Embed Size (px)
Citation preview

International Journal of Innovation, Management and Technology, Vol. 5, No. 3, June 2014
214DOI: 10.7763/IJIMT.2014.V5.516
Abstract—In respect of interior design service, how to build a
service platform that can document the process of the user’s
joint participation in the design communication and visualize
their life model and design requirement is worth of further
study and development. Designers need more messages that
influence the interaction between the user and design objects in
order to produce a design object that complies with the user’s
experience and meets their expectations. For the purpose of
saving designer’s time in searching for design data and of
emphasizing the method of converting the data acquired from a
user’s personal life model, data are visualized into design
information that contains specific meaning. After the visualized
design information is understood by the interior designer, it is
further employed and converted to design knowledge, and
eventually applied in the real service design. It is believed in this
study a joint design method that involves users and interior
designers should be developed to allow users' participation in
design process. Users may also participate the activity of
creation through a joint design process, thus achieving the goal
of service optimization.
Index Terms—Design service, information visualization,
lifestyle patterns, interior design.
I. BACKGROUND AND OBJECTIVE
Architecture Design refers to a design activity that is
specific to the purposes of architecture, including design
activities per requirements for the environment, usage, and
visualization, and presents specifically historical, cultural
and symbolic meanings of architecture. The scope of
Architecture Design includes Appearance Design and
Interior Design and can be further extended to the
relationship between architecture and environment. Interior
design is then the recreation of the interior environment of
architecture. In the area of residential space design, the style
and preference of inhabitants are transformed into design
concept and employed in the process of design, thus
converting interior space to the value of life, emphasizing the
taste of the family and individual, expressing the user’s
attitude toward life, and eventually providing a more cozy
living space. Therefore, as far as functionality is concerned,
Architectural Design provides an existing space, yet lifestyle
and interior space need to be refined in detailed design. In
other words, Interior Design is not only beautification of
architectural interfaces, but more like a recreation of interior
functionality and space form.
Traditional service channel is losing its edge due to
Manuscript received February 10, 2014; revised April 25, 2014.
Chiung-Hui Chen is with the Department of Visual Communication
Design, Asia University, Taiwan (e-mail: [email protected]).
emerging service technology. To establish interaction with
the clients, the service industry is using effective mechanism
to give clients direct access to services with emerging
technologies. Thus, as service science receives attention,
special and unique consumption pattern evolves, henceforth
leading to new market mechanism and influencing attitudes
toward life and consumption patterns. The market demand
for customized services is thus valued due to the emphasis of
personal value, and is gradually changing the demand and
supply relationship in the traditional industry. In respect of
interior design service, in the process of traditional interior
design, a designer converts to a concrete form the concept
generated from the ideas and needs dictated by a client, by
using his/her professional knowledge and drawing tool. The
final product is generated through iterations of
communication and modification, which is a very
time-consuming process. Although this process has been
accelerated with the help of computer graphics software
today, repeated discussions and confirmations with users are
still required to complete the task. Besides, in providing
innovative design service of interior design, innovation must
take into consideration user’s needs in order to reach
consensus with the user. It is believed in this study that users
should have access to sufficient information related to design
in the course of communication, and they are hence allowed
to understand the style elements of their needs and to
participate in the provision of innovative service design. The
time and the cost of communication can therefore be reduced,
and the user may feel the sense of achievement.
In consideration of what is addressed above a space user’s
life model is analyzed with visualization technique to create
an interaction system modeled after interior design
knowledge. The space user document intuitively personal life
experience in a model requirement chart, allowing a
researcher to analyze interrelation between analysis
documents, identify the logic and the substance of data
conversion. The repeated data which is documented are then
transformed into design information for reuse and sharing. A
professional interior designer may sort out the correlation
among user’s preference, life pattern and design specification,
thus deciding the critical design elements in the process of
service design.
II. THEORETICAL FRAMEWORK AND LITERATURE REVIEW
A. Description of Life Model
Human develops close interaction with the environment
which consists of human’s standing behaviors and the
A Study on Information Visualization Depicting Life
Model and Employed in Interior Design
Chiung-Hui Chen

International Journal of Innovation, Management and Technology, Vol. 5, No. 3, June 2014
215
locations where such behaviors occur. Behaviors of the
environment are thus multifaceted [1]. Barker [2] proposes
that there are four factors in Behavior Settings, which are
user, standing pattern of behavior, physical environment, and
a period of specific time. Lang [3] also proposes that
Behavior Settings are standing patterns of behavior which
appear repeatedly in a specific place and time. If different
users access this place, Behavior Settings do not disappear as
a result. They will disappear only when physical environment
changes. In other words, the standing pattern of behavior in
Behavior Settings has close relationship with time. Wicker [4]
makes a further discourse from the perspective of time,
proposing a dynamic change model of Behavior Settings. He
describes the behavior arrangement for the Behavior Settings
in the time segment with Behavior Settings segmented in the
time sequence and with composition factors as the major
entry point of view. From initial gathering, standing pattern
of behavior, to ending behavior, this process may be
considered as a dynamic change process of Behavior
Settings.
Based on the above description, it is concluded that the
time for which Behavior Settings appear may be short or
lengthy. For the benefit of analysis, the records obtained
during the study must be well controlled during investigation.
Wicker [5] and Schoggen [6] also point out that if confirmed
Behavior Settings are to be described objectively, Behavior
Settings must be divided into four parts for discussion of
relationship between all parts and all information must be
recorded. These four parts are user’s frequent behavior and
classification, amount and attributes of Behavior Settings,
times and duration of occurrence, and the location and the
size of the dimensions. The life model in this study is thus
defined as a cycle that consists of generation, growth, change,
fading, ending of user’s behavior in a residential environment
in a time sequence. On the other hands, in the study of the
value of life model in a society and a culture, Højrup [7]
stresses that designers should not only focus on
understanding a user’s life model, but also integrate the
preferences of the user, family, and future demands with the
characteristic information of a house, thus creating a
complete map of user’s life model. Overall speaking, in order
to develop a joint design service based on a life model it is
mandatory for users to share their ideas and opinions,
particularly in the initial design phase. Communication and
reflection are crucial to the core of design. In summary, this
study employs the theory of Behavior Settings as the
infrastructure for investigation, thus enabling space users to
record behaviors that occur at home and the locations where
such behaviors occur during test period. The user’s life
models in one day and in a period are analyzed accordingly.
B. Technology Used in Information Visualization
Information Visualization is a unique academic discipline.
It combines multiple disciplines, such as Computer Science,
Psychology, Semiotics, Graphics Design, Interaction Design
and Art. It pays close attention to how to create an effective
interaction between abstract data and users in a visual and
metaphorical way. Lack of space initiative is the
characteristic of abstract data; therefore, the visualized
presentation of abstract data and development of new visual
metaphors and data presentation method are challenging to
researchers of Information Visualization. With respect to the
definition of Information Visualization, Card [8] et al. define
it as visible presentation of the interaction between abstract
data for better understanding. Therefore, we can say that
visualization can improve the interaction between users and
abstract data, and users’ degree of awareness. On the other
hand, Information Visualization consists of two concepts, i.e.,
data and visualization. This means that the objects, concepts
or abstract data are expressed in images instead of text. Due
to the multiple types and various structures of data,
Shneiderman [9] defines and divides data into seven basic
types, which are one dimension, two dimensions, three
dimensions, multiple dimensions, time, tree, and network.
One dimensional data is one of linear data type which can be
combined in a proper sequence. The visual presentation of
two dimensional data is typically expressed in a coordinate
plane with X and Y axes.
Danyel Fisher quoted the test performed by Robertson et al.
[10] in his book Beautiful Visualization [11]. Robertson
employs a model in which data move with time and numeric
data are presented in a traditional XY Scatterplot. He creates
an animation that plays with time. He then gives the tester a
question, asking the tester to find the answer from the
animation. The test result tells us finding an answer from
animation is very slow and the answer obtained this way is
inaccurate. We discover that Exploration and Presentation of
the data differ from each other a lot. For people who need to
explore data, Animated Visualization, though fascinating,
may produce results contrary to the intended purpose.
Several causes may be concluded from the findings of
Robertson et al. [10]. Firstly, readers cannot predict the
variation of data and thus need to watch animation repeatedly
because they do not understand the data. In a multiple data
structure, people normally can only pay attention to one
dimensional data and observe at most 3 to 4 points; moreover,
they need to pay additional attention to reflect on the meaning
to which the axis corresponds in the process of tracking data,
thus causing delay in making a judgment. What is worse, the
tester may be divided in his/her attention and thus gives
misjudgment if the data do not change in consistence with the
speed of the movement. For the purpose of comparison,
Robertson et al. also show the trajectory of each point’s
movement in a static chart and perform a re-test. The tester
could make the judgment not only faster, but also more
accurately. In order to help the user understand better the
presentation method of dynamic information, Heer and
Robertson [12] makes a simple classification for animation
and provides some methods which are used more commonly,
such as shifting perspectives, shifting coordinate plane (like
shifting linear axis to logarithm axis), presentation of specific
data (filtering data), shifting data category or dimension,
moving data with time, etc. When we begin to prepare or
analyze data, we can also consider suggestions from Fisher,
such as maintaining compatibility in the process of data
movement or conversion, ensuring data to have meaningful
coordinate motion, and ensuring each motion is a meaningful

International Journal of Innovation, Management and Technology, Vol. 5, No. 3, June 2014
216
motion. With these methods and guidelines of self-inspection
the data can be presented more precisely.
C. Life Model-Based Information Visualization Model
Visual Programming Language (also called Graphical
Programming Language) can process mass data to obtain
information and then presents the message such information
intends to communicate in graphics which is easy for human
to recognize. Human typically spends more time and effort to
understand when facing huge amount of text and data. To
help a user analyze efficiently and understand quickly the
structure and characteristics of information, visualization
methods based on computer graphics technology are thus
developed to help people grasp quickly and absorb efficiently
the message which the information intends to communicate.
The results obtained from visualization may reveal the
necessary messages of the information, thus allowing a
professional interior designer to observe overall information
and then grasp the key point. However, Information
Visualization is mainly functionality- and efficiency-oriented.
The potential and implicit influence brought about by
aesthetic factor may be overlooked if practicality is
emphasized too much. When viewed from another
perspective [13], data-based aesthetics puts much emphasis
on artistic metaphor, and ignores functionality that should be
considered in employing information visualization, hence
leading to messages too abstract to understand. Therefore,
Aesthetics, as an independent media, can effectively
eliminate the gap between functionality and artisticity and
increase the value and functionality of the information.
Ancient Roman Architect Vitruvius, in his book titled The
Ten Books on Architecture (De Architectura) [14], mentions
three architectural design principles that should be adhered to:
Completeness, Practicality, and Aesthetics. Vande Moere, A.
and Purchase H, in their co-authored book, titled On the Role
of Design in Information Visualization [15], point out that
these three principles may be applied in Information Design
and various applications that are suitable for Information
Design. They also indicate that good visualized content
should be very complete. In other words, the form of the
design must match with the information described by the
design. Moreover, visualized content should be practical so
that the user may derive meanings from it. Finally, like any
design, Information Design should be aesthetically appealing,
draw attention from the user, and provide pleasant visual
experience. The three design principles that Vande Moere, A.
and Purchase H propose serve as a solid foundation for our
judgment of the value of information visualization. This
study is built upon above-mentioned view points, and the
four steps of visualization by Colin [16] which are,
respectively, collecting and storing data, pre-processing and
converting data to an intelligible form, displaying, on the
screen, image generated by the graphical engine, and
human’s observing and cognizing the image. There are also
feedbacks existing between these steps whose correlation is
shown in Fig. 1. Quantified data are used to express certain
characteristics with symbols in lieu of digital expression of
data. In term of visual meanings and perception, a project
interior designer is more inclined to accept symbols than text
mainly because he/she can quickly understand the data and
grasp their characteristics with the help of symbols. In term
of data itself, the area scale, color, length, and quantity of the
image are used to express content. The created image
symbols replace the explanation in language in way of visual
metaphor. Project interior designer can thus review digital
data, provide opinions, and propose design service with
better quality.
Life Model-basedInformation Visualization
ModelData
Fig. 1. Life model-based information visualization model.
III. EXPLORING LIFE MODEL
Interior design process places emphasis mainly on design
object itself. However, as user-centered concept gains
popularity in recent years, more and more design methods
have improved design quality by understanding the user [17].
This trend also impacts the design process of a traditional
service platform. Designers communicate with users by
utilizing co-design technology and tool, thus allowing more
effective design ideas and creating more opportunities for
service innovations. Based on theories and study objectives
explored previously, the method employed in this study is
detailed as below.
A. Background of Client
Due to tediousness and complexity involved in interior
design, the interior designer provides design expertise and
services based on design knowledge, builds up the
framework of user requirement, and analyzes the attributes of
style and design elements so that re-creation conditions of
design elements in service combination may be met. This
study first uses a nuclear family in a case study. There are
three members in this family – Mr. Peng, Mrs. Peng and their
son who is a student of senior year in high school. Mr. Peng,
47 years old, is the owner of a medium sized company. His
hobbies are reading and travel. His friends often visit him at
home. He likes to have a chat over coffee and spend most of
his time before a computer. Occasionally he plays basketball.
Mrs. Peng, 45 years old, stays home most of the time. She is a
very good cooker. Occasionally she would invite friends over
for a meal. She likes coffee, arts, and crafts. She often goes
for a walk in the country and travels overseas. The house of

International Journal of Innovation, Management and Technology, Vol. 5, No. 3, June 2014
217
the Peng family is located at the Main Street. The total floor
area of their two-floored house is 1,800 square feet. The main
amenities such as living room, dining room, kitchen, rest
room and yard are on the first floor while master bed room,
their son’s bed room, study room, bathroom and balcony are
on the second floor.
B. Space Encoding
For human being, different space forms account for
different cultures under different environments. Any space
has sphere depth and defined sphere is the result of
encompassed boundary. The definition of Space Sphere
Depth in this study is given according to the theory of sphere
structure given in the study of Hiller [18], [19]. Hiller’s study
indicates that the sphere depth in space is obtained from
observing physical environment, and from walking distance
in space and accessibility of visual permeability. His study
also indicates the relation in space is not geometrical, but
topological. The study of space structure is thus rid of
plane-based study, and the space encoding is symbolized and
numeralized into symbols and mathematical system with
single meaning for better exploration of correlation between
spaces. As a result, we can conclude that the lower one’s
accessibility to a space is and the more private a behavior is,
the deeper the sphere depth is. On the contrary, the more the
people who share the control over a space are and the higher
one’s accessibility to such a space is and the more open a
behavior is, the shallower the sphere depth is.
Therefore, this study is guided by the degree of privacy of
a behavior and divides the sphere structure of living space in
the case study into four levels (i.e., space coding) on a scale
from “private” to “open.” Living space thus includes several
independent space units: rest room, master bed room, child
bed room, kitchen, study room, dining room, living room,
balcony, and yard. Each room is described as below.
Bathroom and bed rooms are space-encoded as No. 1 because
they are considered spaces under the same category and with
the highest level of privacy. Kitchen and study room are
spaces where independent behaviors occur, but they may be
shared by members of the family, thus leading to cooperative
behavior. They are space-encoded as No. 2. Dining room and
living room are where family members gather and visitors
stay for cooperative behaviors; they are space-encoded as No.
3. Balcony or yard can be seen by pedestrians; they are
space-encoded as No. 4. Behavior settings for holidays or
weekends, such as school, office, park, and market, are
space-encoded as No. 5. Space levels encoded from No. 1 to
4 are the main subjects in this study. Space outside of the
house (No. 5) is not considered for information conversion.
Definitions for each level are shown in Table I as below.
TABLE I: INTERIOR SPACE ENCODING FOR THE HOUSE
Sphere CharacteristicsSphere
EncodingName of Space
The larger the Number is,
the lower the privacy is
1. Bathroom, bed rooms
2. Kitchen, study room
3.Dining room, living
room
4. Balcony, yard
5. not included
Space outside the house
C. Journal Encoding
Family is the starting point of a community life and the
most basic unit of a society. Everyone’s daily life is filled
with people, events, times, things, and places. This study
begins with a space user’s daily life sphere. Various
conditions caused by each factor of a space user are used to
create task description on a case study basis. Unlike ordinary
questionnaire and interview, a space user records his/her own
daily activities and uses a journal and a camera to complete
recording of his/her own daily behaviors. Keeping journal
allows us to receive details of a space user’s daily life. The
descriptions of a space user’s preferences, activities,
environment, and use of an object are hence received through
this mechanism. The interior designer then obtains a
complete script of life. With camera exploration, family
members are required to record videos of the locations of
their activities, environment, or equipment used so that the
interior designer may observe the environment and
conditions in real life. Journal is recorded every one hour, 24
hours a day, and for 14 days (two week). During the period of
recording, family members are required to record the
behaviors that occur in daily activities, and where and when
they happen. The samples of journal encoding are listed in
Table II.
TABLE II: JOURNAL ENCODING: A DAY IN THE MRS. PENG’S
Time Activity Name of SpaceDuration
(hrs)Sphere
Encoding
12:00 AM Sleeping Bed room 1 1
1:00 Sleeping Bed room 1 1
2:00 Sleeping Bed room 1 1
3:00 Sleeping Bed room 1 1
4:00 Sleeping Bed room 1 1
5:00 Sleeping Bed room 1 1
6:00 Sleeping Bed room 1 1
7:00Get up and
wash upBathroom 1 1
8:00Prepare
breakfastKitchen 1 2
9:00 Eat breakfast Dining room 1 3
10:00 Chore Kitchen 1 2
11:00 Chore Dining room 1 3
12:00 PM Prepare lunch Kitchen 1 2
1:00 Eat lunch Dining room 1 3
2:00 Nap time Bed room 1 1
3:00 Nap time Bed room 1 1
4:00Walk the dog
in the parkSpace outside
the house1 5
5:00Go grocery shopping
Space outside the house 1 5
6:00Prepare
dinnerKitchen 1 2
7:00 Eat dinner Dining room 1 3
8:00 Eat dinner Dining room 1 3
9:00 Do laundry Balcony 1 4
10:00Take a bath
and get ready for bed
Bathroom 1 1
11:00 Sleeping Bed room 1 1
International Journal of Innovation, Management and Technology, Vol. 5, No. 3, June 2014
218
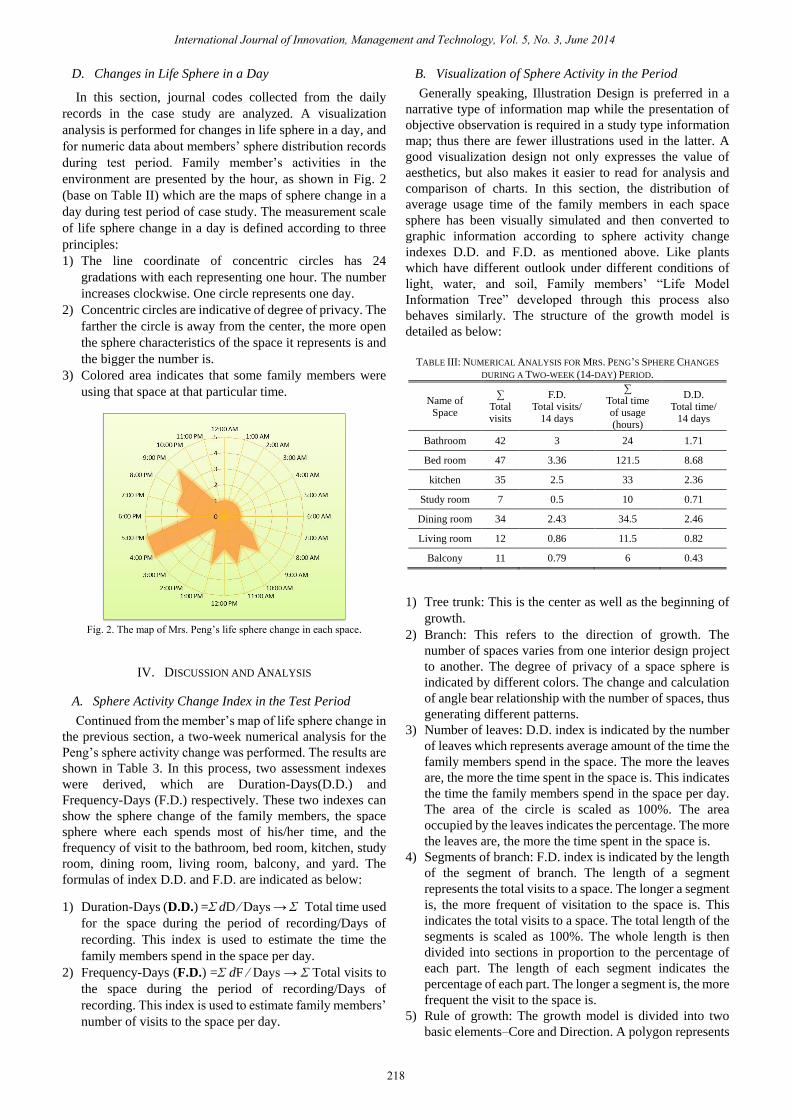
D. Changes in Life Sphere in a Day
In this section, journal codes collected from the daily
records in the case study are analyzed. A visualization
analysis is performed for changes in life sphere in a day, and
for numeric data about members’ sphere distribution records
during test period. Family member’s activities in the
environment are presented by the hour, as shown in Fig. 2
(base on Table II) which are the maps of sphere change in a
day during test period of case study. The measurement scale
of life sphere change in a day is defined according to three
principles:
1) The line coordinate of concentric circles has 24
gradations with each representing one hour. The number
increases clockwise. One circle represents one day.
2) Concentric circles are indicative of degree of privacy. The
farther the circle is away from the center, the more open
the sphere characteristics of the space it represents is and
the bigger the number is.
3) Colored area indicates that some family members were
using that space at that particular time.
Fig. 2. The map of Mrs. Peng’s life sphere change in each space.
IV. DISCUSSION AND ANALYSIS
A. Sphere Activity Change Index in the Test Period
Continued from the member’s map of life sphere change in
the previous section, a two-week numerical analysis for the
Peng’s sphere activity change was performed. The results are
shown in Table 3. In this process, two assessment indexes
were derived, which are Duration-Days(D.D.) and
Frequency-Days (F.D.) respectively. These two indexes can
show the sphere change of the family members, the space
sphere where each spends most of his/her time, and the
frequency of visit to the bathroom, bed room, kitchen, study
room, dining room, living room, balcony, and yard. The
formulas of index D.D. and F.D. are indicated as below:
1) Duration-Days (D.D.) =Σ dD ∕ Days → Σ Total time used
for the space during the period of recording/Days of
recording. This index is used to estimate the time the
family members spend in the space per day.
2) Frequency-Days (F.D.) =Σ dF ∕ Days → Σ Total visits to
the space during the period of recording/Days of
recording. This index is used to estimate family members’
number of visits to the space per day.
B. Visualization of Sphere Activity in the Period
Generally speaking, Illustration Design is preferred in a
narrative type of information map while the presentation of
objective observation is required in a study type information
map; thus there are fewer illustrations used in the latter. A
good visualization design not only expresses the value of
aesthetics, but also makes it easier to read for analysis and
comparison of charts. In this section, the distribution of
average usage time of the family members in each space
sphere has been visually simulated and then converted to
graphic information according to sphere activity change
indexes D.D. and F.D. as mentioned above. Like plants
which have different outlook under different conditions of
light, water, and soil, Family members’ “Life Model
Information Tree” developed through this process also
behaves similarly. The structure of the growth model is
detailed as below:
TABLE III: NUMERICAL ANALYSIS FOR MRS. PENG’S SPHERE CHANGES
DURING A TWO-WEEK (14-DAY) PERIOD.
Name of Space
∑Total visits
F.D.Total visits/
14 days
∑Total time of usage (hours)
D.D.Total time/
14 days
Bathroom 42 3 24 1.71
Bed room 47 3.36 121.5 8.68
kitchen 35 2.5 33 2.36
Study room 7 0.5 10 0.71
Dining room 34 2.43 34.5 2.46
Living room 12 0.86 11.5 0.82
Balcony 11 0.79 6 0.43
1) Tree trunk: This is the center as well as the beginning of
growth.
2) Branch: This refers to the direction of growth. The
number of spaces varies from one interior design project
to another. The degree of privacy of a space sphere is
indicated by different colors. The change and calculation
of angle bear relationship with the number of spaces, thus
generating different patterns.
3) Number of leaves: D.D. index is indicated by the number
of leaves which represents average amount of the time the
family members spend in the space. The more the leaves
are, the more the time spent in the space is. This indicates
the time the family members spend in the space per day.
The area of the circle is scaled as 100%. The area
occupied by the leaves indicates the percentage. The more
the leaves are, the more the time spent in the space is.
4) Segments of branch: F.D. index is indicated by the length
of the segment of branch. The length of a segment
represents the total visits to a space. The longer a segment
is, the more frequent of visitation to the space is. This
indicates the total visits to a space. The total length of the
segments is scaled as 100%. The whole length is then
divided into sections in proportion to the percentage of
each part. The length of each segment indicates the
percentage of each part. The longer a segment is, the more
frequent the visit to the space is.
5) Rule of growth: The growth model is divided into two
basic elements–Core and Direction. A polygon represents

International Journal of Innovation, Management and Technology, Vol. 5, No. 3, June 2014
219
the originating core of a tree trunk while the text inside
the polygon represents the appellation of the family
members. The number of sides of polygon (N) depends
on the number of spaces in the interior design project, as
an example of hexagon is shown in Figure 3. The rule of
growth of single member’s Life Model Information Tree
is defined as follows: Multiple branch axes are generated
and extended from the center with the direction of each
axis representing a space. The angle of each branch (θ) is
obtained by evenly dividing 360 degrees by the number
of space in the interior design project (θ = 360 degrees/6 =
60 degrees). The length of a branch axis (F.D.) is derived
from such a member’s frequency of visitation to each
space while the number of leaves at the end of the branch
axis is derived from the average amount of time spent in
the space (D.D.).
The objects of multiple members can also be shown on one
computer screen. A branch connecting line is drawn between
every member and another member; thus an image that
resembles a plant is created. Such an image is therefore called
Life Model Information Tree. However, if there are too many
lines, showing them all on one screen may be a mess, thus
preventing the model to give a clear explanation. The study
result is then built into an interactive Life Model Information
Tree System on a network platform, allowing the user to
select the member to view and those he/she does not wish to
view in real time, and to select dynamic functions such as
space and time change. The upload of data and analysis are
then made easier for the user.
θ
No. of leaves (D.D.):This indicates the time the family members spend in the space per day. The area of the circle is scaled as 100%. The area occupied by theleaves indicates the percentage. The more the leaves are, the more the time spent in the space is.
Name of
member
Length of branch segment (F.D.):This indicates the total visits to a space. The total length of the segments is scaled as 100%. The whole length is then divided into sections in proportion to the percentage of each part. The length of each segment indicates the percentage of each part. The longer a segment is, the more frequent the visit to the space is.
Name of space
Name of space
Fig. 3. Representation of the life model information tree.
V. CONCLUSION AND FOLLOW-UP STUDIES
In the process of visualization the characteristics of data
and the problem to be resolved must be defined first. A
dynamic presentation may be helpful to allow the user to
understand the change of data movement. If the change of
data before and after movement is required, then a static
presentation may be a better choice. Though dynamic
presentation may bring adverse effect due to improper
handling, it is undoubtedly an important data visualization
technique. In this study a method of providing an interior
design data source which is fit for the objective of this study
has been created. Meanwhile how the consistency of number
data is maintained in the process of format is also detailed. It
will take a long time for project interior designer to find a
periodic mode that is inherent in the data if only a simple
electronic data table is provided. Although current design
outcome of visualization is a static image, the whole iconic
infrastructure and hierarchies have been established, which is
the most difficult part of the task. Overall speaking, mass
information may be converted to meaningful image
framework through information visualization. Compared to
the pure digital display used in the past, information
visualization is more intuitive and easy for interior designer
to quickly understand and use information. With the
improvement brought about by new technologies and
algorithms, the data dimension and width that information
visualization can present today are more diversified and
interactive.
ACKNOWLEDGMENT
This study is supported by the Taiwan National Science
Council, grant- NSC-102-2221-E-468-023.
REFERENCES
[1] K. Lewin, “Defining the Field at a Given Time,” Psychological Review,
vol. 50, pp. 292-310, 1943, Resolving Social Conflicts & Field Theory
in Social Science, Washington, D.C.: American Psychological
Association, 1997.
[2] R. G. Barker, “Ecological psychology: concepts and method for
studying the environment of human behavior,” Stanford University
Press, Standford, California, 1968.
[3] J. Lang, “The behavior setting: A unit for environmental analysis and
design, creating architectural theory-the role of the behavioral sciences
in environmental design,” Van Nostrand Reinhold Inc, pp. 113-125,
New York, 1987.
[4] A. W. Wicker, “Behavior setting reconsidered: Temporal stages,
resources, internal dynamics, context,” in D. Stokols & I. Altman (Eds.),
Handbook of environmental psychology, pp. 613-653, NY: John Wiley
& Sons, 1987.
[5] A. W. Wicker, “Making sense of environments,” in W. B. Walsh, K. H.
Clark, & R. H. Price (Eds.), Person- environment Psychology: Models
and perspectives, pp. 158-191, Hillsdale, NJ: Lawrence Erbum
Associates, 1992.
[6] P. Schoggen, Behavior settings: A revision and extension of Roger
G.Barker's Ecological Psychology, Stanford, CA: Stanford University
Press, 1989.
[7] T. Højrup, State, culture, and life modes: the foundations of life mode
analysis, London, UK: Ashgate, 2003.
[8]
[9] B. Shneiderman, “Tree visualization with treemaps: A 2-D
space-filling approach,” ACM Transactions on Graphics, vol. 11, no. 1,
pp. 92-99, 1992.
[10] G. Robertson, R. Fernandez, D. Fisher, B. Lee, and J. Stasko,
“Effectiveness of animation in trend visualization,” IEEE Transactions
on Visualization and Computer Graphics, vol. 14, no. 6, pp. 1325-1332,
2008.
[11] J. Steele and N. Ilinsky, Beautiful visualization, looking at data
through the eyes of experts, Sebastopol, CA, 2010.
[12] J. Heer and G. Robertson, “Animated transitions in statistical data
graphics,” IEEE Transactions on Visualization and Computer
Graphics, vol. 13, no. 6, pp. 1240-1247, 2007.
[13] C. Horn, “Natural metaphors for information visualizations,
massachusetts college of art and design,” Master Thesis, 2007.
[14] V. Pollio, The Ten Books on Architecture, Courier Dover Publications,
transl. Morris Hicky Morgan, 1960.
[15] A. V. Moere and H. Purchase, “On the role of design in information
visualization,” in A. Kerren, C. Plaisant, and J. T. Stasko, (Eds), State
of the Field and New Research Directions, Information Visualization
Journal, vol. 10, no. 4, pp. 356-371, 2011.
[16] W. Colin, Information visualization: perception for design, 2th ed., San
Francisco, CA: Morgan Kaufmann, 2004.
S. K. Card, J. D. Mackinlay, and B. Shne Iderman, Readings in
information visualization: Using vision to think, San Francisco:
Morgan Kaufmann, 1999.

International Journal of Innovation, Management and Technology, Vol. 5, No. 3, June 2014
220
[17]
[18] B. Hillier and J. Hanson, The social logic of space, Cambridge
University Press: Cambridge, 1984.
[19] B. Hillier, Space is the machine: a configurational theory of
architecture, Cambridge University Press: Cambridge, 1996.
Chiung-Hui Chen is currently an assistant
professor of Department of Visual Communication
Design, at the ASI
Her research interests include the future
architecture design, data communications,
information visualization, and aesthetic computing.
F. Samalionis, “Can designers help deliver better services?” in S.
Miettien and M. Koivisto (Eds.), Designing Service with Innovative
Methods, University of Art and Design Helsinki, 2009. A University, Taiwan, R.O.C.