Embed Size (px)
Citation preview
© 2018 JETIR December 2018, Volume 5, Issue 12 www.jetir.org (ISSN-2349-5162)
JETIR1812B60 Journal of Emerging Technologies and Innovative Research (JETIR) www.jetir.org 467
A STUDY ON JOB SATISFACTION OF HOTEL
EMPLOYEES IN PATHANAMTHITTA
DISTRICT
ANJALI JACOB
GUEST LECTURER
ST.THOMAS COLLEGE ,RANNY
ABSTRACT
A study on job satisfaction of hotel employees in pathanamthitta district aimed to assess the job satisfaction
of hotel employees in Ranni taluk,to assess the job satisfaction on compensation and rewards, assess
the job security of the employees and employees work environment;and to understand the level of
satisfaction of employees.50 respondents have been selected following convenient sampling
method.Questionaires were used as data collecting instrument. Data was analyzed using tabulation,
percentages, and likert scale. Recommendations from the study was Management should take adequate
steps to improve salary of the employees, Supervisors should take care of employees and allow them
to express their view point’s without fear.Management should provide accommodation for their
employees.
keywords:Job satisfaction, Hotel Employees,Hotel industry
INTRODUCTION
Hotel industry is belonging to service industry. In today's world, service industries are the source of economic
leadership, hotel industry get into a new age. Therefore, developing human resources and using technology to operate
hotel businesses become more important. “For many travelers, a hotel room is a hotel room and what separates one
hotel from another is the quality of service. It is what people remember." Service is a hotel's most important product
and good service does not just happen. It is a team effort, requiring constant attention, training, and supervision.
Providing good service to reach customer satisfaction is the essential task in this field. To provide good service, we
have to reach employee satisfaction first. Employee is the first line to receive customer, their satisfaction will affect
service quality.
In the Hotel industry, which involves both production and service aspects, creation and rendering of services
from the hotel to the customer are primarily achieved through its employees. The success of this industry is therefore
dependent on the caliber of its employees and how effectively they are managed in its routine acts.
One of the upcoming industries in Kerala with a huge development potential is tourism and tourism cannot
thrive without a wide choice of well run hotels. The desirability of a hotel is determined by many factors and one of the
most important of them is the quality of human servicesBut the hotel industry in Kerala is criticized as a sector with
poor employee management practices and the criticisms are not totally out of place. Unscientific recruitment, inadequate
training and development facilities, low wages, unsocial working hours and shift patterns, non existence of career
structures, difficulties in retention of employees and high level of labour turnover are the main allegations leveled
against the employment practices in the hotel industry in Kerala. Even though there are instances of good management
practices particularly in state owned hotels and in highly starred private hotels, most of the hotels have not yet given
due importance to the HR factor. It is widely accepted that only satisfied employees can make the guests satisfied-such
dictum has not yet rooted in the mindset of hoteliers in Kerala
© 2018 JETIR December 2018, Volume 5, Issue 12 www.jetir.org (ISSN-2349-5162)
JETIR1812B60 Journal of Emerging Technologies and Innovative Research (JETIR) www.jetir.org 468
STATEMENT OF THE PROBLEM
Organizations consist of people, and so the development of these people should be a key task of the
organizations. Every organization begins and ends with people. The importance of employee satisfaction within an
organization is becoming increasingly accepted in today's rapidly changing and uncertain business environment. In
today’s complex business scenario, no one can deny that the most important cog in the wheel of management is human
resources, around which all other management facts revolve.
An organization’s success increasingly depends on the knowledge, skills and abilities of employees, particularly
as they help establish a set of core competencies that distinguish an organization from its competitors. Effective
employee satisfaction is crucial for every organization’s success. The quality of the organization’s Human resources,
their sense of fair treatment, their enthusiasm and satisfaction with their job, all affect the organization’s productivity,
customer service, reputation and survival.
OBJECTIVES OF THE STUDY
₪ To assess the job satisfaction of hotel employees in Ranni taluk;
₪ To assess the job satisfaction on compensation and rewards;
₪ To assess the job security of the employees;
₪ To assess the employees work environment;
₪ To understand the level of satisfaction of employees;
NEED & IMPORTANCE OF THE STUDY
A service industry like hotel industry cannot afford to neglect the human element because the efficiency of the
employees determines, to a great extent, the quality of service rendered. Hotel industry in India is often criticized as a
sector with poor employee management practices. A number of studies on this regard reveal that this sector is
characterized by poor employee relation, low pay, and high labor turnover. All these pitfalls are mainly on account of
poor satisfaction of job .Changes in the development of hotel industry alone will change tourism and hospitality industry
too.
Kerala’s economy is largely dependent on the tourism and hotel industry. Proper development of human resources is
the need of the hour for developing the hospitality industry to its full potential. A good employee management practice
will create satisfied employees and only satisfied employees can make the guests satisfied. Satisfied guests will create
more revenue to the state and in turn it will create a good image for the nation. The present study is significant in that
it analyzes the HRM practices prevailing in the hotel industry in Kerala. It looks in to the pitfalls on the employee
management practices and puts forward remedial measures to resolve serious drawbacks.
RESEARCH METHODOLOGY
The study is an empirical one based on survey method. The main thrust of the study is to analyze the job satisfaction
of the employees in hotel industry
In the first stage Job Satisfaction of the employees in Ranni taluk were identified. For identifying the level of
satisfaction of employee’s, discussions were held by the researcher with the hotel employees in Ranni taluk. On this
basis, the researcher identified the satisfaction of different employees.The Job Satisfaction Survey was conducted at
the second stage by the researcher to measure the satisfaction of the employees working in hotel industry.
© 2018 JETIR December 2018, Volume 5, Issue 12 www.jetir.org (ISSN-2349-5162)
JETIR1812B60 Journal of Emerging Technologies and Innovative Research (JETIR) www.jetir.org 469
RESEARCH DESIGN
Descriptive design is used for research design.
COLLECTION OF DATA
Both primary and secondary data have been used for the purpose of study.
TOOLS USED
TOOLS FOR ANALYSIS
For analysis of data, various statistical tools are used.
Percentage Analysis
Percentage is often used in the data presentation as they simplify numbers, by bringing all data to 0-100 range. Through
the use of percentage the data is reduced to a standard with base equal to 100, which helps in relative comparison. This
technique is used for simplifying and studying the opinion of respondents with regard to the level of satisfaction.
Likert’s scale
Likert scale or summated scales are developed by utilizing the item analysis approach, wherein a particular item is
evaluated on the basis of how well it discriminates between those persons whose total score is high and those whose
score is low. Summated scales consist of a number of statements which express either a favorable or unfavorable attitude
towards the given object to which the respondent is asked to react.
B) TOOLS FOR PRESENTATION
Pie chart:
A pie chart is used to emphasis proportion or shares of each category. It is a circular chart divided into sectors,
illustrating relative frequencies. The relative frequency in each category or sector is proportional to the arc length of
that sector or the area of that sector or the central angle of that
Bar chart
A bar chart consists of a series of rectangles (or bars). The height of each rectangle is determined by the frequency of
that category.
LIMITATIONS OF THE STUDY
A sample of 50 respondents was taken, so it is very difficult to draw the inferences of the actual population
from this sample.
The study requires more time as it involves detailed analysis. But the time period of study was limited.
The area under the study is limited to respondents in Ranni Taluk, so the inferences drawn will not be that
reliable.
Capabilities, exposure, experience and knowledge of the researchers on the subject are other limitations
applicable to the study
© 2018 JETIR December 2018, Volume 5, Issue 12 www.jetir.org (ISSN-2349-5162)
JETIR1812B60 Journal of Emerging Technologies and Innovative Research (JETIR) www.jetir.org 470
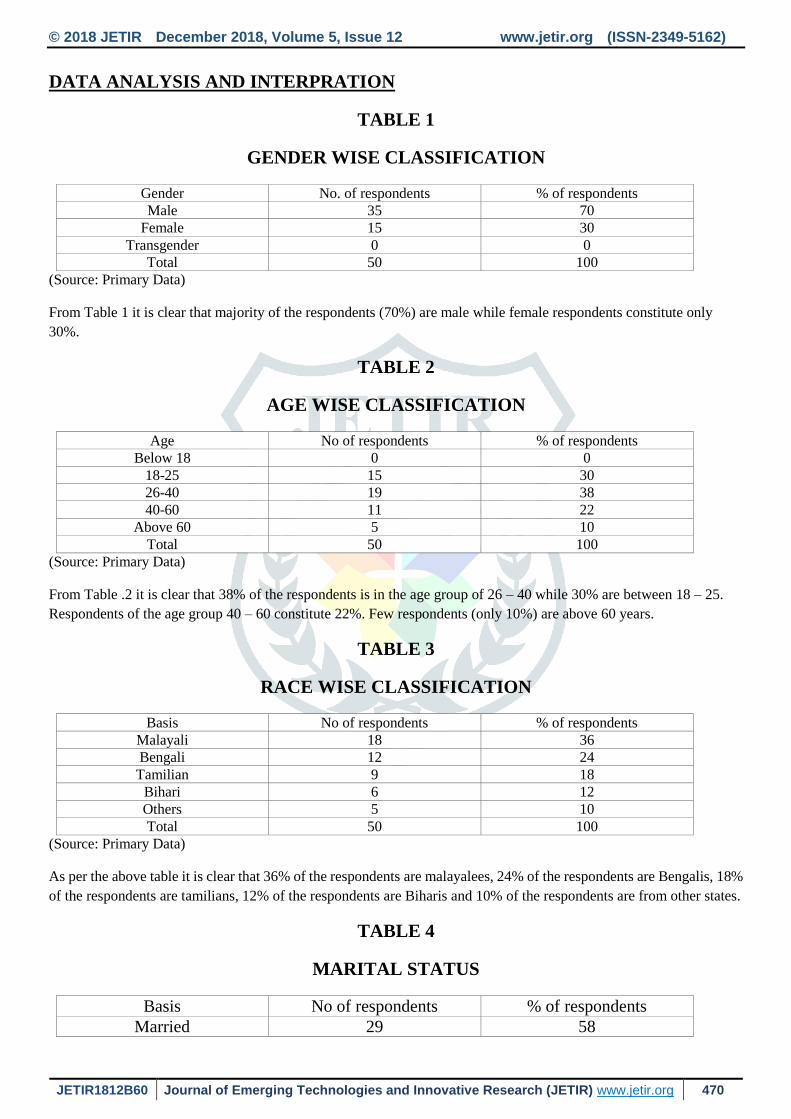
DATA ANALYSIS AND INTERPRATION
TABLE 1
GENDER WISE CLASSIFICATION
Gender No. of respondents % of respondents Male 35 70
Female 15 30 Transgender 0 0
Total 50 100 (Source: Primary Data)
From Table 1 it is clear that majority of the respondents (70%) are male while female respondents constitute only
30%.
TABLE 2
AGE WISE CLASSIFICATION
Age No of respondents % of respondents Below 18 0 0
18-25 15 30 26-40 19 38 40-60 11 22
Above 60 5 10 Total 50 100
(Source: Primary Data)
From Table .2 it is clear that 38% of the respondents is in the age group of 26 – 40 while 30% are between 18 – 25.
Respondents of the age group 40 – 60 constitute 22%. Few respondents (only 10%) are above 60 years.
TABLE 3
RACE WISE CLASSIFICATION
Basis No of respondents % of respondents Malayali 18 36 Bengali 12 24
Tamilian 9 18 Bihari 6 12 Others 5 10 Total 50 100
(Source: Primary Data)
As per the above table it is clear that 36% of the respondents are malayalees, 24% of the respondents are Bengalis, 18%
of the respondents are tamilians, 12% of the respondents are Biharis and 10% of the respondents are from other states.
TABLE 4
MARITAL STATUS
Basis No of respondents % of respondents
Married 29 58
© 2018 JETIR December 2018, Volume 5, Issue 12 www.jetir.org (ISSN-2349-5162)
JETIR1812B60 Journal of Emerging Technologies and Innovative Research (JETIR) www.jetir.org 471
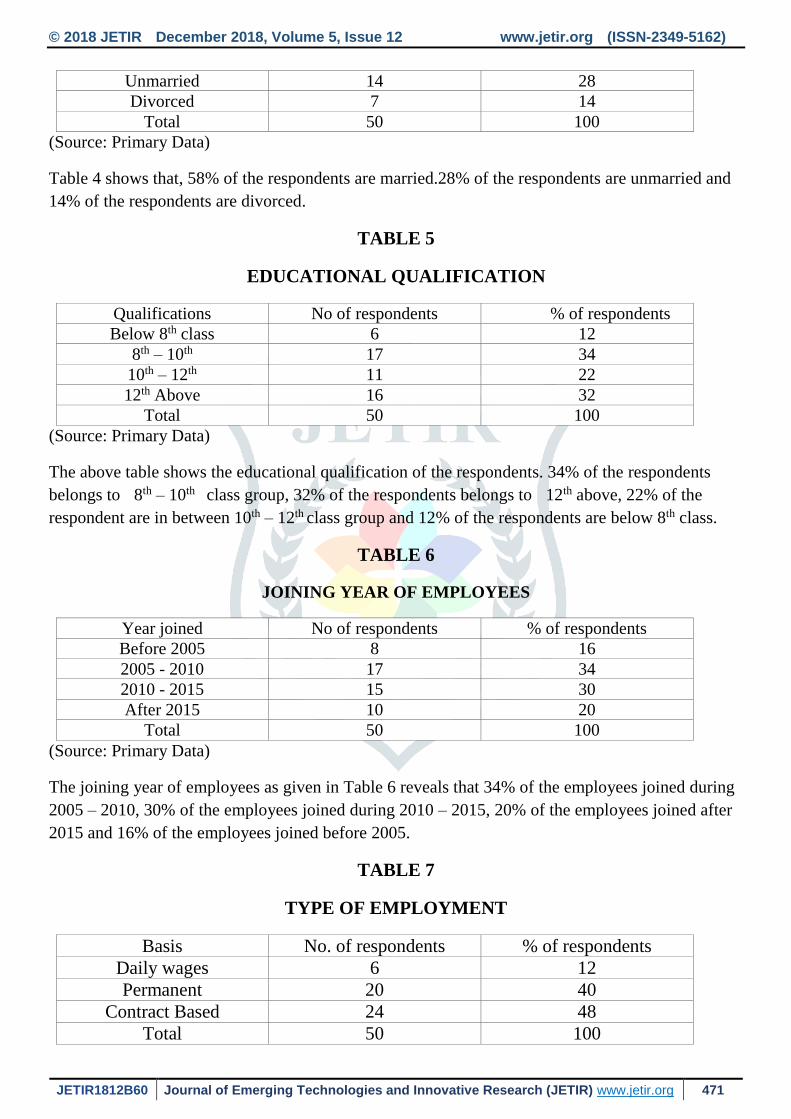
Unmarried 14 28
Divorced 7 14
Total 50 100
(Source: Primary Data)
Table 4 shows that, 58% of the respondents are married.28% of the respondents are unmarried and
14% of the respondents are divorced.
TABLE 5
EDUCATIONAL QUALIFICATION
Qualifications No of respondents % of respondents
Below 8th class 6 12
8th – 10th 17 34
10th – 12th 11 22
12th Above 16 32
Total 50 100
(Source: Primary Data)
The above table shows the educational qualification of the respondents. 34% of the respondents
belongs to 8th – 10th class group, 32% of the respondents belongs to 12th above, 22% of the
respondent are in between 10th – 12th class group and 12% of the respondents are below 8th class.
TABLE 6
JOINING YEAR OF EMPLOYEES
Year joined No of respondents % of respondents
Before 2005 8 16
2005 - 2010 17 34
2010 - 2015 15 30
After 2015 10 20
Total 50 100
(Source: Primary Data)
The joining year of employees as given in Table 6 reveals that 34% of the employees joined during
2005 – 2010, 30% of the employees joined during 2010 – 2015, 20% of the employees joined after
2015 and 16% of the employees joined before 2005.
TABLE 7
TYPE OF EMPLOYMENT
Basis No. of respondents % of respondents
Daily wages 6 12
Permanent 20 40
Contract Based 24 48
Total 50 100
© 2018 JETIR December 2018, Volume 5, Issue 12 www.jetir.org (ISSN-2349-5162)
JETIR1812B60 Journal of Emerging Technologies and Innovative Research (JETIR) www.jetir.org 472
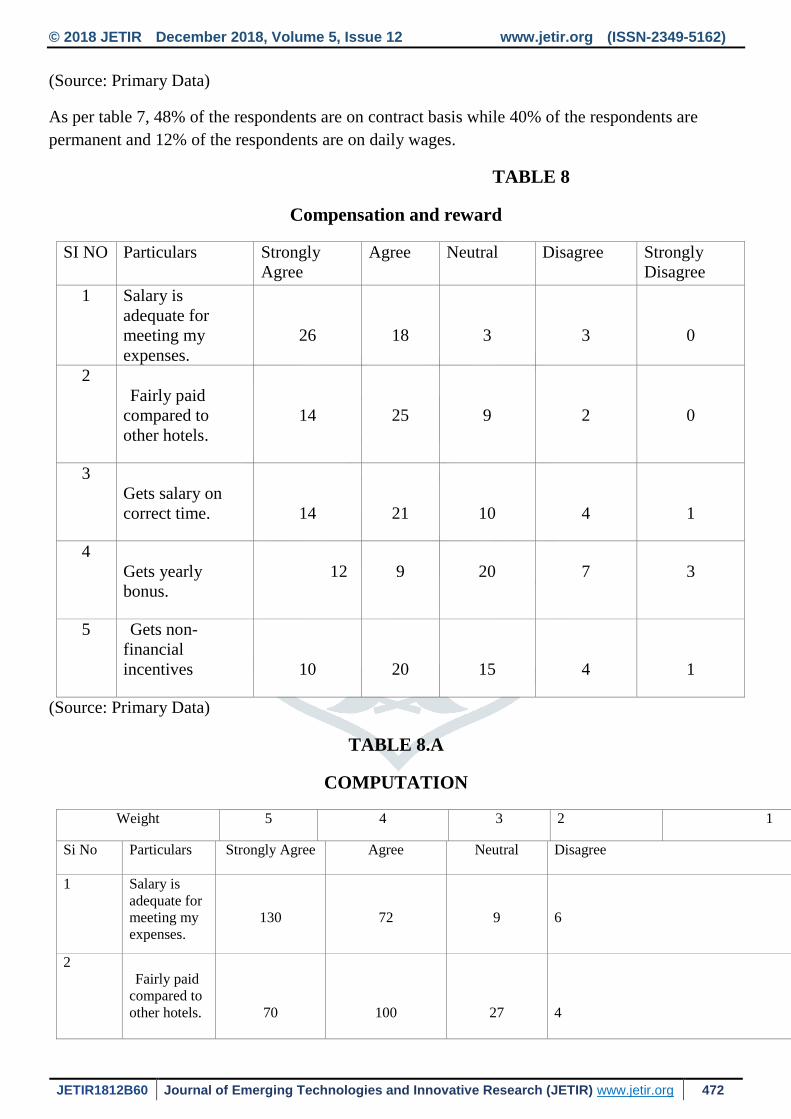
(Source: Primary Data)
As per table 7, 48% of the respondents are on contract basis while 40% of the respondents are
permanent and 12% of the respondents are on daily wages.
TABLE 8
Compensation and reward
SI NO Particulars Strongly
Agree
Agree Neutral Disagree Strongly
Disagree
1 Salary is
adequate for
meeting my
expenses.
26
18
3
3
0
2
Fairly paid
compared to
other hotels.
14
25
9
2
0
3
Gets salary on
correct time.
14
21
10
4
1
4
Gets yearly
bonus.
12
9
20
7
3
5 Gets non-
financial
incentives
10
20
15
4
1
(Source: Primary Data)
TABLE 8.A
COMPUTATION
Weight 5 4 3 2 1
Si No Particulars Strongly Agree Agree Neutral Disagree Disagree
1 Salary is
adequate for
meeting my
expenses.
130
72
9
6
2
Fairly paid
compared to
other hotels.
70
100
27
4
© 2018 JETIR December 2018, Volume 5, Issue 12 www.jetir.org (ISSN-2349-5162)
JETIR1812B60 Journal of Emerging Technologies and Innovative Research (JETIR) www.jetir.org 473
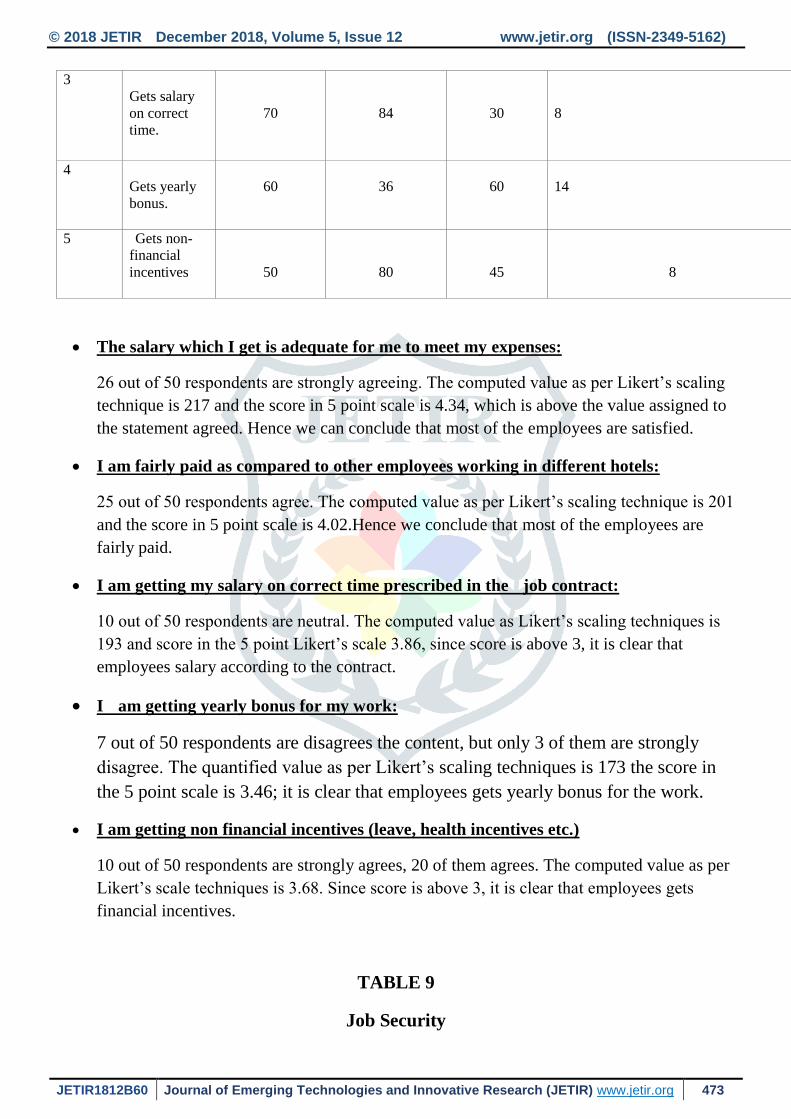
3
Gets salary
on correct
time.
70
84
30
8
4
Gets yearly
bonus.
60
36
60
14
5 Gets non-
financial
incentives
50
80
45
8
The salary which I get is adequate for me to meet my expenses:
26 out of 50 respondents are strongly agreeing. The computed value as per Likert’s scaling
technique is 217 and the score in 5 point scale is 4.34, which is above the value assigned to
the statement agreed. Hence we can conclude that most of the employees are satisfied.
I am fairly paid as compared to other employees working in different hotels:
25 out of 50 respondents agree. The computed value as per Likert’s scaling technique is 201
and the score in 5 point scale is 4.02.Hence we conclude that most of the employees are
fairly paid.
I am getting my salary on correct time prescribed in the job contract:
10 out of 50 respondents are neutral. The computed value as Likert’s scaling techniques is
193 and score in the 5 point Likert’s scale 3.86, since score is above 3, it is clear that
employees salary according to the contract.
I am getting yearly bonus for my work:
7 out of 50 respondents are disagrees the content, but only 3 of them are strongly
disagree. The quantified value as per Likert’s scaling techniques is 173 the score in
the 5 point scale is 3.46; it is clear that employees gets yearly bonus for the work.
I am getting non financial incentives (leave, health incentives etc.)
10 out of 50 respondents are strongly agrees, 20 of them agrees. The computed value as per
Likert’s scale techniques is 3.68. Since score is above 3, it is clear that employees gets
financial incentives.
TABLE 9
Job Security
© 2018 JETIR December 2018, Volume 5, Issue 12 www.jetir.org (ISSN-2349-5162)
JETIR1812B60 Journal of Emerging Technologies and Innovative Research (JETIR) www.jetir.org 474
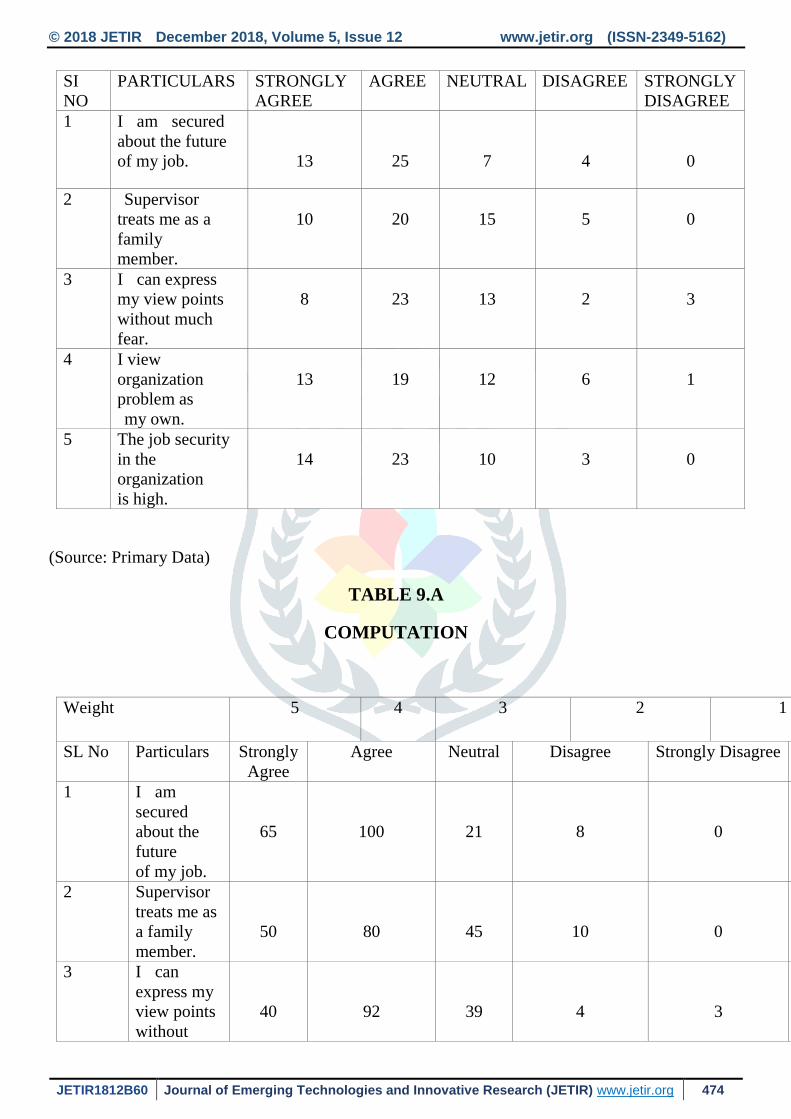
SI
NO
PARTICULARS STRONGLY
AGREE
AGREE NEUTRAL DISAGREE STRONGLY
DISAGREE
1 I am secured
about the future
of my job.
13
25
7
4
0
2 Supervisor
treats me as a
family
member.
10
20
15
5
0
3 I can express
my view points
without much
fear.
8
23
13
2
3
4 I view
organization
problem as
my own.
13
19
12
6
1
5 The job security
in the
organization
is high.
14
23
10
3
0
(Source: Primary Data)
TABLE 9.A
COMPUTATION
Weight 5 4 3 2 1
SL No Particulars Strongly
Agree
Agree Neutral Disagree Strongly Disagree Total
1 I am
secured
about the
future
of my job.
65
100
21
8
0
194
2 Supervisor
treats me as
a family
member.
50
80
45
10
0
185
3 I can
express my
view points
without
40
92
39
4
3
178
© 2018 JETIR December 2018, Volume 5, Issue 12 www.jetir.org (ISSN-2349-5162)
JETIR1812B60 Journal of Emerging Technologies and Innovative Research (JETIR) www.jetir.org 475
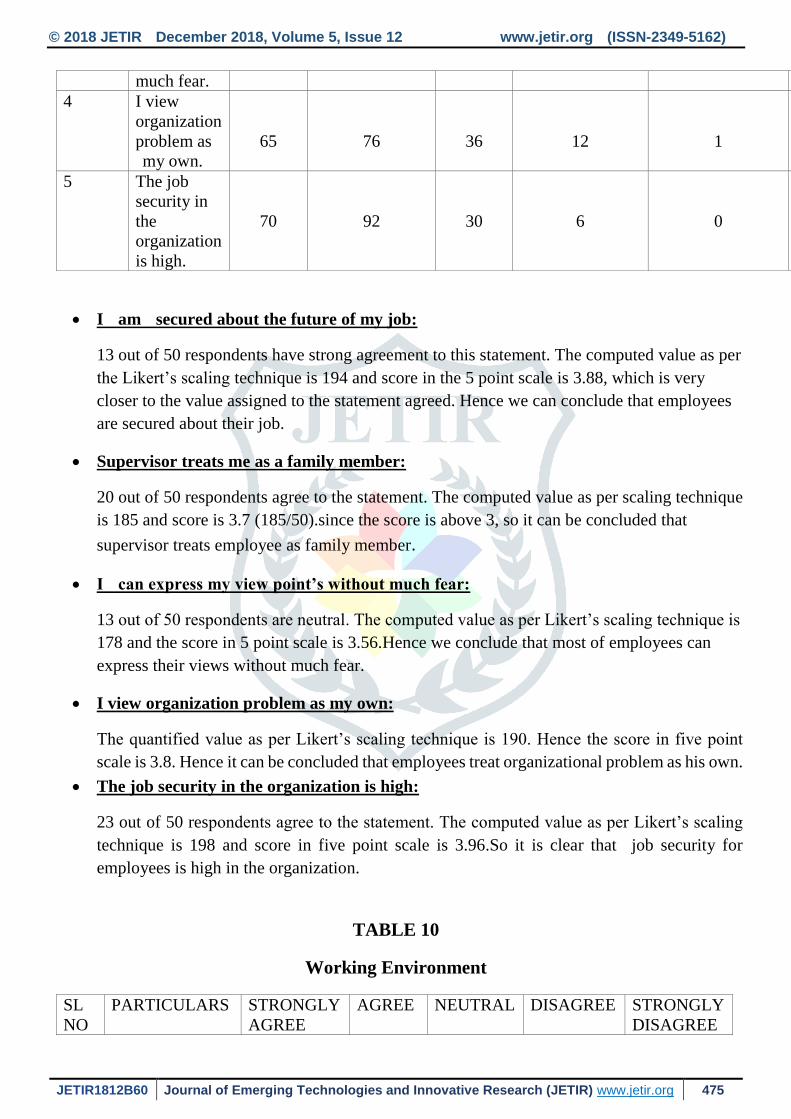
much fear.
4 I view
organization
problem as
my own.
65
76
36
12
1
190
5 The job
security in
the
organization
is high.
70
92
30
6
0
198
I am secured about the future of my job:
13 out of 50 respondents have strong agreement to this statement. The computed value as per
the Likert’s scaling technique is 194 and score in the 5 point scale is 3.88, which is very
closer to the value assigned to the statement agreed. Hence we can conclude that employees
are secured about their job.
Supervisor treats me as a family member:
20 out of 50 respondents agree to the statement. The computed value as per scaling technique
is 185 and score is 3.7 (185/50).since the score is above 3, so it can be concluded that
supervisor treats employee as family member.
I can express my view point’s without much fear:
13 out of 50 respondents are neutral. The computed value as per Likert’s scaling technique is
178 and the score in 5 point scale is 3.56.Hence we conclude that most of employees can
express their views without much fear.
I view organization problem as my own:
The quantified value as per Likert’s scaling technique is 190. Hence the score in five point
scale is 3.8. Hence it can be concluded that employees treat organizational problem as his own.
The job security in the organization is high:
23 out of 50 respondents agree to the statement. The computed value as per Likert’s scaling
technique is 198 and score in five point scale is 3.96.So it is clear that job security for
employees is high in the organization.
TABLE 10
Working Environment
SL
NO
PARTICULARS STRONGLY
AGREE
AGREE NEUTRAL DISAGREE STRONGLY
DISAGREE
© 2018 JETIR December 2018, Volume 5, Issue 12 www.jetir.org (ISSN-2349-5162)
JETIR1812B60 Journal of Emerging Technologies and Innovative Research (JETIR) www.jetir.org 476
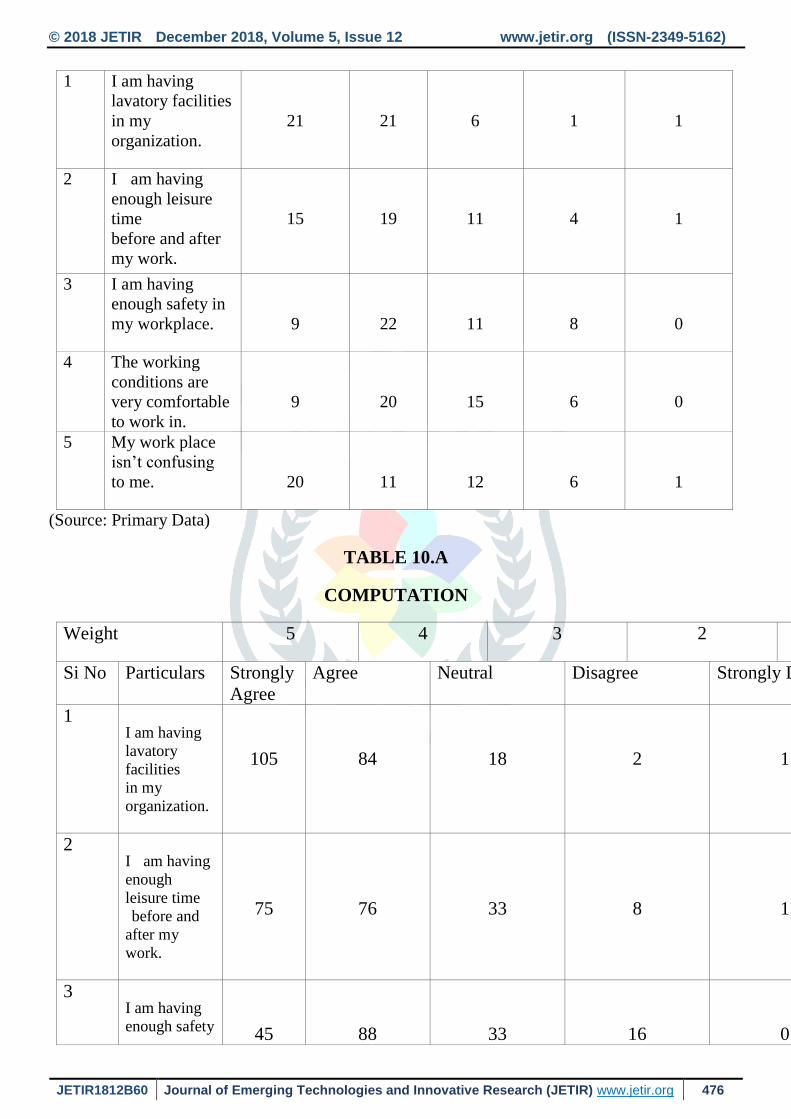
1 I am having
lavatory facilities
in my
organization.
21
21
6
1
1
2 I am having
enough leisure
time
before and after
my work.
15
19
11
4
1
3 I am having
enough safety in
my workplace.
9
22
11
8
0
4 The working
conditions are
very comfortable
to work in.
9
20
15
6
0
5 My work place
isn’t confusing
to me.
20
11
12
6
1
(Source: Primary Data)
TABLE 10.A
COMPUTATION
Weight 5 4 3 2 1
Si No Particulars Strongly
Agree
Agree Neutral Disagree Strongly Disagree
1
I am having
lavatory
facilities
in my
organization.
105
84
18
2
1
2
I am having
enough
leisure time
before and
after my
work.
75
76
33
8
1
3
I am having
enough safety
45
88
33
16
0
© 2018 JETIR December 2018, Volume 5, Issue 12 www.jetir.org (ISSN-2349-5162)
JETIR1812B60 Journal of Emerging Technologies and Innovative Research (JETIR) www.jetir.org 477
in
my
workplace.
4
The working
conditions are
very
comfortable
to work in.
45
80
45
12
0
5
My work
place isn’t
confusing
to me.
100
44
36
12
1
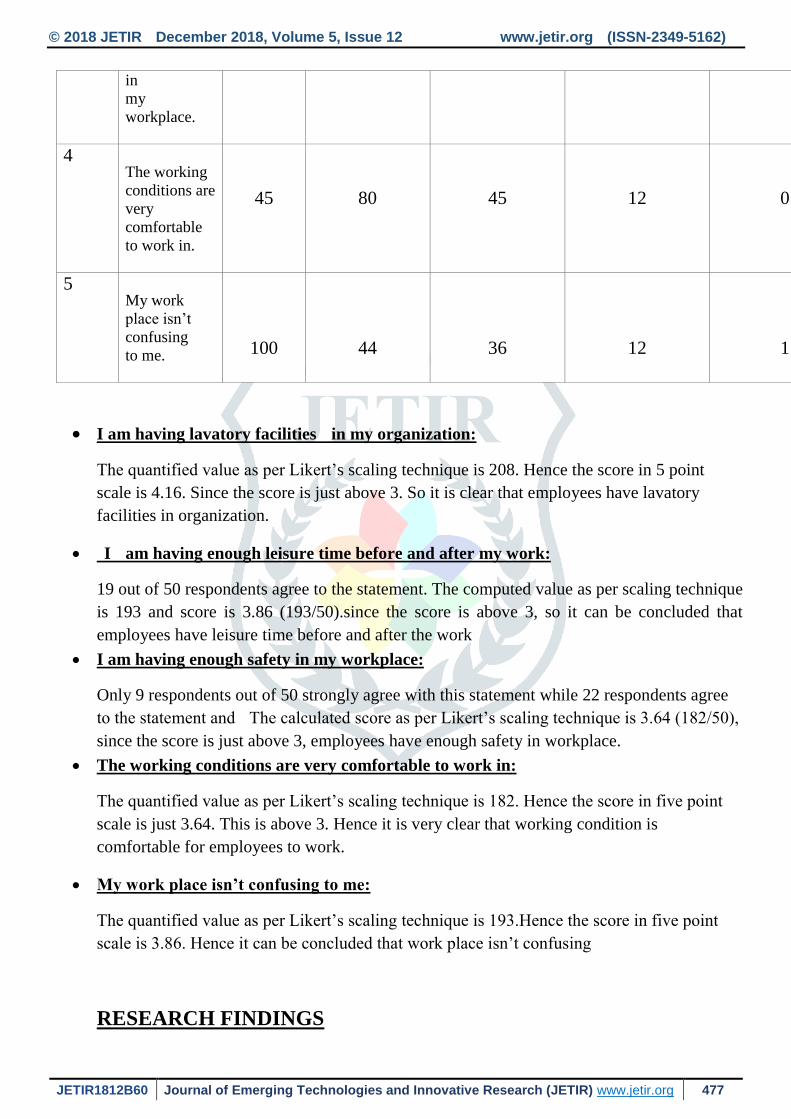
I am having lavatory facilities in my organization:
The quantified value as per Likert’s scaling technique is 208. Hence the score in 5 point
scale is 4.16. Since the score is just above 3. So it is clear that employees have lavatory
facilities in organization.
I am having enough leisure time before and after my work:
19 out of 50 respondents agree to the statement. The computed value as per scaling technique
is 193 and score is 3.86 (193/50).since the score is above 3, so it can be concluded that
employees have leisure time before and after the work
I am having enough safety in my workplace:
Only 9 respondents out of 50 strongly agree with this statement while 22 respondents agree
to the statement and The calculated score as per Likert’s scaling technique is 3.64 (182/50),
since the score is just above 3, employees have enough safety in workplace.
The working conditions are very comfortable to work in:
The quantified value as per Likert’s scaling technique is 182. Hence the score in five point
scale is just 3.64. This is above 3. Hence it is very clear that working condition is
comfortable for employees to work.
My work place isn’t confusing to me:
The quantified value as per Likert’s scaling technique is 193.Hence the score in five point
scale is 3.86. Hence it can be concluded that work place isn’t confusing
RESEARCH FINDINGS
© 2018 JETIR December 2018, Volume 5, Issue 12 www.jetir.org (ISSN-2349-5162)
JETIR1812B60 Journal of Emerging Technologies and Innovative Research (JETIR) www.jetir.org 478
The study found that most of the questionair respondents are male.38% of the respondents are between the
age group 26 – 40.36 % of the respondents were malayalees.Out of 50 respondents, majority were having
educational qualification of 8th – 10th. 34% of employees joined during 2005 – 2010. Most of the employees
are on contract basis. Majority of the respondents disagree that the salary they get is adequate to meet their
expenses. Majority (18 out of 50) of the employees shows disagreement with the statement that they are fairly
paid compared to other hotels.Most of the respondents agree with the statement that they gets salary on correct
time .20 out of 50 respondents partially agree or they have neutral attitude towards the statement that they “gets
yearly bonus for their work”.20 respondents agree that they get non –financial incentives such as leave, health
benefits. 25 out of 50 respondents are of the opinion that they are secured about the future of their job. Majority
have strong disagreement to the statement “Supervisor treats me as a family member”.23 out of 50 strongly
disagree that they can express their view points without much fear. Majority have stated that they view
organization’s problem as their own. 23 respondents opined that the job security in their concerned organization
is high. Majority of the respondents strongly agree that they have lavatory facilities in their organization.19
out of 50 respondents agree that they have enough leisure time before and after their work. 22 respondents
opined that they have enough safety in their work environment. Majority of the respondents are satisfied with
the working conditions in the organization. Most of the respondents (20 out of 50) have strong agreement to the
statement that their work environment isn’t confusing.
CONCLUSIONS AND RECOMENDATIONS
The objective for which the present project work was taken up were to assess the job satisfaction of
hotel employees in Ranni taluk, to assess the job satisfaction on compensation and rewards,to assess the job
security of the employees and work environment and to understand the level of satisfaction of employees. As
per study Majority of the respondents disagree that the salary they get is adequate to meet their expenses.
Majority (18 out of 50) of the employees shows disagreement with the statement that they are fairly paid
compared to other hotels.Most of the respondents agree with the statement that they gets salary on correct time
.20 out of 50 respondents partially agree or they have neutral attitude towards the statement that they “gets
yearly bonus for their work”.20 respondents agree that they get non –financial incentives such as leave, health
benefits. 25 out of 50 respondents are of the opinion that they are secured about the future of their job. Majority
have strong disagreement to the statement “Supervisor treats me as a family member”. Majority have stated that
they view organization’s problem as their own. Majority of the respondents strongly agree that they have
lavatory facilities in their organization. 22 respondents opined that they have enough safety in their work
environment. Majority of the respondents are satisfied with the working conditions in the organization. Most
of the respondents (20 out of 50) have strong agreement to the statement that their work environment isn’t
confusing.
REFERENCE
https://en.wikipedia.org/wiki/Job_satisfaction
https://oshwiki.eu/wiki/Job_satisfaction:_theories_and_definitions
www.khra.in
www.keralahotelsassociation.com
BOOKS:
Human Resource Management L.M Prasad