Embed Size (px)
Citation preview
A Study on LONG - Term Liquidity Position of the
Select Paper Mills in Tamilnadu 1D. Jai Ganesh and 2S.M. Chockalingam
1Karpagam Academy of Higher Education,
Coimbatore, Tamil Nadu.
2Department of Commerce,
Karpagam Academy of Higher Education,
Coimbatore.
Abstract Paper is considered as one of the important inventions that has created
History around the world. Paper has spread to all elements of human activity
from books to bullet and early morning News paper to Atom energy. The
Paper firms are considered as the 2nd largest in India that is liberated after
cement Industry. Currently, the financial performance of paper mills are not
satisfactory in spite of numerous benefits and fiscal concessions provided to
the firms. Hence, the Paper industry is facing crisis. In this situation the
scholar has made a deliberate effort in analyzing the Long term liquidity
position of Tamilnadu News Print & Papers Limited and Seshasayee Paper and
Boards Limited in Tamil Nadu. The study is analytical in nature with a focus
on comparing the short-term liquidity position of the TNPL and SPBL. As on
31.03.2015, there are eight paper mills in operation in Tamil Nadu, out of which
only 2 large-scale paper Mills, namely TNPL and SPBL is choosed. Thus, the
two large-scale paper mills are chosen for the current study. The study
includes both the primary and secondary data. For collecting the primary data,
personal discussions are made with the officials of the select paper mills. The
study is based on the secondary data. The secondary data are collected from
the annual statement reports published, account books, minutes, audit reports,
company annual reports and circulars of the TNPL and SPBL. A period of ten
years from 2005-06 to 2014-15 is selected for this study. The results show that
there is an important difference in the current ratio, quick ratio and super
quick ratio between the TNPL and SPBL during the period of study. On the
other hand, there is no important difference is discovered in the inventory to
working capital ratio b/w the TNPL and SPBL. The select paper mills face
problems such as inadequate short-term liquidity, improper utilization of
working capital and inefficiency of the cash management. The researcher
suggests better avenues to enhance the short-term liquidity position of both the
paper mills.
International Journal of Pure and Applied MathematicsVolume 117 No. 7 2017, 287-302ISSN: 1311-8080 (printed version); ISSN: 1314-3395 (on-line version)url: http://www.ijpam.euSpecial Issue ijpam.eu
287
1. Importance of the Paper Industry
Our country is one of the fastest developing market in the world & its current
situation indicated a satisfying position. The consumption of paper will be ready
at any movement with increasing in sync with the economic growth & is
projected to touch 13.95 million tones by the end of 2015-16. Paper and paper
products are a core sector of the Industrial Development and Regulation Act,
1951. Paper is considered as one of the essential products included in the
Essential Commodities Act, 1955.1 Due to the wide spread of Industry across
the globe, it has resulted in the regional balance of both output and
consumption. The predominant role of paper industry has continued until
recently when the revolution in microelectronics and photo chemicals posed
challenges to this industry.2
Growing consumerism, modern retailing, rising literacy through the Sarva
Shiksha Abhiyan, and more maintenance of documentation will help in
increasing the demand of paper. Though India’s per capita consumption is quite
less, when compared to other countries, there is an upward trend & the demand
is likely to increase from current 13 million tones to a projected 20 million tones
by the end of 2020. There is more scope for growth of paper industry in India.
From the view of demand, with every one Kg increase in the per capita
consumption will result in additional demand of one million tone per year.
Moreover, with more than half of the world population in Asia, the potential
growth in paper consumption is enormous.3 The Indian paper industry plays a
vital role in economic development by contributing to a sizeable revenue for the
exchequer. It provides Job opportunities to 1.50 million people and its
contribution to the Government is around Rs.3000 crores. The projected sales of
the paper industry is Rs.35000 crores.
2. Long Term Solvency Analysis
The term “Solvency means the possession of Total Assets in excess of External
liabilities. In other words, the ability to pay the debts is called Solvency. Each &
every activities of the business such as Operation, Financing and Investing
activity have an impact on Solvency. The long-term indebtedness of a company
includes Long term Loan, Debentures, Creditors etc. The long-term Debts of a
Company are mostly concerned regarding the earning capacity, so as to enable
the firm to pay Interest regularly, commitment in payment of principal amount
on the maturity date. In this chapter, an attempt has been made to analyze the
Solvency position in Long run of the select paper mills.
1Alka Subramanian, “Small is not Beautiful: A Study of Paper Industry”, Economic and Political
Weekly, Vol. XXII, No. 35, August, Pp. 87, 1987. 2Research Section of the National Productivity Council, “Productivity Norms for Agro Paper Mills”,
Productivity, Vol. 29, No. 4, January-March, Pp. 467, 1989. 3 Seetal S. Mehta and Rakshesh J.Oza, “Indian Paper Industry Looking to a Sunbeam?”, SAKET
Industrial Digest, Vol. 5, No. 8, August, Pp. 11, 1999.
International Journal of Pure and Applied Mathematics Special Issue
288
The Soundness of the long term position of a company can be evaluated by
testing its capacity to pay interest at regular intervals and its ability in its
commitment to repay the Principal amount. The long-term solvency of any
business can be checked with the help of Debt Equity Ration , Fixed Asset
Ratio , Solvency Ratio & Proprietary Ratio etc. In this context, various analyses
such as ratio analysis, Co-efficient of variation, t. test , Growth rate variation
and inter-correlation analysis have been employed to evaluate the long-term
solvency position of the TNPL and SPBL.
3. Review of Literature
Sudarsana Reddy, Sivarami Reddy and Mohan Reddy (2014) 4 studied the
causes of poor financial performance of six paper mills in Andhra Pradesh for a
period of ten years. The data have been obtained from the secondary sources
such as Financial reports and books of accounts of select paper mills . mills, the
Stock Exchange Official Directory, etc. The study reveals that there is no
positive relation between debt and equity and there was the possibility of non-
payment of interest charges to creditors, which may have caused financial
problems. The selected paper mills have not made use of Fixed assets
effectively and have made use of Term funds to provide funds for fixed assets.
Raw material was under-stocked and all the sample mills have not maintained
finished paper stock properly.
Basavarajappa (2012)5 made an attempt to study the effectiveness of inventory
management; to study the inventory management practices in Mysore Paper
Mills Limited; to evaluate the inventory control techniques in Mysore Paper
Mills Limited; and to offer suggestions for improving the efficiency in
inventory management. This study was mainly concentrated on inventory
management adopted by the company. The results indicate that inventory
turnover ratio are increased from 2005 to 2007 (3.43 to 3.631) then it decreases
in 2008, 2009 finally it increased in the 2010. Raw material turnover ratio is
lowest in 2006 at 3.83 and highest in the year 2007. The study suggests that
stock-in-process ratio should be decreased so it is good to an organization. The
store can be moderate according to the needs of the company. This will provide
effective, safe and good storage system. The company should follow the first in
first out method in issuing the materials to the production department.
Lamaan Sami and Anas Khan (2015)6 examined the financial performance of
the Ballarpur Industries Limited and Tamil Nadu Newsprint and Papers
4Reddy, G.Sudarsana, Reddy, C.Sivarami and Reddy, P.Mohan, “Management Focus on Operational
Performance of Paper Industry in Andhra Pradesh State of India: Empirical Research Findings”, Journal of
Financial Management and Analysis, Vol. 27, No. 2, July-December, 2014. 5Basavarajappa, M.T, “An Empirical Investigation of Inventory Management Practices of Mysore Paper
Mills Limited Bhadravathi: A Case Study”, International Journal of Research in Computer Application &
Management, Vol. 2, No. 12, December, Pp.150-155, 2012. 6Lamaan Sami and Anas Khan (2015). “Financial Performance Appraisal of Paper Industry in India: A
Study of Selected Paper Mills”, International Journal of Multidisciplinary Research and Development, Vol.2,
No.12, December, pp. 69-72.
International Journal of Pure and Applied Mathematics Special Issue
289
Limited. The objectives of the study are: to study the concept of financial
performance appraisal; to analyze the profitability position of BILT and TNPL;
to analyze the liquidity position of BILT and TNPL; to appraise the long-term
solvency and short-term solvency of BILT and TNPL; and to suggests ways to
enhance the financial performance of the BILT and TNPL. The study is based
on the secondary sources of data collected from the published financial
statements of the selected paper mills. Therefore, to study the Financial
performance Profitability, Liquidity and Solvency ratios are used for the said
purpose. The findings showed that there is a significant d/f in BILT and TNPL
with respect to G/P Ratio, N/P ratio , CR , QR and DER.
Halani (2014)7 made an attempt to study the factors affecting working capital
requirements in selected paper companies in India; and to analyze the working
capital management with respect to trade off between the liquidities. The study
was preliminary based on the published accounts and Annual Financial
Statement of the select paper mills. The study shows that the current ratio was
satisfactory in Andhra Pradesh Paper Mills, Ballarpur Paper Mills, J. K. Paper
Mills, Orient Paper and Industries, Seshasayee Paper and Boards, Sirpur Paper
Mills, South India Paper Mills and Star Paper Mills. Further, the current ratio is
also satisfactory in TNPL and West Coast Paper Mills. It is found that there is
an important variation in the current ratio of the select paper mills.
4. Research Gap
The above reviews show that there have been studies on financial performance
of public or private companies. The studies made on paper mills have analyzed
only Inventory management and analysis of one company. Therefore, No such
study has been undertaken to compare the Long Term Liquidity aspects of the
financial performance of the Tamil Nadu Newsprint and Papers Limited, and
Seshasayee Paper and Boards Limited on a comparative basis. Hence, a careful
and exhaustive investigation is found to be important in this aspect. With this
situation, the present study makes an attempt to fill in the research gap in these
areas.
5. Statement of the Problem
There is a downward trend in the Paper Industry in India due to the increase
in supply together with world wide recession. The world recession and Asian
crisis has contributed to a reduced demand considerably. Since 1990, the paper
industry in India is facing a trade cycle with different phases of over capacity
leading to fall in paper prices, lower capacity utilization and decreased
investments/capacity addition, followed by the dissolution of mills, decreased in
demand supply gap and once again back circle to increase the paper prices.
7Halani, P.R, “A Comparative Study of Working Capital Management of Selected Paper Companies in
India”, Research Hub: International Multidisciplinary Research Journal, Vol. 1, No. 5, December,
Pp. 1-11, 2014.
International Journal of Pure and Applied Mathematics Special Issue
290
More over availability of adequate capital, Raising cost of capital, Higher
dividend payout ratio, Higher interest on long term funding of Banks etc , have
also created a major blow to paper industries in India. The major issue before
the paper industry is production of paper. There are several issues that have
prone to the environmental issues. It is evident that planning for the
development of a basic industry like paper and pulp industries, account has not
taken immediately, but also fairly that there is the need for the country over a
long period. Inadequate investment in the infrastructure, lack of coherent and
modern manufacturing policy traditional labour welfare policies. And
insufficient supply of power has created a situation where only about 60%
production capacity is being used, while approximately 200 small mills are
currently underperforming or closed.
India’s infrastructure has seen improvement, but still has to improve a lot and it
is not on par with the developed countries. Developments in roads, railways and
ports can benefit all the industries including pulp and paper. India has a large
number of unskilled and skilled labours and the advantage of very low labour
costs. Indian paper Industries are facing difficulties such as increasing
production cost , Lack of adequate raw material , high labour and raw material ,
higher cost of power etc., there is also lack of availability of specialized and
sophisticated machineries and equipments in India. These machines need to be
imported at higher cost. There is also a sharp increase in prices that has resulted
in crisis in the economy and hence the paper industry has been facing crisis due
to different causes such as sub-optimal use of installed capacity, poor
profitability etc., Capacity under utilization, high costs of manufacture,
inefficient management in finance etc., are few causes for the poor profitability.
Paper mills also face a problem of sharp increase in the price of fuel. The steep
increase in the fuel had a negative impact on the operation cost of the paper
industry. The financial performance of the paper mills are not satisfactory in
spite of enormous benefits in terms of facility and fiscal benefis. Currently the
paper industry is at the crossroads In this context, the researcher makes an
attempt to compare the Long -term liquidity position of the Tamil Nadu News
Print and Papers Limited, and Seshasayee Paper and Boards Limited in
Tamilnadu.
6. Objectives of the Study
The Objective of the study is listed below:
1. To Study the Long-term liquidity position of the Tamil Nadu News Print
and Papers Limited, and Seshasayee Paper and Boards Limited.
2. To suggest the better measures to increase the Long-term liquidity
position of the select paper mills on the basis of findings in the study.
Testing of Hypothesis
The following Null Hypothesis is framed for the purpose of the study. The
validity is tested with the available data through an suitable analysis. Ho: There
is no significant difference in the Long-term liquidity position between the
International Journal of Pure and Applied Mathematics Special Issue
291
Tamil Nadu News Print and Papers Limited, and Seshasayee Paper and Boards
Limited.
Scope of the Study
This study is undertaken to assess the Long -term liquidity position of the select
paper mills. The present study is confined to two paper mills only, namely, the
Tamil Nadu Newsprint and Papers Limited (a public sector undertaking), and
Seshasayee Paper and Boards Limited (a private sector undertaking).
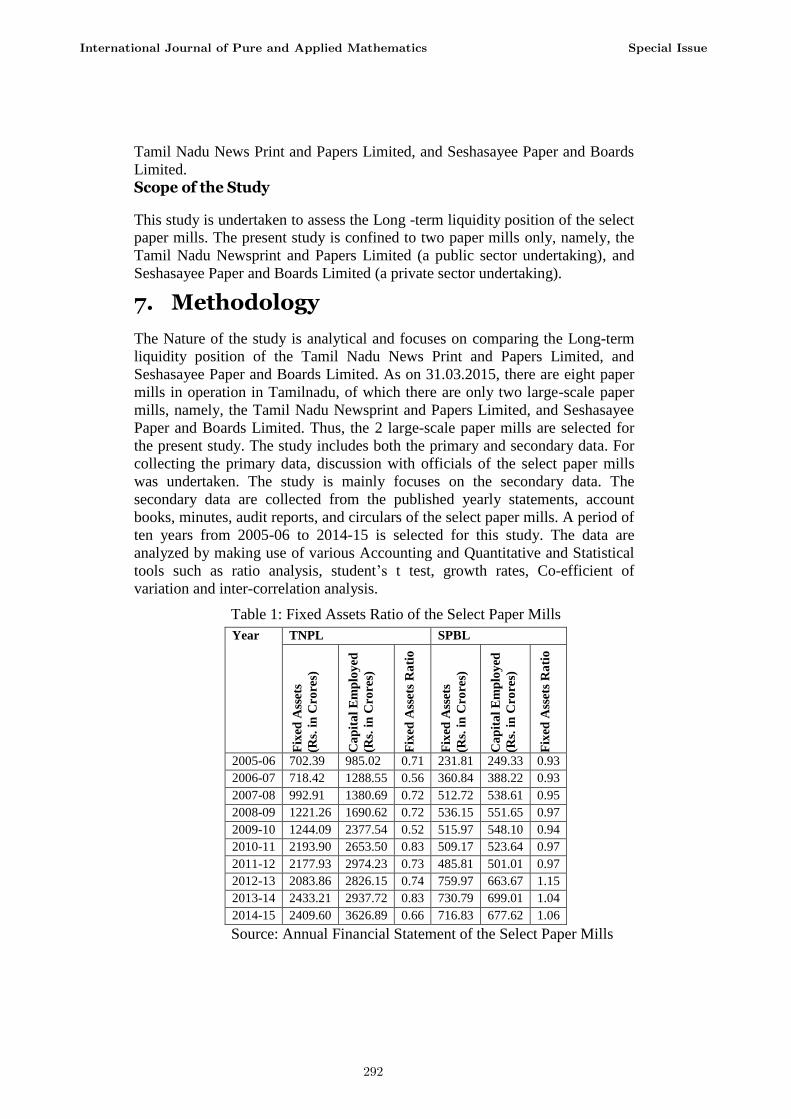
7. Methodology
The Nature of the study is analytical and focuses on comparing the Long-term
liquidity position of the Tamil Nadu News Print and Papers Limited, and
Seshasayee Paper and Boards Limited. As on 31.03.2015, there are eight paper
mills in operation in Tamilnadu, of which there are only two large-scale paper
mills, namely, the Tamil Nadu Newsprint and Papers Limited, and Seshasayee
Paper and Boards Limited. Thus, the 2 large-scale paper mills are selected for
the present study. The study includes both the primary and secondary data. For
collecting the primary data, discussion with officials of the select paper mills
was undertaken. The study is mainly focuses on the secondary data. The
secondary data are collected from the published yearly statements, account
books, minutes, audit reports, and circulars of the select paper mills. A period of
ten years from 2005-06 to 2014-15 is selected for this study. The data are
analyzed by making use of various Accounting and Quantitative and Statistical
tools such as ratio analysis, student’s t test, growth rates, Co-efficient of
variation and inter-correlation analysis.
Table 1: Fixed Assets Ratio of the Select Paper Mills
Year TNPL SPBL
Fix
ed A
sset
s
(Rs.
in
Cro
res)
Ca
pit
al
Em
plo
yed
(Rs.
in
Cro
res)
Fix
ed A
sset
s R
ati
o
Fix
ed A
sset
s
(Rs.
in
Cro
res)
Ca
pit
al
Em
plo
yed
(Rs.
in
Cro
res)
Fix
ed A
sset
s R
ati
o
2005-06 702.39 985.02 0.71 231.81 249.33 0.93
2006-07 718.42 1288.55 0.56 360.84 388.22 0.93
2007-08 992.91 1380.69 0.72 512.72 538.61 0.95
2008-09 1221.26 1690.62 0.72 536.15 551.65 0.97
2009-10 1244.09 2377.54 0.52 515.97 548.10 0.94
2010-11 2193.90 2653.50 0.83 509.17 523.64 0.97
2011-12 2177.93 2974.23 0.73 485.81 501.01 0.97
2012-13 2083.86 2826.15 0.74 759.97 663.67 1.15
2013-14 2433.21 2937.72 0.83 730.79 699.01 1.04
2014-15 2409.60 3626.89 0.66 716.83 677.62 1.06
Source: Annual Financial Statement of the Select Paper Mills
International Journal of Pure and Applied Mathematics Special Issue
292
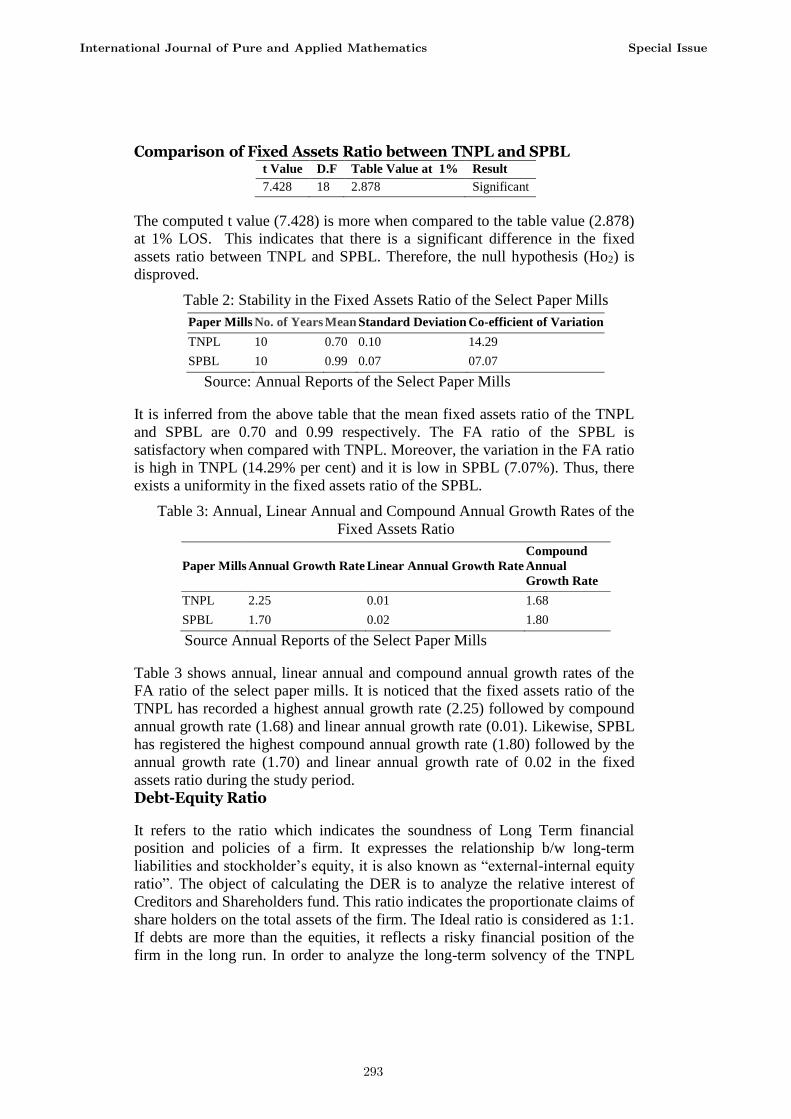
Comparison of Fixed Assets Ratio between TNPL and SPBL t Value D.F Table Value at 1% Result
7.428 18 2.878 Significant
The computed t value (7.428) is more when compared to the table value (2.878)
at 1% LOS. This indicates that there is a significant difference in the fixed
assets ratio between TNPL and SPBL. Therefore, the null hypothesis (Ho2) is
disproved.
Table 2: Stability in the Fixed Assets Ratio of the Select Paper Mills
Paper Mills No. of Years Mean Standard Deviation Co-efficient of Variation
TNPL 10 0.70 0.10 14.29
SPBL 10 0.99 0.07 07.07
Source: Annual Reports of the Select Paper Mills
It is inferred from the above table that the mean fixed assets ratio of the TNPL
and SPBL are 0.70 and 0.99 respectively. The FA ratio of the SPBL is
satisfactory when compared with TNPL. Moreover, the variation in the FA ratio
is high in TNPL (14.29% per cent) and it is low in SPBL (7.07%). Thus, there
exists a uniformity in the fixed assets ratio of the SPBL.
Table 3: Annual, Linear Annual and Compound Annual Growth Rates of the
Fixed Assets Ratio
Paper Mills Annual Growth Rate Linear Annual Growth Rate
Compound
Annual
Growth Rate
TNPL 2.25 0.01 1.68
SPBL 1.70 0.02 1.80
Source Annual Reports of the Select Paper Mills
Table 3 shows annual, linear annual and compound annual growth rates of the
FA ratio of the select paper mills. It is noticed that the fixed assets ratio of the
TNPL has recorded a highest annual growth rate (2.25) followed by compound
annual growth rate (1.68) and linear annual growth rate (0.01). Likewise, SPBL
has registered the highest compound annual growth rate (1.80) followed by the
annual growth rate (1.70) and linear annual growth rate of 0.02 in the fixed
assets ratio during the study period.
Debt-Equity Ratio
It refers to the ratio which indicates the soundness of Long Term financial
position and policies of a firm. It expresses the relationship b/w long-term
liabilities and stockholder’s equity, it is also known as “external-internal equity
ratio”. The object of calculating the DER is to analyze the relative interest of
Creditors and Shareholders fund. This ratio indicates the proportionate claims of
share holders on the total assets of the firm. The Ideal ratio is considered as 1:1.
If debts are more than the equities, it reflects a risky financial position of the
firm in the long run. In order to analyze the long-term solvency of the TNPL
International Journal of Pure and Applied Mathematics Special Issue
293
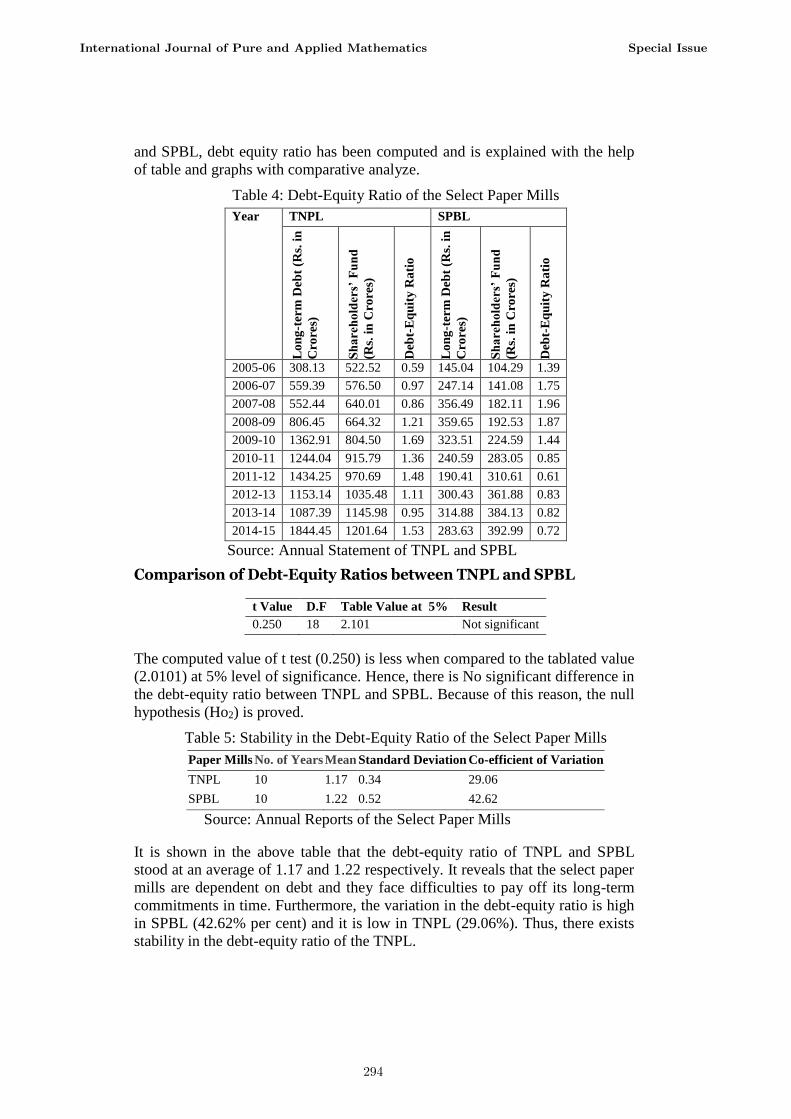
and SPBL, debt equity ratio has been computed and is explained with the help
of table and graphs with comparative analyze.
Table 4: Debt-Equity Ratio of the Select Paper Mills
Year TNPL SPBL
Lo
ng
-ter
m D
eb
t (R
s. i
n
Cro
res)
Sh
are
ho
lder
s’ F
un
d
(Rs.
in
Cro
res)
Deb
t-E
qu
ity
Ra
tio
Lo
ng
-ter
m D
eb
t (R
s. i
n
Cro
res)
Sh
are
ho
lder
s’ F
un
d
(Rs.
in
Cro
res)
Deb
t-E
qu
ity
Ra
tio
2005-06 308.13 522.52 0.59 145.04 104.29 1.39
2006-07 559.39 576.50 0.97 247.14 141.08 1.75
2007-08 552.44 640.01 0.86 356.49 182.11 1.96
2008-09 806.45 664.32 1.21 359.65 192.53 1.87
2009-10 1362.91 804.50 1.69 323.51 224.59 1.44
2010-11 1244.04 915.79 1.36 240.59 283.05 0.85
2011-12 1434.25 970.69 1.48 190.41 310.61 0.61
2012-13 1153.14 1035.48 1.11 300.43 361.88 0.83
2013-14 1087.39 1145.98 0.95 314.88 384.13 0.82
2014-15 1844.45 1201.64 1.53 283.63 392.99 0.72
Source: Annual Statement of TNPL and SPBL
Comparison of Debt-Equity Ratios between TNPL and SPBL
t Value D.F Table Value at 5% Result
0.250 18 2.101 Not significant
The computed value of t test (0.250) is less when compared to the tablated value
(2.0101) at 5% level of significance. Hence, there is No significant difference in
the debt-equity ratio between TNPL and SPBL. Because of this reason, the null
hypothesis (Ho2) is proved.
Table 5: Stability in the Debt-Equity Ratio of the Select Paper Mills
Paper Mills No. of Years Mean Standard Deviation Co-efficient of Variation
TNPL 10 1.17 0.34 29.06
SPBL 10 1.22 0.52 42.62
Source: Annual Reports of the Select Paper Mills
It is shown in the above table that the debt-equity ratio of TNPL and SPBL
stood at an average of 1.17 and 1.22 respectively. It reveals that the select paper
mills are dependent on debt and they face difficulties to pay off its long-term
commitments in time. Furthermore, the variation in the debt-equity ratio is high
in SPBL (42.62% per cent) and it is low in TNPL (29.06%). Thus, there exists
stability in the debt-equity ratio of the TNPL.
International Journal of Pure and Applied Mathematics Special Issue
294
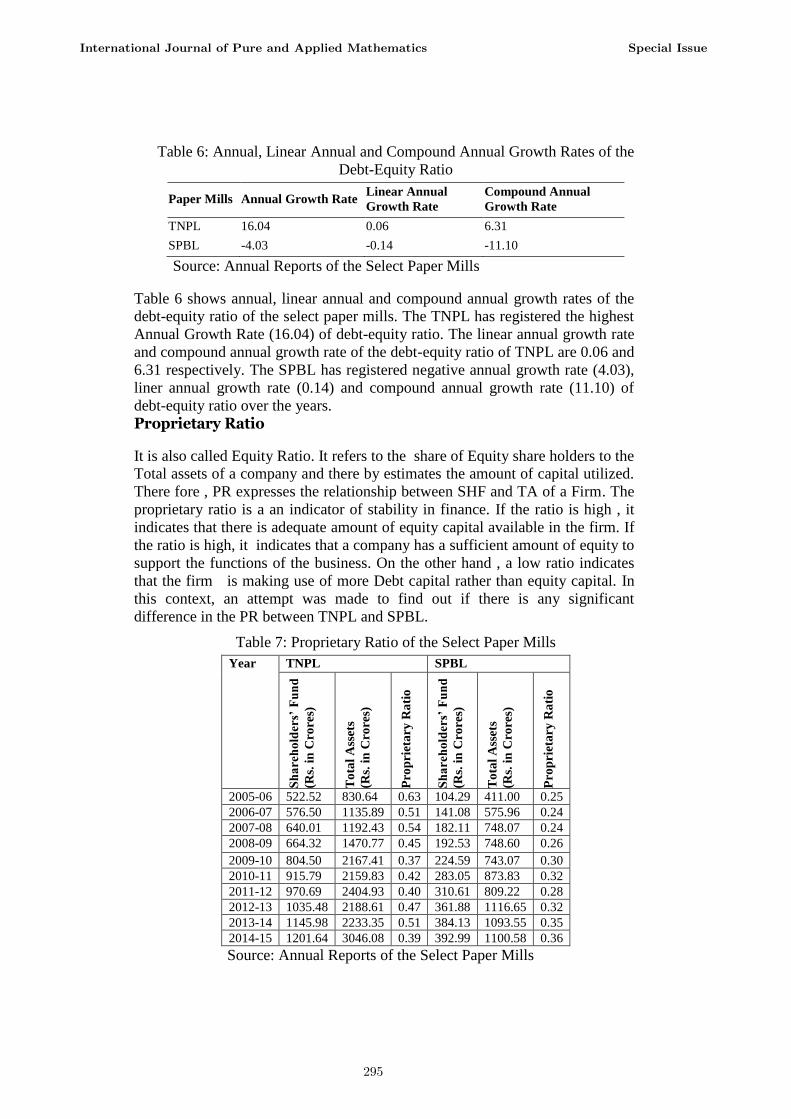
Table 6: Annual, Linear Annual and Compound Annual Growth Rates of the
Debt-Equity Ratio
Paper Mills Annual Growth Rate Linear Annual
Growth Rate
Compound Annual
Growth Rate
TNPL 16.04 0.06 6.31
SPBL -4.03 -0.14 -11.10
Source: Annual Reports of the Select Paper Mills
Table 6 shows annual, linear annual and compound annual growth rates of the
debt-equity ratio of the select paper mills. The TNPL has registered the highest
Annual Growth Rate (16.04) of debt-equity ratio. The linear annual growth rate
and compound annual growth rate of the debt-equity ratio of TNPL are 0.06 and
6.31 respectively. The SPBL has registered negative annual growth rate (4.03),
liner annual growth rate (0.14) and compound annual growth rate (11.10) of
debt-equity ratio over the years.
Proprietary Ratio
It is also called Equity Ratio. It refers to the share of Equity share holders to the
Total assets of a company and there by estimates the amount of capital utilized.
There fore , PR expresses the relationship between SHF and TA of a Firm. The
proprietary ratio is a an indicator of stability in finance. If the ratio is high , it
indicates that there is adequate amount of equity capital available in the firm. If
the ratio is high, it indicates that a company has a sufficient amount of equity to
support the functions of the business. On the other hand , a low ratio indicates
that the firm is making use of more Debt capital rather than equity capital. In
this context, an attempt was made to find out if there is any significant
difference in the PR between TNPL and SPBL.
Table 7: Proprietary Ratio of the Select Paper Mills
Year TNPL SPBL
Sh
are
ho
lder
s’ F
un
d
(Rs.
in
Cro
res)
To
tal
Ass
ets
(Rs.
in
Cro
res)
Pro
pri
eta
ry R
ati
o
Sh
are
ho
lder
s’ F
un
d
(Rs.
in
Cro
res)
To
tal
Ass
ets
(Rs.
in
Cro
res)
Pro
pri
eta
ry R
ati
o
2005-06 522.52 830.64 0.63 104.29 411.00 0.25
2006-07 576.50 1135.89 0.51 141.08 575.96 0.24
2007-08 640.01 1192.43 0.54 182.11 748.07 0.24
2008-09 664.32 1470.77 0.45 192.53 748.60 0.26
2009-10 804.50 2167.41 0.37 224.59 743.07 0.30
2010-11 915.79 2159.83 0.42 283.05 873.83 0.32
2011-12 970.69 2404.93 0.40 310.61 809.22 0.28
2012-13 1035.48 2188.61 0.47 361.88 1116.65 0.32
2013-14 1145.98 2233.35 0.51 384.13 1093.55 0.35
2014-15 1201.64 3046.08 0.39 392.99 1100.58 0.36
Source: Annual Reports of the Select Paper Mills
International Journal of Pure and Applied Mathematics Special Issue
295
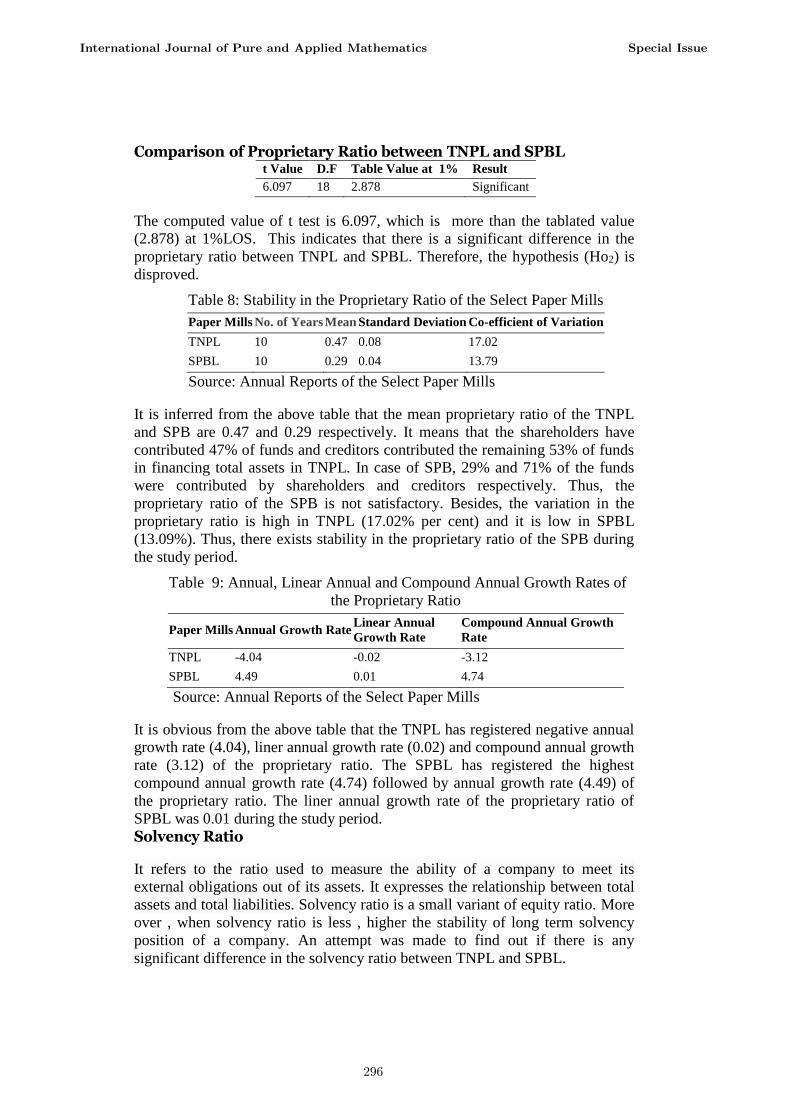
Comparison of Proprietary Ratio between TNPL and SPBL t Value D.F Table Value at 1% Result
6.097 18 2.878 Significant
The computed value of t test is 6.097, which is more than the tablated value
(2.878) at 1%LOS. This indicates that there is a significant difference in the
proprietary ratio between TNPL and SPBL. Therefore, the hypothesis (Ho2) is
disproved.
Table 8: Stability in the Proprietary Ratio of the Select Paper Mills
Paper Mills No. of Years Mean Standard Deviation Co-efficient of Variation
TNPL 10 0.47 0.08 17.02
SPBL 10 0.29 0.04 13.79
Source: Annual Reports of the Select Paper Mills
It is inferred from the above table that the mean proprietary ratio of the TNPL
and SPB are 0.47 and 0.29 respectively. It means that the shareholders have
contributed 47% of funds and creditors contributed the remaining 53% of funds
in financing total assets in TNPL. In case of SPB, 29% and 71% of the funds
were contributed by shareholders and creditors respectively. Thus, the
proprietary ratio of the SPB is not satisfactory. Besides, the variation in the
proprietary ratio is high in TNPL (17.02% per cent) and it is low in SPBL
(13.09%). Thus, there exists stability in the proprietary ratio of the SPB during
the study period.
Table 9: Annual, Linear Annual and Compound Annual Growth Rates of
the Proprietary Ratio
Paper Mills Annual Growth Rate Linear Annual
Growth Rate
Compound Annual Growth
Rate
TNPL -4.04 -0.02 -3.12
SPBL 4.49 0.01 4.74
Source: Annual Reports of the Select Paper Mills
It is obvious from the above table that the TNPL has registered negative annual
growth rate (4.04), liner annual growth rate (0.02) and compound annual growth
rate (3.12) of the proprietary ratio. The SPBL has registered the highest
compound annual growth rate (4.74) followed by annual growth rate (4.49) of
the proprietary ratio. The liner annual growth rate of the proprietary ratio of
SPBL was 0.01 during the study period.
Solvency Ratio
It refers to the ratio used to measure the ability of a company to meet its
external obligations out of its assets. It expresses the relationship between total
assets and total liabilities. Solvency ratio is a small variant of equity ratio. More
over , when solvency ratio is less , higher the stability of long term solvency
position of a company. An attempt was made to find out if there is any
significant difference in the solvency ratio between TNPL and SPBL.
International Journal of Pure and Applied Mathematics Special Issue
296
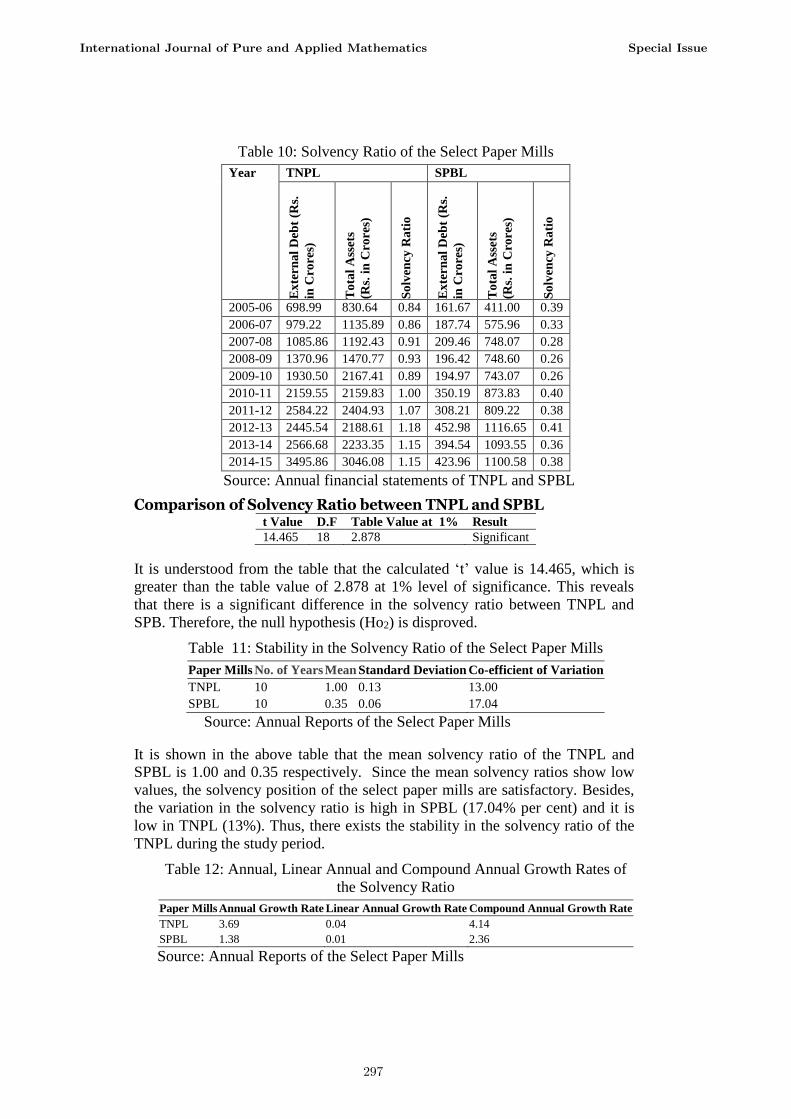
Table 10: Solvency Ratio of the Select Paper Mills
Year TNPL SPBL
Ex
tern
al
Deb
t (R
s.
in C
rore
s)
To
tal
Ass
ets
(Rs.
in
Cro
res)
So
lven
cy R
ati
o
Ex
tern
al
Deb
t (R
s.
in C
rore
s)
To
tal
Ass
ets
(Rs.
in
Cro
res)
So
lven
cy R
ati
o
2005-06 698.99 830.64 0.84 161.67 411.00 0.39
2006-07 979.22 1135.89 0.86 187.74 575.96 0.33
2007-08 1085.86 1192.43 0.91 209.46 748.07 0.28
2008-09 1370.96 1470.77 0.93 196.42 748.60 0.26
2009-10 1930.50 2167.41 0.89 194.97 743.07 0.26
2010-11 2159.55 2159.83 1.00 350.19 873.83 0.40
2011-12 2584.22 2404.93 1.07 308.21 809.22 0.38
2012-13 2445.54 2188.61 1.18 452.98 1116.65 0.41
2013-14 2566.68 2233.35 1.15 394.54 1093.55 0.36
2014-15 3495.86 3046.08 1.15 423.96 1100.58 0.38
Source: Annual financial statements of TNPL and SPBL
Comparison of Solvency Ratio between TNPL and SPBL t Value D.F Table Value at 1% Result
14.465 18 2.878 Significant
It is understood from the table that the calculated ‘t’ value is 14.465, which is
greater than the table value of 2.878 at 1% level of significance. This reveals
that there is a significant difference in the solvency ratio between TNPL and
SPB. Therefore, the null hypothesis (Ho2) is disproved.
Table 11: Stability in the Solvency Ratio of the Select Paper Mills
Paper Mills No. of Years Mean Standard Deviation Co-efficient of Variation
TNPL 10 1.00 0.13 13.00
SPBL 10 0.35 0.06 17.04
Source: Annual Reports of the Select Paper Mills
It is shown in the above table that the mean solvency ratio of the TNPL and
SPBL is 1.00 and 0.35 respectively. Since the mean solvency ratios show low
values, the solvency position of the select paper mills are satisfactory. Besides,
the variation in the solvency ratio is high in SPBL (17.04% per cent) and it is
low in TNPL (13%). Thus, there exists the stability in the solvency ratio of the
TNPL during the study period.
Table 12: Annual, Linear Annual and Compound Annual Growth Rates of
the Solvency Ratio
Paper Mills Annual Growth Rate Linear Annual Growth Rate Compound Annual Growth Rate
TNPL 3.69 0.04 4.14
SPBL 1.38 0.01 2.36
Source: Annual Reports of the Select Paper Mills
International Journal of Pure and Applied Mathematics Special Issue
297
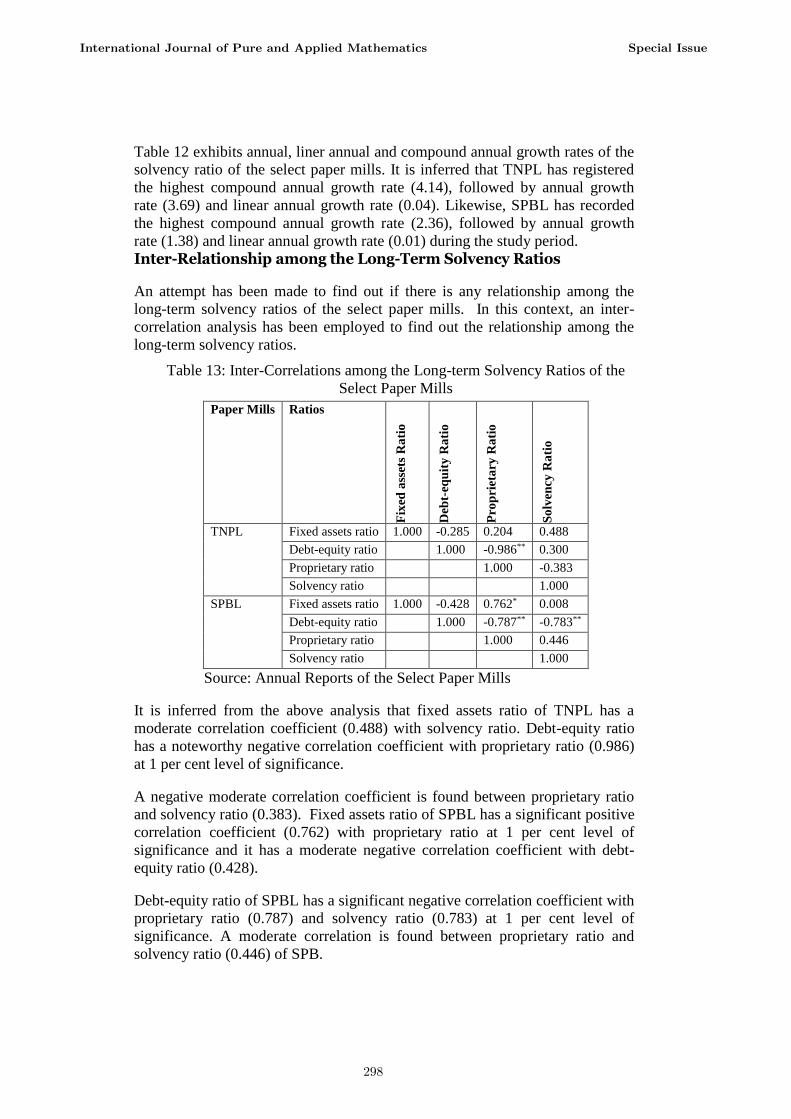
Table 12 exhibits annual, liner annual and compound annual growth rates of the
solvency ratio of the select paper mills. It is inferred that TNPL has registered
the highest compound annual growth rate (4.14), followed by annual growth
rate (3.69) and linear annual growth rate (0.04). Likewise, SPBL has recorded
the highest compound annual growth rate (2.36), followed by annual growth
rate (1.38) and linear annual growth rate (0.01) during the study period.
Inter-Relationship among the Long-Term Solvency Ratios
An attempt has been made to find out if there is any relationship among the
long-term solvency ratios of the select paper mills. In this context, an inter-
correlation analysis has been employed to find out the relationship among the
long-term solvency ratios.
Table 13: Inter-Correlations among the Long-term Solvency Ratios of the
Select Paper Mills
Paper Mills Ratios F
ixed
ass
ets
Ra
tio
Deb
t-eq
uit
y R
ati
o
Pro
pri
eta
ry R
ati
o
So
lven
cy R
ati
o
TNPL Fixed assets ratio 1.000 -0.285 0.204 0.488
Debt-equity ratio 1.000 -0.986** 0.300
Proprietary ratio 1.000 -0.383
Solvency ratio 1.000
SPBL Fixed assets ratio 1.000 -0.428 0.762* 0.008
Debt-equity ratio 1.000 -0.787** -0.783**
Proprietary ratio 1.000 0.446
Solvency ratio 1.000
Source: Annual Reports of the Select Paper Mills
It is inferred from the above analysis that fixed assets ratio of TNPL has a
moderate correlation coefficient (0.488) with solvency ratio. Debt-equity ratio
has a noteworthy negative correlation coefficient with proprietary ratio (0.986)
at 1 per cent level of significance.
A negative moderate correlation coefficient is found between proprietary ratio
and solvency ratio (0.383). Fixed assets ratio of SPBL has a significant positive
correlation coefficient (0.762) with proprietary ratio at 1 per cent level of
significance and it has a moderate negative correlation coefficient with debt-
equity ratio (0.428).
Debt-equity ratio of SPBL has a significant negative correlation coefficient with
proprietary ratio (0.787) and solvency ratio (0.783) at 1 per cent level of
significance. A moderate correlation is found between proprietary ratio and
solvency ratio (0.446) of SPB.
International Journal of Pure and Applied Mathematics Special Issue
298
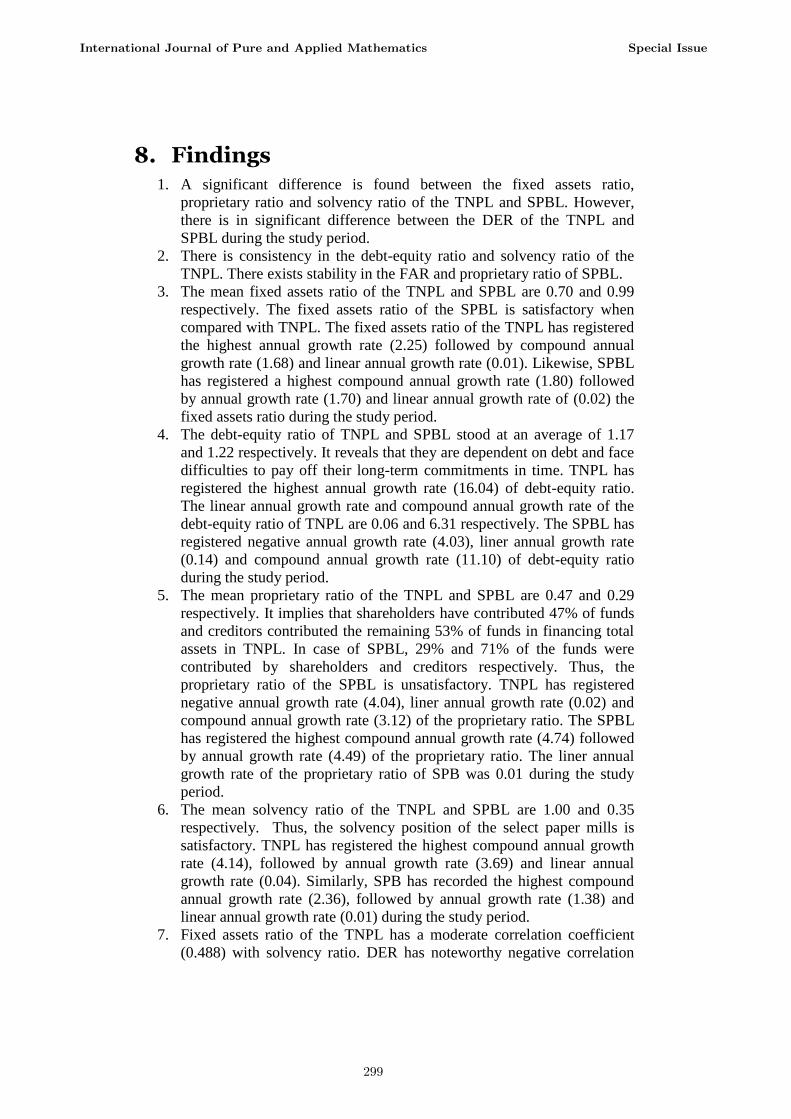
8. Findings
1. A significant difference is found between the fixed assets ratio,
proprietary ratio and solvency ratio of the TNPL and SPBL. However,
there is in significant difference between the DER of the TNPL and
SPBL during the study period.
2. There is consistency in the debt-equity ratio and solvency ratio of the
TNPL. There exists stability in the FAR and proprietary ratio of SPBL.
3. The mean fixed assets ratio of the TNPL and SPBL are 0.70 and 0.99
respectively. The fixed assets ratio of the SPBL is satisfactory when
compared with TNPL. The fixed assets ratio of the TNPL has registered
the highest annual growth rate (2.25) followed by compound annual
growth rate (1.68) and linear annual growth rate (0.01). Likewise, SPBL
has registered a highest compound annual growth rate (1.80) followed
by annual growth rate (1.70) and linear annual growth rate of (0.02) the
fixed assets ratio during the study period.
4. The debt-equity ratio of TNPL and SPBL stood at an average of 1.17
and 1.22 respectively. It reveals that they are dependent on debt and face
difficulties to pay off their long-term commitments in time. TNPL has
registered the highest annual growth rate (16.04) of debt-equity ratio.
The linear annual growth rate and compound annual growth rate of the
debt-equity ratio of TNPL are 0.06 and 6.31 respectively. The SPBL has
registered negative annual growth rate (4.03), liner annual growth rate
(0.14) and compound annual growth rate (11.10) of debt-equity ratio
during the study period.
5. The mean proprietary ratio of the TNPL and SPBL are 0.47 and 0.29
respectively. It implies that shareholders have contributed 47% of funds
and creditors contributed the remaining 53% of funds in financing total
assets in TNPL. In case of SPBL, 29% and 71% of the funds were
contributed by shareholders and creditors respectively. Thus, the
proprietary ratio of the SPBL is unsatisfactory. TNPL has registered
negative annual growth rate (4.04), liner annual growth rate (0.02) and
compound annual growth rate (3.12) of the proprietary ratio. The SPBL
has registered the highest compound annual growth rate (4.74) followed
by annual growth rate (4.49) of the proprietary ratio. The liner annual
growth rate of the proprietary ratio of SPB was 0.01 during the study
period.
6. The mean solvency ratio of the TNPL and SPBL are 1.00 and 0.35
respectively. Thus, the solvency position of the select paper mills is
satisfactory. TNPL has registered the highest compound annual growth
rate (4.14), followed by annual growth rate (3.69) and linear annual
growth rate (0.04). Similarly, SPB has recorded the highest compound
annual growth rate (2.36), followed by annual growth rate (1.38) and
linear annual growth rate (0.01) during the study period.
7. Fixed assets ratio of the TNPL has a moderate correlation coefficient
(0.488) with solvency ratio. DER has noteworthy negative correlation
International Journal of Pure and Applied Mathematics Special Issue
299
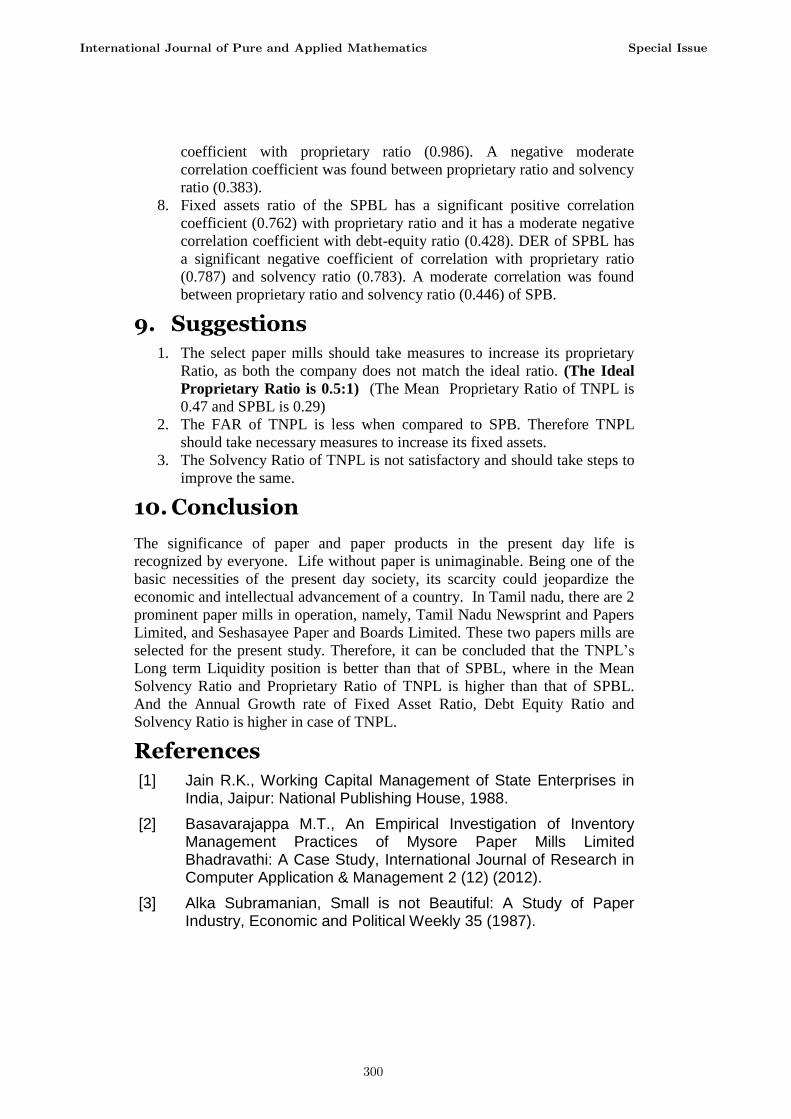
coefficient with proprietary ratio (0.986). A negative moderate
correlation coefficient was found between proprietary ratio and solvency
ratio (0.383).
8. Fixed assets ratio of the SPBL has a significant positive correlation
coefficient (0.762) with proprietary ratio and it has a moderate negative
correlation coefficient with debt-equity ratio (0.428). DER of SPBL has
a significant negative coefficient of correlation with proprietary ratio
(0.787) and solvency ratio (0.783). A moderate correlation was found
between proprietary ratio and solvency ratio (0.446) of SPB.
9. Suggestions
1. The select paper mills should take measures to increase its proprietary
Ratio, as both the company does not match the ideal ratio. (The Ideal
Proprietary Ratio is 0.5:1) (The Mean Proprietary Ratio of TNPL is
0.47 and SPBL is 0.29)
2. The FAR of TNPL is less when compared to SPB. Therefore TNPL
should take necessary measures to increase its fixed assets.
3. The Solvency Ratio of TNPL is not satisfactory and should take steps to
improve the same.
10. Conclusion
The significance of paper and paper products in the present day life is
recognized by everyone. Life without paper is unimaginable. Being one of the
basic necessities of the present day society, its scarcity could jeopardize the
economic and intellectual advancement of a country. In Tamil nadu, there are 2
prominent paper mills in operation, namely, Tamil Nadu Newsprint and Papers
Limited, and Seshasayee Paper and Boards Limited. These two papers mills are
selected for the present study. Therefore, it can be concluded that the TNPL’s
Long term Liquidity position is better than that of SPBL, where in the Mean
Solvency Ratio and Proprietary Ratio of TNPL is higher than that of SPBL.
And the Annual Growth rate of Fixed Asset Ratio, Debt Equity Ratio and
Solvency Ratio is higher in case of TNPL.
References
[1] Jain R.K., Working Capital Management of State Enterprises in India, Jaipur: National Publishing House, 1988.
[2] Basavarajappa M.T., An Empirical Investigation of Inventory Management Practices of Mysore Paper Mills Limited Bhadravathi: A Case Study, International Journal of Research in Computer Application & Management 2 (12) (2012).
[3] Alka Subramanian, Small is not Beautiful: A Study of Paper Industry, Economic and Political Weekly 35 (1987).
International Journal of Pure and Applied Mathematics Special Issue
300
[4] Seetal S. Mehta, Rakshesh J. Ozam, Indian Paper Industry Looking to a Sunbeam?”, SAKET Industrial Digest 5 (8) (1999).
[5] Sudarsana Reddy G, Sivaram Reddy C Mohan Reddy R, Debtors Management: A Case Study of Andhra Pradesh Paper Industry, The Management Accountant 38 (11) (2003).
[6] Lamaan Sami, Anas Khan, Financial Performance Appraisal of Paper Industry in India: A Study of Selected Paper Mills, International Journal of Multidisciplinary Research and Development 2 (12) (2015) 69-72.
[7] Halani P.R, A Comparative Study of Working Capital Management of Selected Paper Companies in India, Research Hub: International Journal of Multidisciplinary Research 1 (5) (2014) 1-11.
International Journal of Pure and Applied Mathematics Special Issue
301

302