Embed Size (px)
Citation preview
A STUDY ON MANAGEMENT OF PUBLIC EXPENDITURE
BY STATE GOVERNMENTS IN INDIA
PREPARED FOR PLANNING COMMISSION , GOVERNMENT OF INDIA
By Dr.Vathsala Ramji, Smt.Sujatha Suresh and V.K.Srinivasan
(THE INDIAN INSTITUTE OF ECONOMICS )
The Indian Institute of Economics ‘Federation House ’ 11-6-841,
Red Hills, Hyderabad - 500 004
Phone : 040-3393512 Fax : 040-3395083 Email : [email protected]
ACKNOWLEDGEMENT
This study on Management of Public Expenditure by the State Governments in India was made possible by a Grant- in-Aid of Rs.3.25 lakhs sanctioned by the Planning Commission Government of India , in March 2000. The Indian Institute of Economics is grateful to the Planning Commission for sanction of assistance as also for the continuous cooperation extended by the SER and FR Divisions of the Planning Commission . Dr.N.J.Kurian Adviser , FR and Dr. Sushmita Das Gupta Deputy Adviser , FR provided useful suggestions during the periodical reviews of the project. The project work was initiated by Dr.M.L.Kantha Rao and continued by Dr. Vathsala Ramji . A multi disciplinary team consisting of Dr.R.K.Mishra, Dean Institute of Public Enterprise ,Dr.S.Sudhakar , Associate Professor of Economics , Osmania University and Smt.Sujatha Suresh , Statistician and Computer Consultant was formed to review the scope of study , data collected and progress of the work . Sri M.C.Swaminathan Former Director(Planning) , Government of Andhra Pradesh helped the study with some useful suggestions and insights .We are grateful to them . The Report is the result of indefatigable efforts for compilation and analysis of data from different sources by Dr.Vathsala Ramji with excellent statistical and computer backup by Smt Sujatha Suresh. Sri . Murali Krishna and Sri Naveen Srivastava attended to the tabulation of data . The work was carried under the overall guidance of Sri V.K.Srinivasan ,Former Special Chief Secretary , Government of Andhra Pradesh and Hon.Director , Indian Institute of Economics. We are grateful to Principal Secretaries of Finance , Governments of Tamilnadu , Maharashtra and Andhra Pradesh for promptly forwarding all the budgetary documents. Valuable assistance was provided by Officers of the Reserve Bank of India, , Hyderabad in particular Dr. M. Seenuvasan , Assistant Adviser, Department of Economic Analysis and Policy : Dr.N.V.Koteswara Rao , Deputy Director General , National Informatics Centre , Hyderabad , Senior Officers of the Office of Accountant General, Andhra Pradesh.Sri Srinivasa Rao IRS , Finance and Planning Department , Government of Andhra Pradesh. Apart from Sri S.K.Yadav , Librarian , Indian Institute of Economics, Miss .Sushmita , of NIRD Library , and Sri Vijaykumar , Librarian , Centre for Economic and Social Studies have also rendered assistance in gathering of data. Above all , we owe a deep debt to the valuable work done by the Reserve Bank of India , Economic and Political Weekly Research Foundation , as also to several scholars of Public Finance whose analyses have been published in leading Journals. We have tried to acknowledge the sources of data and analytical information in the course of the Report. Any omission in this regard is purely unintentional 1.12.2001 V.K.Srinivasan Hon.Director, IIE
CONTENTS
Executive Summary ES-1
Introduction i
I The National Setting
1.1 Current Fiscal Outlook 6
1.2 Perspective View of Finances of the Centre and the States 9
1.3 Perspective View of Finances of the Centre 13
II Finances of the States
2.1 Perspective View 17
2.2 Fiscal Imbalances and the Sources of Crisis 20
III Constitutional and Policy Framework
3.1 Fiscal Federalism 28
3.2 Changing Policy Framework - Economic Reforms 46
3.3 Economic Reforms- Plan and Union Budget 56
IV Growth Performance of the States
4.1 Structural Transformation 65
4.2 Growth Performance and Levels of Development 67
V Budgetary Trends in the States
5.1 Perspectives of Planning Commission,
RBI, Finance Ministry 83
5.2 Budgetary Trends in the States 87
5.3 Trends in Expenditure Management 94
5.4 Size of Debt and Interest Burden 102
5.5 Gross Fiscal Deficit 108
VI Socio – Economic Profile of Select States 113
VII Budgetary Profiles of Select States 124
VIII Sectoral Insights
8.1 Economic Services: Irrigation Financing and Development 134
8.2 Social Services Education 145
8.3 General Services- Administrative Services 155
(Contd)
IX Problem Areas in Public Expenditure
9.1 Leakage and Wastage 160
9.2 Intra State Disparities and Political Unrest 174
9.3 Devolution to Local Bodies 180
9.4 Falling levels of Fiscal Marksmanship 184
9.5 Fading Standards of Accountability 189
X Fiscal Reforms and the Future
10.1 Reversing Fiscal Crises 193
10.2 Cost Recovery and Subsidies 198
XI Summing up and Suggestions 208
Bibliography
Statistical Tables (Separate Volume)
ES-1
EXECUTIVE SUMMARY
CHAPTER- I NATIONAL SETTING (Pgs 6-16) Study of Management of Public Expenditure by State Governments in India is highly
relevant as
• The Indian Economy is in a decelerating mode according to the Planning Commission
(Approach Paper 10th FYP) marked by deterioration of the fiscal situation– with high fiscal
and revenue deficits at both Centre and the States especially in the 1990’s
• Economic Survey (2000-01) of the Ministry of Finance, recognises gaps in the reform
process clo uding the long term prospects of the economy and recommends credible medium
term programme of fiscal improvement.
• International Monetary Fund’s Report (April 2000) categorises India among the fastest
growing economies of the world needing deft handling of monetary policy to combat the
challenge of fiscal deficit.
• Approaches to Public Expenditure Management during the Eighth Plan have been,
directed towards reducing budgetary deficits and have concentrated on compression of
public investment affecting development investments (Mid Term Appraisal of the Ninth
FYP)
• There is need for appreciation of the fact that the character of expenditure, rather than the
size of the deficit is more important and that the composition of the budget and direction of
expenditure influence the growth of GDP and that the level and patterns of expenditure as
well as the means through which resources are raised directly affect the income and
expenditure streams.
• Analysis of the patterns and composition of expenditure at the Centre and States reveal
that
(a) While development expenditure at the Centre increased in absolute terms from
Rs.13,327 crores in 1980-81 to Rs. 1,34,637 crores in 2000-2001, it registered a decrease
from 9.3% of GDP in 1980-81 to 6.2 percent of GDP in 2000-01 (BE).
(b) Non Development Expenditure, on the other hand has increased both in absolute terms
as also in terms of proportion of GDP. At the centre it has increased from Rs. 9867 crores
(6.9% of GDP) in 1980-81 steadily to Rs. 213580 crores (9.8% of GDP) in 2000-01 (BE).
(c) At the state development expenditure increased from Rs . 15961 crores in 1980-81 to
Rs.208333 crores in 2000-2001 registering however a decline in GDP terms from 11.1 % to
ES-2
9.6 % during the same period Non development Expenditure has increased from Rs. 4289
crores (3.0% of GDP) in 1980-81 to Rs. 125484 crores (5.8% of GDP) in 2000-01 (BE)
without any fluctuations in the intervening years.
(d) Plan expenditure at the Centre while increasing in absolute terms from Rs. 28,401
crores to Rs. 88,100 crores , has shown a decrease viewed as a proportion of total
expenditure, from 5.8 percent in 1989-90 to 4.0 percent in 2000-01 (BE).
(e) At the State level, it increased in absolute terms from Rs. 23012 crores to Rs. 89074
crores but , as a percentage of its total expenditure, decreased from 4.7 percent to 4.1 percent
in the period form 1989-90 to 2000-01 (BE)
(f) Non Plan Expenditure, at the Centre increased from Rs. 64505 crores in 1989-90 to
Rs. 250387 crores in 2000-2001 but as a proportion of total expenditure, recorded a
decrease from 13.17 percent to 11.5 percent during the same period. At the state levels,
however, non-plan expenditure increased both in absolute numbers as also as a proportion of
its total expenditure during the same period i.e. from Rs. 53798 crores (11.1 percent) to Rs.
261693 crores (12 percent) .
(g) As for the relative shares of Centre and States in Plan Expenditure one can see that,
while the share of centre increased from 36.02 percent in the First Five Year Plan to 56.93
percent in the Ninth Plan outlays, the share of states came down from 63.52 percent to 43.07
percent during the same period.
• Analysis of transactions on revenue and capital accounts, at the centre reveals that,
revenue surplus covered to a significant extent the capital deficit till the eighties but the trend
reversed in the nineties with the emergence of capital surpluses and revenue deficits,
reduction in capital expenditure and increasing borrowings and debt liabilities in the latter
years.
• Reviewing the Receipts at the centre, it is noted that
(a) Gross tax revenues have over the last two decades been slightly less the ten percent of
the GDP except in the later part of the 80’s and early 90’s.
(b) The share of direct taxes in total Revenue have come down from 21.91 percent in 1980-
85 to 18.76 percent in 1985-90 before increasing to 29.18 percent during 1995-99, the later
day increase being attributed to widening of the tax base.
(c) The indirect taxes accounting for 79% in the eighties decreased steeply as proportion of
total revenue accounting for 66.29 percent during 1995-99, mainly on account of progressive
extension of MODVAT to the entire industry sector, and non taxation of the services sectors,
and cut in customs duties.
ES-3
The Non Tax Revenue, viewed as a proportion of total Revenue, increased steadily from
22.55 percent in the eighties to 27.62 percent in the nineties. But as proportion of GDP, it
ranged between 2.13 and 2.7 percent of GDP during the two decades.
• Capital receipts of Centre , fluctuated between 6.2 to 7.3 percent of GDP during the two
decades.
(a) Internal debt, a major category, accounted for 31.43 percent of total Capital Receipts
during 1980-85, declined to 25.37 percent in 1985-90, before increasing to 26.39 percent in
1995, further steeply increasing to 43.99 percent in 1999.
(b) The share of recovery of loans in Capital Receipts was 21.46 % between 1980-85 15.79
% in 1985-90 ,13.64 % in 1990-95 and 10.35 percent in 1995-99.
(c) Small savings and provident funds increased from 14.62 percent in 1980-85 to 28.04
percent in 1995-99
• The fiscal scenario at the Centre for the nineties indicate that
While the total expenditure increased in absolute terms, but declined as a proportion of GDP,
the rising tide of expenditure could not be adequately met by the Revenue Receipts (Tax &
Non Tax) and Capital Receipts (Loans recovery and disinvestments) put together resulting in
an increase in Centre’s borrowing at high costs and consequent steep rise on interest
payments reflected in the mounting non-plan expenditure. This effectively reduced the share
of plan expenditure affecting public investment and capital formation. An important
consequence of these has been the declining proportions of devolution and transfer of
resources to the states.
CHAPTER- II FINANCES OF THE STATES (Pgs 17-27) • A perspective view of the State’s Finances reveal enormous increase in transactions on
both the Revenue and Capital Accounts .
(a) The total receipts on Revenue Account increased from Rs. 296.4 crores in 1951-52 to
Rs. 64842 crores in 1990-91, and Rs. 214810 crores in 1999-2000 .Revenue expenditure
increased from Rs. 392.6 crores in 1951-52 to Rs. 70993 crores in 1990-91 and Rs.271611 in
19990-2000.
(b) The Capital Receipts increased from 164.64 crores in 1951-52 to Rs. 21868 crores in
1990-91 and Rs. 101612 crores in 1999-2000 and capital expenditure during the same period
increased from Rs. 189.47 crores in 1951-52 to Rs. 18025 crores.in 19990-91 and Rs.54023
crores in 1999-2000.
• State Budgets recorded more revenue surpluses than deficits during the first six five year
plans and deficits if any during this period was relatively small, but from the mid eighties

ES-4
onwards, the revenue deficits became regular feature of the State Budgets increasing from
Rs. 4582.4 crores in 1989-90to Rs. 56801 crores 1999-2000.
• Capital Account depicted fluctuations between small surpluses and deficits uptill the
fourth plan period but from the mid-eighties, the capital account started recording increasing
surpluses.
• This trend of revenue deficits and capital surpluses continued in the nineties. The
Revenue deficit increased from Rs. 5651 crores in 1991-92 to Rs. 56, 801 by 1999-00(RE).
and capital surplus increased from Rs. 5495 crores in 1991-92 to Rs. 47589 crores in 1999-
00(RE). With the revenue deficit increasing as a much faster pace than capital surpluses,
overall deficit also increased.
• During the nineties, Gross Fiscal Deficit increased from 3.30 percent of GDP in 1990-91
to 4.13 percent of GDP in 2000-01 (BE). The primary deficit decreased first, from 1.78
percent in 90-91 to 0.93 in 97-98 and then increased to 2.52 percent of GDP in 1999-00(RE)
and on the other hand, Revenue Deficit increased steadily from 0.93 percent of GDP in 1990-
91 to 2.91 percent of GDP in 1999-00(RE)
• The Tenth Finance Commission also noted that an increasing part of Capital Receipts
was used for financing revenue deficits leading to growth of public debt and interest burdens
. With further expansion of Revenue expenditure and spiraling deficits, the GFD of the States
increased from Rs. 3713 crores in 1980-81 to Rs. 18787 crores. In 1990-91 and to Rs. 56802
crores in 1999-2000 (RE)
• While the emerging picture of state finances as seen from the main fiscal indicators
,showed weaknesses in the late eighties , culminating in signs of stress in the nineties but as
pointed in the RBI study the key deficit indicators, like revenue deficit, GFD etc. while
serving as useful information variables do not depict a vital aspect of the States resource gap
in the context of inter institutional transactions and constitutional restraints on the borrowing
powers of the State contributing to the ‘artificial’ stagnancy of GFD.
• In the financing of GFD of the states , loans from the Centre, market loans and small
savings and other (including PR fund etc) increased significantly from the eighties to the
nineties . Loans from the centre increased from Rs. 1567 crores in 1980-81 to Rs. 9978
crores in 1990-91 and to Rs. 39879 crores in 1999-2000 (RE) Market Borrowing (net)
increased from Rs. 198 crores in 1980-81 to Rs. 2556 crores in 1990-91 and to Rs. 11829
crores in 1999-2000 (RE).Small savings and others increased from Rs. 1948 crores in 1980-
81 to Rs. 6253 crores in 1990-91 and further to Rs. 43031 crores in 1999-2000 (RE).
Consequently, the total out standing liabilities of the States increased from Rs. 23959 crores
in 1980-81 to Rs. 110289 crores in 1990-91 and further to Rs. 41852 crores in 1999-2000
ES-5
(RE) and Gross interest payments increased from Rs. 1225 crores in 1980-81 to Rs. 8655
crores in 1990-91 and further to Rs. 45526 crores in 1999-2000 (RE)
Expenditure on Administrative Services increased from Rs. 1562 in 1980-81 o Rs. 7018 in
1990-91 and further to Rs. 24424 crores in 1999-2000 (RE) and pensions increased from Rs.
375 crores in 1980-81 to Rs. 3593 crores in 1990-91 and further Rs. 24750 crores in 1999-
2000 (RE). The constricting nature of non-plan expenditure, reduced the availability of
resources for investment and also maintenance expenditure leading to a structural weakness
in the state finances. Eight state governments show a persistent and growing revenue deficit.
Bihar (Since 89-90), Kerala (Since 83-84) , Maharashtra (Since 88-89), Orissa (Since 84-
85) , Punjab and Tamil Nadu (Since 87-88) , West Bengal (Since 86-87) , Uttar Pradesh
(Since 88-89)
• Tenth Finance Commission reported that
(a) All the States had almost identical ‘turning points’ on their financial deterioration
(b) This was indicative of ‘Systemic’ factors, rather than ‘State Specific’ factors.
• Other analysts have pointed out that the financial and institutional weaknesses at the State
level emerged as major constraints on the provision of social and infrastructural services,
and that the impact of structural adjustment policies in the nineties, affected expenditure
patterns in various sectors with consequences for different economic and social groups to the
detriment of basic objectives of Indian Planning like growth with social justice and equity .
There has been a deceleration in social sector expenditure in thirteen major states, including
those with low levels of Human Development since the mid 1990’s. The social costs of
transition are felt mainly by the marginalised sections of society, with decreasing plan
expenditure on social services.
• Overview of finances at the centre and the states indicate fiscal deterioration marked by
fiscal deficits of various kinds, with the state finances also deteriorating in the nineties on
account of systemic factors and that the economic reforms and the structural adjustment
policies led to compression of public investment at the Centre and lower social sector
expenditure in the states.
• Detailed analysis of demographic indicators , State Domestic Product ,development and
non development expenditure , Plan expenditure, credit availability , indicate that the on
going reforms since 1991 with stabilisation and deregulation policies as the prime
instruments , marked by retreat of the state and increasing role for the private sector have
affected the growth pattern and rates of states and have aggravated interest rates disparities.
ES-6
CHAPTER- III CONSTITUTIONAL AND POLICY FRAMEWORK (Pgs. 28-64) For a better understanding of fiscal imbalance and budgetary dilemmas one need to
take into account the structural aspects of (a) Fiscal Federalism (b) Democratic
Planning and (c)Mixed Economy
Fiscal Federalism
• A review of the evolution and structural features of the federal economy of India in the
pre independence and post independence era , highlighting the roles of the Finance
Commissions providing statutory devolution of taxes and Grants-in-Aid from Centre to the
states and the Planning Commission providing discretionary plan Assistance for
developmental schemes indicate that the criteria for transfer of resources from Centre to the
States have lacked an element of continuity leading to dissatisfaction among the states.
• The Ten Finance Commissions – from the first FC for the period 1952-57 to the Tenth
FC for the period 1995-2000 have adopted different criteria for determination of the shares in
the states in the divisible taxes as also in the criteria for distribution of state’s share among
different states.
• Though the Tenth Finance Commission recommended that 29 % of the total tax revenue
should be transferred to the states and the inter-state-council had in 1990-97 reached a
consensus on this , the required amendment of the constitution could not be carried out .
• The Eleventh Finance Commission recommended that 28 % of the net proceeds of all
shareable taxes should be transferred to the states.With the passing of the 80th Constitution
Amendment Bill in 2000 , the states have become entitled to 28 % of the shareable taxes .
• However the criteria adopted by the Eleventh Finance Commission for the distribution of
the states share among individual states has led to a sense of grievance among the states in
the Southern , Western and Northern region.
• The discretionary assistance provided by the Centre to the states on the basis of
recommendations of the Planning Commission have also been marked by changes in the
criteria , brought about in 1969 . 1990 and 1991 .
• The emergence of the National Development Council in which the Chief Ministers of the
state are members , provided a forum for discussions before changes in criteria for plan
assistance were made, thus enabling a measure of continuity in the patterns of assistance.
• However the Planning Commissions insistence on additional resource mobilisation by the
states to match their ambitious expenditure programmes ha s some times led to unhappiness
among the states.
ES-7
• The Planning Commission has for its part found itself wedged between the State
Governments with a demand and the Union Finance Ministry with its own problems for
mobiliastion of resources for meeting the increasing expenditure of the Central Government .
• Analysis of the quantum and relative shares of Tax devolution, statutory transfers , Plan
and other discretionary transfers , show that
(a) the total quantum of resources transferred to the states as a percentage of resources raised
by the Centre has come down in gross terms from 38.3 % in 1980-81 to 33.8 % in 1997-98
and in net terms from 31.3 % to 25.2 % during the same period.
(b) The transfer of resources as a proportion of aggregate expenditure of the state have also
been gradually falling in Gross terms , from 50.2 % in 1980-81 to 38.9 % in 1997-98 and in
net terms from 40.9 % to 27.6 % during the same period,
(c) Analysed in terms of proportion to the GDP , transfer of resources from Centre to the
state came down from 7.2 % in 1980-81 to 6.7 % in 1997-98 , and in net terms from 5.8 % to
5 % during the same period. This had serious implications for management of Public
Expenditure by the state governments.
• Economic Reforms: While the impetus for the Economic Reforms ,came in the eighties
from perceptions that a regulated economy was responsible for low growth rate , leading to
liberalisation and deregulation in the domestic sphere , the major policy initiatives in fiscal
reform industrial policy , trade regulations and monetary and credit policies in the nineties came as a response to the Balance of Payment Crisis faced by the country and the
Globalisation movement all over the world.
• The philosophical base for the Economic Reform of the early 90’s was provided by a
review of the role of the State and market forces in the economy which led to a wide range
of administrative changes and new institutional mechanisms in the areas if industrial
licensing , prices and distribution controls , capital market and foreign investment regulations
, foreign exchange management and major Budgetary Reforms, with impact on public
sector investment and transfer of resources to the states.
• With the emergence of fiscal problems by way of revenue and fiscal defic its , budgetary
reform moved in the direction of reductions in Government Expenditures , Defence
Expenditures ,subsidies and man power requirements as also increase in administered prices
like those for power fertilisers and food grains .
• Analysts of Economic Reforms have drawn attention to the adverse impact of reform
measures on plan expenditure and on the social sector spending . Plan expenditure as a
percentage of aggregate expenditure had come down from 29.9 % in 1992-93 to 25.7 % in
2000-2001 with budget support for Central Plan , as a share of total expenditure from 16.1 %
ES-8
to 14.4 % and central assistance to the state plan coming down from 12.8 % to 10.9 %
during the same period. This was also accompanied by increase in non plan expenditure on
interest payments defence expenditure and General Services and reduction in expenditure on
subsidies for food fertilisers and other items .
• The net resource transfers from Centre to the states came down , as a percentage of GDP
from 5.7 % in 1990-91 to 4.7 % in 2000-2001 and Total assistance to state and UT plans
from 2.4 % to 1.7 % during the same period. While the Approach paper to the Ninth Plan
pointed out a decline in the share of the states in the total plan outlay , the Mid Term
appraisal of the Nin th Five Year Plan (Oct 2000) indicated a lower annual growth of 6.2 %
against target of 6.4 % in the first three years of the Plan and unlikelihood of investment
targets being reached in the last two years of the Plan.
• Review of the actual pattern of Budgetary provisions and public expenditure during the
nineties indicate that (a)the envisaged careful balancing of the rolls of the State and the
Market did not materialise and permeate the planning process of the Centre and the State (b)
the Budgetary constraints and fiscal deficit reduction objectives had led to compression of
public investment and Government expenditure leading to a slowing down of the process of
Economic Growth.
• Some analysts have even argued that the root cause of industrial recession experienced
during the entire Ninth Plan Period had some thing to do with the unrealised expectations of
annual plan outlays. While the liberalisation of procedures and decontrol in the industrial
sector , was expected to stimulate industrial investment , the removal of import restrictions
and reduction in customs duties created an air of uncertainty regarding domestic demand due
to flow of foreign goods.
• The reduction of subsidies for agricultural inputs like fertilisers and uncertain seasonal
conditions affected agricultural production . The impact of varying growth rates in different
sectors of the economy could not be properly met by Public Expenditure programmes which
were guided mainly by fiscal consolidation objective aiming at reduction in revenue and
fiscal deficit both at the centre and the states , apart from a series of reforms constricting the
supports provided by the reserve bank of India to the state governments .
CHAPTER-IV GROWTH PERFORMANCE OF THE STATES (Pgs 65-82)
• Review of policies and programmes on Public expenditure have to take into account the
structural transformation of the Indian Economy , with variations in sectoral growth rates in
different states and the levels of development reached by each state after nearly five decades
of planning and popular aspirations and potential for growth. Assessment of growth should
ES-9
keep in view the changes effected in data base and methodology in aggregation in the
National Accounting Systems .
• The sectoral composition of National GDP shows that the share of agriculture and allied
activities has come down from 34.5 % in 1980-81 to 24 % in 2000-2001 while Share of
Industries came down marginally from 23.2 % to 21.9 % and the Share of Services increased
sharply from 42.3 % to 54.1 % .
• Within the broad pattern of structural transformation of the economy there have been
over the years persisting problems of inter state and regional disparities, and serious attempts
by Planning Commission and the Governments to reduce the disparities have had only
marginal impact.
• Detailed examination using various indicators and component analysis by S.N.V Siva
Kumar and V.V.N.Somayajulu (Asian Economic Review ). L.M.Bhole and Abdul Shaban (
Journal of Rural Development ) Dr. N.J. Kurien (Economic and Political weekly) C.P.
Chandra Sekhar and Jayathi Ghosh (The Hindu Businessline) P.R.Brahmananda ( Hindu
Businessline ) T.C. Ananth , K.L. Krishna , Uma Dutta Roy Choudhary ( Tenth Finance
Commission) B.G.Jandhayala Tilak (IASSA quarterly ) A.K.Sivakumar (EP W) S.P.Paul
and D.K.Pant (Margin) show that pace and patterns of development vary from state to state
and inter- state disparities continue to be high . Sectoral analysis show that individual states
secure different ranks , depending on the parameter chosen for classification and ranking and
thereby indicating that the priorities for Public Expenditure Management need to be guided
by local resource endowment , development needs and popular aspirations. (See tables 4.4 to
4.10 )
• However Public Expenditure Programmes , formulated in the context of Economic
Reforms with emphasis on fiscal consolidation have been marked by decline in budgetary
outlay for social services in several states , and the implementation of structural adjustment
policy has not also contributed to the build up of social and technical infrastructure necessary
for stepping up the pace of Economic Growth.
• Analysis of the growth of different sectors in the nineties and their implications there of,
for the macro economic indicators like fiscal deficit tax revenue, external debt, interest
payments etc should take note of the change in computation of GDP.The introduction of the
new series by CSO in 1993-94, included new activities under different sectors, as it will
affect the estimates of various macro economic indicators as a proportion of GDP.
• Growth rate of GDP as also the three sectors varied from year to year , with high rates
between 1993-94 to 1996-97 and falling thereafter. The growth rate of services was higher
than the other sectors and its contribution to GDP increased from year to year .
ES-10
• In view of the structural transformation of the economy, and the need for refining and
speeding up policy responses to sectoral problems, conventional examination of the sectoral
growth rates need to be supplemented by analyses of the seasonal factor published by RBI.
• Making mid term assessment of economic trends, around October-November each year
will facilitate timely decisions on needed corrective action,both for resource mobilisation and
expenditure management.
• For effective and efficient management of finances, the present time lag between their
assessment of field conditions, their reaching the centre and the policy response and the
decision making and their application at the field level needs to be reduced.
• While comparing the growth rates of different states, only a broad view of the
performances can be taken as states use different methodologies for computing their growth
rates.
• Classification of states have been made in different manners depending on the purposes.
For Plan Assistance they have been grouped into special category states and other states,
and analysts have further grouped them into (a) major states and smaller states (b)high
income, middle income and low income states (c)high budgetary deficit, low budgetary
deficit and budgetary surplus states.
• The focus, since the beginning of planning has been on reducing regional imbalances and
inter state disparities with criteria for public investment giving more weightage for backward
regions. The recent emphasis on efficiency and financial performance has shifted focus from
the earlier objectives of balanced regional development.
• An important aspect that needs special attention, from the point of view of public
expenditure management, is the extent to which the plan and programme implementation
have achieved their target of reducing the inter-state and intra state differentials in
development.
• Approach Paper to the Ninth Five Year Plan reviewed that the inter regional disparities in
terms of percapita income and indicated that grow rates of states varied and that some of the
most populous states were still less developed having growth rates lower than the national
average.
• The 1997 Committee appointed by Planning Commission headed by Dr. E.A.S. Sharma
used 3 basic indicators like (a) deprivation (b) social infrastructure, (c) economic
infrastructure to develop and aggregate measure of backwardness and identified 100 districts
spread in 38 in Bihar, 19 in M.P, 17 in U.P, 10 in Maharashtra, 4 in Orissa, 4 in West
Bengal, 2 in Rajasthan and l each in Haryana, H.P. and Dadra Nagar Havali.
ES-11
• The National Institute of Rural Development, worked out, in 1999 indices of
backwardness, social and infrastructure for all states and pointed out that, the states of U.P.,
Rajasthan, M.P., Bihar, Orissa and Maghalaya showed backwardness in all respects and that
social development and Gender development indices have a higher level of inter state and
intra state variations.
• Several analys is have confirmed the high level disparity among the States and most
studies place Southern and Western States among the developed states, and the Northern and
Eastern States like Bihar, Orissa included among the less developed States.
• While studies have examined the impact of structural changes resulting from the reforms
of the nineties on the growth performance of the States in terms if sectoral performance , it is
difficult to establish, on the basis of available data, that there is a causal relationship between
the share of primary sector and the rate of growth of the State economy.
• Studies by C.P. Chandrasekhar and Jayanti Ghosh and Prof P.R. Brahmananda, Dr.
Brahmananda show Maharashtra , Gujarat and Tamilnadu and Karnataka among the top
performers, Kerala, West Bengal, Haryana, Punjab and Andhra Pradesh among the middle performers and Bihar, Orissa, M.P., Assam, Rajasthan and Uttar Pradesh among the poor
performers.
• NCAER, in collaboration with Planning Commission and UNDP have attempted to
develop the required database for constructing these Human Development profiles for
different regions of the country.
• Computation of HDI for the major states by B.G. Jandhyala Tilak (1991), A.K. Shiva
Kumar (1991) and S.P.Pal and D.K.Panth (1993), place the four states of Punjab, Kerala,
Haryana and Maharashtra among the top four, although, the ranks of other states are different
in each study .
• The World Bank study entitled “Reducing poverty in India: options for more effective
public services”. ranks the s tates based on head count index, life expectancy, infant mortality
and literacy rates to indicate the ‘well being of the states places Punjab at the top and Bihar at
the bottom.
• Dr. N.J.Kurien, analysing data for 489 districts of 15 major states, places Punjab,
Haryana, Gujrat, Maharashtra, Andhra Pradesh, Karnataka, Tamil Nadu and Kerala (total 190
districts) in the forward group with high socio - demographic development. The remaining
seven states , Assam , West Bengal , Bihar , Orissa Madhya Pradesh , Uttar Pradesh and
Rajasthan (total of 299 districts) are placed in the backward group with low socio -
demographic development. This classification, however, is highly weighted in favour of a
ES-12
large number of demographic and gender indicators, indicative mainly of social
backwardness.
• M.Ravallion and K.Subba Rao (1992), Sanjay Baru (1993), S.P.Gupta (1995) have
looked into the implications of structural adjustment policies on fiscal compression and
social sector spending, while others like V.B.Tulsidhar (1993) and Seetha Prabhu and other
(1993) have drawn attention to the sectoral implications of the decline in budgetary outlays
for social services in several states
• All these studies emphasise the need for active interventions by the Government in the
fiscal sphere for ensuring adequate financing for achieving Human development/Social
development in the States.
CHAPTER – V BUDGETARY TRENDS IN THE STATE (Pgs. 83-112)
• Analysis of developments of the past decades need to take into account the differing
perspectives and time frames of the Planning Commission , the Reserve Bank of India and
the Union Ministry of Finance. Examination of budgetary trends from (a) the ‘long term’
perspectives of the Planning Commission, (b)the ‘medium term’ views of RBI on the trends
in the economy, and (c)the Ministry of Finance, with a shorter budgetary time frame.show
that the main problem in Public Expenditure Management has been one of matching limited
resources and capacity for mobilisation with ambitious development plans.
• The RBI , which has been the Nation’s Banker, monitoring developments in the field of
currency and finance, has been pointing out that , the overall budgetary position of the States
had been markedly deteriorating due to their declining receipts and increasing expenditure
and that the position had worsened with committed non-plan expenditures being financed by
cut backs in development expenditure. RBI diagnosed the problems of State finances in the
nineties as a structural weakness, as the capital receipts were diverted to finance revenue
deficits, instead of revenue surpluses financing capital investments.
• The Finance Ministry, which frames the Central Budget, for the short time frame of a
financial year has pointed out, the significant differences between budget estimates and the
revised estimates in the state budgets and the need for fiscal consolidation and expenditure
reform.
• It can be seen that all the key actors in the federal financial structure were in the know
regarding the deteriorating finances of union and the states and were advocating corrective
measures from time to time . But the reforms adopted on ad hoc basis, however failed to
arrest the deterioration resulting ultimately in the launch of the full scale economic reforms
of the nineties.
ES-13
• Appraisals of the Development Plans , such as the Mid Term Appraisal of the Third Plan
(Nov 1963) and Mid Term Appraisal of the Ninth Plan (Oct 2000) show that states have not
been able to fulfill the targets for additional resource mobilisation and the excess of
expenditure over the revenue receipts has led to dependence on increased borrowings by
states to finance their plans.
• Analysis of transactions on revenue and capital accounts , show the emergence of a large
revenue deficits during the last two decades , with the revenue surplus of Rs. 1486 crores
(0.13 % of the GDP )in 1980-81 converted into a deficit of Rs. 5309 crores (0.93 % of
GDP) in 1990-91 and further to Rs. 56801 crores (2.91 % of GDP) by 1999-2000.
• There is a shifting pattern of receipts and disbursement and emergence of fiscal
imbalance in the nineties marked by increase in gross fiscal deficit, changing pattern of
financing gross fiscal deficit , dwindling devolution and transfer to resources from Centre to
the states and rising debt and interest payments .
• The budgetary performance of state governments have been greatly influenced by the
fiscal federal character of the Constitution, with the transfers recommended by the Finance
Commission , and the development perspective and plan assistance provided by the Planning
Commission at the National level.
• Review of the Gross transfers from the Centre to the States in the nineties, as a proportion
of aggregate expenditure of the States show a declining trend from 44.8 % in 1990-91 to 39.8
% in 2000-2001. The statutory transfers under the ageis of Finance Commissions, also
showed significant changes .
• While aggregate receipts of all the states increased from Rs. 21872 crores in 1980-81 to
Rs 91313 crores in 1990-91 and further to Rs. 316421 crores in 2000-2001 , The aggregate
disbursements were Rs.22770 crores , Rs.91242 crores , Rs.325634 crores in the respective
years.
• Detailed analysis of transaction on the revenue and capital accounts show a trend of
increasing revenue deficit at the aggregate level as also in the individual states.
Revenue Receipts
• The total Revenue Receipts of the States in the nineties increased from Rs. 66467 crores
in 1990-91, to Rs. 244920 crores in 2000-01. But as a proportion of GDP, it showed an
increasing trend in the first four years of the 90’s decade (from 11.7 percent in 1990-91 to
12.30 percent in 1993-94), thereafter decreasing to below the 90-91 level (from 12.10 percent
in 1994-95 to 11.20 percent in 2000-01)
ES-14
• The own tax revenue of the states increased from Rs. 30344 crores in 1990-91 to Rs.
125563 crores in 2000-01, and as a proportion to GDP from 5.3 percent to 5.8 percent during
the same period .Total tax revenue showed a fluctuating trend in the 90’s, hovering in and
around 8 percent of GDP.
• Total non tax revenue increased from Rs. 21881 crores in 1990-91 to Rs. 68551 crores in
2000-01 (BE), and as a proportion of GDP, uptill the mid nineties, from 3.9 percent in 1990-
91 to 4.3 percent in 1993-94, but decreased in the subsequent years from 4.1 percent in 1994-
95 and 3.1 percent in 2000-01 (BE).
• Own Non Tax Revenue of the States showed a fluctuating trend varying between 1.5
percent of GDP to 2.1 percent, recording the highest (2.1 percent) in the year 1994-95 and
lowest (1.5 percent) in 2000-01 (BE)
• Grants from the Centre increased from Rs. 12643.3 crores in 1990-91 to Rs. 36963.5
crores in 2000-01, although as a proportion of State’s aggregate expenditure it increased from
13.9 percent in 90-91 to 15.7 percent in 1993-94 before decreasing to 10.5 percent in 2000-
01.
• Share in Central taxes, taken for the whole decade, covered lesser proportion of states
aggregate expenditure, although it increased in absolute value and some of the intervening
years recorded an increase of one or two percentile points. The states share in central taxes
increased in absolute terms from Rs. 14241 crores in 1990-91 to Rs. 50805 crores in 2000-01
(BE) but decreased as a proportion of aggregate state expenditure, during the same period,
from 15.6 percent to 14.5 percent
• In the five year periods 1980-81 to 1984-85, 1985-86 to 1989-90 and 1990-91 to 1994-95
, Development Expenditure, grew at an annual average of 16.1, 13.7 and 14.5 percents, and
Non Development Expenditure for the State grew at an ave rage annual rate of 19.2 percent,
18.2 percent and 20.9 percent respectively .
Revenue Account Transaction
• The entire decade of nineties, showed an increasing trend of revenue deficits. It
increased, for all states from Rs. 5309 crores in 1990-91 to Rs. 45702 crores in 2000-01
(BE).The State wise data show that, except for Rajasthan and special category states, all the
major states revenue growth was inadequate to meet their expenditures in the nineties but by
the year 2000-01, even special category states started reporting revenue deficit with the few
exceptions of Arunachal Pradesh, Nagaland, Sikkim and NCT Delhi.
• Analysing the data to ascertain the fiscal marksmanship of various states in its states
budget studies, RBI notes that the not only the gap between the actuals and budget estimates
ES-15
is large, even the revised estimates show large differences from the actuals and attributes this
to the non-materialisation of Additional Resource Mobilisation Targets, and the heavy
dependence and overestimation of the states on transfers from the Centre .
ARM
• The Additional Revenue Mobilisation (ARM) of the States increased from Rs. 772.16
crores in 1991 to Rs. 1383.8 crores in 1994-95 with lower yields.of Rs. 948.9 crores in 1995-
96 , Rs. 684.4 crores in 1996-97 and Rs. 1012 crores in 1997-98 but recorded a sharp
increase to Rs. 2969.6 crores and Rs. 5599 crores in 1998-99 and 1999-00 respectively.
• The States of Gujarat, Maharashtra, Kerala and West Bengal have pursued ARMs every
year in the nineties but Karnataka, M.P., Punjab, Tamil Nadu, Rajasthan have also attempted
ARMs, but in some years .
• Fourteen states proposed ARM to tune of Rs. 2677 crores in 2000-01, of these, the states
proposing higher ARMs, relative to their own resources were also the States which have
entered into MOU agreement with the Centre and availed assistance under the fiscal reform
programme.
• The ARM proposals in general, tends to place higher reliance on tax sources for raising
revenues. Bihar was the only state which showed considerable non tax revenue of Rs. 257.8
crores (2000-01) under ARM.
Transfers
• The Tenth Finance Commission did not envisage any revenue deficit grants for the States
in the year 1999-2000 in the expectation that better revenue mobilisation effort and
expenditur e management will wipe out the deficit. But as the Eleventh Finance Commission
pointed out that this did not materalise and contrarily, the state finances deteriorated further.
• The question is whether the awards of the earlier Finance Commissions’ based on the gap
filling approach led to fiscal prodigalism of the States, and whether this can be fully
corrected by MOU’s and the newly created Incentive Fund for performance of monitorable
fiscal reform programme.
Expenditure
• The most important contribution to fiscal imbalance in the State have been on the
expenditure side. The total revenue expenditure in 1990-91, of Rs. 70993 crores. equals the
entire revenue account expenditure from the first to the fifth plan periods.
• Total Expenditure in 1990-91 increased from Rs. 91,242 crores to Rs. 3,25,633 crores
in 1999-2000 , as a share of total expenditure , Revenue Expenditure increased from 78.66
ES-16
% to 83.41 % while capital expenditure decreased from 21.34 % to 16.59 % during the same
period
Development Vs Non Development Expenditure
• Development Expenditure, as a proportion of total expenditure decreased from 69.5 % in
1990-91 to 60.9 % in 1999-2000 while non-development expenditure increased from 24.8 %
to 33.8 % during the same period.
• The Development Expenditure in absolute terms is higher than the non development
component, development expenditure grew at 14.9 % in the eighties and 13.7 % in the
nineties and non-development expenditure grew at 18.7 %., and 19.1 % during the same
period.
Components of Development Expenditure
• The States’ share in the Total Development Expenditure is higher than that of the Centre.
In 1990-91, it exceeded that of the centre by less than 10 %, while in 2000-01 it exceeded by
about 55 %. The Centre’s share in total expenditure on social services, was 13 % in 1980-81,
9.85 % 1990-91 and 13.5 % in 2000-01 while the state’s share has consistently been above
85 percent.
• Expenditure on social services in 1990-91 increased from 46.1 % to 54.3 % in 1990-
2000, and on economic services went down from 45.1 % to 35.7 % in the same period.
• Direct development expenditure on power projects showed an increase from Rs. 3585
crores in 1990-91 to Rs. 5951 crores in 1999-00, during the same period in irrigation sector it
increased from Rs. 7113 crores to Rs. 19871 crores ,in the energy sector from Rs. 1994
crores to Rs. 6914 crores.,Water supply and sanitation expenditure increased from Rs. 1993
crores to Rs, 7782 crores ,urban development rose from Rs. 664 crores to Rs. 4033 crores and
welfare of scheduled castes, scheduled tribes and other backward classes increased from Rs.
1909 crores to Rs. 6900 crores. The Revenue Expenditure on Science and Technology was
only 131 crores in 1999-00, despite the emphasis on modernisation of society in the
nineties.
• However, these increases with in the category of development expenditure, do not appear
to be adequate to meet the growing obligations of the State for promoting equitable
development of the States. A point to be noted here is that formation of corporate financing
and development bodies, to cover the specific target groups like scheduled castes, scheduled
tribes and the minorities appeared to absorb more resources on administrative expenses and
there by reduced the availability of funds for development schemes.
ES-17
Components of Non Development Expenditure
• Non Development Expenditure of the States increased from Rs. 22600 crores in 1990-91
to 123533 crores in 2000-01 (BE) of this , Organs of States increased from Rs. 685 crores to
Rs. 2976 crores, fiscal services from Rs. 1616 crores to Rs. 8179 crores interest payment and
debt servicing from Rs. 9226 crores to Rs. 55745 crores, Administrative Services from Rs.
8655 crores to Rs. 29219 crores and pension from Rs. 3593 crores to Rs. 27415 crores during
the same period.
• The distribution of Government employees in the various Government sectors. Shows
Central Govt. employees increased from 33.47 lakhs in 1976 to 33.66 lakhs in 1996, State
Government employees increased from 48.97 lakhs to 74.14 lakhs, Quasi Government
employees increased from 33.92 lakhs to 64.58 lakhs and that of local bodies increased from
19.85 lakhs to 21.92 lakhs in the same period.
• From 1976 to 1996 , there has been an addition of 25.88 lakh employees by the State
Governments, , 24.43 lakhs employees by Quasi Government organisations 3.17 lakhs by the
Centre and 2.59 lakhs by local bodies.
• This picture is disconcerting to say the least, as much of the services impinging on quality
of life in urban and rural areas is the responsibility of the local bodies which has shown only
a marginal increase in the employment, This, policy seems to contradict the basic precincts of
fiscal reforms advocating downsizing and reduction in expenditure on wages and salary bills.
Also, it results in progressive reduction in resources available for developmental activities.
• Proper employment policy in various sectors and Government Departments with attention
to the public functions of the department and the population to be serviced rather than
common VRS policy, needs to be pursued vigorously.
Plan - Non Plan Expenditure
• State Plan Expenditure while increasing in absolute numbers (from Rs. 27432.9 crores to
89073.5 crores) decreased as a proportion of GDP (from 4.8 percent to 4.1 percent) and also,
as a proportion of total expenditure (from 30.10 percent to 25.40 percent) during 1990-91 to
2000-01.
• State Non Plan Expenditure on the other hand increased in absolute terms (from Rs.
63809.1 crores to Rs. 261693.3 crores), as a proportion of GDP (from 11.2 percent to 12
percent) and also as proportion of total expenditure (from 69.9 percent to 74.6 percent) in the
same period.
• One important factor of note in this context is that, the Plan, Non Plan Expenditure
classification is ambiguous. Vital items of expenditure like those involved in maintenance of
expenditure of projects, continuing research projects, operating expenses of power stations,
ES-18
maintenance of law and order are classified as Non Plan and have all non plan expenditure is
not ‘bad’.
Expenditure –Debt
• Total debt of states increased from Rs. 52281 crores (1986) to Rs. 108203 crores (1991)
and further to Rs. 498841 crores in 2001 . The total debt increased by Rs. 80257 crores
(2000-01) in one year period. The debt stock, as a percentage of GDP rose from 19 % in
1991 to 22.9 % by March 2001.
• In the eighties, loans from the Centre met 51.9 percent of the overall borrowing
requirements of the States, but these could meet only 48.5 percent of the needs in the
nineties.Of the total outstanding debt of Rs. 4,98,841 crores in March 2001, loans and
advances, from the Central Governments accounted for Rs. 2,85,825 crores, 57.3 % of the
total outstanding debt. Market borrowings covered the State fiscal deficit, to an extent of
16.4 % in the nineties, and only 11 % in the eighties
• An important rider, which added to the expenditure is the deregulation of the interest rate
in the nineties and the Central Government resorting to market related interest-rates resulting
in rising interests on central loans to the States.
• The interests on central loans increased from an average interest of 5.5 percent on on-lent
loans in 1980-81 to 11.74% in 1996-97. The weighted average of interest rates for loans of
State Governments increased from 11.5 percent in 1990-91 to 12.35 % in 1998-99 . The
States gross interest payments increased from Rs. 10944 crores (as a percentage of revenue
receipts 13.5 %) in 1991–92 to Rs. 54271 crores (22.2 % ) in 2000-01.
• From 1995 onwards , interest rates on plan loans,( the single largest component of
Central loan to States), has been revised to 13.5 percent. The average borrowing cost to the
Centre from the market has increased from 10.43 percent in 1991-92 to 12.05 in 1995-96 and
further to 12.09 percent in 1996-97. The interest rate subsidy from the Centre has thus come
down from 1.57 percent to 0.66 percent and further to 0.35 percent during the same period.
• Looking at the debt picture of individual states, we can observe that as many as 18 States
have a higher rate of debt accumulation relative to the revenue growth. As many as five
special category sates and nine non special category states recorded a higher rate of growth
of debt than all states’ average .
• Gross interest payment as a percentage of revenue receipts, increased from 11.1 % in
1991-92 to 18.9 % in 2000-01 for A.P., 11.9 to 21.4 % for Maharashtra, 10.4 to 15.4 % for
Karnataka, 8.2 to 14.9 % for Tamil Nadu and 16.9 to 18.9 % for Kerala.
ES-19
• The RBI Study of State Finances analysing the dynamics of states debts, points out that
the crisis is closely linked to the fiscal accounts of the Centre due to the increasing debt
repayment and interest burdens (as discussed in the earlier points) as also to the dependence
on federal flows by the states. The impact on growth has been in two ways basically; (a)
restricting resource availability for investment, (b) the necessity of using capital surpluses for
covering non development al expenditures.
• Government guarantees as a proportion to GDP in the case of 17 States has declined
from 6.5 percent in 1992 to 4.7 percent in 1999 . This has implications for the risk
associated with loans from financial institutions. RBI has set up a Technical Committee, in
1999 ,on State Government Finances, , for prescribing limits for ensuring greater selectivity
in providing and transparency in reporting Government Guarantees.
GFD
• In the nineties the size of GFDs of all States has increased and their decomposition and
financing has implications for Expenditure Management .
• Revenue deficit, began to rise from Rs. 5309 crores in 1990-91 to Rs.8200.5 crores in
1995-96, increasing steeply to 16,113 crores in 1996-97 and further to Rs. 56801 crores in
1999-2000. This has been attributed to the salary and wage pressures from State Government
employees following the implementation of the Fifth Pay Commission recommendations by
the Central Government.
• The GFD of the States rose from Rs. 3713 crores (2.57 % of GDP) in 1980-81 to Rs.
18787 crores (3.30% of GDP) in 1990-91, further to Rs. 90092 crores (4.86% of GDP) in
1999-00.
• The accountancy tactic of shifting of the classification of small savings to the category of
states borrowings through special securities in 1998-99, brought down the centre’s deficit
while pushing up that of the States, without any material improvement in overall fiscal
health.
• On the financing of Gross Fiscal Deficit, the States resorted on a larger scale than earlier
to market borrowings and tapping small savings, provident funds and loans from financial
institutions, reserve funds and deposits on the nineties. The shares of different sources of
financing GFD kept fluctuating in the nineties, indicating the lack of firm and steady strategy
of fiscal management to cope up with the fiscal crisis.
GFD –Interstate Comparison
• An inter state analysis reveals that, in 2000-01 (BE) U.P. had the largest GFD (Rs. 12358
crores), followed by West Bengal (Rs. 10339 crores), Andhra Pradesh. (Rs. 8460 crores)
and Maharashtra (Rs. 7030 crores).
ES-20
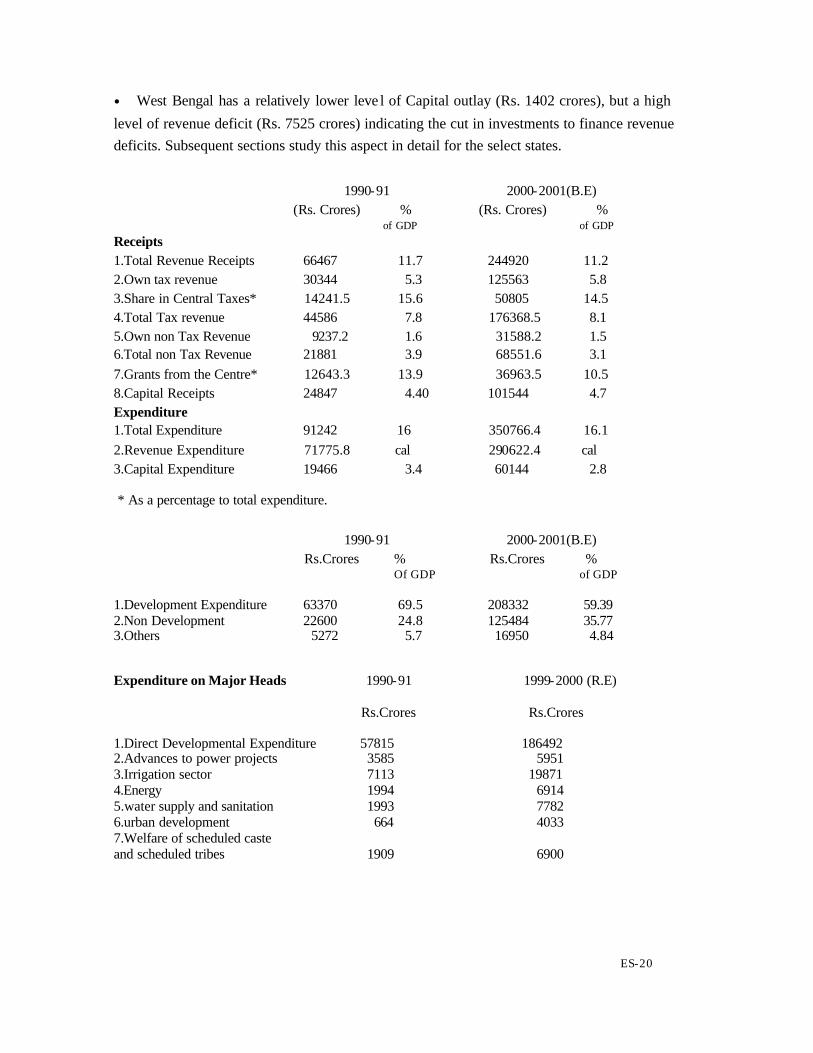
• West Bengal has a relatively lower leve l of Capital outlay (Rs. 1402 crores), but a high
level of revenue deficit (Rs. 7525 crores) indicating the cut in investments to finance revenue
deficits. Subsequent sections study this aspect in detail for the select states.
1990-91 2000-2001(B.E) (Rs. Crores) % (Rs. Crores) % of GDP of GDP
Receipts 1.Total Revenue Receipts 66467 11.7 244920 11.2 2.Own tax revenue 30344 5.3 125563 5.8 3.Share in Central Taxes* 14241.5 15.6 50805 14.5 4.Total Tax revenue 44586 7.8 176368.5 8.1 5.Own non Tax Revenue 9237.2 1.6 31588.2 1.5 6.Total non Tax Revenue 21881 3.9 68551.6 3.1
7.Grants from the Centre* 12643.3 13.9 36963.5 10.5 8.Capital Receipts 24847 4.40 101544 4.7 Expenditure 1.Total Expenditure 91242 16 350766.4 16.1
2.Revenue Expenditure 71775.8 cal 290622.4 cal 3.Capital Expenditure 19466 3.4 60144 2.8
* As a percentage to total expenditure.
1990-91 2000-2001(B.E) Rs.Crores % Rs.Crores % Of GDP of GDP 1.Development Expenditure 63370 69.5 208332 59.39 2.Non Development 22600 24.8 125484 35.77 3.Others 5272 5.7 16950 4.84
Expenditure on Major Heads 1990-91 1999-2000 (R.E) Rs.Crores Rs.Crores 1.Direct Developmental Expenditure 57815 186492 2.Advances to power projects 3585 5951 3.Irrigation sector 7113 19871 4.Energy 1994 6914 5.water supply and sanitation 1993 7782 6.urban development 664 4033 7.Welfare of scheduled caste and scheduled tribes 1909 6900
ES-21
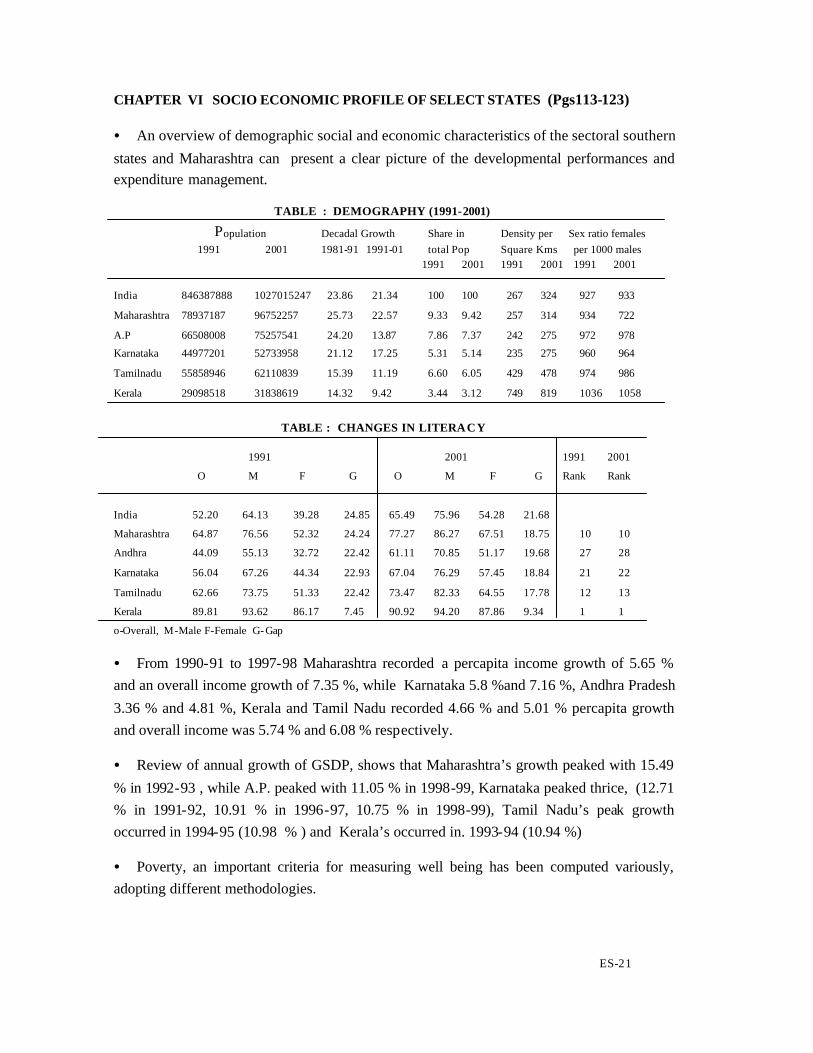
CHAPTER VI SOCIO ECONOMIC PROFILE OF SELECT STATES (Pgs113-123)
• An overview of demographic social and economic characteristics of the sectoral southern
states and Maharashtra can present a clear picture of the developmental performances and
expenditure management.
TABLE : DEMOGRAPHY (1991-2001) Population Decadal Growth Share in Density per Sex ratio females
1991 2001 1981-91 1991-01 total Pop Square Kms per 1000 males 1991 2001 1991 2001 1991 2001
India 846387888 1027015247 23.86 21.34 100 100 267 324 927 933
Maharashtra 78937187 96752257 25.73 22.57 9.33 9.42 257 314 934 722
A.P 66508008 75257541 24.20 13.87 7.86 7.37 242 275 972 978
Karnataka 44977201 52733958 21.12 17.25 5.31 5.14 235 275 960 964
Tamilnadu 55858946 62110839 15.39 11.19 6.60 6.05 429 478 974 986
Kerala 29098518 31838619 14.32 9.42 3.44 3.12 749 819 1036 1058
TABLE : CHANGES IN LITERACY
1991 2001 1991 2001
O M F G O M F G Rank Rank
India 52.20 64.13 39.28 24.85 65.49 75.96 54.28 21.68
Maharashtra 64.87 76.56 52.32 24.24 77.27 86.27 67.51 18.75 10 10
Andhra 44.09 55.13 32.72 22.42 61.11 70.85 51.17 19.68 27 28
Karnataka 56.04 67.26 44.34 22.93 67.04 76.29 57.45 18.84 21 22
Tamilnadu 62.66 73.75 51.33 22.42 73.47 82.33 64.55 17.78 12 13
Kerala 89.81 93.62 86.17 7.45 90.92 94.20 87.86 9.34 1 1
o-Overall, M-Male F-Female G-Gap
• From 1990-91 to 1997-98 Maharashtra recorded a percapita income growth of 5.65 %
and an overall income growth of 7.35 %, while Karnataka 5.8 %and 7.16 %, Andhra Pradesh
3.36 % and 4.81 %, Kerala and Tamil Nadu recorded 4.66 % and 5.01 % percapita growth
and overall income was 5.74 % and 6.08 % respectively.
• Review of annual growth of GSDP, shows that Maharashtra’s growth peaked with 15.49
% in 1992-93 , while A.P. peaked with 11.05 % in 1998-99, Karnataka peaked thrice, (12.71
% in 1991-92, 10.91 % in 1996-97, 10.75 % in 1998-99), Tamil Nadu’s peak growth
occurred in 1994-95 (10.98 % ) and Kerala’s occurred in. 1993-94 (10.94 %)
• Poverty, an important criteria for measuring well being has been computed variously,
adopting different methodologies.
ES-22
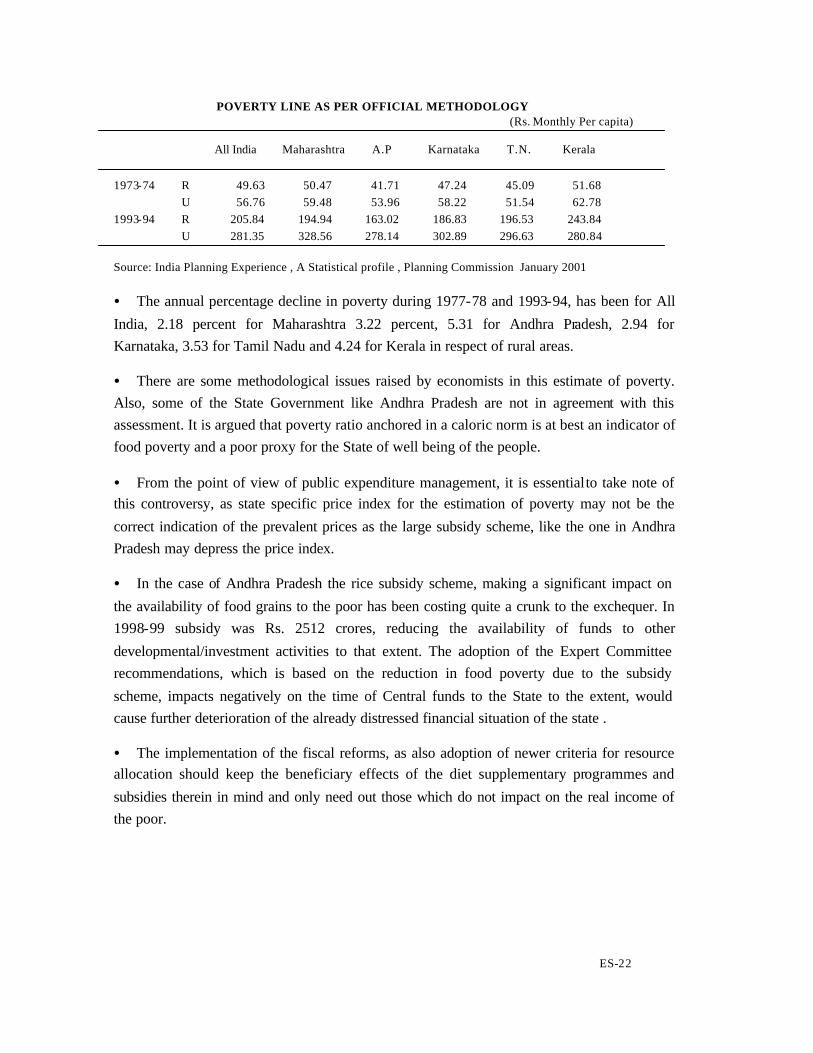
POVERTY LINE AS PER OFFICIAL METHODOLOGY (Rs. Monthly Per capita)
All India Maharashtra A.P Karnataka T.N. Kerala 1973-74 R 49.63 50.47 41.71 47.24 45.09 51.68
U 56.76 59.48 53.96 58.22 51.54 62.78
1993-94 R 205.84 194.94 163.02 186.83 196.53 243.84
U 281.35 328.56 278.14 302.89 296.63 280.84
Source: India Planning Experience , A Statistical profile , Planning Commission January 2001
• The annual percentage decline in poverty during 1977-78 and 1993-94, has been for All
India, 2.18 percent for Maharashtra 3.22 percent, 5.31 for Andhra Pradesh, 2.94 for
Karnataka, 3.53 for Tamil Nadu and 4.24 for Kerala in respect of rural areas.
• There are some methodological issues raised by economists in this estimate of poverty.
Also, some of the State Government like Andhra Pradesh are not in agreement with this
assessment. It is argued that poverty ratio anchored in a caloric norm is at best an indicator of
food poverty and a poor proxy for the State of well being of the people.
• From the point of view of public expenditure management, it is essential to take note of
this controversy, as state specific price index for the estimation of poverty may not be the
correct indication of the prevalent prices as the large subsidy scheme, like the one in Andhra
Pradesh may depress the price index.
• In the case of Andhra Pradesh the rice subsidy scheme, making a significant impact on
the availability of food grains to the poor has been costing quite a crunk to the exchequer. In
1998-99 subsidy was Rs. 2512 crores, reducing the availability of funds to other
developmental/investment activities to that extent. The adoption of the Expert Committee
recommendations, which is based on the reduction in food poverty due to the subsidy
scheme, impacts negatively on the time of Central funds to the State to the extent, would
cause further deterioration of the already distressed financial situation of the state .
• The implementation of the fiscal reforms, as also adoption of newer criteria for resource
allocation should keep the beneficiary effects of the diet supplementary programmes and
subsidies therein in mind and only need out those which do not impact on the real income of
the poor.
ES-23
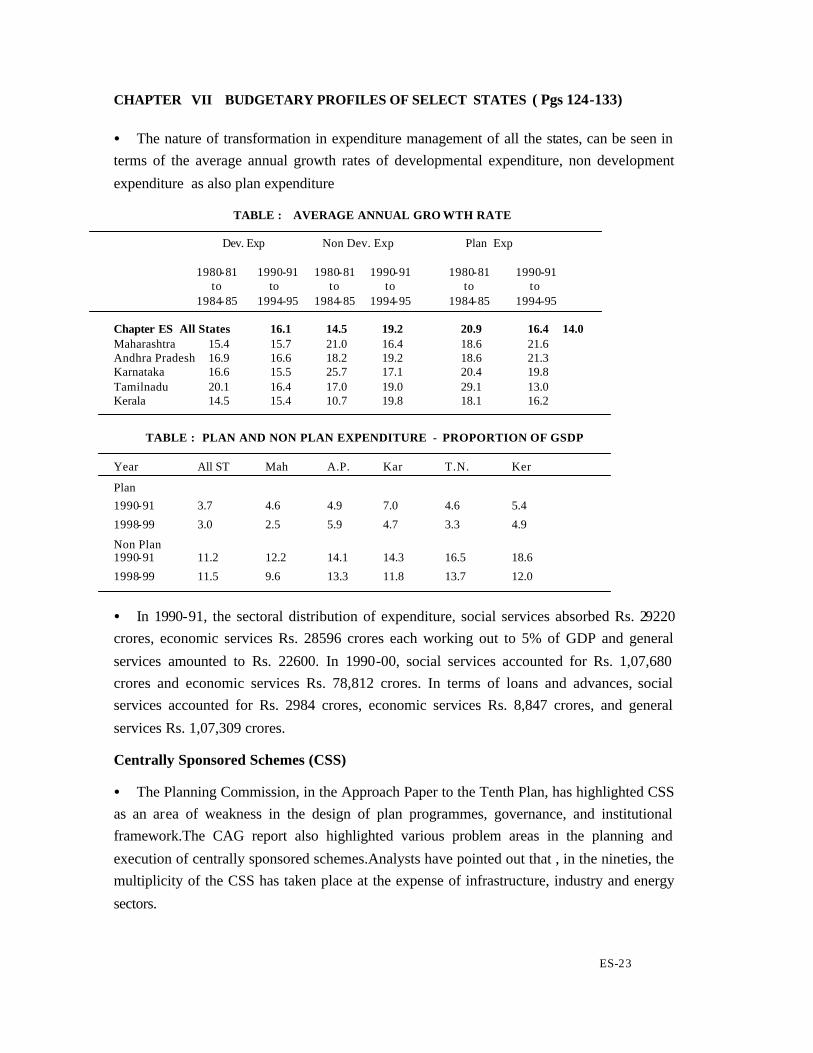
CHAPTER VII BUDGETARY PROFILES OF SELECT STATES ( Pgs 124-133) • The nature of transformation in expenditure management of all the states, can be seen in
terms of the average annual growth rates of developmental expenditure, non development
expenditure as also plan expenditure
TABLE : AVERAGE ANNUAL GRO WTH RATE Dev. Exp Non Dev. Exp Plan Exp 1980-81 1990-91 1980-81 1990-91 1980-81 1990-91 to to to to to to 1984-85 1994-95 1984-85 1994-95 1984-85 1994-95 Chapter ES All States 16.1 14.5 19.2 20.9 16.4 14.0 Maharashtra 15.4 15.7 21.0 16.4 18.6 21.6 Andhra Pradesh 16.9 16.6 18.2 19.2 18.6 21.3 Karnataka 16.6 15.5 25.7 17.1 20.4 19.8 Tamilnadu 20.1 16.4 17.0 19.0 29.1 13.0 Kerala 14.5 15.4 10.7 19.8 18.1 16.2
TABLE : PLAN AND NON PLAN EXPENDITURE - PROPORTION OF GSDP
Year All ST Mah A.P. Kar T.N. Ker
Plan
1990-91 3.7 4.6 4.9 7.0 4.6 5.4
1998-99 3.0 2.5 5.9 4.7 3.3 4.9
Non Plan 1990-91 11.2 12.2 14.1 14.3 16.5 18.6
1998-99 11.5 9.6 13.3 11.8 13.7 12.0
• In 1990-91, the sectoral distribution of expenditure, social services absorbed Rs. 29220
crores, economic services Rs. 28596 crores each working out to 5% of GDP and general
services amounted to Rs. 22600. In 1990-00, social services accounted for Rs. 1,07,680
crores and economic services Rs. 78,812 crores. In terms of loans and advances, social
services accounted for Rs. 2984 crores, economic services Rs. 8,847 crores, and general
services Rs. 1,07,309 crores.
Centrally Sponsored Schemes (CSS)
• The Planning Commission, in the Approach Paper to the Tenth Plan, has highlighted CSS
as an area of weakness in the design of plan programmes, governance, and institutional
framework.The CAG report also highlighted various problem areas in the planning and
execution of centrally sponsored schemes.Analysts have pointed out that , in the nineties, the
multiplicity of the CSS has taken place at the expense of infrastructure, industry and energy
sectors.
ES-24
• Central Government taking note of this, in 2001-02 announced as part of Expenditure
Management measures its intention to converge various CSS to eliminate duplication. Of the
256 Centrally sponsored schemes covered, 139 schemes are to be transferred to the States,
while 117 schemes are to reviewed by the respective Government Departments. Elementary
education and literacy will have a massive cut down from 19 to 2, and higher education from
22 to 8 schemes.
Revenue Transactions
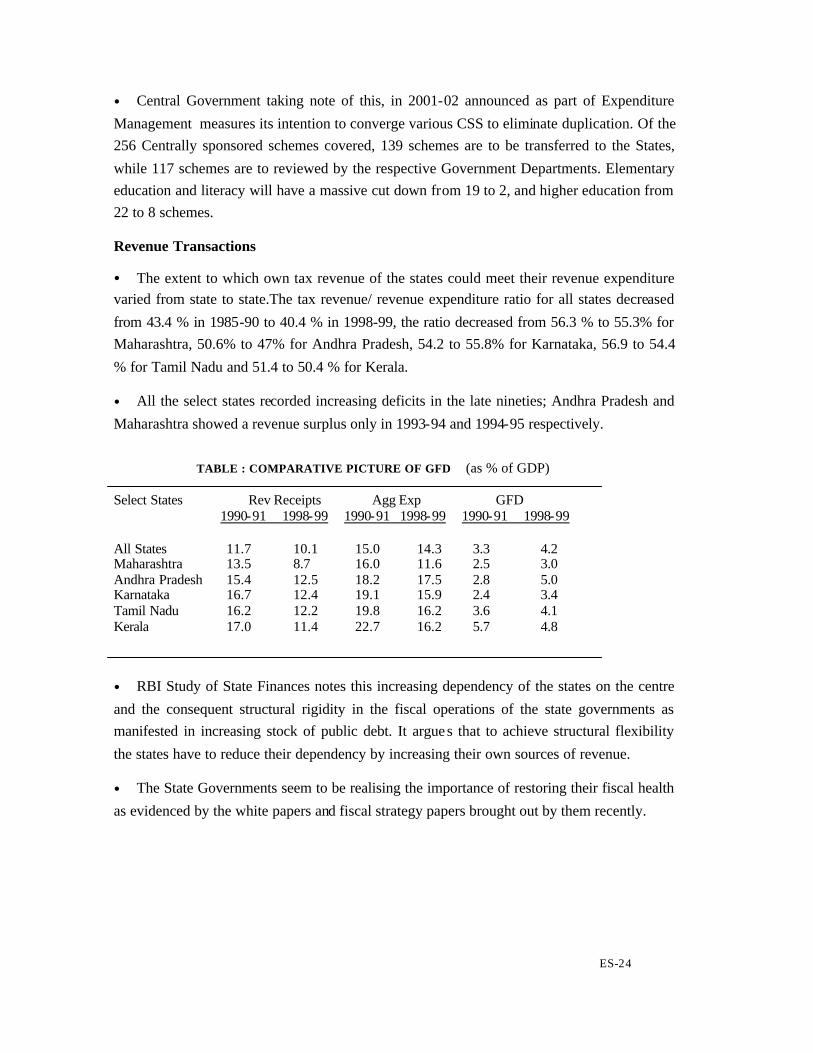
• The extent to which own tax revenue of the states could meet their revenue expenditure
varied from state to state.The tax revenue/ revenue expenditure ratio for all states decreased
from 43.4 % in 1985-90 to 40.4 % in 1998-99, the ratio decreased from 56.3 % to 55.3% for
Maharashtra, 50.6% to 47% for Andhra Pradesh, 54.2 to 55.8% for Karnataka, 56.9 to 54.4
% for Tamil Nadu and 51.4 to 50.4 % for Kerala.
• All the select states recorded increasing deficits in the late nineties; Andhra Pradesh and
Maharashtra showed a revenue surplus only in 1993-94 and 1994-95 respectively.
TABLE : COMPARATIVE PICTURE OF GFD (as % of GDP)
Select States Rev Receipts Agg Exp GFD 1990-91 1998-99 1990-91 1998-99 1990-91 1998-99 All States 11.7 10.1 15.0 14.3 3.3 4.2 Maharashtra 13.5 8.7 16.0 11.6 2.5 3.0 Andhra Pradesh 15.4 12.5 18.2 17.5 2.8 5.0 Karnataka 16.7 12.4 19.1 15.9 2.4 3.4 Tamil Nadu 16.2 12.2 19.8 16.2 3.6 4.1 Kerala 17.0 11.4 22.7 16.2 5.7 4.8
• RBI Study of State Finances notes this increasing dependency of the states on the centre
and the consequent structural rigidity in the fiscal operations of the state governments as
manifested in increasing stock of public debt. It argues that to achieve structural flexibility
the states have to reduce their dependency by increasing their own sources of revenue.
• The State Governments seem to be realising the importance of restoring their fiscal health
as evidenced by the white papers and fiscal strategy papers brought out by them recently.
ES-25
CHAPTER VIII SECTORAL INSIGHTS (Pgs. 134-159) 8.1 Economic Services: Irrigation Financing and Development • A detailed analysis of economic services in terms of expenditure on irrigation is taken up.
Irrigation though a state subject, the Government of India, through the Central Water
Commission and the Irrigation Ministry as also the Planning Commission provides the broad
framework for its development and utilization.
• Important policy issues have been dealt with from time to time, by the First Irrigation
Commission of India (1901-1903) prior to independence, the Second Irrigation Commission
(1970-72) and the National Water Policy (1987).
• The National Commission of Water in its report of 1999, classified water resources into
available water resources and usable water resources, placing the former at 1953 km3 and the
latter at 1086 km3, including 690km3 of surface water, 693 km3 of ground water and the
present level of use is estimated at 600km3
• Irrigation has been an important plan expenditure item from the first to the ninth plan,
adding up to a total of Rs. 73388 crores estimated at 1996-97 prices.
Irrigation- Potential and Utilisation
• The potential created by major and medium irrigation projects -32.96 million hectares
utilization -28.44 million hectares (End Eighth Five Year Plan) since then, 2.59 million
hectares to the potential and 1.81 million hectare to utilization have been added.
• In minor irrigation, the practice upto 1980, was to take utilization as 100 percent of the
potential created. As it was unacceptable to the Public Accounts Committee of the
Parliament, Planning Commission after consulting State Governments fixed a base figure for
1984-85, for potential created at 37.5 million hectares and utilization at 32.25 million
hectares. At the end of Eighth Five Year Plan the potential increased to 56.60 million hectare
and utilization to 52.31 million hectares. This amounts to a total potential 89.56 million
hectares and an utilization of 80.75 million hectares. But the land utilization statistics records
only 70.64 million hectares under gross irrigated area. This indicates an even larger gap
between potential created and utilized, than indicated by the irrigation statistics, at 9 million
hectares.
• Irrigation sector’s share in the state plans, had been high in the first three decades of
Planning but declined from 23.25 percent in the Fifth Plan to 18.48 percent in the Eighth
Plan. Major and medium irrigation projects, in 12 out of 16 major states have expenditures
higher than outlays (Ninth Five Year Plan).

ES-26
• Committee on water pricing set up by the Planning Commission in 1992 pointed out that
the gross revenue realised in irrigation projects was not even covering the working expenses.
Recovery percentage computed as the percentage of working expenses to gross receipts for
the country as a whole came down from 8.59 % in the late eighties to 8.53% in the early
nineties, for Andhra Pradesh from 5.03 % to 8.3 % , Tamil Nadu from 2 % to 2.59%,
Maharashtra from 5.8 % to 3.63 % for the same period . Some others, like Punjab, with high
recovery rates of 23.69 % came down to 16.03 % in the same period. The fall in recovery
rate appears to be common for all the States although quantum of decline varies from State to
State.
• Maharashtra in 1994, Karnataka in 1985, Andhra Pradesh in 1986, Tamil Nadu in 1962
and Kerala in 1974 revised their water rates. The prevailing water rates in Andhra Pradesh,
Tamil Nadu and Kerala is quite low.
• Analysts identify several core problems -financial performance of irrigation sector, policy
towards water rates and Beneficiary participation in irrigation management.Irrigation projects
show enormous time and cost over runs. In Kerala, Periyar valley project, started in 1956,
shows a 1711 % increase between the original and revised estimates. Other projects started
around the same time, like Kanjirapuzha, Kallada, Kuttiady etc. also showed a similar large
difference. Consequently, the investment on irrigation has not yielded commensurate revenue
for long periods of time restricting resource availability for other uses.
• CAG, draws attention to the execution of non essential works in Kallada Irrigation
Project, additional expenditure due to adoption of higher rate in Idamalayar Project and
removal of sand dunes, non completion of flood control works started in 1971, and negatory
expenditure on idle staff in Kerala irrigation department.
• Andhra Pradesh, had an irrigation potential of 11.2 million hectares and utilization of
over 5.9 million hectares. By 1994, there were 26 ongoing projects. 258 large dams were
completed. According to CAG by March 2000, 22 incomplete major and medium irrigation
projects, having already cost Rs. 4482 crores to the exchequer, without any benefits accruing
for 2 major and 8 medium irrigation projects and partial benefits for six major and six minor
irrigation projects, and 15 projects were languishing for more than 15 years. A scrutiny of
CAG’s list shows that the assessment may not be totally correct, as projects like Singur
(1976) and Tungabhadra lowlevel cannal (1974) have been yielding results through not at the
promising level.
• Creation of irrigation potential, and its utilization apart from dam construction, also
involves canal works and command area development, which to a considerable extent
depends on the agriculturists, their acceptance and assimilation of new techniques and ideas
to bring about the necessary change from dry land agriculture practices and associated life
ES-27
styles to wet agriculture practices and associated life styles. This influences the time frame of
the project, phasing of the projects backed up by the socio, economic, cultural and
environmental studies of the command area, at the beginning and various phases of the
project.
• Government of Andhra Pradesh in its strategy paper takes cognizance of the problems
involved in the utilization of the irrigation potential and its translation to prosperity and
initiated a major reform program in 1996. The State Government issued a white paper on
irrigation sector taking steps in three areas (a) increase in water rates, (b) farmer education
and (c) farmer empowerment and enacted Andhra Pradesh Farmer Management of Irrigation
systems Act 1997, providing for linkages between irrigation department and farmers
organisations. It initiated the formation of water users association spanning 4.8 million
hectares of irrigated area of the State.
• Scheme of modernisation of irrigation sector in Andhra Pradesh is being implemented
with specific objectives of (a)Improving cost recovery and productivity of irrigated
agriculture, (b)Strengthening cost recovery for O & M, (c)Reversing the decline in irrigated
area under existing commands, (d)Effectively expanding irrigation utilization levels.
• Maharashtra had in 1992-93, an irrigation potential of 8.9 million hectares and utilization
of 3.5 million hectares. By 1994, 1220 dams were built and 300 more were under
construction. Relative to Andhra Pradesh its utilization, has been slow, probably due to
unfavorable topography. The first Irrigation Commission of 1962 had recommended a review
of the sector once in 15 years. Second Irrigation Commission was recently appointed by the
Maharashtra Government recently to review the changes in the sector.
• Karnataka, had an ultimate irrigation potential (major and medium) of 5.9 million
hectares and utilization of 2.7 million hectares. By 1994, 188 medium projects were
completed and 28 still under construction. Karnataka’s minor irrigation potential was higher
than that of its major and medium irrigation potential.
• In Karnataka, a sharp intra regional imbalance, the paucity of positive efforts, lack of
prioritization of schemes, inadequate drainage facilities, and beneficiary participation as also
poor land development are affecting development of irrigation potential.
• In Tamil Nadu, Irrigation sector’s performance is impressive despite relatively low
budgetary outlays with a more clear cut development strategy based on identification and
classification of districts according to predominant source of irrigation and efficient bank and
co-operative credit system. Only one major project and 15 medium projects started in late
eighties and early nineties are pending.

ES-28
Irrigation Expenditure Rev. Exp. Cap. Exp. 1991-92 2000-01 1991-92 2000-01 All States 4140.28 9859.51 3851.83 11032.25 Maharashtra 708.70 728.63 526.11 1434.10 Andhra Pradesh 438.20 1596.16 372.95 1191.06 Karnataka 269.65 691.19 373.77 1343.20
Tamil Nadu 139.42 236.77 49.37 483.78 Kerala 62.46 148.45 90.81 220.65 (Note: Irrigation Expenditure includes that for flood control. Ref. DET tables, Statistical Tables )
Study Findings:-
• Achieving optimal levels of utilization of irrigation potential, the engineering aspects,
farmer training and empowerment and credit facilities.
• Water pricing committee recommendations for improving project design, appraisal
management in the irrigation sector to be implemented.
• Also, provision of an incentive structure, periodic upward revision of irrigation rates,
determination water rates on a volumetric basis and extending beneficiary participation in
irrigation management to all sections of farmers.
• Problems like the environmental impact, acquisition and compensation aspects of project
execution, disputes between beneficiaries and persons displaced, interstate disputes,
prolonged gestation period of the irrigation projects need to be tackled for effective
expenditure management .
8.2 Social Services : Education (Pgs.145-154)
• The expenditure on Social Services, especially education, in the post reform period of the
nineties in the backdrop of the constitutional provisions, plan objectives and policy changes
and resources available is studied here.‘Education’, is in the concurrent list and the
responsibility of both centre and states figuring in the budgets of both. As per the
Constitution, elementary education is to be provided free for all by the Government.
• Education for all has figured among the priorities set by the different plans, from the first
to the tenth. The Tenth Plan, acknowledging education for all to be one of its primary
objectives, announced the launching of the ‘Sarva Siksha Abhiyan’
• Analysts are of the opinion that social services expenditures including education, health,
housing, urban development and social welfare has declined considerably during the first few
years of reforms. For instance education expenditure for the states decreased form 21.08
percent in the pre reform period to 19.70 percent of total revenue expenditure during the
reform period.
ES-29
• Tulasidhar (1997), reviews percapita expenditures on social services for three categories
of states:- poor states of Bihar, Madhya Pradesh, Orissa, Rajasthan and Uttar Pradesh, middle
income states of Andhra Pradesh, Assam, Karnataka, Kerala, Tamil Nadu and West Bengal
and Rich States of Gujarat, Haryana, Maharashtra and Punjab, finds that the poor states’
social service expenditure has declined much more in the nineties, than those of the other
categories, impacting severely on their human development.
• The national policy on education (1986) emphasised elementary education, especially
free elementary education. A review of the state government expenditure on elementary
education in the post reform period of 1991-95 shows –(a)as a proportion of NSDP, five
states out of fifteen major states recorded a lower expenditure than the average for the fifteen
states. (b)as a proportion of total revenue expenditure of the states, nearly half of the major
states had a lower proportion than the average for the fifteen states.
• By 1995-96, the proportion of primary students enjoying free education in the states
ranged from 54 percent to 96 percent, with Assam at the top with 95.1 percent and Haryana
at the bottom with 54.10 percent and an all India average of 76 percent.; middle school
students enjoying free education in the states ranged from 51 percent to 93 percent indicating
dropouts, due to decreased expenditure. This is supported by the average household
expenditure per student. (National Sample Survey, 52nd round 1995-96) ranging between Rs.
501 and Rs. 915 for primary and middle school education. Even in the poor States
(Tulsidhar’s classification) referred to earlier, Rs. 450 to Rs. 550 on average per student per
household is spent. Coupled with the dwindling public expenditure on education it will
impact negatively on Human Development on the region, affecting the development of these
States.
Education Budget
• Successive versions of the national Policy on education, ever since 1968, have resolved
that around 6 percent of GDP should be invested in education. By the end of 1999, only 3.8
percent of GDP was spent on education. Despite its high priority in the national agenda,
centre’s share in education expenditure has been relatively less although it increased from 6.8
percent in 1980-81 to 11.1 percent in 1995-96.
• A large proportion of this expenditure at both the centre and the state level has been on
the revenue account, categorised under the non-plan category. In 1991-92, Non Plan
Expenditure on education was 91.44% of the total, decreasing to 88.09 percent in 2000-01
(BE).
• Contrarily, in capital account, the share of plan expenditure on education (99.06% of
total) is relatively higher than non-plan expenditure (0.9 percent 1.5 percent of total).
ES-30
Revenue expenditure is higher than Capital expenditure which is relatively small and
declining. In 1991-92 capital expenditure accounted for 1.60 percent of the total expenditure
(Revenue + Capital). It declined to 0.80 percent in 2000-01 (BE). Low capital expenditure on
education affects the quality of education in terms of inadequate provision for equipment,
furniture, libraries etc.
• Similarly for all states, non plan expenditure increased from Rs. 15617.1 crores in 1991-
92 to Rs. 50462.41 in 2000-01(BE) i.e. by Rs. 34845.31 crores and plan expenditure on
education increased from Rs. 1737.79 crores to Rs. 7272.42, i.e. by Rs. 5534.63. This seems
woefully inadequate with a decadal variation of 21.34 percent in population during this
period, the entrants into the school age group has also increased.
• Another dimension to the public expenditure on education lies in the intra sectoral
allocations, which have favoured the higher levels of education rather than the crucial
elementary level. Even the various commissions on education appointed from time to time
have been asked to focus on higher education despite the priority accorded to primary
education. Analysts fear that this preponderance of higher education in India at the expense
of elementary education has marginalised the weaker and poor sections of society further. In
the nineties, however the intra sectoral allocation seems to have changed slightly in favour
of elementary education in the states, except in West Bengal, Punjab and Andhra Pradesh..
• Total education expenditure as a proportion of GSDP, in Maharashtra, Andhra Pradesh,
Karnataka, Tamil Nadu and Kerala. ranges between 2 to 3.6 percent, which is much lower
than the 3% recommended for elementary education alone. Kerala has consistently
recorded higher percapita expenditure on education and the share of education in social
service expenditure has been higher than that of the other states, as reflected on its higher
literacy and educational growth rates. Analysts feel that, this achievement in social services
sector is at the cost of economic growth, and the root cause of the fiscal crisis faced by the
state and propose a retreat of the state from this sphere with measures like closing up
‘uneconomic government schools’ and encour aging private investments. While others have
noted that squeezing expenditure on education and other social service sectors may
ultimately affect economic growth through its impact on human development.
• Tamil Nadu, launched “elementary education movement” in the year 1999-2000, giving
special attention to children belonging to economically backward sections. It aims at
improving the quality and quantity by expanding the services to cover all the school age
children, opening new schools and upgrading existing ones, with in one kilometer of their
residence. It continues to run supplementary nutrition programmes like the midday meal
programme for improving enrollment and retention in schools.
ES-31
• Andhra Pradesh, has also launched special programmes like ’Back to School’, Vidya
volunteers scheme etc under Janmabhoomi programme to improve access and quality and
expand elementary education in the late nineties.
• While other southern states have been involving in and committing themselves to,
improving social services and education, Kerala having a significant record in social services,
is being advocated by analysts and experts to withdraw or retreat from its commitments in
the sector as a way to resolve its fiscal crisis.
• Such a withdrawal has to be gradual, accompanied by social mobilisation in terms of
NGO and local community participation advocated in the ninth and tenth plans, vigorously
pursued and monitored to plug wastages and leakages.
8.3 : General Services -Administrative Services (Pgs 155-159)
• Salaries and allowance of Government employees, is an important area of concern in
State Finances. Between 1991-92 and 1999-00, the administrative expenditure has increased
from Rs. 7809 crores (9.06%) to Rs. 24424 crores (10.05% as a proportion of total
expenditure). As a proportion of States own revenue they decreased from 19.73 percent to
18.59 percent in the same period. As a proportion of total revenue receipts, it increased from
9.69 percent to 11.93 percent during the same period.
• This shows that the increasing administrative expenditure is being covered to a lesser and
lesser extent by the states own resources than other receipts. But relative to the rise in interest
payments, during the same period, from Rs. 10944 crores to Rs. 45269 crores the increase
does not appear to be steep. Dr. Rakesh Mohan’s analysis shows that expenditure on
Government servants has grown at a lower rate than the GDP growth rate.
• There are interstate variations in the Administrative Expenditure, but commitments on
Grant-in-aid for salaries of employees of educational and local body institution are common
to most states. While only a few of the State Governments have linked the salary scale of
their employees to the Central Government pay scales and their finances came under serious
threat with the acceptance of the recommendations of the Fifth Pay Commission by the
Central Government, as pointed out by J.L.Bajaj. The impact of revision, placed at Rs.
20,000 to Rs. 30,000 crores, likely, to be faced by the Government of Uttar Pradesh, Madhya
Pradesh and Maharashtra would affect the finances already riddled with high revenue deficit,
fiscal deficit and debt stock as also a higher quantum of employees.
• The down sizing of employees, as a measure to control administrative expenditure needs
to be selective with particular attention paid to the responsibilities of the various organs,
proper man power planning to improve the efficiency and efficacy of the services provided
by the Government is needed. Andhra Pradesh fiscal strategy paper, reveals that the pay and
ES-32
allowances has steadily increased from Rs. 1231 crores in 1990-91 to Rs. 4470 crores in
2000-01(BE) despite the decrease in number of employees. The grants in aid in salaries has
increased from Rs. 1056 crores to Rs. 3620 crores, while pensions increased from Rs. 358
crores to Rs. 2179 crores in the same period. In 1994 Andhra Pradesh Government
introduced legislation to regulate employment in public enterprises and Government
departments with a programme for restructuring them. The impact of these on the
establishment cost does not appear to have been significant, although the ratio of
establishment cost to states own revenue improved due to increase in state’s own tax and
non-tax revenues, from 85.7 percent in 1990-91 to 74.8 percent in 2000-01 (BE)
• In Maharashtra, in 2000-01 the total salary bill of the State Government took away 60.93
percent of revenue receipts. The total pension liabilities amounted to Rs. 2657 crores.
According to Ashok Lahiri, the State Governments wages bills has gone up by 2 to 4 percent
of their respective GSDP’s during the nineties. The increases was from 7.5 percent in 1991 to
8.9 percent in 1997-98 in the case of Uttar Pradesh, Rajasthan recorded increase from 5.5 to
8.4 percent between 1991 and 1999. In Orrisa the increase was from 8.4 percent in 1993-94
to 11 percent in 1998-99.
• In the present times of violence it is not surprising that the police expenditure in the
nineties rose from Rs. 3981 crores to Rs. 14490 crores i.e. from 56.71 percent to 59.73
percent of Administrative Expenditure. In the State like Andhra Pradesh and Maharashtra,
not only has the police expenditure increased, but special assistance is being provided to
meet naxalite problems. Important issues here are-(a)the growing unemployment levels
(b)increasing disenchantment among the youth. (c)the consequent increase in crime rate and
militant activity. (d)whether the States can radically downsize in this context and retreat?
Therefore a balanced approach covering all sectors of the economy is feasible.
CHAPTER -IX: PROBLEM AREAS IN PUBLIC EXPENDITURE (Pgs. 160-192)
9 . 1 : Leakage and Wastage (Pgs. 160-714)
• The Objectives of Growth with ‘Social Justice’ and ‘Poverty alleviation’ have been
sought to be achieved through planned development in terms of - high economic growth and
all round development percolating to the weaker and marginal sections; vigorous anti-
poverty and employment programmes for identified target groups and according high
priority to social expenditure on education, health, family welfare, water supply and
sanitation, nutrition, housing, labour and employment, welfare of SC/ ST’s and OBCs.
• From the VI Plan, specific plan allocations for Rural Development, as a head of
development, and increased allocations for social services were made. Increasing allocations
and the large scale of implementation led to growing concern over efficacy of expenditure
and avoidance of wastage and leakage in implementation.
ES-33
• Main feature of the poverty alleviation and employment generation schemes in the self
employment category is a provision of package of assistance consisting of subsidy or margin
money provided by the Government and a loan provided by the bank or credit institutions for
acquisition of productive assets by the bene ficiaries; some schemes included training and
special packages for women. A 1990 Government of India evaluation of these schemes
revealed that a poor individual beneficiary without any skill or experience could not achieve
income security.
• The wage employment schemes for tackling short term seasonal unemployment suffered
from the targeting errors of inclusion of non poor and exclusion of a significant proportion
of poor in many states and frequent shift in focus between employment generation and asset
creation. A total of 5 million households were provided assistance under IRDP and related
schemes with an average of Rs. 18000 per beneficiary household by 1998-99 and nearly 40%
of this assistance was by way of Government subsidy.
CAG Evaluation
• CAG’s performance audit of JRY and EMS programmes in 25 states reported short
comings in critical areas of targeting, inadequacy of resources, as also insignificant
employment generation and fictious reporting of employment generation and asset creation.
• CAG reports that out of a total allocation for CSS employment schemes of Rs. 50715
crores, the Union and the States spent Rs. 48,821 crores from the Fifth Plan (1977-80) to the
Annual Plan (1998-99)
• For the ten year period of 1989-99, JRY and EAS expenditure accounted for Rs. 41,090
crores. Of which CAG found, a diversion of Rs. 2178 crores to other activities and Rs. 1747
crores to personal deposit accounts, a non utilization of Rs. 754 crores and an excessive
administrative expenditure of Rs. 14.5 crores, providing only 7 to 21 days of work under JRY
and 9 to 18 days of work under EAS for Below Poverty Line employment seekers. The crux
of the matter according to CAG is the routine manner of implementation impervious to lags
and bottlenecks in execution and unverifiable out puts.
• The important points that emerge are- (a) the change of focus in employment generation
and other CSS schemes resulting in confusion and inefficiency at the implementation level as
also dilution of verifiability of the quality of execution, (b) the multiplicity of controls by
Central Government, State Governments and local bodies diluting both efficiency of physical
implementation and financial accountability. (c) Dual sources of funding burdening the field
staff with administrative respons ibilities of coordinating fund release eating into their field
execution time.
ES-34
• Much of what is perceived as wastage could be the resources absorbed not only by
intermediate agencies but also increasing overheads on the salaries and travel of officials and
members of the innumerable committees.
Public Distribution Scheme
• PDS is an important scheme directed towards poverty alleviation through provision of
food security. CAG (Reports 3 of 2000), comments that PDS has substantially contributed to
the containment of rise in food prices and ensured access of urban consumer to food.
• The PDS in 1999, encompassed a total of 4,55,055 fair price shops catering to 19.12
crore ration cardholders of which 7.20 crores were below the poverty line. The procurement
operations cover 11 crore operational holdings handling 15 % of the total available rice and
wheat. The scheme costs about 0.5% of GDP and 6% of Centre’s Revenue.
• With a view to reduce subsidies under PDS, in 1997 Government of India modified the
scheme to targeted PDS. CAG (Report 3 of 2000) reports that 18 out of 31 states and Union
territories have not completed the necessary identification and listing of families Below the
Poverty Line and even where it was completed ration cards were not provided to a significant
proportion of BPL families adversely affecting the offtake from PDS, lifting of stocks from
FCI and state government agencies.
• Analysts observed that wherever the policy of delivery of food grains at the door steps of
Fair Price Shops (FPS) is there leakages at the FCI godown level (first level) is minimal; in
those states where the FPS dealers have to lift the stock at their own expense leakages at the
first level are high and often the food grains do not reach the village. The leakages at the
second level, due to bogus cards, diversion of quantities not taken by card holders by the FPS
dealers are due to the lower margins and income of these dealers, according to the analysts.
• Analysis reveals that, PDS despite its weaknesses had managed to provide food security
in its universal application. Misconceived efforts to reduce budgetary burden of food subsidy
through higher food grain prices has resulted in reduction in offtake, higher storage costs and
wastage of food grains due to storage problems. Thus universal application of PDS sans
implementation bottlenecks may be the more effective solution.
9 . 2 : Intra State Disparities and Political unrest (Pgs. 174-180)
• Existence of intra regional disparities is an acknowledged fact. The popular perceptions,
policy and programme responses in different states to this needs attention. Andhra Pradesh,
Karnataka, Maharashtra have faced agitations stemming from local discontent. The official
responses have been in the form of study teams and area development boards like, Malnad
area development board, Hyderabad-Karnataka area development board, Telengana and
Rayalseema Development boards etc.

ES-35
• Similar discontent in Tamil Nadu and Kerala have not led to agitations. In Tamil Nadu
the official response has bee n to bifurcate and trifurcate large districts to create more
manageable districts while in Kerala area development boards have been created to deal with
the issue.
• NCAER, South India Human Development Report, 2001, commenting on the inter
district variations in levels of development in different sub regions in the Southern States,
points out that Telengana is the least developed sub region in Andhra Pradesh. The
Telengana agitations, demanding a Telengana State started in 1969 leading to the constitution
of area development board and specific allocation of plan funds for the same. In 1973, a
counter agitation for a separate Andhra State started with the supreme courts upholding the
formulae of employment for ‘locals only’ in the Telengana area, assuaged by a six point
formula dealing with services, and provision of a separate development fund. Resurgence of
Telengana Movement for a separate State has brought to the fore issues of efficacy of public
expenditure programmes in achieving inter and intra regiona l balances in growth.
• In the case of Maharashtra the formation of a Vidarbha backlog removal and
development forum in 2001is estimating the backlogs in allocation of development funds to
the region. The official committee estimates that the backlog in allocation of irrigation funds
to the region is Rs. 4265 crores (as per the 1994 rates) when the estimated cost was Rs.
50,000 per hectares. Maharashtra Government has decided to accept the committee’s report
in principle and proposes to raise funds through bonds for irrigation development
corporations constituted separately for Vidharbha, Marathwada and Konkan areas.
• In Karnataka, in May 1980, a committee was constituted to study the backward area of
Hyderabad- Karnataka region and it recommended in 1981, (a) the establishment of a
statutory board to formulate plans for the region, (b) Setting up a development corporation to
execute these plans. The State Government in response constituted in 1992, a fullfledged area
development board to implement the development plan.and a high power committee to
monitor the development of the region was setup. In 1994 Institute of Social and Economic
Change (ISEC) seminar, reviewing the development in this region, concluded that the region
had remained economically and socially backward despite conscious efforts by the State
Government to develop the region.
• The NCAER South India Human Development Report observes that the northeastern
districts of Karnataka are the most backward with regard to social as well as economic
ind icators. The area development boards have not been able to achieve the expected success
and have met with resistance from environmental and local groups in same districts.
ES-36
• It would appear that, for the most part, the problems of Andhra Pradesh, Karnataka and
Maharashtra which inherited areas form the old Hyderabad State, is a historical legacy of the
old feudal regime.
• Kerala State represents another dimension of the development scenario. Its 14 districts
exhibit high social development but rather low eco nomic indicators. Of the total, four
districts have been classified as better-developed, six districts as medium developed and five
districts as less developed by the NCAER Study.
• In its budget of 2001-2002, Kerala Government, announced the constitution of (a)Coastal
Area Development (b) Hill- Area Development authority with a preliminary provision of Rs.
one crore each. The success of this move, in the light of the experiences of similar moves by
Karnataka and Andhra Pradesh seems doubtful.
• The regional developmental aspirations and their political manifestations, thus seems to
be simmering just under the surface, erupting now and then under the influence of events
elsewhere in the country like the formation of Uttaranchal, Jharkhand, and Chattisgarh
districts.
• This move will no doubt add to the expenditure on administration, but also fragment the
resource base of the States. This needs to be averted especially in view of the fact that
decentralization of effective resource allocation and use, for various sectors at the micro level
has already been mooted in terms of the provisions of 73rd and 74the Amendments.
9 . 3 : Devolution to Local bodies (Pgs. 180-184)
• The emphasis on felt needs of the people and local participation as the key elements in
formula tion of plans and programmes has been the continuous refrain of five year plans, but
have been translated into action with varying degrees. Different concepts of this
decentralization have held centre stage and exited during the last five decades, without any of
them being given time and scope for getting fully operationalised in the different states.
• Devolution to local bodies, has assumed importance in the light of 73rd and 74th
Amendments enacted in 1992, according constitutional status to the municipalities and
panchayats to make them a permanent feature of the third tier of Governance in the Country,
leading to effective decentralization and use of resources. To speedup the devolution of
power, functions and finances to the local bodies, Planning Commission appointed a
committee in 1996. But the State Governments have been dragging their feet in this regard.
• Analysts like Bohra, Bandhopadhyay, have observed that the assignment of functional
responsibilities at Gram Panchayat, Panchayat Samities and Zilla Parisherd levels have not
been uniform among the states as common selection criteria have not been used. There is a
need for a clear policy and operative statement with regard to plan formulation by the local
ES-37
levels; the policy regarding panchayat finances needs to be clearly defined vis a vis those of
DRDA and other existing agencies, as also Government funded NGOs. The multiplicity of
agencies as also schemes at the local level need to be streamlined for better co-ordination and
efficient functioning.
• The Tenth Finance Commission (1994) recommended a total grant of Rs. 5380.93 crores
for local bodies in four equal installments starting from 1996-97. The Eleventh Finance
Commission recommended a grant-in-aid of Rs. 8000 crores to panchayats and Rs. 2000
crores to municipal bodies for the period 2000-05. The local bodies grants made by all the
states together, in 1990-91 was only under non-plan account amounting to Rs. 1015.52
crores. rising to Rs. 5057.63 crores in nonplan account and Rs. 66.91 crores in plan account
in 2000-01 (BE) indicating a general increase in aid to local bodies in the nineties.
• The Tenth Plan approach paper, suggests that the Finance Commission awards and other
development funds for local bodies should be given to the States only when such powers as
envisaged are transferred to the local bodies by the State Governments concerned so that
effective decentralization is achieved. It recommends that the local bodies should be
empowered to raise some revenue on their own to reduce their exclusive dependence on the
other tiers of Governance as also to discourage their heavy leaning on the higher levels of
Governance. Measures like, strengthening of accountability of the local bodies, through
evolution of code of conduct for elected members, simplification of rules and transparency in
procedures, ensuring proper audit of finances have been recommended by the approach
paper.
• With the changing philosophies of Governance at the national level, Institutional changes
and sub national and sub state levels have implications for the flow of funds between the
different levels as also the quality of public expenditure at these levels. The situation at
present is still transitional and fluid with settled pattern get to emerge with different
experiments of decentralization taking place in different states. These changing trends will
add a new dimension to the public expenditure management in the states in terms of posing
severe challenges in the flow of funds from the state to the sub -state levels than have been
experienced in the Centre State devolutions.
9 . 4 : Falling levels of Fiscal Marksmanship (Pgs. 184-189)
• The procedure of Budgeting is designed to provide parliamentary control and
administrative accountability to check falling levels of fiscal marksmanship. Budget, as
recommended by Godbole committee, needs to be reformed towards greater clarity and
transparency by publishing a simpler version of the budget with key issues and made freely
available to the common man. Publishing of a ‘Budget in Brief’ a simplified version by some
ES-38
states and the Planning Commission and RBI presenting various budget details with
functional classification are steps in the right direction.
• To make legislative control of budgets more effective, the budgetary composition needs
to change. The ‘committed’ expenditure accounting for over 60 percent of the consolidated
funds and 80 percent of the revenue receipts limits the scope for modification of budget by
the legislatures.
• An important aspect of the budget is the difference between the Budget estimates
presented in the Parliament/Legislatures and the revised estimate and the actuals, both in case
of receipts as well as expenditure. This impinges upon the legislatury control compromising
the role and discipline of the budgetary mechanism on expenditure.
• The estimates of tax revenues by the State Government could at times be affected by
unforeseen changes, but other sources of revenue could be more accurately estimated, as
such errors on the part of the Government affects several sectors seriously. Like in the case
of Andhra Pradesh which first took recourse to ways and means advances and overdrafts to
the tune of Rs. 7756 crores and later during the year resorted to freezing of expenditure to the
tune of Rs. 3035 crores to crucial sectors of water supply, sanitation, housing under social
services and rural development under economic services.
• Article 205 of the Constitution, provides that variations in expenditure, particularly
excesses are to be regularised by the departments explaining the reasons for such occurrences
to the Public Accounts Committee of the legislature. In a number of cases however the
procedure has not been followed and huge amounts have not been regularised and
expenditures were incurred for which provisions were not made either in the original
estimates or in supplementary demands according to CAG. For avoiding lapse, and surrender
budgetary provision not likely to be used, the state departments, CAG reports, have been
drawing funds and keeping them under deposit outside the public account to report utilization
during the year.
• Wastage of capital expenditure in terms of lower provision for O & M expenditure
resulting in deterioration of the quality of capital assets created, sometimes requiring
reinvestment are some of the issues concerning the weaknesses flowing from the calculated
disregard of budgetary propriety and legislature conventions that need to be addressed as part
of the reform process to achieve financial security.
Chapter ES 9 . 5 : Fading Standards of Accountability (Pgs. 189-192)
• One of the important areas of concern in the fiscal crisis of the States is the need to plug
leakages and wastages and use the resources available efficiently. Fading standards
accountability assume importance here. The financial control and audit, both of the Centre
ES-39
and State Governments have been designed to control leakages and wastages in government
transactions.
• Several of the articles in the Indian Constitution like Articles 112, 202, 77(3), 166(3), 266
to 292 etc, clearly set down rules and procedures for Central and State financial transactions.
These along with the scrutiny of Government accounts and audit provided under article 148
(1) of constitution make for checking of wastage and leakage at different levels. The CAG as
envisaged, in the financial framework, is expected to critically review the effectiveness of
Governments revenue mobilisation and expenditure management envisaging the
accountability of the executive to the parliament for the way in which public monies are
handled by the concerned Governments. Rules and procedures are drawn up in detail,
indicating the manner in which these audit reports are to be taken up by the Lok Sabha and
State Assemblies for scrutiny and discussion.
• While this is the framework as per the Constitutional provisions, the ground reality is
that, Audit instead of being looked upon as a valued ally, bringing to the notice, procedural,
technical and other lapses and irregularities, errors of judgement, negligence or intents of
dishonesty, is looked upon as some thing alien in the nature of impediment. Many public
account committees have not discussed the audit reports for several years and Government
and legislatures have generally ignored the audit reports.
• Analysts feel that fraud, waste and corruption are on the increase in many states because
of :- (a)poor state of accounts and audit by the State Government audit officers. (b)archaic
treasury system, (c)lack of specialisation in the audit department (d)the audit departments
lack of direct contact with the public either to publicise the discrepancies and frauds it has
traced nor to seek suggestions from the public to tackle the same. (e)the unintelligibility of
the CAG reports to the common man unfamiliar with jargons and accounting procedures.
CHAPTER X FISCAL REFORMS AND THE FUTURE (Pgs. 193-207) 10.1: Reversing Fiscal Crisis. (Pgs. 193-198)
• Our Study establishes clearly the nature and pace of deterioration of State Government
Finances in earlier chapters. An important fact that emerges is that the Governments of the
Southern States and Maharashtra under study here, have announced corrective steps in their
white papers/strategy papers.
• Government of Maharashtra’s white paper in December 1999, acknowledging the fiscal
deterioration indicated that over a period of five years, the revenue deficit would be wiped
out with a yearly reduction of 20 percent. The steps announced for this purpose included
reduction in interest payments, salary and related expenditure from 73 percent to 50 percent
of the revenue receipts over the next five years through review of the norms of Grant-in-Aid
ES-40
to institutions, right sizing of the Government departments, Zilla parishads and State PSUs
and restricting the borrowings to investments. Setting up of a three member board for
financial and managerial restructuring of State PSUs, constitution of expenditure priority
committee and Expenditure reform committee under the chairmanship of the Chief Minister
are some of the other measures of Government of Maharashtra. Maharashtra Government
appointed Dr. Godbole committee, to look into the budgetary aspects for bringing in greater
transparency and easy comprehension, submitted its report with a number of
recommendations to make the budget user friendly in December 2000.
• Andhra Pradesh has been publishing white paper on state finances since 1994. This
exercise in February 2001 included sector specific strategy papers apart from a fiscal strategy
paper and was circulated for discussion in the legislature and among the enlightened public.
The fiscal strategy paper admitted that the worsening of the fiscal situation due to various
reasons resulted in a higher level of debt (24.16% of GSDP) than the average for all states
(21.5 percent of GDP). The paper emphasised the need to reorient the mix of public
expenditure from, low priorities and inefficient applications to key social and developmental
priorities by increasing capital investments from the present level of 1.3 percent of GSDP to
2.2 percent of GSDP in the mean term and to 2.4 percent of GSDP by 2004 and by reducing
power, rice and other subsidies from their level of 1.5 percent of GSDP to 1.2 percent of
GSDP by 2005. Fiscal strategy paper announced a ceiling of 9 percent of GSDP for
Government guarantees to PSUs and co-operatives, and the adoption of Zero based
budgeting, improvement in accounting procedures and performance measurements. All these
relevant measures, however are yet to be put into practice.
• Karnataka, in July 2001, announced a medium term fiscal plan for the period 2001-02 to
2004-05 and indicated that this will be followed by a fiscal responsibility bill. The various
measures announced were- (a)reduction in budgetary support for PSUs and closure of
unviable PSUs, (b)to cut implicit and explicit subsidies for transport and electricity sectors,
(c)stop borrowings by Krishna Bhagyajala Nigam and Karnataka Niravari Nigam, (d)to shift
to long term low cost borrowings World Bank & Asian Development Bank. Targets set for
the terminal year 2004-05 are (a)transformation of revenue deficit of 1.49 percent of GSDP
in 2000-01 to a surplus of 0.40 percent of GSDP, (b)reduce fiscal deficit from the percent
level of 3.66 percent to 3 percent of GSDP, (c)reduce consolidated fiscal deficit form the
present levels of 5.44 percent to 3 percent of GSDP, (d)reduce overall debt stock from 32.65
percent to 31.03 percent and stabilise it at that level, (e)increase capital expenditure form the
present 1.66 percent to 2.41 percent of GSDP. The Medium Term Fiscal plan also covers tax
reform, expenditure reforms and management, levy of user charges and PSU reforms and
administrative reforms. The plan is sharp it its focus with clear goals. Implementation is yet
to begin.
ES-41
• Tamil Nadu Government, brought out a white paper on state finances for the period
1996-2000 in August 2001, seeking political consensus on fiscal correction programme to be
adopted. The white paper notes all the key issues relative to the financial predicament of the
state and attributes it to increase in the salaries, pensions, loans and interest payment
liabilities, as also the unsustainable subsidy regime and the decline in the state’s share in
central taxes from 20 percent (1992-93) to 16 percent (1999-2000) and has announced
measures to increase its revenues, reduce the unabridged deficit, maintain tighter control over
expenditure, encourage small savings and revise user charges and other fees collected for
various public services. A cell has been constituted to analyse the implications of shifting to
a value added tax regime and has announced its decision to act on the recommendations of
the committee on PSUs reporting a total accumulated loss of Rs. 2292 crores eroding
completely the States Government share capital of Rs. 1298.
• Kerala released a white paper on state finances noting its alarming deterioration, almost
on the verge of bankruptcy in June 2000. It noted the decline in capital expenditure in the
nineties and the increasing liabilities. The white paper could identify resource mobilization
option for only Rs. 1435 crores and proposed austerity measures to save Rs. 975 crores. For
enhancing tax collections rationalisation and simplification of tax structure was proposed for
improved tax compliance. Small savings collectio ns were proposed to be stepped up from Rs.
876 crores in 2000-01 Rs. 1200 crores in 2001-02.. Revision of the fee structures, in some
areas, to increase non-tax revenues by Rs. 275 crores were also proposed. Power supply tariff
was proposed to be revised for all categories of consumers by 60 percent. Intention to adopt
zero-based budgeting was also announced.
• All in all, the Southern States and Maharashtra have realised their fiscal position and
have proposed changes to arrest its deterioration. The imple mentation will require political
will and possibly a rescue mission form the centre.
10.2: Cost recovery and subsidies (Pgs. 198-207)
• An important issue in the fiscal consolidation in the nineties is the emphasis on reduction
of subsidies and recovery of costs incurred in the provision of services, as also the retreat of
the State as a provider of services and the privatisation of the same.
• Planning in India has been committed to raising the income and standards of living of the
people; the public secto r was to take initiative in the provision of services to raise the
standards of living of the people. Social and economic services have been basically designed
around equity consideration rather than economic/financial ones. Over the decades the role of
state and public sector has changed from predominant presence in the fifties to restructuring
and retreat from some areas in the eighties to a major withdrawal and privatisation in the
nineties, as the state finances slid from surpluses to deficits to financial crisis. The plan
ES-42
documents through the decades depict this policy/philosophy shift. The nineties witnessed
privatisation of public utilities like power, water supply, infrastructure etc., and restructuring
of public enterprises and disinvestment in PS Us, marking the retreat of the state. These
measures have met with popular and user resistance to the tariff revision involved.
• The approach paper to the Tenth Plan, has spoken of the need for a new development
policy to make a break from the past despite this. In this new policy framework reduction of
subsidies and cost recovery measures assume importance in public expenditure management.
In 1994-95, the Aggregate Govt. Subsidies (centre and States) amounted to Rs. 1,36,844
crores (14.35 percent of GDP) of which 70 percent of the subsidies were borne by the States.
In 1993-94 a study of 15 major States, revealed a subsidization higher then the cost recovery.
The overall recovery rate for social and economic services taken together was only 5.81
percent of the total cost incurred. Out of a total states subsidy of Rs. 73,100 crores, 28.7
percent covered the merit group of elementary education, public health, sewage, information
and publicity, welfare of SC, ST and OBC, labour and nutrition, while the balance of 71.3
percent was claimed by the non- merit subsidies. The percapita subsidy increasing with
increase in percapita income and the non- merit subsidies rising at a faster rate. But the
recovery rates in non-merit services increased with increase in percapita income.
• Government of Andhra Pradesh in its while paper of 1996, classified sudsidies into 3
categories (a) direct or transparent, with clear identification of beneficiaries and explicit
budgetary allocations. (b) indirect or hidden subsidy due to no n recovery of user charges. (c)
subsidized loans to co-operatives, public undertaking, housing loans to individuals. Analysis
revealed that the direct subsidies increased from Rs. 416.49 crores in 1991 to Rs. 805crores
in 1993-94, reaching Rs. 1322 crores in 1995-96. The indirect subsidy cost to the state budget
increased from Rs. 882 crores in 1991 to Rs. 2506 crores in 1995-96. The twin subsidy
pressures on the State Finances identified were - the direct subsidies pushing up the revenue
expenditure and the indirect subsidies freezing non-tax revenues.
• Government of Andhra Pradesh measures in this regard are- (a)increase in issue price of
rice and redefining the target group to of PDS reduce rice subsidy, (b)revising power tariff
for various categories of consumers, (c)reducing the subsidies in public education. The
crucial areas of irrigation rates, subsidized power supply to agriculture, involving the highest
non-merit subsidy according to the State Government, have not been included in this
exercise. With the options for improving state finances boiling down to either the paring
down of expenditure on service provision and privatisation of services, or improving non-tax
revenues, especially by the levy of user charges and cost recovery on a range of services, the
latter option is preferred by the Andhra Pradesh Government, which notes that if the quality
of services are improved users can be persuaded to pay commensurate charges. Andhra
Pradesh Government’s decision (preamble to G.O.No 170, Finance and Planning Department
ES-43
of 2001), recognizes the need to make system more user friendly and cost efficient and
allows the departments concerned to moblise their own resources and retain with them the
amount so collected to improve the services. The departments included in the detailed
procedural instructions are police, irrigation, sports, technical education, medical and public
health, water supply and sanitation, information and publicity, labour and employment, crop
husbandry, animal husbandry, fisheries, forest, industries and tourism.
• In Maharashtra, the high level of subsidies amounting to Rs. 9607 crores in 1993-94
consisted of only 30 percent of merit subsidies. The percapita subsidy is Rs. 1157 crores. In
the Budget for 2000-01, a decrease in the water rate for sugarcane growth in lift irrigation
schemes (from Rs. 1900 per hectare to Rs. 950 per hectare), although irrigation schemes
were executed with loans carrying high interest of 17 to 18 percent.
Food Subsidy
• Analysis reveals that while Maharashtra operates a relatively smaller scale of PDS than
Andhra Pradesh it suffers from a higher cost of leakage; the poor, in Andhra Pradesh receive
the substantially higher subsidy than the poor in Maharashtra ; rural Andhra Pradesh suffers
from wastage due to errors of inclusion of non-poor in the distribution of substantial
subsidy; Administrative actions to streamline the PDS is not yet forthcoming.
• Broad indicators of cost recovery like the ratio of non-tax revenues to non-plan revenue
expenditure in respect of social services (education & health) and economic services
(irrigation & road) for the 90’s, computed by RBI, cannot provide the true measure of either
the cost or the extent of its recovery, as for instance, the non-tax revenue and non-plan
expenditure taken for education, is booked under education, sports, art and culture. Of these,
educational facilities can confer benefits to individuals, but expenditure on sports, art and
culture tend to be more on infrastructure and administrative services in these sectors.
• In another analysis of state budgets from 1990-91 to 1998-99, defining cost recovery
ratio, as the ratio of cost recovered form the beneficiaries to the total cost incurred on each of
the budgetary services provided by the state governments and subsidy as the difference
between the cost recovered and cost incurred, in the provision of services, concludes that the
combined recovery rates of general services, economic services and social services has
declined from 14.22 % to 12.12 % in Andhra Pradesh and 13.01% to 11.91 % for all states.
States cost recovery rates, in the period , 1990-91 to 1998-99, came down from 19.65% to
14.36% for general services and from 2.10 % to 1.93% for social services. While for
economic services it went up from 20.59 to 23.43 % for the same period.
• Cut in the flow of subsidy benefits to the non-poor, defined as middle and high income
groups and higher user charges for higher income slabs can improve the recovery from 1.5

ES-44
percent to 44.54 percent in Andhra Pradesh alone. The administrative difficulties in
implementing the above suggestion makes a simple system of nominal charges, universally
applied and efficiently operated more pragmatic. For different sectors different approaches to
cost recovery are needed as in some cases it is far easier to relate the services provided to the
costs incurred, while in others it may not be so. In some, beneficiaries can be easily identified
and charges levied, while in common public services it may be a little more difficult. In
economic services, the O & M cost and benefits vary from service to service, as also between
different sub categories within the same service category. Political pressures, and lobbying
have kept rational/optional pricing policies at bay for most of the services.
• The Tenth Finance Commission observes-“ … most states have preferred the softer
option of letting services deteriorate rather than improving their spread and quality by
realising economic returns on investment in these areas and deploying additiona l resources
for these purposes”. State governments have however realised, in the wake of their financial
crisis, that the revision of rates and tariffs in power, irrigation and other sectors are long
overdue. Andhra Pradesh Government’s example of making public, costs involved in the
provision of subsidies and move towards higher charges may be a step on the right direction.
CHAPTER XI SUMMING UP AND SUGGESTIONS (Pgs. 208-220)
• The persistent fiscal challenges faced by the Centre having spread to the States, the
Finance Ministry at the Centre has taken a more active role in redefining the modalities of
arranging discretionary transfers as also inducing the states to adopt fiscal and budgetary
reforms appropriate to their specific situation. Several State Governments have realised and
acknowledged the poor state of their fiscal health in the NDC meeting of 1999
• The Reserve Bank of India has started monitoring its ways and means advances (WMA)
to the states carefully. Reserve Bank of India constituted an Advisory Committee to consider
the rationalisation and revision of the limits of ways and means advances to the states in
1998. Recommendations of this committee covering both special and normal WMAs to the
states included- (a)raising the limit from Rs. 2234 crores to Rs. 3685 crores for all states
specifying different limits for 23 States, (b)a ceiling on overdrafts and a restriction the
number of days the states could operate overdrafts to 20 working days in a quarter. As
suggested by RBI a Consolidated Sinking Fund for the States to retire debts, introduce
flexibility in market borrowing and timing their access to market has been set up.
• The Department of Expenditure of the Ministry of Finance at the Centre has taken
initiative in introducing MOU with 14 State Governments to restore financial viability of
electricity boards to rationalise electricity tariff.
• In 1998-99 Union Budget, a task force to examine the question of elimination of plan and
non plan distinction in the Budget and to make recommendations for a functionally viable
ES-45
and more focussed presentation of Government Expenditure in the budget. Union
Government announced in its budget of 2000-01 announced its intention of carrying out
structural changes in the composition of Central Governments expenditure and effect
economy in non-plan revenue expenditure with greater vigour, simultaneously improving the
quality of plan expenditure. The expenditure reforms commission constituted by it has
submitted its report in respect of six ministries, but the implementation is slow and reluctant.
• The fiscal responsibility bill, introduced by the Centre in Parliament in December 2000,
sought to reduce the fiscal deficit to 2 percent and completely eliminate revenue deficit in the
next five years. A critical examination of the bill shows that the ambitions are rather lofty
and considerable operational problems limit the extent of implementation.
• The Eleventh Finance Commission felt that excessive attention to plan expenditure has
resulted in a neglect of maintenance of past projects classified as ‘non plan’. In pursuance of
its additional terms of reference, the Eleventh Finance Commission, in order to encourage the
state government to implement fiscal reforms in a time bound manner recommended setting
up of an incentive fund, consisting of 15 percent of the withheld portion of the grants
recommended by EFC. This has been set up by the centre. The release will be based on a
single monitorable fiscal objective of a minimum improvement of 5 percent as a propor tion
of revenue receipts in their revenue deficits each year till 2004-05.
Suggestions
• There is need for state specific programmes of action , with a proper time frame, that
maintains a balance between Economic, Social and Political value systems and factors
operating at the ground level.
• Tax performance and expenditure control need to be among the premium virtues
attracting devolution and transfers of central resources for interstate disparities in central
assistance to be relatable to identifiable difficulties in fiscal performance, paucity of natural
resources, logistical problems of the states for making the fiscal reforms and discipline more
effective and meaningful.
• Some of the measures announced like levy of User Charges, scrutiny of staff strength
with a view to restricting new recruitment, creation of surplus pool employees to redeploy
surplus staff and use of Information Technology to promote efficiency in activities with large
interface with people , could be equally applied to the State Governments.
• The states should immediately pay greater attention to fiscal integrity, audit and
accountability, and regain for the system at least a part of the sanctity associated with
obtaining legislative approval.
ES-46
• Relationship between Macro Economic Management and Micro Economic Planning is
important and that coordination within the Government agencies concerned with micro
management should be given due importance.
• An improvement in the quality of budget preparation, with due attention to, and prior
determination of inter se priorities of alternative claims for the ever shrinking resources of
the state and Union Governments and improved quality of decision making is needed.
Improving the presentation aspects of the budget can help improve the quality of legislative
control, and monitoring of expenditure.
• The real improvement in fiscal health of the state can come about only by more detailed
attention to the resources side, with studies of trends in tax and non tax revenue, and review
of the existing frame work for cost recovery and reduction of subsidies.
• Mechanisms like Expenditure Finance Committee and Public Investment Board, which
provide some degree of pre investment scrutiny of feasibility reports, now obtaining at the
Centre and the time phasing of investments, with provisions in the budget matching the needs
of approved projects need to be introduced in the States. Tightening of procedures relating to
approval of revised costs estimates is an urgent necessity.
• The proposed project preparation facility at the Planning Commission can make a
difference in due course, if the State Governments avail this facility in adequate measure. For
its part the Planning Commission could consider training State Government employees in
project formulation and appraisal. The proposed scheme of training could be implemented by
the Planning Commission with expert faculty from authorities like the Central Electricity
Authority (CEA).
• Creation of a mechanism for concurrent audit and monitoring by a mutli-disciplinary
group with representatives having administrative, technical and audit professional
background need to be deliberated and decided upon.
• A constitutional cap on borrowings has become urgent. state governments appear to be
getting encouragement to access directly International Financial Agencies. This needs to be
curbed, for one of the major reasons for distortion of plan priorities and expenditure are the
subtle dictations of these agencies. Constitutional and fiscal propriety both demand a firm
decision in this area.
i
MANAGEMENT OF PUBLIC EXPENDITURE BY STATE GOVERNMENTS
IN INDIA - A STUDY OF THE TRENDS IN THE 1990’s
INTRODUCTION
This study is an investigation into the Management of Finances by State Governments in
India, covering 26 States, fifteen major and eleven small states, with focus on the states
of Maharashtra, Andhra Pradesh, Karnataka, Tamilnadu and Kerala. The study turns the searchlight on deteriorating financial position of the State
Governments worsening since the eighties, unravels in detail, the period of economic
reform 1990-91 to 1999-2000, and examines the compelling need for fiscal reform and
the measures initiated for fiscal consolidation. While the 26 States studied included Delhi
now designated as National Capital Territory, it did not include the Union Territories of
Chandigarh, Daman & Diu, Dadra and Nagar Havali, Lakshadeep, Pondichery and
Andaman and Nicobar Island.
The study covers the structural changes in Public Expenditure and their impact on pace of
Economic development, constrictions on Plan Expenditure and expansion of Non Plan
Expenditure, with competitive populism and diversion of subsidies affecting the utility of
Public Expenditure. Attention is paid to the sources of crises in Central and State
Finances and the manner in which State Finances deteriorated since the mid eighties and
brings out the efforts of the Government of India, the Planning Commission the Finance
Commission and the RBI and their attempts to evolve monitoring and regulatory
mechanism for stemming the deterioration.
The recurrent problems of Centre-State relations and mechanism of devolution, haunting
Indian public finance, receives attention, as the pattern of devolution and quantum of
flow of resources from the Centre, both by way of discretionary route of Planning
Commission and statutory route of Finance Commission have influenced the decision
making and pattern of Expenditure at the State level, highlighting the changes in criteria
adopted by the Tenth and Eleventh Finance Commissions.It also brings out the changes
in Planning Commission’s formulae for transfers from Centre to the States for
developmental plans. As the Study deals with the nineties, the decade of Economic
Reform, it provides a rapid view of the changes in the policy frame work particularly
efforts at fiscal consolidation and their impact on sectoral allocations in the annual plans
and budgetary provisions both at the central and the state level.
ii
As a result the study seeks to address the central question of Public Expenditure
Management as a vital development imperative, with investigation focussing attention on
the analysis of the plan and budgetary priorities particularly growth, equity and balanced
regional development adopted by the States and the policy options available and
exercised by the State Governments to improve their own resource mobilization and to
increase efficiency of expenditure. While the study provides a macro view of the
budgetary trends in all the Indian states it attempts to analyse in depth the budgetary
performances of the states of Maharashtra, Andhra Pradesh, Karnataka, Tamilnadu and
Kerala. With a view to eliciting information on differences in sectoral treatment if any,
the study probes the policies and programmes and expenditure patterns choosing one
major head of expenditure in different functional classifications in the Budget. (a)
Administrative and Police Services in General Services category, (b) Irrigation in
Economic Services category and (c) Education in Social Services category.
By the year 2000-01 three states have been carved out of the existing States. Since the
focus of the investigation was to be on four Southern States and Maharashtra the creation
of new States may not make substantial difference to the analysis of the trends in Public
Expenditure and Revenue mobilization or to the package of measures to be considered.
But the creation of these smaller States may have a substantial impact on the programmes
of Public Expenditure as this has given a spur to the long subsisting claim for creation
smaller States like Vidharbha in Maharashtra, Telengana in Andhra Pradesh as also to the
manner of allocation of funds for intra state regional bodies like the Hyderabad –
Karnataka Regional Development Board. In Karnataka. This aspect is analysed. Likewise the Constitutional Amendments 73rd and 74th, emphasizing devolution of funds
to the local bodies in Rural and Urban areas , if effectively carried out are likely to impact
the nature of Public Expenditure Management in the various States. The Panchayati Raj
and Municipal bodies have been in position for a few decades now, and can provide
useful insights into the manner in which the fresh bout of decentralization is likely to
affect the Public Expenditure Management, including the much vaunted downsizing of
Government , the study covers this aspect.
A source of major concern in Public Expenditure Management is the area of leakages and
wastage in poverty alleviation and other schemes conceived with laudable socio-
economic objectives but perceived in some quarters as populist securing substantial
budgetary allocation. The study seeks to draw attention to the Reports of the Comptroller
and Auditor General and examines the problems of implementation agencies, with a view
iii
to suggesting measures that can be taken by the State Governments to minimize costs,
leakage and wastages. The study also draws attention to the recent realisation of need for fiscal discipline for
betterment of State finances and covers the salient aspect of the White Papers on financial
situation and fiscal strategy papers published by the states of Maharashtra, Andhra
Pradesh , Karnataka , Tamilnadu and Kerala. The approach is diagnostic and prescriptive,
at the macro level, with some suggestions for improvement offered .
DATA AND METHODOLOGY
The data relating to the study have been drawn from the Budgetary documents of the
State Governments for the Southern States, Reports of Planning Commission, Finance
Ministry, Finance Commission and the RBI supplemented by contributions published in
journals like the RBI Bulletins, The Asian Economic Review, Economic and Political
Weekly, Finance India, Journal of Rural Development, Indian Economic Journal, Artha
Vijnana .We have also drawn from reports in news papers like the Hindu, Times of India,
The New Indian Express , the Hindu Business Line and Economic Times. Needless to
mention the study had to draw upon insights and information from several of the old and
recent books, particularly on Economic Reforms, Planning and State Specific studies.
These have been mentioned in a Bibliography.
With the scope covering 26 States and data from several official agencies, the
investigators faced the problem of a plethora of data and the need to cull out the vital
details from vast assemblage of data and ana lytical angles from research studies. With the
subcontinental dimensions of India there were several instances of partial analysis even
by experts. The need to balance the findings of specific investigations into a problem area
in one state and assessment of its relevance to the other states has led to several useful
lines of investigation being merely highlighted. These will provide leads for further
studies.The question of reliability and comparability of data gathered from multiple
sources, particularly of the State Governments had to be dealt with carefully as
component wise details were not available for Expenditure data for some years. In certain
years data for Capital receipts were found to have been adjusted for remittances.
In respect of expenditure of the State Governments due regard had to be paid for
adjustments for repayment of loans by State Governments, inter governmental transfer
and adjustments. In dealing with such data problems reliance has been placed on the

iv
methodology adopted by RBI and the Union Government. To this extent, the
discrepancies in the data gathered from State Government sources have been minimised.
While the data collection has covered several years and activities of different
governments, their presentation in the report had to be necessarily restricted to facilitate
clear analysis without cluttering the report with minutiae of data. To this extent the report
is an under statement of the effort involved in the study. While initially nearly 100 tables
of data were drawn up, the presentation had to be restricted. The data has been presented,
as far as possible, along with the text. However for convenience of reference, the detailed
tables have been presented in three sets, with different group headings
(a)Tables designated as SA series , presenting the aggregates of all the states for each
year in the nineties
(b) Tables designated as AS series presenting the details for each of the 26 states from
1990-91 to 2000-01.
(c) Tables designated as SS series presenting the details the Select States of Maharashtra,
Andhra Pradesh, Karnataka, Tamil Nadu and Kerala.
(d) Tables designated as DET series providing the details of various items of Plan and
Non Plan Expenditure under Revenue and Capital Accounts for the years 1991-92, 1997-
98, 1998-99, 1999-2000 RE, and 2000-2001 BE. Item wise Details of Revenue and
Capital Receipts compiled have been used only for analytical purposes, and not presented
here.
The study report is divided into 11 Major Sections
Section – I Deals with the Setting and economic landscape of India and provides
perspective views of the Finances of the Centre and the States, and the combined picture.
Section – II Deals with the Aggregate Picture of Revenue, Expenditure and other aspects
of Budgets of all the States, and traces the sources of fiscal imbalance.
Section – III Seeks to provide a better understanding of the fiscal dilemma of the States in
the context of the Constitutional and policy framework of Indian Economy mainly fiscal
federalism and the mechanisms evolved for devolution and transfer of resources to the
Centre to the States. It also provides a quick review of the impulses for Economic
Reforms initiated by the Centre and the impact of the new framework of policy on
development plans and the Union Budgets.
Section – IV Highlights the structural transformation of Indian Economy, and reviews
the differential growth performance and its impact on the levels of development of
various States, as measured by various indicators.
v
Section – V Provides an analysis of the Budgetary trends, in all the 26 states focussing
on transaction in Revenue and Capital Account, with details of Development and Non
Development Expenditures and Plan and Non Plan categories highlighting the fiscal
deterioration reflected in growing revenue and gross fiscal deficits during the nineties
with mounting debts and interest payment obligations.
Section – VI Provides a geographic and demographic profile as also key economic and
social indicators in States of Maharashtra, Andhra Pradesh, Karnataka, Tamilnadu and
Kerala , chosen for closer examination.
Section – VII examines the nature of transformation of Expenditure Management with
analysis of Budgetary trends and Sectoral Distribution of expenditure in the Select States
of Maharashtra, Andhra Pradesh, Karnataka, Tamil Nadu and Kerala.which were reputed
to be financially better managed.
Section – VIII With a view to obtaining insights into sectoral expenditure management
the study focuses attention on one major head of expenditure in each of functional
classifications in the Budget. (a) Administrative and Police Services in General Services
category, (b) Irrigation in Economic Services category and (c) Education in Social
Services category.
Section – IX focuses attention on the problem areas of Public Expenditure Management
and explores the emerging areas of weaknesses in Public Finance –the leakage and
wastage in poverty alleviation schemes, the political dimensions of intra state and
interstate disparities , the persisting tardiness in devolution to local bodies, falling levels
of fiscal marksmanship and fading standards of accountability.
Section X outlines the steps taken by the state governments to reverse the fiscal crisis by
formulation fiscal strategy and medium term plans and highlights the need for fiscal
recovery through mechanisms for better expenditure control enforcement of budgetary
discipline and improved resource mobilisation by universalisation of user charges and
other measures.
Section XI sums up the critical aspects of states’ finances , surveys the recent policy and
programme measures for fiscal consolidation and proceeds to make some suggestions .
Bibliography is provided at the end and the statistical tables are provided as a separate
volume.
The Study has been carried out at the Indian Institute of Economics, Hyderabad with a
grant from the Planning Commission
- 6 -
I THE NATIONAL SETTING
1.1 CURRENT FISCAL OOTLOOK
Even as India stepped into a new millenium, the development outlook has been marked
by the consciousness, as noted by the Planning Commission in the Approach Paper to the
Tenth Five Year Plan, that “the economy is currently in a decelerating phase and urgent
steps are needed to arrest the deceleration and restore momentum,” “and that” this
reversal … has to take place in an environment where the world economy is slowing
down”.1
There is the overcast of a brooding omnipresence of fiscal insecurity. The Planning
Commission also pointed out that “ the fiscal situation of the central government has
deteriorated continuously in the 1990s and especially during the Ninth Plan” and that “the
finances of the state governments have deteriorated precipitously in the 1990s” 2
Presenting the Union Budget for 2001-02 in February 2001, Shri. Yeshwant Sinha Union
Finance Minister stated that “the most serious problem confronting the economy is the
poor state of the fiscal health of both the Central and State Governments. The combined
fiscal deficit of the two together is in the region of 10% of GDP 3, In February 1999 the
Finance Minister had already informed the Parliament that “the fiscal and revenue
deficits of both Centre and the states are still too high and are undermining the country’s
ability to stimulate involvement and growth, generate resources for priority expenditure
needs, to bring down interest rates, to curb inflationary potential and raise exports.” 4
International Monetary Fund’s, World Economic Outlook released in April 2000 drew
attention to the fact that India has been among the fastest growing economies in the world
over the last two decades and pointed out that deft handling of monetary policy helped
India successfully weather the Asian Crisis while maintaining low inflation and
comfortable external position. Highlighting the problem areas the Report observed that
“the foremost challenge is to make prompt and credible progress in conducing the fiscal
deficit. With budgetary slippage occurring at both Central and State Government levels,
the consolidated public sector deficit has risen to 11% of the GDP in fiscal 1999-2000,
over two percentage points higher than initially budgeted. India’s large fiscal imbalances
that have pushed public debt upto 80 % of the GDP, are crowding out private investment,
1. Planning Commission : Approach Paper to the Tenth Five Year Plan (2002-2007) Para 1.2 2. Ibid Paras 2.6 and 2.7 3. Government of India , Ministry of Finance : Speech on Budget (2001-02) Feb 2001 Para 76 4. Ibid Speech on Budget Feb 1999 Para 6.
- 7 -
and are constraining the scope for monetary authorities to ease interest rates which are
high in real terms, with oil jeopardising recent gains on the inflation front.” 5
The Ministry of Finance in its Economic Survey 2000-2001, presented to the Parliament
in February 2001 observed that “ Despite the positive response of Economic Agents to
Reforms, identifiable gaps in the reform process continue to cloud the long term
prospects of the economy. The fiscal situation has worsened since 1996-97 .”. After
tracing the implications of the persisting high fiscal deficit at both Central and State
levels and the consequent increasing share of debt service in the expenditure budgets of
both the Central and state governments, for Government’s ability to undertake public
investment, demand for Indian industrial goods, growth of private investment in
infrastructure, and high interest rate regime, the Survey observed that “ the key areas for
action, for instilling confidence in the economy, pertains to a credible medium term
programme for fiscal improvement . This has acquired new urgency at this juncture.” 6
While pronounced emphasis on fiscal consolidation and financial restructuring since
1991, had resulted in a determined approach to Public Expenditure Management aiming
at reduction of budgetary deficits, it has since emerged that during the Eighth Plan period
(1992-97) fiscal consolidation measures had concentrated on compression of Public
investment and that the Ninth Plan proposals marked a sharp reduction in the share of
Public Investment in Total Investment from 45 % to 33.4 % (i.e from 10.4 % to 8.3 % of
the GDP) and that in December 1999 Deputy Chairman Planning Commission had
pointed out to the Finance Ministry that the Budgetary Support for the Central Plan in the
first two years of the Ninth Plan was short of requirements and there was need for
stepping up level of budget support by 35 to 40 % in the remaining years of the Ninth
Five Year Plan . In October 2000, Mid Term Appraisal of the Ninth Five Year Plan
indicated that the Central Budget Support for the Ninth Plan could be only 87 % as
against 93 % realised during the Eighth Plan and that the total Public Investment will be
about 81 % of the Plan Target as against the realisation of 85.4 % in the Eighth Plan. The
Appraisal indicated that “due to serious slippages in public investment in physical and
social infrastructure the pipeline investment in the Tenth Plan will be low. This may
weaken the possibility of significant acceleration in the growth rate during the Tenth Plan
Period.”7
5. cited in Reviews of Recent Performance of Indian Economy - A Summary by Sujatha Suresh Asian Economic Review December 2000, p. 490. 6. Govt of India , Ministry of Finance . Economic Survey Feb 2001. 7. Planning Commission Mid Term Appraisal of the Ninth Five Year Plan, Oct 2000 Pg.1.
- 8 -
While there has been unanimity of views on the part of political leaders in positions of
power and Analysts in Economics and Public Finance that restoration of fiscal health of
the state and Central Governments should receive priority of attention and that continuing
fiscal deficits should be curbed, there is another aspect to be kept in view. The
International Monetary Fund and other organisations have no doubt designated ratios
such as Fiscal Deficit / Gross Domestic Product Ratio as indicators of financial prudence
of various governments. It is however necessary to appreciate that the composition of the
budget and direction of expenditure influence the growth of GDP, and that in one’s
anxiety to lower fiscal deficit / GDP ratio, governments should not inadvertently take
budgetary measures that affect the growth of GDP. It is therefore necessary to keep in
view the impact of Public expenditure on GDP growth and to ensure that emphasis is laid
on a good investment programme with accent on increasing domestic production and
strengthening the economy through significant contribution to the growth of GDP and
consequently on the fiscal deficit/GDP ratio and such other indicators.
It will be clear from an analysis of the quantum of fiscal and revenue deficit as also their
ratios to GDP that it is not the size of the deficit but the character of expenditure that is
important. For example in 1991, the gross fiscal deficit of Central Government stood at
Rs.44632 crores working out to 8.33 % of the GDP, but an higher gross deficit of Rs
60257 crores in 1993-94 worked out to be 7.44 per cent of the GDP, and that a similar
size deficit of Rs. 60243 crores in 1995-96 worked out to be 5.48 % of GDP.
It is in the light of such a diagnosis that one must welcome the indication in the Approach
paper to the Tenth Five Year Plan that “the broad strategy of the Plan will be to rely on a
combination of increased investment and improvement in efficiency based on unlocking
of hidden capacities in the economy, unleashing repressed productive forces and
entrepreneurial energies and upgrading technology in all sectors, all of which will
improve the efficiency in all economic activities.” Such a predication of “increased investment and improvement in efficiency “ can be
realised only by proper attention to the improvements in the management and quality of
public expenditure, both at the Central and the State levels. This study is devoted to the
investigation of public expenditure management in the various states in India, against the
backdrop of fiscal federalism, getting fine tuned for over fifty years, without yet attaining
orchestral harmony. There appear to be many discordant and disturbing notes in the air
but it is not yet all cacophony and still can be conducted into a fine symphony.
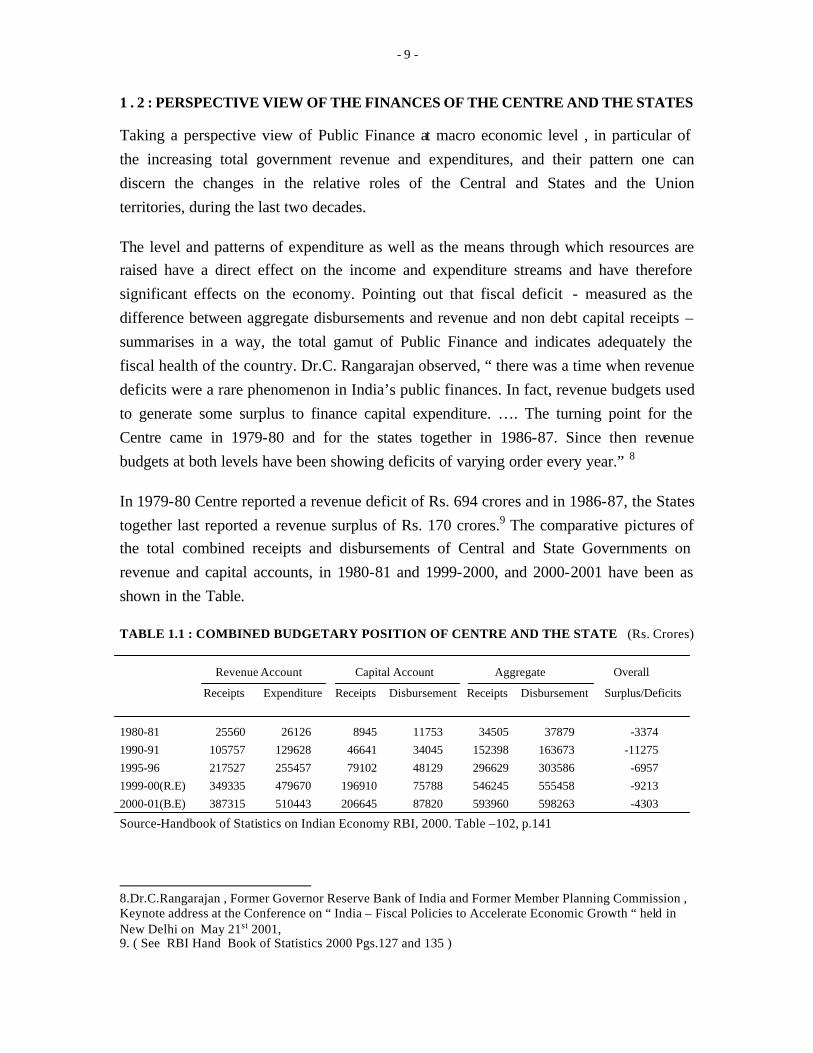
- 9 -
1 . 2 : PERSPECTIVE VIEW OF THE FINANCES OF THE CENTRE AND THE STATES
Taking a perspective view of Public Finance at macro economic level , in particular of
the increasing total government revenue and expenditures, and their pattern one can
discern the changes in the relative roles of the Central and States and the Union
territories, during the last two decades.
The level and patterns of expenditure as well as the means through which resources are
raised have a direct effect on the income and expenditure streams and have therefore
significant effects on the economy. Pointing out that fiscal deficit - measured as the
difference between aggregate disbursements and revenue and non debt capital receipts –
summarises in a way, the total gamut of Public Finance and indicates adequately the
fiscal health of the country. Dr.C. Rangarajan observed, “ there was a time when revenue
deficits were a rare phenomenon in India’s public finances. In fact, revenue budgets used
to generate some surplus to finance capital expenditure. …. The turning point for the
Centre came in 1979-80 and for the states together in 1986-87. Since then revenue
budgets at both levels have been showing deficits of varying order every year.” 8
In 1979-80 Centre reported a revenue deficit of Rs. 694 crores and in 1986-87, the States
together last reported a revenue surplus of Rs. 170 crores.9 The comparative pictures of
the total combined receipts and disbursements of Central and State Governments on
revenue and capital accounts, in 1980-81 and 1999-2000, and 2000-2001 have been as
shown in the Table.
TABLE 1.1 : COMBINED BUDGETARY POSITION OF CENTRE AND THE STATE (Rs. Crores)
Revenue Account Capital Account Aggregate Overall
Receipts Expenditure Receipts Disbursement Receipts Disbursement Surplus/Deficits
1980-81 25560 26126 8945 11753 34505 37879 -3374
1990-91 105757 129628 46641 34045 152398 163673 -11275
1995-96 217527 255457 79102 48129 296629 303586 -6957
1999-00(R.E) 349335 479670 196910 75788 546245 555458 -9213
2000-01(B.E) 387315 510443 206645 87820 593960 598263 -4303
Source-Handbook of Statistics on Indian Economy RBI, 2000. Table –102, p.141
8.Dr.C.Rangarajan , Former Governor Reserve Bank of India and Former Member Planning Commission , Keynote address at the Conference on “ India – Fiscal Policies to Accelerate Economic Growth “ held in New Delhi on May 21st 2001, 9. ( See RBI Hand Book of Statistics 2000 Pgs.127 and 135 )
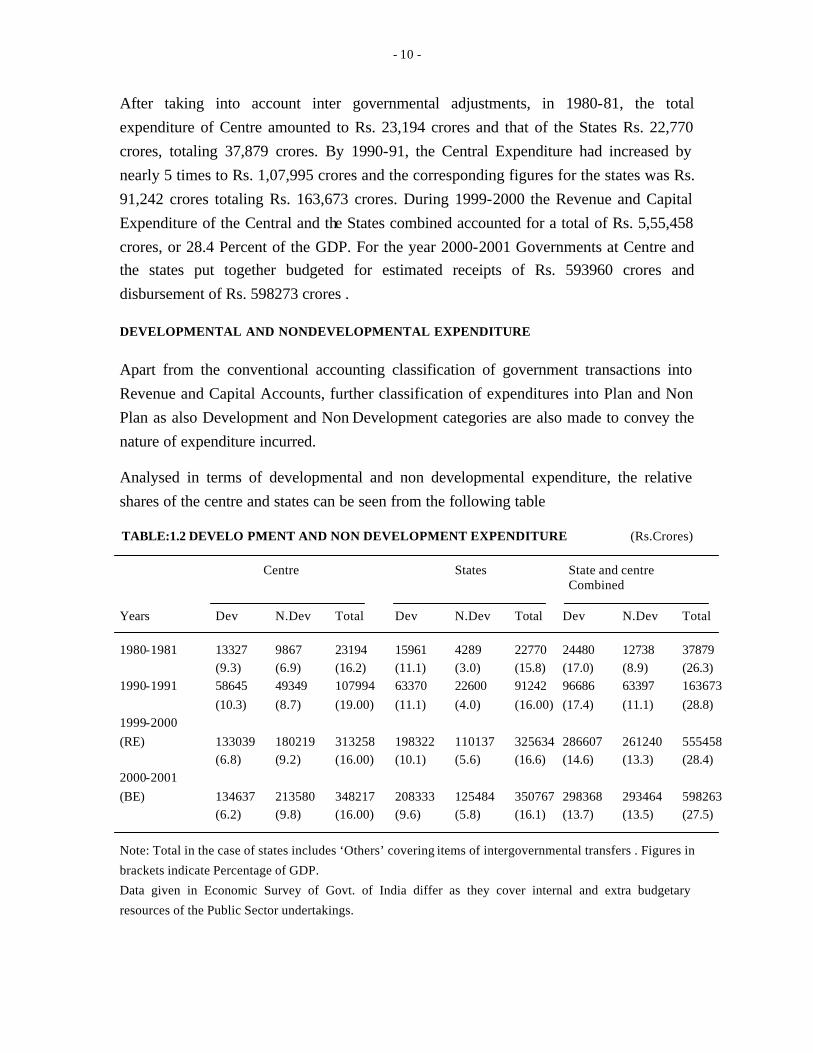
- 10 -
After taking into account inter governmental adjustments, in 1980-81, the total
expenditure of Centre amounted to Rs. 23,194 crores and that of the States Rs. 22,770
crores, totaling 37,879 crores. By 1990-91, the Central Expenditure had increased by
nearly 5 times to Rs. 1,07,995 crores and the corresponding figures for the states was Rs.
91,242 crores totaling Rs. 163,673 crores. During 1999-2000 the Revenue and Capital
Expenditure of the Central and the States combined accounted for a total of Rs. 5,55,458
crores, or 28.4 Percent of the GDP. For the year 2000-2001 Governments at Centre and
the states put together budgeted for estimated receipts of Rs. 593960 crores and
disbursement of Rs. 598273 crores .
DEVELOPMENTAL AND NONDEVELOPMENTAL EXPENDITURE
Apart from the conventional accounting classification of government transactions into
Revenue and Capital Accounts, further classification of expenditures into Plan and Non
Plan as also Development and Non Development categories are also made to convey the
nature of expenditure incurred. Analysed in terms of developmental and non developmental expenditure, the relative
shares of the centre and states can be seen from the following table TABLE:1.2 DEVELO PMENT AND NON DEVELOPMENT EXPENDITURE (Rs.Crores)
Centre States State and centre Combined Years Dev N.Dev Total Dev N.Dev Total Dev N.Dev Total
1980-1981 13327 9867 23194 15961 4289 22770 24480 12738 37879
(9.3) (6.9) (16.2) (11.1) (3.0) (15.8) (17.0) (8.9) (26.3)
1990-1991 58645 49349 107994 63370 22600 91242 96686 63397 163673
(10.3) (8.7) (19.00) (11.1) (4.0) (16.00) (17.4) (11.1) (28.8)
1999-2000
(RE) 133039 180219 313258 198322 110137 325634 286607 261240 555458
(6.8) (9.2) (16.00) (10.1) (5.6) (16.6) (14.6) (13.3) (28.4)
2000-2001
(BE) 134637 213580 348217 208333 125484 350767 298368 293464 598263
(6.2) (9.8) (16.00) (9.6) (5.8) (16.1) (13.7) (13.5) (27.5)
Note: Total in the case of states includes ‘Others’ covering items of intergovernmental transfers . Figures in
brackets indicate Percentage of GDP.
Data given in Economic Survey of Govt. of India differ as they cover internal and extra budgetary
resources of the Public Sector undertakings.

- 11 -
As pointed out in the Study of the Finances of State Government by EPW Research
foundation, by 1999-2000, as per revised Budget estimates the total expenditure of State
Governments, after taking into account inter Governmental transfers, amounted to Rs.
3,25,634 crores, 16.6% of GDP and had even overtaken the total expenditure of the
Centre placed at RS. 3,13,258, estimated at16% of the GDP.10
While the Total Expenditure of both States and Centre combined had increased from
26.3% of the GDP in 1980-81 to 28.8% of GDP in 1990-91, it came down during the mid
90’s before climbing again to 28.4% in 1999-2000(R.E.). A significant aspect of this is
that Development Expenditure had during the 80’s hovered around 17 to 18% of the GDP
before gradually coming from to 14.6% of GDP in 1999-2000 (R.E.).Correspondingly
Non Development Expenditure had increased from 8.9% of GDP in 1980-81 to 13.3% of
GDP in 1999-2000 (R.E). The share of development expenditure in States total
expenditure computed as a percentage of GDP had come down from 11.1 percent in
1980-81 to 9.4 percent in 1998-99 before climbing to 10.1 percent in 1999-’00. The fall
in the Development Expenditure at the Centre was far steeper from 9.3 percent in 1980-
81 to 6.8 percent in 1999-2000 (R.E). Though the 80’s were marked by steady increase
before the declining trend commenced in 90’s. Overall it is seen that at both centre and
the States the developmental expenditure had been steadily increasing in absolute value
but as a percentage of GDP the declining trend is common to both the Centre and States
during the 90’s.
PLAN AND NON-PLAN EXPENDITURE
Analysed, in terms of Plan and NonPlan categories of expenditure and their respective
shares in the total expenditures of the Centre and the States, the pattern over the four
years 1989-90, 1990-91, 1999-00 and 2000-01, both in absolute and relative to GDP
terms can be seen from the Table TABLE 1. 3 PLAN AND NON-PLAN EXPENDITURE (Rs.Crores)
Centre States Year Plan Non Plan Total Plan Nonplan Total 1989-90 28401 64505 92906 23012 53798 76810 (5.8) (13.17) (18.97) (4.7) (11.1) (15.8)
1990-91 29956 76761 106717 27433 63809 91242
(4.9) (13.2) (18.1) (4.8) (11.2) (16.0)
1999-00 76182 221902 298084 78156 247478 325634
(3.9) (11.3) (15.2) (4.0) (12.6) (16.6)
2000-01 88100 250387 338487 89074 261693 350767
BE (4.0) (11.5) (15.5) (4.1) (12.0) (16.1) 10 Finances of the States in its Time series presentation, E.P.W May 19/2001)
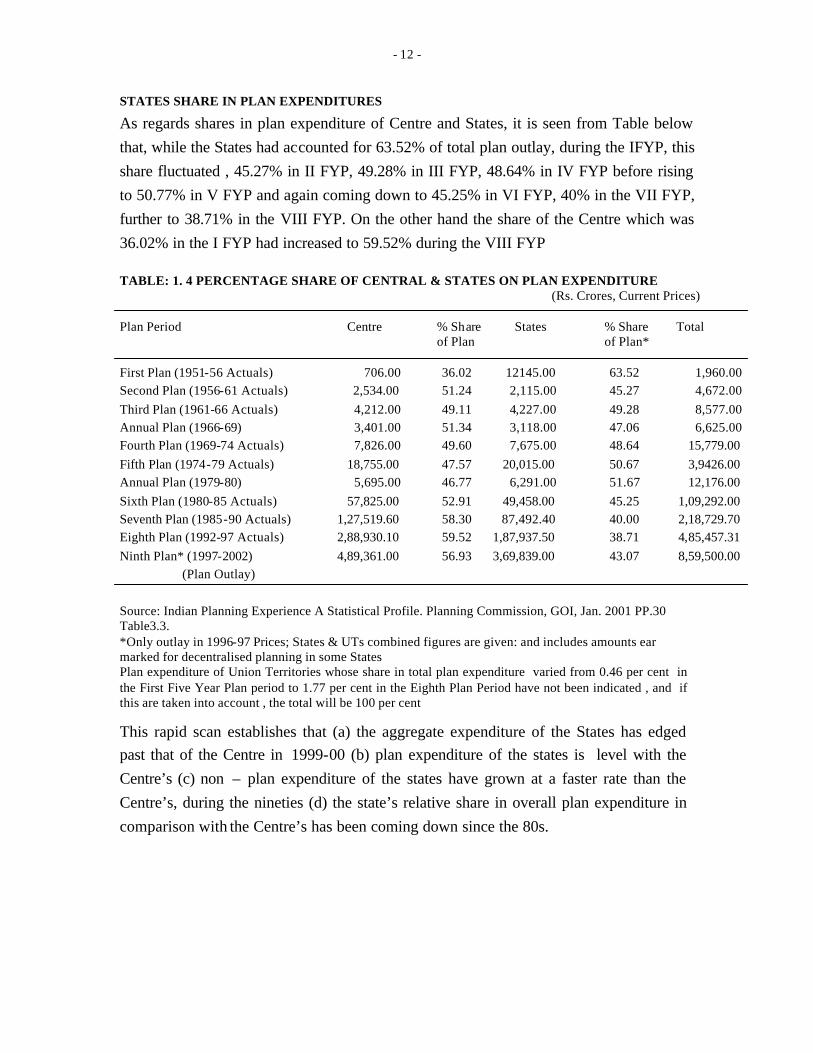
- 12 -
STATES SHARE IN PLAN EXPENDITURES As regards shares in plan expenditure of Centre and States, it is seen from Table below
that, while the States had accounted for 63.52% of total plan outlay, during the IFYP, this
share fluctuated , 45.27% in II FYP, 49.28% in III FYP, 48.64% in IV FYP before rising
to 50.77% in V FYP and again coming down to 45.25% in VI FYP, 40% in the VII FYP,
further to 38.71% in the VIII FYP. On the other hand the share of the Centre which was
36.02% in the I FYP had increased to 59.52% during the VIII FYP TABLE: 1. 4 PERCENTAGE SHARE OF CENTRAL & STATES ON PLAN EXPENDITURE
(Rs. Crores, Current Prices) Plan Period Centre % Share States % Share Total of Plan of Plan* First Plan (1951-56 Actuals) 706.00 36.02 12145.00 63.52 1,960.00
Second Plan (1956-61 Actuals) 2,534.00 51.24 2,115.00 45.27 4,672.00
Third Plan (1961-66 Actuals) 4,212.00 49.11 4,227.00 49.28 8,577.00
Annual Plan (1966-69) 3,401.00 51.34 3,118.00 47.06 6,625.00
Fourth Plan (1969-74 Actuals) 7,826.00 49.60 7,675.00 48.64 15,779.00
Fifth Plan (1974-79 Actuals) 18,755.00 47.57 20,015.00 50.67 3,9426.00
Annual Plan (1979-80) 5,695.00 46.77 6,291.00 51.67 12,176.00
Sixth Plan (1980-85 Actuals) 57,825.00 52.91 49,458.00 45.25 1,09,292.00
Seventh Plan (1985-90 Actuals) 1,27,519.60 58.30 87,492.40 40.00 2,18,729.70
Eighth Plan (1992-97 Actuals) 2,88,930.10 59.52 1,87,937.50 38.71 4,85,457.31
Ninth Plan* (1997-2002) 4,89,361.00 56.93 3,69,839.00 43.07 8,59,500.00
(Plan Outlay)
Source: Indian Planning Experience A Statistical Profile. Planning Commission, GOI, Jan. 2001 PP.30 Table3.3. *Only outlay in 1996-97 Prices; States & UTs combined figures are given: and includes amounts ear marked for decentralised planning in some States Plan expenditure of Union Territories whose share in total plan expenditure varied from 0.46 per cent in the First Five Year Plan period to 1.77 per cent in the Eighth Plan Period have not been indicated , and if this are taken into account , the total will be 100 per cent
This rapid scan establishes that (a) the aggregate expenditure of the States has edged
past that of the Centre in 1999-00 (b) plan expenditure of the states is level with the
Centre’s (c) non – plan expenditure of the states have grown at a faster rate than the
Centre’s, during the nineties (d) the state’s relative share in overall plan expenditure in
comparison with the Centre’s has been coming down since the 80s.
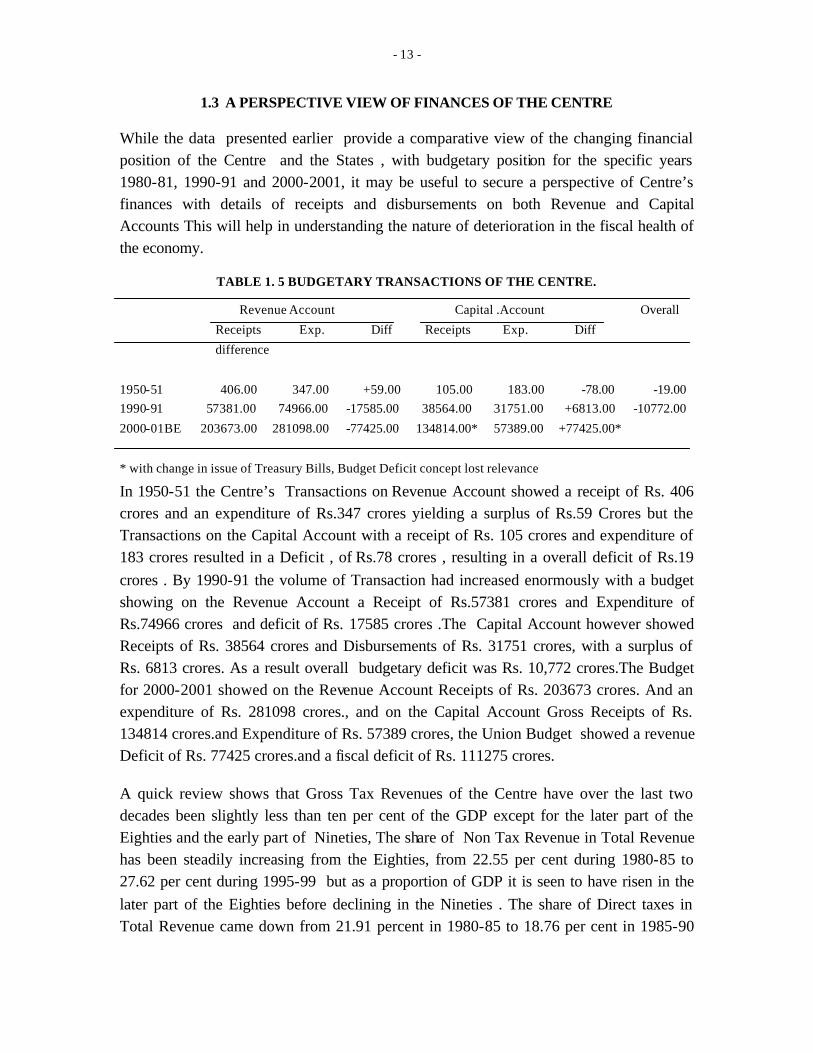
- 13 -
1.3 A PERSPECTIVE VIEW OF FINANCES OF THE CENTRE
While the data presented earlier provide a comparative view of the changing financial
position of the Centre and the States , with budgetary position for the specific years
1980-81, 1990-91 and 2000-2001, it may be useful to secure a perspective of Centre’s
finances with details of receipts and disbursements on both Revenue and Capital
Accounts This will help in understanding the nature of deterioration in the fiscal health of
the economy.
TABLE 1. 5 BUDGETARY TRANSACTIONS OF THE CENTRE.
Revenue Account Capital .Account Overall
Receipts Exp. Diff Receipts Exp. Diff
difference
1950-51 406.00 347.00 +59.00 105.00 183.00 -78.00 -19.00
1990-91 57381.00 74966.00 -17585.00 38564.00 31751.00 +6813.00 -10772.00
2000-01BE 203673.00 281098.00 -77425.00 134814.00* 57389.00 +77425.00*
* with change in issue of Treasury Bills, Budget Deficit concept lost relevance
In 1950-51 the Centre’s Transactions on Revenue Account showed a receipt of Rs. 406
crores and an expenditure of Rs.347 crores yielding a surplus of Rs.59 Crores but the
Transactions on the Capital Account with a receipt of Rs. 105 crores and expenditure of
183 crores resulted in a Deficit , of Rs.78 crores , resulting in a overall deficit of Rs.19
crores . By 1990-91 the volume of Transaction had increased enormously with a budget
showing on the Revenue Account a Receipt of Rs.57381 crores and Expenditure of
Rs.74966 crores and deficit of Rs. 17585 crores .The Capital Account however showed
Receipts of Rs. 38564 crores and Disbursements of Rs. 31751 crores, with a surplus of
Rs. 6813 crores. As a result overall budgetary deficit was Rs. 10,772 crores.The Budget
for 2000-2001 showed on the Revenue Account Receipts of Rs. 203673 crores. And an
expenditure of Rs. 281098 crores., and on the Capital Account Gross Receipts of Rs.
134814 crores.and Expenditure of Rs. 57389 crores, the Union Budget showed a revenue
Deficit of Rs. 77425 crores.and a fiscal deficit of Rs. 111275 crores.
A quick review shows that Gross Tax Revenues of the Centre have over the last two
decades been slightly less than ten per cent of the GDP except for the later part of the
Eighties and the early part of Nineties, The share of Non Tax Revenue in Total Revenue
has been steadily increasing from the Eighties, from 22.55 per cent during 1980-85 to
27.62 per cent during 1995-99 but as a proportion of GDP it is seen to have risen in the
later part of the Eighties before declining in the Nineties . The share of Direct taxes in
Total Revenue came down from 21.91 percent in 1980-85 to 18.76 per cent in 1985-90
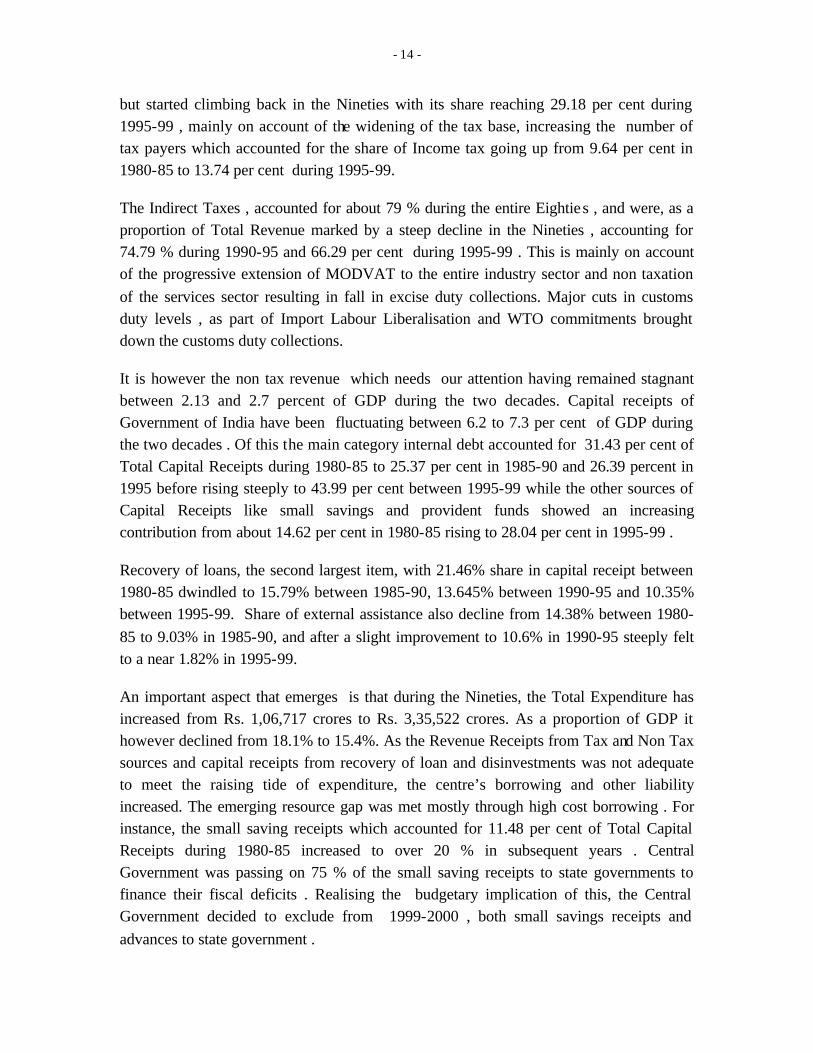
- 14 -
but started climbing back in the Nineties with its share reaching 29.18 per cent during
1995-99 , mainly on account of the widening of the tax base, increasing the number of
tax payers which accounted for the share of Income tax going up from 9.64 per cent in
1980-85 to 13.74 per cent during 1995-99.
The Indirect Taxes , accounted for about 79 % during the entire Eighties , and were, as a
proportion of Total Revenue marked by a steep decline in the Nineties , accounting for
74.79 % during 1990-95 and 66.29 per cent during 1995-99 . This is mainly on account
of the progressive extension of MODVAT to the entire industry sector and non taxation
of the services sector resulting in fall in excise duty collections. Major cuts in customs
duty levels , as part of Import Labour Liberalisation and WTO commitments brought
down the customs duty collections.
It is however the non tax revenue which needs our attention having remained stagnant
between 2.13 and 2.7 percent of GDP during the two decades. Capital receipts of
Government of India have been fluctuating between 6.2 to 7.3 per cent of GDP during
the two decades . Of this the main category internal debt accounted for 31.43 per cent of
Total Capital Receipts during 1980-85 to 25.37 per cent in 1985-90 and 26.39 percent in
1995 before rising steeply to 43.99 per cent between 1995-99 while the other sources of
Capital Receipts like small savings and provident funds showed an increasing
contribution from about 14.62 per cent in 1980-85 rising to 28.04 per cent in 1995-99 .
Recovery of loans, the second largest item, with 21.46% share in capital receipt between
1980-85 dwindled to 15.79% between 1985-90, 13.645% between 1990-95 and 10.35%
between 1995-99. Share of external assistance also decline from 14.38% between 1980-
85 to 9.03% in 1985-90, and after a slight improvement to 10.6% in 1990-95 steeply felt
to a near 1.82% in 1995-99.
An important aspect that emerges is that during the Nineties, the Total Expenditure has
increased from Rs. 1,06,717 crores to Rs. 3,35,522 crores. As a proportion of GDP it
however declined from 18.1% to 15.4%. As the Revenue Receipts from Tax and Non Tax
sources and capital receipts from recovery of loan and disinvestments was not adequate
to meet the raising tide of expenditure, the centre’s borrowing and other liability
increased. The emerging resource gap was met mostly through high cost borrowing . For
instance, the small saving receipts which accounted for 11.48 per cent of Total Capital
Receipts during 1980-85 increased to over 20 % in subsequent years . Central
Government was passing on 75 % of the small saving receipts to state governments to
finance their fiscal deficits . Realising the budgetary implication of this, the Central
Government decided to exclude from 1999-2000 , both small savings receipts and
advances to state government .
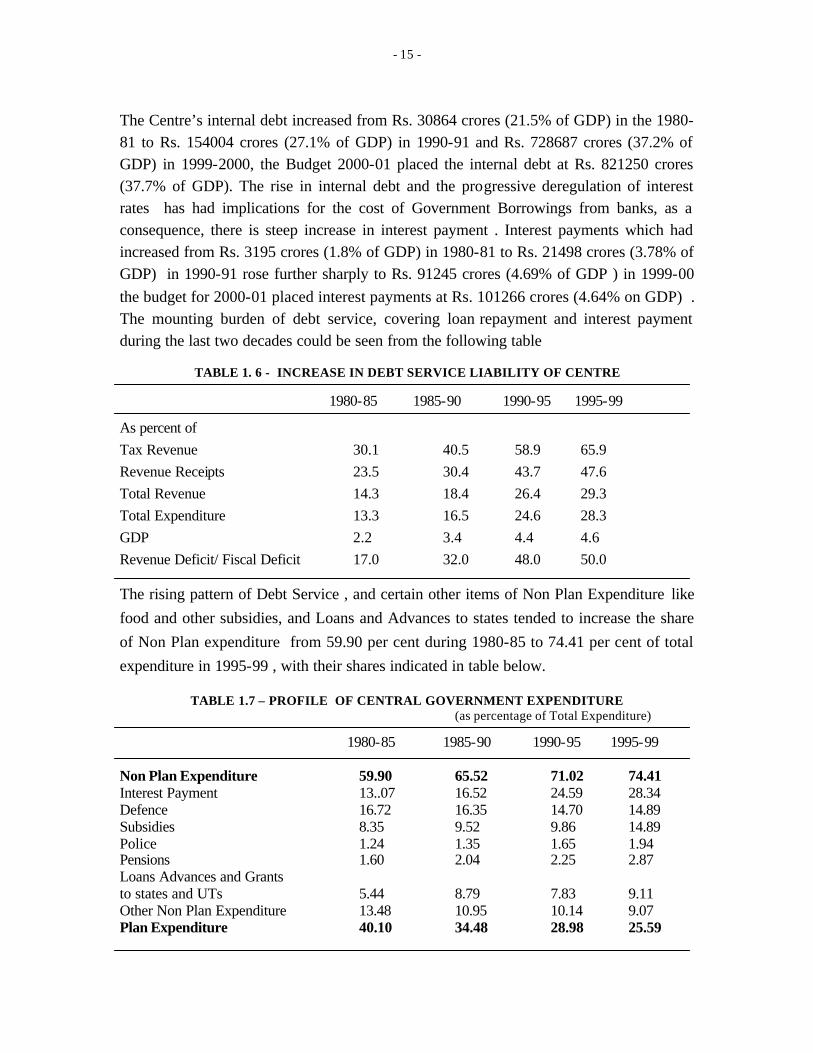
- 15 -
The Centre’s internal debt increased from Rs. 30864 crores (21.5% of GDP) in the 1980-
81 to Rs. 154004 crores (27.1% of GDP) in 1990-91 and Rs. 728687 crores (37.2% of
GDP) in 1999-2000, the Budget 2000-01 placed the internal debt at Rs. 821250 crores
(37.7% of GDP). The rise in internal debt and the progressive deregulation of interest
rates has had implications for the cost of Government Borrowings from banks, as a
consequence, there is steep increase in interest payment . Interest payments which had
increased from Rs. 3195 crores (1.8% of GDP) in 1980-81 to Rs. 21498 crores (3.78% of
GDP) in 1990-91 rose further sharply to Rs. 91245 crores (4.69% of GDP ) in 1999-00
the budget for 2000-01 placed interest payments at Rs. 101266 crores (4.64% on GDP) .
The mounting burden of debt service, covering loan repayment and interest payment
during the last two decades could be seen from the following table
TABLE 1. 6 - INCREASE IN DEBT SERVICE LIABILITY OF CENTRE 1980-85 1985-90 1990-95 1995-99
As percent of
Tax Revenue 30.1 40.5 58.9 65.9
Revenue Receipts 23.5 30.4 43.7 47.6
Total Revenue 14.3 18.4 26.4 29.3
Total Expenditure 13.3 16.5 24.6 28.3
GDP 2.2 3.4 4.4 4.6
Revenue Deficit/ Fiscal Deficit 17.0 32.0 48.0 50.0 The rising pattern of Debt Service , and certain other items of Non Plan Expenditure like
food and other subsidies, and Loans and Advances to states tended to increase the share
of Non Plan expenditure from 59.90 per cent during 1980-85 to 74.41 per cent of total
expenditure in 1995-99 , with their shares indicated in table below.
TABLE 1.7 – PROFILE OF CENTRAL GOVERNMENT EXPENDITURE (as percentage of Total Expenditure)
1980-85 1985-90 1990-95 1995-99 Non Plan Expenditure 59.90 65.52 71.02 74.41 Interest Payment 13..07 16.52 24.59 28.34 Defence 16.72 16.35 14.70 14.89 Subsidies 8.35 9.52 9.86 14.89 Police 1.24 1.35 1.65 1.94 Pensions 1.60 2.04 2.25 2.87 Loans Advances and Grants to states and UTs 5.44 8.79 7.83 9.11 Other Non Plan Expenditure 13.48 10.95 10.14 9.07 Plan Expenditure 40.10 34.48 28.98 25.59
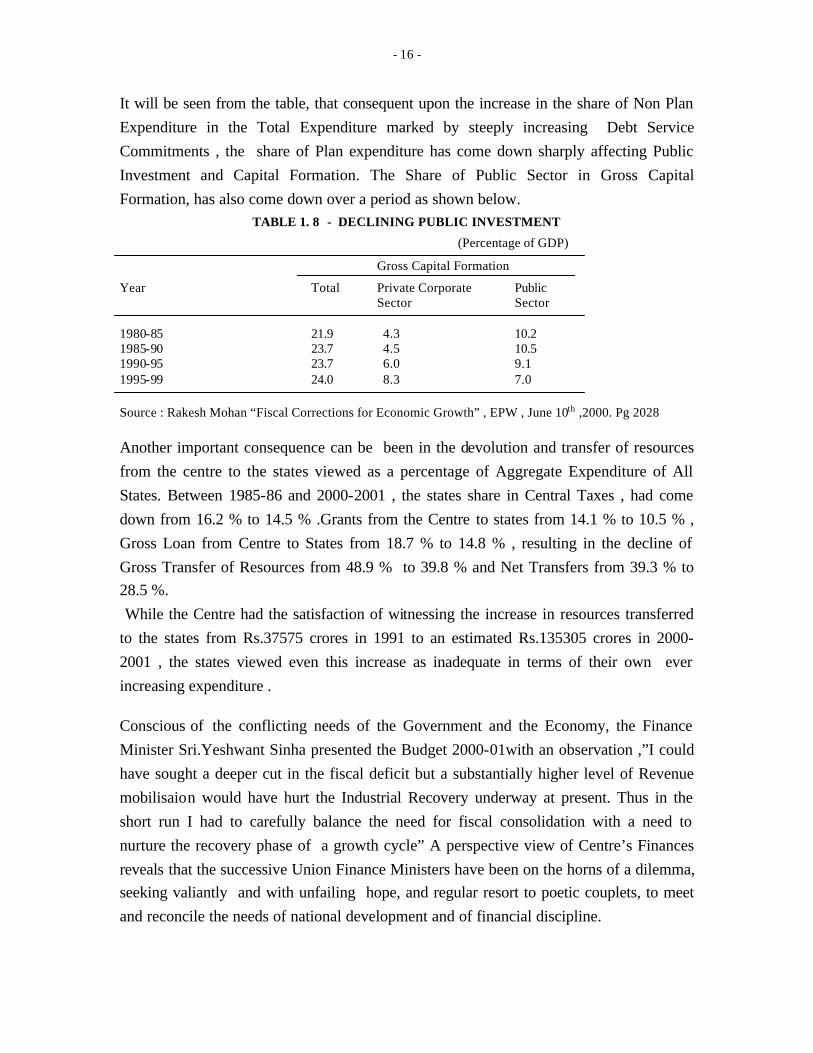
- 16 -
It will be seen from the table, that consequent upon the increase in the share of Non Plan
Expenditure in the Total Expenditure marked by steeply increasing Debt Service
Commitments , the share of Plan expenditure has come down sharply affecting Public
Investment and Capital Formation. The Share of Public Sector in Gross Capital
Formation, has also come down over a period as shown below.
TABLE 1. 8 - DECLINING PUBLIC INVESTMENT
(Percentage of GDP)
Gross Capital Formation
Year Total Private Corporate Public Sector Sector 1980-85 21.9 4.3 10.2 1985-90 23.7 4.5 10.5 1990-95 23.7 6.0 9.1 1995-99 24.0 8.3 7.0
Source : Rakesh Mohan “Fiscal Corrections for Economic Growth” , EPW , June 10th ,2000. Pg 2028
Another important consequence can be been in the devolution and transfer of resources
from the centre to the states viewed as a percentage of Aggregate Expenditure of All
States. Between 1985-86 and 2000-2001 , the states share in Central Taxes , had come
down from 16.2 % to 14.5 % .Grants from the Centre to states from 14.1 % to 10.5 % ,
Gross Loan from Centre to States from 18.7 % to 14.8 % , resulting in the decline of
Gross Transfer of Resources from 48.9 % to 39.8 % and Net Transfers from 39.3 % to
28.5 %.
While the Centre had the satisfaction of witnessing the increase in resources transferred
to the states from Rs.37575 crores in 1991 to an estimated Rs.135305 crores in 2000-
2001 , the states viewed even this increase as inadequate in terms of their own ever
increasing expenditure .
Conscious of the conflicting needs of the Government and the Economy, the Finance
Minister Sri.Yeshwant Sinha presented the Budget 2000-01with an observation ,”I could
have sought a deeper cut in the fiscal deficit but a substantially higher level of Revenue
mobilisaion would have hurt the Industrial Recovery underway at present. Thus in the
short run I had to carefully balance the need for fiscal consolidation with a need to
nurture the recovery phase of a growth cycle” A perspective view of Centre’s Finances
reveals that the successive Union Finance Ministers have been on the horns of a dilemma,
seeking valiantly and with unfailing hope, and regular resort to poetic couplets, to meet
and reconcile the needs of national development and of financial discipline.
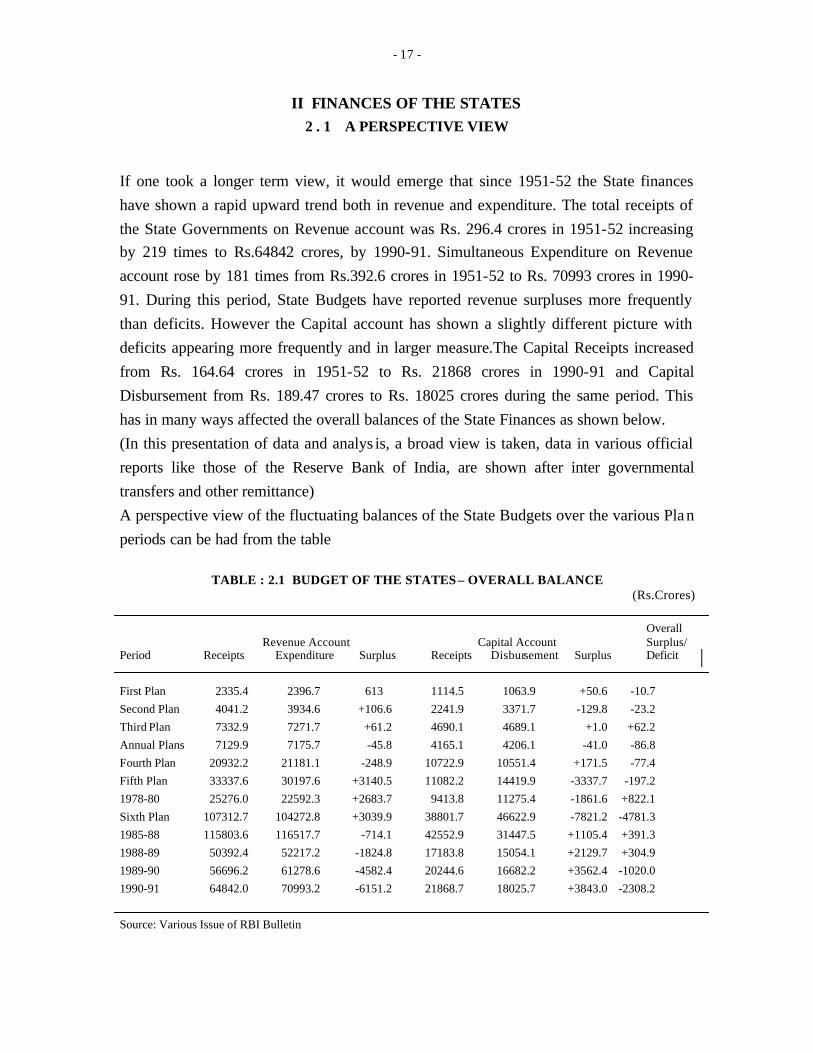
- 17 -
II FINANCES OF THE STATES
2 . 1 A PERSPECTIVE VIEW
If one took a longer term view, it would emerge that since 1951-52 the State finances
have shown a rapid upward trend both in revenue and expenditure. The total receipts of
the State Governments on Revenue account was Rs. 296.4 crores in 1951-52 increasing
by 219 times to Rs.64842 crores, by 1990-91. Simultaneous Expenditure on Revenue
account rose by 181 times from Rs.392.6 crores in 1951-52 to Rs. 70993 crores in 1990-
91. During this period, State Budgets have reported revenue surpluses more frequently
than deficits. However the Capital account has shown a slightly different picture with
deficits appearing more frequently and in larger measure.The Capital Receipts increased
from Rs. 164.64 crores in 1951-52 to Rs. 21868 crores in 1990-91 and Capital
Disbursement from Rs. 189.47 crores to Rs. 18025 crores during the same period. This
has in many ways affected the overall balances of the State Finances as shown below.
(In this presentation of data and analys is, a broad view is taken, data in various official
reports like those of the Reserve Bank of India, are shown after inter governmental
transfers and other remittance)
A perspective view of the fluctuating balances of the State Budgets over the various Plan
periods can be had from the table
TABLE : 2.1 BUDGET OF THE STATES – OVERALL BALANCE
(Rs.Crores)
Overall Revenue Account Capital Account Surplus/ Period Receipts Expenditure Surplus Receipts Disbursement Surplus Deficit
First Plan 2335.4 2396.7 613 1114.5 1063.9 +50.6 -10.7
Second Plan 4041.2 3934.6 +106.6 2241.9 3371.7 -129.8 -23.2
Third Plan 7332.9 7271.7 +61.2 4690.1 4689.1 +1.0 +62.2
Annual Plans 7129.9 7175.7 -45.8 4165.1 4206.1 -41.0 -86.8
Fourth Plan 20932.2 21181.1 -248.9 10722.9 10551.4 +171.5 -77.4
Fifth Plan 33337.6 30197.6 +3140.5 11082.2 14419.9 -3337.7 -197.2
1978-80 25276.0 22592.3 +2683.7 9413.8 11275.4 -1861.6 +822.1
Sixth Plan 107312.7 104272.8 +3039.9 38801.7 46622.9 -7821.2 -4781.3
1985-88 115803.6 116517.7 -714.1 42552.9 31447.5 +1105.4 +391.3
1988-89 50392.4 52217.2 -1824.8 17183.8 15054.1 +2129.7 +304.9
1989-90 56696.2 61278.6 -4582.4 20244.6 16682.2 +3562.4 -1020.0
1990-91 64842.0 70993.2 -6151.2 21868.7 18025.7 +3843.0 -2308.2
Source: Various Issue of RBI Bulletin
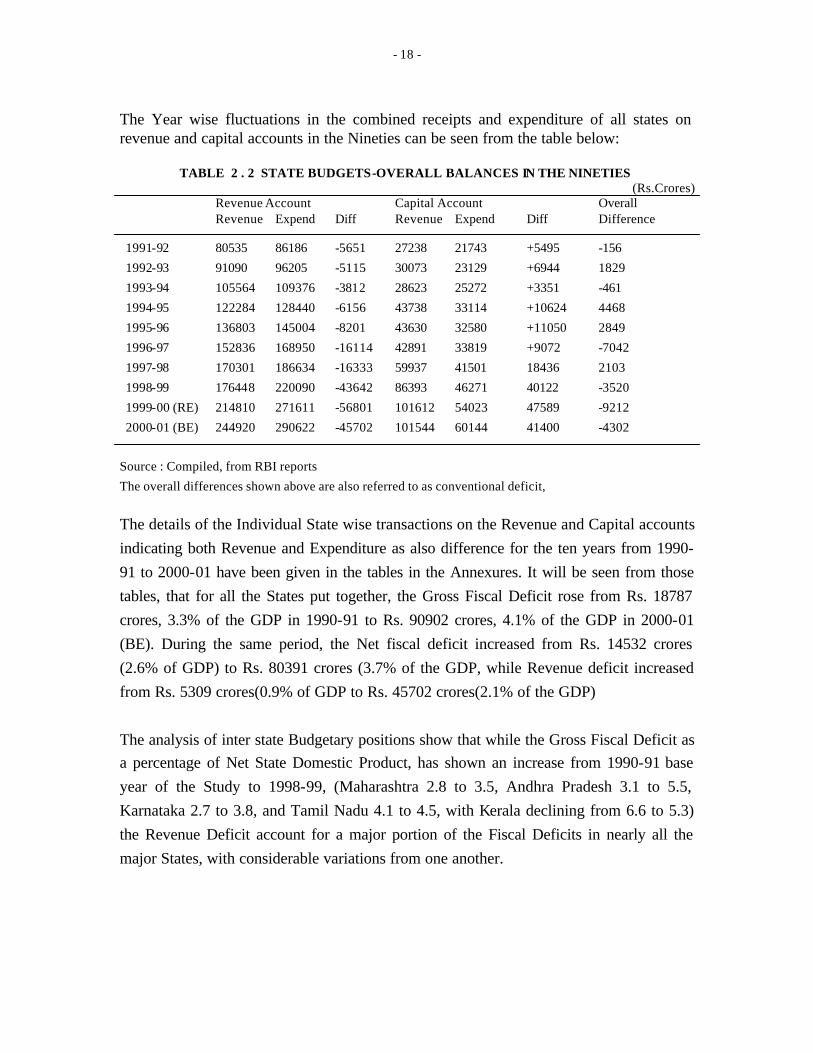
- 18 -
The Year wise fluctuations in the combined receipts and expenditure of all states on revenue and capital accounts in the Nineties can be seen from the table below:
TABLE 2 . 2 STATE BUDGETS-OVERALL BALANCES IN THE NINETIES (Rs.Crores)
Revenue Account Capital Account Overall Revenue Expend Diff Revenue Expend Diff Difference 1991-92 80535 86186 -5651 27238 21743 +5495 -156
1992-93 91090 96205 -5115 30073 23129 +6944 1829
1993-94 105564 109376 -3812 28623 25272 +3351 -461
1994-95 122284 128440 -6156 43738 33114 +10624 4468
1995-96 136803 145004 -8201 43630 32580 +11050 2849
1996-97 152836 168950 -16114 42891 33819 +9072 -7042
1997-98 170301 186634 -16333 59937 41501 18436 2103
1998-99 176448 220090 -43642 86393 46271 40122 -3520
1999-00 (RE) 214810 271611 -56801 101612 54023 47589 -9212
2000-01 (BE) 244920 290622 -45702 101544 60144 41400 -4302
Source : Compiled, from RBI reports
The overall differences shown above are also referred to as conventional deficit,
The details of the Individual State wise transactions on the Revenue and Capital accounts
indicating both Revenue and Expenditure as also difference for the ten years from 1990-
91 to 2000-01 have been given in the tables in the Annexures. It will be seen from those
tables, that for all the States put together, the Gross Fiscal Deficit rose from Rs. 18787
crores, 3.3% of the GDP in 1990-91 to Rs. 90902 crores, 4.1% of the GDP in 2000-01
(BE). During the same period, the Net fiscal deficit increased from Rs. 14532 crores
(2.6% of GDP) to Rs. 80391 crores (3.7% of the GDP, while Revenue deficit increased
from Rs. 5309 crores(0.9% of GDP to Rs. 45702 crores(2.1% of the GDP)
The analysis of inter state Budgetary positions show that while the Gross Fiscal Deficit as
a percentage of Net State Domestic Product, has shown an increase from 1990-91 base
year of the Study to 1998-99, (Maharashtra 2.8 to 3.5, Andhra Pradesh 3.1 to 5.5,
Karnataka 2.7 to 3.8, and Tamil Nadu 4.1 to 4.5, with Kerala declining from 6.6 to 5.3)
the Revenue Deficit account for a major portion of the Fiscal Deficits in nearly all the
major States, with considerable variations from one another.
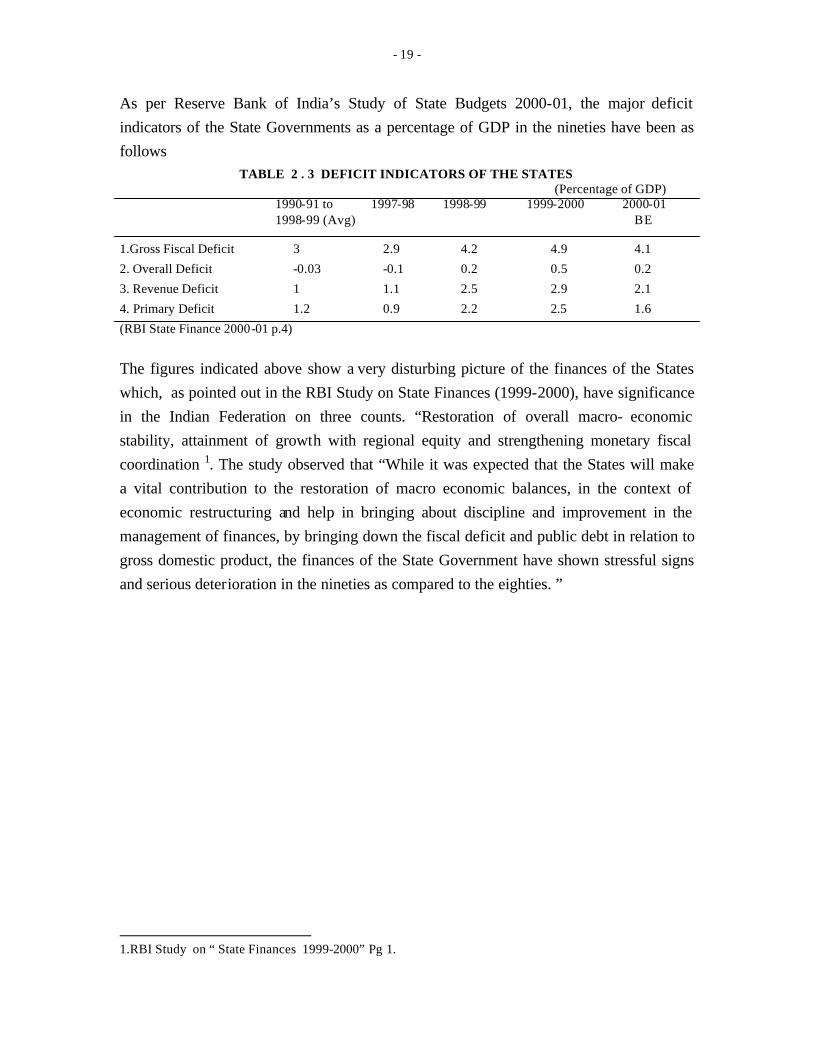
- 19 -
As per Reserve Bank of India’s Study of State Budgets 2000-01, the major deficit
indicators of the State Governments as a percentage of GDP in the nineties have been as
follows
TABLE 2 . 3 DEFICIT INDICATORS OF THE STATES (Percentage of GDP)
1990-91 to 1997-98 1998-99 1999-2000 2000-01 1998-99 (Avg) BE 1.Gross Fiscal Deficit 3 2.9 4.2 4.9 4.1
2. Overall Deficit -0.03 -0.1 0.2 0.5 0.2
3. Revenue Deficit 1 1.1 2.5 2.9 2.1
4. Primary Deficit 1.2 0.9 2.2 2.5 1.6
(RBI State Finance 2000-01 p.4)
The figures indicated above show a very disturbing picture of the finances of the States
which, as pointed out in the RBI Study on State Finances (1999-2000), have significance
in the Indian Federation on three counts. “Restoration of overall macro- economic
stability, attainment of growth with regional equity and strengthening monetary fiscal
coordination 1. The study observed that “While it was expected that the States will make
a vital contribution to the restoration of macro economic balances, in the context of
economic restructuring and help in bringing about discipline and improvement in the
management of finances, by bringing down the fiscal deficit and public debt in relation to
gross domestic product, the finances of the State Government have shown stressful signs
and serious deterioration in the nineties as compared to the eighties. ”
1.RBI Study on “ State Finances 1999-2000” Pg 1.
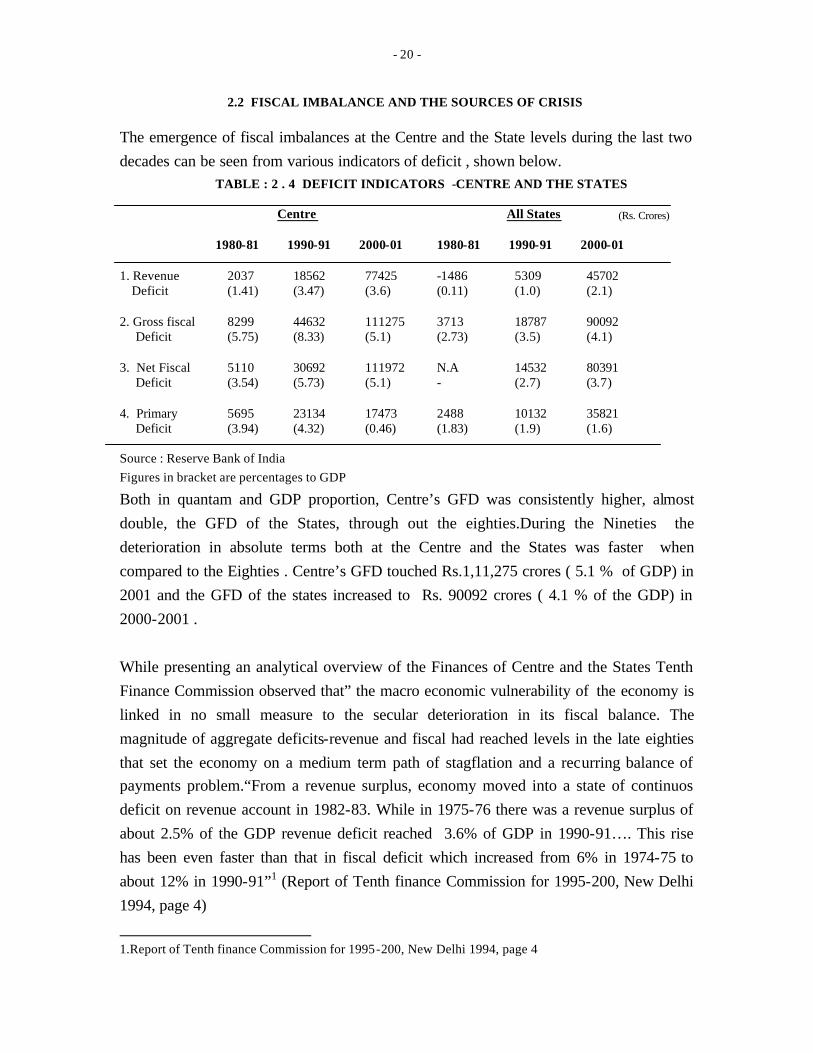
- 20 -
2.2 FISCAL IMBALANCE AND THE SOURCES OF CRISIS
The emergence of fiscal imbalances at the Centre and the State levels during the last two
decades can be seen from various indicators of deficit , shown below.
TABLE : 2 . 4 DEFICIT INDICATORS -CENTRE AND THE STATES Centre All States (Rs. Crores)
1980-81 1990-91 2000-01 1980-81 1990-91 2000-01 1. Revenue 2037 18562 77425 -1486 5309 45702 Deficit (1.41) (3.47) (3.6) (0.11) (1.0) (2.1) 2. Gross fiscal 8299 44632 111275 3713 18787 90092 Deficit (5.75) (8.33) (5.1) (2.73) (3.5) (4.1) 3. Net Fiscal 5110 30692 111972 N.A 14532 80391 Deficit (3.54) (5.73) (5.1) - (2.7) (3.7) 4. Primary 5695 23134 17473 2488 10132 35821 Deficit (3.94) (4.32) (0.46) (1.83) (1.9) (1.6) Source : Reserve Bank of India Figures in bracket are percentages to GDP
Both in quantam and GDP proportion, Centre’s GFD was consistently higher, almost
double, the GFD of the States, through out the eighties.During the Nineties the
deterioration in absolute terms both at the Centre and the States was faster when
compared to the Eighties . Centre’s GFD touched Rs.1,11,275 crores ( 5.1 % of GDP) in
2001 and the GFD of the states increased to Rs. 90092 crores ( 4.1 % of the GDP) in
2000-2001 .
While presenting an analytical overview of the Finances of Centre and the States Tenth
Finance Commission observed that” the macro economic vulnerability of the economy is
linked in no small measure to the secular deterioration in its fiscal balance. The
magnitude of aggregate deficits-revenue and fiscal had reached levels in the late eighties
that set the economy on a medium term path of stagflation and a recurring balance of
payments problem.“From a revenue surplus, economy moved into a state of continuos
deficit on revenue account in 1982-83. While in 1975-76 there was a revenue surplus of
about 2.5% of the GDP revenue deficit reached 3.6% of GDP in 1990-91…. This rise
has been even faster than that in fiscal deficit which increased from 6% in 1974-75 to
about 12% in 1990-91”1 (Report of Tenth finance Commission for 1995-200, New Delhi
1994, page 4)
1.Report of Tenth finance Commission for 1995-200, New Delhi 1994, page 4
- 21 -
Dealing with the same issue Shri S.P. Gupta and A.K.Sarkar have pointed out that, “at the
Central level genesis of escalating fiscal deficit lies primarily in the burgeoning revenue
deficits. The rate of growth of Central Government Expenditure accelerated significantly
from 2.6% in the Seventies to 10.8% during the Eighties . The acceleration in Central
spending was visible in all the three functional categories – Economic Services, Social
Services and General Services. This acceleration in expenditure was the primary cause of
increasing fiscal deficits. The soft Budget constraint continued to operate at the Central
level during this period.”
As regards the expenditure of the states S.P.Gupta and A.K. Sarkar2 observe that, “akin
to Centre the States in the eighties experienced fast enlarging deficit primarily on the
revenue account. During this period revenue expenditure of the States grew at the average
of 17.6% per annum, much faster than the growth of the revenue receipts. However, as
distinct from the Centre, the Budget constraint at the State level hardened by the mid
eighties itself. This in part was due to the introduction of the Overdraft Regulation
Scheme (ORS) in the mid eighties and also regulation of market borrowing. The
Overdraft Regulation Scheme limited the extent to which a state could incur overdrafts
during a financial year. This constraint translated into a cut in the expenditure on the
capital account of the State Budgets.There was a marked deceleration in the growth of
Capital expenditure at the State level from 8.8 percent to 3.9 percent between 1980 and
1987”.
In NIPFP study titled “ Government Expenditure in India Level Growth and
Composition, M.Govinda Rao and T.K.Sen 3 have attributed the worsening of the fiscal
position of the states to the increase in expenditure on Quasi Public Goods., subsidies and
Transfers following high expenditure growth at the Central level, Proliferation of
Centrally sponsored schemes since the early Eighties requiring matching contribution
from the states .
But as pointed out in the Annual Report of the Reserve Bank of India for 1991-92, the
overall resource gap of the States began to increase mainly on account of worsening
deficits on the Revenue Account since 1986-87 and increasing resort to the Financing of
2. S.P Gupta and A.K. Sarkar, ‘Fiscal Correction and Human Resource Development’ EPW, March 26,
1994, pp. 741-751
3.NIPFP study “ Government Expenditure in India Level Growth and Composition , M.Govinda Rao and T.K.Sen (1993)
- 22 -
gap through loans from Centre Government, Market Borrowings, State Provident Funds
etc. 4
That this trend continued has been confirmed by the RBI’s studies of the State Finances
in the latter years. The Report “Finances of State Government 1995-96,” observed that
“the aggregate consolidated budgetary position of State Government in –95-’96 reflected
an acceleration of the structural weakness in their finances. A matter of particular concern
is the deficit of the revenue account which persists for the ninth year in succession and is
estimated to increase by nearly 36 percent to Rs. 10,461.7 crores in 1995-96”. Seven
State Governments show a persistent deficit in the revenue accounts viz. Bihar (Since
‘89-’90), Kerala (‘83-‘84) Maharashtra (‘88-’89), Orissa (‘84-’85), Punjab (‘87-’88),
Tamilnadu (‘87-’88), Uttar Pradesh (‘88-’89) and West Bengal (‘86-’87)”.5
The Report had pointed out that all the key deficit indicators, GFD, Revenue Deficit, and
Conventional Deficit in 1995-96 were higher than in the previous years and observed that
“the deficit indicators, while serving as useful information variables, do not capture a
vital aspect of State Government Finances – their resource gap in the context of inter
institutional transactions. In particular, the “artificial” stagnancy in the level of GFD of
the States expressed as a proportion of the GDP, (at around 3%) is indicative of the
constitutional restraints on the borrowing powers of the States. As such it may not be a
realistic profile of the imbalance in their finances. The revenue deficit on its part does not
distinguish between receipts obtained from sources at the direct disposal of the States and
those which flow from other institutions, even if these are governed by the establish legal
principles (ibid page 993)
The RBI Study also pointed out the need for an indicator of resource gap which
supplements the traditional deficit methods, to provide an idea of the extent of reliance of
the States on resources mobilised through arrangements other than those at their disposal
and further advised that Central devolution and transfers and the fiscal (Tax)
performances of the States should, in principle, be positively correlated. However there
have been other analysts who felt that a holistic view of States Finances, including
statutory transfers, should be taken. The debate on the desirability of what has come to be
known as “Revenue gap filling approach” of the Finance Commission, covers a wide
range of issues that may need a more detailed examination, than could be accommodated
4.Reserve Bank of India, Annual Report 1991-92, October 1992 Page 45 5. State Finances 1995-96, RBI Bulletin, Dec. 1995 page 1000

- 23 -
within the Study devoted mainly to Public Expenditure Management. It should however
be noted that this approach has had a significant impact on the State Governments’
approach to fiscal management.
The Tenth Finance Commission had however noted, “the change in the fiscal regime
from 1982-83 has meant that what was earlier a non debt creating source of financing has
become a source of rising internal indebtedness. In the other words, while Revenue
Receipts used to cover a part of Capital Expenditure, an increasing part of the Capital
receipts are used to finance revenue expenditure. The consequent build up of public debt
and interest burden which is now the largest and fastest growing them of expenditure
further fuelled the growth of revenue expenditure. This lead to a spiral of growing
deficits, rising debt, escalating interest costs and further expansion of deficit 6 The
implications of this spiral for the State Finances are manifold.
The TFC Report of 1994 also pointed out that “the structure of expenditure had imparted
a downward rigidity and inflexibility to its level. Interest payment and wages and salaries
emerged as the major components of expenditure as a direct result of the mode of
financing of expenditure and expansionary policies. These items of “committed
expenditure could be curtailed only in the medium term. This had made expenditure more
income elastic than revenue receipts, thus generating an inbuilt tendency towards deficits.
As a result, the economy moved away from resource based fiscal management to
expenditure based Budgeting.”
The details of deficit indicators in state government finances show that Gross Fiscal
Deficit increased from Rs. 3713 crores in 1980-81 to Rs. 18787 crores in 1990-91 and
further to Rs. 94739 crores in 1999-2000. With the Revenue Account turing from a
surplus of RS. 1486 crores in 1980-81 to a deficit of 5309 crores in 1990-91 and 56802
crores in 1999-2000 . In the financing of Gross Fiscal deficit loans from centre increased
from Rs. 1567 crores in 1980-81 to Rs.9978 crores in 1990-91 and Rs. 39879 crores in
1999-2000. While market borrowings (net) increased relatively gradually from 198 crores
to 2556 crores and further to 11829 crores during the same period small savings and
others contributed an increasing share from Rs. 1948 crores in 1980-81 to Rs. 6253 crores
in 1990-1991and further to Rs. 43031 crores in 1999-2000.
The total outstanding liabilities of the State Governments (as a sum of internal debt,
outstanding loans and advances from the Centre , Provident Funds etc) on March 31st of
the year increased from Rs. 23959 crores (16.7 % of GDP) in 1980-81 to Rs. 110289
6. Report of the Tenth Finance Commission 1994 page 4
- 24 -
crores ( 19.4 % of GDP) in 1990-91 and further to Rs. 418582 crores (21.4 % of the
GDP) in 1999-2000. It is seen that the 1990s have been marked by a steep increase in the
outstanding liabilities of the state. As a consequence the gross interest payments of all the
states, which stood at Rs. 10944 crores in 1991-92 increased to Rs.45526 crores in 1999-
2000, and this as a percentage of the revenue receipts of the state increased from 13.6 to
21.2.
Apart from this the expenditure on Administrative Services, increasing from Rs.9225
crores in 1990-91 to Rs. 29219 crores in 2000-2001, and pensions increasing from
Rs.3593 crores in 1990-91 to Rs.23810 crores in 2000-2001 enhanced the constricting
nature of non plan expenditure and implied meagre availability of resources for new
projects, particularly in the infrastructural sector and even for maintenance expenditure. It is interesting to note in this regard, the diagnosis made by the Tenth Finance
Commission of “a pattern in the transition from healthy revenue surpluses that the
system used to generate, to chronic deficits”. The Commission identified a three phase
deterioration in the revenue account balance of all the States, by disaggregating the
revenue account into Plan and Non Plan as follows
1. First Phase Non Plan account surplus was larger than Plan deficit yielding upto 1986-87 an overall Revenue surpluses.
2.Second Phase The magnitude of Plan deficit increased sharply and became larger 1986-87 to 1991-92 than the Non Plan surplus which was declining
3.Third Phase The Non Plan revenue account itself went into deficit after 1991-92 The Tenth Finance Commission went on to observe that “the fact that all the States have
had almost identical turning points seem to suggest that there are systemic factors
underlying this deterioration rather than State specific reasons….. for the first time, not a
single State has submitted a pre devolution surplus on the Non Plan revenue account.
Thus the problem post to us was far worse than that faced by earlier Finance
Commissions”
This has long term significance, for as pointed out by the World Bank 7 in “the financial
and institutional weakness at the State Level are becoming a major constraint to the
provision of infrastructure and Social Services.” State Governments account for 53% of
7. “India- Recent Economic Development: Achievements and challenges” Country Economic Memorandum, World Bank, May 30, 1995
- 25 -
the total combined expenditure of the Centre and the States as also 56 % of the
expenditure on Social Services and 85% of total combined expenditure on economic
services, :World Bank also pointed out that discrete changes in the policy regimes by a
few Central Ministries and Departments (Finance, Commerce, Industry and
Telecommunication) can no longer profoundly improve the enabling environment,
Changing India’s Economic environment. further and ensuring that the liberalisation of
the economy leads to sustained reform efforts in several areas including ones in which
State Governments play a central role. “Among the key areas cited by the Report are
Irrigation and Road Transport which are constitutionally the responsibility of State
Governments and Power and Education which are constitutionally responsibilities shared
with the Central Governments.
Yet another dimension of the fiscal imbalances can be felt in the impact on the basic
objectives of Indian planning like Growth with Social Justice and Equity as also on
Social services sector expenditure. Equity consideration which have been a pillar of the
planing process in India with dominant objective of growth with social justice appears to
have received a set back in the pursuit of fiscal stabilization and structural adjustment
programme. Sanjaya Baru 8argued that while the new economic policy has been seeking
to improve the level of efficiency in the economy by promoting efficiency gains to be
attained through privatisation and deregularisation of the economic system, it did not
address the problem of inequity and inequality, as an explicit goal and that even the
efforts to meet the social dimensions of structural adjustment programmes have been
limited to compensate for the macro economic and micro economic losses that
marginalised economic and social group were likely to encounter as consequence of
fiscal and structural adjustment policies
Dr.Geeta Gouri 9 had however pointed out that “ Reactions to New Economic Policy
display a common tendency with the Stabilisation and Structural Adjustment Programme,
towards obfuscation of existing social costs of poorly designed governments
interventions or lack of Government action and transitional costs attributed to changes in
economic policy. Unfortunately, more often than not both sets of costs tend to converge
on the same groups and classes of people. Transitional costs then cease to be transitional
and instead tend towards the long run. ….While the sustainability of the SSAP package
depends on the minimisation of transitional costs, the structural transformation of the
8. Sanjaya Baru , The New Economic Policy and the Budget: Efficiency, Equity and Fiscal stabilization” EPW, April 10, 1993. 9.Dr.Geeta Gouri Towards Equity, New Economic Policy , Oxford 1995 Pg .11
- 26 -
economy depends on the minimisation if not elimination of all social costs. Design of
policy however has to be sensitive to the different dimensions of social costs
“Examination of the Budgetary trends do reveal the extend to which Expenditure
Programmes have been sensitised to different Social costs
As early as 1994, S.P.Gupta and A.K. Sarkar10 had also drawn attention to the possibility
of fiscal consolidation measure affecting the expenditure on social services particularly
those catering to the poorer sections of the society. They had argued that as activities on
social services are mostly undertaken by the State Government, which account for 85%
of the total expenditure. On social services, with 94% of non-plan expenditure and 68%
of plan expenditure on social services being borne by the State Governments. In their
view structural adjustment and fiscal consolidation have a contractionary role leading to
high social cost of adjustment.
In a comparison of the average ratio of Plan Expenditure to the State Domestic product in
respect of 14 States in the 1980’s with the ratio in the 90’s, Dr. Montek Ahluwalia 11 has
pointed out that the average plan expenditure as a percentage of SDP for the period 1980-
81 to 1990-91 was 5.69% and that the average for the decade ‘87-’88 – ‘97’98 was only
4.5%
In a paper estimating Trend Growth of Government Expenditure in Social Services,
particularly on Education and Health in 15 major Indian States, over the period 1974-75
to 1995-96, P.C. Sarkar and K. Seethaprabhu 12 have pointed out that there is a
deceleration in social sector expenditure in 13 Indian States, including those with low
levels of human development since the mid 1990’s. According to their analysis, 14 out of
15 states registered a deceleration, in respect of health sector with 9 States recording
negative growth rates. In respect of education the deceleration was noticed only in 6
States
10.S.P Gupta and A.K. Sarkar, ‘Fiscal Correction and Human Resource Development’ EPW, March 26, 1994, pp. 741-751 11.Montek Ahluwalia, “Economic Performance of States in post-reform period”, EPW, May 6, 2000 pp. 1637 to 1648. 12.P.C.Sarkar and K.Seetaprabhu, “Financing Human Development in Indian States -trends and
implications 1974-75 to 1995-96”, Asian Economic Review, April 2001, pp.36-60
- 27 -
It is reasonable to presume that the resource constraints have affected the expenditure on
development and in particular plan expenditure, far more specifically the Social Sector
Expenditure.
In a survey of Recent Trends in State Government Finances Dr. N.J.Kurien has pointed
out that while the overall impact of Fiscal Reforms initiated at the Centre since 1991 have
not been encouraging with the Tax /GDP ratio in the nineties dropping lower than that in
the eighties, and that pay revision of Central Government employees had nullified what
ever gains that were achieved in the Expenditure Management by the Centre. According
to him, the States Finances were marked by a sharp deterioration on account of the failure
of State Governments to contain wasteful expenditure, reluctance to raise additional
resources, competitive populism practised by different political parties, substantial and
still growing explicit and implicit subsidies passed on to influential segments of the
society through State Budgets and the continued losses of the State Electricity Board and
other public undertakings.
On the basis of analysis of data on demographic indicators, State domestic product,
development and non development expend iture of State Governments, shares in plan
outlay investments, banking activities and infrastructural development, Dr. Kurien13
asserted that the “ongoing economic reforms since 1991, with stabilization and
deregulation policies as their prime instruments and a very significant role for the private
sector seem to have aggravated the inter state disparities.”
13.(Dr. N.J. Kurien State Government Finances – A Survey of Recent Trends EPW May 1999 pages 1115
to 1123)
- 28 -
III CONSTITUTIONAL AND POLICY FRAMEWORK
3 . 1 FISCAL FEDERALISM
For a better understanding of the fiscal imbalance and budgetary dilemma , one may need
to review the structural features of the Indian Economy like (a) the constitutionally
ordained fiscal federalism providing a political and economic framework and (b)
democratically chosen approach of central planning and mixed economy to development
needs of the economy and proceed to sift the trends in these two areas , to identify the
impulses for Economic Reforms launched in the nineties. It may also be relevant to
examine whether the Finance Commission and the Planning Commission in the
traditional roles and the New Economic Policy of the Nineties have made any difference
to the disparities in the levels of development of the states , - a fundamental challenge to
Public Expenditure Management.
Fiscal Federalism in India has a long history, preceding the Indian Constitution of 1950,
which envisaged that the President of India will, under Article 280 appoint, a Finance
Commission to undertake a quinquennial review of the resources of the Union and the
States, and their financial requirements for discharging Constitutionally allocated duties
and responsibilities in, as per three lists of subjects – the Union list, the State list and the
Concurrent list and make recommendations on the manner in which the proceeds of
Union Taxes and duties have to be shared between the Central Government and the
States, and further on the manner in which the share of the states is to be distributed
among all the states.
Commencing with the Mayo Scheme of 1870, and developing through the Mont-Ford
Reform reflected in the Financial Provisions of the 1919 Act, and further through the
Report of Joint Parliamentary Committee on Indian Constitutional Reforms 1933-34,
culminating in the Government of India Act of 1935, India had experience of federal
administration for several decades. The 1935 Act distributed among the Centre and the
Provinces legislative powers in three lists, the Federal list having 59 entries, the
Provincial list having 94 entries and Concurrent list with 36 entries. The sources of
revenue were allocated by categorising the powers for levy of taxes. An important point to be noted is that while the 1919 Act stipulated that the Provinces
should make initial contributions to the Federal Government to cover its deficits for a
period of seven years and thereafter make a standard annual contribution, the 1935 Act
- 29 -
provided for the emergence of a financially strong centre, and for Federal Grants in Aid,
conditional or discretionary, to be given to the Provinces to meet public purposes. The exigencies of the Second World War, the partition of India, and the declaration of
independence disturbed this pattern before it could settle down. However interim
arrangements proposes by Shri C.D. Deshmukh, the Report of Expert Committee on
Financial Provisions, headed by Shri N.R.Sarkar (December 1947), and the Report of the
Indian States Finance enquiry Committee headed by Shri V.T.Krishnamachari (October
1948), dealt with the problems of distribution of Financial Powers, Public Borrowings
and Union State Relation immediately after independence.
The economic and social conditions prevalent in the wake of the Second World War and
the Partition of the Country appeared to dictate the emergence of a strong Centre, with
the Indian Constitution of 1950 not conferring more powers on the states than was
contemplated under the Government of India Act of 1935. Constitutional experts have
referred to India as a Federation with the features of an Unitary state. Experience of over
fifty years of Constitutional Federal Government has revealed that in the areas of
Economy and Finance , the interactions between the Union and the States have been
guided by the emergence and continuing roles of the Finance Commission and the
Planning Commission .
FINANCE COMMISSION
Article 246 of the Indian Constitution deals with the distribution of legislative powers
between the Union and the States, with the Seventh Schedule providing three list, the
State List and the Concurrent List. This was. More or less an adoption of the three fold
division of the 1935 Act, the taxes included in the Union List falling under four
categories are indicated below: (a)Taxes levied and collected by the Union the proceeds of which are retained by the
Union. (b)Taxes levied and collected by the Union, the proceeds of which are shared with
the states (Article 270) (c)Taxes levied and collected by the Union, the proceeds of which
are assigned to the States wholly (Article 269) (d)Taxes levied by the Union but collected
and appropriated by the States. (Article 268) Apart from the taxes as indicated above, Indian Constitution envisaged two types of
grants, a) Statutory Grants under Article 275 to be made to the states in aid of the
- 30 -
revenues, and b) Discretionary Grants made available under Article 282 for a public
purpose. Article 280 provided for appointment of the Finance Commission, a quasi judicial body
within two years of the commencement of the constitution, and as prescribed under
Article 280 (2) the Parliament passed the Finance Commission (Miscellaneous
Provisions) Act 1951. This Act was amended in 1955. The Task of the Finance
Commission as laid down in the Constitution is to make recommendations to the
President, on the Principles governing a) Distribution of the tax proceeds between the
Centre and the States as also between the States b) The basis of central grants to the state
in aid of their revenues, and in respect of statutory grants, if the President seeks
recommendation Grants made under Article 280 (2) are kept outside the perview of the
Finance Commission.
The other Article of the Constitution relevant to the Finance of the States are Article 274
safeguarding the financial interests of the states, Article 285 and 289 concerning
immunity from taxation and Article 292 and 293 empowering the Government of India
and the States to borrow from the country. Article 360 provides for Declaration of the
Financial Emergency by the president of India. In the context of planned economic development and public expenditure management
one may note that the functional responsibilities of the Centre related to the National
Economy, apart from Defence, and External Affairs. While the Union Government dealt
with the Credit and Monetary systems, Infrastructural areas like Railways, Posts and
Telegraph, Communication and also strategic area of Foreign Trade, Exploitation of
Mineral Resources, Development of Large Scale Industries and the like. The
responsibilities of the States related to areas that impinged on the lives of individuals and
communities more directly, like maintenance of law and order, provision of
infrastructures like Irrigation, Power, Roads, Educational Facilities and Development of
Agriculture, Fisheries Forests, Small and Medium Industries. Briefly stated, the States
were responsible for not only activities in the Primary and Secondary sectors of the
economy but also Social and Economic overheads in their respective jurisdictions.
This divisions of responsibilities and taxing powers between the Union and the States has
been the subject of vigorous debates, as one must expect in the context of a country of
sub continental dimensions with varying levels of regional and local resource
endowment. It is necessary to keep this aspect in mind, as some hold the view that there
is a divergence between functional responsibilities and financial powers of the Union
- 31 -
and States and this is inherent in the Federal Fiscal Frame work envisaged in the Indian
Constitution. But the Framework has been made operational by building into it, a
mechanism of periodical review of the financial needs of the State and of transfer from
Centre, a part of the resources raised by the Union, to the States. Ten Finance Commission that covered the period between 1952-57 to 1995-2000 had
recommended criteria for (a) the vertical sharing between Centre and States of the
proceeds of Income Tax and Central Excise (b) the horizontal distribution of the States
share among different states.
The specific share of the States in the Centre tax revenue, and the criteria proposed by the
successive Finance Commission for allocation of the States share as between different
states has been changing from time to time, with each commission adopting criteria for
which they had some justification or other. In fact the Chairman of the Fourth Finance
Commission Dr. P.V. Rajamannar had described the choice of different criteria, “as a
gamble in the personal views of five persons are a majority of them”.
The criteria included, States contribution in Central revenue collection, size of
population, per-captia income distance and per-captia income inverse ratio. While the
First Six commission gave different weightages to the various criteria in determining the
share of individual states, the Seventh Finance Commission introduce poverty as a
criterion, and this was also adopted by the Ninth Finance Commission. The Eighth and
the Tenth Finance Commission had not adopted poverty criteria. Ninth and Tenth
Finance Commission have introduced specific indicator of backwardness as criterion.
The Tenth finance Commission had taken the Tax effort made by the State Government
as a criteria for the allocation of Income Tax proceeds and for sharing excise revenue.
The shares of the States in Central Revenue, and the criteria for inter-se distribution
among the States, recommended by the Ten Finance Commissions are summarised in
Tables 3 .1 to 3 .3, and a comparison of the criteria adopted by the Tenth and the
Eleventh Finance Commission is shown in Table- 3 .3. The frequent changes in the
criteria in the determination of the States share in Central Tax Revenue and for allocation
of Central resources to individual States, lead to criticism from several quarters and
spread dissatisfaction among the states. By the mid nineties these was wide spread
agreement that there should be a fair element of continuity and evolution in the operation
of the scheme of devolution, and this was significant in the context of the emergence of
- 32 -
regional parties with their local agenda and their victory during the elections to the
Assembly. The Tenth Finance Commission while making its recommendation on the sharing
between the Centre and the States of the proceeds of the stipulated taxes suggested an
alternative scheme of devolution, in which 29% of the total tax revenue would be
transferred to the states and this share should be in operation for period of 15 years. The
third meeting of the Inter-State Council held in July 1997 reached a consensus of this.
Then Union Government (the United Front Government) accepted this in principles but
could not implemented. The Successor Government, (the BJP lead coalition) ratified the
previous Government’s decision and decided to give effect to this through a Constitution
Amendment Bill, with the modification that the proportion in which the States will share
the gross proceeds of the Central Taxes may be reviewed by the successive Finance
Commission instead of freezing the share percentage for 15 years. Even this could not be
carried out.
The Eleventh Finance Commission constituted in July 1998 was required not only to
make recommendations on the determination of the share of the Sates in the divisible
Union Taxes, and their inter-sea allocation among the States and formulate principles to
govern the determination of the grants- in-aid to the States but also suggest measures for
augmenting the Consolidated Funds of the States to supplement the resources of the local
bodies. And more importantly the Commission was required to review the Finances of
the Union and the States and suggest Ways and Means by which the Governments
collectively and severally can bring about the restructuring of the Public Finances so as to
restore Budgetary balance and maintain macro economic stability. The Commission was
also required to take into account the needs of the states for meeting not only non plan
revenue expenditure but also Current Expenditure in the Plans. Apart from this the
Commission was required to suggest suitable corrective measures for ensuring long term
sustainability of the Country’s Public Debt while making an assessment of the debt
position to the States. The Commission was also requested to draw up a monitorable
fiscal reforms programme aimed at reduction of Revenue Deficit of the States and
recommend the manner in which Central grants to cover non plan revenue deficits of the
states can be linked to the implementation of fiscal reforms programme.
The Eleventh Finance Commission submitted an interim report in January 2000, which
was accepted by the Government of India in March 2000 another report was submitted in
July 2000, which was accepted by the Government in July 2000. The Commission came
- 33 -
up with the further reports on certain issues in August 2000. With the passing of the 80th
Constitution Amendment Bill in 2000, the share of the States had become a definite
proportions of the Net Proceeds of all Central Taxes and duties as against the earlier
practice of sharing only the proceeds of Income Tax , Excise duties and Additional
Excise duties. The Eleventh Finance Commission recommended that 28% of the net
proceeds of all sharable central tax and duties be transferred to the States and indicated
the criteria, the weights assigned and the amount involved in the distribution of State’s
share among all the States and that tax devolution, and plan and non plan grants should
not exceed 37.5% of gross revenue receipts of the Centre. Other recommendation covered
quantum of grants to the local bodies continuance of existing scheme of debt relief,
discontinuance of the National Calamity Relief Fund for calamities of rare severity, and
establishment of National Centre for Calamity Management. The quantum of transfers
and the criteria adopted by the Tenth and Eleventh Finance Commission are summarised
in Tables 3 . 4 and 3.5 .
Taken together the recommendation of the Eleventh Finance Commission should have
brought about some degree of satisfaction to the States but this was not the case, as the
devolution proposed by the Eleventh Finance Commission appeared, in effect, to make
significant modifications in the allocations to some of the States. See Tables 3.6 and 3.7
The Chief Ministers of as many of 8 States submitted a Memorandum to the Prime
Minister Government of India expressing their concern over the reduction of their shares
in the inter-se allocation among the States. While arguing that there should be no ceiling
on the transfer of central resources to the state, the memorandum pointed out that this
percentage should be the minimum share to be transferred to the states.1 Analysis of the
relative flows of resources from Centre to the States, on account of the recommendations
of the Tenth and the Eleventh Finance Commissions show that there is a discernible
pattern of higher flows to certain Northern and Eastern States from the Eleventh Finance
Commission.
It has been observed that “ the relative shares of various states as groups in tax devolution
and total transfer show that the high income and middle income states which contribute
to the GDP and export effort in a significant manner have had to suffer in the hands of the
EFC with the sole exception of West Bengal which seemed to have received higher
shares in tax devolution and total transfer. That the special category states also receive
1.See Asian Economic Review, December 2000 for a summary of the recommendations of the Eleventh Finance Commission, Critical Analysis and Text of Representation by 8 State Governments.
- 34 -
from the EFC lower share in both tax devolution and total transfer as compared to the
EFC awards shows that even the principles of redistributive transfer has not been strictly
followed …. The new predicament created by the EFC has serious implications for Indian
fiscal federalism , which may need to be addressed by the National Development Council
and the Inter State Council and these may be overshadow the other recommendations of
the EFC designed to achieve budgetary balance and macro – economic stability .” 2
This only establishes the fact that even after five decades of experience of devolution,
there is dissatisfaction among the states. The federal flows are still like an untamed river
breaching its banks at its will and places of its own choice. The implication of this for
public expenditure management in the states, have become even more serious after the
emergence of regional parties in the various states. ROLE OF PLANNING COMMISSION
In the Constitutionally evolved broad pattern of transfer of resources that has come to
dominate fiscal federalism in India, the emergence of the Planning Commission as an
important channel for grants and loans for development to be extended by the Centre to
the States has been very significant. Brought into existence through a Resolution of the
Government of India dated March 15, 1950, the Planning Commission is technically a
creation of the Union Government and not a body created by the Constitution of India or
an Act of the Parliament.
The vital role played by the Commission has, over the last five decades, involved
allocation of national resources for development applications by the Centre and the States
among different sectors of economy and in various regions of the country.
With the Constitution envisaging an assessment of both revenue and capital requirements
of the States, for deciding the pattern of devolution of resources gathered by the Centre,
the Finance Commission, and Planning Commission have come to be the load bearing
walls in the federal fiscal frame work of India. However some operational problems have
emerged in the functioning of the two commissions. The First two Finance Commissions
made recommendations covering both revenue and capital requirements of the States but
during this period, Planning Commission had also begun to assume responsibility for
allocation of resources for plan purposes, which included capital requirements also.
2. See V.K.Srinivasan , Finance Commission Recommendations . Yojana Nov 2000 pg 15.
- 35 -
The Third Finance Commission drew attention to the overlap in the functions of the
Finance Commission and the Planning Commission and recommended that the Central
Government should either “enlarge the functions of the Finance Commission to embrace
total financial assistance to be afforded to the States whether by way of loans or
devolution of revenue to enable them balance their normal budgets and fulfill the
prescribed targets of the plan” or “transform the Planning Commission into Finance
Commission at the appropriate time”. The issue was not settled then .
The Fourth Finance Commission which was precluded from examining the fiscal needs to
the states for the Fourth Plan, did not recommend any assistance to the States for their
Chairman , Shri. P.V.Rajamannar, even observed that “the relative scope and functions of
the two commissions should be clearly defined by amending Constitution and the
Planning Commission should be made a statutory body independent of the Government.”
While the overlap of functions between the Finance Commission and Planning
Commission has led to considerable legal quibbling regarding Article 282 of the Indian
Constitution, it has come to be accepted in due course of time, that the Finance
Commission will attend to the Non Plan requirements of the States and towards certain
specific capital grants and the Planning Commission will make recommendations in
respect of grants and loans for State Plans and discretionary transfers. The emergence of National Development Council, in which the Chief Ministers of the
States are members, as a body required to accord formal approval for the Five Year Plans
and take major decisions concerning planning , has lent both weight and authority to the
role played by the Planning Commission in assessing the resource gap of the States for
the implementation of development plans and making appropriate recommendations for
central assistance to be made available to the States. Thus even without a formal
constitutional status, the Planning Commission has become an important agency in the
Centre-State economic frame work, (a) for ensuring adequate mobilisation of physical
and financial resources for the plan, (b) for assessing the size and helping in the
determination of priorities of the State plans to ensure that they, while serving the local
developmental needs are also in conformity with national perspective; (c) for
participating in the national effort to reduce inter-state disparities and to promote
balanced regional development, with clearly directed Central and States schemes for
accelerating economic growth and social transformation in the States. After the initial
experience of the first two decade of planning and interaction with the state governments,
the Planning Commission evolved and adopted in 1969, what has come to be known as
- 36 -
the Gadgil formulae spelling out criteria for determining the quantum of plan assistance
from Centre to the States. The formulae adopted in 1969, and the modifications made in
1980, 1990 and 1991 are summarised in Table 3.8
The adoption of such a carefully evolved pattern of assistance by the Planning
Commission has not however rendered it immune from critical references from some
state governments , which have after formulating ambitious plans for expenditure
programmes , with available glare of publicity are unable to raise on their own resources
sufficient to meet these programmes, and therefore do not take fondly , to the monitoring
role of the Planning Commission and its insistence on a degree of compliance with sound
principle of Planning and matching resources with expenditure programmes. The
Planning Commission has for its part , found itself wedged between the Union Finance
Ministry with its own problems of mobilisation of resources for meeting the burgeoning
expenditure of the Central Government and the State Governments which are closer to
the field and have therefore to face the pressure of popular needs. The Crucial issue is
Planning and Budgeting in governments at the centre and the states. It is necessary in this
regard , to keep in view , the paradigmatic shift in the recent years . As observed by
Dr.A.Premchand, “ Planning and Budgeting in Government have traditionally been
considered in terms of the formulation and implementation of medium term and annual
plans and the relative roles of Planning Agencies and Ministries of Finance in this larger
process. The development plans during the early 1950s and 1960s tended to be larger in
coverage and focus and reflected the Management trends of those decades- Control of the
commanding heights of the Economy, an extensive public sector and the prevalence of
extensive network of physical and financial controls. ….. major changes have taken place
during the last decade , in the approaches of the activities of the Governments and Public
Sector . the paradigm is no longer one of extensive Government control but it is now one
of reduced role of the government and pursuit of economic policy that emphasise the
supply side of the economy – removal of structural bottleneck of the economy. Not
withstanding this paradigmatic shift , budget of the government continues to be the most
gripping aspect of economic policy , while at the heart of the economic policy , lies the
control of Public Expenditure”.3
We may need to turn to the quantum of resources involved in devolution, and statutory
and non statutory transfers from the Centre to the States provided in the Union Budget
3 A.Premchand, Planning and Budgeting in Governments in “Financial Management and Accountability in the Public Sector , Ed Ravi Kathpalia , Oxford and IBH 1994 pg.193.
- 37 -
TOTAL TRANSFER OF RESOURCES FROM CENTRE TO THE STATE
In context of this study, it is important to take note of items of “expenditure” of the Union
Government which have implications for the State Government and their expenditure
programmes. The Central Budget provides for transfers to the State and Union Territory
Governments by way of (a) States’ shares of Taxes and Duties as recommended by the
Finance Commission. (b) Non plan Grants and Loans, displayed in the Budget
Document, as net of recovery short term loans and advances, (c) Central Assistance for
State and U.T. Plans (Grants & Loans recommended by the Planning commission (d)
Assistance for Central Sector and Centrally sponsored schemes (included in the plan
outlays of Central Ministry and released to the State Government as per approved
patterns of assistance. From the aggregate of the above, recovery of loans and advances
from the State and U.T. Governments, is deducted to derive the net resources transferred
to State and U.Ts. Central Resources are also released directly to implementing agencies
as part of Central Assistance for State and U.T. for Rural Electrification, Member of
Parliament local Area Development Schemes etc. These have Development implications.
We may however take note of the quantums and the relative share of – (a)Statutory
transfer (b)Plan transfers (c)Discretionary transfers. The quantum of resources transferred
through the three routes varied in each Five Year Plan period, as shown in the Table 3.9
The transfer made in the Nineties are shown in Table 3.10 While the Gross Transfer from Centre to the State and U.Ts was Rs.21951 crores, about
49% of aggregate expenditure of States in 1985-86, and had increased to Rs. 40860
crores, meeting a lower level of 44.9% of States expenditure in 1990-91, it had doubled
to Rs. 81974 crores in 1996-97 and more than trebled to Rs. 129066 crores in 1999-2000.
But with the aggregate expenditure of States increasing, gross resources transferred by
the Centre, could meet only lower levels of State expenditure, 40.4% in 1996-97 and
39.6% in 1999-2000.
Further with the States repayment of loans and interest payment to the Centre, increasing
, the net transfers from Centre to the State, amounted to Rs. 17633 mcrores in 1985-86,
Rs. 31685 crore in 1990-91, Rs. 60585 crores in 1996-97, and Rs. 93712 crores in 1999-
2000, with net resources providing lower and lower covers for State expenditure 39.3%
in 1985-86, 34.8% in 1990-91, 29.9% in 1996-97 and 28.8% in 1999-2000. It appears
that loan repayment and interest payment obligations of the State have been as a
percentage of total States expenditure gradually increasing from 9.6% in 1990-91 to

- 38 -
11.3% in 2000-014 . Data provided by Reserve Bank of India indicate higher sums of
gross transfer as these include ways and Means Advance from the Centre to the State.
It has been argued that the total quantum of resources transferred to the States as
percentage of the resources, raised by the Centre, and also has a proportion of the
aggregate expenditure of the states have been gradua lly falling has been gradually falling.
Analysis of data published in Union Budgets and the Indian Public Finance statistics
confirms this argument.
All the same, the impact of deterioration of Central finances, on the State is fairly clear
and a more detailed examination of the Finances of the States may reveal the nature and
pattern of deterioration at that level.
4. EPW Finances of State Governments, May 19, 2001 Page 1761
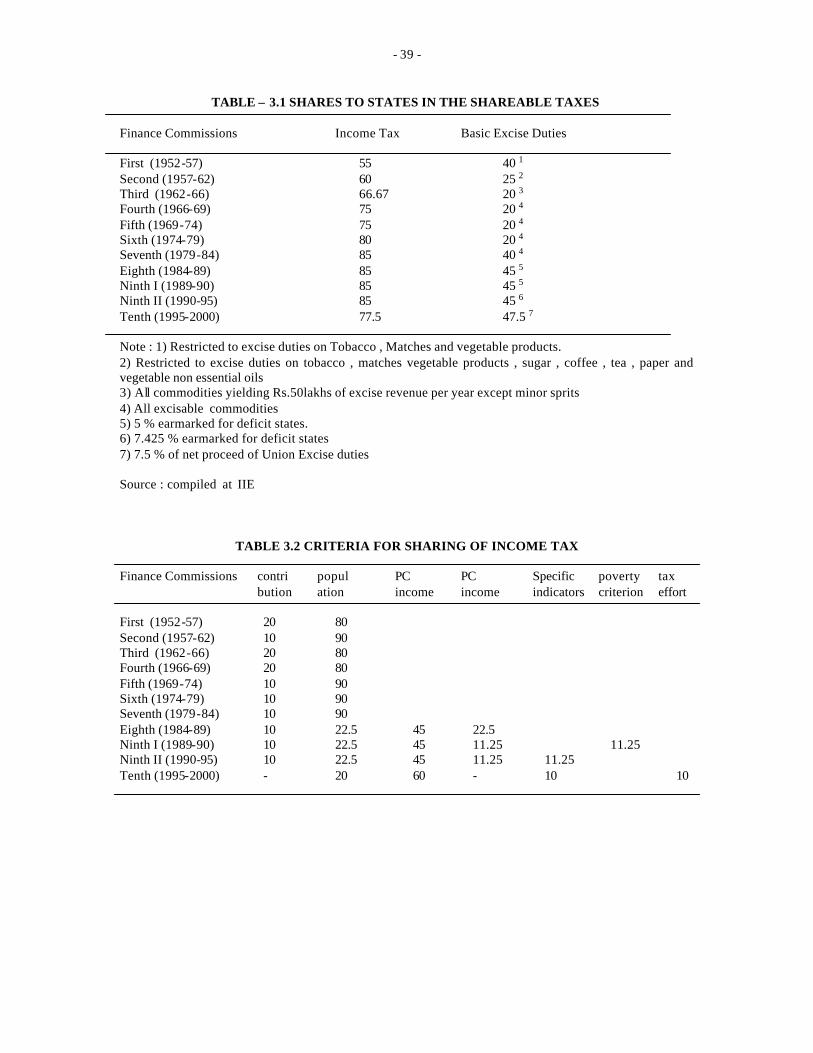
- 39 -
TABLE – 3.1 SHARES TO STATES IN THE SHAREABLE TAXES
Finance Commissions Income Tax Basic Excise Duties First (1952-57) 55 40 1
Second (1957-62) 60 25 2 Third (1962-66) 66.67 20 3 Fourth (1966-69) 75 20 4 Fifth (1969-74) 75 20 4 Sixth (1974-79) 80 20 4 Seventh (1979-84) 85 40 4 Eighth (1984-89) 85 45 5 Ninth I (1989-90) 85 45 5 Ninth II (1990-95) 85 45 6 Tenth (1995-2000) 77.5 47.5 7
Note : 1) Restricted to excise duties on Tobacco , Matches and vegetable products. 2) Restricted to excise duties on tobacco , matches vegetable products , sugar , coffee , tea , paper and vegetable non essential oils 3) All commodities yielding Rs.50lakhs of excise revenue per year except minor sprits 4) All excisable commodities 5) 5 % earmarked for deficit states. 6) 7.425 % earmarked for deficit states 7) 7.5 % of net proceed of Union Excise duties Source : compiled at IIE
TABLE 3.2 CRITERIA FOR SHARING OF INCOME TAX Finance Commissions contri popul PC PC Specific poverty tax bution ation income income indicators criterion effort First (1952-57) 20 80
Second (1957-62) 10 90 Third (1962-66) 20 80 Fourth (1966-69) 20 80 Fifth (1969-74) 10 90 Sixth (1974-79) 10 90 Seventh (1979-84) 10 90 Eighth (1984-89) 10 22.5 45 22.5 Ninth I (1989-90) 10 22.5 45 11.25 11.25 Ninth II (1990-95) 10 22.5 45 11.25 11.25 Tenth (1995-2000) - 20 60 - 10 10
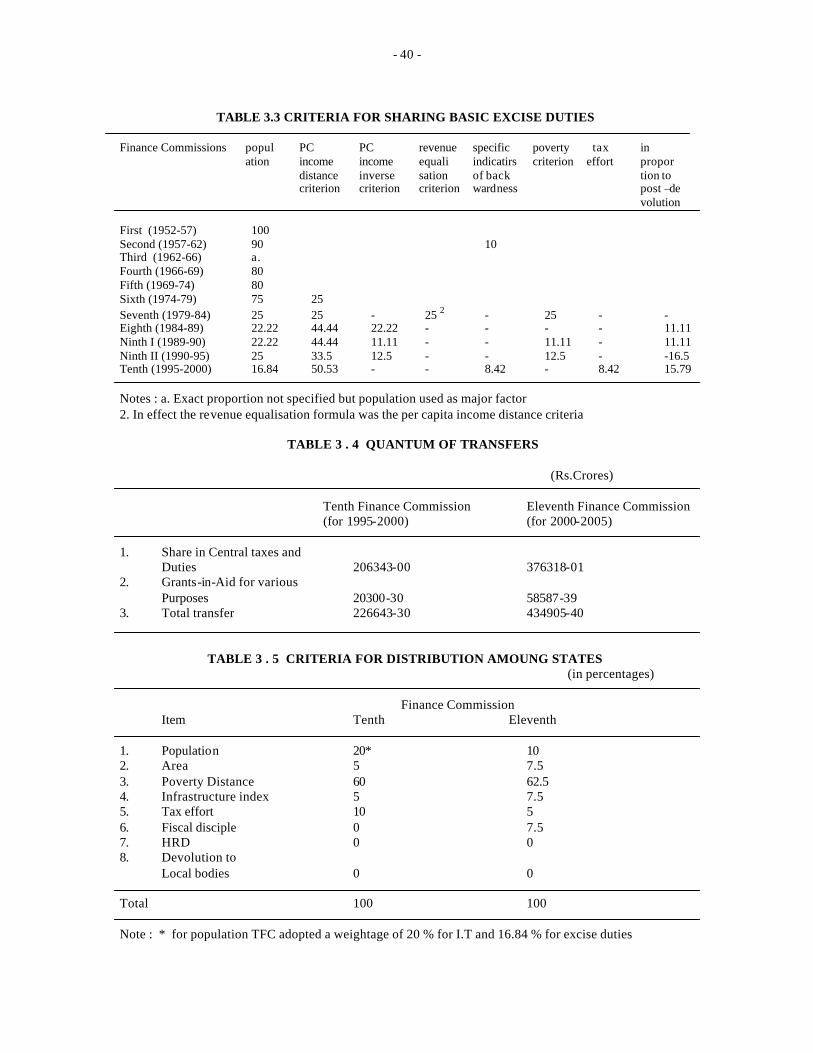
- 40 -
TABLE 3.3 CRITERIA FOR SHARING BASIC EXCISE DUTIES
Finance Commissions popul PC PC revenue specific poverty tax in ation income income equali indicatirs criterion effort propor distance inverse sation of back tion to criterion criterion criterion wardness post –de volution First (1952-57) 100
Second (1957-62) 90 10 Third (1962-66) a. Fourth (1966-69) 80 Fifth (1969-74) 80 Sixth (1974-79) 75 25 Seventh (1979-84) 25 25 - 25 2 - 25 - - Eighth (1984-89) 22.22 44.44 22.22 - - - - 11.11 Ninth I (1989-90) 22.22 44.44 11.11 - - 11.11 - 11.11 Ninth II (1990-95) 25 33.5 12.5 - - 12.5 - -16.5 Tenth (1995-2000) 16.84 50.53 - - 8.42 - 8.42 15.79 Notes : a. Exact proportion not specified but population used as major factor 2. In effect the revenue equalisation formula was the per capita income distance criteria TABLE 3 . 4 QUANTUM OF TRANSFERS (Rs.Crores) Tenth Finance Commission Eleventh Finance Commission (for 1995-2000) (for 2000-2005) 1. Share in Central taxes and
Duties 206343-00 376318-01 2. Grants-in-Aid for various
Purposes 20300-30 58587-39 3. Total transfer 226643-30 434905-40
TABLE 3 . 5 CRITERIA FOR DISTRIBUTION AMOUNG STATES (in percentages)
Finance Commission Item Tenth Eleventh
1. Population 20* 10 2. Area 5 7.5 3. Poverty Distance 60 62.5 4. Infrastructure index 5 7.5 5. Tax effort 10 5 6. Fiscal disciple 0 7.5 7. HRD 0 0 8. Devolution to
Local bodies 0 0 Total 100 100 Note : * for population TFC adopted a weightage of 20 % for I.T and 16.84 % for excise duties

- 41 -
TABLE 3 . 6 DISTRIBUTION AMOUNG STATES
Tax Devolution Total Transfer TFC EFC TFC EFC High income 13.14 9.75 13.06 9.62 Middle Income 29.23 29.19 28.53 27.56 Low Income 44.17 53.76 43.25 49.34 Special Category 13.46 7.30 15.17 13.48 100.00 100.00 100.00 100.00
TABLE 3 . 7 RELATIVE SHARES OF STATES IN RESOURCE TRANSFER –
TENTH AND ELEVENTH FINANCE COMMISSIONS State Tenth Finance Commission Eleventh Finance Commission TD TT TD TT Total for All States (Rs.Crores) 206343 226643 376318 434905 1. Andhra Pradesh 7.91 7.98 7.701 7.13 2. Arunachal Pradesh 0.66 0.78 0.244 0.53 3. Assam 3.42 3.67 3.285 3.05 4. Bihar 11.29 10.88 14.597 13.04 5. Goa 0.25 0.27 0.206 0.19 6. Gujarat 3.88 3.92 2.821 2.76 7. Haryana 1.24 1.23 0.944 0.97 8. Himachal Pradesh 1.81 2.10 0.683 1.72 9. Jammu and Kashmir 2.86 3.23 1.290 3.78 10. Karnataka 4.86 4.64 4.930 4.53 11. Kerala 3.5 3.41 3.057 2.83 12. Madhya Pradesh 7.4 7.10 8.838 8.05 13. Maharashtra 6.23 6.05 4.632 4.46 14. Manipur 0.82 0.94 0.366 0.74 15. Meghalaya 0.74 0.83 0.342 0.68 16. Mizoram 0.68 0.80 0.198 0.58 17. Nagaland 1.06 1.23 0220 1.02 18. Orissa 4.26 4.28 5.056 4.77 19. Punjab 1.53 1.58 1.147 1.25 20. Rajasthan 4.97 5.03 5.473 5.42 21. Sikkim 0.27 0.31 0.184 0.38 22. Tamilnadu 6.12 5.89 5.385 4.97 23. Tripura 1.13 1.27 0.487 1.00 24. Uttar Pradesh 16.25 15.95 19.798 18.05 25. West Bengal 6.84 6.61 8.116 8.10 Total All states 100.00 100.00 100.00 100.00 Note : TD -Tax Devolution share TT – Total Resource Transfer share TD for Tenth FC only of income tax and excise duty revenue TD for Eleventh FC is for all tax revenue
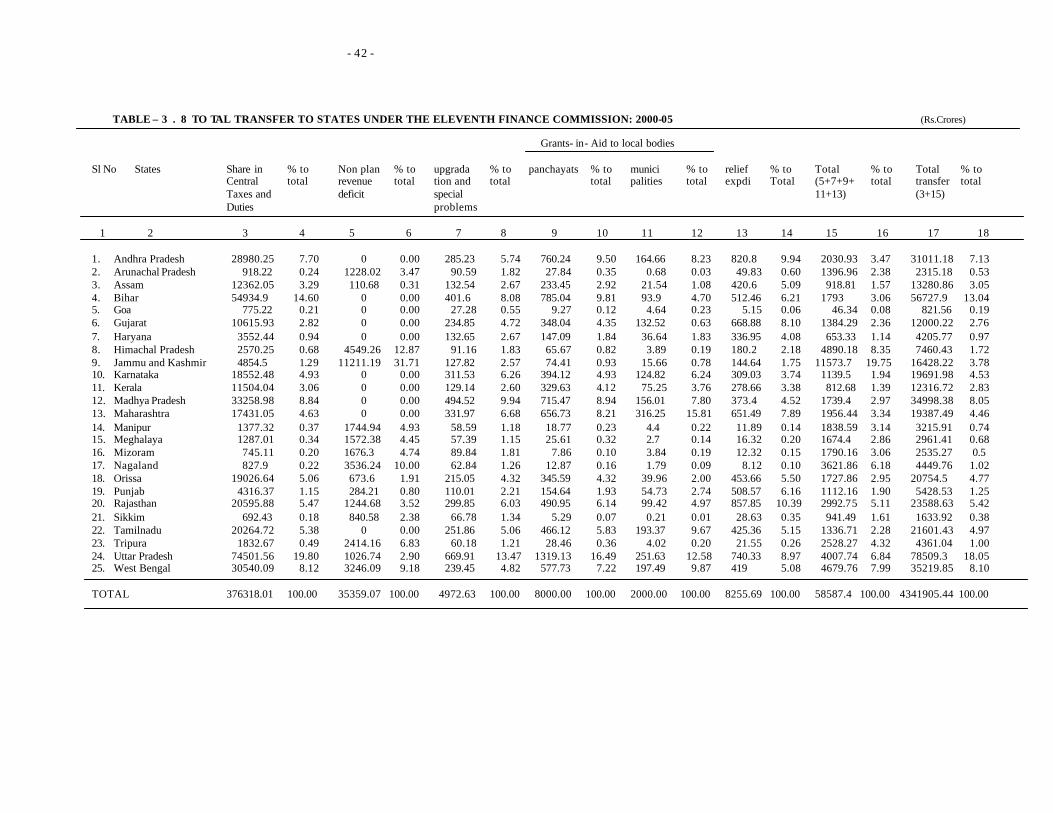
- 42 -
TABLE – 3 . 8 TO TAL TRANSFER TO STATES UNDER THE ELEVENTH FINANCE COMMISSION: 2000-05 (Rs.Crores) Grants- in- Aid to local bodies Sl No States Share in % to Non plan % to upgrada % to panchayats % to munici % to relief % to Total % to Total % to Central total revenue total tion and total total palities total expdi Total (5+7+9+ total transfer total Taxes and deficit special 11+13) (3+15) Duties problems 1 2 3 4 5 6 7 8 9 10 11 12 13 14 15 16 17 18 1. Andhra Pradesh 28980.25 7.70 0 0.00 285.23 5.74 760.24 9.50 164.66 8.23 820.8 9.94 2030.93 3.47 31011.18 7.13 2. Arunachal Pradesh 918.22 0.24 1228.02 3.47 90.59 1.82 27.84 0.35 0.68 0.03 49.83 0.60 1396.96 2.38 2315.18 0.53 3. Assam 12362.05 3.29 110.68 0.31 132.54 2.67 233.45 2.92 21.54 1.08 420.6 5.09 918.81 1.57 13280.86 3.05 4. Bihar 54934.9 14.60 0 0.00 401.6 8.08 785.04 9.81 93.9 4.70 512.46 6.21 1793 3.06 56727.9 13.04 5. Goa 775.22 0.21 0 0.00 27.28 0.55 9.27 0.12 4.64 0.23 5.15 0.06 46.34 0.08 821.56 0.19 6. Gujarat 10615.93 2.82 0 0.00 234.85 4.72 348.04 4.35 132.52 0.63 668.88 8.10 1384.29 2.36 12000.22 2.76 7. Haryana 3552.44 0.94 0 0.00 132.65 2.67 147.09 1.84 36.64 1.83 336.95 4.08 653.33 1.14 4205.77 0.97 8. Himachal Pradesh 2570.25 0.68 4549.26 12.87 91.16 1.83 65.67 0.82 3.89 0.19 180.2 2.18 4890.18 8.35 7460.43 1.72 9. Jammu and Kashmir 4854.5 1.29 11211.19 31.71 127.82 2.57 74.41 0.93 15.66 0.78 144.64 1.75 11573.7 19.75 16428.22 3.78 10. Karnataka 18552.48 4.93 0 0.00 311.53 6.26 394.12 4.93 124.82 6.24 309.03 3.74 1139.5 1.94 19691.98 4.53 11. Kerala 11504.04 3.06 0 0.00 129.14 2.60 329.63 4.12 75.25 3.76 278.66 3.38 812.68 1.39 12316.72 2.83 12. Madhya Pradesh 33258.98 8.84 0 0.00 494.52 9.94 715.47 8.94 156.01 7.80 373.4 4.52 1739.4 2.97 34998.38 8.05 13. Maharashtra 17431.05 4.63 0 0.00 331.97 6.68 656.73 8.21 316.25 15.81 651.49 7.89 1956.44 3.34 19387.49 4.46 14. Manipur 1377.32 0.37 1744.94 4.93 58.59 1.18 18.77 0.23 4.4 0.22 11.89 0.14 1838.59 3.14 3215.91 0.74 15. Meghalaya 1287.01 0.34 1572.38 4.45 57.39 1.15 25.61 0.32 2.7 0.14 16.32 0.20 1674.4 2.86 2961.41 0.68 16. Mizoram 745.11 0.20 1676.3 4.74 89.84 1.81 7.86 0.10 3.84 0.19 12.32 0.15 1790.16 3.06 2535.27 0.5 17. Nagaland 827.9 0.22 3536.24 10.00 62.84 1.26 12.87 0.16 1.79 0.09 8.12 0.10 3621.86 6.18 4449.76 1.02 18. Orissa 19026.64 5.06 673.6 1.91 215.05 4.32 345.59 4.32 39.96 2.00 453.66 5.50 1727.86 2.95 20754.5 4.77 19. Punjab 4316.37 1.15 284.21 0.80 110.01 2.21 154.64 1.93 54.73 2.74 508.57 6.16 1112.16 1.90 5428.53 1.25 20. Rajasthan 20595.88 5.47 1244.68 3.52 299.85 6.03 490.95 6.14 99.42 4.97 857.85 10.39 2992.75 5.11 23588.63 5.42 21. Sikkim 692.43 0.18 840.58 2.38 66.78 1.34 5.29 0.07 0.21 0.01 28.63 0.35 941.49 1.61 1633.92 0.38 22. Tamilnadu 20264.72 5.38 0 0.00 251.86 5.06 466.12 5.83 193.37 9.67 425.36 5.15 1336.71 2.28 21601.43 4.97 23. Tripura 1832.67 0.49 2414.16 6.83 60.18 1.21 28.46 0.36 4.02 0.20 21.55 0.26 2528.27 4.32 4361.04 1.00 24. Uttar Pradesh 74501.56 19.80 1026.74 2.90 669.91 13.47 1319.13 16.49 251.63 12.58 740.33 8.97 4007.74 6.84 78509.3 18.05 25. West Bengal 30540.09 8.12 3246.09 9.18 239.45 4.82 577.73 7.22 197.49 9.87 419 5.08 4679.76 7.99 35219.85 8.10 TOTAL 376318.01 100.00 35359.07 100.00 4972.63 100.00 8000.00 100.00 2000.00 100.00 8255.69 100.00 58587.4 100.00 4341905.44 100.00
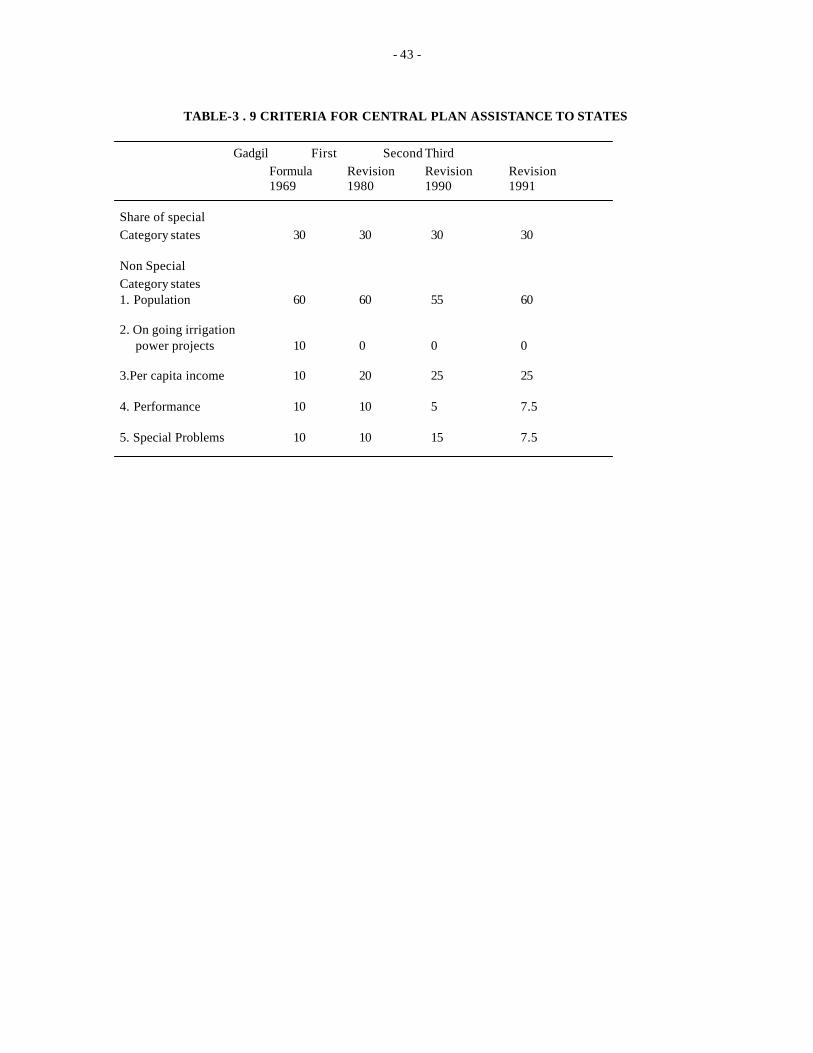
- 43 -
TABLE-3 . 9 CRITERIA FOR CENTRAL PLAN ASSISTANCE TO STATES
Gadgil First Second Third
Formula Revision Revision Revision 1969 1980 1990 1991 Share of special
Category states 30 30 30 30 Non Special
Category states 1. Population 60 60 55 60 2. On going irrigation power projects 10 0 0 0 3.Per capita income 10 20 25 25 4. Performance 10 10 5 7.5 5. Special Problems 10 10 15 7.5
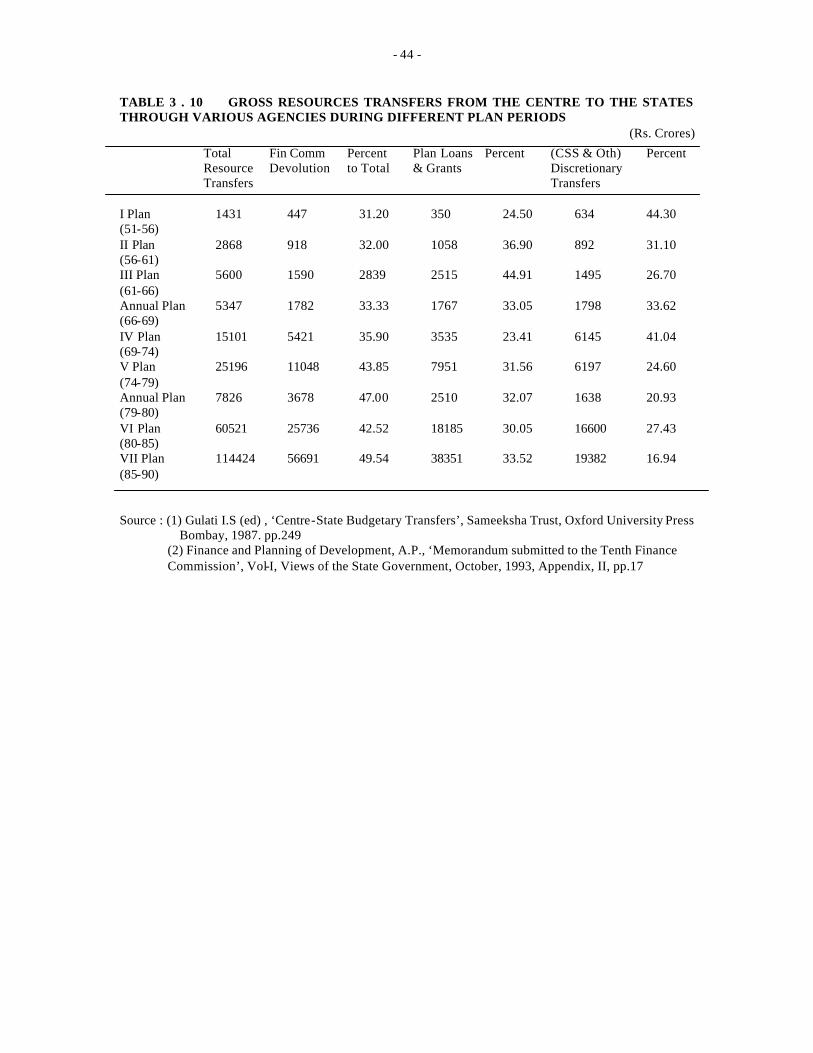
- 44 -
TABLE 3 . 10 GROSS RESOURCES TRANSFERS FROM THE CENTRE TO THE STATES THROUGH VARIOUS AGENCIES DURING DIFFERENT PLAN PERIODS
(Rs. Crores)
Total Fin Comm Percent Plan Loans Percent (CSS & Oth) Percent Resource Devolution to Total & Grants Discretionary Transfers Transfers I Plan 1431 447 31.20 350 24.50 634 44.30 (51-56) II Plan 2868 918 32.00 1058 36.90 892 31.10 (56-61) III Plan 5600 1590 2839 2515 44.91 1495 26.70 (61-66) Annual Plan 5347 1782 33.33 1767 33.05 1798 33.62 (66-69) IV Plan 15101 5421 35.90 3535 23.41 6145 41.04 (69-74) V Plan 25196 11048 43.85 7951 31.56 6197 24.60 (74-79) Annual Plan 7826 3678 47.00 2510 32.07 1638 20.93 (79-80) VI Plan 60521 25736 42.52 18185 30.05 16600 27.43 (80-85) VII Plan 114424 56691 49.54 38351 33.52 19382 16.94 (85-90) Source : (1) Gulati I.S (ed) , ‘Centre-State Budgetary Transfers’, Sameeksha Trust, Oxford University Press Bombay, 1987. pp.249
(2) Finance and Planning of Development, A.P., ‘Memorandum submitted to the Tenth Finance Commission’, Vol-I, Views of the State Government, October, 1993, Appendix, II, pp.17
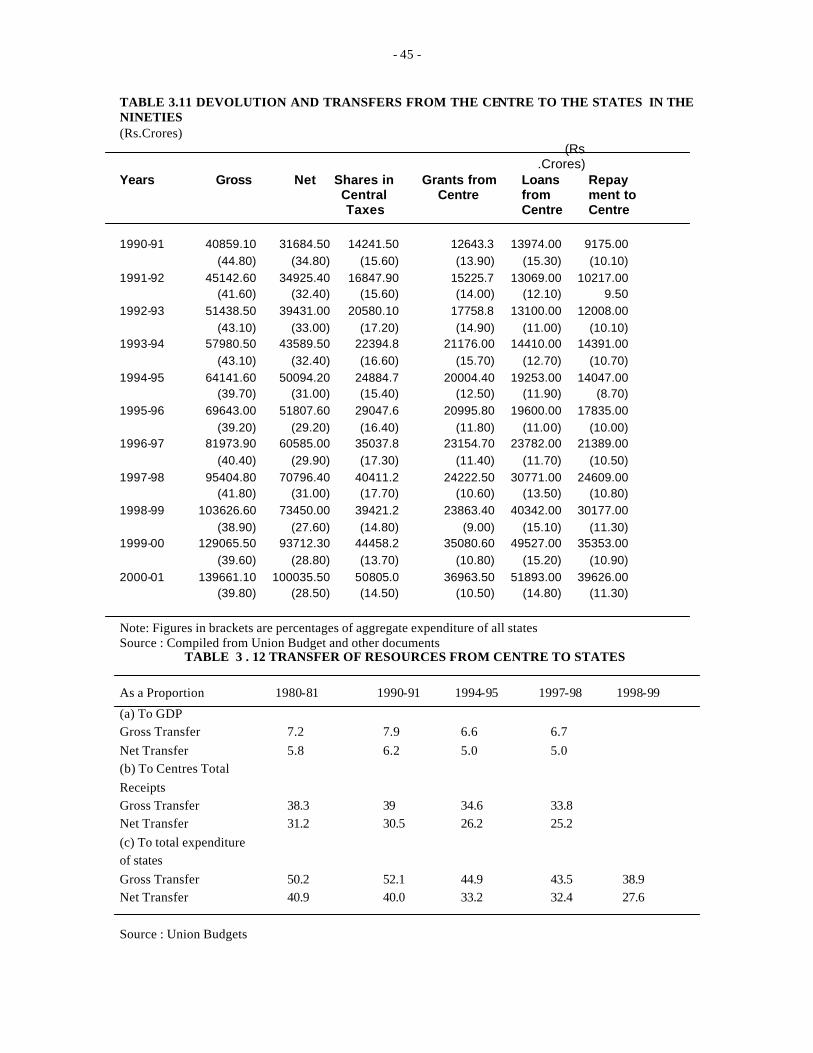
- 45 -
TABLE 3.11 DEVOLUTION AND TRANSFERS FROM THE CENTRE TO THE STATES IN THE NINETIES (Rs.Crores) (Rs
.Crores)
Years Gross Net Shares in Central Taxes
Grants from Centre
Loans from Centre
Repay ment to Centre
1990-91 40859.10 31684.50 14241.50 12643.3 13974.00 9175.00 (44.80) (34.80) (15.60) (13.90) (15.30) (10.10)
1991-92 45142.60 34925.40 16847.90 15225.7 13069.00 10217.00 (41.60) (32.40) (15.60) (14.00) (12.10) 9.50
1992-93 51438.50 39431.00 20580.10 17758.8 13100.00 12008.00 (43.10) (33.00) (17.20) (14.90) (11.00) (10.10)
1993-94 57980.50 43589.50 22394.8 21176.00 14410.00 14391.00 (43.10) (32.40) (16.60) (15.70) (12.70) (10.70)
1994-95 64141.60 50094.20 24884.7 20004.40 19253.00 14047.00 (39.70) (31.00) (15.40) (12.50) (11.90) (8.70)
1995-96 69643.00 51807.60 29047.6 20995.80 19600.00 17835.00 (39.20) (29.20) (16.40) (11.80) (11.00) (10.00)
1996-97 81973.90 60585.00 35037.8 23154.70 23782.00 21389.00 (40.40) (29.90) (17.30) (11.40) (11.70) (10.50)
1997-98 95404.80 70796.40 40411.2 24222.50 30771.00 24609.00 (41.80) (31.00) (17.70) (10.60) (13.50) (10.80)
1998-99 103626.60 73450.00 39421.2 23863.40 40342.00 30177.00 (38.90) (27.60) (14.80) (9.00) (15.10) (11.30)
1999-00 129065.50 93712.30 44458.2 35080.60 49527.00 35353.00 (39.60) (28.80) (13.70) (10.80) (15.20) (10.90)
2000-01 139661.10 100035.50 50805.0 36963.50 51893.00 39626.00 (39.80) (28.50) (14.50) (10.50) (14.80) (11.30)
Note: Figures in brackets are percentages of aggregate expenditure of all states Source : Compiled from Union Budget and other documents
TABLE 3 . 12 TRANSFER OF RESOURCES FROM CENTRE TO STATES
As a Proportion 1980-81 1990-91 1994-95 1997-98 1998-99 (a) To GDP
Gross Transfer 7.2 7.9 6.6 6.7
Net Transfer 5.8 6.2 5.0 5.0
(b) To Centres Total
Receipts
Gross Transfer 38.3 39 34.6 33.8
Net Transfer 31.2 30.5 26.2 25.2
(c) To total expenditure
of states
Gross Transfer 50.2 52.1 44.9 43.5 38.9
Net Transfer 40.9 40.0 33.2 32.4 27.6
Source : Union Budgets
- 46 -
3 . 2 CHANGING POLICY FRAMEWORK -ECONOMIC REFORMS
While reviewing the recent “Economic Reforms” and their impact on public expenditure
management , it may be useful to set out the back drop and the time period for analysis as
the exercise in stock taking should provide opportunities to draw lessons from the recent
experiences and enable reshape policies and programmes to meet the continuing
challenges.
Dr.C.Rangarajan has pointed out that “ Economic Reforms come in waves. In our own
country , the first wave of reform started with the launching of Planning with an emphasis
on industrialisation , more particularly of heavy industries. The second wave , the precise
dating of which may be difficult , began when it was found that the growth rate was weak
and the trickle down effect was not adequate and when the need to focus directly on
poverty alleviation became evident. The third wave which began in the late Eighties
gathered momentum after 1991. The period since 1991-92 has seen some important
changes in the approach to and content of Economic Policy.” 1
But most discussions on Economic reforms in India have concentrated on the policy
changes initiated and implemented in the Eighties and the Nineties. Some set the date of
its commencement as 1984 when Sri Rajiv Gandhi ‘s Government launched his New
Economic Policy , with promises to open up the economy for achieving faster growth
And others as 1991 when Sri P.V.Narasimha Rao’s Government , formulated and set on
course a multi pronged programme for restructuring institutions and reorienting
philosophies and programmes impacting on economic development .
Dr.Arjun Sen Gupta 2 points out that ,” the Economic Policies that were introduced in
1991 , following a balance of payment crisis and which formed the basis of the letter of
intent of policies approved by the IMF , are generally described as the programme of
India’s Economic Reforms .” and draws attention to the existence of two views (a) Vijay
Joshi and I.M.D.Little 3 in their book India’s Economic Reforms 1991-2001, Oxford
1996 stating that “ India’s reforms programme began in the middle of a macro-crisis that
erupted in 1991.” (b) Dr. Montek Ahluwalia 4, who observed in an 1994 article , on
India’s Economic Reforms , that several policy changes were initiated in the 1980s ,”to
1.Dr.C.Rangarajan ,’Economic Reforms in India Some Issues and Concern’ Convocation Address at the University of Hyderabad. March 2000 (published in Asian Economic Review Vol.42 No.1 Pg .1 April 2000) 2.Dr.Arjun Sengupta .” India’s Economic Reforms and the Art of the Feasible ,” Economic and Political Weekly Vol XXXV. No 51 Dec 16, 2000 , Pgs 4485 to 4498 3.& 4. Cited in 2. Above.
- 47 -
mitigate the rigours of the control regime , lower direct tax rates , expand the role on both
trade and foreign investment .” later stating in an 1999 article that India’s Economic
reforms began in 1991 .Dr.Ahluwalia however distinguished two reforms programmes by
stating that the reform programme of 1991 . “though gradualist in its approach was
nevertheless very different from the incremental reforms of the 1980s.
It is possible to see Indian Economic reforms not just as a response to the perceptions on
and experience of domestic policies and programmes but also as a rather lagged response
to the transformation of industrial and trade regimes in several countries notably
Europe. Setting the international context , Dr. I.G.Patel 5 has in the preface to his
Economic Reforms and Global Change ; 1998 observed , “ Economic Policy has
witnessed a virtual revolution through out the world since the early eighties. In India too,
there has been a sea change atleast since 1991.”
PHILOSOPHICAL BASE
Offering what could be considered as the philosophical base of the Reforms Programme
of 1991, Prime Minister Sri P.V.Narasimha Rao 6 has in his preface to the Eighth Plan ,
stated “The Eighth Plan is being launched at a time of momentous changes in the world
and in India. The international political and economic order is being restructured
everyday and as the Twentieth Century draws to a close , many of its distinguishing
philosophies and features have been swept away. In this turbulent world , our policies
must also deal with changing realities. Our basic policies have stood us in very good
stead and now provide the opportunity to respond with flexibility to the new situation ,
so that we can work uninterruptedly towards our basic aim of providing a rich and just
life for our people.”
The then Prime Minister proceeded to point out that “ Planning has been one of the pillars
of our policies since independence and our present strength derive from its achievements”
and that , “ there is today a recognition that in many areas of activity , development can
be best ensured by freeing them of unnecessary controls and regulations and with
drawing state intervention. At the same time , we believe that the growth and
development of the country cannot be left entirely to the market mechanism. The market
can be expected to bring about an “equilibrium” between “demand “ backed by
5. Dr.I.G.Patel Economic Reform and Global Change , Macmillian India 1998. 6. Sri P.V.Narasimha Rao , preface to the Eighth Five Year Plan (1992-97) Planning Commission New Delhi 1992.
- 48 -
purchasing power and “supply”, but it will not be able to ensure a balance between
“Need” and “Supply” . Planning is necessary to overcome such limitations of the market
mechanism. Planning is essential for macro economic management , for taking care of
the poor and the downtrodden , who are mostly outside the market system and have little
asset management. It is thus not a choice between the Market Mechanism and Planning:
the challenges is to effectively dovetail the two so that they are complementary to each
other. ”
STATE AND MARKET INTERFACE
As Dr.Rangarajan 7 has since explained in the 1950s and 1960s , the dominant view in
economic literature was that Government must play a role in correcting market failures in
the area of allocation of resources over time, because of the ‘myopic’ nature of market
participant , four decades of development experience world over has shown that there can
be “government failures” as well , resulting not only in economic losses due to
misallocations of resources arising from faulty investment decisions but also from
diversion of resources to rent seeking activities because of the very regulations
themselves. Dr.Rangarajan has observed that , “ if there is a lesson to be drawn from the
development record of the last four decades, it is that there can be both “ government
failure “ and market failure “ and the critical issue is not so much the presence or absence
of the state intervention but the extent and quality of that intervention.”
It is possible to analyse economic policy formulation and implementation in India , in
terms of the changing boundaries of state and market , and the emerging new balances as
a result of Economic Reform. In a lecture delivered at the Indian Institute of Economics
in August 1999 and published in the Asian Economic Review in Dec 1999 , Dr. Y.V
Reddy 8 analysed the role of State in Economic activity from a functional point of view
classifying state into (a) Producer state -–Producing commercial goods and services.(b)
Regulatory state setting and enforcing rules that encourage or discourage economic
activities of market participants.(c) facilitator state – providing public goods such as
police , judiciary , roads etc. and (d) Welfare state providing a wide variety of merit
goods such as education and health services.
Drawing attention to the process of reforms and the new balances that are emerging as
both causes and consequences of a changing mix between state and market and
7. Dr.Rangarajan in 1. Cited above. 8. Dr.Y.V Reddy ,State and market : Altering the Boundaries and Emerging Balances , Asian Economic Review Vol 41.
- 49 -
emphasising that this does not happen in isolation but in relation to other balances like
that vertically between Centre and Provinces , between public and private sectors ;
funding and provision of services , poor and non poor , organised employment and self
employment and finally rural and urban areas. Dr. Reddy has urged that “ analysts need
to have an appropriate understanding of these emerging new balances to appreciate the
stability and pace of Economic Reforms.”
EQUITY AND EFFICIENCY
Economic Planning in India has been directed towards objectives of Growth with Social
Justice , Self Reliance and Balanced Regional Development, assigning important place in
programme formulation and implementation to considerations of equity and distributive
justice. There is a school of view that the rate of growth of the Indian Economy has been
relatively lower than it could have been mainly on account of multiple objectives .
In his paper ,” New Economic Policies : A Historical Perspective ,” Dr. I.G.Patel 9 offers
a view that “in our anxiety to increase the supply of factors of production and reduce the
constraints on growth and out of excessive zeal for distributional justice , we have often
overlooked the importance of an efficient use of existing resources….. the kind of use
that generates the maximum growth potential for the future”, Dr. Patel however observes
that efficiency is a dynamic concept and its best promoters , apart from entrepreneur ship
, skills and capital , are good information , competition with a level playing field,
transparency , relative stability in policies and improvements in technology.” and points
out “efficiency , transcends the domains of micro economics as narrowly and
traditionally conceived and requires some thing more than competitive markets.”
GLOBALISATION AND NAT ION STATE
The requirement of Capital . skills , technology and the like , often need free flow of
these factors across the borders of nation and offer justification for globalisation .
Answers to key questions whether globalisation constrains national autonomy and
whether it tends to aggravate inequalities , depend on whether the analysis is made in
economic terms or in political terms taking into account the dilemma created by the fact
that markets are increasingly international in scope while governments remain national
in jurisdiction and character .
9.Dr.I.G.Patel Opinion cited.
- 50 -
While economic analysis can certainly provide broad guidelines to governmental policy
and action, experience reveals that ultimately it is the power play between various interest
groups – business industry and social that provide the vital inputs for decisions on
economic policy.
But then there is the vital question on the desirability and effect of globalisation in an
unequal world.
UNCTAD’s Trade and Development Report 1997 10 stated .“ the big story of the world
economy since the early 1980’s has been the unleashing of market forces. The
deregulation of domestic markets and their opening up to international competition have
become universal features….Many commentators are optimistic about the prospect for
faster growth and for convergence of incomes and living standards which greater global
competition should bring …. However ,…. Since the early 1980s the world economy has
been characterised by rising inequality and slow growth. Income gaps between North and
South have continued to widen … In 1965 , the average per capita income of the G-7
countries was 20 times that of the world’s poorest seven countries , By 1995 , it was 39
times as much …Polarisation among countries has been accompanied by increasing
income inequality within countries … In many countries , the per capita income of the
poorest 20 % now averages less than one tenth of the richest 20 %. …. Indeed , the
hollowing out of the middle class has become a prominent feature of income distribution
of many countries.” TDR 1997 points out that over the past decade , the world economy
has settled down to an average growth rate of 3 % per year , 2 % points lower than that
achieved between 1950-1997 and states ,“Such a relatively modest rate can solve neither
the North ‘s labour market problems nor the South’s poverty problem nor will it allow for
a narrowing of the North –South divide.”
COMPONENTS OF REFORMS
Economic Reforms programmes has several components (i) Fiscal reform(ii) Industrial
policy reform (iii) Trade Reform (iv) Monetary reform etc. Government of India’s
Economic survey 1998-99 pg.809 , enumerates the various policy measures taken in
industry , infrastructure, trade policy , financial and banking sector, Taxation policies ,
foreign investment (Direct and institutional , external finance (Multilateral assistance and
commercial borrowing). All these have meant restructuring of the various Government
Departments , and creation of New Institutional Mechanisms , to subserve the basic
10.‘Globalisation , Distribution and Growth ’;Trade and Development Report 1997 , UNCTAD , Geneva

- 51 -
objectives of Economic reform and carry out the difficult task of distancing the state from
direct intervention in Economic Activity and interplay of Market Forces .
Economic Reforms with some or all of the above components have been the prescription
offered by the experts serving the IMF and the IBRD , to the fiscal and financial
problems faced by several countries , which had , at different points of time reached ,
“crisis proportions.” The efficacy of these prescriptions have also come to be questioned
by several economists . The recent debate and divergence of opinion between the
economists serving the IMF and those serving the IBRD raise important issues of both
analytical and operational significance.
The vital issue in this debate , is whether the policy instruments and programmes can be
devised for a country and its economic problems by “experts” with a reputation at an
international level without exposure to the country experience in implementation of
programmes in that country or elsewhere and whe ther any such programme devised for
one country , even if it is deemed successful , could be prescribed for another country ?
Should Economic Policy making in developing countries be governed by Washington
Consensus, emphasising free market , global integration and macro economic stability?
At the centre of the controversy was the policy prescriptions made by the IMF Team for
some of the Asian Economies , and their effectiveness.Joseph Stiglitz 11 Chief Economist
of the IBRD , has argued that Washington consensus has a specious simplicity as the
world is too complicated and economic policy making faces too much uncertainty . In a
contribution to a Symposium on International Financial Architecture Stiglitz has argued
that the conditionalities approach of the IBRD and IMF has failed , and from now on , for
the sake of democratic accountability and economic sustainability each country must
own its development strategy .
INSTITUTIONAL FACTORS
Search for answer to these questions on universality of prescriptions of economic reforms
leads to a similar problem faced by development administrators , in the implementation
of administrative reforms suggested by International Aid Agencies over the years .
Difficulties in implementation were attributed to “ ineffective administrative procedures
and managerial techniques (b) inadequate development institutions and (c) inappropriate
governmental, structures ,” and it was felt that the complexities of programme
11.Joseph Stiglitz – Report in Economic Times 26-12-1999
- 52 -
administration requires ‘ a deep understanding of the varie ties that affect programme
implementation especially the political behavioural , cultural economic and physical
factors ’.{James W. Bjorkman 12 ) . This realisation has in its turn led to appreciation of
the need for institution building to accompany reforms to ensure effective
implementation
IMPLEMENTION: Milton Esman 13 (Elements of Institution Building ) defines institution
building as the planning , structuring and guidance of new or reconstituted organisations
which (a) embody changes in values functions physical and /or social technologies (b)
establish ,foster and protect new normative relationships and action patterns and (c)
obtain support and complementarity in the environment.
It has been India’s good fortune that its economic programmes and policies have been
formulated by persons with a reputation for erudition and clarity of thinking . As Dr.Ajit
Mazoomdar 13 has pointed out “the Planning processes , first improvised and then
improved upon , and the institutional mechanisms developed within the country’s
political and administrative frame works were in themselves , notable achievements.
After taking stock of the development perspective and implementation of various plans
and noting the gap between promise and performance , inability to undertake sustained
analyses of policy at different levels particularly of political constraints on development
and uniformity of design imposed by planning from Delhi , Dr.Mozoomdar draws
attention to one of the main problems of Indian Planning realised in the seventies that
“whereas the plans were articulated at the macroeconomic level , the detailed preparation
of investment projects and programmes was inadequate in many ways. Planning failures
at this level were due to the absence of relevant data in some cases , insufficient technical
and economic analysis and lack of impact evaluation .” However capacities were soon
developed for sectoral planning , project formulation , selection and appraisal ands post
evaluation. The policy instruments directed towards attainment of specific plan objectives
, like Fiscal Policy , Monetary and Credit Policies , Pricing Policy , Industrial Policy ,
Agrarian Policy , Labour and Employment policies , Reservation Policy etc. has also
been shaped and modified to suit changing circumstances. Despite efforts Indian
Development Plans are not considered to have been effective in achieving their objectives
and goals . Similar are the perceptions regarding administrative reforms.
12.James Bjorkman – Implementation and Development Policy in Strategic Concerns of the Public Sector in India. Special is sues of Public Enterprises , Vol 14, Nos 3 to 4 . International Centre for Public Enterprises Sept 1994. 13. Milton Esman , ‘Elements of Institution Building ‘ and Ajit Mazoomdar The Rise and decline of Development Planning in India , in Kuldeep Mathur ‘s Ed, Development Policy and Administration ,1996.

- 53 -
In respect of Economic Reforms Programmes in India , there is a distinctive difference in
the approach to the implementation as exemplified by the gradualism and attention to
institutional factors. While the reforms initiated in the mid eighties sought to modify
regulatory procedures and protocols relating to industrial licensing and other regimes , as
part of the process of liberalisation , the Economic Reforms launched in 1991 covered a
wider range of administrative changes and establishment of new institutional mechanisms
in the areas of industrial licensing, capital market and foreign investment regulation ,
prices and distribution controls , foreign exchange management , apart from measures
designed to bring public finance back on the rails with fiscal reform measures.
Experience in the implementation of programmes and measures in the above areas led to
the realisation that while these were responses to a crisis situation , they were not in
themselves adequate to ensure sustained growth of the Indian Economy. This led to the
launching what is described as the Second Generation Reforms to grapple with the
structural features of the Indian economy covering land reforms , public sector
enterprises reforms , labour laws , capital market and competition policies and the
financial and banking sector reforms. The need for Government to consider in depth
several vital issues and bring about changes in the legislative framework has been an
important aspect of the second generation reforms.
It is significant that while some degree of political consensus appeared to have been
implicit in the implementation of the First Generation Reforms, marked by continuity in
economic policies pursued by the Union Government despite changes in the ruling
political alignments , the Second Generation Reforms have , even in the stage of
launching faced a good measure of opposition and public protest.
The relative ease with which the First Generation measures got introduced and taken to
implementation stage was on account of the calibration of the policies to suit the Indian
psyche and ethos as also to the creation of new or redesigning existing institutional
mechanisms. To illustrate in the area of pricing policies the Agricultural Prices
Commission established in the sixties has been restructured as the Commission on
Agricultural Costs and prices. In the Industrial sector the Statutory Tariff Commission
has been replaced by the Bureau of Industrial Costs and Prices , a diluted version carrying
no mandatory status , quite possibly as a salute to the emerging free market mechanism.
However in the vital area of health and medicine , requiring regulation of drug prices , a
- 54 -
Pharmaceutical Pricing Authority has been created to deal with the industry specific
issues of research ,development and manufacture costs and pricing.
Among the host of procedural and institutional changes impacting on the capital market
and corporate sector is the abolition of the office of the Controller of Capital Issues and
the establishment of a statutory body , Securities and Exchange Board of India to deal not
only with regulation of capital issues but also act as a watch dog of the corporate world ,
to usher proper practices of corporate governance.
In the area of Public Sector Management, measures were taken to increase the autonomy
of PSU management and to relax the grip of the Administrative Ministries and the
Bureau of Public Enterprises functioning under the Ministry of Finance . The adoption of
the system of Memorandum of Understanding between the Administrative Ministry and
the PSU and the new system of performance evaluation , the designation of some
enterprises as Navratna Enterprises , with larger powers for capital investment and
commercial decisions were all part of a system of distancing the public enterprises from
the Government and taking them closer to the markets in which they were operating.
The study of modes of withdrawal of the state from commercial activities by embarking
on a process of divestment of Government ownership was entrusted to the Disinvestment
Commission set up as a independent body to recommend the levels and modes of
divestment of government shares in specific enterprises. After the Commission had
completed the studies and made recommendations in respect nearly 50 enterprises , the
task has been entrusted to a newly created Department of Disinvestment to propose the
levels and modes of disinvesment in public sector enterprises for the consideration of an
Inter Ministerial Committee of Secretaries before a decision by the Cabinet Committee
on Disinvestment .
By far the most far reaching changes impacting on the economy have been in the
financial and banking sectors . The appointment of two committees , both chaired by Sri
M.Narasimham , a financial administrator with deep domestic experience and vast
international exposure, to study and make recommendations of the changes needed in the
financial sector and the banking system was a move designed to ensure that the changes
were calibrated to meet the specific requirements of the various subsectors and to carry
out change without affecting continuity of operations of the institutions in these vital
sectors.The introduction of prudential regulations and prescription of norms for Capital
Adequacy , Asset Quality , Management Earnings ,Liquidity and Systems Control
- 55 -
(CAMELS) have reinfused a degree of discipline in the banking system. But the Reforms
appear to have affected the credit availability to the priority sectors of agriculture and
small scale industries. The changes have not also effectively improved the position
relating to non performing assets. There is a view that the decline in morale of Bank
employees , and credit availability to priority sectors could be attributed to the
uncertainty resulting from structural reforms in the Banking Sector. The promulgation of
Regulations governing Non Banking Finance Companies by the Reserve Bank of India ,
though considered a bit belated has brought about some changes in the money market .
Overall the Banking Sector is still in a state of flux , though the operations have been
marked by some degree of continuity .
The plethora of laws governing industrial and business operations as also labour
management , and the time consuming procedures for judicial intervention were also
sought to be modified as part of the Economic Reforms. The Ministry of Finance
organised a project for Legal Adjustments and Reforms for globalising the
economy(LARGE) to review and rationalise various economic legislations.
The Ministry of Law and Justice , have brought into existence a new Alternative Dispute
Settlement Mechanism to speed up arbitration in commercial disputes , and the
Department of Company Affairs have proposed changes in the Companies Act to ensure
better corporate governance and changes in the Monopoly and Restrictive Trade
Practices Act to endure a more competitive Environment. The retuning of the legal
system in keeping with the major objectives of the Economic Reforms have been a major
area of concern because the implications of changes in the basic laws and procedures
need close study of their long term structural implications before they are given effect to .
The two specific areas relating to labour law legislation and foreign capital and exchange
regulations have posed some thorny questions for which answers have not been easy to
find. Sharp differences of opinion have arisen of the need for and level of foreign capital
participation in certain sectors of economy like Insurance , Media Management, and
Strategic Areas like oil exploration .Likewise the design and implementation of Exit
Policies for Labour and Amendment to the Labour Legislation as also the design of
Safety Net Mechanisms for labour have been marked by the need to take a careful view
of conflicting but equally valid view point of different interest groups. These differences
reflect the as yet unresolved areas of value judgements and long term goals in the Indian
economy.
- 56 -
The unwillingness of the elected government to rush into these areas with hasty
legislations has resulted in some criticisms from interested quarters that the Economic
Reforms have been slowed down. But the Union Finance Minister Sri Yeshwant Sinha
has clarified that India cannot be hustled into globalisation , and that it is the
responsibility of every government to manage globalisation properly. Sri Sinha has
explained that while the First Generation reforms initiated in the early nineties were
mainly administrative in character , the Second Generation reforms called for legislative
changes in areas relating to labour laws , small scale industries , public sector
privatisation and tightening the financial sector which are marked by difficult contentious
and controversial issues , with resistance from political and trade union quarters. Sri
Sinha asserted that “ Government has to be practical and patient in carrying them
forward ”.
The difficulties faced by the government and various organisations in sequencing the
various steps and carrying out the Second Generation Reforms serve , if any thing to
underline the importance of institutional factors in Economic Reforms. It may be useful
in this regard to take note of the interaction between the process of reform and major
institutions , playing pivotal role in economic decision making in India like the Planning
Commission , the State Governments and other organisations .
3. 3 ECONOMIC REFORMS , PLANS AND UNION BUDGET
While reviewing the Management of Public Expenditure by the State Governments
during the era of Economic reforms, one should take into account certain philosophical
changes impacting on the planning process as also procedural and policy changes in the
broad area of transfer of resources from the Centre to the States that became prominent
feature of the period. These centred on the role of the State in economic activity and
sought to make a break with the previous four decades of planning emphasising the
bounden duty of the State to not only for the economic growth but also ensure that this is
accompanied by Social Justice, Balanced Regional Development and Self Reliance.
While Economic Reforms launched in July 1991 sought to redefine the role of the State
and of market forces, in promoting and sustaining economic activity, the then Prime
Minister Shri P.V. Narsimha Rao had taken care to strike a balanced note in this regard.
While drawing attention to the momentous changes taking place, with the restructuring of
international political and economic order, and to the recognition that in many areas of
activity development can be ensured by freeing them from unnecessary controls and with
- 57 -
drawing state intervention, Shri Rao had made it clear that “the growth and development
of the country can not be left entirely to the market mechanism ” and that planning is
necessary to over come the limitation of the market mechanism which can be expected
bring about an equilibrium between “Demand” backed by purchasing power and
“Supply” but will not be able to ensure a balance between “Need” and “Supply”. In his Preface to the Eighth Five Year Plan (1992-97) Shri. Pranab Mukerjee Deputy
Chairman, Planning Commission clarified, that the Plan was being launched against the
backdrop of wide spread changes which have altered the international social and
economic order, and that even the Centralised Economy were opening up to free market
forces and competition and pointed out that in India, “the fiscal problems restrict the
ability of the Governments to provide needed resources to maintain the impetus of
growth. At the same time we have to ensure that the stimulus for sustaining the long term
growth of the economy is strengthened in the immediate future the process of economic
reforms and structural adjustments has to be carried forward without sacrificing the
imperatives of development. This calls for a dedicated balancing options in the
formulation of the plan. We have to start rolling back the public sector from those sectors
of the economy where the private sectors can move in and step up on investment in the
social sector . At he same time we have to ensure that the infrastructure needed for
economic development continues to grow in the transitional period.” The Eighth Five Year Plan was expected to be “a Plan” for managing the change, for
managing the transition from Centrally planned economy to market led economy without
tearing our socio cultural fabric. Deputy Chairman had also indicated that the Planning
Commission was working out a monitoring system which will provide timely signals to
the performance of the State Governments the priority sectors of the plan.
ECONOMIC REFORMS AND THE UNION BUDGET It is in this context that one must turn to the Budget of July 1991 , introduced by
Dr.Manmohan Singh, making a sharp break with several of the basic objectives and
methods of Planned Development and announcing several measures which have come to
be called New Economic Policy. This came about in the context of a Balance of Payment
Crisis faced by the Govt of India which was attributed to the persistent high fiscal and
budgetary deficits of the Union Government and called for fiscal correction to place the
economy back on the rails.
- 58 -
Viewed in some circles as a successor to the policy on liberalisation initiated in 1984 by
the Government of India, the New Economic Policy laid emphasis on action in five
policy areas-
(1) achievement of macro economic balance with high investment levels (2) reforms &
redefinition of the role of public sector (3) reducing and restructuring domestic control
over production and investment licensing (4) reducing the degree of protection to Indian
Industry (5) Opening up to foreign investment.
While the above areas appeared to emphasize liberalization of the economy, the policy
makers appeared to be more conscious of the fiscal priorities in the short run, and listed
for the first two years of the reforms, measures to bring about (a) Reduced Government
expenditure (b) Reduced Defence Expenditure (c) Increase in administered prices like
power, fertilizers; (d) Reduction of subsidy, to be followed by restriction of access to the
PDS to the needy. (e) Reduction of job in Government Departments, Public Sectors under
taking (PSUS).
Many of these measures appear to have drawn their inspiration from World Bank
Country Economic Memorandum for India presented to the Aid India Consortium
Meeting in Paris in May 1990 and reiterated the Country Economic Memorandum for
India in 1991. Following the suggestions in 1991 Memorandum of the World Bank
Dr.Manmohan Singh wrote to the Managing Director of the International Monetary Fund
in August 1991 presenting Govt of India’s Memorandum of Economic Policies .
indicating the steps mentioned above .
It was only on 16th December 1991 that the Finance Minister placed in the Parliament this
Memorandum as an annexure to his statement on Management of the Economic crisis . It
is largely for this reason , that analysts view the economic reforms measure as inspired by
the International Financial Institutions.
An objective analysis may however lead us to understand that ‘Economic Reforms’ had
really begun in early eighties, when late Shri Rajiv Gandhi promised a “Government that
works faster” and launched a New Economic Policy, with promises to open up the Indian
economy for achieving faster growth with a regime of lower direct taxes, expanded role
for the private sector, liberalisation of the licensing system, and easing of controls on that
and foreign investment. Those set of measures, initiated with some degree of concern
over the slow pace of domestic economic growth were really the commencement of the
- 59 -
transition from the era of controls to the era of relatively greater freedom from
Government in economic operations.
The reforms of the Eighties were, domestic in their origin, born out of a perception that
the three decades of planning and mixed economy with partial control had resulted in a
relatively slower pace of development while nation was striving for larger objectives like
growth with social justice, self reliance and balanced regional development.
While the New Economic Policy was launched , with claims of the need to improve
efficiency in utilisation of resources and improve the quality of Public Expenditure
Management , with focus on fiscal consolidation , it soon became apparent that fiscal
correction measures , enforced through budgetary instruments could while marginally
improve the rate of growth of the Economy , seriously impact on extra economic
objectives of equity and balanced regional development .
Dr.Sanjaya Baru 14 has drawn attention to the awareness in Government circles of the
likely deflationary pressure and high costs of social adjustment bound to be faced by the
poor in the process of macro level fiscal consolidation by the Government of India.
Sanjaya Baru had argued that while the note of the President of the World Bank Louis
Pretzel to the Board of Governor, recommending India’s Structural Adjustment loan and
India’s Finance Minister, Dr.Manmohan Singh in his speeches on the Parliament had
both spoken of possible increases in Financial allocations for certain schemes in social
sectors in order to compensate for the iniquitous impact of fiscal adjustment, the actual
provisions did not match these words.
This is supported with data of provisions for Plan and Non Plan Expenditure in the Union
Budgets for ‘91-‘92, ‘92-‘93 and ‘93-‘94, indicating that “the share in total Government
Expenditure of important sectors like education, health, small scale industries and the
Public Distribution Scheme was not very significant .While the aggregate expenditure
increased considerably, the share of the Social Sectors in it was 15.4 % in 1991-92 ,
15.7% in 1992-93 and 16.2 % in 1993-94. Over the three years the budgetary increase
was less than one percent despite claims to the contrary that structural adjustment was
being carried with a care for the Human face. Sanjaya Baru has also drawn attention to
the impact of the reformist budget on the resources transferred to the states .
14. Dr.Sajaya Baru , New Economic Policy , EPW , April 10, 1993
- 60 -
Drawing attention to the argument that most of these sectors are under the purview of the
State Government and that Centre can do little by way of offering financial support, Dr.
Baru argued that the Centre –State dimension of the Union Budget were biased against
the States as evidenced by the disparity on the Budget support for Central Plan and for
Plan Assistance to the States.
Between 1992-93 and 1993-94 Total Budgetary support for the Central Plan had gone up
by 18.4 % while the Total Central Assistance to the State had gone up only by 2.8 %
further examination of the trends in the Budgetary support to the Central Plans and
Central assistance to the State Plan reveal that Plan Expenditure as a percentage of
Aggregate Expenditure had come down from 29.9% in ‘92-’93 to 25.7% in 2000-
01(RE), marked by a fall in the Budget support for Central Plan, as a share in Total
Expenditure from 16.1% in 1992-93 to 14.4% in 2000-01.Central Assistance to the State
Plan during the same period has also been marked by a similar fall from 12.8 % to 10.9 %
of the Centre’s Aggregate Expenditure.
This confirms that the fiscal consolidation objective of the Union Budget has adversely
affected Budget support for Plan Expenditure of the Centre and Central assistance to the
State Plans. Between 92-93 and 2000-01 the Non Plan Expenditure, as a percent of total
expenditure had gone up from 70.1% to 74.3% mainly on account of increase in the share
of interest payments (25.3% to 30% ) Defence Expenditure from 14.3% to 16.2% and
General Services, including police and pension, from 7.2% to 8.4% .The share of
subsidies for food, fertilizers and other items has gone down slightly from 8.9% to 8.0%.
A significant point to be noted in the context of Management of State Government
Finances is that, the net resource transfers from centre to the states excluding interest
payments had , as a percentage of Gross Domestic Product come down from 5.7 per cent
in 1990-91 to 4.7 per cent in 2000-2001 , and total assistance to state and UT Plans from
2.4 per cent in 1991-92 to 1.7 per cent in 2000-2001 . This is dealt in greater detail
elsewhere .
For a perspective view at macro economic level one can refer to Tables 1.1 , 1.2 and 1.3
for obtaining a clear view of increasing total Government Expenditures , their
distribution into Plan and Non Plan Categories and also Development and Non
Development Categories and the changes in the relative roles of the Centre and States and
the Union territories in bearing Plan and Development Expenditure.
- 61 -
After taking into account inter governmental adjustments, in 1980-81, the total
expenditure of Centre amounted to Rs. 23,194 crores and that of the State Rs. 22,770
crores, totaling 37,879 crores. By 1990-91, the Central Expenditure had increased by
nearly 5 times to Rs. 1,07,995 crores and the corresponding figures for the states was Rs.
91,242 crores totalling Rs. 1,63,673 crores. During 1999-2000 the Development and Non
Development Expenditure of the Central and the States combined accounted for a total
of Rs. 5,55,458 crores, or 28.4 Percent of the GDP.
As pointed out in the Study of the Finances of State Government 15, by 1999-2000 “the
total expenditure of State Government (Rs. 3,25,634 crores) 16.6% of GDP have even
over taken those of the centre (Rs. 3,13,258) 16% of the GDP in 1999-2000(R.E)”
.However when we review the trends in Plan Expenditure with reference to shares of
Centre and the States, it is seen that, while the States had accounted for 63.52% of total
plan outlay, during the I FYP, their share had come down to 45.27% in the II FYP,
49.28% in III FYP, 48.64% in IV FYP before rising to 50.77 % in the V FYP and again
coming down to 45.25% in VI FYP, 40% in VII FYP, further to 38.71% in VIII FYP.On
the other hand the share of the Centre which was 36.02% of total Plan Expenditure during
the First FYP period had increased to 59.52% during the VIII FYP The relative shares
of the Centre and the States in Total Plan Expenditure from the First Plan to the Eighth
Five Year Plan has been brought out in Table 1.4 . For the Ninth Five Year Plan a total
outlay of Rs. 8,59,500 crores has been indicated , with the Centre accounting for Rs.
489361 crores and the States Rs. 3,69,839 crores . It emerges from the review of the actual pattern of budget provisions and public
expenditure during the nineties, that the envisaged careful balancing of the role of the
State and the Market did not materialise and permeate the planning process at the Centre
and in the States, and that a certain degree of philosophic confusion and policy haziness,
as also budgetary constraints had marked the implementation of the various
developmental programmes during the nineties. This was recognised even in the approach paper to the Ninth Five Year Plan placed
before the National Development Council in January 1997. Reviewing the growth
performance during the Eighth Plan (1992-97, which was “launched against the
backdrop of a severe balance of payments crisis triggered off by financial profligacy and
excessive borrowing of the Government which stated in the early 1980’s”, the Approach
paper outlined the structural reforms undertaken, and claimed that “the actual growth
15. EPW Research foundation (Finances of the States in its Time series presentation, May 19/2001)

- 62 -
performance of the economy appears to have surpassed the expectations”, with the
average growth rate during the first four years of the Eighth Plan reaching 5.7% per
annum as against the target growth rate of 5.6% per annum. The expression of
satisfaction at the overall sectoral growth rates was however moderated by the
recognition of interregional disparities in per capita income, increase in current daily
unemployment rate, substantial increase in food prices and short falls in expenditure in
social sectors like education, wealth and family welfare, women and child development,
housing water supply and urban development which depend exclusively on budgetary
support for financing their plan outlays.
The Approach paper pointed out that “there has been a decline in the share of the states in
total plan outlay. In the Eighth Plan it has declined 36.4 % as compared to the projected
41.5 %. What is the matter of concern is that when the States share decline the sectors
which suffer more severely are agriculture basic minimum services, health education”.16 The Midterm Appraisal of Ninth Five Year Plan published in October 2000, placed the
growth rate of GDP during the first three years of ninth five year plan at 6.2% per annum
on an average, as against a target of 6.4%, and indicated that “significant shortages in
growth performance have been recorded in agriculture, mining and quarrying and
manufacturing sectors” and that “investment target in these sectors were not likely to be
met in the last two years of the plan.” It also indicated that the targets were exceeded in
construction, communication, public administration and community services and that in
these sectors investment targets may be met.
The Appraisal pointed out that central budget support to the Ninth Plan may be around
87% of the plan target, comparing unfavorably with 93% realised during the Eighth Plan
and total public investments would be about 81% of the plan targets as against 84.5%
realised during the Eighth Five Year Plan. The appraisal also indicated that due to serious
slippage’s on public investments in physical and social infrastructure, there could be
weakening of the possibility of acceleration in the growth rate during the Tenth Plan
period.” Presenting a synoptic view of the Government of India’s Budgetary operations during the
era of Economic Reforms, the EPW Research Foundation pointed out that the data, “are
revealing, particularly in the context of their long term implications for development” and
16. ‘Approach Paper to the Ninth Five Year Plan 1997-2002; Planning Commission 1997 paras 1.13 to 1.32
- 63 -
that the Budgetary trends during the period prove that the actual performances has not
been even remotely comparable with the Five Year Plan targets and goals. The review
drew attention to two major developments. “first the objective of fiscal consolidation
which was sought to be achieved in the previous plan period, after the reform began, and
resulted in a fall in the domestic debt to GDP ratio from 59.7% in 1991 to 56.5% in 1997,
but this was based mainly on severe compression of Plan Expenditure in general and
investment in particular. Secondly the Centre’s Tax /GDP ratio which was as high as 11.3
% in 1989-90 had declined to 9.8% in 1994-95, standing in sharp contrast to the increase
of 2 to 4 percentage points experienced by some of the developing countries in the wake
of their economic reforms. According to this review the Ninth Plan objectives of
increased domestic investments and savings was dependent on increased public savings
and plan outlays, which, in the turn, hinged on a racing of the Tax /GDP ratio from 9.4%
in 1996-97 to 11.5% in 2000-01, and further the reduction of Centres fiscal deficit from
6.1% to 4.1% during this period was also based on the virtuous relationship between
increased plan outlays, improved growth and higher Tax/GDP ratios. On the other hand
the Government of India’s Budgets in recent years have been formulated with the single
objective of fiscal responsibility which is somewhat narrowly constructed. EPW
Research Foundation Review, asserts that “if experiences of the whole decade of the
1990’s is any guide, fiscal consolidation with reduced fiscal deficit, dispensing of RBI’s
support and reduced tax mobilisation had to perforce result in compression of all forms of
expenditure, which have development implications – Plan Expenditure, Social and
Physical Infrastructural Expenditures and Capital Expenditure.
Reviewing the impact of tax measures and expenditure patterns, EPW Research
Foundation points out that the Ninth Plan Period was marked by unusually large short
falls in the Annual Plan outlays, as compared with the Budget estimates, and argues that
the “root cause of Industrial recession experienced during the entire Ninth Plan has
something to do with the unrealised expectations of Annual Plan outlays” 17 . This may
not be acceptable to votaries of Economic Reform who have been arguing that Economic
Reforms , particularly measures of liberalisation have speeded up the rate of growth of
the Economy. The debate has been continuing , and light if any can be obtained only by ,
analysing the varying growth rates in different sectors of the Economy , and in particular
examine whether the fiscal consolidation measures taken in the form of budgetary
measures had any impact on the rate and direction of Economic Growth. A balanced view
could be taken , if one investigates the impact of liberalisation of procedures and
decontrol in the industrial sector , and the impact of import restrictions removal on Indian
- 64 -
agriculture and industry. The gains claimed in this sector may have to be measured
against the impact of budgetary conservatism on the Social Sector. Analysis of the Govt
of India Budget show that while aggregate budgetary expenditure increased from Rs.
143872 crores in 1993-94 to Rs. 335522 crores in 2000-2001 RE , as a percentage of
GDP it fluctuated around 12 per cent of GDP .But the allocations for all Social Services
and Poverty alleviation programmes , while increasing from Rs. 17851 crores in 1993-94
to Rs. 42455 crores in 2000-2001 RE , its proportion to the GDP had come down from
2.08 per cent to 1.87 per cent , this lending some measure of credibility to the critics who
argue that Economic Reforms , have adversely affected the Social Sector Expenditure.
It is in the context of State government Expenditure exceeding that of the Centre in
aggregate terms even while their share in Plan Expenditure declining relative to Centre’s
Expenditure that one must look at the quantum and quality of Public Expenditure in the
States and take note of the increasing attention paid by the Centre to Economic reforms
at the State level . It may be relevant to note that the states have begun in the late nineties,
to realise the importance of expenditure control and took important policy initiatives
towards fiscal reforms. This will be dealt with later
17.EPW Research Foundation, Finances of Government of India, EPW 14th April, 2001 page 1249.
VOLUME - II
GROWTH AND BUDGETARY PERFORMANCE OF THE STATES
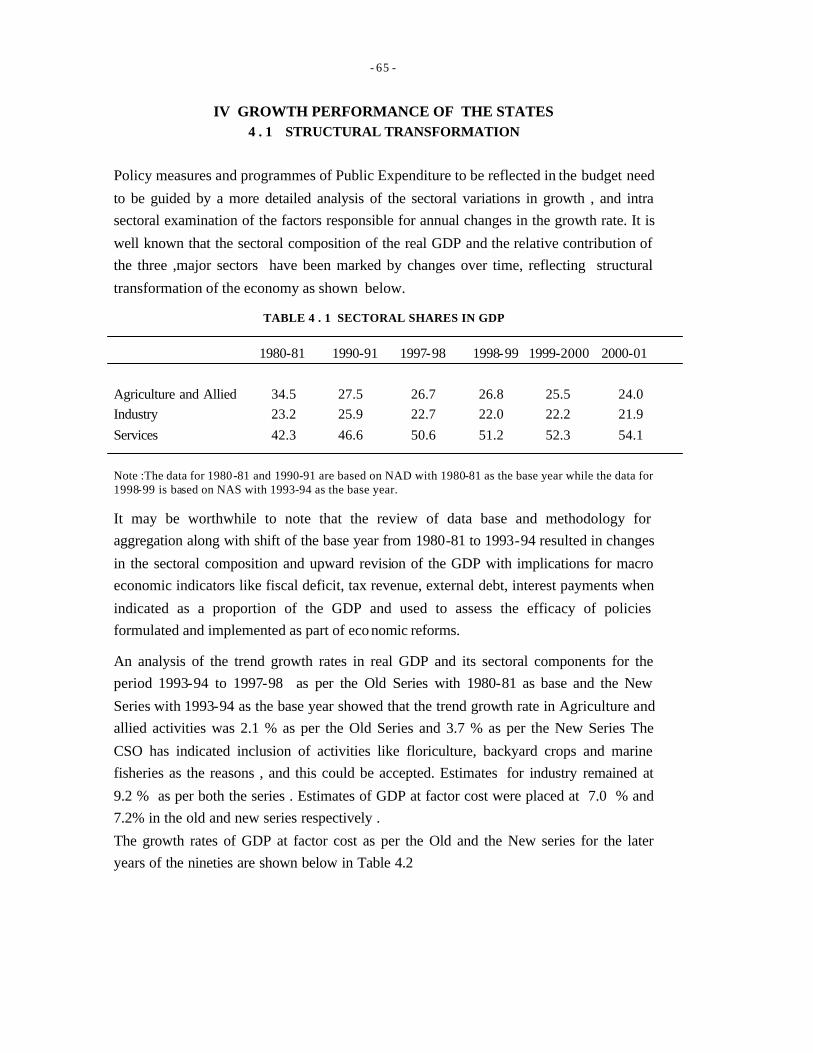
- 65 -
IV GROWTH PERFORMANCE OF THE STATES 4 . 1 STRUCTURAL TRANSFORMATION
Policy measures and programmes of Public Expenditure to be reflected in the budget need
to be guided by a more detailed analysis of the sectoral variations in growth , and intra
sectoral examination of the factors responsible for annual changes in the growth rate. It is
well known that the sectoral composition of the real GDP and the relative contribution of
the three ,major sectors have been marked by changes over time, reflecting structural
transformation of the economy as shown below.
TABLE 4 . 1 SECTORAL SHARES IN GDP
1980-81 1990-91 1997-98 1998-99 1999-2000 2000-01
Agriculture and Allied 34.5 27.5 26.7 26.8 25.5 24.0
Industry 23.2 25.9 22.7 22.0 22.2 21.9
Services 42.3 46.6 50.6 51.2 52.3 54.1
Note :The data for 1980-81 and 1990-91 are based on NAD with 1980-81 as the base year while the data for 1998-99 is based on NAS with 1993-94 as the base year. It may be worthwhile to note that the review of data base and methodology for
aggregation along with shift of the base year from 1980-81 to 1993-94 resulted in changes
in the sectoral composition and upward revision of the GDP with implications for macro
economic indicators like fiscal deficit, tax revenue, external debt, interest payments when
indicated as a proportion of the GDP and used to assess the efficacy of policies
formulated and implemented as part of eco nomic reforms.
An analysis of the trend growth rates in real GDP and its sectoral components for the
period 1993-94 to 1997-98 as per the Old Series with 1980-81 as base and the New
Series with 1993-94 as the base year showed that the trend growth rate in Agriculture and
allied activities was 2.1 % as per the Old Series and 3.7 % as per the New Series The
CSO has indicated inclusion of activities like floriculture, backyard crops and marine
fisheries as the reasons , and this could be accepted. Estimates for industry remained at
9.2 % as per both the series . Estimates of GDP at factor cost were placed at 7.0 % and
7.2% in the old and new series respectively .
The growth rates of GDP at factor cost as per the Old and the New series for the later
years of the nineties are shown below in Table 4.2
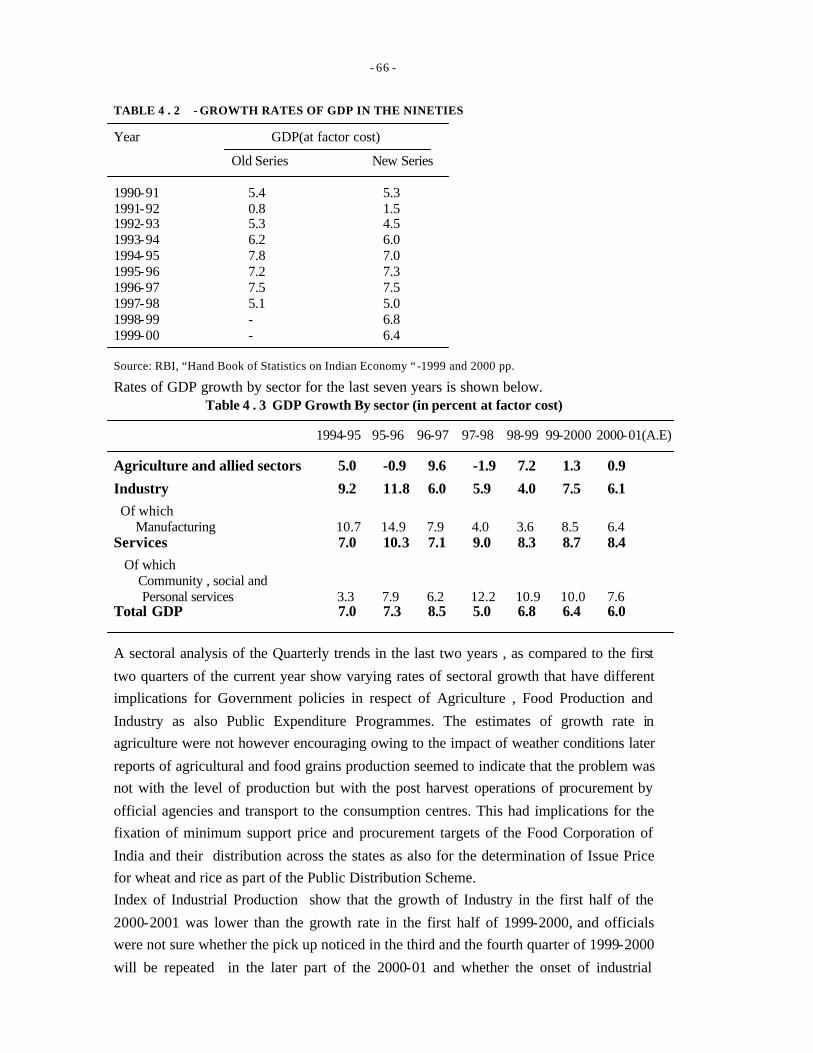
- 66 -
TABLE 4 . 2 - GROWTH RATES OF GDP IN THE NINETIES
Year GDP(at factor cost)
Old Series New Series 1990-91 5.4 5.3 1991-92 0.8 1.5 1992-93 5.3 4.5 1993-94 6.2 6.0 1994-95 7.8 7.0 1995-96 7.2 7.3 1996-97 7.5 7.5 1997-98 5.1 5.0 1998-99 - 6.8 1999-00 - 6.4 Source: RBI, “Hand Book of Statistics on Indian Economy “-1999 and 2000 pp.
Rates of GDP growth by sector for the last seven years is shown below. Table 4 . 3 GDP Growth By sector (in percent at factor cost)
1994-95 95-96 96-97 97-98 98-99 99-2000 2000-01(A.E)
Agriculture and allied sectors 5.0 -0.9 9.6 -1.9 7.2 1.3 0.9
Industry 9.2 11.8 6.0 5.9 4.0 7.5 6.1
Of which Manufacturing 10.7 14.9 7.9 4.0 3.6 8.5 6.4 Services 7.0 10.3 7.1 9.0 8.3 8.7 8.4
Of which Community , social and Personal services 3.3 7.9 6.2 12.2 10.9 10.0 7.6 Total GDP 7.0 7.3 8.5 5.0 6.8 6.4 6.0
A sectoral analysis of the Quarterly trends in the last two years , as compared to the first
two quarters of the current year show varying rates of sectoral growth that have different
implications for Government policies in respect of Agriculture , Food Production and
Industry as also Public Expenditure Programmes. The estimates of growth rate in
agriculture were not however encouraging owing to the impact of weather conditions later
reports of agricultural and food grains production seemed to indicate that the problem was
not with the level of production but with the post harvest operations of procurement by
official agencies and transport to the consumption centres. This had implications for the
fixation of minimum support price and procurement targets of the Food Corporation of
India and their distribution across the states as also for the determination of Issue Price
for wheat and rice as part of the Public Distribution Scheme.
Index of Industrial Production show that the growth of Industry in the first half of the
2000-2001 was lower than the growth rate in the first half of 1999-2000, and officials
were not sure whether the pick up noticed in the third and the fourth quarter of 1999-2000
will be repeated in the later part of the 2000-01 and whether the onset of industrial
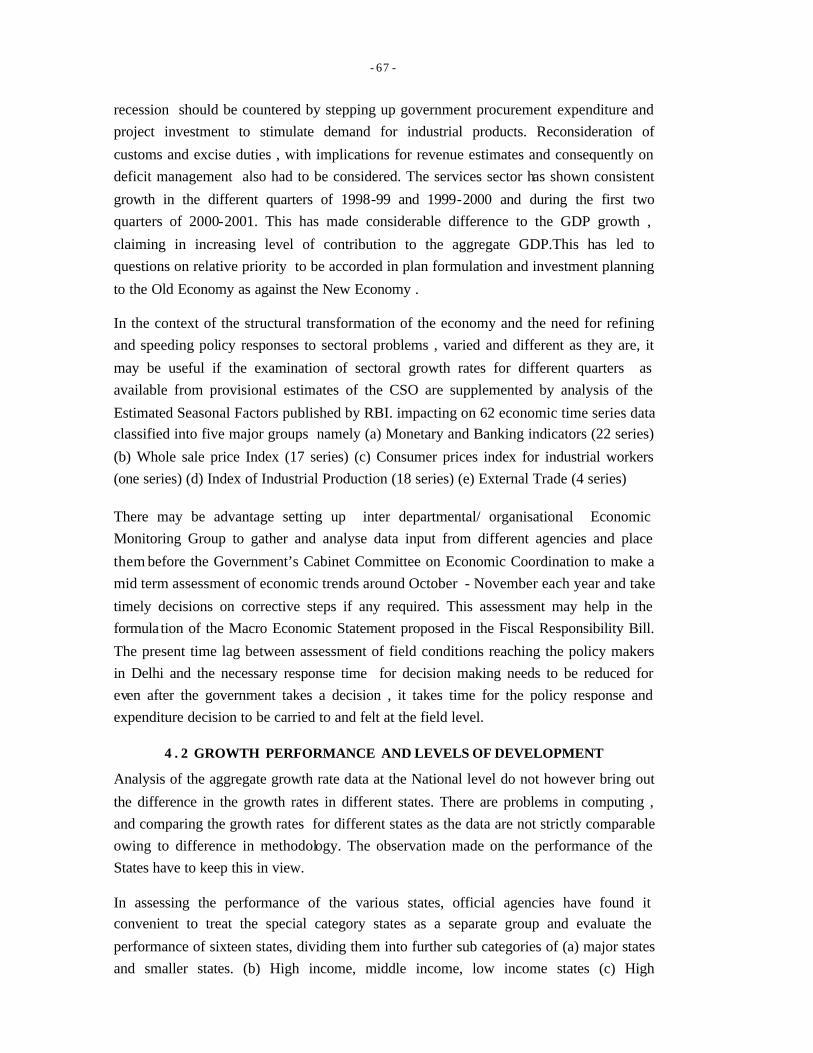
- 67 -
recession should be countered by stepping up government procurement expenditure and
project investment to stimulate demand for industrial products. Reconsideration of
customs and excise duties , with implications for revenue estimates and consequently on
deficit management also had to be considered. The services sector has shown consistent
growth in the different quarters of 1998-99 and 1999-2000 and during the first two
quarters of 2000-2001. This has made considerable difference to the GDP growth ,
claiming in increasing level of contribution to the aggregate GDP.This has led to
questions on relative priority to be accorded in plan formulation and investment planning
to the Old Economy as against the New Economy .
In the context of the structural transformation of the economy and the need for refining
and speeding policy responses to sectoral problems , varied and different as they are, it
may be useful if the examination of sectoral growth rates for different quarters as
available from provisional estimates of the CSO are supplemented by analysis of the
Estimated Seasonal Factors published by RBI. impacting on 62 economic time series data
classified into five major groups namely (a) Monetary and Banking indicators (22 series)
(b) Whole sale price Index (17 series) (c) Consumer prices index for industrial workers
(one series) (d) Index of Industrial Production (18 series) (e) External Trade (4 series)
There may be advantage setting up inter departmental/ organisational Economic
Monitoring Group to gather and analyse data input from different agencies and place
them before the Government’s Cabinet Committee on Economic Coordination to make a
mid term assessment of economic trends around October - November each year and take
timely decisions on corrective steps if any required. This assessment may help in the
formula tion of the Macro Economic Statement proposed in the Fiscal Responsibility Bill.
The present time lag between assessment of field conditions reaching the policy makers
in Delhi and the necessary response time for decision making needs to be reduced for
even after the government takes a decision , it takes time for the policy response and
expenditure decision to be carried to and felt at the field level.
4 . 2 GROWTH PERFORMANCE AND LEVELS OF DEVELOPMENT
Analysis of the aggregate growth rate data at the National level do not however bring out
the difference in the growth rates in different states. There are problems in computing ,
and comparing the growth rates for different states as the data are not strictly comparable
owing to difference in methodology. The observation made on the performance of the
States have to keep this in view.
In assessing the performance of the various states, official agencies have found it
convenient to treat the special category states as a separate group and evaluate the
performance of sixteen states, dividing them into further sub categories of (a) major states
and smaller states. (b) High income, middle income, low income states (c) High
- 68 -
budgetary deficit, low budgetary deficit and budgetary surplus states, depending on the
purpose of the analysis.
While attention has been focussed on Regional Imbalances , and Inter State Disparities in
levels of development , since the beginning of the Planning Era , and this attention has
taken the form of criteria for public investment including weightage for location in
backward areas and the resultant infrastructural disadvantages, the more recent emphasis
on efficiency , and financial performance of public sector have tended to shift the
attention away from the earlier objective of balanced regional development . This policy
shift , not very well articulated has to be kept in view , while reviewing the performance
of states in the 90s. LEVELS OF DEVELOPMENT
An important area needing attention from the point of view of management of public
expenditure, is the extent to which the implementation of plans and other programmes
have been able to reduce the inter-state disparities and intra-state differentials in
development. While analysts and policy makers have dealt with inter state disparities it
must be admitted that the five decades of development planning have , while contributing
to overall growth , have not been able to eliminate the inter-state differential in levels of
development and rates of growth .The Approach Paper to the Ninth Five Year Plan drew
attention to the evidence of deterioration of inter regional disparities in per capita income
, and pointed out that “ some of the populous and less developed state have experienced
growth rates which are lower than the national average”. (pg 7 Approach Paper to the
Ninth Plan 1997).
The problems of Backward areas in the country and districts within the states have
earlier received attention from policy makers and planners and have led to specially
designed packages for accelerated development. Committees appointed by the Planning
Commission on the eve of the Fourth Five Year Plan, like the B.D.Pande Committee on
Dispersal of Industries (1968) , the Wanchoo Committee appointed by the National
Development Council (1968) had dealt with the problem of identification of backward
areas or districts to provide incentives for industrial development and transport subsidies.
The Committee on Backward Areas (1972) headed by Dr.Sukhumoy Chakravarthy and
the National Committee on Development of Backward areas (1978-81 ) headed by Sri
B.Sivaraman , also dealt with the identification of districts for implementation of
employment schemes .
In 1997 the Planning Commission appointed a Committee for identification of hundred
most backward and poorest districts. This Committee headed by Dr.E.A.S Sarma paid
attention to the problem of persisting backwardness in certain parts of the country. On the
- 69 -
basis of indicators of (a) deprivation (b) Social infrastructure (c) Economic infrastructure
, the Committee developed an aggregate measure of Backwardness and identified 100
districts spread in several states . These districts were 38 in Bihar , 19 in Madya Pradesh
17 in Uttar pradesh , 10 in Maharashtra 4 in Orissa , 4 in West Bengal , 2 in Rajasthan
and 1 each in Haryana , Himachal Pradesh , Dadra Nagar Haveli . The Committee felt
that the North eastern states (consisting of Assam , Arunachal Pradesh , Nagaland ,
Manipur , Meghalaya , Mizoram and Tripura ) and the Jammu and Kashmir had certain
peculiar problems of Backwardness and needed an approach different from other poor
and Backward districts of the country. This aspect has been more than adequately covered
by the Planning Commission and Finance Ministry , devising packages for special
category states .
In 1999 the National Institute of Rural Development worked out Backwardness Index
Social Development Index and Infrastructure Development Index for all states , and the
Report observed that Uttar Pradesh , Rajasthan . Madhya Pradesh , Bihar , Orissa and
Meghalaya have shown high level of backwardness in all respects. The Social
Development Indices and Gender Development Indices presented in that study have also
shown high level of interstate and intra state variations.
These attempts have highlighted and spread awareness of the problems without making
any significant impact on reducing the levels of disparities or backwardness of areas in
the various states. That socio demographic disparities continue to be persist in all the major states has implications for Public Expenditure Management , for there are already
signs of serious outbreak of crime and problems of law and order maintenance , which in their turn pressure leading to increased expenditure on police.
In an analysis of the problem of regional imbalances , its extent and reasons , S.N.V Siva
Kumar and V.V.N.Somayajulu 1 have drawn attention to the efforts of the Planning
Commission and the Finance Commission to bring about better balance in the levels of
development among the states. Indicating the per capita aggregate revenue and capital
expenditures of the states between 1956 and 1997 , the authors have pointed out that the
per capita aggregate revenue and capital expenditures increased from Rs. 180 during the
Second Plan to Rs. 1102 during the Fifth Plan and further to Rs.2058 in 1991 and Rs.
4332 in 1997 . The authors had taken the actual expenditures of the states during the
nineties and divided them by their population .Analysing the per capita SDP at constant
prices for the period 1980-81 to 1994-95 , and details of Tax Revenue , Non Tax Revenue
, Capital Expenditure , Expenditure on Social Sector , Expenditure on Economic
1. S.N.V.Siva Kumar and V.V.N.Somayajulu , The Problems of Regional Imbalances : An analytical View Asian Economic Review April 2000 pg : 58-70)
- 70 -
Services,Market Borrowings , Loans and Advances from Centre and Internal Debt , the
authors have assigned Ranks to the States . In their view , “ After about four and a half
decades of the implementation of Five Year Plans and the awards of Finance
Commissions one finds no betterment in the position of some of the states . For instance
the Per Capita Net State Domestic Product ( SDP) of Bihar is less than one third of
Punjab while Madhya Pradesh and Uttar Pradesh have about two fifths of Punjab during
1991-92”
Analysing “Regional Disparities in Rural Development in India “ in a contribution to the
Journal of Rural Development L.M. Bhole and Abdul Shaban2 have used 17 indicators of
development - (1) Per capital Net States domestic product at factor cost, (2) Number of
working rural males per thousand rural population (July 1990-June 1991) (3) Number of
working rural females per thousand of rural female population (July 1990-June 1991) (4)
Rural male illiteracy rates (5) Rural female literacy rates (6) Average food graining
production per capita in Kgs (1989-90 to 1991-92) (7) percentage of rural population
below poverty line (87-88) (8) Rural Death rate (1990) (9) Rural infant mortality
rate(1990) (10) Percent of rural children covered by pulse polio (92-73) (11) Percentage
of rural H.H.S with access to safe drinking water facilities. (12) Percentage of rural HHS
having toilet facilities (13) Percentage of rural HHS having electricity connections
(14)Total housing shortage in rural areas (15) Area per post office (16) Number of rural
Bank Offices- per lakh rural population (17) Road length per hundred Sq. Kms.
Reducing these 17 indicators to four principal components, and using principal
component analysis, cluster analysis and other statistical method to measure inter state
differential in Rural Development in India for 1991-92 the authors have pointed out that
inter state disparities are very high and that at the aggregate level of development ,
Punjab is the most developed State followed by Haryana, Kerala and Karnataka. At the
lower and the least developed State is Bihar followed by Orissa, Uttar Pradesh and
Assam.
Analysed in terms of Principal Component showing General, Social, Economic and
Infrastructural Development, the authors place Kerala at the top, followed by Punjab,
Haryana, Maharashtra and Tamilnadu and the least developed States are Bihar,U.P. , M.P,
Rajasthan and Orissa. Analysis of the indicators in terms of Principal Component
showing agricultural development and lower infrastructural development, the authors
place Punjab at the top followed by Haryana, M.P., Karnataka and Andhra Pradesh. In
this category Kerala is at the bottom followed by Assam, Bihar, Orissa and West Bengal.
Analysis with higher negative loading for female employment and higher positive loading
for the per capita food grain production shows Punjab at the top followed by Assam,
Haryana, West Bengal and U.P. In this category Tamil Nadu is at the bottom followed by
2. Vol. 19. No. 1 Jan. March 2001.
- 71 -
Andhra Pradesh, Orissa and Karnataka. Analysis in term of lower mortality rates and
higher density of post office, M.P. is placed at the top, followed by Kerala, Rajasthan,
Assam and Karnataka. In this category Maharashtra is at the bottom, followed by Uttar
Pradesh, Tamil Nadu and West Bengal.
In a special article Dr. N.J.Kurian 3 has made a comparative analysis of the emerging
trends in fifteen major states which together account for 96 percent of India population in
respect of some key parameters which have an intrinsic bearing on social and economic
development particularly gender and equity issues. The author has analysed the
Demographic Characteristics , Social Characteristics the structure and magnitude of state
domestic product and level of poverty , the disposition of state government expenditure
in developmental and non developmental categories for the years 1980-81 and 1995-96 ,
the sectoral distribution of Eighth Plan Outlay , Resource Transfer from Centre to States ,
Disbursal of Financial Assistance by All India Development Institutions , the spread of
commercial banks and credit deposit ratios and levels of development of infrastructure in
irrigation , electricity , transport and telephone and has concluded that interstate economic
and social disparities in India have been increasing inspite of various governmental
measures. The author’s analysis places the fifteen states two groups, with the Forward
Group consisting of Punjab , Haryana , Gujarat . Maharashtra , Andhra Pradesh
Karmataka , Tamil Nadu and Kerala and the Backward Group consisting of Assam , West
Bengal, Bihar , Orissa , Madhya Pradesh , Uttar Pradesh and Rajasthan . Significantly ,
the Forward Group of states accounting for 42 % of the national population are located in
the western and southern parts of the country and the Backward group accounting for 54
per cent of the population are in the eastern and northern parts. The Special Category
states account for barely 3-4 percent of the population.
A study titled “ Attracting Investment in North India – Agenda for Competitiveness”
conducted by the National Council of Applied Economic Research for the Confederation
of Indian Industries , and focussing attention on six states ( Jammu and Kashmir ,Punjab ,
Haryana , Himachal Pradesh , Union territories of Delhi and Chandigarh and Uttar
Pradesh ) points out that the northern states have not been managing their finances well
during the decade , and that a comparison of the growth performance of different regions
during the 1980s and 1990s show that the western region , with Goa , Maharashtra and
Gujarat have been able to step up its growth rates from 5.7 per cent in the Eighties to 6.6
Per cent whereas the growth rate of the states in the Northern Region declined from 5.6 %
in the Eighties to 4.5 per cent . The NCAER observed that “ The high growth
performance of India in the mid nineties appears to entirely bypassed the northern region
“ and points out that growth deceleration and fiscal deterioration in the northern states
was in conspicuous contrast with the states in the western and southern region.
3. “Widening Regional Disparities in India – Some Indicators “ EPW Feb 12
th 2000 Pgs 538-550
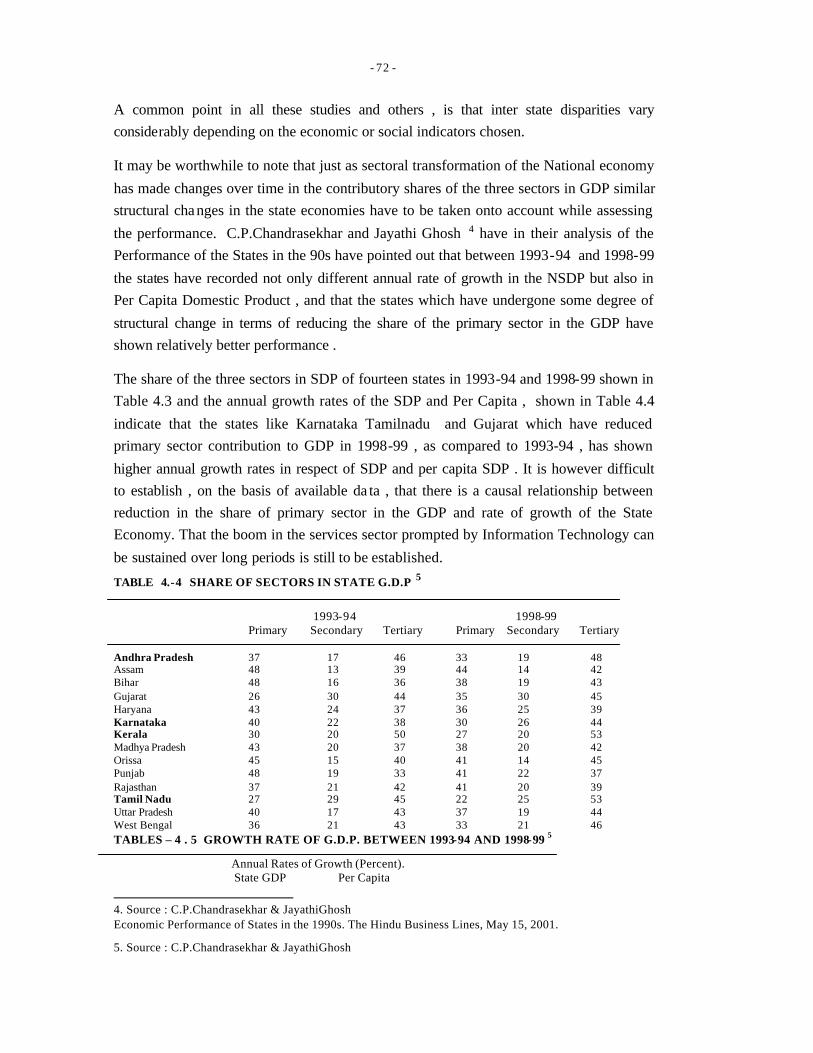
- 72 -
A common point in all these studies and others , is that inter state disparities vary
considerably depending on the economic or social indicators chosen.
It may be worthwhile to note that just as sectoral transformation of the National economy
has made changes over time in the contributory shares of the three sectors in GDP similar
structural cha nges in the state economies have to be taken onto account while assessing
the performance. C.P.Chandrasekhar and Jayathi Ghosh 4 have in their analysis of the
Performance of the States in the 90s have pointed out that between 1993-94 and 1998-99
the states have recorded not only different annual rate of growth in the NSDP but also in
Per Capita Domestic Product , and that the states which have undergone some degree of
structural change in terms of reducing the share of the primary sector in the GDP have
shown relatively better performance .
The share of the three sectors in SDP of fourteen states in 1993-94 and 1998-99 shown in
Table 4.3 and the annual growth rates of the SDP and Per Capita , shown in Table 4.4
indicate that the states like Karnataka Tamilnadu and Gujarat which have reduced
primary sector contribution to GDP in 1998-99 , as compared to 1993-94 , has shown
higher annual growth rates in respect of SDP and per capita SDP . It is however difficult
to establish , on the basis of available da ta , that there is a causal relationship between
reduction in the share of primary sector in the GDP and rate of growth of the State
Economy. That the boom in the services sector prompted by Information Technology can
be sustained over long periods is still to be established.
TABLE 4.-4 SHARE OF SECTORS IN STATE G.D.P 5 1993-94 1998-99 Primary Secondary Tertiary Primary Secondary Tertiary Andhra Pradesh 37 17 46 33 19 48 Assam 48 13 39 44 14 42 Bihar 48 16 36 38 19 43 Gujarat 26 30 44 35 30 45 Haryana 43 24 37 36 25 39 Karnataka 40 22 38 30 26 44 Kerala 30 20 50 27 20 53 Madhya Pradesh 43 20 37 38 20 42 Orissa 45 15 40 41 14 45 Punjab 48 19 33 41 22 37 Rajasthan 37 21 42 41 20 39 Tamil Nadu 27 29 45 22 25 53 Uttar Pradesh 40 17 43 37 19 44 West Bengal 36 21 43 33 21 46 TABLES – 4 . 5 GROWTH RATE OF G.D.P. BETWEEN 1993-94 AND 1998-99 5
Annual Rates of Growth (Percent). State GDP Per Capita
4. Source : C.P.Chandrasekhar & JayathiGhosh Economic Performance of States in the 1990s. The Hindu Business Lines, May 15, 2001.
5. Source : C.P.Chandrasekhar & JayathiGhosh
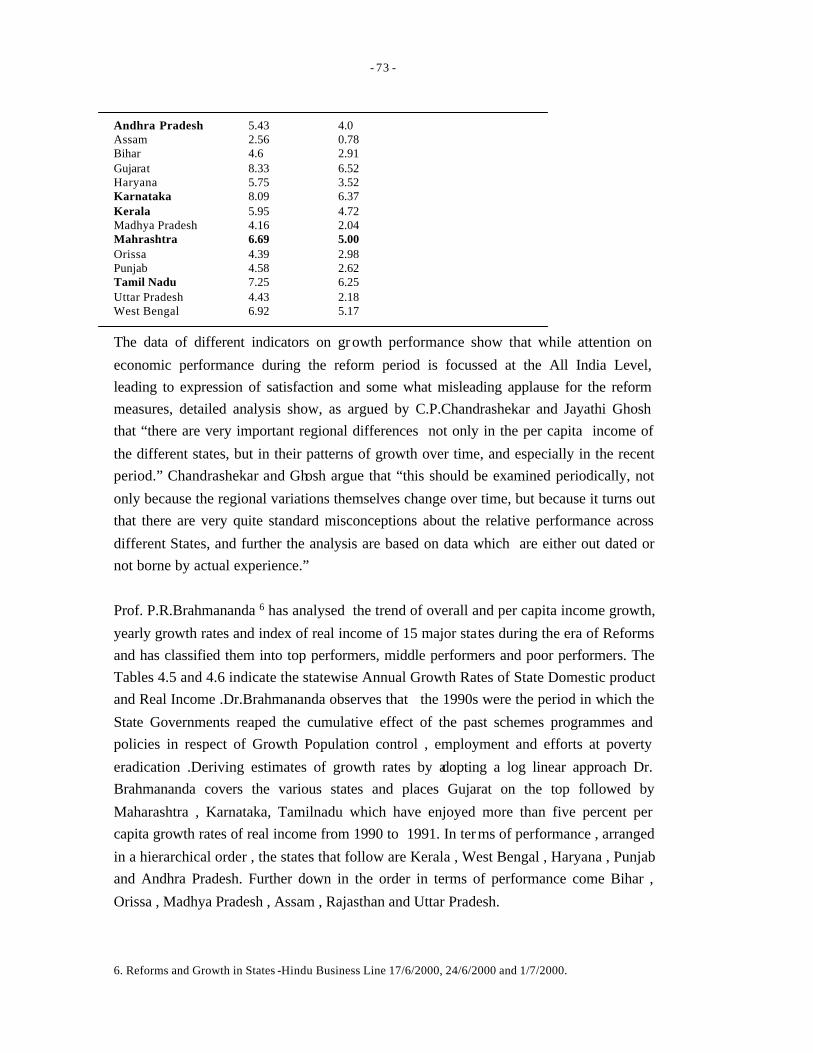
- 73 -
Andhra Pradesh 5.43 4.0 Assam 2.56 0.78 Bihar 4.6 2.91 Gujarat 8.33 6.52 Haryana 5.75 3.52 Karnataka 8.09 6.37 Kerala 5.95 4.72 Madhya Pradesh 4.16 2.04 Mahrashtra 6.69 5.00 Orissa 4.39 2.98 Punjab 4.58 2.62 Tamil Nadu 7.25 6.25 Uttar Pradesh 4.43 2.18 West Bengal 6.92 5.17 The data of different indicators on growth performance show that while attention on
economic performance during the reform period is focussed at the All India Level,
leading to expression of satisfaction and some what misleading applause for the reform
measures, detailed analysis show, as argued by C.P.Chandrashekar and Jayathi Ghosh
that “there are very important regional differences not only in the per capita income of
the different states, but in their patterns of growth over time, and especially in the recent
period.” Chandrashekar and Ghosh argue that “this should be examined periodically, not
only because the regional variations themselves change over time, but because it turns out
that there are very quite standard misconceptions about the relative performance across
different States, and further the analysis are based on data which are either out dated or
not borne by actual experience.”
Prof. P.R.Brahmananda 6 has analysed the trend of overall and per capita income growth,
yearly growth rates and index of real income of 15 major states during the era of Reforms
and has classified them into top performers, middle performers and poor performers. The
Tables 4.5 and 4.6 indicate the statewise Annual Growth Rates of State Domestic product
and Real Income .Dr.Brahmananda observes that the 1990s were the period in which the
State Governments reaped the cumulative effect of the past schemes programmes and
policies in respect of Growth Population control , employment and efforts at poverty
eradication .Deriving estimates of growth rates by adopting a log linear approach Dr.
Brahmananda covers the various states and places Gujarat on the top followed by
Maharashtra , Karnataka, Tamilnadu which have enjoyed more than five percent per
capita growth rates of real income from 1990 to 1991. In ter ms of performance , arranged
in a hierarchical order , the states that follow are Kerala , West Bengal , Haryana , Punjab
and Andhra Pradesh. Further down in the order in terms of performance come Bihar ,
Orissa , Madhya Pradesh , Assam , Rajasthan and Uttar Pradesh.
6. Reforms and Growth in States -Hindu Business Line 17/6/2000, 24/6/2000 and 1/7/2000.
- 74 -
For determining the relative shares of the states in the resources to be transferred from
Centre , the Eleventh Finance Commission has used a criteria of population , per capita
GSDP, Tax GSDP ratio and index of fiscal self reliance worked out as an average of
1994-95 , 1995-96 and 1996-97 and apart from this , Eleventh Finance Commission has
also adopted an index of Social and Economic Infrastructure worked out by T.C.Ananth ,
K.L.Krishna and Uma Dutta Roy Choudhry , “ Measuring Interstate Differentials in
Infrastructure ”. This index brings out the differences in the levels of development of the
various states and places state like Goa , Punjab, Kerala, Tamilnadu ,Haryana Punjab ,
Maharashtra .
However these indices can serve only to explain the varying levels of performance in
specific sectors , and all these , on the whole confirm that the different levels of
development and different degree of performance by the State even during the earlier
period continue in the nineties. It is in this context that one finds the search for socio
economic indicators of performance somewhat relevant.

- 75 -
TABLE 4 . 6 ANNUAL GROWTH RATES (In Per cent)
States 1990-91 1991-92 1992-93 1993-94 1994-95 1995-96 1996-97 1997-98 1998-99 1999-2000
I. Top Performers 1. Maharashtra 4.50 -0.31 15.12 11.03 4.93 9.92 6.99 0.30 9.88 NA 2.Gujarat 1.48 -8.26 32.18 -3.16 21.80 4.11 11.59 0.71 4.70 NA 3.Tamil Nadu 8.33 2.67 5.16 8.72 10.98 7.79 7.60 5.90 4.07 NA 4.Karnataka 0.73 12.71 2.32 7.45 8.14 6.50 10.91 4.30 10.75 4.50 II. Middle Performers 1. Kerala 7.56 1.96 7.21 10.94 3.96 2.79 7.10 6.56 5.60 NA 2.West Bengal 5.26 7.83 2.98 7.27 9.30 5.66 7.66 6.32 7.08 7.02 3.Haryana 10.45 2.06 -0.03 4.51 7.59 1.84 11.67 1.40 6.00 NA 4. Punjab 1.90 4.53 4.72 4.37 4.33 3.25 7.69 1.97 NA NA 5.Andhra Pradesh 1.56 2.53 -1.17 9.71 5.61 5.65 6.50 -1.70 11.05 4.95
III. Poor Performers 1.Bihar 9.48 -5.66 -5.92 2.42 3.98 -3.20 10.55 2.71 2.90 3.30 2.Orissa -16.99 12.70 -1.69 6.44 4.27 5.24 -8.52 16.89 4.20 NA 3.Madhya Pradesh 14.21 -7.21 7.34 10.65 4.08 5.49 6.42 3.12 6.73 NA 4.Assam 4.26 4.41 1.01 3.90 2.32 5.39 3.51 2.67 1.82 NA 5.Rajasthan 15.69 -7.67 14.99 -8.15 18.01 -0.86 14.78 4.53 NA NA 6.Uttar Pradesh 5.95 0.41 1.08 2.48 2.65 2.54 7.41 2.17 3.57 NA Note: For calculating Growth Rates for 98-99 and 99-00, New Series (base : 1993-94) data has been utilised. Source: Compiled at IIE, Hyderabad based on NSDP at Factor Cost (at constant prices) Data from “Hand book of Statistics on Indian Economy”, RBI, 2000
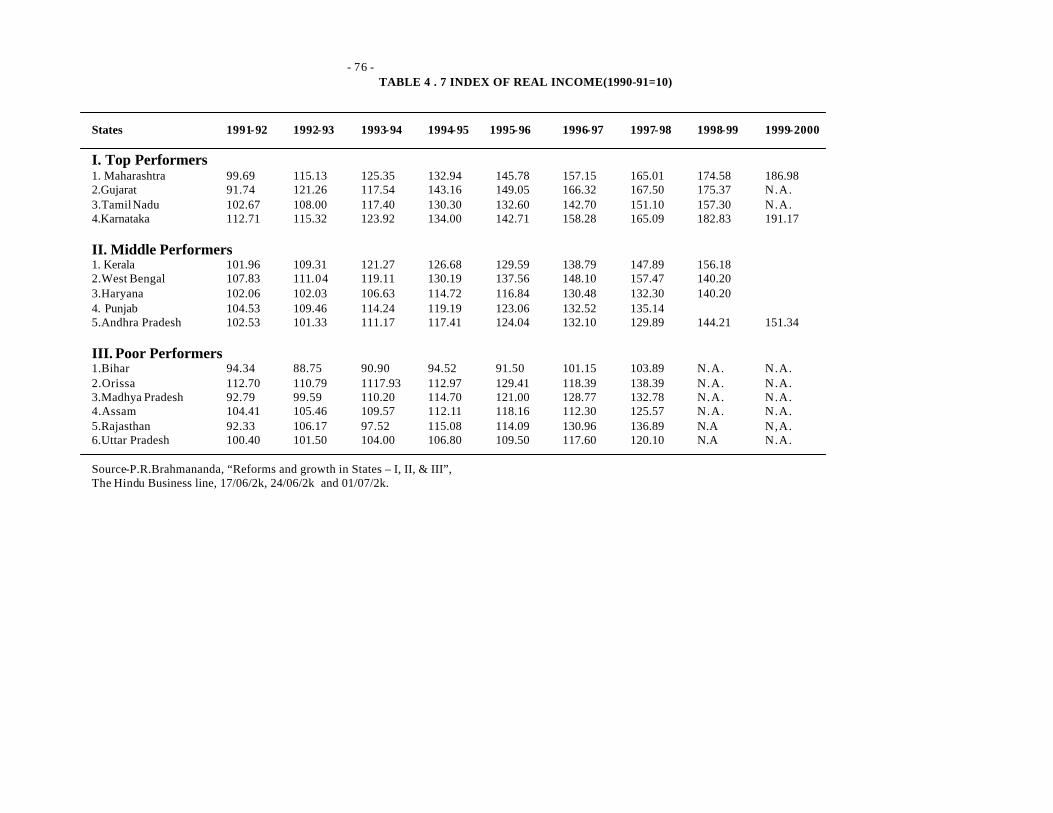
- 76 -
TABLE 4 . 7 INDEX OF REAL INCOME(1990-91=10)
States 1991-92 1992-93 1993-94 1994-95 1995-96 1996-97 1997-98 1998-99 1999-2000
I. Top Performers 1. Maharashtra 99.69 115.13 125.35 132.94 145.78 157.15 165.01 174.58 186.98 2.Gujarat 91.74 121.26 117.54 143.16 149.05 166.32 167.50 175.37 N.A. 3.Tamil Nadu 102.67 108.00 117.40 130.30 132.60 142.70 151.10 157.30 N.A. 4.Karnataka 112.71 115.32 123.92 134.00 142.71 158.28 165.09 182.83 191.17
II. Middle Performers 1. Kerala 101.96 109.31 121.27 126.68 129.59 138.79 147.89 156.18 2.West Bengal 107.83 111.04 119.11 130.19 137.56 148.10 157.47 140.20 3.Haryana 102.06 102.03 106.63 114.72 116.84 130.48 132.30 140.20 4. Punjab 104.53 109.46 114.24 119.19 123.06 132.52 135.14 5.Andhra Pradesh 102.53 101.33 111.17 117.41 124.04 132.10 129.89 144.21 151.34
III. Poor Performers 1.Bihar 94.34 88.75 90.90 94.52 91.50 101.15 103.89 N.A. N.A. 2.Orissa 112.70 110.79 1117.93 112.97 129.41 118.39 138.39 N.A. N.A. 3.Madhya Pradesh 92.79 99.59 110.20 114.70 121.00 128.77 132.78 N.A. N.A. 4.Assam 104.41 105.46 109.57 112.11 118.16 112.30 125.57 N.A. N.A. 5.Rajasthan 92.33 106.17 97.52 115.08 114.09 130.96 136.89 N.A N,A. 6.Uttar Pradesh 100.40 101.50 104.00 106.80 109.50 117.60 120.10 N.A N.A. Source-P.R.Brahmananda, “Reforms and growth in States – I, II, & III”, The Hindu Business line, 17/06/2k, 24/06/2k and 01/07/2k.
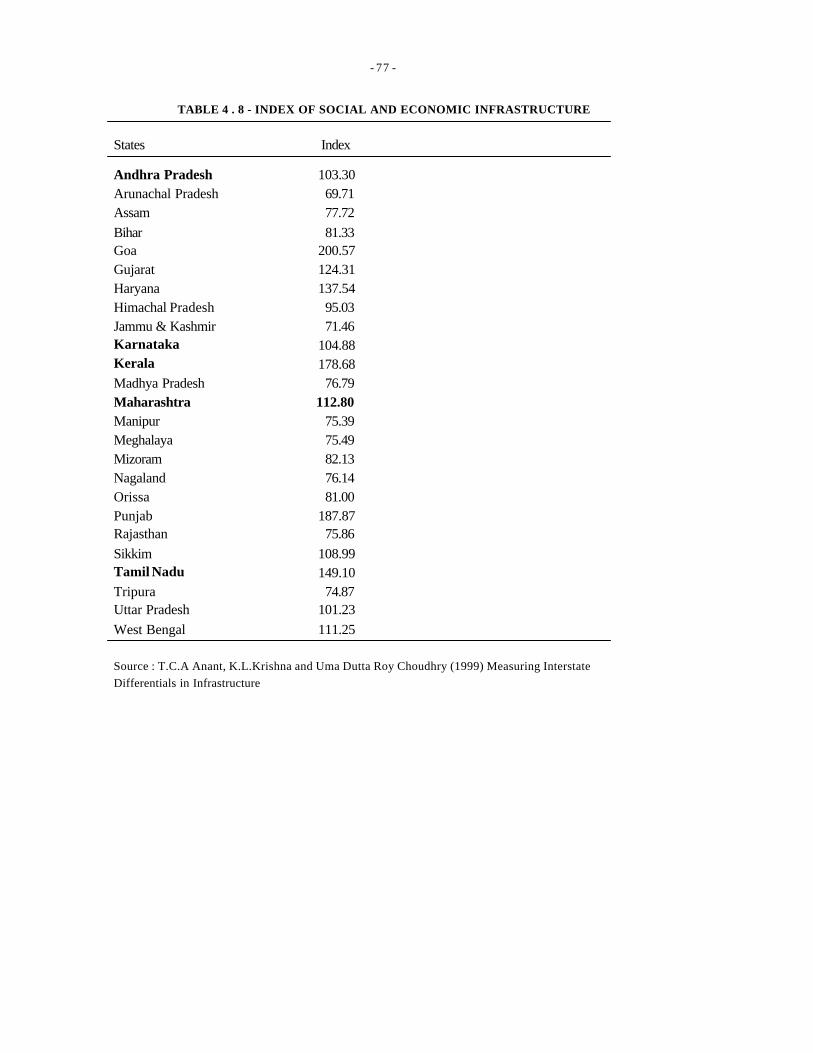
- 77 -
TABLE 4 . 8 - INDEX OF SOCIAL AND ECONOMIC INFRASTRUCTURE
States Index Andhra Pradesh 103.30 Arunachal Pradesh 69.71 Assam 77.72
Bihar 81.33 Goa 200.57 Gujarat 124.31 Haryana 137.54 Himachal Pradesh 95.03 Jammu & Kashmir 71.46 Karnataka 104.88 Kerala 178.68 Madhya Pradesh 76.79 Maharashtra 112.80 Manipur 75.39 Meghalaya 75.49 Mizoram 82.13 Nagaland 76.14 Orissa 81.00 Punjab 187.87 Rajasthan 75.86
Sikkim 108.99 Tamil Nadu 149.10 Tripura 74.87 Uttar Pradesh 101.23
West Bengal 111.25 Source : T.C.A Anant, K.L.Krishna and Uma Dutta Roy Choudhry (1999) Measuring Interstate
Differentials in Infrastructure

- 78 -
SOCIO ECONOMIC INDICATORS Attempts to measure socio economic development have resulted in the refinement of
concept of development , identification of indicators relevant to each area of concern and
construction of Indices to reflect not only Economic Growth , but also Social
Development. One must draw attention in this connection to the cons truction by UNDP,
of Human Development Index, which help to trace the linkage between material well
being and social development identifying three critical elements. Access to income and
assets needed for decent standard of living, Knowledge acquisition and Enjoyment of
long and healthy life.
Such analysis of development performance in terms of indicators broadly referred to as
Human Resource Development (HRD) gained currency commencing with the
contribution of Theodore Shultz,7 who in 1960 defined Human Capital in terms of five
major categories. With further contributions from Hector Correa (The Economics of
Human Resources 1963) and F.K.Harbison , (Human Resources as Wealth 1973), the
United Nations Development Programme in its Development Reports8 enlarged this as
the “ the process of enlarging the range of people’s choices , increasing their
opportunities for education ,health care , income and employment , and covering the full
range of human choices from a sound physical environment to economic and political
freedoms “ . this has led to publication of Human Development Index with further
refinement Human Poverty Index and Gender Related Development Index for various
countries according ranks .
The National Council of Applied Economic Research, in collaboration with Planning
Commission and UNDP has attempted to develop the required database for preparing a
human development profile for the country. While recognising that, “the Human
Development Index’ though superior to traditional aggregate indices such as GDP fails
to reveal disparities among population sub groups and therefore has a limited role in
deciding policy prescriptions for raising the level of human development”
In the Indian context computation of HDI index for major states have been attempted by
B.G.Jandhyala Tilak (1991) Human Development Index for India IASSA quarterly 10(2)
; A.K.Shiva Kumar, UNDP’s Human Development Index : A computation for India
states , EPW Oct 22nd 1991 , and S.P.Pal and D.K.Pant , ‘An Alternative Human
7. Investment in Human Capital , American Economic review Vol 51. 8. Human Development Report 1990
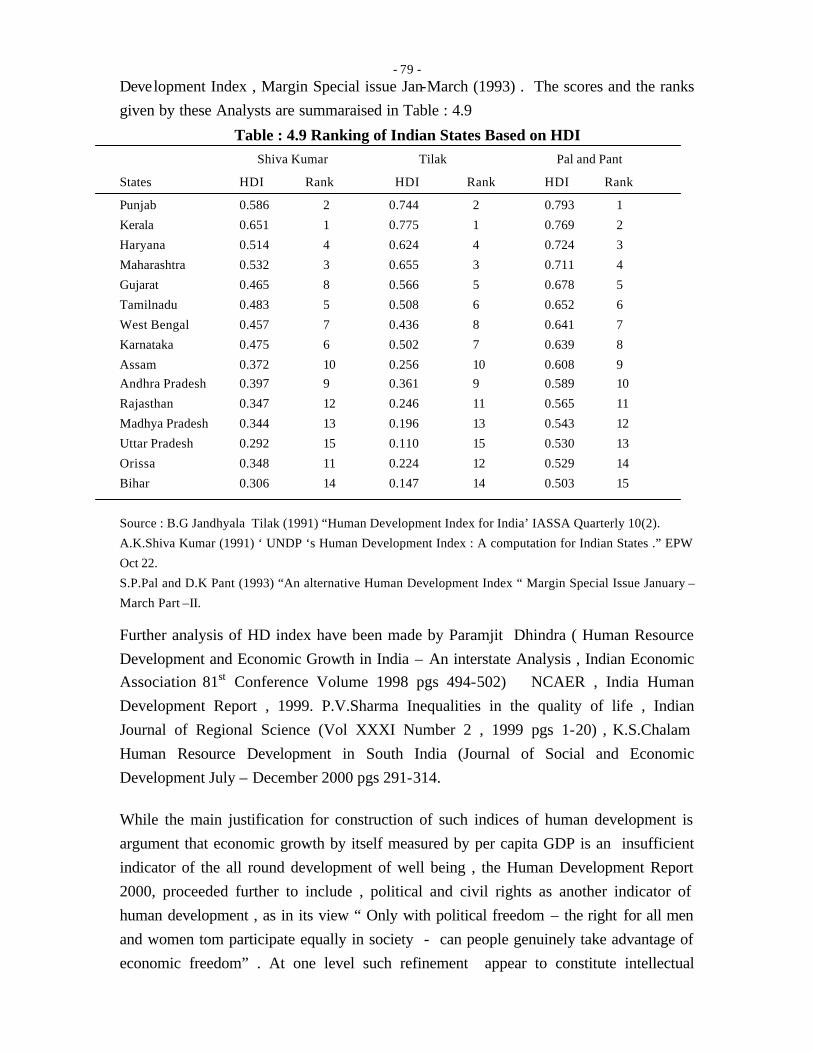
- 79 -
Development Index , Margin Special issue Jan-March (1993) . The scores and the ranks
given by these Analysts are summaraised in Table : 4.9
Table : 4.9 Ranking of Indian States Based on HDI
Shiva Kumar Tilak Pal and Pant
States HDI Rank HDI Rank HDI Rank
Punjab 0.586 2 0.744 2 0.793 1
Kerala 0.651 1 0.775 1 0.769 2
Haryana 0.514 4 0.624 4 0.724 3
Maharashtra 0.532 3 0.655 3 0.711 4
Gujarat 0.465 8 0.566 5 0.678 5
Tamilnadu 0.483 5 0.508 6 0.652 6
West Bengal 0.457 7 0.436 8 0.641 7
Karnataka 0.475 6 0.502 7 0.639 8
Assam 0.372 10 0.256 10 0.608 9
Andhra Pradesh 0.397 9 0.361 9 0.589 10
Rajasthan 0.347 12 0.246 11 0.565 11
Madhya Pradesh 0.344 13 0.196 13 0.543 12
Uttar Pradesh 0.292 15 0.110 15 0.530 13
Orissa 0.348 11 0.224 12 0.529 14
Bihar 0.306 14 0.147 14 0.503 15
Source : B.G Jandhyala Tilak (1991) “Human Development Index for India’ IASSA Quarterly 10(2).
A.K.Shiva Kumar (1991) ‘ UNDP ‘s Human Development Index : A computation for Indian States .” EPW
Oct 22.
S.P.Pal and D.K Pant (1993) “An alternative Human Development Index “ Margin Special Issue January –
March Part –II.
Further analysis of HD index have been made by Paramjit Dhindra ( Human Resource
Development and Economic Growth in India – An interstate Analysis , Indian Economic
Association 81st Conference Volume 1998 pgs 494-502) NCAER , India Human
Development Report , 1999. P.V.Sharma Inequalities in the quality of life , Indian
Journal of Regional Science (Vol XXXI Number 2 , 1999 pgs 1-20) , K.S.Chalam
Human Resource Development in South India (Journal of Social and Economic
Development July – December 2000 pgs 291-314.
While the main justification for construction of such indices of human development is
argument that economic growth by itself measured by per capita GDP is an insufficient
indicator of the all round development of well being , the Human Development Report
2000, proceeded further to include , political and civil rights as another indicator of
human development , as in its view “ Only with political freedom – the right for all men
and women tom participate equally in society - can people genuinely take advantage of
economic freedom” . At one level such refinement appear to constitute intellectual
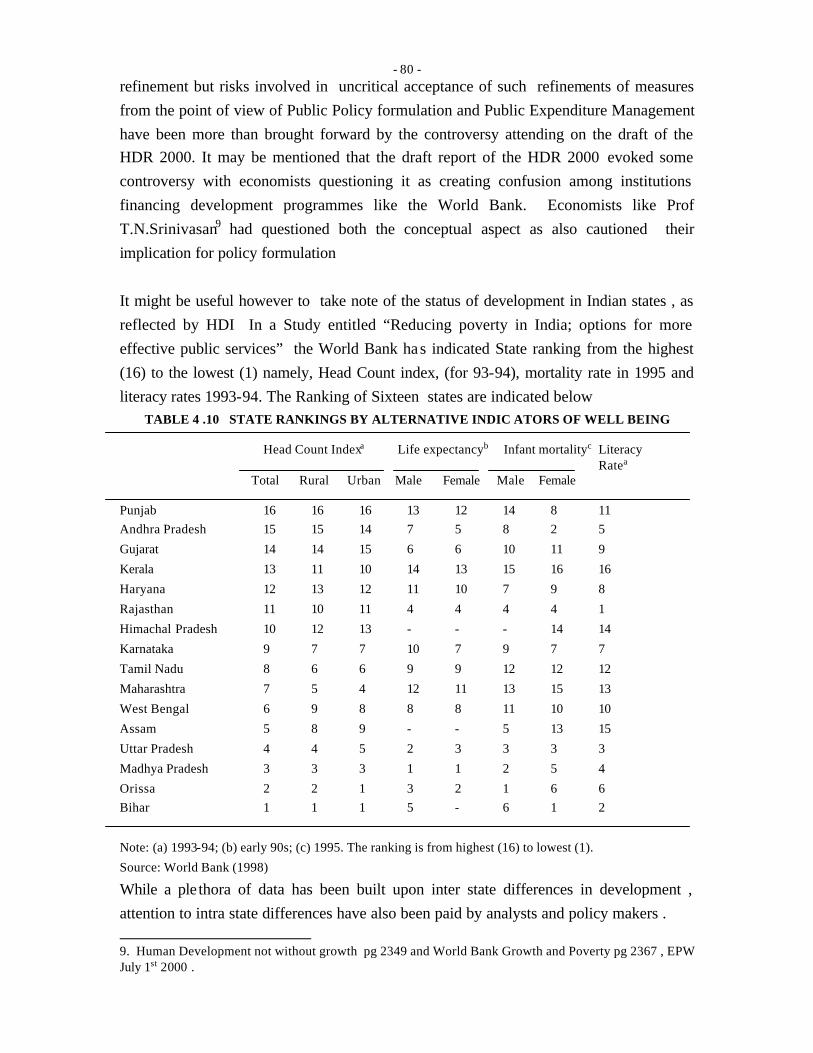
- 80 -
refinement but risks involved in uncritical acceptance of such refinements of measures
from the point of view of Public Policy formulation and Public Expenditure Management
have been more than brought forward by the controversy attending on the draft of the
HDR 2000. It may be mentioned that the draft report of the HDR 2000 evoked some
controversy with economists questioning it as creating confusion among institutions
financing development programmes like the World Bank. Economists like Prof
T.N.Srinivasan9 had questioned both the conceptual aspect as also cautioned their
implication for policy formulation
It might be useful however to take note of the status of development in Indian states , as
reflected by HDI In a Study entitled “Reducing poverty in India; options for more
effective public services” the World Bank has indicated State ranking from the highest
(16) to the lowest (1) namely, Head Count index, (for 93-94), mortality rate in 1995 and
literacy rates 1993-94. The Ranking of Sixteen states are indicated below
TABLE 4 .10 STATE RANKINGS BY ALTERNATIVE INDIC ATORS OF WELL BEING Head Count Indexa Life expectancyb Infant mortalityc Literacy Ratea Total Rural Urban Male Female Male Female Punjab 16 16 16 13 12 14 8 11
Andhra Pradesh 15 15 14 7 5 8 2 5
Gujarat 14 14 15 6 6 10 11 9
Kerala 13 11 10 14 13 15 16 16
Haryana 12 13 12 11 10 7 9 8
Rajasthan 11 10 11 4 4 4 4 1
Himachal Pradesh 10 12 13 - - - 14 14
Karnataka 9 7 7 10 7 9 7 7
Tamil Nadu 8 6 6 9 9 12 12 12
Maharashtra 7 5 4 12 11 13 15 13
West Bengal 6 9 8 8 8 11 10 10
Assam 5 8 9 - - 5 13 15
Uttar Pradesh 4 4 5 2 3 3 3 3
Madhya Pradesh 3 3 3 1 1 2 5 4
Orissa 2 2 1 3 2 1 6 6
Bihar 1 1 1 5 - 6 1 2
Note: (a) 1993-94; (b) early 90s; (c) 1995. The ranking is from highest (16) to lowest (1).
Source: World Bank (1998)
While a ple thora of data has been built upon inter state differences in development ,
attention to intra state differences have also been paid by analysts and policy makers .
9. Human Development not without growth pg 2349 and World Bank Growth and Poverty pg 2367 , EPW July 1st 2000 .
- 81 -
Citing the data brought out by National Commission on Population ,covering 569
districts , Dr.N.J.Kurian (Economic Times 28th August,2001 pg.6 ) has analysed the data
relating to 489 districts of 15 major states which have been classified into (a) Forward
Group of eight states Punjab, Haryana, Gujarat, Maharashtra , A.P, Karnataka,
Tamilnadu and Kerala, , (total 190 districts) covering 40 % of the population and (b)
Seven states Assam , West Bengal ,Bihar , Orissa , Madhya Pradesh , Uttar pradesh and
Rajasthan ( total 299 districts ) covering 55 % of the population and has argued that a
large section still suffer from serious socio demographic backwardness . This is on the
basis of a composite index constructed with 12 variables , which are (1) decadal
population growth for 1991-2001 (2) percentages of births of the order 3 and above (3)
percentage of eligible couples using Family Planning methods (4) percentage of girls
marrying below 18 years (5) sex ratio (6) Percentage of women receiving skilled
attention during deliveries (7) percentage of children getting complete immunisation (8)
female literacy rates (9) Villages connected with Pucca Roads , (10) coverage of drinking
water and sanitation (11) per centage of births registered (12) percentage of deaths
registered .According to Dr.Kurian , “ It is crystal clear that the two groups of states are
socio-demographically two worlds apart.There is hardly any district from the second
group of states figuring in the top hundred , one from Assam and one from W.Bengal
only figure in the list . On the other hand thirteen out of fourteen districts of kerala and 28
out of 30 districts of Tamilnadu rank among the first hundred.While more than 90 % of
the districts in Kerala figure in the first hundred , more than 90 % of Bihar districts 70
% of Rajasthan District and 55 % of U.P are ranked below 400.
While the analysis draws attention to the problems of persisting backwardness measured
at the sub state levels , it must be pointed out that such classification and ranking depend
on the choice of variables .The above analysis appears to be highly weighted in favour of
a large number of demographic and gender indicators , and could therefore be considered
as indicative of only social backwardness . This finding is only the converse of the
finding of the E.A.S Sharma Committee which identified hundred of the most Backward
and poorest districts from the infrastructure point of view.
The implications of Public Expenditure Programmes , formulated against the Back
ground of the Economic Reforms with emphasis on fiscal consolidation have been
analysed in the context of their impact on indicators of Human Development in the
Indian states, M.Ravallion ,and K.Subbha Rao 10 had in 1992 and S.P.Gupta 11 Sanjaya
10.Adjustment and Human Development in India , Journal of Indian School of Political Economy March 1992)
- 82 -
Baru 12 had referred to the implications of Structural Adjustment Policy on fiscal
compression and Socia l Sector Expenditure . V.B.Tulsidhar13, K.Seetha Prabhu and
Others 14 have drawn attention to the sectoral implications of decline in budgetary outlays
for social services in several states .
There has been a debate whether this decline commenced in the Eighties or much latter .
Several of the sectoral issues covering food nutrition, health and housing , education ,
employment and income security , impact on vulnerable groups have been addressed as
part of a study of a holistic perspective of social and economic security in India ,in a
Volume edited by S.Mahendra Dev , Piush Antony , V,Gayathri and R.P Mamgain 15.
The Volume , with all sectoral contributions taken together argues that unless the state
prioritises social security a an integral part of Governance , lack of public demand and
resource constraints will remain as convenient justification for a abysmal performance of
social security measures. The experience of states like Kerala and Tamilnadu reiterates
state sponsored public participation as an effective strategy in carrying out both
promotional and protective social security measures with comparatively low levels of
economic growth and public expenditure .The contributions in this volume on the
financing of social security measures , bring out that state governments emphasise one or
two promotional social security programmes to the neglect of protective measures
indicating the lack of an integrated perspective on social security , and advocate active
interventions in the fiscal sphere for ensuring adequate financing of social security
measures.
11. Economic Reforms and its Impact on Poor EPW 1995 pgs 1295-1312 12. EPW, April 10, 1993 . 13. Expenditure Compression and the Health Sector Outlays EPW 1993 pgs 2473-2477 14. Social Sector Expenditure and Human Development a Study of the Indian States - Study of Reserve Bank of India 15. Social and Economic security in India , Institute of Human Development 2001.
- 83 -
V BUDGETARY TRENDS IN THE STATES
5.1 PERSPECTIVES OF PLANNING COMMISSION, RBI AND FINANCE MINISTRY
Our review of the recent experience in “Management of Public Expenditure by State
Governments”, has proceeded mostly in terms of time series financial and budgetary data
for the period commencing with the eighties, and covering the nineties to against the
back drop of the earlier period for a perspective view. It may however be not adequate, to
come to grips with the problems of development administration in the states, or for
formulating a strategy for improving the fiscal health of the state in the immediate future.
We need to diagnose the problems of flesh and blood that have clothed the skeletal
frame work of government machinery at the Centre and the States.
It is quite illuminating to reach back into the earlier decade to gather an idea of the
perspectives of (a) the Planning Commission which has a long time frame of several
decades (b) the Reserve Bank of India which has a medium term view of the trends in the
economy and (c) the Ministry of Finance which has a shorter budgetary time frame
PLANNING COMMISSION’S PERSPECTIVE The First Five Year Plan had, as far back as
1952, commented on the nature of problems faced, stating “the decline in the standards
of administration which has taken place during the past few years points to the urgent
need for carrying out administrative reforms. Important achievements stand to the credit
of Central and State Governments and administration has taken large responsibilities,
never the less it is true that numerous functions are now performed less efficiently than
before. To some extent this is due to the fact that while the work falling to the
administration has considerably increased, the strength of experience personnel in public
services every where has been depleted.” The Planning Commission identified three
groups of problems in this regard and proposed measures for the strengthening and
improving of the administration. 1 Fifty years later with the Governments in the States and Centre swearing allegiance to the
new economic policy of reform, emphasising the retreat of the states from many areas of
activity the Approach Paper to the Tenth Five Year Plan, observes, “in many respects
development policy in future must make a break from the past. The Government had
over the years taken on itself too many responsibilities with the result that have not only
marginalised individual initiatives but also succeeded in imposing severe strains on its
financial and administrative capabilities. More importantly in the face of momentous
changes in the domestic economic policy in the last decade and an equally fast paced
integration of our economy with the emerging global order, investment planning is no
- 84 -
more the only, or the only predominant, or even the most effective instrument of
perusing development. Planning has to necessarily go beyond undertaking mere
budgetary allocations between competing sectors and regions. It has to address with
greater regard, the need to release latent energies and stimulate private initiative in the
various facets of our development process”.2
Matching economic ambitions of the States and the Union and their capacities to
mobilise resources as always been a difficult task for the government themselves, and
even more for the Planning Commission, acting as a referee, and having to blow the
whistle. Nearly 50 years back, the Second Five Year Plan of the Government of
Hyderabad , indicated that as directed by the Planning Commission in the letter of 10th
September 1955, in its Second Five Year Plan the size of the Second Five Year Plan
had to be revised downwards from 5050 crores to Rs. 4800 crores, of which the states
share was Rs. 2214 crores and that of the centre Rs. 2586 crores. The Planning
Commission felt that as a general principle, every ministry and every state government
should secure economy and increase efficiency to the extent of achieving the reduction of
5% in expenditure without effecting the fiscal targets3.
On August 10th 2001, the Planning Commission advised the Government of Andhra
Pradesh (successor to the Hyderabad Government, )that it should reduce the size of its
Annual Plan (2001-2002) to Rs. 8378 crores from the proposed Rs. 8991 crores, and that
the state should take urgent steps to reduce the burden of states exchequer, and pursue
implementation of fiscal reforms in view of growing debt burden escalating public
expenditure on subsidies salaries and pensions.4
Past experience has been that even after the Planning Commission has assessed the
resources available to the Centre and the States and determined the outlays for Central
and State Plans, realisation of these in budgetary terms has been difficult. After little
more than a decade’s experience in implementation of the First and Second FYP and
three years of the Third Plan, the Planning Commission carried out a mid term appraisal
of the Third Plan and placed it for the consideration of the National Development
Council at its 20th meeting held on November 8th and 9th 1963. In respect of Public
Finance, the mid term appraisal had observed that the total budgetary outlay have been
increasing from year to year, and that “the excess of expenditure over revenue receipts as
in all the years been met to a substantial extent through public borrowing, external
1 Government of India Planning Commission the First Five Year Pan 1952 Page 113 2 Government of India Planning Commission Approach Paper to the Tenth Five Year Plan Chapter V 3 Government of Hyderabad Second Five Year Plan 1955 Page 3. 4 The Hindu 11th August 2001
- 85 -
assistance and miscellaneous receipts on capital account”5. Almost 37 years later “the
Mid Term Appraisal of Ninth Five Year Plan published in October 2000 observed “the
expected buoyancy in revenue receipts particularly that of Union Excise did not
materialise where as growth in revenue expenditure of the Centre substantially exceeded
the plan estimates ………the short fall in moblisation of budgetary resources for the
plan in the First Three Years has been off set to some extent through a larger recourse to
borrowings than projected in the Ninth Plan. However increased borrowings have lead to
excessive fiscal deficit beyond sustainable levels”. In respect of the states the Mid Term
Appriasal of the Ninth Five Year Plan observed that, “only 44.4% of the projected
resources have been moblised by the States during the First Three Years of the Ninth
Plan. There has been a massive deterioration in the contribution of “own funds” of the
states to the plan resources and the additional resource moblisation (ARM) has been low.
This has lead to dependence on increased borrowings to finance their plan” 6.
RBI ’S PERSPECTIVE The Reserve Bank of India, as the nation’s banker, monitors
developments in the field of currency and finance and takes a close look at the finances
of the Union and State Governments as major influences in economic and financial
developments. After a little over 25 years of planning experience, the Reserve Bank of India in its
Report on Currency and Finance for 1977-78 stated that “according to the revised
estimates for 1977-78, the overall budgetary position of states shows an aggregate deficit
of Rs. 290 crores in contrast to a surplus of Rs. 50 crores in the preceding year. Such a
marked deterioration was the result of larger increase in aggregate disbursements than in
receipts”7. With reference to state government finances twenty years later, the Reserve
Bank of India observed in its Report on Currency and Finance in 1998-99 that “the
stress on the State Finances hinges upon the inadequacy of receipts in meeting the
expenditure requirements, as has been evidenced by the structural imbalances manifested
through the revenue deficits since the Mid Eighties. The long run structural character of
the state finances is indicative of a uni-directional trend between the rate of growth of
expenditures and receipts. However the rate of growth of expenditure has been higher
than that of revenue receipts. The resultant gap between receipts and expenditure
revealed that the revenue position could not support the total expenditure requirements.
The resource gap has further worsened since the Mid Nineties when the revenue growth
began to stagnate while expenditure growth accelerated. Constraint by the compulsions
5 Government of India Planning Commission Third Plan Mid –Term Appraisal, November 1963 6 The Planning Commission Mid Term Appraisal of the Ninth Plan October 2000 page 2 7 Reserve Bank of India Report on Currency and Finance 1977-78 Vol-1 Page 179
- 86 -
in meeting the large committed non plan expenditures, the States often resorted to
financing non plan expenditure through cut backs in developmental expenditure.” 8
The RBI contrasted the pre 1986-87 posit ion when the states generated surpluses on
revenue account and released them for capital investment, with the post 1987-88 period
when the state governments, facing revenue deficits, started diverting the capital receipts
essentially high cost borrowed funds towards current expenditure and points out the
resultant slashing down of investment programme. Reserve Bank of India views this as a
structural weakness of state finances.
FINANCE MINISTRY’S VIEW The Union Finance Ministry frames the Central Budget
keeping in view the impact of its revenue mobilisation, and expenditure programmes on
the economy, with short time frame. The Finance Ministry’s Economic Survey 1988-89
observed that “the overall budgetary deficit of states and union territories taken together
in 1988-89 was Rs. 872 crores, 45% lower than the deficit of Rs. 1583 crores in the
revised estimates for 1987-88 but 56% higher than the budget estimates of Rs. 559 crores
for 1987-88.9 Ten years latter the Economic Survey for 1998-99 glosses over the
numbers of state government finances and confines its observations to the rather less
important implication of small saving collections for the fiscal deficits of the centre.
Perhaps, the picture was little too uncomfortable for the Finance Ministry. However the
position could not be ignored for too long. The Economic Survey 2000-01 published in
February 2001 drew attention to the findings of the RBI Studies on State Finances
regarding the increase in States debts to GDP and the increase in the guarantees
provided by the state governments and observed that “the result of this fiscal
deterioration is that states expenditure on social sectors have remained stagnant. There is
little money for improving reach and quality of educational services or of public
health.”10 . It was in this context that the Union Finance Minister had to mention in his
Budget speech “the poor state of the fiscal health of both the central and state
governments”, and indicate that “along with fiscal consolidation at the cent re, it will be
our endeavor to work jointly with the states to reform their finances. Pursuant to the
recommendations of the Eleventh Finance Commission, we have created Incentive Fund
Rs. 10607 crores have been earmarked for next five years to encourage states to
implement monitorable fiscal reforms. These reforms will essentially be the states’ own
programmes, and considerable flexibility has been provided for individual states to
decide their programmes”. Union Finance Minister announced a provision of Rs. 4243
crores for this incentive fund in the budget 2001-02.
8 Report on Currency and Finance in 1998-99 9 The Finance Ministry’s Economic Survey 1988-89 10 Ministry of Finance Economic Survey 2000-2001 para 1.129
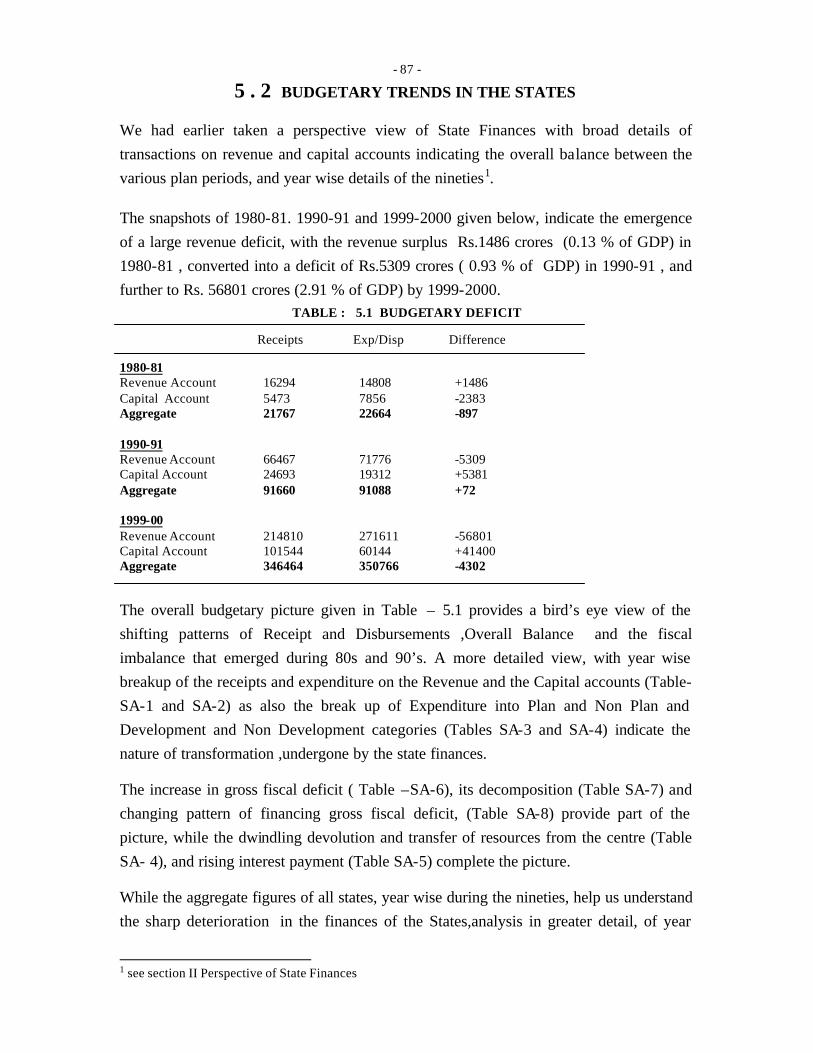
- 87 -
5 . 2 BUDGETARY TRENDS IN THE STATES
We had earlier taken a perspective view of State Finances with broad details of
transactions on revenue and capital accounts indicating the overall balance between the
various plan periods, and year wise details of the nineties1.
The snapshots of 1980-81. 1990-91 and 1999-2000 given below, indicate the emergence
of a large revenue deficit, with the revenue surplus Rs.1486 crores (0.13 % of GDP) in
1980-81 , converted into a deficit of Rs.5309 crores ( 0.93 % of GDP) in 1990-91 , and
further to Rs. 56801 crores (2.91 % of GDP) by 1999-2000.
TABLE : 5.1 BUDGETARY DEFICIT Receipts Exp/Disp Difference 1980-81 Revenue Account 16294 14808 +1486 Capital Account 5473 7856 -2383 Aggregate 21767 22664 -897 1990-91 Revenue Account 66467 71776 -5309 Capital Account 24693 19312 +5381 Aggregate 91660 91088 +72 1999-00 Revenue Account 214810 271611 -56801 Capital Account 101544 60144 +41400 Aggregate 346464 350766 -4302 The overall budgetary picture given in Table – 5.1 provides a bird’s eye view of the
shifting patterns of Receipt and Disbursements ,Overall Balance and the fiscal
imbalance that emerged during 80s and 90’s. A more detailed view, with year wise
breakup of the receipts and expenditure on the Revenue and the Capital accounts (Table-
SA-1 and SA-2) as also the break up of Expenditure into Plan and Non Plan and
Development and Non Development categories (Tables SA-3 and SA-4) indicate the
nature of transformation ,undergone by the state finances. The increase in gross fiscal deficit ( Table –SA-6), its decomposition (Table SA-7) and
changing pattern of financing gross fiscal deficit, (Table SA-8) provide part of the
picture, while the dwindling devolution and transfer of resources from the centre (Table
SA- 4), and rising interest payment (Table SA-5) complete the picture. While the aggregate figures of all states, year wise during the nineties, help us understand
the sharp deterioration in the finances of the States,analysis in greater detail, of year
1 see section II Perspective of State Finances
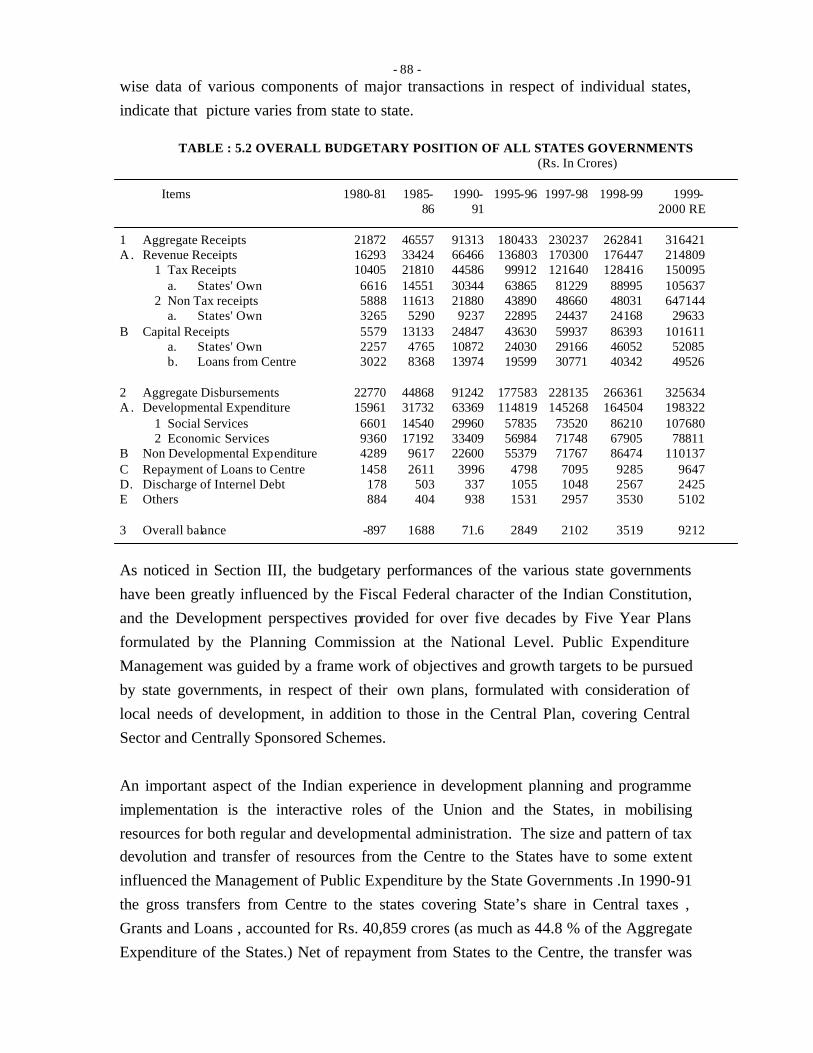
- 88 -
wise data of various components of major transactions in respect of individual states,
indicate that picture varies from state to state.
TABLE : 5.2 OVERALL BUDGETARY POSITION OF ALL STATES GOVERNMENTS
(Rs. In Crores) Items 1980-81 1985-
86 1990-
91 1995-96 1997-98 1998-99 1999-
2000 RE 1 Aggregate Receipts 21872 46557 91313 180433 230237 262841 316421 A . Revenue Receipts 16293 33424 66466 136803 170300 176447 214809 1 Tax Receipts 10405 21810 44586 99912 121640 128416 150095 a. States' Own 6616 14551 30344 63865 81229 88995 105637 2 Non Tax receipts 5888 11613 21880 43890 48660 48031 647144 a. States' Own 3265 5290 9237 22895 24437 24168 29633 B Capital Receipts 5579 13133 24847 43630 59937 86393 101611 a. States' Own 2257 4765 10872 24030 29166 46052 52085 b. Loans from Centre 3022 8368 13974 19599 30771 40342 49526 2 Aggregate Disbursements 22770 44868 91242 177583 228135 266361 325634 A . Developmental Expenditure 15961 31732 63369 114819 145268 164504 198322 1 Social Services 6601 14540 29960 57835 73520 86210 107680 2 Economic Services 9360 17192 33409 56984 71748 67905 78811 B Non Developmental Expenditure 4289 9617 22600 55379 71767 86474 110137 C Repayment of Loans to Centre 1458 2611 3996 4798 7095 9285 9647 D. Discharge of Internel Debt 178 503 337 1055 1048 2567 2425 E Others 884 404 938 1531 2957 3530 5102 3 Overall balance -897 1688 71.6 2849 2102 3519 9212
As noticed in Section III, the budgetary performances of the various state governments
have been greatly influenced by the Fiscal Federal character of the Indian Constitution,
and the Development perspectives provided for over five decades by Five Year Plans
formulated by the Planning Commission at the National Level. Public Expenditure
Management was guided by a frame work of objectives and growth targets to be pursued
by state governments, in respect of their own plans, formulated with consideration of
local needs of development, in addition to those in the Central Plan, covering Central
Sector and Centrally Sponsored Schemes.
An important aspect of the Indian experience in development planning and programme
implementation is the interactive roles of the Union and the States, in mobilising
resources for both regular and developmental administration. The size and pattern of tax
devolution and transfer of resources from the Centre to the States have to some extent
influenced the Management of Public Expenditure by the State Governments .In 1990-91
the gross transfers from Centre to the states covering State’s share in Central taxes ,
Grants and Loans , accounted for Rs. 40,859 crores (as much as 44.8 % of the Aggregate
Expenditure of the States.) Net of repayment from States to the Centre, the transfer was
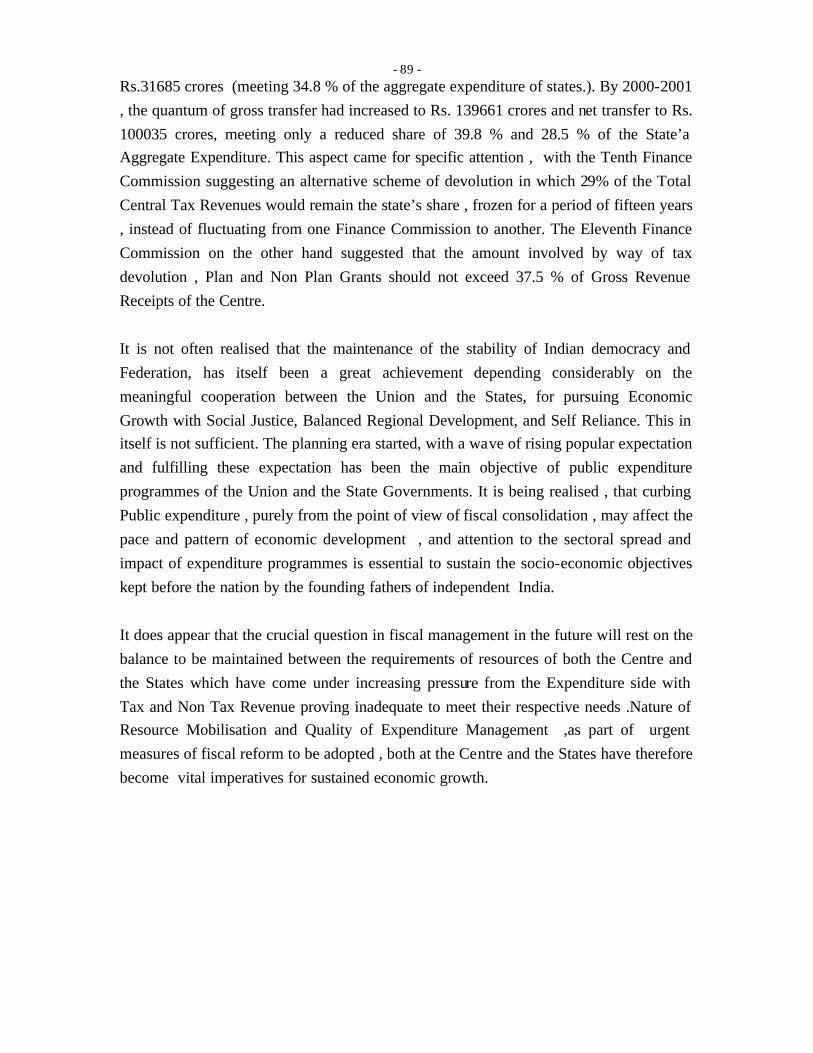
- 89 -
Rs.31685 crores (meeting 34.8 % of the aggregate expenditure of states.). By 2000-2001
, the quantum of gross transfer had increased to Rs. 139661 crores and net transfer to Rs.
100035 crores, meeting only a reduced share of 39.8 % and 28.5 % of the State’a
Aggregate Expenditure. This aspect came for specific attention , with the Tenth Finance
Commission suggesting an alternative scheme of devolution in which 29% of the Total
Central Tax Revenues would remain the state’s share , frozen for a period of fifteen years
, instead of fluctuating from one Finance Commission to another. The Eleventh Finance
Commission on the other hand suggested that the amount involved by way of tax
devolution , Plan and Non Plan Grants should not exceed 37.5 % of Gross Revenue
Receipts of the Centre.
It is not often realised that the maintenance of the stability of Indian democracy and
Federation, has itself been a great achievement depending considerably on the
meaningful cooperation between the Union and the States, for pursuing Economic
Growth with Social Justice, Balanced Regional Development, and Self Reliance. This in
itself is not sufficient. The planning era started, with a wave of rising popular expectation
and fulfilling these expectation has been the main objective of public expenditure
programmes of the Union and the State Governments. It is being realised , that curbing
Public expenditure , purely from the point of view of fiscal consolidation , may affect the
pace and pattern of economic development , and attention to the sectoral spread and
impact of expenditure programmes is essential to sustain the socio-economic objectives
kept before the nation by the founding fathers of independent India.
It does appear that the crucial question in fiscal management in the future will rest on the
balance to be maintained between the requirements of resources of both the Centre and
the States which have come under increasing pressure from the Expenditure side with
Tax and Non Tax Revenue proving inadequate to meet their respective needs .Nature of
Resource Mobilisation and Quality of Expenditure Management ,as part of urgent
measures of fiscal reform to be adopted , both at the Centre and the States have therefore
become vital imperatives for sustained economic growth.
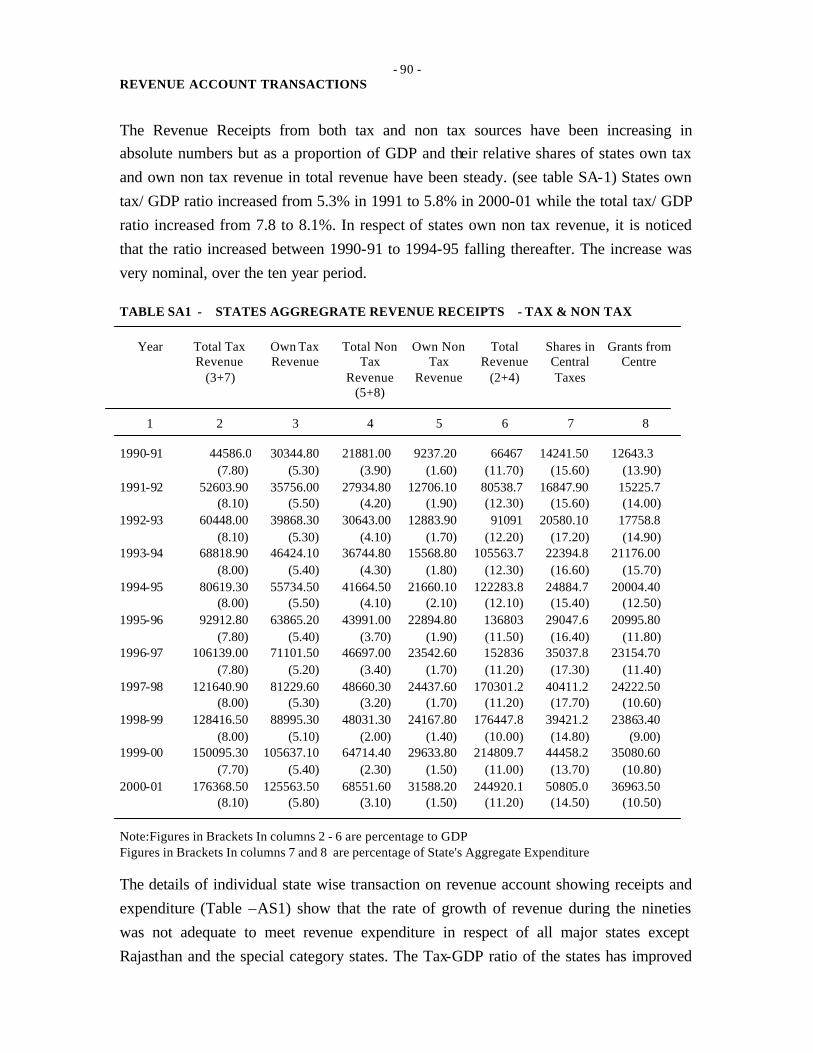
- 90 -
REVENUE ACCOUNT TRANSACTIONS
The Revenue Receipts from both tax and non tax sources have been increasing in
absolute numbers but as a proportion of GDP and their relative shares of states own tax
and own non tax revenue in total revenue have been steady. (see table SA-1) States own
tax/ GDP ratio increased from 5.3% in 1991 to 5.8% in 2000-01 while the total tax/ GDP
ratio increased from 7.8 to 8.1%. In respect of states own non tax revenue, it is noticed
that the ratio increased between 1990-91 to 1994-95 falling thereafter. The increase was
very nominal, over the ten year period.
TABLE SA1 - STATES AGGREGRATE REVENUE RECEIPTS - TAX & NON TAX
Year Total Tax Revenue
(3+7)
Own Tax Revenue
Total Non Tax
Revenue (5+8)
Own Non Tax
Revenue
Total Revenue
(2+4)
Shares in Central Taxes
Grants from Centre
1 2 3 4 5 6 7 8
1990-91 44586.00 30344.80 21881.00 9237.20 66467 14241.50 12643.3 (7.80) (5.30) (3.90) (1.60) (11.70) (15.60) (13.90)
1991-92 52603.90 35756.00 27934.80 12706.10 80538.7 16847.90 15225.7 (8.10) (5.50) (4.20) (1.90) (12.30) (15.60) (14.00)
1992-93 60448.00 39868.30 30643.00 12883.90 91091 20580.10 17758.8 (8.10) (5.30) (4.10) (1.70) (12.20) (17.20) (14.90)
1993-94 68818.90 46424.10 36744.80 15568.80 105563.7 22394.8 21176.00 (8.00) (5.40) (4.30) (1.80) (12.30) (16.60) (15.70)
1994-95 80619.30 55734.50 41664.50 21660.10 122283.8 24884.7 20004.40 (8.00) (5.50) (4.10) (2.10) (12.10) (15.40) (12.50)
1995-96 92912.80 63865.20 43991.00 22894.80 136803 29047.6 20995.80 (7.80) (5.40) (3.70) (1.90) (11.50) (16.40) (11.80)
1996-97 106139.00 71101.50 46697.00 23542.60 152836 35037.8 23154.70 (7.80) (5.20) (3.40) (1.70) (11.20) (17.30) (11.40)
1997-98 121640.90 81229.60 48660.30 24437.60 170301.2 40411.2 24222.50 (8.00) (5.30) (3.20) (1.70) (11.20) (17.70) (10.60)
1998-99 128416.50 88995.30 48031.30 24167.80 176447.8 39421.2 23863.40 (8.00) (5.10) (2.00) (1.40) (10.00) (14.80) (9.00)
1999-00 150095.30 105637.10 64714.40 29633.80 214809.7 44458.2 35080.60 (7.70) (5.40) (2.30) (1.50) (11.00) (13.70) (10.80)
2000-01 176368.50 125563.50 68551.60 31588.20 244920.1 50805.0 36963.50 (8.10) (5.80) (3.10) (1.50) (11.20) (14.50) (10.50)
Note:Figures in Brackets In columns 2 - 6 are percentage to GDP Figures in Brackets In columns 7 and 8 are percentage of State's Aggregate Expenditure The details of individual state wise transaction on revenue account showing receipts and
expenditure (Table –AS1) show that the rate of growth of revenue during the nineties
was not adequate to meet revenue expenditure in respect of all major states except
Rajasthan and the special category states. The Tax-GDP ratio of the states has improved
- 91 -
from 4.2 % during the Seventies to 5.2 % on an average during the Eighties and further
to 5.7 % during the Nineties The Average Annual Growth Rate of Tax Revenue of All
States was 16.8 % during 1980-81 to 1984-85 , 16.2 % between 1985-86 and 1989-90 ,
16.5 % between 1990-91 and 1994-95. This growth was however not adequate as the
Non Development expenditure grew at 19.2 % 18.2 and 20.9 % during the corresponding
periods with the result , that Development Expenditure got regulated and grew at
Average Annual Growth Rates of 16.1 % , 13.7 % and 14.5 % during the corresponding
periods. The State’s share in Central Taxes showed an increase during the second half of
the Eighties , 17.6 % between 1985-86 and 1989-90 , as compared to 11.5 % during the
earlier period of 1980-81 and 1984-85 but the growth rate falling to 13.8 % during
1990-91 and 1994-95 place the states once again in some difficulty. The consequent
increase in revenue deficit during the Nineties is brought out clearly in the following
table
TABLE : 5 . 3 TRANSACTIONS ON REVENUE ACCOUNTS – ALL STATES
(Rs,crores)
Year Rev. Recpt Exp Surplus/ Deficit
1990-91 66466.80 71775.80 -5309.00
1991-92 80535.70 86186.40 -5650.70
1992-93 91091.10 96205.20 -5114.10
1993-94 105563.70 109376.20 -3812.50
1994-95 122283.70 128439.90 -6156.20
1995-96 136803.40 145003.90 -8200.50
1996-97 152836.40 168950.30 -16113.90
1997-98 170300.80 186633.80 -16333.00
1998-99 176447.70 220089.50 -43641.80
1999-00 214809.60 271611.30 -56801.60
2000-01 244920.10 290622.40 -45702.30
Source : Compiled at IIE
The trend of increasing revenue deficit was common to nearly all the states with size of
the gap fluctuating from year to year. The gap became more pronounced in the latter part
of the 90’s , with nearly every state reporting revenue deficit in 2000-01 Regrettably
even special category states started reporting revenue deficit except Arunachal Pradesh,
Nagaland, Sikkim and NCT Delhi.
- 92 -
An important aspect is that the state’s estimate of Revenue Receipts have not been
achieved , with revised estimate showing shortfalls compared to the budget estimates .
RBI’s analysis of Fiscal Marksmanship , - reflecting the degree of accuracy between
estimates and actuals show that the deviations have often been large between the actuals
and not only the budget estimates but also the revised estimates. This is attributed to the
dependence of states on resources outside their control like Central Transfers and Market
Borrowings . It has been observed that “ the States in the Indian Federal setup have social
and developmental responsibilities which are not adequately complimented by their
resource assignments . Moreover the State’s ability to access External Sources of Finance
has also been capped. This has led to a divergence between receipts and expenditure of
states”(RBI State Finances - Study of Budgets 1999-2000 pg 22) .Further , there has been
in the late Nineties some uncertainty attributable to the initial losses on account of
rationalisation and harmonisation measures being under taken as part of the process to
introduce uniform value added tax in all the states.The end result is the revenue receipts
of states grew at 15.8 % in the Eighties and 14.6 % during the Nineties while total
expenditure grew at 15.7 % and 51.1 % during the relevant periods , leading to greater
divergence.
ADDITIONAL RESOURCE MOBILISATION
Analysis of the estimated yield from additional resource mobilisation (ARM) by way of
tax and non tax measures during the 90’s show that the states did make some efforts
increasing the yield from Rs. 772.16 crores in 1991 to Rs. 1383.80 crores in 1994-95.
After lower yields in the following three years, Rs. 948.9 crores in 1995-96, Rs. 684.40
crores in 1996-97 and Rs. 1012 crores in 1997-98, there was a sharp increase to Rs.
2969.60 crores in 1998-99 and Rs. 5599 crores in 1999-00. Non tax receipts which were
rather low began to pick up in the late 90’s mainly on account of efforts in NCT Delhi,
Rajasthan, Maharashtra, Madhya Pradesh, Bihar and Jammu & Kashmir. The states
which have sought to pursue ARM measures every year include Gujarat, Maharashtra,
Kerala, West Bengal, while Karnataka , Madhya Pradesh, Punjab, Rajasthan and Tamil
Nadu have attempted to raise resources in all but one or two years during the nineties.
Two significant factors emerged from the point of view of policy formulation and
programme measures. As the RBI Study of State Finances 2000-01 shows, the fourteen
states that had proposed ARM to the tune of Rs. 2677 crores in 2000-01, many have
entered into MOU with the Central Government and availed assistance under the scheme
for monitored fiscal reforms. In retrospect one may ask whether the terms of references
to the Finance Commission in regard to bridging the gap between the revenue and
expenditure of the states had any influence on the manner in which revenue estimates
- 93 -
were prepared and realisation reported by the State Governments. It may be noted that
the transfers recommended by the Tenth Finance Commission did not envisage any
revenue deficit grants to the states in the year 1999-2000 in the expectation that revenue
deficits would disappear from the budget with better revenue effort and expenditure
management. As the Eleventh Finance Commission pointed out this did not materialise
and on the contrary there has been steady deterioration. One needs to examine whether
the unintended incentive in the terms of reference to and approach of the previous
Finance Commissions for the States to indulge in fiscal prodigalism can be fully
corrected only by MOU’s and the newly created Incentive Fund for performance for
monitorable fiscal reform programme.
CAPITAL ACCOUNT RECEIPTS
Analysis of state wise details of receipts on the Capital Account (Table-AS2 All States)
show that the aggregate capital receipts of all states put together had increased from Rs.
24846.8 Crores with a net surplus of Rs. 5380.6 crores in 1990-91, to Rs. 43630.10
crores with a net surplus of Rs. 11050.3 crores in 1995-96, and further to Rs. 101543.78
crores with the surplus of Rs. 41399.4 crores in 2000-01. This surplus is rather deceptive
and should infact cause alarm , the internal debt has increased from Rs.3264 crores in
1991 to Rs. 22228 crores in 1999-2000. The BE for 2000-2001 places it at Rs.26293
crores , marking more than eightfold increase during the nineties. Likewise loan from
Centre have also increased from Rs. 3974 crores in 1990-91 to Rs.49527 crores in 1999-
2000 . The BE for 2000-2001 place this at Rs.51893 crores . While borrowing has been
increasing capital disbursements appear to be increasing at a much lower rate from Rs.
19467 crores in 1990-91 to Rs. 54023 crores in 1999-2000 , coming down as a
percentage of GDP from 3.40 % to 2.80 % during the period. This is indicative of a
tendency to use borrowed funds to finance revenue expenditure , instead for creating
capital assets .
The year wise details of capital receipts , internal debt , Loans from centre and Capital
disbursements for the period 1990-91 to 2000-2001 BE are shown in the Table .

- 94 -
TABLE : SA 1C - CAPITAL RECEIPTS & DISBURSEMENTS (Rs. Crores)
Year Total Cap.recpt
Internal Debt
Loans From Centre
Cap Disb Surplus/ Deficit
1990-91 24847.00 3264.00 13974.00 19467.00 5380.00
(4.40) (3.40)
1991-92 27954.00 5042.00 13069.00 22460.00 5494.00
(4.30) (3.40)
1992-93 30073.00 4731.00 13100.00 23129.00 6944.00
(4.00) (3.10)
1993-94 28623.00 5189.00 14410.00 25272.00 3351.00
(3.30) (2.90)
1994-95 43738.00 8741.00 19253.00 33114.00 10624.00
(4.30) (3.30)
1995-96 43630.00 7847.00 19600.00 32580.00 11050.00
(3.70) (2.70)
1996-97 42891.00 8214.00 23782.00 33819.00 9072.00
(3.10) (2.50)
1997-98 59937.00 10754.00 30771.00 41501.00 18436.00
(3.90) (2.70)
1998-99 86393.00 16085.00 40342.00 46271.00 40122.00
(4.90) (2.60)
1999-00 101612.00 22228.00 49527.00 54023.00 47589.00
(RE) (5.20) (2.80)
2000-01 101544.00 26293.00 51893.00 60144.00 41400.00
(BE) (4.70) (2.80)
Note : Figures in brackets are percentage of GDP
5 . 3 TRENDS IN EXPENDITURE MANAGEMENT
By far the most important contribution to fiscal imbalance in the states have been on the
expenditure side. This could be seen from the steep increase in total expenditure of state
governments, over the last several decades . The total expenditure of Rs.70993 crores on
revenue account during 1990-91 equals the entire revenue account expenditure for three
decades from the First Plan to the Fifth Plan periods .
If the increases in the total expenditure of the states during the last two decades is
staggering, the changes in the composition of expenditure is rather distressing. Between
1970-71 and 1999-00, Revenue Expenditure increased, as proportion of total expenditure
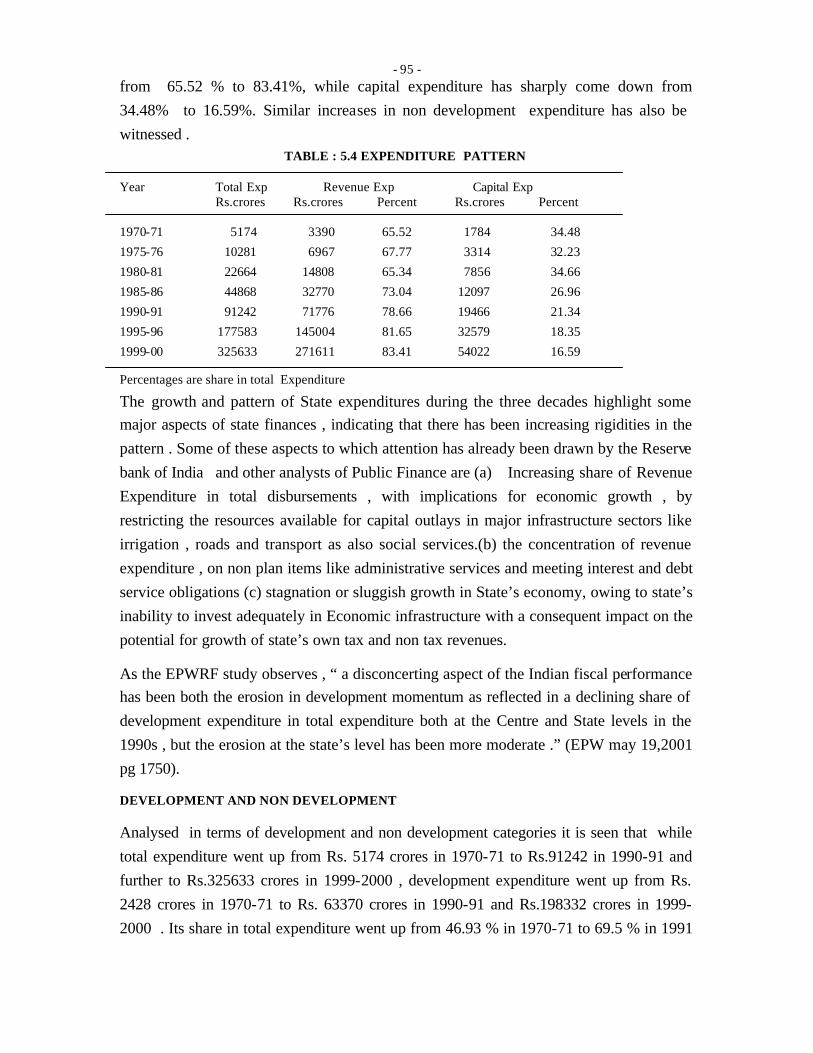
- 95 -
from 65.52 % to 83.41%, while capital expenditure has sharply come down from
34.48% to 16.59%. Similar increases in non development expenditure has also be
witnessed . TABLE : 5.4 EXPENDITURE PATTERN
Year Total Exp Revenue Exp Capital Exp Rs.crores Rs.crores Percent Rs.crores Percent 1970-71 5174 3390 65.52 1784 34.48
1975-76 10281 6967 67.77 3314 32.23
1980-81 22664 14808 65.34 7856 34.66
1985-86 44868 32770 73.04 12097 26.96
1990-91 91242 71776 78.66 19466 21.34
1995-96 177583 145004 81.65 32579 18.35
1999-00 325633 271611 83.41 54022 16.59
Percentages are share in total Expenditure
The growth and pattern of State expenditures during the three decades highlight some
major aspects of state finances , indicating that there has been increasing rigidities in the
pattern . Some of these aspects to which attention has already been drawn by the Reserve
bank of India and other analysts of Public Finance are (a) Increasing share of Revenue
Expenditure in total disbursements , with implications for economic growth , by
restricting the resources available for capital outlays in major infrastructure sectors like
irrigation , roads and transport as also social services.(b) the concentration of revenue
expenditure , on non plan items like administrative services and meeting interest and debt
service obligations (c) stagnation or sluggish growth in State’s economy, owing to state’s
inability to invest adequately in Economic infrastructure with a consequent impact on the
potential for growth of state’s own tax and non tax revenues.
As the EPWRF study observes , “ a disconcerting aspect of the Indian fiscal performance
has been both the erosion in development momentum as reflected in a declining share of
development expenditure in total expenditure both at the Centre and State levels in the
1990s , but the erosion at the state’s level has been more moderate .” (EPW may 19,2001
pg 1750).
DEVELOPMENT AND NON DEVELOPMENT
Analysed in terms of development and non development categories it is seen that while
total expenditure went up from Rs. 5174 crores in 1970-71 to Rs.91242 in 1990-91 and
further to Rs.325633 crores in 1999-2000 , development expenditure went up from Rs.
2428 crores in 1970-71 to Rs. 63370 crores in 1990-91 and Rs.198332 crores in 1999-
2000 . Its share in total expenditure went up from 46.93 % in 1970-71 to 69.5 % in 1991

- 96 -
before coming down to 60.90% in 1999-2000. The share of non development
expenditure increased from 24.8% in 1990-91 to 33.80% in 1999-00.
TABLE SA-3 STATES AGGREGRATE DEVELOPMENT, NON DEVELOPMENT & OTHER EXPENDITURE
Year Develop Non dev Others Total % of GDP
1990-91 63370.00 22600.00 5272.00 91242.00 16.00
(69.50) (24.80) (5.70)
1991-92 74588.00 27143.00 6916.00 108647.00 16.60
(68.70) (25.00) (6.30)
1992-93 80566.90 32103.80 6664.00 119335.00 15.90
(67.50) (26.90) (5.60)
1993-94 89387.60 38019.60 7241.00 134648.00 15.70
(66.40) (28.20) (5.40)
1994-95 104347.80 49556.00 7650.00 161554.00 16.00
(64.60) (30.70) (4.70)
1995-96 114819.40 55379.90 7385.00 177584.00 14.90
(64.70) (31.20) (4.10)
1996-97 132007.70 62095.40 8664.00 202767.00 14.80
(65.10) (30.60) (4.30)
1997-98 145268.40 71766.90 11100.00 228135.00 15.00
(63.70) (31.50) (4.80)
1998-99 164503.50 86474.40 15383.00 266361.00 15.10
(61.80) (32.50) (5.70)
1999-00 198321.80 110137.10 17175.00 325634.00 16.60
(60.90) (33.80) (5.30)
2000-01 208332.40 125484.30 16950.00 350767.00 16.10
(59.39) (35.77) (4.84)
Note: Figures in the bracket are percentages to the total
As the RBI Study of State Finances (1999-00) observed “Failure to contain expenditure
has been accepted as a major reason for the fiscal woes of the state governments. While
the development expenditure in absolute terms has been higher than the non development
component, the latter has been rising faster through out the eighties and the nineties. In
the eighties non development expenditure rose at an average rate of 18.7% as compared
with 14.9% for development expenditure, while in the nineties the growth was even
faster at 19.1% with a concomitant decline in growth in developmental expenditure at
13.7%.
- 97 -
One needs to note in this regard that the size of overall development expenditure of the
states has always been higher than that of the Centre and that the difference has widened
significantly in the 1990’s. EPW Research Foundations’s Review of State Finances
observes that “in 1990-91 state development expenditure exceeded that of the centre by
less than 10% but by 2000-01 it had exceeded by about 55%. What is more, in total
government expenditure on social services the share of the state governments now
constitutes over 86% while central expenditure accounts for less than 14%.
EXPENDITURE IN MAJOR HEADS
Taking a closer view of the expenditure in Major Heads of expenditure categorized
developmental and non developmental, in the more proximate period between 1990-91
and 1999-2000, one notices that the total developmental expenditure of all the states
increased in absolute terms from Rs. 63370 crore in 1990-91 to Rs. 198322 crore in
1999-00 but as a percentage of GDP it came down from 11.1% to 10.1% in the relevant
period. This fall is common to both direct developmental expenditure covering social and
economic services, as also to loans and advances by state government in the various
sectors. Between 1990-91 and 1999-2000 direct developmental expenditure increased
from Rs.57815 crores to Rs. 186492 crores, even while falling, as a percentage of GDP
from 10.2% to 9.5%. Of this, the expenditure on Social Services, which was declining
slightly in the mid nineties picked up in the later years of the nineties, where as
expenditure on Economic Services continued to decline as a proportion of GDP. Loans
and advances, given by the state governments in the areas of housing, cooperation, crop
husbandry, soil and water conservation, village and small industry are covered in this
category. While the developmental advances to this sectors, were marked by nominal
increases from year to year, the advances to the power projects showed a significant
increase from Rs. 3585 crores in 1990-91 to Rs. 5951 crores in 1999-00.
With direct development expenditure in Irrigation Sector increasing from Rs. 7113
crores to Rs. 19871 crores and that in Energy increasing from Rs. 1994 crores to Rs.
6914 crores during the same period, it appears that infrastructural expenditure was on the
increase. The other areas of significant increase in developmental expenditure between
1990-91 to 1999-00 were water supply and sanitation from Rs. 1993 crores to Rs. 7782
crores Urban Development from Rs. 664 crore to Rs. 4033 crores and welfare of
Scheduled Caste from Rs. 1909 crores to Rs. 6900 crores. Similar increase has also been
noticed in agricultural and rural development, which accounted for over 35% of the
expenditure on Economic Services.
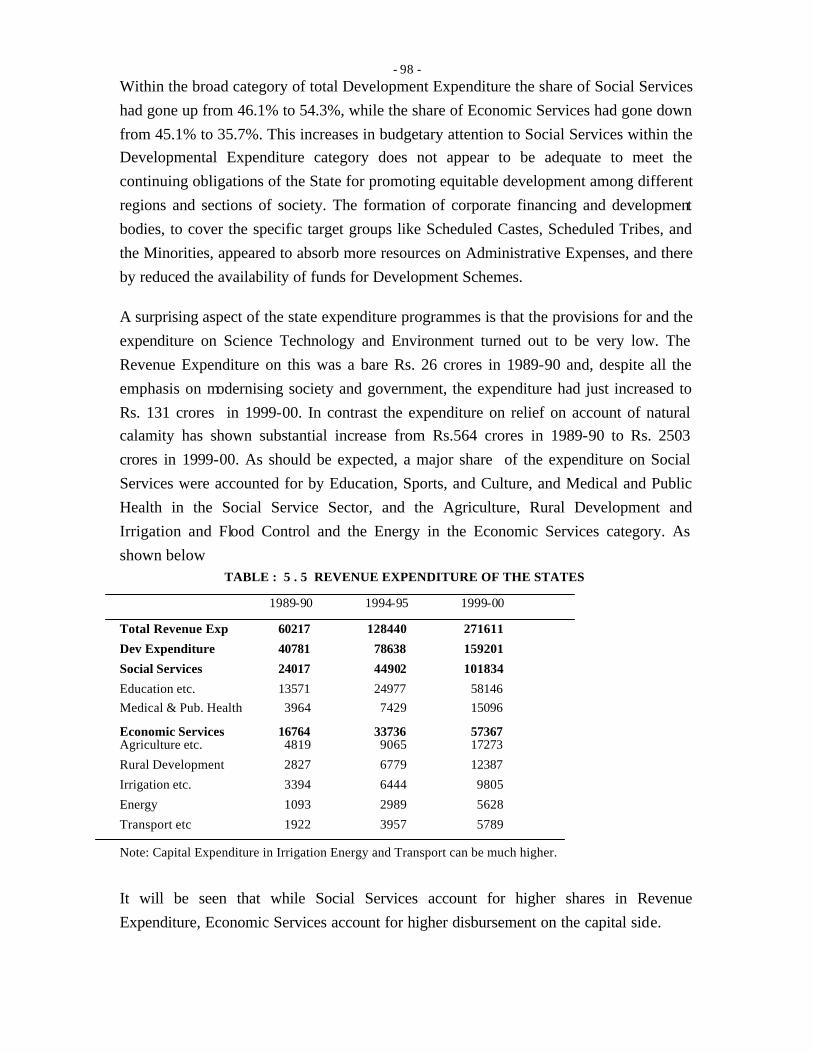
- 98 -
Within the broad category of total Development Expenditure the share of Social Services
had gone up from 46.1% to 54.3%, while the share of Economic Services had gone down
from 45.1% to 35.7%. This increases in budgetary attention to Social Services within the
Developmental Expenditure category does not appear to be adequate to meet the
continuing obligations of the State for promoting equitable development among different
regions and sections of society. The formation of corporate financing and development
bodies, to cover the specific target groups like Scheduled Castes, Scheduled Tribes, and
the Minorities, appeared to absorb more resources on Administrative Expenses, and there
by reduced the availability of funds for Development Schemes.
A surprising aspect of the state expenditure programmes is that the provisions for and the
expenditure on Science Technology and Environment turned out to be very low. The
Revenue Expenditure on this was a bare Rs. 26 crores in 1989-90 and, despite all the
emphasis on modernising society and government, the expenditure had just increased to
Rs. 131 crores in 1999-00. In contrast the expenditure on relief on account of natural
calamity has shown substantial increase from Rs.564 crores in 1989-90 to Rs. 2503
crores in 1999-00. As should be expected, a major share of the expenditure on Social
Services were accounted for by Education, Sports, and Culture, and Medical and Public
Health in the Social Service Sector, and the Agriculture, Rural Development and
Irrigation and Flood Control and the Energy in the Economic Services category. As
shown below TABLE : 5 . 5 REVENUE EXPENDITURE OF THE STATES
1989-90 1994-95 1999-00
Total Revenue Exp 60217 128440 271611
Dev Expenditure 40781 78638 159201
Social Services 24017 44902 101834
Education etc. 13571 24977 58146
Medical & Pub. Health 3964 7429 15096 Economic Services 16764 33736 57367 Agriculture etc. 4819 9065 17273
Rural Development 2827 6779 12387
Irrigation etc. 3394 6444 9805
Energy 1093 2989 5628
Transport etc 1922 3957 5789
Note: Capital Expenditure in Irrigation Energy and Transport can be much higher.
It will be seen that while Social Services account for higher shares in Revenue
Expenditure, Economic Services account for higher disbursement on the capital side.
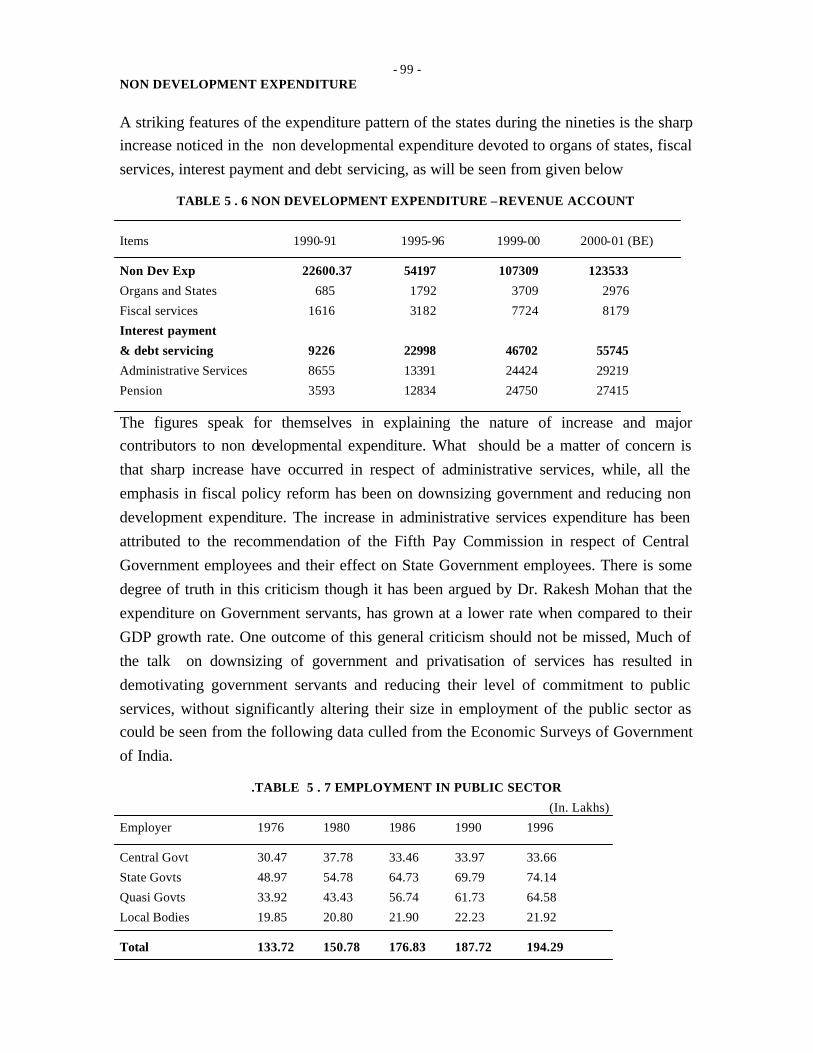
- 99 -
NON DEVELOPMENT EXPENDITURE
A striking features of the expenditure pattern of the states during the nineties is the sharp
increase noticed in the non developmental expenditure devoted to organs of states, fiscal
services, interest payment and debt servicing, as will be seen from given below
TABLE 5 . 6 NON DEVELOPMENT EXPENDITURE –REVENUE ACCOUNT
Items 1990-91 1995-96 1999-00 2000-01 (BE)
Non Dev Exp 22600.37 54197 107309 123533
Organs and States 685 1792 3709 2976
Fiscal services 1616 3182 7724 8179
Interest payment
& debt servicing 9226 22998 46702 55745
Administrative Services 8655 13391 24424 29219
Pension 3593 12834 24750 27415
The figures speak for themselves in explaining the nature of increase and major
contributors to non developmental expenditure. What should be a matter of concern is
that sharp increase have occurred in respect of administrative services, while, all the
emphasis in fiscal policy reform has been on downsizing government and reducing non
development expenditure. The increase in administrative services expenditure has been
attributed to the recommendation of the Fifth Pay Commission in respect of Central
Government employees and their effect on State Government employees. There is some
degree of truth in this criticism though it has been argued by Dr. Rakesh Mohan that the
expenditure on Government servants, has grown at a lower rate when compared to their
GDP growth rate. One outcome of this general criticism should not be missed, Much of
the talk on downsizing of government and privatisation of services has resulted in
demotivating government servants and reducing their level of commitment to public
services, without significantly altering their size in employment of the public sector as
could be seen from the following data culled from the Economic Surveys of Government
of India.
.TABLE 5 . 7 EMPLOYMENT IN PUBLIC SECTOR
(In. Lakhs)
Employer 1976 1980 1986 1990 1996
Central Govt 30.47 37.78 33.46 33.97 33.66
State Govts 48.97 54.78 64.73 69.79 74.14
Quasi Govts 33.92 43.43 56.74 61.73 64.58
Local Bodies 19.85 20.80 21.90 22.23 21.92
Total 133.72 150.78 176.83 187.72 194.29
- 100 -
The Table clearly brings out that the increase in employment at the Central level which
concerns with policy making and economic coordination has been marginal, as also in
the local bodies which provide public services. It is understandable that the Government
of India have over a period of two decade added only 3.17 lakh employees. But the
addition of a mere of only 2.59 lakhs in the local bodies should rather be disconcerting,
considering that much of the services impinging on quality of life in urban and rural
areas like water supply and sanitation and roads are attended to by the local bodies. It
must at the same time be recognised that the addition of 25.88 lakh employees in the
state government and 21.43 lakh employees in the quasi government organisations, do
not, in comparison commend themselves as proper employment policy even if one were
to ignore the preemption by salary and wages bill of a large share of the revenue
moblised by this organisations, and the progressive reduction in resources available for
deployment in capital investment and development activities.
What is required, in a proper examination of man power requirements, at the various
tiers of the governments in relation to the need for performance of essential services to
the community. Macro level prescriptions of Expenditure Reforms announced often over
look the vital imperative that in certain sectors, and departments , the increasing
population of the country needs to be serviced by in increasing number of persons in the
department providing the need and the services, and that in sectors and areas of economic
and social activity from which the state has chosen to withdraw, the number of
employees could be reduced. Whether such an approach would, in the immediate run,
mean a mismatch of skills available need to be examined, particularly in engineering
departments. Given the nature of tenure and terms of employment of Government and
Semi Government employees, redeployment of the employees appears to be a better
option and this option should be pursued more vigorously than the Voluntary Retirement
option.
PLAN AND NON PLAN EXPENDITURE
Analysed in terms of plan and non plan categories of expenditure, it is seen that while
plan expenditure of the states increased in absolute terms from Rs. 27433 crores in 1990-
91 to Rs. 78156 crores in 1999-00, their share has a percentage of total expenditure came
down form 30.10% to 24% during the same period. This trend was common to both the
states and centres. As a percentage of total expenditure of the states the share of non plan
expenditure increased from 69.9% in 1990-91 to 76% in 1999-00.
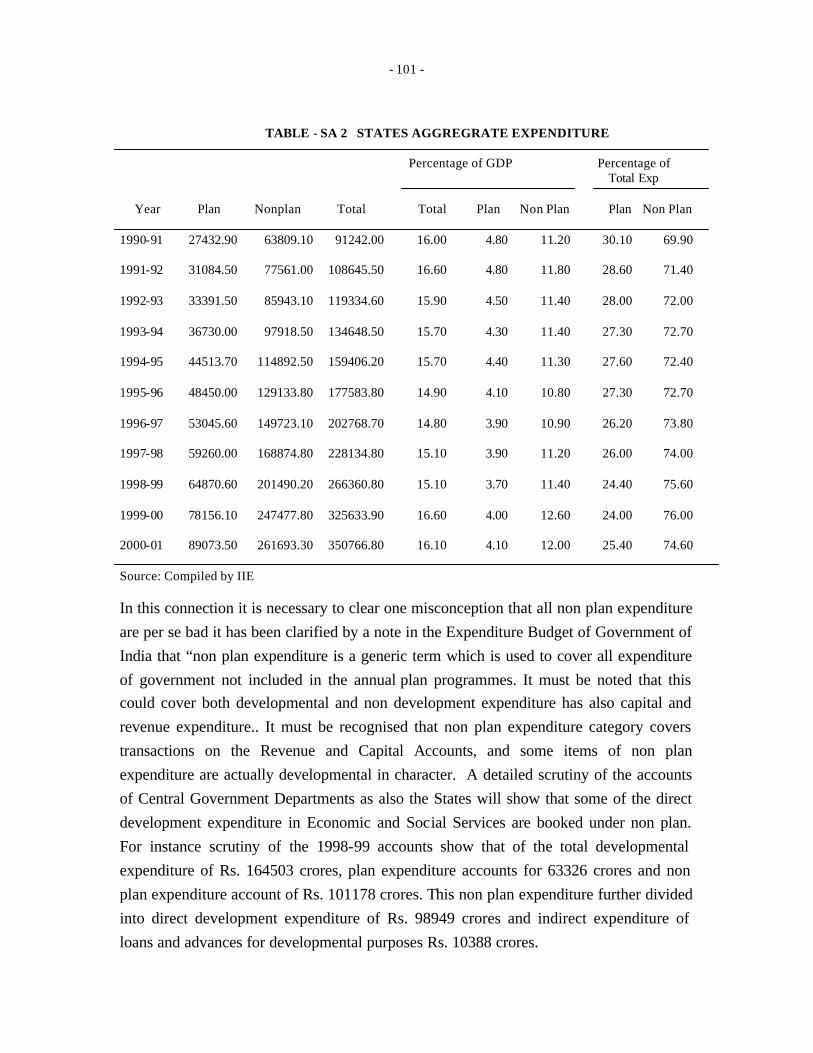
- 101 -
TABLE - SA 2 STATES AGGREGRATE EXPENDITURE Percentage of GDP Percentage of
Total Exp
Year Plan Nonplan Total Total Plan Non Plan Plan Non Plan
1990-91 27432.90 63809.10 91242.00 16.00 4.80 11.20 30.10 69.90
1991-92 31084.50 77561.00 108645.50 16.60 4.80 11.80 28.60 71.40
1992-93 33391.50 85943.10 119334.60 15.90 4.50 11.40 28.00 72.00
1993-94 36730.00 97918.50 134648.50 15.70 4.30 11.40 27.30 72.70
1994-95 44513.70 114892.50 159406.20 15.70 4.40 11.30 27.60 72.40
1995-96 48450.00 129133.80 177583.80 14.90 4.10 10.80 27.30 72.70
1996-97 53045.60 149723.10 202768.70 14.80 3.90 10.90 26.20 73.80
1997-98 59260.00 168874.80 228134.80 15.10 3.90 11.20 26.00 74.00
1998-99 64870.60 201490.20 266360.80 15.10 3.70 11.40 24.40 75.60
1999-00 78156.10 247477.80 325633.90 16.60 4.00 12.60 24.00 76.00
2000-01 89073.50 261693.30 350766.80 16.10 4.10 12.00 25.40 74.60
Source: Compiled by IIE
In this connection it is necessary to clear one misconception that all non plan expenditure
are per se bad it has been clarified by a note in the Expenditure Budget of Government of
India that “non plan expenditure is a generic term which is used to cover all expenditure
of government not included in the annual plan programmes. It must be noted that this
could cover both developmental and non development expenditure has also capital and
revenue expenditure.. It must be recognised that non plan expenditure category covers
transactions on the Revenue and Capital Accounts, and some items of non plan
expenditure are actually developmental in character. A detailed scrutiny of the accounts
of Central Government Departments as also the States will show that some of the direct
development expenditure in Economic and Social Services are booked under non plan.
For instance scrutiny of the 1998-99 accounts show that of the total developmental
expenditure of Rs. 164503 crores, plan expenditure accounts for 63326 crores and non
plan expenditure account of Rs. 101178 crores. This non plan expenditure further divided
into direct development expenditure of Rs. 98949 crores and indirect expenditure of
loans and advances for developmental purposes Rs. 10388 crores.

- 102 -
EPW Research Foundation Study of Finances and The State Government indicates that
“for all States together over 97% of plan expenditure are under developmental heads and
that 55% of such plan expenditure are under revenue account and 45% are under capital
account”: It must be noted that vital items of expenditure like those involved in
maintenance of law and order has also maintenance expenditure of Projects are included
in the non plan category. Further even expenditure on continuing services and activities
of levels already reached in a plan period (like continuing Research Projects and
operating expenses of Power Stations) is classified as non plan expenditure in the next
plan period. Given this clarification, the pejorative inferences to non plan expenditure
could be eschewed, and analysis proceed on rational lines.
5 . 4 SIZE OF DEBT AND INTEREST BURDEN
As has been pointed out earlier, the increasing the revenue gap had obliged state
governments to resort to loans from the Centre and to market borrowing to meet their
expenditure requirements.
Total Debt of the States as of March each year increased from Rs . 23067 Crores (
16% of GDP ) in 1980-81 to Rs. 52281 crores (18.8% of GDP) in 1986 , Rs. 108203
crores (19% of GDP) in 1991 and further to Rs. 212226 crores (17.9% of GDP ) in 1996
and even more sharply raising to Rs. 281209 crores (18.5% of GDP) in 1998 and Rs
341978 crores (17.5% of GDP) in 1999, and Rs 418584 crores (19.2% of GDP ) in 2000
and to Rs. 4,98,841 crores (20.2% of GDP) in 2001.
A grim indicator of the prodigality of the states is the startling fact that while the states
accumulated additional total debt of Rs. 55,922 crores in the Five Year Period between
1986 and 1991. In the next five years the doubled the quantum of addition- by increasing
the total debt by Rs. 104023 crores to Rs. 212226 crores in 1996. The total debt increased
by Rs. 60,769 crores during one year 1998-99, by Rs. 76,606 crores during 1999-00 and
Rs. 80,257 crores during the single year of 2000-01.
As EPW Research Foundation Study of Finances of State Governments pointed out, “the
end product of fiscal laxity is seen in growing outstanding liabilities of state
governments. In fact, this began in the second half of the nineties when revenue growth
suffered a set back. The debt stock of all the state government s together as a percentage
of GDP, which had remained stable at around 19% in the second half of the 1980’s, had
in fact declined in the first half of 1990’s to less than 18%. Thereafter it began raising
and touched 21.4% by March 2000 and 22.9% by March 2001.

- 103 -
It is important to note that out of the outstanding debt of Rs. 4,98,841 crores remaining in
March 2001, loans and advances from the central governments accounted for Rs.
2,85,825 crores, 57.3% of the total outstanding debt.
It is to be noted that while in the eighties, loans from the Centre met 51.9% of the overall
borrowing requirements of the states, these could meet only 48.5% of the needs during
the nineties. In view of this market borrowing as a source of finance became more
important meeting 16.4% of the state fiscal deficit in the nineties as compared to 11%
during the eighties. With the deregulation of the interest rate, the cost implication of
market borrowings became serious. The weighted average of interest rates for loans of
state governments increased from 11.50% in 1990-91 to 12.35% in 1998-99. The
aggregate gross interest payments of all states increased from Rs. 10944 crores in 1991-
92 to Rs. 54271 crores in 2000-01 and increase , as a percentage of revenue receipts was
from 13.5% in 1991-92 to 22.20% in 2000-01 (see Table SA-5).
The Reserve Bank of India , in its study of Finances of State Governments , 1996-97
explains the inter relation between the nature of increase in Capital receipts of States ,
increasing share of Central Loans , and the rising interest payment obligations of the
states. The Study observed “ Since the Central Government has been resorting to market
related interest rates , the interest rates on the loans extended by the Centre to the States
have also been increased by Centre. As a result the average interest rate charged by
Central loans to states has been rising .In 1980-81 , the average interest rate charged by
Centre on the on- lent funds was 5.50 % , which rose to 8.86 % in 1991-92 . Since then it
has grown steadily to reach 11.39 % in 1995-96 and 11.74 % in 1996-97 . Loans for
State Plan schemes are the single largest component of Central loan to states which have
an average maturity of 20 years . Interest rates on these loans have been revised to 13.5
% with effect from June 1 , 1995 , which is close to the yield rate on longest maturity
central loan presently offered. On the other hand, the average borrowing cost to the
Centre from market has increased from 10.43 % in 1991-92 to 12.05 % in 1995-96 and
further to 12.09 % in 1996-97 . With the result , the interest rate subsidy from the Centre
to the States has come down from 1.57 % in 1991-92 to 0.66 % in 1995-96 and further
to 0.35 % in 1996-97. Thus rising share of Central loans in the borrowing requirements
of the states while obviating a need for states access to other borrowing sources on a
large scale also implies some cost to the Central Budget and subsidy to the states to the
extent that the interest costs on Centre’s borrowing is higher than the interest rates
charged by it to the states.” (pg 8 of 1996-97, RBI Study Finances of State Governments
1996-97)
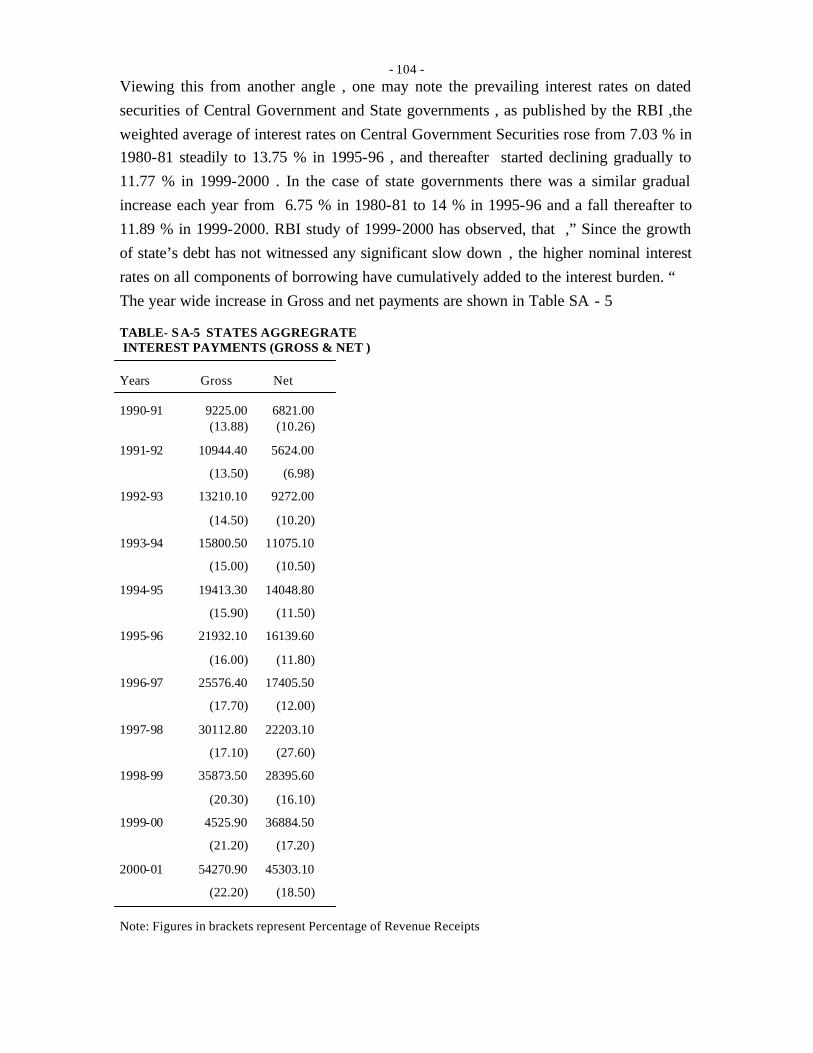
- 104 -
Viewing this from another angle , one may note the prevailing interest rates on dated
securities of Central Government and State governments , as published by the RBI ,the
weighted average of interest rates on Central Government Securities rose from 7.03 % in
1980-81 steadily to 13.75 % in 1995-96 , and thereafter started declining gradually to
11.77 % in 1999-2000 . In the case of state governments there was a similar gradual
increase each year from 6.75 % in 1980-81 to 14 % in 1995-96 and a fall thereafter to
11.89 % in 1999-2000. RBI study of 1999-2000 has observed, that ,” Since the growth
of state’s debt has not witnessed any significant slow down , the higher nominal interest
rates on all components of borrowing have cumulatively added to the interest burden. “
The year wide increase in Gross and net payments are shown in Table SA - 5
TABLE- S A-5 STATES AGGREGRATE INTEREST PAYMENTS (GROSS & NET )
Years Gross Net
1990-91 9225.00 6821.00
(13.88) (10.26)
1991-92 10944.40 5624.00
(13.50) (6.98)
1992-93 13210.10 9272.00
(14.50) (10.20)
1993-94 15800.50 11075.10
(15.00) (10.50)
1994-95 19413.30 14048.80
(15.90) (11.50)
1995-96 21932.10 16139.60
(16.00) (11.80)
1996-97 25576.40 17405.50
(17.70) (12.00)
1997-98 30112.80 22203.10
(17.10) (27.60)
1998-99 35873.50 28395.60
(20.30) (16.10)
1999-00 4525.90 36884.50
(21.20) (17.20)
2000-01 54270.90 45303.10
(22.20) (18.50)
Note: Figures in brackets represent Percentage of Revenue Receipts
- 105 -
Analysis of the growth of debt individual state wise reveals that the rate of debt
accumulation exceeded the revenue growth in the case of as many as 18 states, and that
five among the special category states, and nine from non special category states had
recorded debt growth at a rate higher than the all states averages.
The details of individual state wise liability for interest payment in both gross and net
terms are shown in tables-9 and 9a. Between 1991-92 and 2000-01 gross interest
payment as a percentage of revenue receipts of respective states increased from 11.10 %
to 18.90% in case of Andhra Pradesh 11.90 to 21.40 in respect of Maharashtra 10.40 to
15.40 in respect of Karnataka from 8.20 to 14.90 in respect of Tamil Nadu and from
16.90 to 18.90 in respect of Kerala.
The Reserve Bank of India Study of State Finances 2000-01 has analysed the debt
dynamics of states from a macro economic perspective and points out that this is closely
linked to fiscal accounts of the centre on account of their dependence on Federal
Financial Flows and interest rate and the investments in the economy, and the
preemption of available resources for interest payment and debt servicing reducing the
resource flows to social and economic sectors. EPW Study has raised questions on the
sustainability of state debt position in the light of the facts that a “the recent debt has
occurred at relatively high interest rates (b) it has been accompanied by significant slow
down in the revenue growth and (c) an increasing proportion of it is being used for non
developmental purposes.
An important dimension to the discussion on sustainability of state finances ha been
added by the Reserve Bank in pointing out, that “ the growing trend in guarantees at the
state level has been witnessed in the recent past on account of demand for extending
guarantees for setting up basic infra structure.” While pointing out that the state
government guarantees outstanding at the end of the financial year has increased from
Rs. 40,159 crores in 1992 to RS. 83,075 crores in 1999, the RBI point out that the
outstanding state government guarantees in respect of 17 major states as a ratio to GDP
came down from 6.5% in 1992 to 4.7% in year 1999. Since this had implications for the
risk associated with loans from financial institutions, Reserve Bank of India set up a
Technical Committee on State Governments Guarantees in 1999 for prescribing limit
ensuring greater selectivity in providing and transparency in reporting government
guarantees
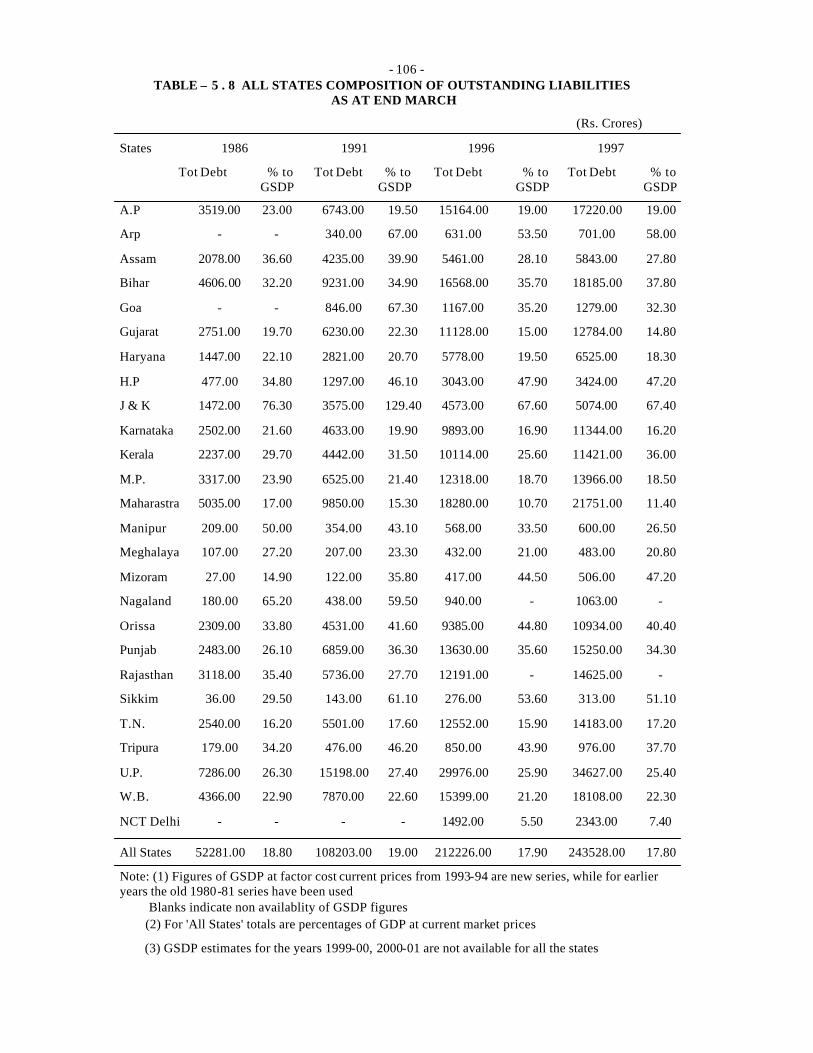
- 106 -
TABLE – 5 . 8 ALL STATES COMPOSITION OF OUTSTANDING LIABILITIES AS AT END MARCH
(Rs. Crores)
States 1986 1991 1996 1997
Tot Debt % to GSDP
Tot Debt % to GSDP
Tot Debt % to GSDP
Tot Debt % to GSDP
A.P 3519.00 23.00 6743.00 19.50 15164.00 19.00 17220.00 19.00
Arp - - 340.00 67.00 631.00 53.50 701.00 58.00
Assam 2078.00 36.60 4235.00 39.90 5461.00 28.10 5843.00 27.80
Bihar 4606.00 32.20 9231.00 34.90 16568.00 35.70 18185.00 37.80
Goa - - 846.00 67.30 1167.00 35.20 1279.00 32.30
Gujarat 2751.00 19.70 6230.00 22.30 11128.00 15.00 12784.00 14.80
Haryana 1447.00 22.10 2821.00 20.70 5778.00 19.50 6525.00 18.30
H.P 477.00 34.80 1297.00 46.10 3043.00 47.90 3424.00 47.20
J & K 1472.00 76.30 3575.00 129.40 4573.00 67.60 5074.00 67.40
Karnataka 2502.00 21.60 4633.00 19.90 9893.00 16.90 11344.00 16.20
Kerala 2237.00 29.70 4442.00 31.50 10114.00 25.60 11421.00 36.00
M.P. 3317.00 23.90 6525.00 21.40 12318.00 18.70 13966.00 18.50
Maharastra 5035.00 17.00 9850.00 15.30 18280.00 10.70 21751.00 11.40
Manipur 209.00 50.00 354.00 43.10 568.00 33.50 600.00 26.50
Meghalaya 107.00 27.20 207.00 23.30 432.00 21.00 483.00 20.80
Mizoram 27.00 14.90 122.00 35.80 417.00 44.50 506.00 47.20
Nagaland 180.00 65.20 438.00 59.50 940.00 - 1063.00 -
Orissa 2309.00 33.80 4531.00 41.60 9385.00 44.80 10934.00 40.40
Punjab 2483.00 26.10 6859.00 36.30 13630.00 35.60 15250.00 34.30
Rajasthan 3118.00 35.40 5736.00 27.70 12191.00 - 14625.00 -
Sikkim 36.00 29.50 143.00 61.10 276.00 53.60 313.00 51.10
T.N. 2540.00 16.20 5501.00 17.60 12552.00 15.90 14183.00 17.20
Tripura 179.00 34.20 476.00 46.20 850.00 43.90 976.00 37.70
U.P. 7286.00 26.30 15198.00 27.40 29976.00 25.90 34627.00 25.40
W.B. 4366.00 22.90 7870.00 22.60 15399.00 21.20 18108.00 22.30
NCT Delhi - - - - 1492.00 5.50 2343.00 7.40
All States 52281.00 18.80 108203.00 19.00 212226.00 17.90 243528.00 17.80
Note: (1) Figures of GSDP at factor cost current prices from 1993-94 are new series, while for earlier years the old 1980-81 series have been used Blanks indicate non availablity of GSDP figures (2) For 'All States' totals are percentages of GDP at current market prices
(3) GSDP estimates for the years 1999-00, 2000-01 are not available for all the states
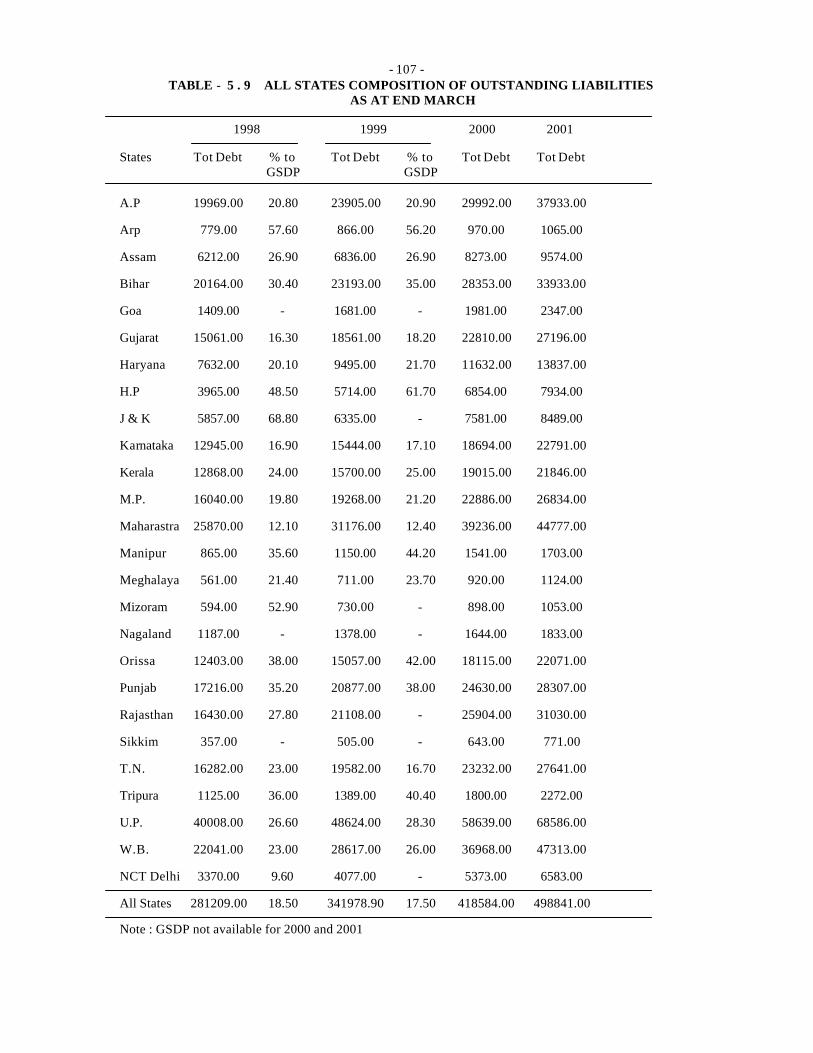
- 107 -
TABLE - 5 . 9 ALL STATES COMPOSITION OF OUTSTANDING LIABILITIES AS AT END MARCH
1998 1999 2000 2001
States Tot Debt % to GSDP
Tot Debt % to GSDP
Tot Debt Tot Debt
A.P 19969.00 20.80 23905.00 20.90 29992.00 37933.00
Arp 779.00 57.60 866.00 56.20 970.00 1065.00
Assam 6212.00 26.90 6836.00 26.90 8273.00 9574.00
Bihar 20164.00 30.40 23193.00 35.00 28353.00 33933.00
Goa 1409.00 - 1681.00 - 1981.00 2347.00
Gujarat 15061.00 16.30 18561.00 18.20 22810.00 27196.00
Haryana 7632.00 20.10 9495.00 21.70 11632.00 13837.00
H.P 3965.00 48.50 5714.00 61.70 6854.00 7934.00
J & K 5857.00 68.80 6335.00 - 7581.00 8489.00
Karnataka 12945.00 16.90 15444.00 17.10 18694.00 22791.00
Kerala 12868.00 24.00 15700.00 25.00 19015.00 21846.00
M.P. 16040.00 19.80 19268.00 21.20 22886.00 26834.00
Maharastra 25870.00 12.10 31176.00 12.40 39236.00 44777.00
Manipur 865.00 35.60 1150.00 44.20 1541.00 1703.00
Meghalaya 561.00 21.40 711.00 23.70 920.00 1124.00
Mizoram 594.00 52.90 730.00 - 898.00 1053.00
Nagaland 1187.00 - 1378.00 - 1644.00 1833.00
Orissa 12403.00 38.00 15057.00 42.00 18115.00 22071.00
Punjab 17216.00 35.20 20877.00 38.00 24630.00 28307.00
Rajasthan 16430.00 27.80 21108.00 - 25904.00 31030.00
Sikkim 357.00 - 505.00 - 643.00 771.00
T.N. 16282.00 23.00 19582.00 16.70 23232.00 27641.00
Tripura 1125.00 36.00 1389.00 40.40 1800.00 2272.00
U.P. 40008.00 26.60 48624.00 28.30 58639.00 68586.00
W.B. 22041.00 23.00 28617.00 26.00 36968.00 47313.00
NCT Delhi 3370.00 9.60 4077.00 - 5373.00 6583.00
All States 281209.00 18.50 341978.90 17.50 418584.00 498841.00
Note : GSDP not available for 2000 and 2001

- 108 -
5 . 5 GROSS FICAL DEFICIT
SIZE, DECOMPOSITON AND FINANCING
The increasing size of Aggregate Gross Fiscal Deficits of all states during the nineties
(Table SA-6), their decomposition (Table –SA-7) and their financing (Table Sa-8)
present a rather distressing picture. The individual state wise details of growing Gross
Fiscal Deficits and their decomposition (Table –7) show that the cancer has spread to all
states and the details of financing (Table –8) show that while the diagnosis is clear, fiscal
management strategy has not yet been clearly settled in favour of surgery or chemo
therapy. TABLE : 5 . 10 GROSS FISCAL DEFICIT
Year Rev Recpt Agg Exp GFD
1990-91 66466.80 85253.70 18786.90
(11.70) (15.00) (3.30)
1991-92 80535.00 99435.80 18900.10
(12.30) (15.20) (2.90)
1992-93 91091.10 111982.40 20891.3
(12.20) (15.00) (2.80)
1993-94 105563.70 126159.70 20596.00
(12.30) (14.70) (2.40)
1994-95 122283.70 149980.60 27696.90
(12.10) (14.80) (2.70)
1995-96 136803.40 168229.20 31425.80
(11.50) (14.20) (2.70)
1996-97 153029.50 190280.80 37251.30
(11.20) (13.90) (2.70)
1997-98 170300.80 214500.70 44199.90
(11.20) (14.10) (2.90)
1998-99 176952.60 251206.40 74253.80
(10.10) (14.30) (4.20)
1999-00 214809.60 309548.20 94738.60
(11.00) (15.80) (4.80)
2000-01 245320.10 335412.10 90092.00
(11.30) (15.40) (14.10)
Note: Figures in bracket represent percentage to GDP at Current Market Prices GDP figures adopted from 1993-94 onwards are according to the new series, Earlier years are according to the 1980-81 series

- 109 -
Analysis of the Aggregate figures show that for all states revenue deficit began to emerge
in the late eighties, 1987-98, and that for about a decade upto 1997-98, it remained below
one percent of GDP. Revenue Deficit , began to rise in the Nineties from about RS. 5309
crores in 1990-91 to Rs. 8200.50 crores, in 1995-96 and steeply increasing thereon to Rs.
16113 crores in 1996-97 and Rs. 16333 crores in 1997-98 and even steeper tp Rs. 43641
crores in 1998-99 and 56801 crores in 1999-2000 . and falling thereafter to Rs.45702.3
crorees .The rise since 1997-98, from 1.2% to 2.5% in 1998-99 and 2.91% in 1999-00,
has been attributed to the salary and wage pressures from a state government employees
following the implementation of the recommendation of the Fifth Pay Commission in
respect of Central Government employees.
While the Revenue Deficit increased as above Capital Outlay of the State Government
increased from Rs. 556 crores in 1970-71 to Rs.3201 crores in 1980-81 Rs.9223 crores
in 1990-91 , and increasing further to Rs 28734 crores in 1999-2000.The Loans and
Advances by State Governments had increased from Rs.491 crores to Rs.2447 crores ,
Rs. 5756 and Rs.13216 crores in the respective years.
The increase in the expenditure on the revenue and capital side began to get reflected in
the increase in Gross fiscal deficit of the state. The GFD of all the states rose from Rs.
901 crores in 1970-71 to Rs. 3713 crores in 1980-81 and 18787 crores in 1990-91.By
1999-2000 it had risen to a astounding level of Rs. 90092 crores . The G.F.D. of all
States which was only 1.96% of GDP in 1970-71 had risen to 2.57% of GDP in 1980-81
,3.30% of GDP in 1990-91, before sharply rising to touch a level of 4.86% of GDP in
1999-2000.The year wise decomposition of the GFD of all states is shown in SA - 7
With both the Centre and the States struggling to improve their fiscal make up, the Union
Government decided in 1998-99 to make a change in the classification of small savings,
shifting them to the category of States’ borrowings through special securities. The result
of this accountancy tactic was that the Centre’s deficit came down and that of the States
rose, without any material improvement in the overall fiscal health.
It also served to increase the share of Revenue Deficit in Gross Fiscal Deficit of all the
States from 29.90% in 1991-92, to 37.00 in 1997-98, and further to 58.80% in 1998-99
and 60.00% in 1999-2000. Manner of financing the Gross Fiscal Deficit also underwent
change (Table SA-7), with the loans from the Centre meetings smaller shares of GFD,
coming down from 53.11% in 1990-91, to 47.10% in 1995-96, and 42.10% in 1999-
2000. The role of market borrowings became more prominent and resort to tapping small
savings, provident funds loans from financial institutions, Reserve funds and Deposits
(shown in the category of others in Table-SA-7).
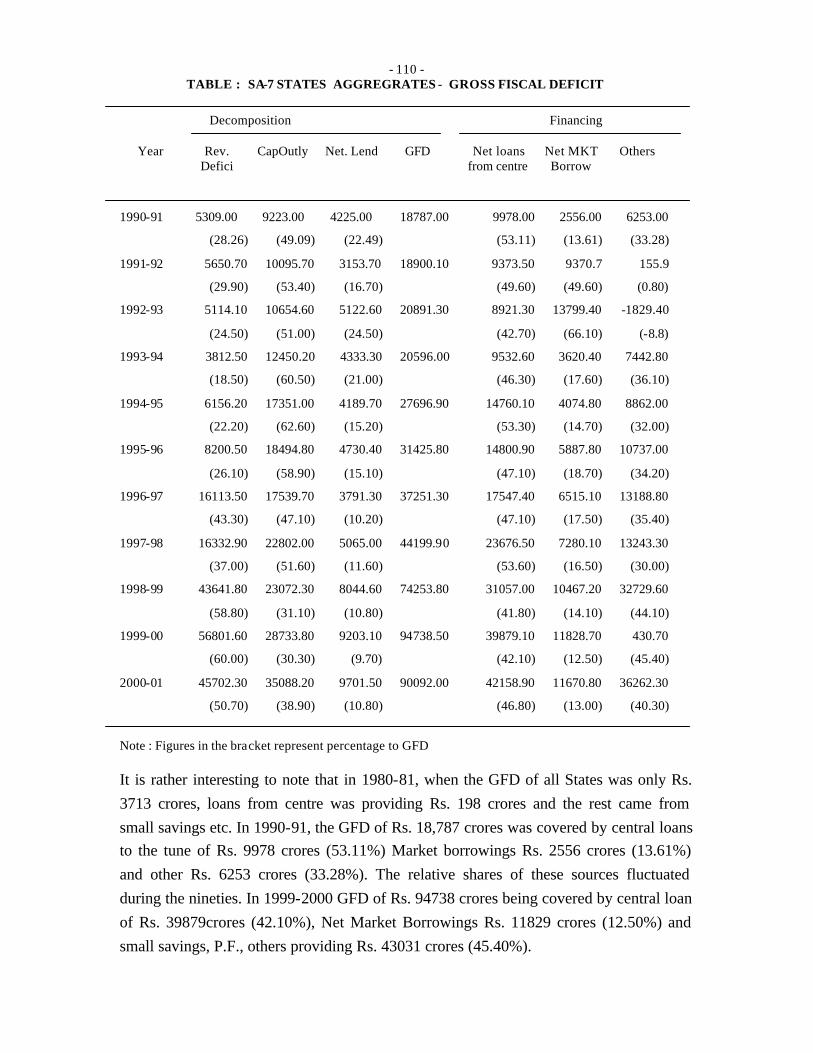
- 110 -
TABLE : SA-7 STATES AGGREGRATES - GROSS FISCAL DEFICIT
Decomposition Financing
Year Rev. Defici
CapOutly Net. Lend GFD Net loans from centre
Net MKT Borrow
Others
1990-91 5309.00 9223.00 4225.00 18787.00 9978.00 2556.00 6253.00
(28.26) (49.09) (22.49) (53.11) (13.61) (33.28)
1991-92 5650.70 10095.70 3153.70 18900.10 9373.50 9370.7 155.9
(29.90) (53.40) (16.70) (49.60) (49.60) (0.80)
1992-93 5114.10 10654.60 5122.60 20891.30 8921.30 13799.40 -1829.40
(24.50) (51.00) (24.50) (42.70) (66.10) (-8.8)
1993-94 3812.50 12450.20 4333.30 20596.00 9532.60 3620.40 7442.80
(18.50) (60.50) (21.00) (46.30) (17.60) (36.10)
1994-95 6156.20 17351.00 4189.70 27696.90 14760.10 4074.80 8862.00
(22.20) (62.60) (15.20) (53.30) (14.70) (32.00)
1995-96 8200.50 18494.80 4730.40 31425.80 14800.90 5887.80 10737.00
(26.10) (58.90) (15.10) (47.10) (18.70) (34.20)
1996-97 16113.50 17539.70 3791.30 37251.30 17547.40 6515.10 13188.80
(43.30) (47.10) (10.20) (47.10) (17.50) (35.40)
1997-98 16332.90 22802.00 5065.00 44199.90 23676.50 7280.10 13243.30
(37.00) (51.60) (11.60) (53.60) (16.50) (30.00)
1998-99 43641.80 23072.30 8044.60 74253.80 31057.00 10467.20 32729.60
(58.80) (31.10) (10.80) (41.80) (14.10) (44.10)
1999-00 56801.60 28733.80 9203.10 94738.50 39879.10 11828.70 430.70
(60.00) (30.30) (9.70) (42.10) (12.50) (45.40)
2000-01 45702.30 35088.20 9701.50 90092.00 42158.90 11670.80 36262.30
(50.70) (38.90) (10.80) (46.80) (13.00) (40.30)
Note : Figures in the bracket represent percentage to GFD
It is rather interesting to note that in 1980-81, when the GFD of all States was only Rs.
3713 crores, loans from centre was providing Rs. 198 crores and the rest came from
small savings etc. In 1990-91, the GFD of Rs. 18,787 crores was covered by central loans
to the tune of Rs. 9978 crores (53.11%) Market borrowings Rs. 2556 crores (13.61%)
and other Rs. 6253 crores (33.28%). The relative shares of these sources fluctuated
during the nineties. In 1999-2000 GFD of Rs. 94738 crores being covered by central loan
of Rs. 39879crores (42.10%), Net Market Borrowings Rs. 11829 crores (12.50%) and
small savings, P.F., others providing Rs. 43031 crores (45.40%).
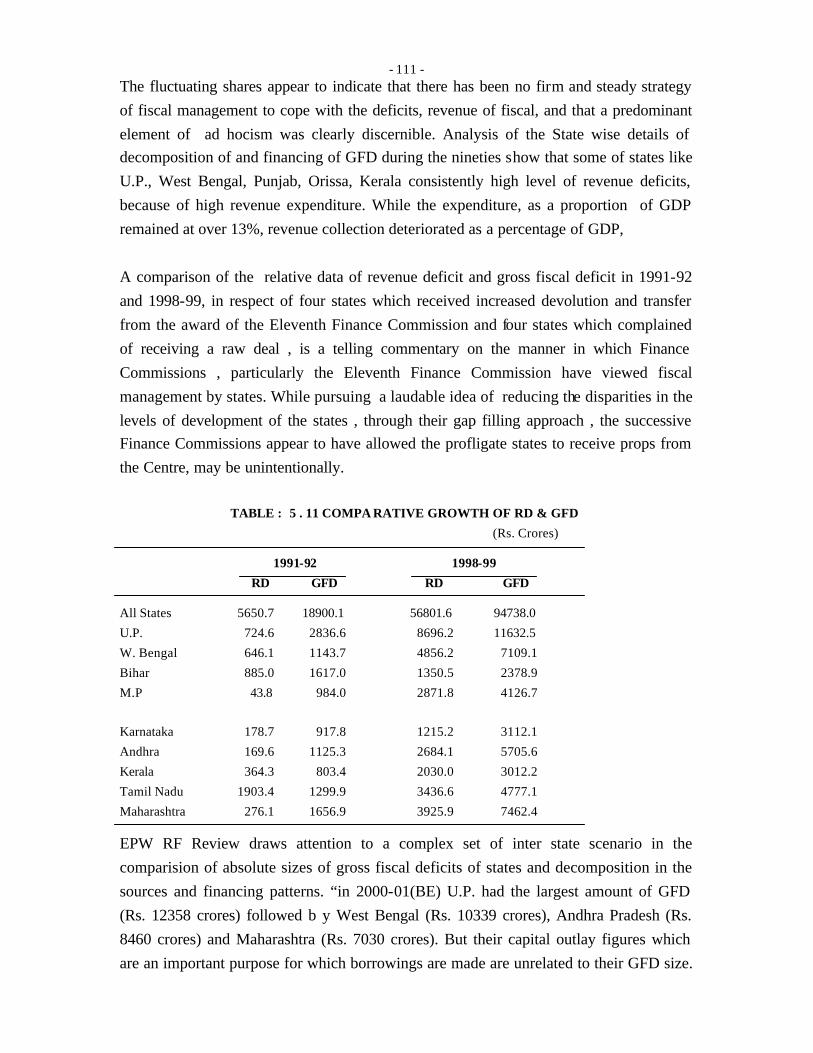
- 111 -
The fluctuating shares appear to indicate that there has been no firm and steady strategy
of fiscal management to cope with the deficits, revenue of fiscal, and that a predominant
element of ad hocism was clearly discernible. Analysis of the State wise details of
decomposition of and financing of GFD during the nineties show that some of states like
U.P., West Bengal, Punjab, Orissa, Kerala consistently high level of revenue deficits,
because of high revenue expenditure. While the expenditure, as a proportion of GDP
remained at over 13%, revenue collection deteriorated as a percentage of GDP,
A comparison of the relative data of revenue deficit and gross fiscal deficit in 1991-92
and 1998-99, in respect of four states which received increased devolution and transfer
from the award of the Eleventh Finance Commission and four states which complained
of receiving a raw deal , is a telling commentary on the manner in which Finance
Commissions , particularly the Eleventh Finance Commission have viewed fiscal
management by states. While pursuing a laudable idea of reducing the disparities in the
levels of development of the states , through their gap filling approach , the successive
Finance Commissions appear to have allowed the profligate states to receive props from
the Centre, may be unintentionally.
TABLE : 5 . 11 COMPA RATIVE GROWTH OF RD & GFD
(Rs. Crores)
1991-92 1998-99
RD GFD RD GFD
All States 5650.7 18900.1 56801.6 94738.0
U.P. 724.6 2836.6 8696.2 11632.5
W. Bengal 646.1 1143.7 4856.2 7109.1
Bihar 885.0 1617.0 1350.5 2378.9
M.P 43.8 984.0 2871.8 4126.7
Karnataka 178.7 917.8 1215.2 3112.1
Andhra 169.6 1125.3 2684.1 5705.6
Kerala 364.3 803.4 2030.0 3012.2
Tamil Nadu 1903.4 1299.9 3436.6 4777.1
Maharashtra 276.1 1656.9 3925.9 7462.4
EPW RF Review draws attention to a complex set of inter state scenario in the
comparision of absolute sizes of gross fiscal deficits of states and decomposition in the
sources and financing patterns. “in 2000-01(BE) U.P. had the largest amount of GFD
(Rs. 12358 crores) followed b y West Bengal (Rs. 10339 crores), Andhra Pradesh (Rs.
8460 crores) and Maharashtra (Rs. 7030 crores). But their capital outlay figures which
are an important purpose for which borrowings are made are unrelated to their GFD size.
- 112 -
Where capital outlay figures are low, the borrowings are used to finance revenue deficit
which is comparatively high. West Bengal is a case in point, having a relatively lower
level of capital outlay (Rs. 1402 crores ) but a higher level of revenue deficit (Rs. 7525
crores) then U.P. (Capital Outlay Rs. 5885 crores) and revenue deficit Rs. 4130 crores.
Capital outlays of Andhra Pradesh (Rs. 3419 crores) and Maharashtra (Rs. 3071 crores)
are closer to the revenue deficits. Andhra Pradesh (Rs. 3841 crores) and Maharashtra
(Rs. 3601 crores). EPW RF Study observed that “circumstances faced by individual
states as much as differences in the governance explain the differing fiscal outcomes”
(EPW May 19th 2001, Page 1751). This aspect in the studied in greater detail in the next
section.
- 113 -
VI
SOCIO –ECONOMIC PROFILE OF SELECT STATES
Mere analysis of Budgetary Trends is not adequate to secure a clear picture of the
developmental performances of the individual states which are characterised by
differences in geographical size, resource endowment demographic features , levels of
social and economic development apart from budgetary potential and capabilities. The
Ninth Five Year Plan 1997-2002 , while presenting sectoral over view in the context of
human and social development , observed that “the benefits of national economic
progress , reach different segments of the population through different channels at
different rates and that the needs of the people above poverty line and an improvement in
their standards of living can be achieved through optimum utilisation of existing market
mechanism but market mechanism may not improve access to available facilities or fully
meet the essential needs of the population with poor purchasing power .” ( Draft Ninth
Five Year Plan (1997-2002). Volume – 2 pg 82 ).
The Ninth Plan Draft Document drew attention to the marked differences between the
states in terms of size of population , population growth rates , in levels of socio
economic development , and pointed out that in a majority of the states , with high
population growth rates , the performance in the social and economic sector has been
poor and that “poor performance could be the outcome of a variety of factors including
paucity of natural financial or human resources. Poverty , illiteracy and poor development
coexist and reinforce each other . In order to promote equity and reduce disparity
between states , special assistance has been provided to the poorly performing states .The
benefit accrued from such assistance has to a large extent dependent upon (a) the states
ability to utilise the funds available and improve services and facilities and (b)
community awareness and ability to utilise the available services. “ (pg 84) . The manner
in which the devolution and transfer of funds from Centre to the states , have taken into
account , some of these indicators for determining the size and pattern of distribution of
Central Assistance , have been analysed earlier.
In view of this data on demographic , economic and social features , of the states chosen
for the study may be relevant .For facility of convenient reference , the Area , the
Number of districts , Demographic features , Economic and Social indicators of the five
states are presented in Table – 6.1 0 ,6.11 ,6.12 Profile of Select States.
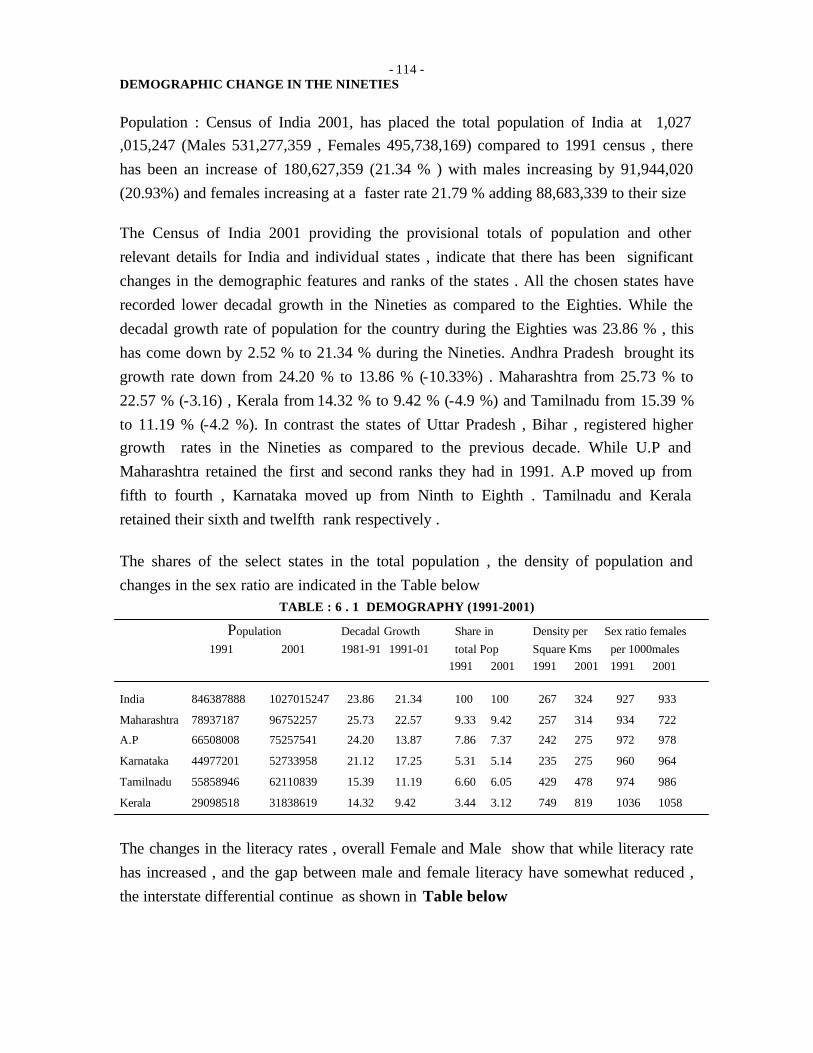
- 114 -
DEMOGRAPHIC CHANGE IN THE NINETIES
Population : Census of India 2001, has placed the total population of India at 1,027
,015,247 (Males 531,277,359 , Females 495,738,169) compared to 1991 census , there
has been an increase of 180,627,359 (21.34 % ) with males increasing by 91,944,020
(20.93%) and females increasing at a faster rate 21.79 % adding 88,683,339 to their size
The Census of India 2001 providing the provisional totals of population and other
relevant details for India and individual states , indicate that there has been significant
changes in the demographic features and ranks of the states . All the chosen states have
recorded lower decadal growth in the Nineties as compared to the Eighties. While the
decadal growth rate of population for the country during the Eighties was 23.86 % , this
has come down by 2.52 % to 21.34 % during the Nineties. Andhra Pradesh brought its
growth rate down from 24.20 % to 13.86 % (-10.33%) . Maharashtra from 25.73 % to
22.57 % (-3.16) , Kerala from 14.32 % to 9.42 % (-4.9 %) and Tamilnadu from 15.39 %
to 11.19 % (-4.2 %). In contrast the states of Uttar Pradesh , Bihar , registered higher
growth rates in the Nineties as compared to the previous decade. While U.P and
Maharashtra retained the first and second ranks they had in 1991. A.P moved up from
fifth to fourth , Karnataka moved up from Ninth to Eighth . Tamilnadu and Kerala
retained their sixth and twelfth rank respectively .
The shares of the select states in the total population , the density of population and
changes in the sex ratio are indicated in the Table below TABLE : 6 . 1 DEMOGRAPHY (1991-2001)
Population Decadal Growth Share in Density per Sex ratio females
1991 2001 1981-91 1991-01 total Pop Square Kms per 1000males
1991 2001 1991 2001 1991 2001
India 846387888 1027015247 23.86 21.34 100 100 267 324 927 933
Maharashtra 78937187 96752257 25.73 22.57 9.33 9.42 257 314 934 722
A.P 66508008 75257541 24.20 13.87 7.86 7.37 242 275 972 978
Karnataka 44977201 52733958 21.12 17.25 5.31 5.14 235 275 960 964
Tamilnadu 55858946 62110839 15.39 11.19 6.60 6.05 429 478 974 986
Kerala 29098518 31838619 14.32 9.42 3.44 3.12 749 819 1036 1058
The changes in the literacy rates , overall Female and Male show that while literacy rate
has increased , and the gap between male and female literacy have somewhat reduced ,
the interstate differential continue as shown in Table below
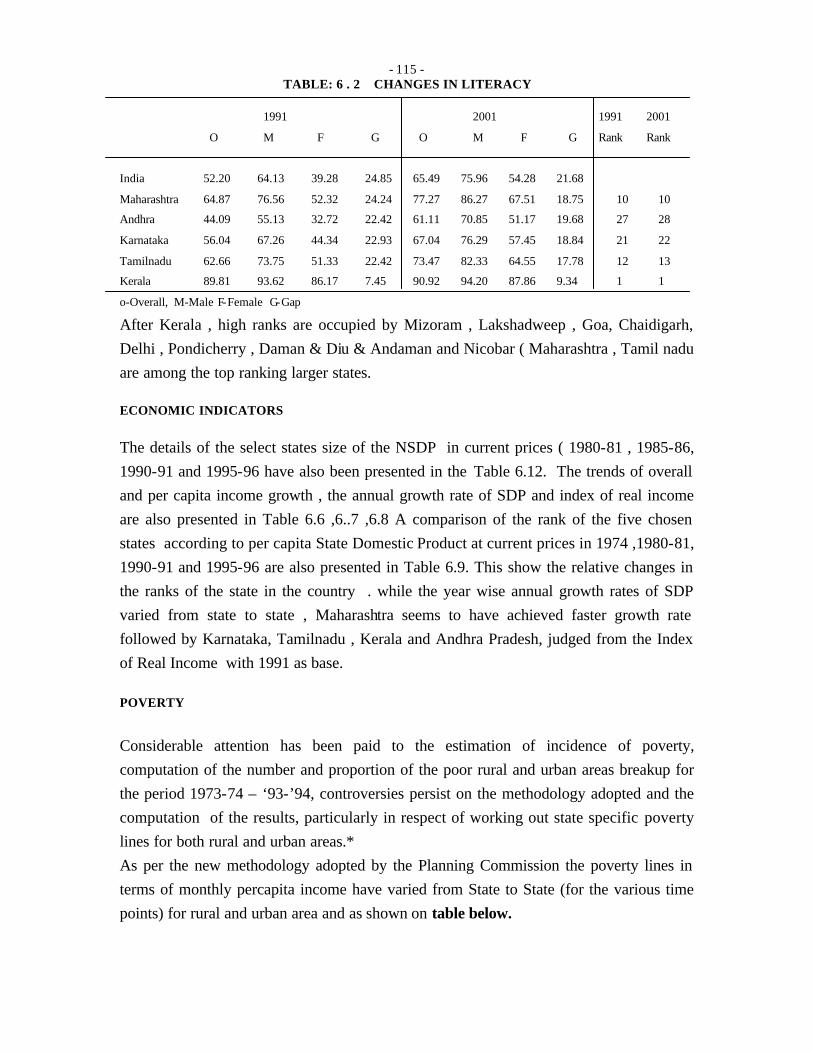
- 115 -
TABLE: 6 . 2 CHANGES IN LITERACY
1991 2001 1991 2001
O M F G O M F G Rank Rank
India 52.20 64.13 39.28 24.85 65.49 75.96 54.28 21.68
Maharashtra 64.87 76.56 52.32 24.24 77.27 86.27 67.51 18.75 10 10
Andhra 44.09 55.13 32.72 22.42 61.11 70.85 51.17 19.68 27 28
Karnataka 56.04 67.26 44.34 22.93 67.04 76.29 57.45 18.84 21 22
Tamilnadu 62.66 73.75 51.33 22.42 73.47 82.33 64.55 17.78 12 13
Kerala 89.81 93.62 86.17 7.45 90.92 94.20 87.86 9.34 1 1
o-Overall, M-Male F-Female G-Gap
After Kerala , high ranks are occupied by Mizoram , Lakshadweep , Goa, Chaidigarh,
Delhi , Pondicherry , Daman & Diu & Andaman and Nicobar ( Maharashtra , Tamil nadu
are among the top ranking larger states.
ECONOMIC INDICATORS
The details of the select states size of the NSDP in current prices ( 1980-81 , 1985-86,
1990-91 and 1995-96 have also been presented in the Table 6.12. The trends of overall
and per capita income growth , the annual growth rate of SDP and index of real income
are also presented in Table 6.6 ,6..7 ,6.8 A comparison of the rank of the five chosen
states according to per capita State Domestic Product at current prices in 1974 ,1980-81,
1990-91 and 1995-96 are also presented in Table 6.9. This show the relative changes in
the ranks of the state in the country . while the year wise annual growth rates of SDP
varied from state to state , Maharashtra seems to have achieved faster growth rate
followed by Karnataka, Tamilnadu , Kerala and Andhra Pradesh, judged from the Index
of Real Income with 1991 as base.
POVERTY
Considerable attention has been paid to the estimation of incidence of poverty,
computation of the number and proportion of the poor rural and urban areas breakup for
the period 1973-74 – ‘93-’94, controversies persist on the methodology adopted and the
computation of the results, particularly in respect of working out state specific poverty
lines for both rural and urban areas.*
As per the new methodology adopted by the Planning Commission the poverty lines in
terms of monthly percapita income have varied from State to State (for the various time
points) for rural and urban area and as shown on table below.
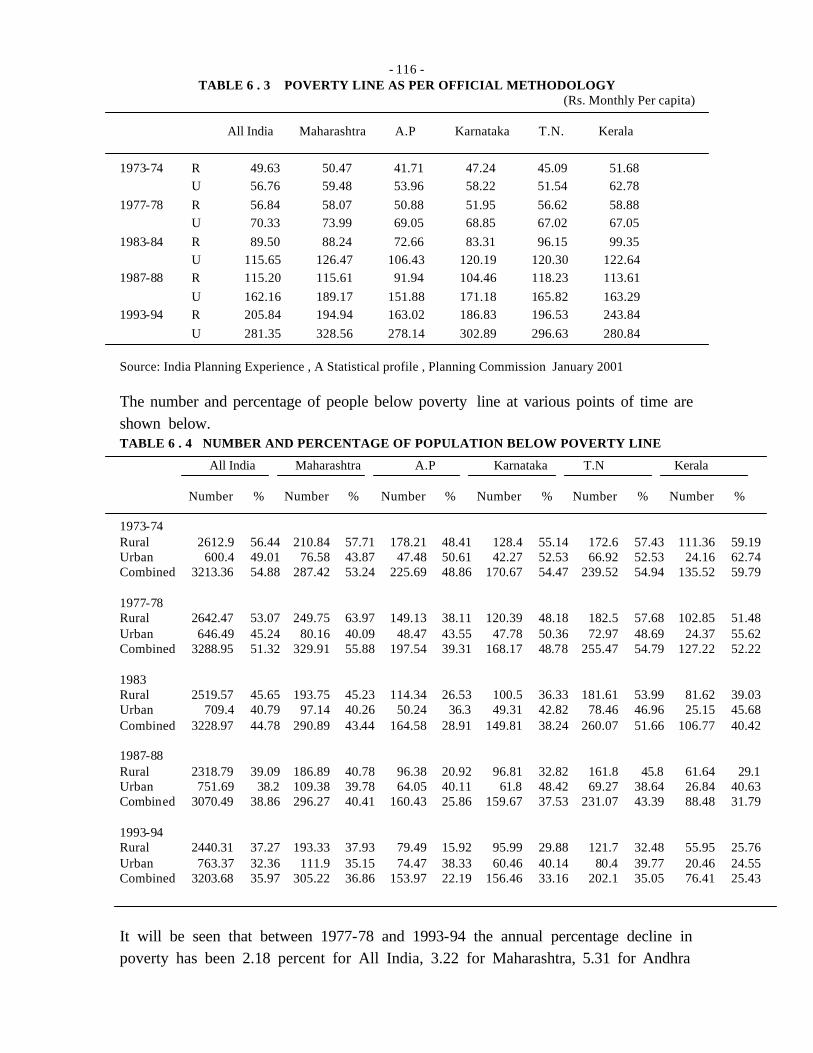
- 116 -
TABLE 6 . 3 POVERTY LINE AS PER OFFICIAL METHODOLOGY (Rs. Monthly Per capita)
All India Maharashtra A.P Karnataka T.N. Kerala 1973-74 R 49.63 50.47 41.71 47.24 45.09 51.68
U 56.76 59.48 53.96 58.22 51.54 62.78
1977-78 R 56.84 58.07 50.88 51.95 56.62 58.88
U 70.33 73.99 69.05 68.85 67.02 67.05
1983-84 R 89.50 88.24 72.66 83.31 96.15 99.35
U 115.65 126.47 106.43 120.19 120.30 122.64
1987-88 R 115.20 115.61 91.94 104.46 118.23 113.61
U 162.16 189.17 151.88 171.18 165.82 163.29
1993-94 R 205.84 194.94 163.02 186.83 196.53 243.84
U 281.35 328.56 278.14 302.89 296.63 280.84
Source: India Planning Experience , A Statistical profile , Planning Commission January 2001
The number and percentage of people below poverty line at various points of time are
shown below. TABLE 6 . 4 NUMBER AND PERCENTAGE OF POPULATION BELOW POVERTY LINE
All India Maharashtra A.P Karnataka T.N Kerala
Number % Number % Number % Number % Number % Number %
1973-74 Rural 2612.9 56.44 210.84 57.71 178.21 48.41 128.4 55.14 172.6 57.43 111.36 59.19 Urban 600.4 49.01 76.58 43.87 47.48 50.61 42.27 52.53 66.92 52.53 24.16 62.74 Combined 3213.36 54.88 287.42 53.24 225.69 48.86 170.67 54.47 239.52 54.94 135.52 59.79
1977-78 Rural 2642.47 53.07 249.75 63.97 149.13 38.11 120.39 48.18 182.5 57.68 102.85 51.48 Urban 646.49 45.24 80.16 40.09 48.47 43.55 47.78 50.36 72.97 48.69 24.37 55.62 Combined 3288.95 51.32 329.91 55.88 197.54 39.31 168.17 48.78 255.47 54.79 127.22 52.22
1983 Rural 2519.57 45.65 193.75 45.23 114.34 26.53 100.5 36.33 181.61 53.99 81.62 39.03 Urban 709.4 40.79 97.14 40.26 50.24 36.3 49.31 42.82 78.46 46.96 25.15 45.68 Combined 3228.97 44.78 290.89 43.44 164.58 28.91 149.81 38.24 260.07 51.66 106.77 40.42
1987-88 Rural 2318.79 39.09 186.89 40.78 96.38 20.92 96.81 32.82 161.8 45.8 61.64 29.1 Urban 751.69 38.2 109.38 39.78 64.05 40.11 61.8 48.42 69.27 38.64 26.84 40.63 Combined 3070.49 38.86 296.27 40.41 160.43 25.86 159.67 37.53 231.07 43.39 88.48 31.79
1993-94 Rural 2440.31 37.27 193.33 37.93 79.49 15.92 95.99 29.88 121.7 32.48 55.95 25.76 Urban 763.37 32.36 111.9 35.15 74.47 38.33 60.46 40.14 80.4 39.77 20.46 24.55 Combined 3203.68 35.97 305.22 36.86 153.97 22.19 156.46 33.16 202.1 35.05 76.41 25.43
It will be seen that between 1977-78 and 1993-94 the annual percentage decline in
poverty has been 2.18 percent for All India, 3.22 for Maharashtra, 5.31 for Andhra
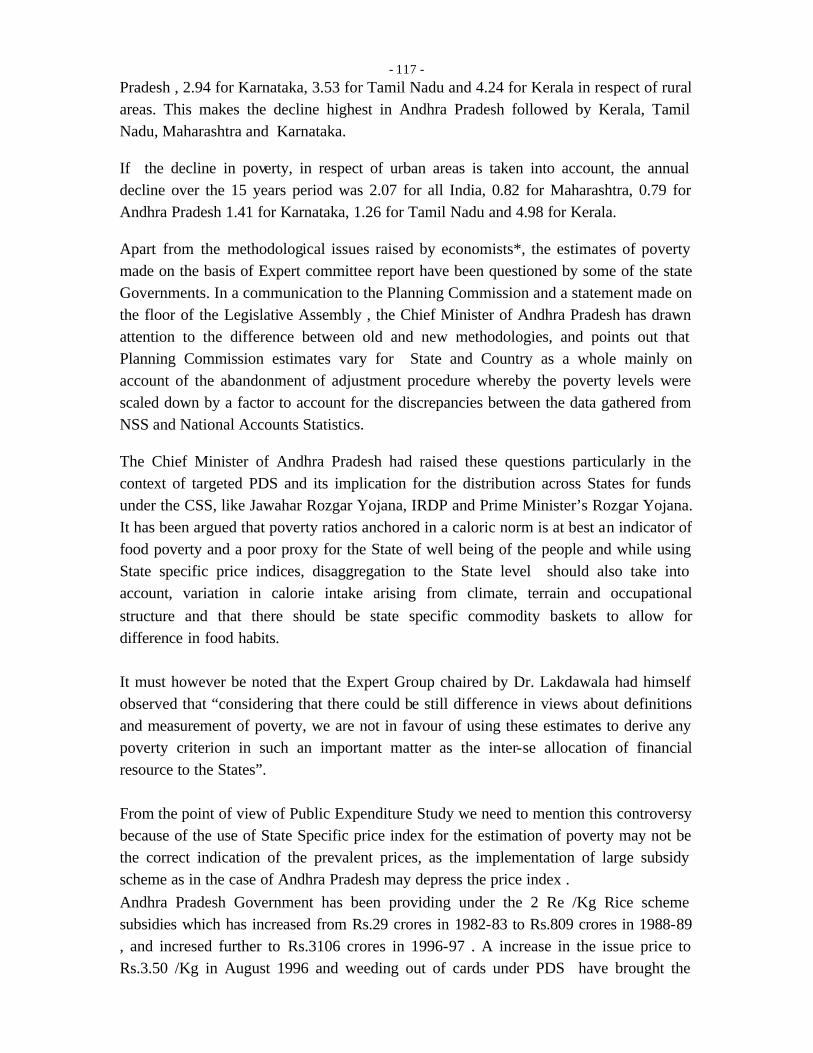
- 117 -
Pradesh , 2.94 for Karnataka, 3.53 for Tamil Nadu and 4.24 for Kerala in respect of rural
areas. This makes the decline highest in Andhra Pradesh followed by Kerala, Tamil
Nadu, Maharashtra and Karnataka.
If the decline in poverty, in respect of urban areas is taken into account, the annual
decline over the 15 years period was 2.07 for all India, 0.82 for Maharashtra, 0.79 for
Andhra Pradesh 1.41 for Karnataka, 1.26 for Tamil Nadu and 4.98 for Kerala.
Apart from the methodological issues raised by economists*, the estimates of poverty
made on the basis of Expert committee report have been questioned by some of the state
Governments. In a communication to the Planning Commission and a statement made on
the floor of the Legislative Assembly , the Chief Minister of Andhra Pradesh has drawn
attention to the difference between old and new methodologies, and points out that
Planning Commission estimates vary for State and Country as a whole mainly on
account of the abandonment of adjustment procedure whereby the poverty levels were
scaled down by a factor to account for the discrepancies between the data gathered from
NSS and National Accounts Statistics.
The Chief Minister of Andhra Pradesh had raised these questions particularly in the
context of targeted PDS and its implication for the distribution across States for funds
under the CSS, like Jawahar Rozgar Yojana, IRDP and Prime Minister’s Rozgar Yojana.
It has been argued that poverty ratios anchored in a caloric norm is at best an indicator of
food poverty and a poor proxy for the State of well being of the people and while using
State specific price indices, disaggregation to the State level should also take into
account, variation in calorie intake arising from climate, terrain and occupational
structure and that there should be state specific commodity baskets to allow for
difference in food habits.
It must however be noted that the Expert Group chaired by Dr. Lakdawala had himself
observed that “considering that there could be still difference in views about definitions
and measurement of poverty, we are not in favour of using these estimates to derive any
poverty criterion in such an important matter as the inter-se allocation of financial
resource to the States”.
From the point of view of Public Expenditure Study we need to mention this controversy
because of the use of State Specific price index for the estimation of poverty may not be
the correct indication of the prevalent prices, as the implementation of large subsidy
scheme as in the case of Andhra Pradesh may depress the price index .
Andhra Pradesh Government has been providing under the 2 Re /Kg Rice scheme
subsidies which has increased from Rs.29 crores in 1982-83 to Rs.809 crores in 1988-89
, and incresed further to Rs.3106 crores in 1996-97 . A increase in the issue price to
Rs.3.50 /Kg in August 1996 and weeding out of cards under PDS have brought the
- 118 -
outgo on rice subsidies to Rs. 2608 crores in 1997-98 and Rs.2512 crores in 1998-99.
The Rice Subsidy schemes, has made a significant impact on the availability of food
grains to the poorer section of societies. Since subsidy scheme resulted in reduction of
availability of states own funds for other schemes, the adoption of the revised poverty
ratios for allocation of Central funds to the various states without taking into account the
improvement in the status of poor on account of better implementation of Poverty
Alleviation Scheme and better targeted Public Distribution Schemes A.P state would be
adversely affected .Further the increase in the issue price by the Central Government
from Rs. 7.50 per Kg to Rs. 9.05 per kg in February 1999 , made the state’s burden more
onerous . However , this was softened to some extent by the decision of the Central
Government to issue 10 Kgs of rice per month per family at half the central issue price ,
under the targeted public distribution scheme .
As part of fiscal consolidation strategy , the Central Government revised the issue prices
of rice in February 1999 and in March 2000 , with certain differentials built in for people
below and above poverty line. This has impact on the both central and state Government
finances, apart from estimates of poverty line. According to one estimate the subsidised
rice scheme has met a monthly income gain of Rs.5 to 14 Rs. When the price was
Rs.3.50 and between Rs. 8 to 20 when the price was Rs.2 per Kg (see S.Indrakant and
M.C.Swaminathan , “Social Security in Andhra Pradesh “ in Mahendra Dev et.al , Social
and Economic Security in India , Institute of Human Development , 2001). Similarly
schemes like Employment Guarantee Scheme in Maharashtra, and Mid Day Meal and
Nutrition Scheme in Tamilnadu and Kerala make a significant difference to the real
income of persons below poverty line . Subject to these observations , the growth in real
per capita income in the select states , shown in Table - 6.6 and 6.7 throw some light in
the relative levels of the states. The changes in the relative ranks of the select states as
per their per capita income from 1974-75 to 1995-96 are also shown in a separate table.
The Economic and Social Indicators of development of the select states can also be seen
in Tables 6.8 to 6.12
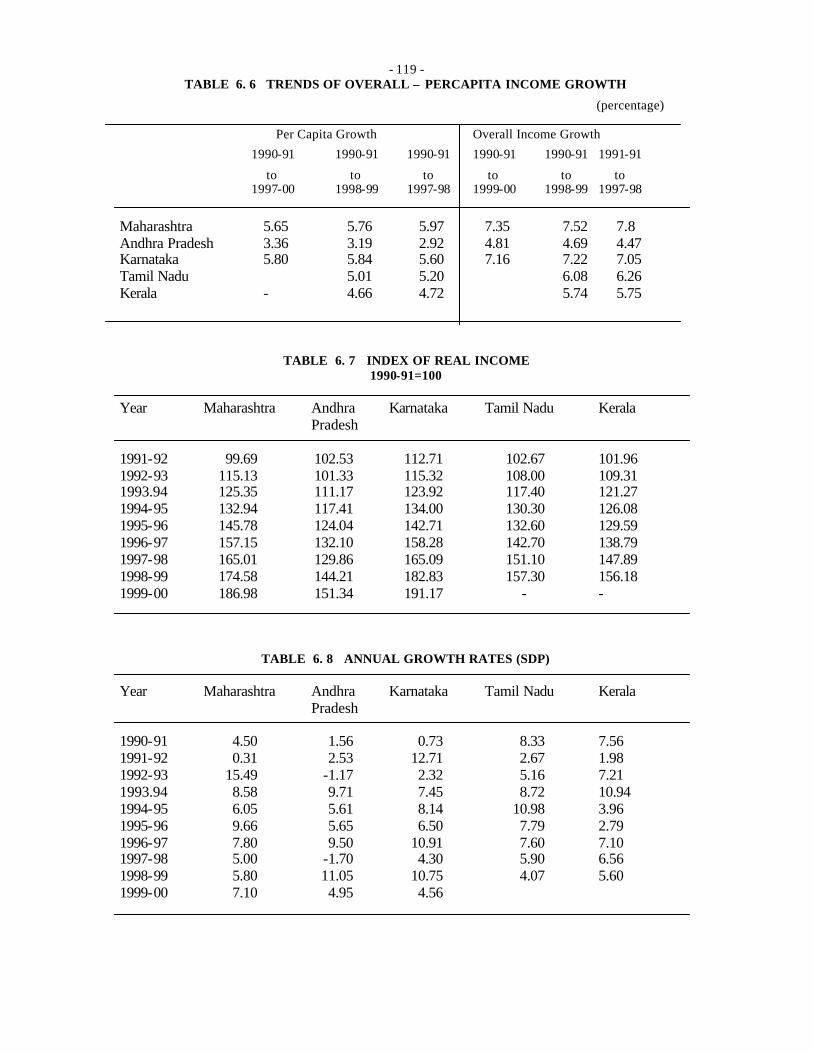
- 119 -
TABLE 6. 6 TRENDS OF OVERALL – PERCAPITA INCOME GROWTH (percentage) Per Capita Growth Overall Income Growth 1990-91 1990-91 1990-91 1990-91 1990-91 1991-91
to to to to to to 1997-00 1998-99 1997-98 1999-00 1998-99 1997-98
Maharashtra 5.65 5.76 5.97 7.35 7.52 7.8 Andhra Pradesh 3.36 3.19 2.92 4.81 4.69 4.47 Karnataka 5.80 5.84 5.60 7.16 7.22 7.05 Tamil Nadu 5.01 5.20 6.08 6.26 Kerala - 4.66 4.72 5.74 5.75
TABLE 6. 7 INDEX OF REAL INCOME 1990-91=100
Year Maharashtra Andhra Karnataka Tamil Nadu Kerala Pradesh 1991-92 99.69 102.53 112.71 102.67 101.96 1992-93 115.13 101.33 115.32 108.00 109.31 1993.94 125.35 111.17 123.92 117.40 121.27 1994-95 132.94 117.41 134.00 130.30 126.08 1995-96 145.78 124.04 142.71 132.60 129.59 1996-97 157.15 132.10 158.28 142.70 138.79 1997-98 165.01 129.86 165.09 151.10 147.89 1998-99 174.58 144.21 182.83 157.30 156.18 1999-00 186.98 151.34 191.17 - -
TABLE 6. 8 ANNUAL GROWTH RATES (SDP)
Year Maharashtra Andhra Karnataka Tamil Nadu Kerala Pradesh 1990-91 4.50 1.56 0.73 8.33 7.56 1991-92 0.31 2.53 12.71 2.67 1.98 1992-93 15.49 -1.17 2.32 5.16 7.21 1993.94 8.58 9.71 7.45 8.72 10.94 1994-95 6.05 5.61 8.14 10.98 3.96 1995-96 9.66 5.65 6.50 7.79 2.79 1996-97 7.80 9.50 10.91 7.60 7.10 1997-98 5.00 -1.70 4.30 5.90 6.56 1998-99 5.80 11.05 10.75 4.07 5.60 1999-00 7.10 4.95 4.56

- 120 -
TABLE 6. 9 PER CAPITA INCOME RANKS OF SELECT STATES
1974 Rank 1980-81 Rank 1990-91 Rank 1995 Rank Rs Rs Rs Rs. Maharashtra 1360 2 2427 2 7409 2 15457 4 Andhra Pradesh 1010 6 1380 9 4722 7 8938 14 Karnataka 1000 7 1623 5 4737 6 9384 13 Tamil Nadu 826 11 1498 8 4428 8 10222 8 Kerala 910 8 1513 7 3843 10 8824 15 Economic Survey of 1982-83 1992-93 and 1998-99.
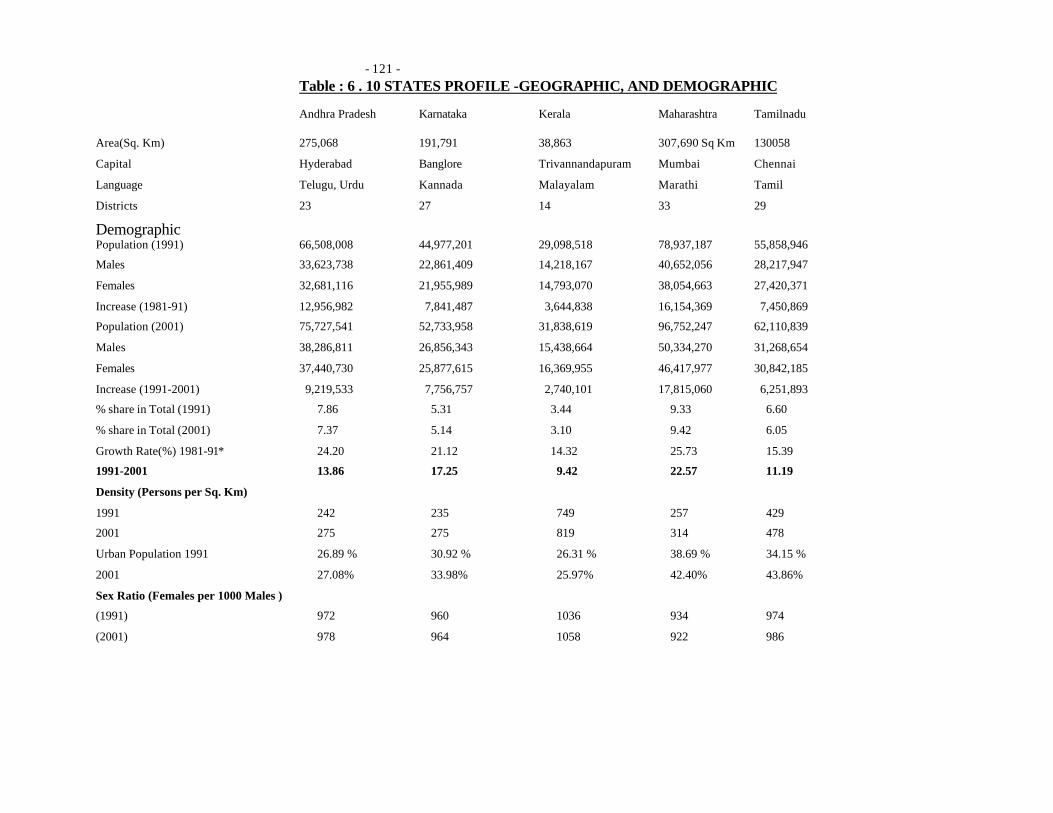
- 121 -
Table : 6 . 10 STATES PROFILE -GEOGRAPHIC, AND DEMOGRAPHIC Andhra Pradesh Karnataka Kerala Maharashtra Tamilnadu Area(Sq. Km) 275,068 191,791 38,863 307,690 Sq Km 130058
Capital Hyderabad Banglore Trivannandapuram Mumbai Chennai
Language Telugu, Urdu Kannada Malayalam Marathi Tamil
Districts 23 27 14 33 29
Demographic Population (1991) 66,508,008 44,977,201 29,098,518 78,937,187 55,858,946
Males 33,623,738 22,861,409 14,218,167 40,652,056 28,217,947
Females 32,681,116 21,955,989 14,793,070 38,054,663 27,420,371
Increase (1981-91) 12,956,982 7,841,487 3,644,838 16,154,369 7,450,869
Population (2001) 75,727,541 52,733,958 31,838,619 96,752,247 62,110,839
Males 38,286,811 26,856,343 15,438,664 50,334,270 31,268,654
Females 37,440,730 25,877,615 16,369,955 46,417,977 30,842,185
Increase (1991-2001) 9,219,533 7,756,757 2,740,101 17,815,060 6,251,893
% share in Total (1991) 7.86 5.31 3.44 9.33 6.60
% share in Total (2001) 7.37 5.14 3.10 9.42 6.05
Growth Rate(%) 1981-91* 24.20 21.12 14.32 25.73 15.39
1991-2001 13.86 17.25 9.42 22.57 11.19
Density (Persons per Sq. Km)
1991 242 235 749 257 429
2001 275 275 819 314 478
Urban Population 1991 26.89 % 30.92 % 26.31 % 38.69 % 34.15 %
2001 27.08% 33.98% 25.97% 42.40% 43.86%
Sex Ratio (Females per 1000 Males )
(1991) 972 960 1036 934 974
(2001) 978 964 1058 922 986
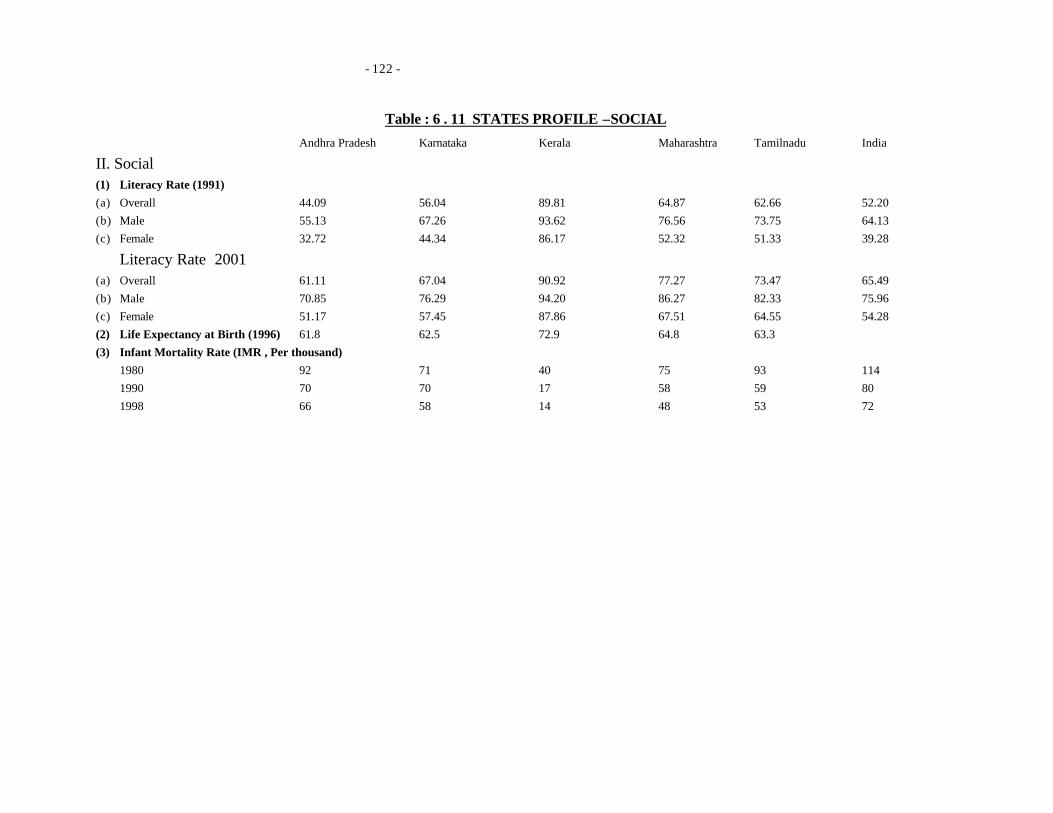
- 122 -
Table : 6 . 11 STATES PROFILE –SOCIAL
Andhra Pradesh Karnataka Kerala Maharashtra Tamilnadu India
II. Social (1) Literacy Rate (1991)
(a) Overall 44.09 56.04 89.81 64.87 62.66 52.20
(b) Male 55.13 67.26 93.62 76.56 73.75 64.13
(c) Female 32.72 44.34 86.17 52.32 51.33 39.28
Literacy Rate 2001 (a) Overall 61.11 67.04 90.92 77.27 73.47 65.49
(b) Male 70.85 76.29 94.20 86.27 82.33 75.96
(c) Female 51.17 57.45 87.86 67.51 64.55 54.28
(2) Life Expectancy at Birth (1996) 61.8 62.5 72.9 64.8 63.3
(3) Infant Mortality Rate (IMR , Per thousand)
1980 92 71 40 75 93 114
1990 70 70 17 58 59 80
1998 66 58 14 48 53 72
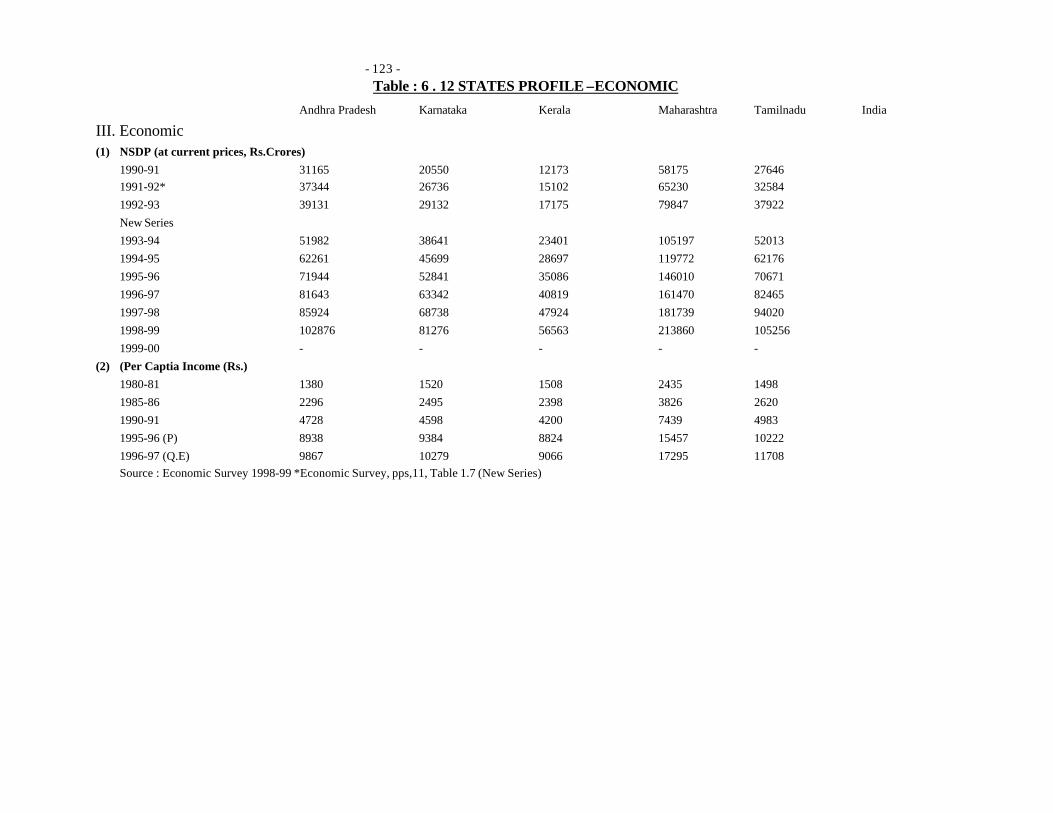
- 123 -
Table : 6 . 12 STATES PROFILE –ECONOMIC
Andhra Pradesh Karnataka Kerala Maharashtra Tamilnadu India
III. Economic (1) NSDP (at current prices, Rs.Crores)
1990-91 31165 20550 12173 58175 27646
1991-92* 37344 26736 15102 65230 32584
1992-93 39131 29132 17175 79847 37922
New Series
1993-94 51982 38641 23401 105197 52013
1994-95 62261 45699 28697 119772 62176
1995-96 71944 52841 35086 146010 70671
1996-97 81643 63342 40819 161470 82465
1997-98 85924 68738 47924 181739 94020
1998-99 102876 81276 56563 213860 105256
1999-00 - - - - -
(2) (Per Captia Income (Rs.)
1980-81 1380 1520 1508 2435 1498
1985-86 2296 2495 2398 3826 2620
1990-91 4728 4598 4200 7439 4983
1995-96 (P) 8938 9384 8824 15457 10222
1996-97 (Q.E) 9867 10279 9066 17295 11708
Source : Economic Survey 1998-99 *Economic Survey, pps,11, Table 1.7 (New Series)
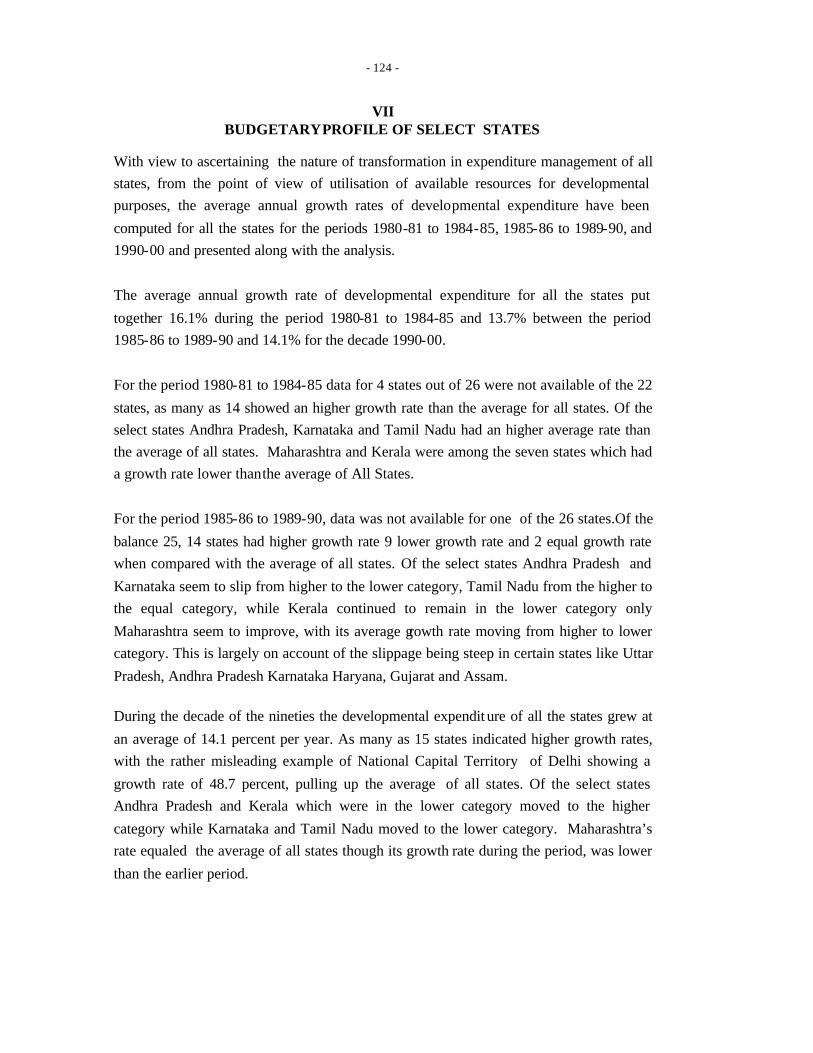
- 124 -
VII BUDGETARY PROFILE OF SELECT STATES
With view to ascertaining the nature of transformation in expenditure management of all
states, from the point of view of utilisation of available resources for developmental
purposes, the average annual growth rates of developmental expenditure have been
computed for all the states for the periods 1980-81 to 1984-85, 1985-86 to 1989-90, and
1990-00 and presented along with the analysis.
The average annual growth rate of developmental expenditure for all the states put
together 16.1% during the period 1980-81 to 1984-85 and 13.7% between the period
1985-86 to 1989-90 and 14.1% for the decade 1990-00.
For the period 1980-81 to 1984-85 data for 4 states out of 26 were not available of the 22
states, as many as 14 showed an higher growth rate than the average for all states. Of the
select states Andhra Pradesh, Karnataka and Tamil Nadu had an higher average rate than
the average of all states. Maharashtra and Kerala were among the seven states which had
a growth rate lower than the average of All States.
For the period 1985-86 to 1989-90, data was not available for one of the 26 states.Of the
balance 25, 14 states had higher growth rate 9 lower growth rate and 2 equal growth rate
when compared with the average of all states. Of the select states Andhra Pradesh and
Karnataka seem to slip from higher to the lower category, Tamil Nadu from the higher to
the equal category, while Kerala continued to remain in the lower category only
Maharashtra seem to improve, with its average growth rate moving from higher to lower
category. This is largely on account of the slippage being steep in certain states like Uttar
Pradesh, Andhra Pradesh Karnataka Haryana, Gujarat and Assam.
During the decade of the nineties the developmental expendit ure of all the states grew at
an average of 14.1 percent per year. As many as 15 states indicated higher growth rates,
with the rather misleading example of National Capital Territory of Delhi showing a
growth rate of 48.7 percent, pulling up the average of all states. Of the select states
Andhra Pradesh and Kerala which were in the lower category moved to the higher
category while Karnataka and Tamil Nadu moved to the lower category. Maharashtra’s
rate equaled the average of all states though its growth rate during the period, was lower
than the earlier period.
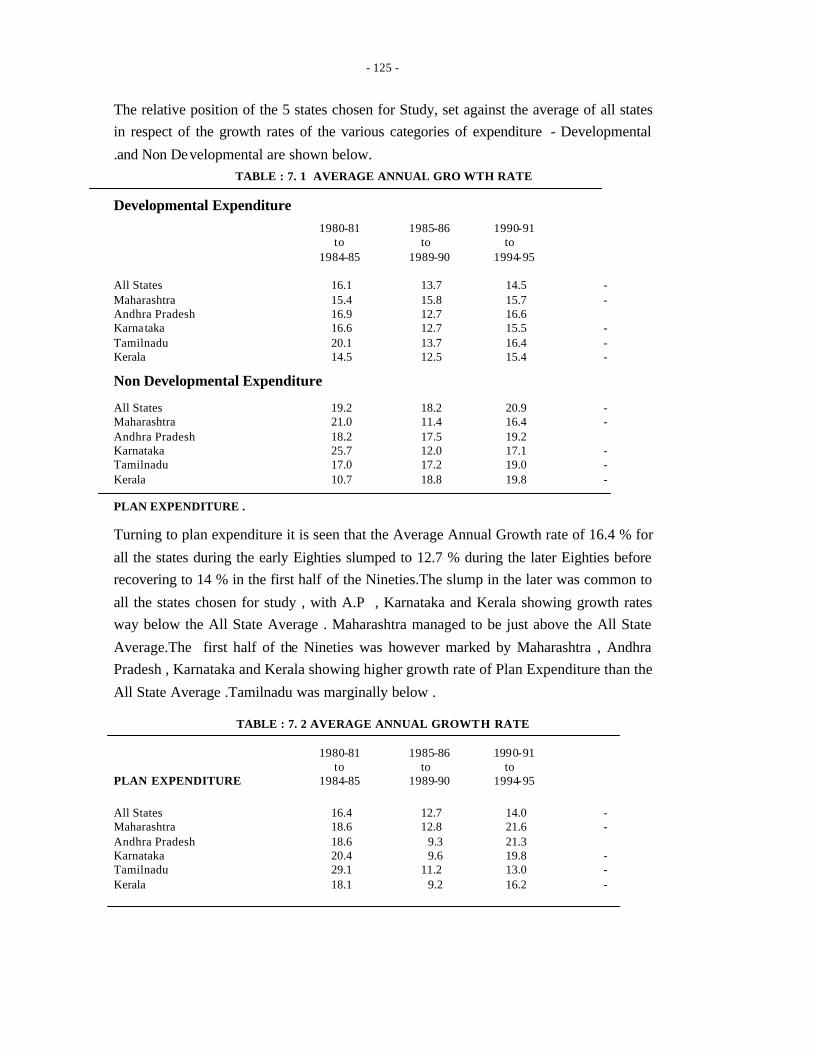
- 125 -
The relative position of the 5 states chosen for Study, set against the average of all states
in respect of the growth rates of the various categories of expenditure - Developmental
.and Non Developmental are shown below.
TABLE : 7. 1 AVERAGE ANNUAL GRO WTH RATE
Developmental Expenditure
1980-81 1985-86 1990-91 to to to 1984-85 1989-90 1994-95 All States 16.1 13.7 14.5 - Maharashtra 15.4 15.8 15.7 - Andhra Pradesh 16.9 12.7 16.6 Karnataka 16.6 12.7 15.5 - Tamilnadu 20.1 13.7 16.4 - Kerala 14.5 12.5 15.4 -
Non Developmental Expenditure
All States 19.2 18.2 20.9 - Maharashtra 21.0 11.4 16.4 - Andhra Pradesh 18.2 17.5 19.2 Karnataka 25.7 12.0 17.1 - Tamilnadu 17.0 17.2 19.0 - Kerala 10.7 18.8 19.8 - PLAN EXPENDITURE .
Turning to plan expenditure it is seen that the Average Annual Growth rate of 16.4 % for
all the states during the early Eighties slumped to 12.7 % during the later Eighties before
recovering to 14 % in the first half of the Nineties.The slump in the later was common to
all the states chosen for study , with A.P , Karnataka and Kerala showing growth rates
way below the All State Average . Maharashtra managed to be just above the All State
Average.The first half of the Nineties was however marked by Maharashtra , Andhra
Pradesh , Karnataka and Kerala showing higher growth rate of Plan Expenditure than the
All State Average .Tamilnadu was marginally below .
TABLE : 7. 2 AVERAGE ANNUAL GROWTH RATE
1980-81 1985-86 1990-91 to to to PLAN EXPENDITURE 1984-85 1989-90 1994-95 All States 16.4 12.7 14.0 - Maharashtra 18.6 12.8 21.6 - Andhra Pradesh 18.6 9.3 21.3 Karnataka 20.4 9.6 19.8 - Tamilnadu 29.1 11.2 13.0 - Kerala 18.1 9.2 16.2 -
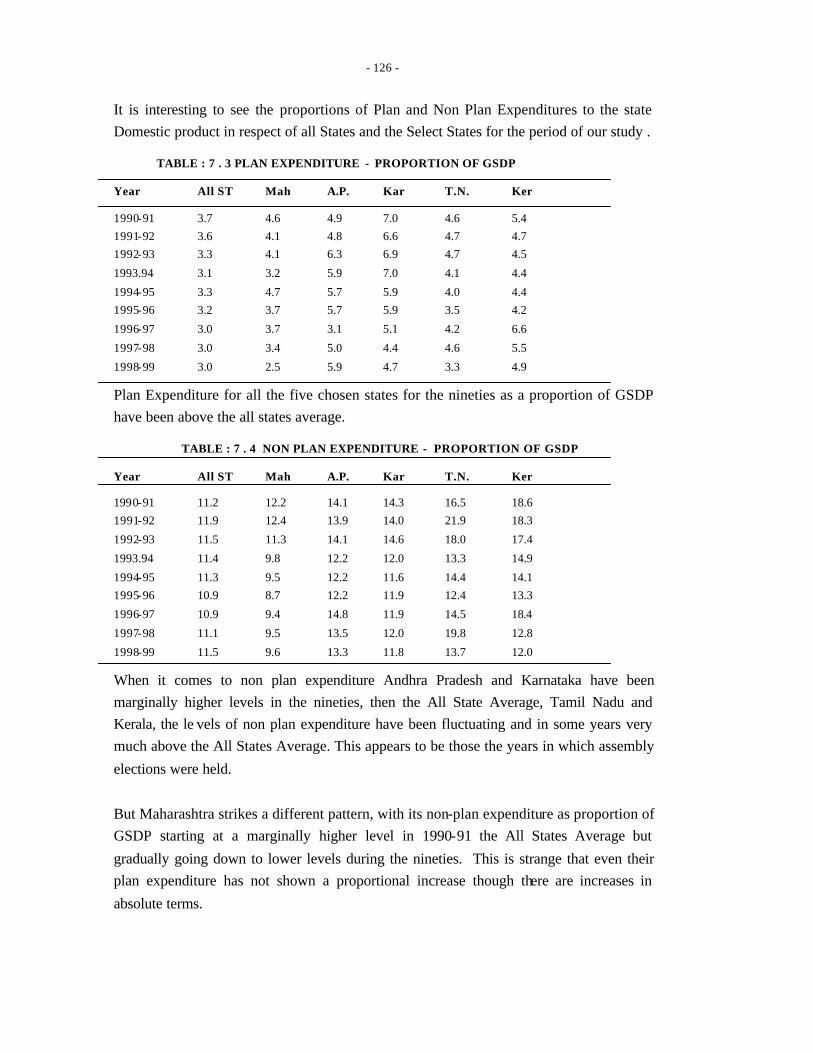
- 126 -
It is interesting to see the proportions of Plan and Non Plan Expenditures to the state
Domestic product in respect of all States and the Select States for the period of our study .
TABLE : 7 . 3 PLAN EXPENDITURE - PROPORTION OF GSDP
Year All ST Mah A.P. Kar T.N. Ker
1990-91 3.7 4.6 4.9 7.0 4.6 5.4
1991-92 3.6 4.1 4.8 6.6 4.7 4.7
1992-93 3.3 4.1 6.3 6.9 4.7 4.5
1993.94 3.1 3.2 5.9 7.0 4.1 4.4
1994-95 3.3 4.7 5.7 5.9 4.0 4.4
1995-96 3.2 3.7 5.7 5.9 3.5 4.2
1996-97 3.0 3.7 3.1 5.1 4.2 6.6
1997-98 3.0 3.4 5.0 4.4 4.6 5.5
1998-99 3.0 2.5 5.9 4.7 3.3 4.9
Plan Expenditure for all the five chosen states for the nineties as a proportion of GSDP
have been above the all states average.
TABLE : 7 . 4 NON PLAN EXPENDITURE - PROPORTION OF GSDP
Year All ST Mah A.P. Kar T.N. Ker
1990-91 11.2 12.2 14.1 14.3 16.5 18.6
1991-92 11.9 12.4 13.9 14.0 21.9 18.3
1992-93 11.5 11.3 14.1 14.6 18.0 17.4
1993.94 11.4 9.8 12.2 12.0 13.3 14.9
1994-95 11.3 9.5 12.2 11.6 14.4 14.1
1995-96 10.9 8.7 12.2 11.9 12.4 13.3
1996-97 10.9 9.4 14.8 11.9 14.5 18.4
1997-98 11.1 9.5 13.5 12.0 19.8 12.8
1998-99 11.5 9.6 13.3 11.8 13.7 12.0
When it comes to non plan expenditure Andhra Pradesh and Karnataka have been
marginally higher levels in the nineties, then the All State Average, Tamil Nadu and
Kerala, the le vels of non plan expenditure have been fluctuating and in some years very
much above the All States Average. This appears to be those the years in which assembly
elections were held.
But Maharashtra strikes a different pattern, with its non-plan expenditure as proportion of
GSDP starting at a marginally higher level in 1990-91 the All States Average but
gradually going down to lower levels during the nineties. This is strange that even their
plan expenditure has not shown a proportional increase though there are increases in
absolute terms.

- 127 -
Analysing plan expenditure as a proportion of GDP in respect of all states and GSDP in
respect of individual states, we should take note of one element relating to reliability of
data. The methodologies adopted by the Economic and Statistics departments of various
states governments are not uniform. While the plan expenditures of all states has been
between 3 to 4% GDP during the nineties, the respective plan expenditure of individual
states have varied and in respect of select states this has been even more varied.
TABLE : 7. 5 PLAN EXPENDITURE –GSDP SELECT YEARS (Rs. Crores)
Year All States Maharashtra Andhra Karnataka Tamil Kerala Pradesh nadu 1989-90 23258.6 2741.5 1520.9 1235.4 1347.1 677.8 (3.6) (5.3) (6.1) (5.0) (5.0) (5.6) 1990-91 27432.9 2932.0 1690.4 1640.3 1448.3 759.6 (3.7) (4.6) (4.9) (7.0) (4.6) (5.4) 1994-95 44513.7 6658.9 3927.1 2977.8 2462.7 1416.0 (3.3) (4.7) (5.7) (5.9) (4.0) (4.4) 1998-99 64870.6 6301.4 6747.2 4239.5 3877.2 3067.8 (3.0) (2.5) (5.9) (4.7) (3.3) (4.9) Note: 1. Figures in brackets are percentages to Gross Domestic Product at factor cost current prices. 2. Figures of GSDP from 1993-94 are new series while for earlier years old 1980-81 series have been used. SECTORAL DISTRIBUTION - SELECT STATES With a view to analysing the sectoral distribution of expenditure incurred by the state
governments, we had tabulated item wise details of expenditure for total expenditure,
developmental and non developmental expenditure, distributed in plan and non plan
categories for the year from 1991-92, to 2000-01. (See Det-Tables for All States,
Maharashtra, Andhra Pradesh , Karnataka, Tamilnadu and Kerala ) The Expenditure
items chosen for analysis like Irrigation , Education , Administrative Services ets have
been highlighted in the tables. However, for comparative purposes ,expenditures in
Social, Economic and General Services for 1991-92 and the recent three years, 1997-98
to 1999-00 have been taken up for analysis
Taking the year 1990-91 the total expenditure incurred by the states was of the order of
Rs. 91242 crores (16% of the GDP), which comprised of a plan expenditure of Rs. 27433
crores (4.8% of GDP) and a non-plan expenditure of Rs. 63809 crores (11.2% of GDP).
In terms of application, developmental expenditure accounted for Rs. 63370 crores
- 128 -
(69.45% of total expenditure), non-development expenditure accounted of Rs. 22600
crores (24.77% of total expenditure) and others like inter governmental transfers,
Rs. 5272 crores (5.78% of total expenditure).
Sectorally, Social Services absorbed Rs. 29220 crores and Economic Services Rs. 28596
crores, each working to about 5% of GDP. The loans and advances by state governments
which amounted to about Rs. 5,555 crore was deployed almost entirely on Economic
Services. The non-developmental expenditure of Rs. 22600 covers was mostly on general
services covering fiscal and administrative services.
Tracing the trend of expenditure, one finds the total expenditure, while increasing in size
has been hovering around 15% to 16 % of the GDP in the nineties. The total expenditure
in 1999-2000, is placed at Rs. 325634 crores (16.6% of GDP) comprising a Plan
expenditure of Rs. 78156 crores (4% of GDP) and a Non Plan expenditure of Rs. 247478
crores (12.6 % GDP) implying an increase in Non Plan expenditure, as compared to Plan
expenditure.(0.8 % ) as percentage of GDP.
In terms of applications, Development Expenditure, in 1999-00, accounted for Rs.
198322 crores, (60.90% of total expenditure), Non Development Expenditure for Rs.
1,10,137crores (33.80% of total expenditure) and others Rs. 17,175 crores (5.27% of
total expenditure). Of the Development Expenditure, Social Services accounted for Rs.
1,07,680 crores on direct development expenditure and Rs. 2,984 crore on loans and
advances. Economic services accounted for Rs. 78,812 crores on direct expenditure and
Rs.8,847 crores on loans and advances and General Services accounted for Rs. 1,07,309
crores. Non Development Expenditure has increased from 4% of GDP in 1990-91 to
5.6% on 1999-2000.
With a view to appreciating the sectoral distribution of these expenditures in the select
states the spread among the social services, Economic Services, and General Ser vices is
shown below The spread is split into Revenue and Capital accounts and shown under Plan
and Non Plan. On broad terms, it will be found that while Social Services and General
Services are dominated by Revenue expenditure, Economic Services have a high
proportion of Capital Expenditure.
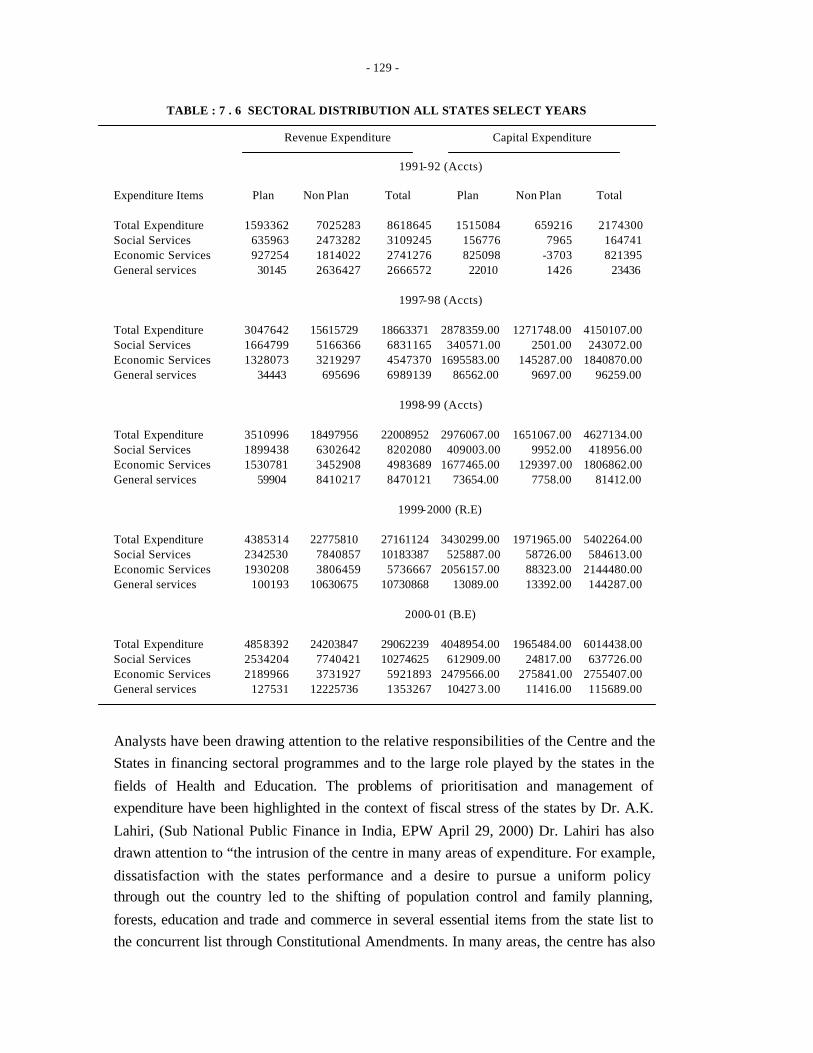
- 129 -
TABLE : 7 . 6 SECTORAL DISTRIBUTION ALL STATES SELECT YEARS
Revenue Expenditure Capital Expenditure 1991-92 (Accts)
Expenditure Items Plan Non Plan Total Plan Non Plan Total
Total Expenditure 1593362 7025283 8618645 1515084 659216 2174300 Social Services 635963 2473282 3109245 156776 7965 164741 Economic Services 927254 1814022 2741276 825098 -3703 821395 General services 30145 2636427 2666572 22010 1426 23436
1997-98 (Accts)
Total Expenditure 3047642 15615729 18663371 2878359.00 1271748.00 4150107.00 Social Services 1664799 5166366 6831165 340571.00 2501.00 243072.00 Economic Services 1328073 3219297 4547370 1695583.00 145287.00 1840870.00 General services 34443 695696 6989139 86562.00 9697.00 96259.00
1998-99 (Accts)
Total Expenditure 3510996 18497956 22008952 2976067.00 1651067.00 4627134.00 Social Services 1899438 6302642 8202080 409003.00 9952.00 418956.00 Economic Services 1530781 3452908 4983689 1677465.00 129397.00 1806862.00 General services 59904 8410217 8470121 73654.00 7758.00 81412.00
1999-2000 (R.E)
Total Expenditure 4385314 22775810 27161124 3430299.00 1971965.00 5402264.00 Social Services 2342530 7840857 10183387 525887.00 58726.00 584613.00 Economic Services 1930208 3806459 5736667 2056157.00 88323.00 2144480.00 General services 100193 10630675 10730868 13089.00 13392.00 144287.00
2000-01 (B.E)
Total Expenditure 4858392 24203847 29062239 4048954.00 1965484.00 6014438.00 Social Services 2534204 7740421 10274625 612909.00 24817.00 637726.00 Economic Services 2189966 3731927 5921893 2479566.00 275841.00 2755407.00 General services 127531 12225736 1353267 10427 3.00 11416.00 115689.00
Analysts have been drawing attention to the relative responsibilities of the Centre and the
States in financing sectoral programmes and to the large role played by the states in the
fields of Health and Education. The problems of prioritisation and management of
expenditure have been highlighted in the context of fiscal stress of the states by Dr. A.K.
Lahiri, (Sub National Public Finance in India, EPW April 29, 2000) Dr. Lahiri has also
drawn attention to “the intrusion of the centre in many areas of expenditure. For example,
dissatisfaction with the states performance and a desire to pursue a uniform policy
through out the country led to the shifting of population control and family planning,
forests, education and trade and commerce in several essential items from the state list to
the concurrent list through Constitutional Amendments. In many areas, the centre has also
- 130 -
intruded in the allocation decisions under the purview of the states through centrally
sponsored schemes”. (EPW April 29, 2001 p.1543).
This “intrusion” has been both by way of the number of schemes and the pattern of
financing of the Centrally Sponsored Schemes (CSS.). The approach paper to the Tenth
Plan has highlighted CSS as an area of weakness in the design of plan programmes,
governance and institutional frame work and indicated that the centre is involved in the
large number of programmes in the state list of the Constitution. Observing that “ as these
schemes are implemented by the states, GOI has no control over the staff or over day to
day supervision or coordination so necessary for the success of such schemes.” The
Approach Paper draws attention to the proliferation of schemes, 210 in number and to the
criticisms made in the CAG Report of 1999-00,that “regarding a common pattern of
shortcomings in the execution of all centrally sponsored schemes”, brought out in the
performance reviews. (See Approach paper chapter 4 and Report of CAG on Union
Government, civil, No. 3 of 2000, over view p.VI)
CAG Report observed that “all previous performance audits have disclosed a similar
pattern of failures of the programmes like design, defects, unconcern for value for money,
programmes run with predominant objective of spending the money rather than for
achie ving their objectives, programmes run without co-relating inputs to the out puts and
out come, absence of criteria for evaluation of the programmes, benefits either not
reaching the target population or unsubstantiated claims of benefits, complex programme
managements/ execution structure, false reporting of financial and physical performances
by the state governments and failure of the ministries in verification of their correctness,
persistence of the ministries with centrally run and controlled programmes despite proven
improbability of central control and monitoring by them and almost total absence of
accountability procedures. These deficiencies have resulted in very poor value for money
spent on social sector programmes, which are executed for general social development
and are specially targeted for social and economic development of the weaker/ poorer
sections of the society.”
It has been pointed out that “the share of centrally sponsored schemes in the plan budget
of the central ministries has now increased to 70% as against 30% in the early 1980s.
That this expansion has taken place at the expense of investment in infrastructure,
industry and energy sectors”. In a more recent report, the Union Finance Minister,
Mr. Yeshwant Sinha, in his Budget speech, 2001-02, had, as part of Expenditure
Management measures, announced that “all schemes that are similar in nature will be
converged to eliminate duplications. Centrally sponsored schemes that can be transferred
to the states will be identified. Necessary procedural changes will also be made to speed
- 131 -
up decision making process for approval of schemes”. (Ref: para 82 of Budget Speech
2001-02)
Recent Reports have indicated as part of the exercises, covering 256 centrally sponsored
schemes, 139 a re proposed to transferred to the states and 117 would be reviewed. Of the
schemes to be reviewed, 114 will be with the Ministry of Environment and Forests, 12
with animal husbandry, 11 in tourism, 11 in social justice and empowerment. In this
pruning exercise, elementary education and literacy will have a massive cut down from
19 to 2, higher education from 26 to 8.
Apart from reducing the number of schemes, there is also a proposal to maintain a
uniform proportion of loan and grant for centrally sponsored schemes. As the final picture
is yet to emerge , it is difficult to anticipate , the impact that the reduction in the number
of centrally sponsored schemes will have on Public Expenditure Management of the
State Governments.
GROWTH OF TAX REVENUE
Looking at the revenue side, the yield from taxes in respect of all the states which was
4.86 % of GDP in 1980-81 improved to 5.55 % of GDP in 1985-86, 5.67% in 1990-91
and 5.88% in 1995-96. The importance of state own tax revenue is obvious .The extent to
which own revenue could meet revenue expenditure varied from state to state.The table
below indicates that except for Andhra Pradesh during the mid nineties , the select states
have had a better Tax Revenue/ Revenue Expenditure ratio than the average of all the
states during the last fifteen years.
Tax Revenue / Revenue Expenditure
1985-90 1990-95 1995-96 1996-97 1997-98 1998-99
All States 43.4 42.2 43.0 44.7 43.5 40.4
Maharashtra 56.3 59.4 61.5 62.1 59.9 55.3
Andhra Pradesh 50.6 47.0 41.4 44.4 48.9 47.0
Karnataka 54.2 58.6 61.0 58.7 58.9 55.8
Tamilnadu 56.9 52.5 59.6 59.8 58.1 54.4
Kerala 51.4 52.2 52.2 51.7 54.6 50.4
Turning to the revenue side of the individual states it is seen that the average annual
growth rates of tax revenue for all states grew at 16.8% during 1980-81 to 1984-85,
16.2% during 1985-86 to 1989-90 and 16.5% during 1990-91 to 1994-95. The states
share in central taxes grew at 11.5%, 17.6% and 13.8% during the above periods. The
relative position of the five select states are indicated below

- 132 -
1980-81 1985-86 1990-91 1984-85 1989-90 1994-95 Growth of Tax Revenue All States 16.8 16.2 16.5 Maharashtra 15.0 17.5 16.6 Andhra Pradesh 19.0 15.3 12.2 Karnataka 17.7 16.3 17.5 Tamilnadu 22.0 14.2 18.7 Kerala 16.6 14.7 18.0
Share in Central Taxes
1980-81 1985-86 1990-91 1984-85 1989-90 1994-95
All States 11.5 17.6 13.8
Maharashtra 12.0 13.1 12.7
Andhra Pradesh 11.2 15.2 16.0
Karnataka 11.0 16.3 12.6
Tamilnadu 11.1 16.6 13.0
Kerala 11.3 18.5 13.1
Deficit Management Turning to the performance of the select states during the nineties
we find that the states of Andhra Pradesh, Karnataka and Maharashtra which had low
levels of revenue deficits suddenly started showing increasing deficit from 1996-97
onwards. Karnataka in fact has shown a small revenue surplus in 1995-96 Kerala and
Tamilnadu showed revenue deficit in all the years in the nineties the quantum picking up
in 1997-98 and 1998-99 Andhra Pradesh showed revenue surplus in 1993-94 and
Maharashtra in 1994-95 .Analysis of the transaction on capital account shows different
picture with only Karnataka showing a deficit in 1992-93 and 1995-96.
Approaching this from a different angle , the Table below shows Revenue receipts
Aggregate Expenditure and GFD as a proportion of GSDP for the years 1990-91 and
1998-99. This indicates a decline in revenue receipts in respect of Andhra Pradesh,
Karnataka, Kerala , Maharashtra and Tamil Nadu and similarly in aggregate expenditure
of all the states for the relevant period, however GFD as a percent of GDP has increased
in varying proportion as shown below.
TABLE : 7 . 7 COMPARATIVE PICTURE OF GFD (as % of GDP)
Select States Rev Receipts Agg Exp GFD 1990-91 1998-99 1990-91 1998-99 1990-91 1998-99 All States 11.7 10.1 15.0 14.3 3.3 4.2 Maharashtra 13.5 8.7 16.0 11.6 2.5 3.0 Andhra Pradesh 15.4 12.5 18.2 17.5 2.8 5.0 Karnataka 16.7 12.4 19.1 15.9 2.4 3.4 Tamil Nadu 16.2 12.2 19.8 16.2 3.6 4.1 Kerala 17.0 11.4 22.7 16.2 5.7 4.8
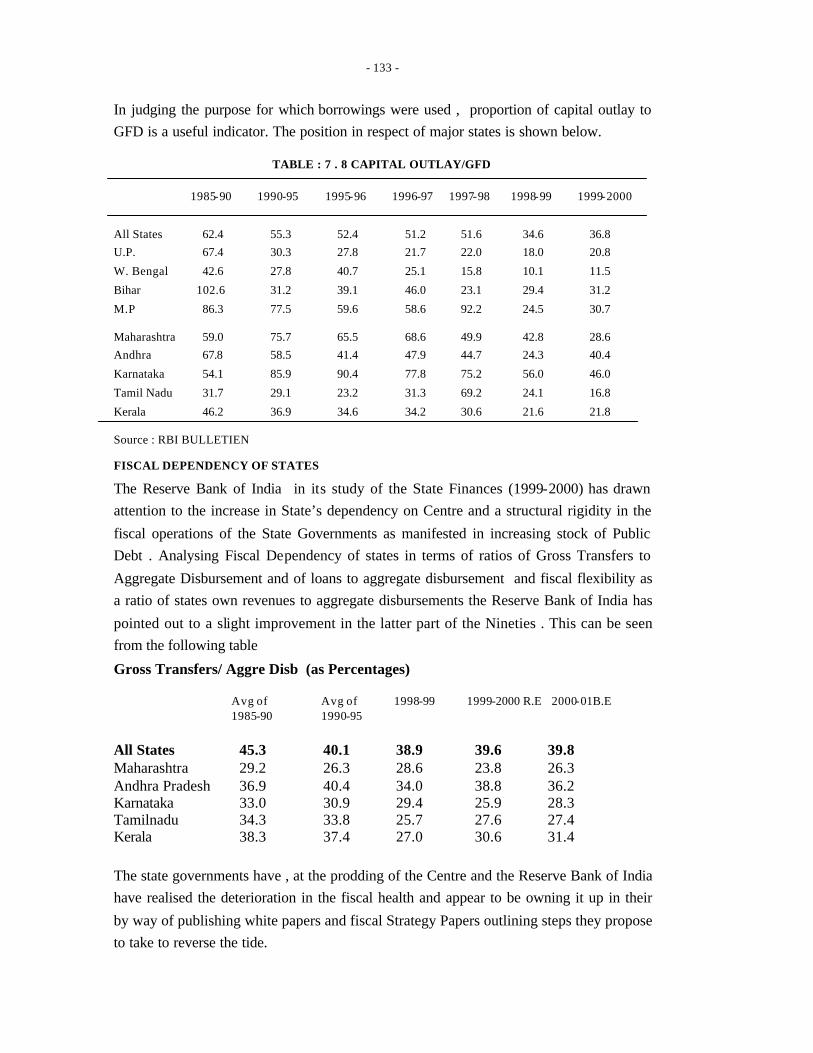
- 133 -
In judging the purpose for which borrowings were used , proportion of capital outlay to
GFD is a useful indicator. The position in respect of major states is shown below.
TABLE : 7 . 8 CAPITAL OUTLAY/GFD
1985-90 1990-95 1995-96 1996-97 1997-98 1998-99 1999-2000
All States 62.4 55.3 52.4 51.2 51.6 34.6 36.8
U.P. 67.4 30.3 27.8 21.7 22.0 18.0 20.8
W. Bengal 42.6 27.8 40.7 25.1 15.8 10.1 11.5
Bihar 102.6 31.2 39.1 46.0 23.1 29.4 31.2
M.P 86.3 77.5 59.6 58.6 92.2 24.5 30.7
Maharashtra 59.0 75.7 65.5 68.6 49.9 42.8 28.6
Andhra 67.8 58.5 41.4 47.9 44.7 24.3 40.4
Karnataka 54.1 85.9 90.4 77.8 75.2 56.0 46.0
Tamil Nadu 31.7 29.1 23.2 31.3 69.2 24.1 16.8
Kerala 46.2 36.9 34.6 34.2 30.6 21.6 21.8
Source : RBI BULLETIEN
FISCAL DEPENDENCY OF STATES
The Reserve Bank of India in its study of the State Finances (1999-2000) has drawn
attention to the increase in State’s dependency on Centre and a structural rigidity in the
fiscal operations of the State Governments as manifested in increasing stock of Public
Debt . Analysing Fiscal Dependency of states in terms of ratios of Gross Transfers to
Aggregate Disbursement and of loans to aggregate disbursement and fiscal flexibility as
a ratio of states own revenues to aggregate disbursements the Reserve Bank of India has
pointed out to a slight improvement in the latter part of the Nineties . This can be seen
from the following table
Gross Transfers/ Aggre Disb (as Percentages) Avg of Avg of 1998-99 1999-2000 R.E 2000-01B.E 1985-90 1990-95 All States 45.3 40.1 38.9 39.6 39.8 Maharashtra 29.2 26.3 28.6 23.8 26.3 Andhra Pradesh 36.9 40.4 34.0 38.8 36.2 Karnataka 33.0 30.9 29.4 25.9 28.3 Tamilnadu 34.3 33.8 25.7 27.6 27.4 Kerala 38.3 37.4 27.0 30.6 31.4
The state governments have , at the prodding of the Centre and the Reserve Bank of India
have realised the deterioration in the fiscal health and appear to be owning it up in their
by way of publishing white papers and fiscal Strategy Papers outlining steps they propose
to take to reverse the tide.

- 134 -
VIII SECTORAL INSIGHTS
With a view to obtaining insights into differences in Sectoral Expenditure Management detailed analysis of one major head of expenditure in each of the functional category of the budget is attempted below.
8 . 1 ECONOMIC SERVICES : IRRIGATION
The provision of irrigation facilities, with state initiative has been a major area concern, in formulating development plans, in project identification, financing and execution. In the
allocation of subjects in the Indian Constitution irrigation is at item 17 in the State list but
the Government of India, through the Central Water Commission and the Irrigation Ministry as also the Planning Commission has been able to provide a broad frame work
for development and utilisation of irrigation facilities. Several of the major policy issues have been dealt with by the first Irrigation Commission of India (1901-1903) and the
Second Irrigation Commission (1970-72), the National Water Policy 1987,
With the India commanding 16% of the worlds population, 2.45% of the worlds land
resources and 4% of the water resources, the importance of conserving water resources
has been realised the National Commission on water, in its Report of 1999 has
distinguished between available water resources, usable water resources. While the
available water resources are placed at 1953 km3 , the “usable water resources have been
estimated at 1086 km3, including 690km3 of surface water and 693 km3 ground water the
present level of use is estimated at 600km3 .” (Data from National Water Commission
cited by Ramaswamy R.Iyer , water charting a course for the future , EPW March 31 ,
2001 .pg. IIIEA 1122)
According to the Planning Commissions, considerable investment have been made from
the First Five Year Plan to the Ninth Plan. Its estimates of magnitude and composition of
investment on Irrigation (major, medium and minor,) command area development has
been on the order of to Rs. 91943 crores on historical costs and Rs. 231386 crores at
1996-97 prices with the following break up
TABLE : 8 . 1 TOTAL INVESTMENT IN IRRIGATION
Category Historical cost Estimate at 1996-97 prices(in Rs)
Major and Medium Irrigation 52606.25 132389.83 Minor Irrigation (a) Public Sector 15692.83 39492.89 (b) Inst Financing 13468.77 33895.77
Sub Total 29161.60 73388.66 Command Area Deve lopment 5418.88 13385.66
Flood Control 4856.67 12222.39
Grand Total 91943.40 231386.59
Source: Planning Commission: Indian Planning Experience Jan 2001. P.77 Also Ninth Plan p.532.
- 135 -
Utilisation of Potential There has been considerable difference of opinion on the estimates of irrigation potential
created and the extent utilised, flowing out of data furnished by the Irrigation
Departments in respect of potential and utilisation and the Revenue Departments
regarding utilisation, inferred from the collection of charges. By end of Eighth Five Year
Plan, the potential created by major and medium irrigation projects has been placed at
32.96 million hectares and utilisation at 28.44 million hectares, since then, 2.59 million
hectares are reported to be addition to the potential and 1.81 million hectares to
utilisation.
The difference of opinion in respect of minor irrigation has been far greater. The practice
up to 1980 was to take utilisation as 100 percent of the potential created. Since this was
not accepted by the Public Accounts Committee of the Parliament, the Planning
Commission had after consultation with the State Governments fixed a base figure for
1984-85 for potential created at 37.52 million hectares and utilisation at 35.25 million
hectares. Since then, further developments has resulted in the potential reaching 56.60
million hectares and utilisation 52.31 million hectares by the end of the Eighth Plan. Of
this, ground water potential was 38.89 million hectares and utilisation 36.25 million
hectares.
Thus, in all ,by the end of the Eighth Plan, (1997) the total potential created is placed at
89.56 million hectares and utilisation at 80.75 million hectares. However if one went by
estimates of gross area irrigated as per Land Utilisation, statistics , gross area irrigated is
only 70.64 million hectares. (see Ninth five Year Plan Vol 11 p.534 The gap even
according to the irrigation statistics is nearly 9 million hectares. This needs to be reduced.
The recognition of such a large gap in utilisation of potential should be considered a
serious admission of weak management as the cost of creating Irrigation potential is
reported to have increased in current prices from Rs. 1200 per hectare in the First Five
Year Plan Period (1951-56) to Rs. 66570 per hectare in 1991. In terms of constant 1980-
81 prices the increase has been estimated to be from Rs. 8620 per hectare to Rs. 29587 per
hectare during the same period.
According to the Ninth Five Year Plan, out of 16 major states, Tamil Nadu, Punjab and
Rajasthan have achieved more than 70% of the ultimate irrigation potential while
Haryana, Karnataka, Jammu and Kashmir, and West Bengal are in the range and 63 to 71
percent U.P. and Maharashtra have achieved 56%. Other states like Assam, Bihar, Orissa,
Madhya Pradesh and Gujrat have still not crossed 50% of the ultimate potential.

- 136 -
The share in total plan outlay , of irrigation and flood control (Centre , States and Union
Territories increased from 7.8 % in Third Plan to 10.6 % by the Annual Plan (1979-80) ,
10.0 % in Sixth Plan , declining to 7.6 % in the Seventh Plan and 7.5 % in the Eighth Plan.
The outlays in the Annual Plan has been between 6 to 7 % in the nineties (see Economic
Survey 1998-99 . S.44 to 47). The funding for irrigation sector in the state plan had been
high in the first three decades of Planning but has shown a declining trend from 23.25 %
of total outlay in Fifth Plan , to 18.48 % in Eighth Plan.
The Ninth Five Year Plan details the financial and physical performance of the various
states, in respect of major and medium projects and observes that 12 out of 16 major states
have incurred more expenditure than outlays. In respect of minor irrigation, implemented
in both Central Sector and State Sector in the performance similarly varied, both in re spect
of physical and financial terms.
U.P., Bihar, West Bengal, Orissa, Madhya Pradesh and Andhra Pradesh contributed to
over 88% of the potential created during the Eighth Plan with megre contribution from
others. Utilisation of institutional finance for minor irrigation development also show
major inter state differences. By the Ninth Plan had envisaged the following targets
Category Potential Potential Creation Utilisation
Major & Medium 9.31 8.01
Minor 7.15 4.74
Total 16.46 12.75
While ambitious targets have been laid both for physical and financial parameters, there is
increasing concern over not only over the rising cost but also poor financial recoveries the
Second Irrigation Commission in 1972 had drawn attention to the poor financial
performances of the irrigation sector both at the Central and the State levels, Committee
on, Committee on Water Pricing set up by the Planning Commissionin 1992 had not only
pointed out that the gross revenue realised in Irrigation and Projects was not covering even
the working expenses. Recovery percentage computed as the percentage of working
expenses to gross receipts showed that for the country as a whole it had come down to
8.59% in the late Eighties to 8.53% in the early Nineties . Andhra Pradesh sho wed an
improvement from 5.03% to 8.3%, Tamil Nadu from 2% to 2.59%, Maharashtra had
fallen from 5.8 to 3.63% . This contrasted with the recovery rates in Punjab and Haryana
which were high in the late Eighties. Punjab’s recovery percentage was 23.69% in the late
Eighties but came down to 16.03% in the early Nineties while in Haryana it came down
from 13.86 % to 13.05%.

- 137 -
The fall in recovery rate appears to be a common phenomenon in all the states. The
following table shows the Working Expenses , Gross Receipts per hectare of potential
utilised in irrigation and Multipurpose River Valley Projects in the states chosen for study
, as per 1996 data of Central Water Commission.
TABLE : 8 . 2 IRRIGATION FINANCIAL PROFILE
Working Expenses Gross Receipts Range of Year of last rate Water Rate Revision Maharashtra 5627 206 100 to 1750 1994
Andhra radesh 1377 48 99 to 222 1986
Karnataka 1639 252 376 to 556 1985
Tamilnadu 579 15 6 to 65 1962
Kerala 596 46 37 to 99 1974
India 1032 82 - -
As pointed out by Shri. R. S. Deshpande and Shri. A. Narayanamurthy (Issues before
Second Irrigation Commission, EPW Mar 2001 p. 1034-1043,) the core problems faced by
the irrigation sector in most of the states are common and the most prominent among these
are: (i)River basinwise proper assessment of water resources and its utilisation. Inter-basin
transfers of water resources (at least within the state and under small catchments). (ii)
Problems of scarcity areas and irrigation backlog across regions. (iii) Financial
performance of the irrigation sector especially in comparison with the same in the other
states (iv) Policy towards water rates. (v)Trends in actual development expenditure on
command area development as against the establishment costs. (vi)Beneficiary
participation in irrigation management (vii)Drip and sprinkler irrigation (vii)The expected
pattern of future development of irrigation in the state.
Sri Ramaswamy R.Iyer , a former Secretary for irrigation , Government of India and a
Member of the National Commission on Water which submitted a Report in Sept 1999 ,
has presented an account of the current state of affairs in the irrigation sector
(E.P.W.march 31,2001 and 4th April 2001 )raising a number of issues and making some
suggestions , Shri Iyer observes , “ the kind of overhaul of politics , procedures , laws and
institutions , will be difficult to bring about and may seem naï ve and unrealistic. In
discussing the changes felt to be needed , we sooner or later encounter the statement that ,
‘politics’ will come in the way .For instance , stopping the thin spreading of resources on
too many projects , pricing water properly , regulating the exploitation of ground water ,
giving PAPs the first claim on the benefits expected from the project , ensuring equity
between head- reach and tail- end users in a canal system , resolving inter state water
disputes in a fair and harmonious manner enforcing economy in the use of water , shifting
the focus from big ,’top-down ‘ projects to local community initiatives and so on , may be
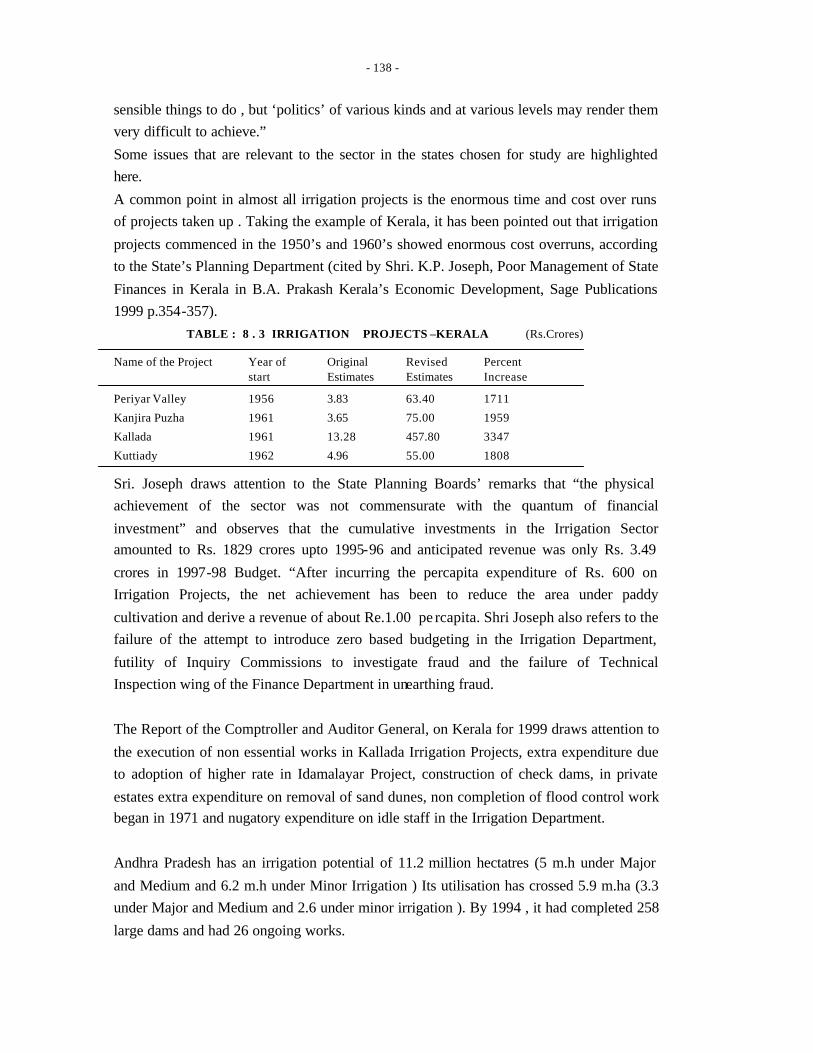
- 138 -
sensible things to do , but ‘politics’ of various kinds and at various levels may render them
very difficult to achieve.”
Some issues that are relevant to the sector in the states chosen for study are highlighted
here.
A common point in almost all irrigation projects is the enormous time and cost over runs
of projects taken up . Taking the example of Kerala, it has been pointed out that irrigation
projects commenced in the 1950’s and 1960’s showed enormous cost overruns, according
to the State’s Planning Department (cited by Shri. K.P. Joseph, Poor Management of State
Finances in Kerala in B.A. Prakash Kerala’s Economic Development, Sage Publications
1999 p.354-357).
TABLE : 8 . 3 IRRIGATION PROJECTS –KERALA (Rs.Crores)
Name of the Project Year of Original Revised Percent start Estimates Estimates Increase
Periyar Valley 1956 3.83 63.40 1711
Kanjira Puzha 1961 3.65 75.00 1959
Kallada 1961 13.28 457.80 3347
Kuttiady 1962 4.96 55.00 1808
Sri. Joseph draws attention to the State Planning Boards’ remarks that “the physical
achievement of the sector was not commensurate with the quantum of financial
investment” and observes that the cumulative investments in the Irrigation Sector
amounted to Rs. 1829 crores upto 1995-96 and anticipated revenue was only Rs. 3.49
crores in 1997-98 Budget. “After incurring the percapita expenditure of Rs. 600 on
Irrigation Projects, the net achievement has been to reduce the area under paddy
cultivation and derive a revenue of about Re.1.00 pe rcapita. Shri Joseph also refers to the
failure of the attempt to introduce zero based budgeting in the Irrigation Department,
futility of Inquiry Commissions to investigate fraud and the failure of Technical
Inspection wing of the Finance Department in unearthing fraud.
The Report of the Comptroller and Auditor General, on Kerala for 1999 draws attention to
the execution of non essential works in Kallada Irrigation Projects, extra expenditure due
to adoption of higher rate in Idamalayar Project, construction of check dams, in private
estates extra expenditure on removal of sand dunes, non completion of flood control work
began in 1971 and nugatory expenditure on idle staff in the Irrigation Department.
Andhra Pradesh has an irrigation potential of 11.2 million hectatres (5 m.h under Major
and Medium and 6.2 m.h under Minor Irrigation ) Its utilisation has crossed 5.9 m.ha (3.3
under Major and Medium and 2.6 under minor irrigation ). By 1994 , it had completed 258
large dams and had 26 ongoing works.
- 139 -
It has been reported by the Comptroller and Auditor General that as of March 2000 there
were 22 incomplete major and medium Irrigation Project, on which expenditure of Rs.
4482 crores have already been incurred of these no benefits have accrued in respect of two
major Irrigation Projects and eight Medium Irrigation Projects. Benefits has accrued
partially in respect of six Major Irrigation Projects and six Medium Irrigation Projects the
CAG Reports also points out that fifteen projects have been languishing for more than 15
years. Scrutiny of the list of projects furnished shows that the CAG assessment may not be
totally correct since projects like Singur started in 1976 and Tunghabadhra Low Level
cannel started in 1974 have been yielding benefits for sometime but not to the promise
extent.
According to the CAG Report Sriram Sagar Project stage 1, started in 1963 has so far
reported an expenditure of Rs. 1536.59 crores and the benefits have accrued only partially
. Scrutiny of the Budgetary Documents of the Irrigation Department shows that the Project
Work was commenced in 1963, with an ultimate potential of 3.92 lakh hectares the works
completed so far can cover only 2.87 lakh hectares, and the irrigation benefits are already
available for 1.28 lakh hectares in the backward districts of Adilabad, Karim Nagar,
Warangal and Khammam. It is necessary to appreciate that the creation of irrigation
potential does not stop with the engineering aspect of raising a dam, but also extends to
execution of canal works, and Command Area Development. This to considerable extent
depends on landholders letting their fields ready to receive water and to take up cultivation
of crops. The transformation, from years of dry land agriculture to irrigated farming
involves not only considerable investment on the part of farmers as also a change in work
habits and living styles.This is found to take time and in many projects , located in
backward areas , it is the migrant farmers with enterprise from developed areas , that
provide the lead , only to face eventually the charge of ‘colonisation’ and local resentment.
Government of Andhra Pradesh appears to be conscious of this and has began to make
policy interventions. The Strategy Paper of Irrigation Development observes,
“performance of existing irrigation system in Andhra Prades has caused concern,
particularly in the case of major and medium irrigation schemes. Despite massive
investments in the irrigation sector, irrigated area particularly in tail-end have declined in
several ma jor commands, due to insufficient maintenance of irrigation schemes, poor cost
recovery of water charges, limited user involvement, low quality of agriculture extension,
etc., resulting in gap ayacut of 11.80 lakh acres”.
The State Government has taken full cognizance of this situation and has commenced a
major reform program, in 1996. The State Government issued a White Paper on Irrigation
- 140 -
Sector and took steps in three areas, (a)increase in water rate (b)farmer education and (c)
farmer empowerment. Pointing out that the State Budget was providing enormous subsidy
in low water rates, amounting to Rs. 557.94 crores on the basis of historical cost of cannel
irrigation and Rs. 4366 crores on current cost basis. The state moved towards three fourth
increase in the water rates. The State also took steps to bring in legislation namely the
Andhra Pradesh Farmer Management of Irrigation Systems Act 1997 providing for
linkages between Irrigation Department and farmers organisations through appointment of
departmental officer as competent authorities responsible for implementation and
execution of all decisions taken by the farmers organisations. The State Government has
also taken initiative to facilitate Water User Associations, over ten thousand of them
covering distributories in the irrigation projects, serving about 4.8 million hectares. The
State Government is currently implementing a scheme for modernisation of the Irrigation
sector with the objectives of
(a) Placing the Irrigation Sector on a sustainable basis through Cost Recovery
(b)Reversing the decline in Irrigated area under the existing commands (c) Improving the
productivity of irrigated agriculture (d) Strengthening cost recovery for O & M.
(e)Expanding effectively irrigated areas in existing systems. This Project appears to have
taken concerted action to bring the Farmer and Irrigation Department together to reduce
the gap between irrigation potential created and utilised.
These positive steps do not however wipe away the basic weakness in Expenditure
Management in the Irrigation Sector namely the thin spreading of available resources over
a large number of projects and the failure to step up cost recovery rate. Even by the
November 2000, the revenue collection continue to be as low as 25.54 % of the demand,
and hardly adequate to cover the O & M expenses.
Maharashra is assessed to have an irrigation potential of 8.9 million hectatres (4.1 under
major and medium , 4.8 under minor) and its utilisation upto 92-93 3.5 m.ha (1.3 under
medium and 2.2 m.ha under Minor ). By 1994, the state has built about 1220 dams and
had 300 more under construction . Relative to A.P , its utilisation , has been slow , may be
due to unfavourable topography and poorer farmer.
Maharashtra, Govt has appointed recently a Sta te Level Second Irrigation Commission, to
review the changes that have taken place in the past few decades. The First Irrigation
Commission of 1962 had gone into several issues, and had made recommendation the
problems in irrigation sector and that policy should reviewed periodically once in fifteen
years.
- 141 -
Taken the case of Karnataka, it is seen that this state is relatively backward in terms of
irrigation potential when compared to Andhra Pradesh and Maharashtra. Its ultimate
potential is estimated at 5.9 million hectares, (2.5 m.ha under Major and Medium and 3.4
m.ha under minor irrigation) . Its utilisation is placed at 2.7 m.ha (1.3 m.ha under Major
and Medium and 1.4 m.ha under minor irrigation). The terrain does not facilitate
construction of large storage of reservoir . It had 188 medium projects by 1994 and 28 still
under construction .Because of these Karnataka’s utilisation of the potential has been
relatively low. In fact Karnataka minor irrigation potential is more than the major and
medium irrigation potential. Another picture is that there are sharp imbalances in the
regions, which has come up for considerable attentions in recent years. According to Shri
M.Venkata Reddy (Irrigation Development Problems and Prospects in Abdul Aziz and
Sudhir Krisha, Regional Development ISEC 1996), net area irrigated as percentage of
sown area had increased from 7.5% in 1957-58 to 15% in 1983-84 and 21.6% in 1991-92,
showing better utilisation but inter-district disparities continued, with ten out of nineteen
districts showing net irrigated area less than the state average. Analysts feel that positive
efforts, lack of prioritization of schemes, inadequate drainage facilities, poor land
development, inadequate beneficiary participation have been affecting development of
irrigation potential in Karnataka.
Analysis of the budgetary documents of the various State Governments show that
irrigation and flood control do account for a significant share of the expenditure on the
revenue and the capital side. Maharashtra’s budget shows a revenue expenditure on
irrigation and flood control to be Rs. 1777 .14 crores in 1998-99 (actuals) . But the revised
estimate for 1999-2000 is less than half at Rs.833.72 crores ,while the BE for 2000-01 is
Rs.728.63 crores. The provision in 2000-2001 works out to 2.3 % of the Total Expenditure
of Rs.31880 crores . However on the capital side it is seen that in 1998-99 out of the total
capital expenditure of Rs. 3192 crores , irrigation and flood control had accounted for
Rs.1198 crores and the provisions in their RE of 1999-2000 and 2000-2001BE are
relatively higher at RS. 1442 crores and 1434 crores respectively. The provision in 2000-
01 BE accounts for 46.7 % of the total capital expenditure .It must be noted that
Maharashtra Government had set up Irrigation Development Corporation for various
development regions.
The State’s Eighth Five Year Plan had allocated Rs. 3329 crores for irrigation and flood
control out of a total approved outlay of Rs. 18520 crores . But interms of actual
expenditure irrigation and flood control accounts for Rs.5668 crores out of a total Eighth
Five Year Plan expenditure of Rs.25751 crores working out to 22.01 % .The Ninth Five
Year Plan has allocated Rs.13437 crores out of a total approved outlay of Rs. 45125
crores working out to 29.7 % . The expenditure in the first two years of the Ninth Plan
(1997-98 1998-99) works out to Rs. 3961 crores out of a total plan expenditure of Rs.
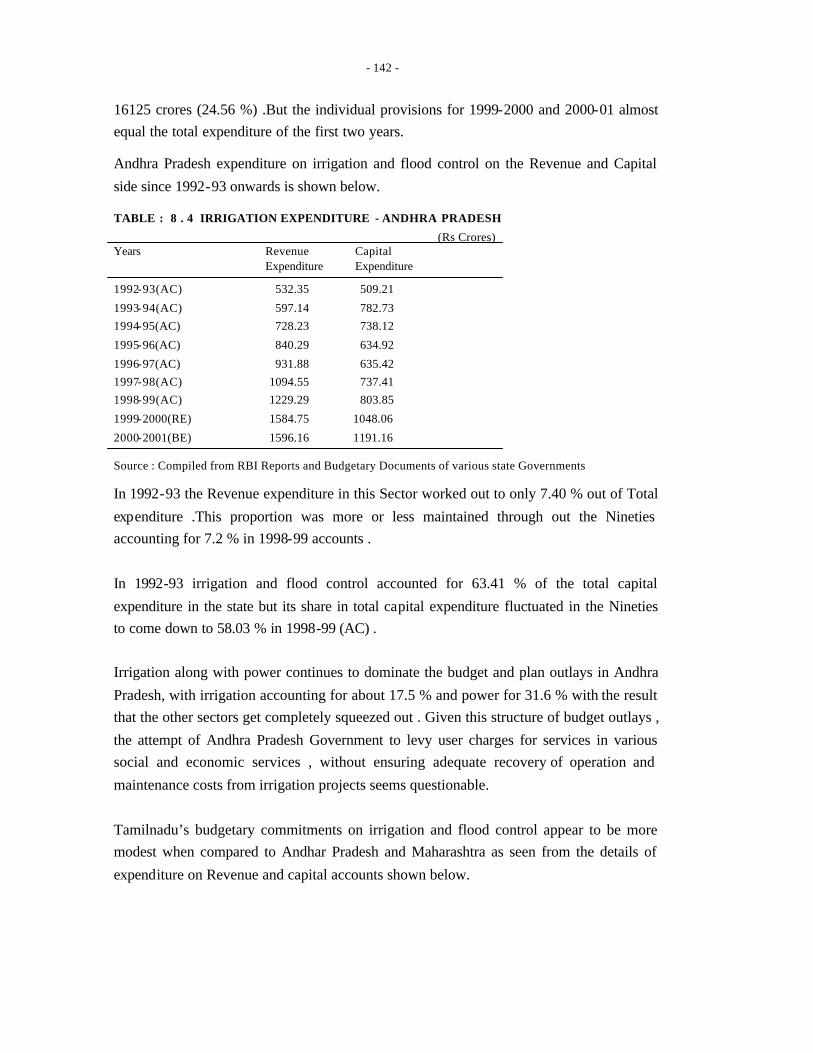
- 142 -
16125 crores (24.56 %) .But the individual provisions for 1999-2000 and 2000-01 almost
equal the total expenditure of the first two years.
Andhra Pradesh expenditure on irrigation and flood control on the Revenue and Capital
side since 1992-93 onwards is shown below.
TABLE : 8 . 4 IRRIGATION EXPENDITURE - ANDHRA PRADESH (Rs Crores) Years Revenue Capital Expenditure Expenditure
1992-93(AC) 532.35 509.21
1993-94(AC) 597.14 782.73
1994-95(AC) 728.23 738.12
1995-96(AC) 840.29 634.92
1996-97(AC) 931.88 635.42
1997-98(AC) 1094.55 737.41
1998-99(AC) 1229.29 803.85
1999-2000(RE) 1584.75 1048.06
2000-2001(BE) 1596.16 1191.16
Source : Compiled from RBI Reports and Budgetary Documents of various state Governments
In 1992-93 the Revenue expenditure in this Sector worked out to only 7.40 % out of Total
expenditure .This proportion was more or less maintained through out the Nineties
accounting for 7.2 % in 1998-99 accounts .
In 1992-93 irrigation and flood control accounted for 63.41 % of the total capital
expenditure in the state but its share in total capital expenditure fluctuated in the Nineties
to come down to 58.03 % in 1998-99 (AC) .
Irrigation along with power continues to dominate the budget and plan outlays in Andhra
Pradesh, with irrigation accounting for about 17.5 % and power for 31.6 % with the result
that the other sectors get completely squeezed out . Given this structure of budget outlays ,
the attempt of Andhra Pradesh Government to levy user charges for services in various
social and economic services , without ensuring adequate recovery of operation and
maintenance costs from irrigation projects seems questionable.
Tamilnadu’s budgetary commitments on irrigation and flood control appear to be more
modest when compared to Andhar Pradesh and Maharashtra as seen from the details of
expenditure on Revenue and capital accounts shown below.
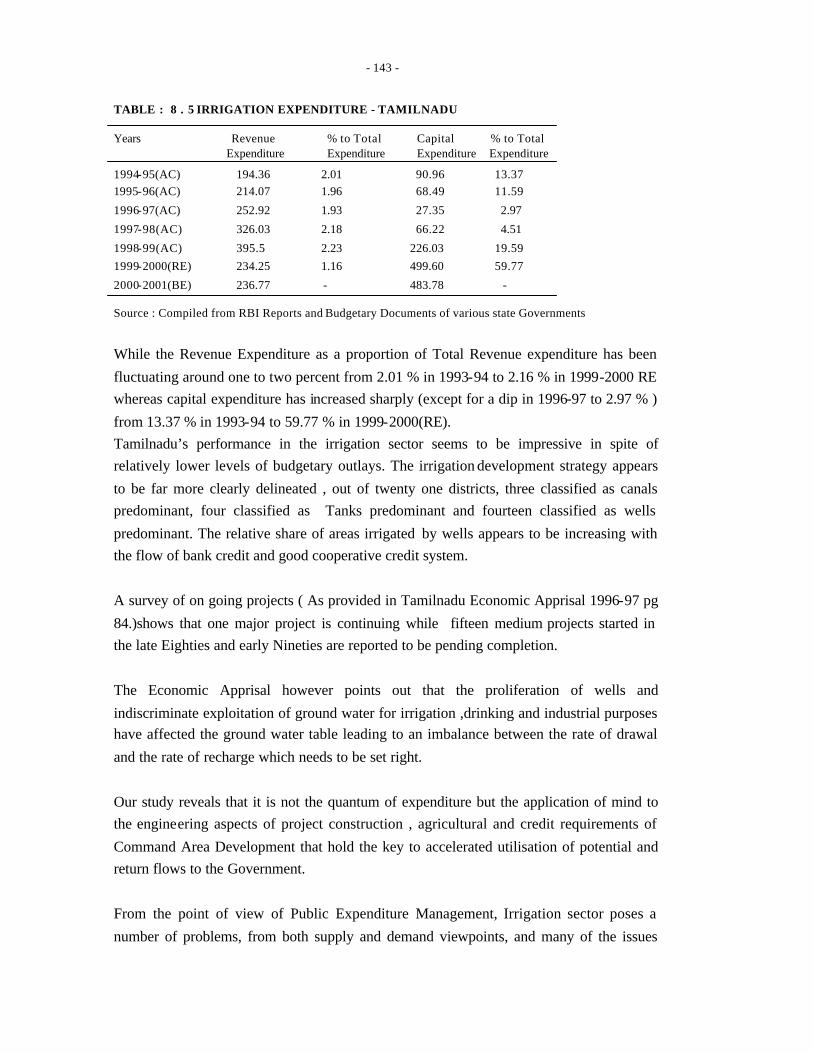
- 143 -
TABLE : 8 . 5 IRRIGATION EXPENDITURE - TAMILNADU
Years Revenue % to Total Capital % to Total Expenditure Expenditure Expenditure Expenditure
1994-95(AC) 194.36 2.01 90.96 13.37
1995-96(AC) 214.07 1.96 68.49 11.59
1996-97(AC) 252.92 1.93 27.35 2.97
1997-98(AC) 326.03 2.18 66.22 4.51
1998-99(AC) 395.5 2.23 226.03 19.59
1999-2000(RE) 234.25 1.16 499.60 59.77
2000-2001(BE) 236.77 - 483.78 -
Source : Compiled from RBI Reports and Budgetary Documents of various state Governments
While the Revenue Expenditure as a proportion of Total Revenue expenditure has been
fluctuating around one to two percent from 2.01 % in 1993-94 to 2.16 % in 1999-2000 RE
whereas capital expenditure has increased sharply (except for a dip in 1996-97 to 2.97 % )
from 13.37 % in 1993-94 to 59.77 % in 1999-2000(RE).
Tamilnadu’s performance in the irrigation sector seems to be impressive in spite of
relatively lower levels of budgetary outlays. The irrigation development strategy appears
to be far more clearly delineated , out of twenty one districts, three classified as canals
predominant, four classified as Tanks predominant and fourteen classified as wells
predominant. The relative share of areas irrigated by wells appears to be increasing with
the flow of bank credit and good cooperative credit system.
A survey of on going projects ( As provided in Tamilnadu Economic Apprisal 1996-97 pg
84.)shows that one major project is continuing while fifteen medium projects started in
the late Eighties and early Nineties are reported to be pending completion.
The Economic Apprisal however points out that the proliferation of wells and
indiscriminate exploitation of ground water for irrigation ,drinking and industrial purposes
have affected the ground water table leading to an imbalance between the rate of drawal
and the rate of recharge which needs to be set right.
Our study reveals that it is not the quantum of expenditure but the application of mind to
the engineering aspects of project construction , agricultural and credit requirements of
Command Area Development that hold the key to accelerated utilisation of potential and
return flows to the Government.
From the point of view of Public Expenditure Management, Irrigation sector poses a
number of problems, from both supply and demand viewpoints, and many of the issues
- 144 -
have been discussed thoroughly at various levels. Committee on water pricing appointed
by the Planning Commission suggested various measures to improve the financial
performance of the irrigation sector , including (a) improving the design of projects and its
apprisal , (b) Restructuring of project management (c) providing an incentive structure (d)
Restructuring irrigation rates and increasing them at periodical levels, determining water
rates on volumetric basis (e) enlarging beneficiary participation in the management.
While the First Five Decades of Planning has been marked by Public Sector and State
initiative in construction of dam and the re is in recent years some attention to private
sector and farmer participation. Maharashtra and Karnataka have begun corporatised
approach to project execution by raising funds through bonds from the market but with
state guarentee . In A.P there was legislation for Advance Betterment Levy which was
collected from the farmers of the potential command area . This has receded into the back
ground .Still irrigation remains a major responsibility of State Governments, which have
not been able to adequately fund the Projects identified and taken up. Even while the
States are struggling to find the resources to completed the projects taken up and later
insuring a reasonable recovery rate, a number of new inssues like environmental impact
and compensation for displaced persons and their rehabilitation have been raised, which
tend to add to the project cost. Disputes between farmers who are the beneficiaries, and
persons who are affected by submergence of other problems has also inter-state dispute
have tended to prolong the gestation of Irrigation Projects. If engineering factors had
earlier cost time and cost overrun of irrigation projects, the newer issues have tend to
delay the commencement of benefits.
If in the point of view of Public Expenditure Management any reform is to be carried out,
it is in the area of project management, and time phasing of investment, and much more in
the areas of award of contracts. Reform of tender procedures cost control and procurement
management along with the advance action for land development in the command areas
will go a long way in improving the Irrigation Sector.
- 145 -
8 . 2 SOCIAL SERVICES - EDUCATION
Education can be viewed as one of the best measures of human resources development
and a key component of social services. Literature on human capital as well as human
development has laid considerable emphasis on education as a key instrument.
As per constitutional directive of India, elementary education is to be provided free for all
by the government. Education, being placed in the concurrent list, both the Centre and
States have concerned themselves with it, as is evident from the central and state
expenditures on education. The Tenth Plan Approach Paper states that “education for all
must be one of the primary objectives of the Tenth Plan.” It states that the launching of
the “Sarva Shiksha Abhiyan” indicates a strong reiteration of the Country’s resolve to
give the highest priority to achieve this goal during the plan period. Although the states
have a major share in social sectors, especially education and health, they have registered
smaller increases relative to the increase in Central Government expenditure, particularly
in respect of the current expenditure in the post reform period.
Many studies have shown that social sector expenditure as a whole has declined
considerably during the first few years of reforms. The per capita expenditure on social
services, including education, health, housing and urban development and social welfare,
for All States together was lower in the post reform period as compared to 1990-91.1
Reviewing the social sectors expenditures of the states in the pre-reform and during
reform periods Shri. P.R. Panchamukhi noted that the expenditure shares of social sector
in total revenue expenditure showed a declining trend education expenditures for all
states, he observes decreased from 21.08 percent (pre reform) to 19.70 percent of total
revenue expenditure during the reform period.
Tulsidhar (1997)2 categorises the per capita public expenditure on social services for
three different categories of states like- (a) poor states including, Bihar, Madhya Pradesh,
Orissa, Rajasthan and Uttar Pradesh (b) Middle income states including Andhra Pradesh,
Assam, Karnataka, Kerala, Tamil Nadu and West Bengal and (c) Rich States including
Gujarat, Haryana, Maharashtra and Punjab to assess the differential impact of decline in
per capita social services expenditure seem to have suffered more, with social services
expenditure, as also the education exp enditure, declining considerably in the post reform
1 S. Mahendra Dev, Pyush Anthony, V.Gayathri and R.P.Mamgain, ‘Social & Economic Security in India’
p.51 2 Tulsidhar V.B (1997), “Resources for Human Development: Notes on selected topics” Background paper
for UNDP Paper India : The Road to Human Development , UNDP
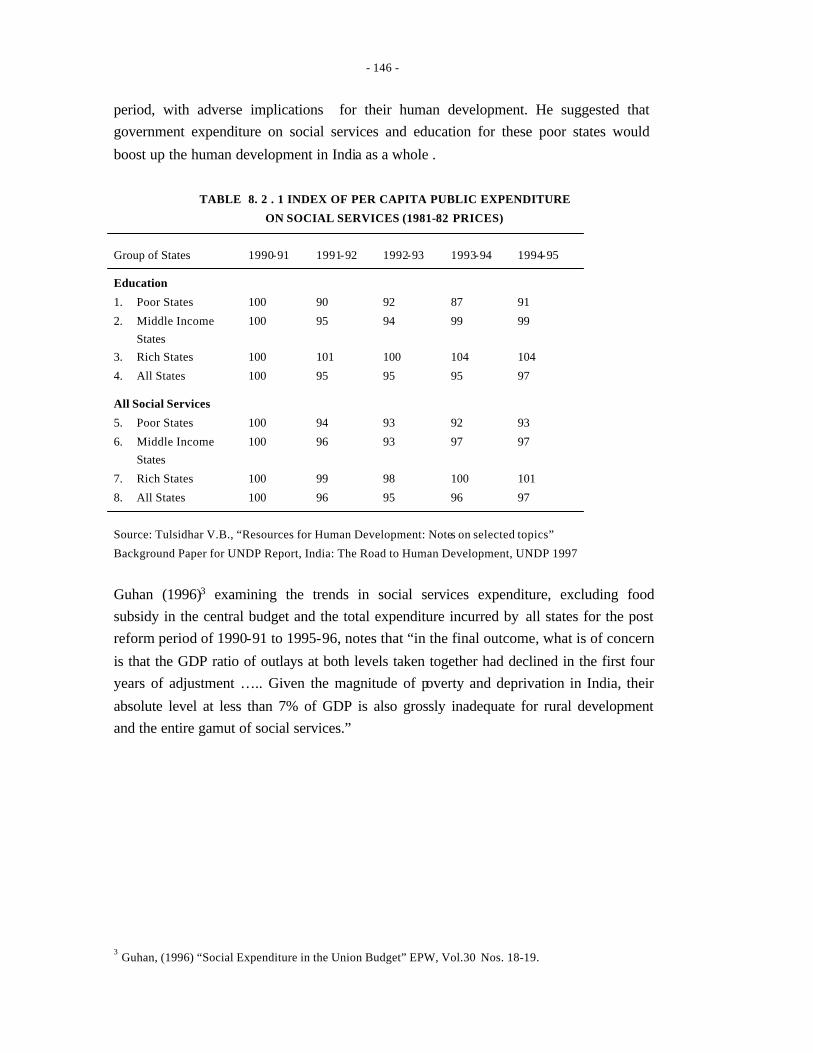
- 146 -
period, with adverse implications for their human development. He suggested that
government expenditure on social services and education for these poor states would
boost up the human development in India as a whole .
TABLE 8. 2 . 1 INDEX OF PER CAPITA PUBLIC EXPENDITURE
ON SOCIAL SERVICES (1981-82 PRICES)
Group of States 1990-91 1991-92 1992-93 1993-94 1994-95
Education
1. Poor States 100 90 92 87 91
2. Middle Income 100 95 94 99 99
States
3. Rich States 100 101 100 104 104
4. All States 100 95 95 95 97
All Social Services
5. Poor States 100 94 93 92 93
6. Middle Income 100 96 93 97 97
States
7. Rich States 100 99 98 100 101
8. All States 100 96 95 96 97
Source: Tulsidhar V.B., “Resources for Human Development: Notes on selected topics”
Background Paper for UNDP Report, India: The Road to Human Development, UNDP 1997
Guhan (1996)3 examining the trends in social services expenditure, excluding food
subsidy in the central budget and the total expenditure incurred by all states for the post
reform period of 1990-91 to 1995-96, notes that “in the final outcome, what is of concern
is that the GDP ratio of outlays at both levels taken together had declined in the first four
years of adjustment ….. Given the magnitude of poverty and deprivation in India, their
absolute level at less than 7% of GDP is also grossly inadequate for rural development
and the entire gamut of social services.”
3 Guhan, (1996) “Social Expenditure in the Union Budget” EPW, Vol.30 Nos. 18-19.
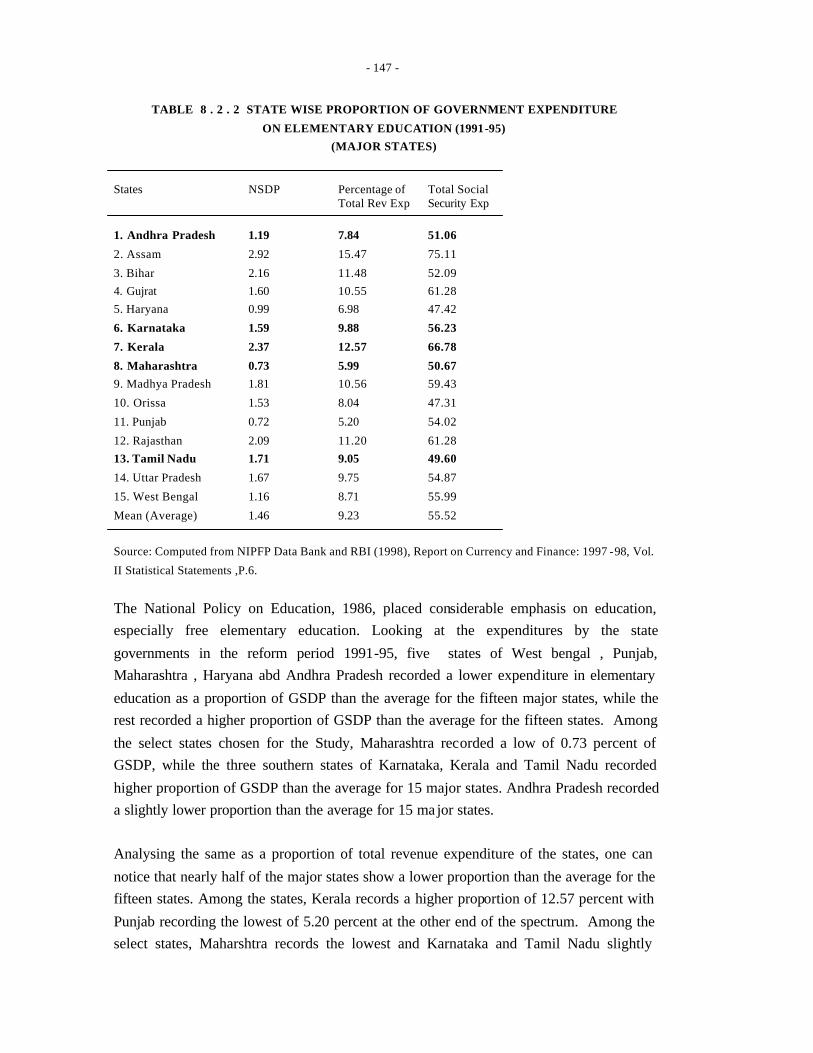
- 147 -
TABLE 8 . 2 . 2 STATE WISE PROPORTION OF GOVERNMENT EXPENDITURE
ON ELEMENTARY EDUCATION (1991-95)
(MAJOR STATES)
States NSDP Percentage of Total Social Total Rev Exp Security Exp
1. Andhra Pradesh 1.19 7.84 51.06
2. Assam 2.92 15.47 75.11
3. Bihar 2.16 11.48 52.09
4. Gujrat 1.60 10.55 61.28
5. Haryana 0.99 6.98 47.42
6. Karnataka 1.59 9.88 56.23
7. Kerala 2.37 12.57 66.78
8. Maharashtra 0.73 5.99 50.67
9. Madhya Pradesh 1.81 10.56 59.43
10. Orissa 1.53 8.04 47.31
11. Punjab 0.72 5.20 54.02
12. Rajasthan 2.09 11.20 61.28
13. Tamil Nadu 1.71 9.05 49.60
14. Uttar Pradesh 1.67 9.75 54.87
15. West Bengal 1.16 8.71 55.99
Mean (Average) 1.46 9.23 55.52
Source: Computed from NIPFP Data Bank and RBI (1998), Report on Currency and Finance: 1997 -98, Vol.
II Statistical Statements ,P.6.
The National Policy on Education, 1986, placed considerable emphasis on education,
especially free elementary education. Looking at the expenditures by the state
governments in the reform period 1991-95, five states of West bengal , Punjab,
Maharashtra , Haryana abd Andhra Pradesh recorded a lower expenditure in elementary
education as a proportion of GSDP than the average for the fifteen major states, while the
rest recorded a higher proportion of GSDP than the average for the fifteen states. Among
the select states chosen for the Study, Maharashtra recorded a low of 0.73 percent of
GSDP, while the three southern states of Karnataka, Kerala and Tamil Nadu recorded
higher proportion of GSDP than the average for 15 major states. Andhra Pradesh recorded
a slightly lower proportion than the average for 15 ma jor states.
Analysing the same as a proportion of total revenue expenditure of the states, one can
notice that nearly half of the major states show a lower proportion than the average for the
fifteen states. Among the states, Kerala records a higher proportion of 12.57 percent with
Punjab recording the lowest of 5.20 percent at the other end of the spectrum. Among the
select states, Maharshtra records the lowest and Karnataka and Tamil Nadu slightly
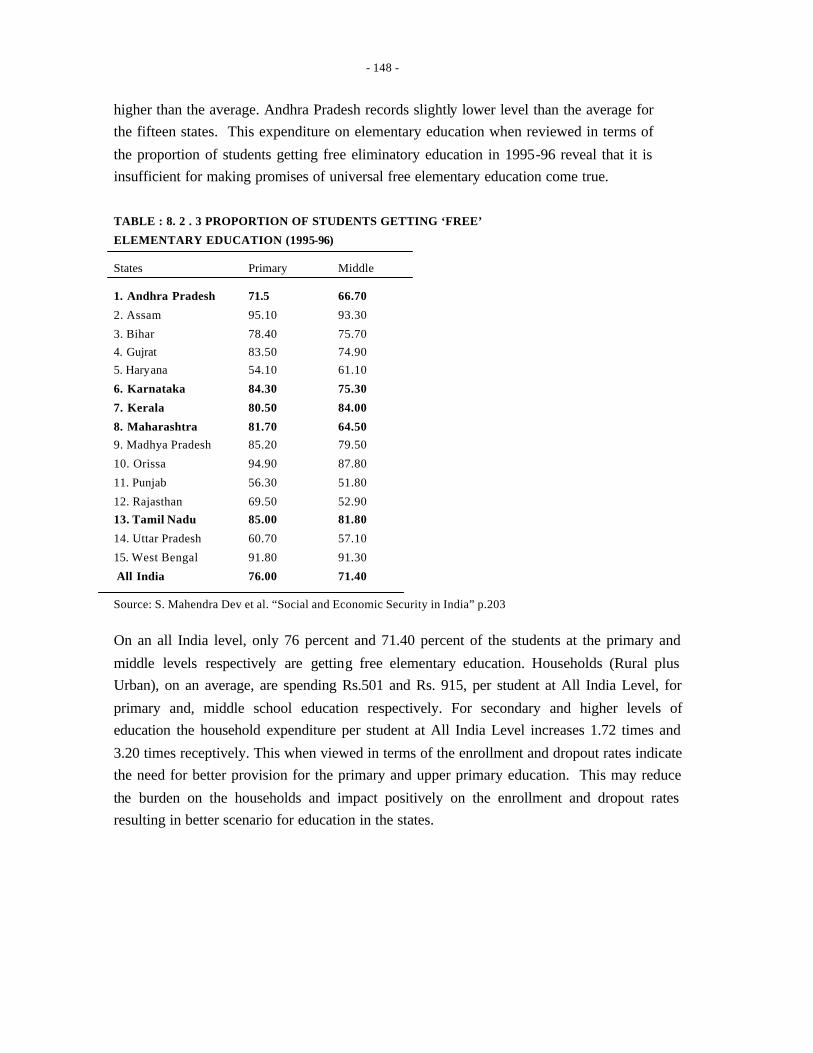
- 148 -
higher than the average. Andhra Pradesh records slightly lower level than the average for
the fifteen states. This expenditure on elementary education when reviewed in terms of
the proportion of students getting free eliminatory education in 1995-96 reveal that it is
insufficient for making promises of universal free elementary education come true.
TABLE : 8. 2 . 3 PROPORTION OF STUDENTS GETTING ‘FREE’
ELEMENTARY EDUCATION (1995-96)
States Primary Middle
1. Andhra Pradesh 71.5 66.70
2. Assam 95.10 93.30
3. Bihar 78.40 75.70
4. Gujrat 83.50 74.90
5. Haryana 54.10 61.10
6. Karnataka 84.30 75.30
7. Kerala 80.50 84.00
8. Maharashtra 81.70 64.50
9. Madhya Pradesh 85.20 79.50
10. Orissa 94.90 87.80
11. Punjab 56.30 51.80
12. Rajasthan 69.50 52.90
13. Tamil Nadu 85.00 81.80
14. Uttar Pradesh 60.70 57.10
15. West Bengal 91.80 91.30
All India 76.00 71.40
Source: S. Mahendra Dev et al. “Social and Economic Security in India” p.203
On an all India level, only 76 percent and 71.40 percent of the students at the primary and
middle levels respectively are getting free elementary education. Households (Rural plus
Urban), on an average, are spending Rs.501 and Rs. 915, per student at All India Level, for
primary and, middle school education respectively. For secondary and higher levels of
education the household expenditure per student at All India Level increases 1.72 times and
3.20 times receptively. This when viewed in terms of the enrollment and dropout rates indicate
the need for better provision for the primary and upper primary education. This may reduce
the burden on the households and impact positively on the enrollment and dropout rates
resulting in better scenario for education in the states.
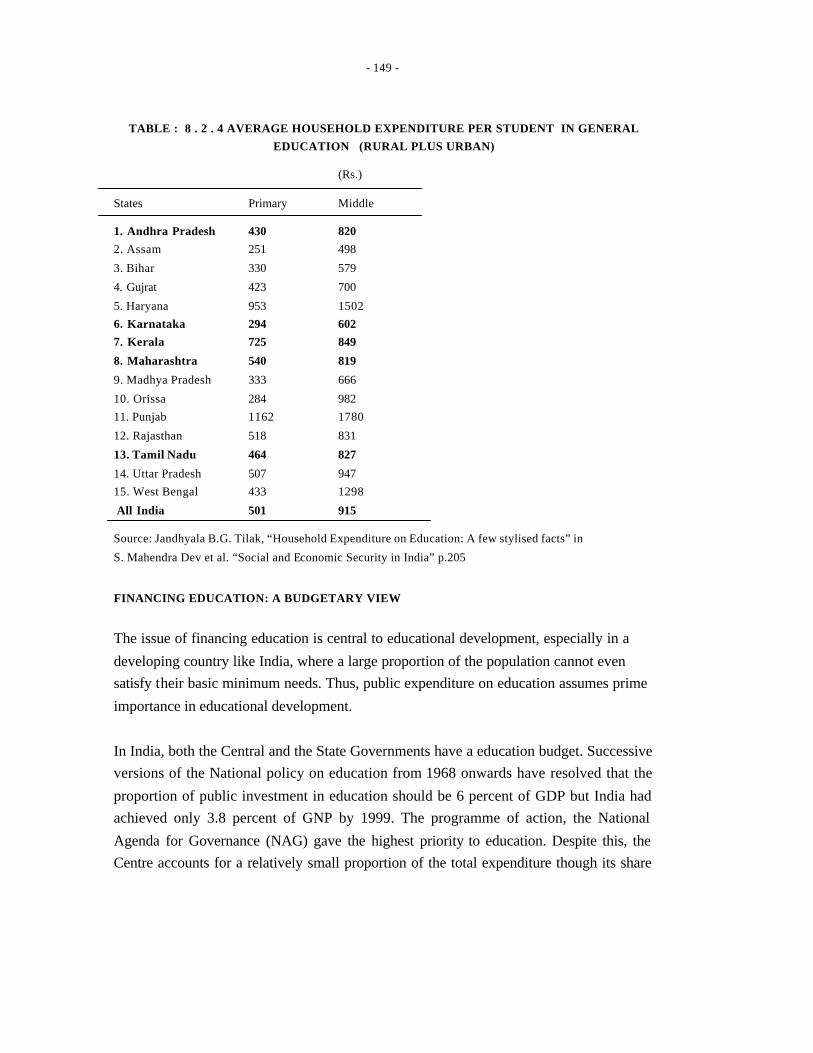
- 149 -
TABLE : 8 . 2 . 4 AVERAGE HOUSEHOLD EXPENDITURE PER STUDENT IN GENERAL
EDUCATION (RURAL PLUS URBAN)
(Rs.)
States Primary Middle
1. Andhra Pradesh 430 820
2. Assam 251 498
3. Bihar 330 579
4. Gujrat 423 700
5. Haryana 953 1502
6. Karnataka 294 602
7. Kerala 725 849
8. Maharashtra 540 819
9. Madhya Pradesh 333 666
10. Orissa 284 982
11. Punjab 1162 1780
12. Rajasthan 518 831
13. Tamil Nadu 464 827
14. Uttar Pradesh 507 947
15. West Bengal 433 1298
All India 501 915
Source: Jandhyala B.G. Tilak, “Household Expenditure on Education: A few stylised facts” in
S. Mahendra Dev et al. “Social and Economic Security in India” p.205
FINANCING EDUCATION: A BUDGETARY VIEW
The issue of financing education is central to educational development, especially in a
developing country like India, where a large proportion of the population cannot even
satisfy their basic minimum needs. Thus, public expenditure on education assumes prime
importance in educational development.
In India, both the Central and the State Governments have a education budget. Successive
versions of the National policy on education from 1968 onwards have resolved that the
proportion of public investment in education should be 6 percent of GDP but India had
achieved only 3.8 percent of GNP by 1999. The programme of action, the National
Agenda for Governance (NAG) gave the highest priority to education. Despite this, the
Centre accounts for a relatively small proportion of the total expenditure though its share
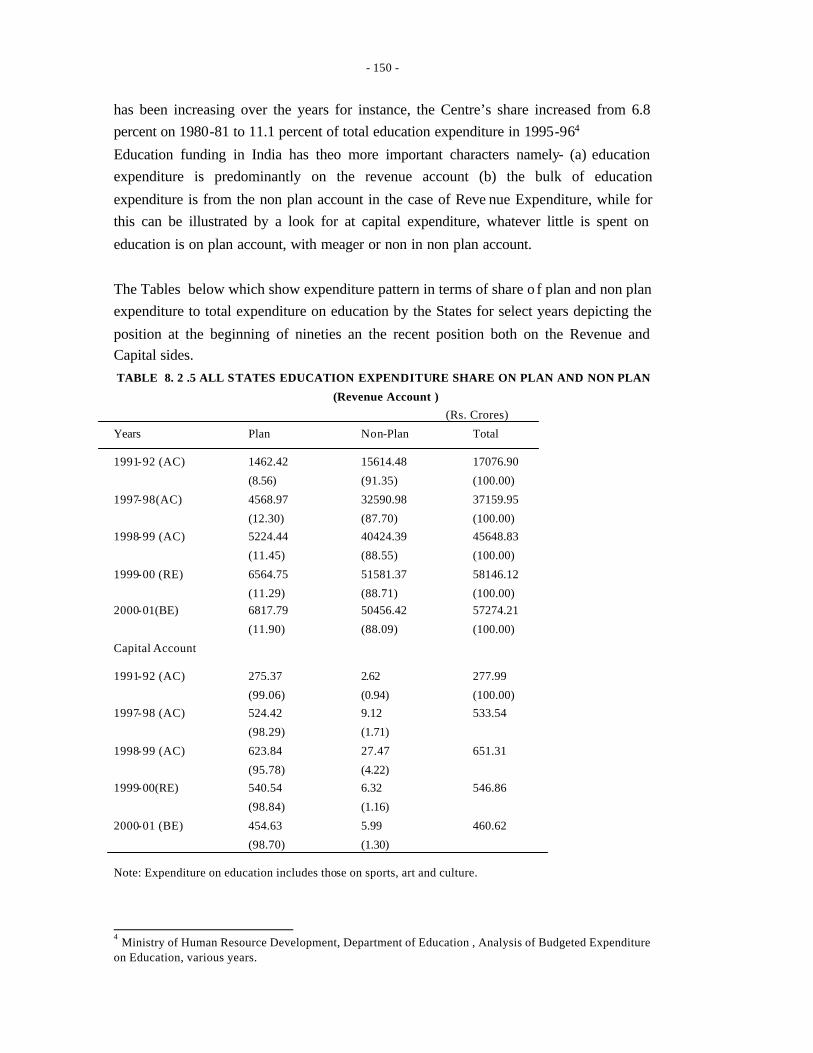
- 150 -
has been increasing over the years for instance, the Centre’s share increased from 6.8
percent on 1980-81 to 11.1 percent of total education expenditure in 1995-964
Education funding in India has theo more important characters namely- (a) education
expenditure is predominantly on the revenue account (b) the bulk of education
expenditure is from the non plan account in the case of Reve nue Expenditure, while for
this can be illustrated by a look for at capital expenditure, whatever little is spent on
education is on plan account, with meager or non in non plan account.
The Tables below which show expenditure pattern in terms of share o f plan and non plan
expenditure to total expenditure on education by the States for select years depicting the
position at the beginning of nineties an the recent position both on the Revenue and
Capital sides.
TABLE 8. 2 .5 ALL STATES EDUCATION EXPENDITURE SHARE ON PLAN AND NON PLAN
(Revenue Account )
(Rs. Crores)
Years Plan Non-Plan Total
1991-92 (AC) 1462.42 15614.48 17076.90
(8.56) (91.35) (100.00)
1997-98(AC) 4568.97 32590.98 37159.95
(12.30) (87.70) (100.00)
1998-99 (AC) 5224.44 40424.39 45648.83
(11.45) (88.55) (100.00)
1999-00 (RE) 6564.75 51581.37 58146.12
(11.29) (88.71) (100.00)
2000-01(BE) 6817.79 50456.42 57274.21
(11.90) (88.09) (100.00)
Capital Account
1991-92 (AC) 275.37 2.62 277.99
(99.06) (0.94) (100.00)
1997-98 (AC) 524.42 9.12 533.54
(98.29) (1.71)
1998-99 (AC) 623.84 27.47 651.31
(95.78) (4.22)
1999-00(RE) 540.54 6.32 546.86
(98.84) (1.16)
2000-01 (BE) 454.63 5.99 460.62
(98.70) (1.30)
Note: Expenditure on education includes those on sports, art and culture.
4 Ministry of Human Resource Development, Department of Education , Analysis of Budgeted Expenditure
on Education, various years.

- 151 -
It can be noticed from the table that the plan expenditure has grown 4.66 times from 1991-
92 to 2000-01. While non plan expenditure for the same period has grown 3.23 times on
the Revenue Side.
On the Capital side, the plan expenditure has grown 1.65 times and non plan expenditure
2.29 times during the same period. Looking at the absolute figures for the same period,
one can see that the increase on plan expenditure as a whole has been only Rs. 5534.63
crores. While on the non plan expenditure, both Capital and Revenue together, increased
by Rs. 34845.31 crores. If one views this in the context of population changes for the
same period, which recorded a decades variation of 21.34 form 1991 to 2001 (All India)
marking new entrants into the education users group, one can understand the pancity of
funds of education.
Abu Saleh Shariff and P.K. Ghosh5 commenting on this gap in public expenditure on
education note that the share of public expenditure on education on education in India’s
GNP shows a declining trend in the nineties and an increase in the share of plan
expenditure in the total Government Expenditure on education is essential for further
development of education.
Another important aspect of education expenditure is the pattern of expenditure with in the
education sectors. Despite abundant research to support the fact that investment in lower
levels of education contributes more to income redistribution and reduction in poverty,
besides contributing to economic growth than investment in higher levels, (Tilak, 1989),
elementary education has not received its due.
Commenting on this Shri. Krishna Kumar (Education and Society in Post Independence
India: Looking Towards the Future, EPW, June 9th 1998, p.1391-1396), says that there is a
preponderance of higher education in India. At the time of independence, despite the high
priority accorded to primary education, the vary first commission on education appointed
after independence was asked to focus on University Education and the Second
Commission appointed a few years states, was asked to focus on secondary education also,
Shri Krishna Kumar, points out, that this was reflected in the growth of enrolment and
institution of higher education rose substantially since the late fifties and has remained so
through out the, seventies and the early eighties. He interprets this as a growth of higher
education at the expense of small elementary education. Which marginalised the weaker
sections further.
5 Abu Saleh Shariff & P.K.Ghosh, “Indian Education Scene and the Public Gap” EPW April 15
th 2000,
pp.B96.
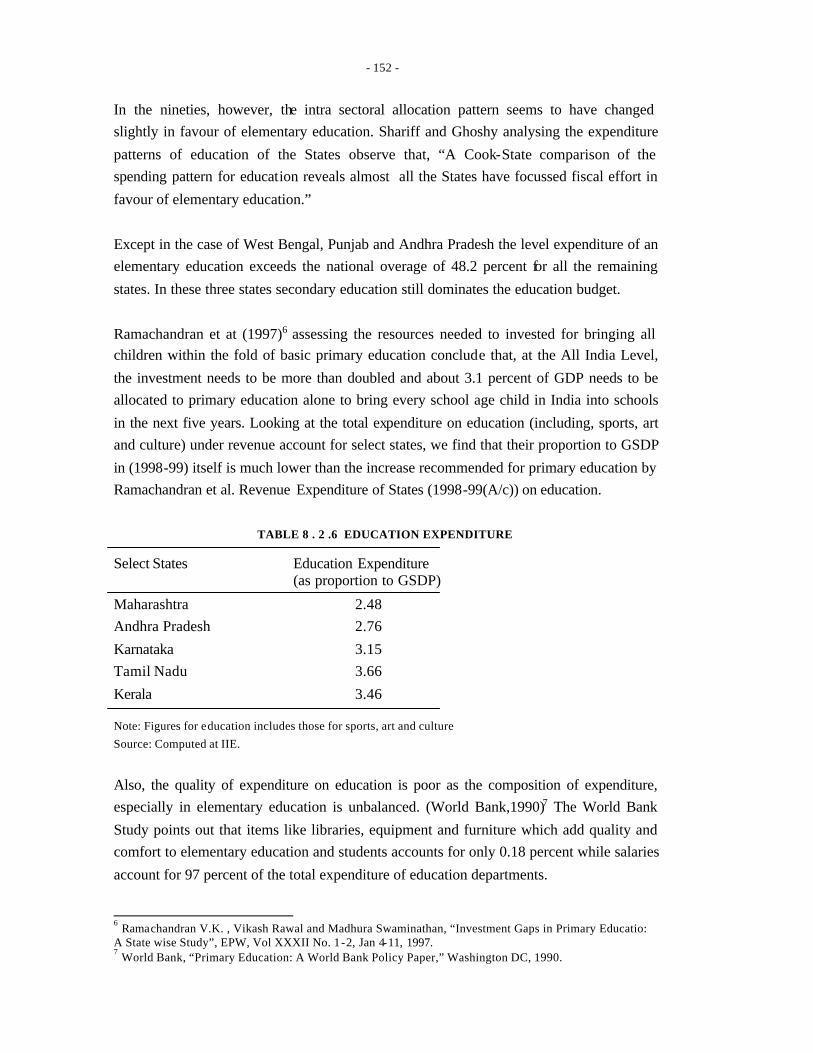
- 152 -
In the nineties, however, the intra sectoral allocation pattern seems to have changed
slightly in favour of elementary education. Shariff and Ghoshy analysing the expenditure
patterns of education of the States observe that, “A Cook-State comparison of the
spending pattern for education reveals almost all the States have focussed fiscal effort in
favour of elementary education.”
Except in the case of West Bengal, Punjab and Andhra Pradesh the level expenditure of an
elementary education exceeds the national overage of 48.2 percent for all the remaining
states. In these three states secondary education still dominates the education budget.
Ramachandran et at (1997)6 assessing the resources needed to invested for bringing all
children within the fold of basic primary education conclude that, at the All India Level,
the investment needs to be more than doubled and about 3.1 percent of GDP needs to be
allocated to primary education alone to bring every school age child in India into schools
in the next five years. Looking at the total expenditure on education (including, sports, art
and culture) under revenue account for select states, we find that their proportion to GSDP
in (1998-99) itself is much lower than the increase recommended for primary education by
Ramachandran et al. Revenue Expenditure of States (1998-99(A/c)) on education.
TABLE 8 . 2 .6 EDUCATION EXPENDITURE
Select States Education Expenditure (as proportion to GSDP)
Maharashtra 2.48
Andhra Pradesh 2.76
Karnataka 3.15
Tamil Nadu 3.66
Kerala 3.46
Note: Figures for education includes those for sports, art and culture
Source: Computed at IIE.
Also, the quality of expenditure on education is poor as the composition of expenditure,
especially in elementary education is unbalanced. (World Bank,1990)7 The World Bank
Study points out that items like libraries, equipment and furniture which add quality and
comfort to elementary education and students accounts for only 0.18 percent while salaries
account for 97 percent of the total expenditure of education departments.
6 Ramachandran V.K. , Vikash Rawal and Madhura Swaminathan, “Investment Gaps in Primary Educatio:
A State wise Study”, EPW, Vol XXXII No. 1-2, Jan 4-11, 1997. 7 World Bank, “Primary Education: A World Bank Policy Paper,” Washington DC, 1990.
- 153 -
Taking the case of Kerala, which has recorded higher social development among states,
percapita expenditure on education has been higher than the all states average and in 1996-
97 was Rs. 166.47 (in current prices) higher than the All States average of Rs. 356.78.
Also the share of education in total social services expenditure has consistently been high.
Many economist feel that this level of social development financing by the State has
preempted investments in economic growth which as a consequence has stagna ted in the
State, as well as being the root cause for the fiscal crisis in the State.
Dr. N.J.Kurien and Joseph Abraham8 writing on the financial crisis of Kerala, State,
“Salary expenditure on a large number of uneconomic government schools (i.e. schools
with a strength of less than 25 per class). Which was 542 in 1995-96 could be saved by
redeployment of the staff of such schools and also by encouraging private schools”.
This Retreat of the State on an arbitrary basis of unavailability , in the social sector of
school education recommended may impact adversely in the future social development of
Kerala. It may be worth while to encourage private investments in terms of sharing in
expenditures for available educational facilities created by the State rather than rationalise
and regroup or close up existing facilities.
Commenting on the same issue K.P. Kannan and Shaji K. Francis, 9 note that “ An oft
repeated question given Kerala’s record in economic growth , is the supposed trade off
between equity (as represented by the share of expenditure for social services ) and
growth. The assumption here is that expenditure on social services represent only
considerations of equity (ie protection and not growth (promotion) . Such a clear cut bias
is not visible in the case of Kerala ….. the question of growth versus equity in terms of the
relative emphasis on social security and other items of expenditure cannot be
meaningfully answered without bringing in a number of other factor that determine
economic growth”. In other words social services expenditure needs to be compressed in
order to increase investment in economic sectors seems a fallacy. In fact social services
expenditure cuts may impact on economic growth indirectly.
Another state which has given importance to elementary education in the recent years is
Tamilnadu by launching a special scheme called “ elementary education movement”
during the year 1999-2000. It gives special attention to children from economically
8 N.J.Kurien and Joseph Abraham, “The Financial Crisis and Analysis” Sage Publication pp.336 in B.A.
Prakash (ed) “Kerala’s Economic Development, issues and problems” 9 Government of Tamil Nadu, “Policy Note on Demand No.17-Education” 2000-01, School Education
Department, Government of Tamil Nadu, 2000.
- 154 -
backward sections and aims at ensuring complete enrollment and retention. It also aims at
improving the infrastructural facilities in elementary schools to achieve its aims apart from
opening new elementary schools and upgrading the existing ones. It aims to provide
access to education facilities to all school age children within one kilometre of their
residences. Tamilnadu also has supplementary programmes like the midday meal
programme to promote their education programmes and improve their efficacy.
Similar efforts are also taken up in other states for instance in Andhra Pradesh which is
still lagging behind in achieving primary education targets has launched special
programmes like ‘Back to School’ programme ,Vidhya Volunteers scheme under the
Jnamabhoomi programmes.
Another aspect which needs attention in making public expenditure on education effective
is by improving utilisation of funds in terms of better organisation of delivery systems.
Quoting Dr.Mahedra Dev’s in this context “ In order to ensure that the governments
promotional and protective programmes have the maximum impact on the poor ,
decentralisation , easy access to information and social mobilisation are important.” Thus
public expenditure management with respect to education in the present post reform
period needs to be looked at not from the point of view of compression and arbitrary
reduction in services but towards effective utilisation of funds by gearing delivery
systems to perform efficiently and through social mobilisation of local communities.
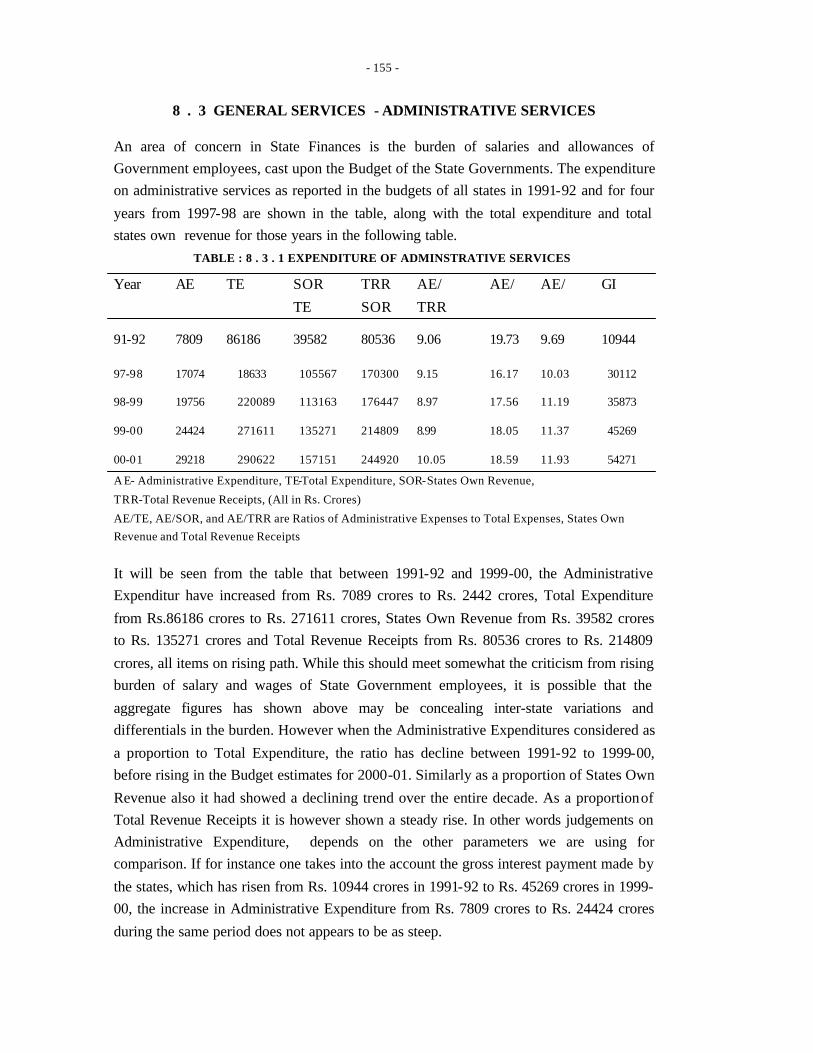
- 155 -
8 . 3 GENERAL SERVICES - ADMINISTRATIVE SERVICES An area of concern in State Finances is the burden of salaries and allowances of
Government employees, cast upon the Budget of the State Governments. The expenditure
on administrative services as reported in the budgets of all states in 1991-92 and for four
years from 1997-98 are shown in the table, along with the total expenditure and total
states own revenue for those years in the following table.
TABLE : 8 . 3 . 1 EXPENDITURE OF ADMINSTRATIVE SERVICES
Year AE TE SOR TRR AE/ AE/ AE/ GI
TE SOR TRR
91-92 7809 86186 39582 80536 9.06 19.73 9.69 10944 97-98 17074 18633 105567 170300 9.15 16.17 10.03 30112 98-99 19756 220089 113163 176447 8.97 17.56 11.19 35873 99-00 24424 271611 135271 214809 8.99 18.05 11.37 45269 00-01 29218 290622 157151 244920 10.05 18.59 11.93 54271
A E- Administrative Expenditure, TE-Total Expenditure, SOR-States Own Revenue,
TRR-Total Revenue Receipts, (All in Rs. Crores)
AE/TE, AE/SOR, and AE/TRR are Ratios of Administrative Expenses to Total Expenses, States Own
Revenue and Total Revenue Receipts
It will be seen from the table that between 1991-92 and 1999-00, the Administrative
Expenditur have increased from Rs. 7089 crores to Rs. 2442 crores, Total Expenditure
from Rs.86186 crores to Rs. 271611 crores, States Own Revenue from Rs. 39582 crores
to Rs. 135271 crores and Total Revenue Receipts from Rs. 80536 crores to Rs. 214809
crores, all items on rising path. While this should meet somewhat the criticism from rising
burden of salary and wages of State Government employees, it is possible that the
aggregate figures has shown above may be concealing inter-state variations and
differentials in the burden. However when the Administrative Expenditures considered as
a proportion to Total Expenditure, the ratio has decline between 1991-92 to 1999-00,
before rising in the Budget estimates for 2000-01. Similarly as a proportion of States Own
Revenue also it had showed a declining trend over the entire decade. As a proportion of
Total Revenue Receipts it is however shown a steady rise. In other words judgements on
Administrative Expenditure, depends on the other parameters we are using for
comparison. If for instance one takes into the account the gross interest payment made by
the states, which has risen from Rs. 10944 crores in 1991-92 to Rs. 45269 crores in 1999-
00, the increase in Administrative Expenditure from Rs. 7809 crores to Rs. 24424 crores
during the same period does not appears to be as steep.
- 156 -
Dr. Rakesh Mohan (Fiscal Correction for Economic Growth, EPW Jun 10th 2000) has in
his analysis of fiscal stress pointed out that the expenditure on government servants has
grown at a lower rate when compared to the GDP growth rate. On the other had critics
have been quick to find out that the increasing in growth rate, was in itself attributable to
the large pay outs on account of pay revision getting reflected in the tertiary sector
growth.
While there are inter-state variations in the salary burdens, two factors seem to make a
considerable difference to the picture (a) commitments on grant- in-aid for salaries of
employees of educational and local body institutions, as also their pensions (b) the
linkage of state government salary scales to the central government pay scale s. While the
first factor seem to be common to more states, it is to be noted that only a few of the state
governments had linked the salary scales of their employees to the central government
pay scales. When the central government accepted the recommendations of the Fifth Pay
Commission, the Finances of these States did come under a serious threat.
Shri. J.L. Bajaj, A Former Finance Official of U.P. and Union Governments had in his
Article, Impact of Pay Revision on State Government Finances, (EPW May 29th 1999
p.1341) had pointed out the major imbalance in the finances of governments of Uttar
Pradesh, Madhya Pradesh and Maharashtra likely to emerge if consequent upon the
recommendation of the Fifth Pay Commission for Central Government employees the
salaries of employees of State Government, aided educational institutions, local bodies
and State Public Enterprises are raised. Placing the likely impact of revision between Rs.
20,000 to Rs. 30,000 crores Shri. Bajaj argued that the manner of financing of
expenditure would be important, and would affect this states which already faced high
level of revenue deficit, fiscal deficit and debt stock. One other point that calls for attention is the differential growth rates in the employees
strength, in Central Governments, State Governments, Quasi Governmental Organisation
and Local Bodies. Significantly enough while the Government of India, have haded only
3.19 lakh employees to its strength between 1976 and 1996, while State Government had
haded 25.88 lakh employees during the same period, with Quasi Government
Organisation having as many as 21.43 employees, as can be seen from the following table
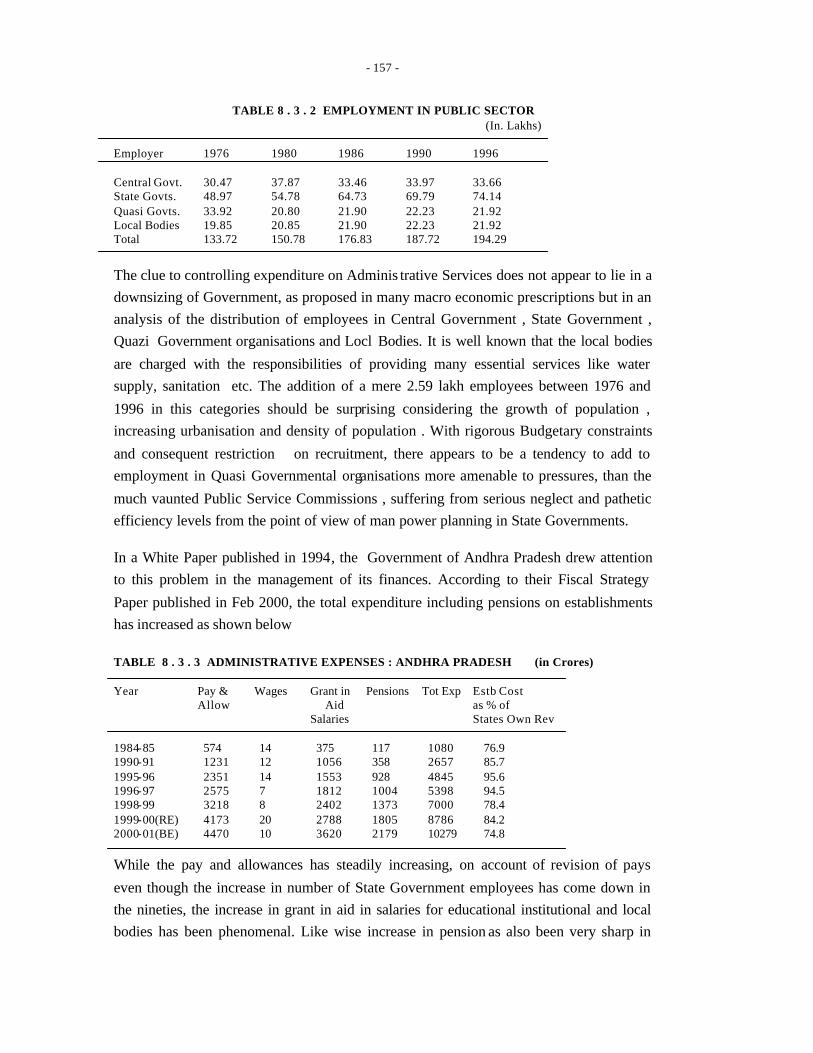
- 157 -
TABLE 8 . 3 . 2 EMPLOYMENT IN PUBLIC SECTOR (In. Lakhs) Employer 1976 1980 1986 1990 1996 Central Govt. 30.47 37.87 33.46 33.97 33.66 State Govts. 48.97 54.78 64.73 69.79 74.14 Quasi Govts. 33.92 20.80 21.90 22.23 21.92 Local Bodies 19.85 20.85 21.90 22.23 21.92 Total 133.72 150.78 176.83 187.72 194.29
The clue to controlling expenditure on Adminis trative Services does not appear to lie in a
downsizing of Government, as proposed in many macro economic prescriptions but in an
analysis of the distribution of employees in Central Government , State Government ,
Quazi Government organisations and Locl Bodies. It is well known that the local bodies
are charged with the responsibilities of providing many essential services like water
supply, sanitation etc. The addition of a mere 2.59 lakh employees between 1976 and
1996 in this categories should be surprising considering the growth of population ,
increasing urbanisation and density of population . With rigorous Budgetary constraints
and consequent restriction on recruitment, there appears to be a tendency to add to
employment in Quasi Governmental organisations more amenable to pressures, than the
much vaunted Public Service Commissions , suffering from serious neglect and pathetic
efficiency levels from the point of view of man power planning in State Governments.
In a White Paper published in 1994, the Government of Andhra Pradesh drew attention
to this problem in the management of its finances. According to their Fiscal Strategy
Paper published in Feb 2000, the total expenditure including pensions on establishments
has increased as shown below
TABLE 8 . 3 . 3 ADMINISTRATIVE EXPENSES : ANDHRA PRADESH (in Crores) Year Pay & Wages Grant in Pensions Tot Exp Estb Cost Allow Aid as % of Salaries States Own Rev 1984-85 574 14 375 117 1080 76.9 1990-91 1231 12 1056 358 2657 85.7 1995-96 2351 14 1553 928 4845 95.6 1996-97 2575 7 1812 1004 5398 94.5 1998-99 3218 8 2402 1373 7000 78.4 1999-00(RE) 4173 20 2788 1805 8786 84.2 2000-01(BE) 4470 10 3620 2179 10279 74.8 While the pay and allowances has steadily increasing, on account of revision of pays
even though the increase in number of State Government employees has come down in
the nineties, the increase in grant in aid in salaries for educational institutional and local
bodies has been phenomenal. Like wise increase in pension as also been very sharp in
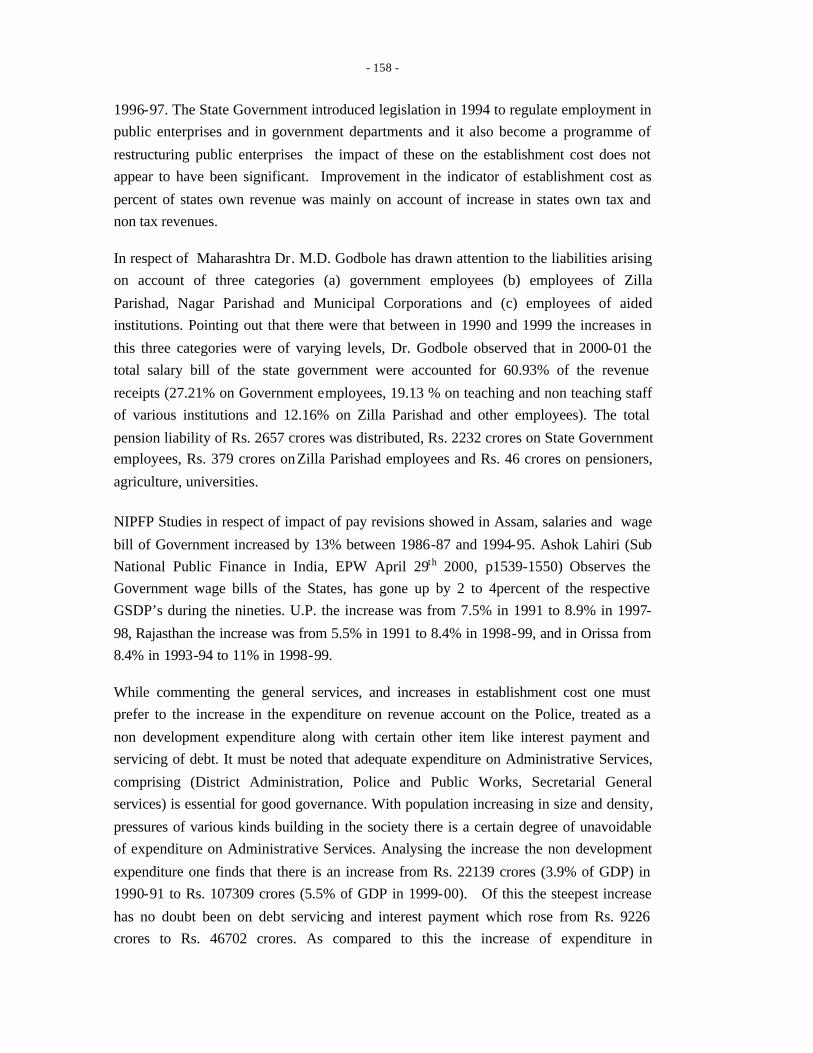
- 158 -
1996-97. The State Government introduced legislation in 1994 to regulate employment in
public enterprises and in government departments and it also become a programme of
restructuring public enterprises the impact of these on the establishment cost does not
appear to have been significant. Improvement in the indicator of establishment cost as
percent of states own revenue was mainly on account of increase in states own tax and
non tax revenues.
In respect of Maharashtra Dr. M.D. Godbole has drawn attention to the liabilities arising
on account of three categories (a) government employees (b) employees of Zilla
Parishad, Nagar Parishad and Municipal Corporations and (c) employees of aided
institutions. Pointing out that there were that between in 1990 and 1999 the increases in
this three categories were of varying levels, Dr. Godbole observed that in 2000-01 the
total salary bill of the state government were accounted for 60.93% of the revenue
receipts (27.21% on Government employees, 19.13 % on teaching and non teaching staff
of various institutions and 12.16% on Zilla Parishad and other employees). The total
pension liability of Rs. 2657 crores was distributed, Rs. 2232 crores on State Government
employees, Rs. 379 crores on Zilla Parishad employees and Rs. 46 crores on pensioners,
agriculture, universities.
NIPFP Studies in respect of impact of pay revisions showed in Assam, salaries and wage
bill of Government increased by 13% between 1986-87 and 1994-95. Ashok Lahiri (Sub
National Public Finance in India, EPW April 29th 2000, p1539-1550) Observes the
Government wage bills of the States, has gone up by 2 to 4percent of the respective
GSDP’s during the nineties. U.P. the increase was from 7.5% in 1991 to 8.9% in 1997-
98, Rajasthan the increase was from 5.5% in 1991 to 8.4% in 1998-99, and in Orissa from
8.4% in 1993-94 to 11% in 1998-99.
While commenting the general services, and increases in establishment cost one must
prefer to the increase in the expenditure on revenue account on the Police, treated as a
non development expenditure along with certain other item like interest payment and
servicing of debt. It must be noted that adequate expenditure on Administrative Services,
comprising (District Administration, Police and Public Works, Secretarial General
services) is essential for good governance. With population increasing in size and density,
pressures of various kinds building in the society there is a certain degree of unavoidable
of expenditure on Administrative Services. Analysing the increase the non development
expenditure one finds that there is an increase from Rs. 22139 crores (3.9% of GDP) in
1990-91 to Rs. 107309 crores (5.5% of GDP in 1999-00). Of this the steepest increase
has no doubt been on debt servicing and interest payment which rose from Rs. 9226
crores to Rs. 46702 crores. As compared to this the increase of expenditure in
- 159 -
Administrative Services from Rs. 7019 crores to Rs. 24424 crores seems moderate. But
within this category the increase in Police expenditure from Rs. 3981 crores to Rs. 14490
crores seems to be relatively large. In other words the share of expenditure on Police
rose from 56.71% to 59.73% of Administrative Expenses. In States like Maharashtra,
Andhra Pradesh not only as the states expenditure on police has increased but special
assistance is being provided to meet naxalite problems
The Tenth Finance Commission which has been required in the terms of reference to
have “due regard to the resources of the central government and the demands there on in
particular on account of expenditure on civil administration, defence and border
security.”, thought that “it should give more than an incidental attention to the assessment
of defence and security related expenditure.” The Commission could not however go
beyond some broad conclusion on manpower cost and related expenditure, defence
pensions, the need for optimum utilisation of available resource by prioritising defence
expenditure, evolving balance between roles of local police and defe nce and para military
forces, before concluding that, “it is not possible for us to go into the myriad aspects of
national security” (see Report on the Tenth Finance Commission, p.62).
Much the same could be the view regarding expenditure on Police, maintenance of
internal security and law and order. However one should be able to draw inferences from
growing unemployment levels, increasing disenchantment among the youth and
increasing crime rate, and militant activity, and raise a broad issue whether in this context
the state governments should pay more attention to maintenance of its own employment
levels, and to creation of employment opportunities outside the government, by suitable
development schemes or commit a greater part of its resources to expend iture on policing
and maintenance of order. This would imply taking a holistic view and taking decisions,
on inter-se priorities of expenditure items in plan and non plan and developmental and
non developmental categories. Such a view should cover all sectors of the economy. It
must be, by now understood, that maintenance of law and order, is as vital to industrial
and economic growth, as offer of incentives to local entrepreneurs and foreign investors.
Revenue foregone or tax expenditure (like sales tax holiday) attract less attention from
fiscal analysis than expenditure on Police and Administrative Services. One needs to
maintain a cautious balance in such matters, affecting order in the community.
- 160 -
IX PROBLEM AREAS IN PUBLIC EXPENDITURE
9 . 1 LEAKAGE AND WASTAGE The enunciation of growth with ‘social justice ‘and alleviation of poverty as the primary
objectives of planned development in the fifties has been followed by the formulation and
implementation of several schemes for the welfare of the weaker section of women and
children , apart from special programmes for self and wage employment in rural and urban
areas. A retrospective view of these schemes , implemented for over four decades , show
that scheme formulation and implementation have three broad based strands differing in
details but aiming at the same objectives . The first is the belief that pursuit of high
economic growth and all round development will improve the levels of living of all
sections of society and enable the weaker sections to be lifted . The second strand is the
proactive formulation and vigorous implementation of anti – poverty and employment
generation schemes for identified target groups to make a sharp dent on poverty. And the
third is according appropriate priority to government expenditure in social sector like
education , Health and family welfare , Labour and Employment , Nutrition , Housing ,
Water supply and sanitation , welfare of SC , ST , BC and minorities.
The first four Five Year Plans were marked by allocations on various heads of
development like agriculture irrigation , industry , etc. Allocation for Regional
Development commenced in the 3rd Five Year Plan. Fourth Five Year Plan was marked
by sharpening of focus , with emphasis on employment in c hronically drought prone areas
, hill areas and special groups for small farmers and marginal farmers. The Nationalisation
of the banks in 1969 , and adoption of New Initiatives for Growth with Social Justice in
1971 spurred the formulation of a number of schemes , some with the area development
approach and others directed towards individual beneficiaries with budgetary provisions
for subsidy or margin money with linkage to credit institutions for individual loans saw
the constitution of agencies like Small Farmer Development Agency , as also schemes like
crash scheme for rural employment and food – for –work programme. The fourth and the
fifth Five Year Plans were marked by restructuring of schemes for asset creation and
income generation in the rural areas .
It was from the Sixth Five Year Plan that specific plan allocations for rural development
as an head of development commenced and has continued since then . With this sector
major programmes were marked by refinement of objectives , and redesigning of patterns
of assistance , even while the quantum of allocation in the central and the state plans
increased enormously. Simultaneously greater attention was also paid to the allocations in
the Social Services sector covering Education , Health and Family Planning , Housing and
Urban Development and other Social Services.
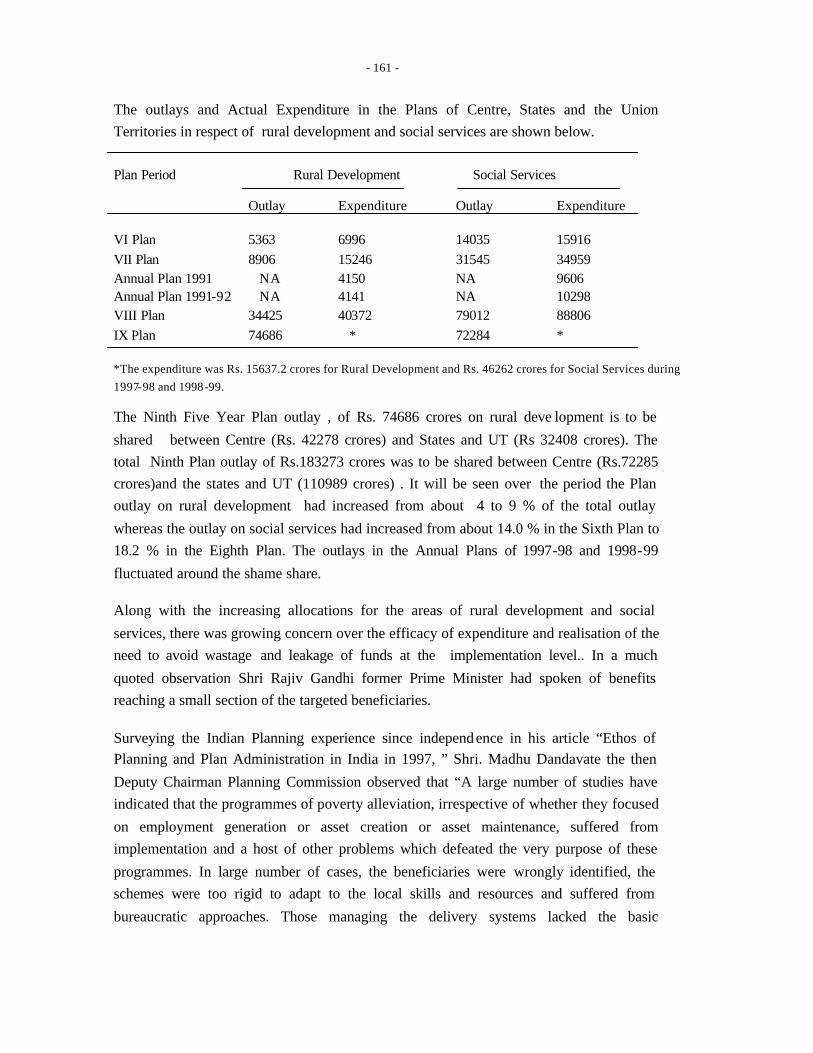
- 161 -
The outlays and Actual Expenditure in the Plans of Centre, States and the Union
Territories in respect of rural development and social services are shown below.
Plan Period Rural Development Social Services Outlay Expenditure Outlay Expenditure VI Plan 5363 6996 14035 15916
VII Plan 8906 15246 31545 34959 Annual Plan 1991 NA 4150 NA 9606 Annual Plan 1991-92 NA 4141 NA 10298 VIII Plan 34425 40372 79012 88806
IX Plan 74686 * 72284 * *The expenditure was Rs. 15637.2 crores for Rural Development and Rs. 46262 crores for Social Services during
1997-98 and 1998-99.
The Ninth Five Year Plan outlay , of Rs. 74686 crores on rural deve lopment is to be
shared between Centre (Rs. 42278 crores) and States and UT (Rs 32408 crores). The
total Ninth Plan outlay of Rs.183273 crores was to be shared between Centre (Rs.72285
crores)and the states and UT (110989 crores) . It will be seen over the period the Plan
outlay on rural development had increased from about 4 to 9 % of the total outlay
whereas the outlay on social services had increased from about 14.0 % in the Sixth Plan to
18.2 % in the Eighth Plan. The outlays in the Annual Plans of 1997-98 and 1998-99
fluctuated around the shame share.
Along with the increasing allocations for the areas of rural development and social
services, there was growing concern over the efficacy of expenditure and realisation of the
need to avoid wastage and leakage of funds at the implementation level.. In a much
quoted observation Shri Rajiv Gandhi former Prime Minister had spoken of benefits
reaching a small section of the targeted beneficiaries.
Surveying the Indian Planning experience since independ ence in his article “Ethos of
Planning and Plan Administration in India in 1997, ” Shri. Madhu Dandavate the then
Deputy Chairman Planning Commission observed that “A large number of studies have
indicated that the programmes of poverty alleviation, irrespective of whether they focused
on employment generation or asset creation or asset maintenance, suffered from
implementation and a host of other problems which defeated the very purpose of these
programmes. In large number of cases, the beneficiaries were wrongly identified, the
schemes were too rigid to adapt to the local skills and resources and suffered from
bureaucratic approaches. Those managing the delivery systems lacked the basic
- 162 -
commitment towards the potential beneficiaries. Outcome of all these was leakages and
less than optimal results.
“Not only in the context of poverty alleviation programmes , but also other schemes as
well, there is a widespread feeling that the benefits intended to be delivered to the people
through development programmes in various social sectors have not fully reached the
beneficiaries because of the weakness in administrative planning and the delivery
mechanism.” (Indian Journal of Public Administration Oct-Dec 1997 Vol-XLIII no.4 Pg
870)
In a survey of “Fifty years of Indian Administration -Retrospect and Prospects” published
by the I.I.P.A Dr. P.R. Dubhashi, argues that “the mixed economy and state directed
development did not deliver the goods” and more specifically, among other things,
“programmes of Rural Development suffered from leakage and inefficiency and could not
attain the objective and Sri C.V. Raghavulu points out the Resource misuse for subsidies
and “Give Away Schemes,” arguing that “Time and again state governments have used
state resources in a profligate manner by providing indirect subsidies such as lower water
and power rates…….. Schemes, such as the subsidized rice scheme (Andhra Pradesh) and
the mid day meals programmes (Tamil Nadu) though targeted at the poor or illiterate were
considered by many as an integral part of the process of political moblisation. Over the
years, there have been several instances of give aways, ‘ besides tax concession in
response to lobbying by organised interests.” Raghavulu also argued that “economic
policy in the context of social pluralism has favoured the better organised or more affluent
groups which have been more influential in shaping the policy agenda than the
unorganised or under organiser poor. Naturally a larger proportion of the benefits from
state resources were cornered by the better off sections. Employees in the organised sector
Doctors, Professionals and Labour in the Industrial Sector have benefited more from
interest group activity than have landless labourers, small farmers, and workers in medium
and small scale industries in the private sectors and unorganised economy (see Indian
Journal of Public Administration July-Sept 1997, pg 364 and pg 485).
Self Employment
In the light of such observations it may be instructive to go over this vast area and gather
lessons for Public Expenditure Management from the evaluation studies and the Audit
Reports in respect of self employment and wage employment schemes.
Since 1969-70 a large number of poverty alleviation and the employment generation
schemes have been launched by the Government of India to be implemented by the
various state governments and specially constituted agencies. Main feature of this schemes
- 163 -
is a provision of package of assistance consisting of subsidy or margin money to be
provided by government and a loan to be provided by the bank or credit institutions to
enable the beneficiary to acquire productive assets like milch animals or machinery and
tools. The schemes included provision of training to trainees , supply of tools to rural
artisans and special packages for women and children in rural areas.
After more than a decade of implementation of these major anti poverty and employment
generation schemes like the Integrated Rural Development Programme (IRDP),
(TRYSEM), (DWACRA), (SITRA), Govt of India had in 1990 evaluation revealed that
poor individual beneficiary without any skill or experience could not improve his income
while those who did succeed possessed better skills and that the programmes, even within
the sector of rural development lacked integration. This had resulted in the merger of all
these programme of Swarna Jayanti , Gram Swarozgar Yojana from 1st April 1999. But
even this scheme depended on the coordination between credit institution and their
developmental agencies.
Wage Employment
Provision of short-term wage employment in public works was attempted through Food
for Work programme initiated in the seventies, National Rural Employment Programme
(NREP), and Rural Landless Employment Guarantee Programme (RLEGP). The official
agencies felt that large expenditure made in the schemes did not provide adequate returns
in terms of durable and useful assets, and sizable part of fund were utilised in
administrative overheads. As a result NREP, and RLEGP were merged into a single
scheme Jawahar Rozgar Yogana in April 1989 and even this was subjected to change in
pattern of assistance from 1993-94. A concurrent evaluation carried out by the Ministry of
Rural Development during 1993-94 across several states like Punjab , AP, Bihar ,
Kernataka ,Kerala, and U.P. showed that the scheme did provide 11 days of employment
out of 30 but the selection of beneficiaries was marked by a large number of non poor
beneficiaries. ‘The implementation experience also brought out the basic question whether
priority should be given to employment generation or asset creation, and whether
emphasis should be on creation of assets for individuals or on community and socially
productive assets.
A review of the schemes indicated that while conceptualisation of the various schemes
were made in Delhi mostly of the Rural Development Ministry and Planning Commission,
with laudable objectives, the implementation was largely the responsibility of the state
government and further down the line of the District Rural Development Agencies and the
Zilla Parishads.
- 164 -
According to studies, between 1980-81 and 1998-99, 54 million house holds have been
provided assistance under the IRDP and related schemes with average level of investment
for beneficiary house hold rising from Rs. 3000 during the period 1980-85 to Rs. 9000
during 1992-95 and about Rs. 18000 during 1998-99 . Nearly 40% of the assistance is said
to have been by way of Government Subsidy. Assessment of the programme shows that
the implementation has reached the poor and among slum the more disadvantage groups
like SC/ST’s beneficiaries. According to Government of India evaluation of 1990, 47% of
the assistance families belong to the SC/ST groups , and 54.4% of the families were able
to cross the old poverty line of Rs. 6400 and 15.96% of the beneficiaries crossing the
revised poverty line. The evaluation brought out the crucial point regarding the rate of
success of the schemes, being high when the beneficiaries had certain skills are could be
organised as a group. There were also doubts weather IRDP beneficiaries were relatively
more indebted than others sections of the poor. The absence of integration between the
IRDP and other schemes like TRYSEM and SITRA.
The Comptroller and Auditor General has covered the schemes in his report no.3 of 1995
and report no.3 of 2000. The latter report indicated that the performance audit of JRY and
Employment Assurance schemes in 25 states revealed short comings in critical areas of
targeting, adequacy of resources leading to insignificant employment generation, fictious
reporting of employment generation and asset creation. According to the CAG Report,
between the Fifth Plan 1977-80 and Annual Plan 1998-99, the allocation for Centrally
Sponsored Employment generation schemes by food for work, NREP, RLEGP, JRY, and
EAS was Rs. 50,715 crores and the total expenditure by the Union and the State
Governments was Rs. 48,821 crores of this of the expenditure JRY and EAS accounted for
Rs. 41,090 crores during the ten year period between 1989-99. CAG office availed the
services of the private agency, ORG-MARG were carrying out the survey during Aug-Oct
1999 covering 141 districts 296 blocks and 2,106 villages covering a sample of 15,106
EAS beneficiaries, 20,454 JRY beneficiaries and 82788 potential beneficiaries. The
survey revealed distortions in targeting owing to absence of a system of registration for
job seekers, non issue of family cards, employment of human being lower than prescribed
norms in adequate allocation of resources to complete the works taken up in the release of
funds to the execution agencies, diversion of funds of Rs. 2178 crores to other activities
and deposit of Rs. 1747 crores in personal deposit accounts, non utilisation of Rs. 754
crores, excessive administration expenditure. According to the survey the average number
of days of employment provided to each Below Poverty Level (BPL) worker or
employment seeker was insignificant and ranged between 7 and 21 days under JRY under
9 and 18 days under EAS. Similiar problems of non-maintenance of muster rolls and
payment of wages at lower than prescribed rates, and non-observance of prescribed
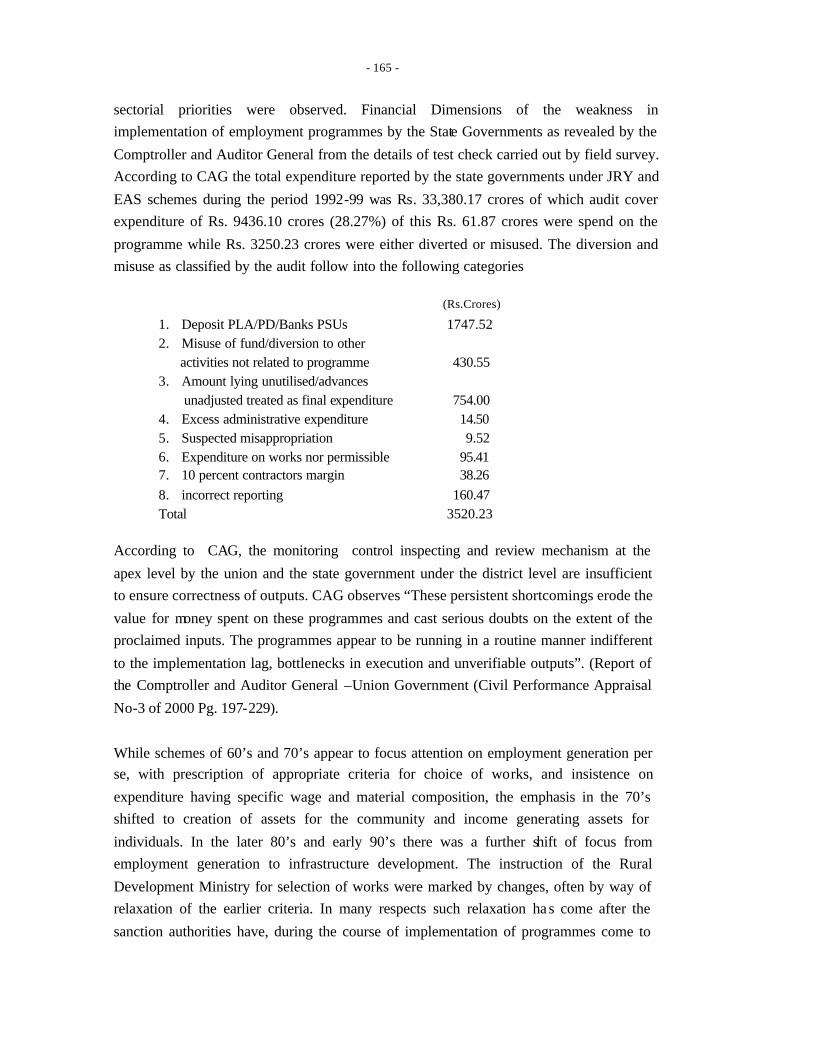
- 165 -
sectorial priorities were observed. Financial Dimensions of the weakness in
implementation of employment programmes by the State Governments as revealed by the
Comptroller and Auditor General from the details of test check carried out by field survey.
According to CAG the total expenditure reported by the state governments under JRY and
EAS schemes during the period 1992-99 was Rs. 33,380.17 crores of which audit cover
expenditure of Rs. 9436.10 crores (28.27%) of this Rs. 61.87 crores were spend on the
programme while Rs. 3250.23 crores were either diverted or misused. The diversion and
misuse as classified by the audit follow into the following categories
(Rs.Crores)
1. Deposit PLA/PD/Banks PSUs 1747.52 2. Misuse of fund/diversion to other activities not related to programme 430.55 3. Amount lying unutilised/advances unadjusted treated as final expenditure 754.00 4. Excess administrative expenditure 14.50 5. Suspected misappropriation 9.52 6. Expenditure on works nor permissible 95.41 7. 10 percent contractors margin 38.26
8. incorrect reporting 160.47 Total 3520.23
According to CAG, the monitoring control inspecting and review mechanism at the
apex level by the union and the state government under the district level are insufficient
to ensure correctness of outputs. CAG observes “These persistent shortcomings erode the
value for money spent on these programmes and cast serious doubts on the extent of the
proclaimed inputs. The programmes appear to be running in a routine manner indifferent
to the implementation lag, bottlenecks in execution and unverifiable outputs”. (Report of
the Comptroller and Auditor General –Union Government (Civil Performance Appraisal
No-3 of 2000 Pg. 197-229).
While schemes of 60’s and 70’s appear to focus attention on employment generation per
se, with prescription of appropriate criteria for choice of works, and insistence on
expenditure having specific wage and material composition, the emphasis in the 70’s
shifted to creation of assets for the community and income generating assets for
individuals. In the later 80’s and early 90’s there was a further shift of focus from
employment generation to infrastructure development. The instruction of the Rural
Development Ministry for selection of works were marked by changes, often by way of
relaxation of the earlier criteria. In many respects such relaxation ha s come after the
sanction authorities have, during the course of implementation of programmes come to

- 166 -
appreciate specific field level difficulties and the need to extend the scope of the
programme to cover broader objective of Public Expenditure Management like utitisation
of funds for development of social infrastructure rather than for individual or community
assets. In this process there has been a dilution of verifiable conditions related to the
quality of execution. While the earlier insistence on a very high labour intensity marked
by the high wage component, militated against minimum level of techno -economic needs
of engineering, like use of mechanical equipment for achieving compaction and
consolidation of earth work. The relaxation of the later yea rs, appear to move in the
direction of reducing employment generation as a secondary objective.
The expenditure under the JRY and EAS were to be shared by the union and state
governments the ratio of 80 : 20. While formulation of schemes at the national level have
perforce to be guided by uniformity of pattern and commonality of approach, the
implementing agencies have to face vastly different field conditions, marked by
differences in resource endowment , of the areas, different level of social and technical
infrastructure apart from the levels of efficiency and supervisory systems. One aspect that
is not kept in view by the authorities is the need for a certain degree of continuity of
programmes over a period. Frequent changes in the concept, and pattern of
administration, weakens the chain of command and pattern of supervision while creating
doubts at the field level, particularly the identification of the beneficiaries and the nature
and level of assistance to be provided. While the federal system of administration can to
some extent accommodate the dual responsibilities for funding developmental schemes,
with union and state governments bearing their respective shares in a predetermined
pattern, the administration of these schemes with multiplicity of controls, by Central,
State Governments and Zilla Parishads appears to have diluted both efficiency of physical
implementation of programmes and financial accountability.
Yet another systemic factor leading to be weakness is that the Government of India began
to release funds directly to the DRDA without routing it through the state government.
While the state government was expected to release its share with in 20 days of release of
central government there were often time gaps in coordinating this aspect. The field
agencies who should normally be concentrating on site inspection and monitoring of
physical progress often spent their time coordinating administrative aspects of obtaining
release from dual sources. The decision to release funds directly to the DRDA’s appear to
have been dictated by two reasons –one to ensure that the central funds released for
implementation of schemes are not held up by cash starved state governments without
releasing to the field agencies, and two, to ensure that the credit for funding schemes for
popular benefit goes to the political parties holding power in the centre rather than to the
- 167 -
political parties holding power , at the state level. The decision could also have been
prompted by the fact that some of the state governments began to utilise central scheme
funds for schemes designated differently giving a misleading impression that the state
government and political parties at the government were responsible for the
conceptualisation and financing of the schemes. Political overtones and patronage
aspects appear to have been affecting pattern and release of funds.
While the multiplicity of the reasons, some valid and other not so dictated the changes in
the scope , focus , pattern of financing , pattern of release, and administration and
monitoring of schemes, the trend appears to have been the shift form emphasis on
verifiable physical criteria in the choice of works to convenient financial criteria of
allocation for block of DRDA as units of implementation. Thus reporting expenditure in
some form or the other rather than reporting the completion of works became the
practice. The emphasis on supervisory machinery appears to have shifted to financial
rather than physical aspects of the programme the constraint of the budget of the union
and the state coupled with ambition to cover larger number of beneficiaries and new areas
, appears to have contributed to this shift. The inability of the Union Ministry to take into
account the diversity of field condition in a country of sub continental dimensions,
appears to have played its own silent role in this shift. The increasing tendency to involve
institutional finance from commercial and cooperative credit institution as also the non
governmental organisations in self employment schemes as part of an exercises of
mobilisation of local resources added its own weight in engineering the shift. Economic
Reforms of the nineties emphasise a philosophy of withdrawal of State, and promotion of
privatisation ,but the time phasing of this withdrawal have not been structured and built
into the pattern of administration of programmes. The emphasis on targeting of the
relatively more vulnerable groups like SCs ,STs , BCs and minorities led to the formation
of a number of new organisation to deal exclusively with the target groups in addition to
the DRDA’s. As a result, multiplicity of agencies and increase in the number of tiers of
administration, with an near confrontation approach of official and non official agencies
appears to be creating at the field a situation popularly referred to as “too many cooks”.
Much of what is perceived as wastage could well be resources absorbed by not only
intermediate agencies like contractors but also increasing overheads on the salaries and
travel of officials and members of committees.
- 168 -
PUBLIC DISTRIBUTION SCHEME
Another important scheme directed towards poverty alleviation is the public distribution
system with emphasis on ensuring regular and assured supplies of essential commodities
at affordable prices to the public. Commencing with the system of rationing scarce
commodities in post world war days to ensure wider availability , management of civil
supplies became much more organised in the 60’s and 70’s. The establishment of Food
Corporation in India in the mid sixties and the various state Civil Supplies Corporation
have enabled the build up of a vast network of food management system discharging the
twin functions of procurement of food grain and essential commodities from the producers
in the rural areas and ensuring their distribution to people through widely spread fair price
shops all over the country.
As summed up by the Comptroller and Auditor General in his Report of 2000, “ The
P.D.S with the focus on distribution of food grains in urban scarcity areas had emanated
from the critical food shortages of the 1960’s. It has since then substantially contributed to
the containment of rise in food prices and ensured access of urban consumer to food. As
the national agriculture production had grown in the aftermath of the green revolution, the
outreach of PDS was extended to rural areas, tribal blocks and areas of high incidence of
poverty in the 70s and 80s. Currently, its focus is on the poor in all areas. The Ninth Plan
(1997-2002) targets primarily people below the poverty line and has enunciated a broader
view of food security, which also includes nutritional security by ensuring availability,
accessibility, acceptability and affordability of balanced food and nutrition for all. With
the increased availability of food, another dimension was added to the PDS. This was to
sustain the high level of food production by fixing minimum support prices at which Food
Corporation of India procured from the farmers. PDS, thus became an instrument for
sustaining the food production as well as for subsidised supply of food grains to
consumers”. (Report of Controller and Auditor General, Union Government
,Performances Appraisal No-3, 2000 Pg. 4)
According to the Ministry of Food and Consumer Affairs the re were in 1999, a total of
4,55,055 fair price shops, with 3,64,385 shops in the rural areas and 90,870 shops in the
urban areas. These fair price shops covered 19.12 crore persons holding ration cards, of
whom 11.92 crores persons were above poverty line and 7.20 crores were below poverty
line. The procurement operations cover 11 crore operational holdings. According to one
estimate, the public distribution scheme handles 15 percent of the total availability of rice
and wheat. PDS costs about 0.5% of GDP and 6% of Central Government Revenue.
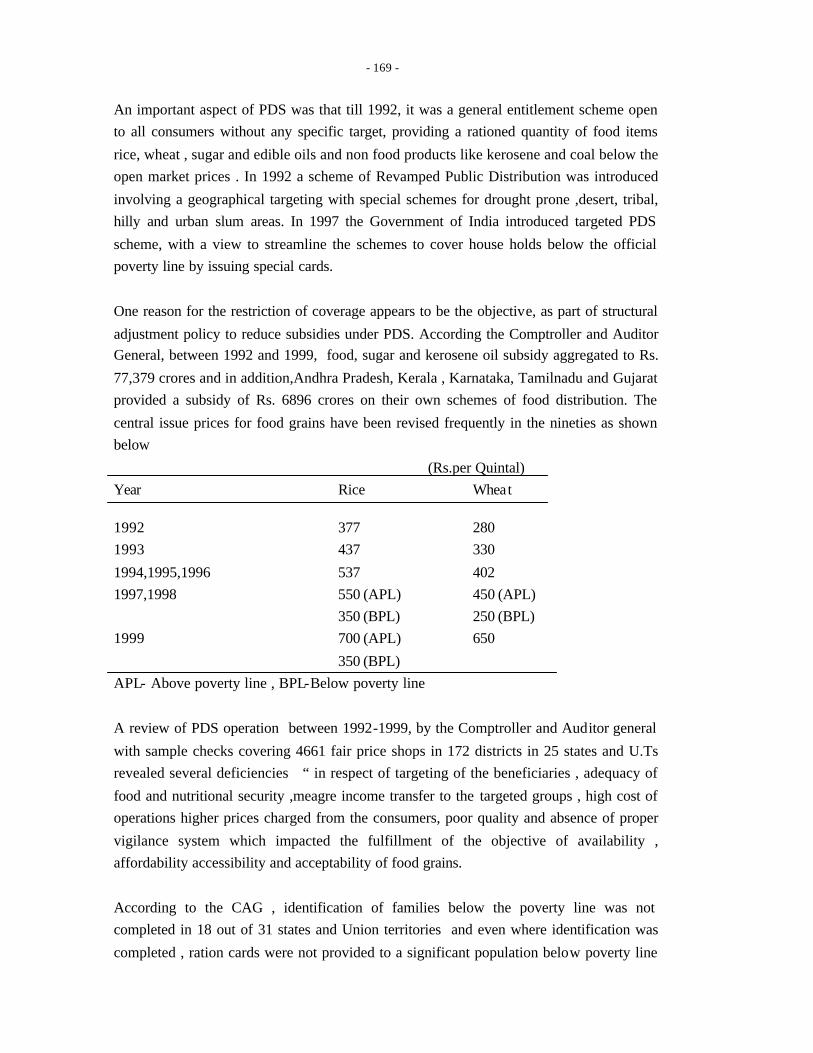
- 169 -
An important aspect of PDS was that till 1992, it was a general entitlement scheme open
to all consumers without any specific target, providing a rationed quantity of food items
rice, wheat , sugar and edible oils and non food products like kerosene and coal below the
open market prices . In 1992 a scheme of Revamped Public Distribution was introduced
involving a geographical targeting with special schemes for drought prone ,desert, tribal,
hilly and urban slum areas. In 1997 the Government of India introduced targeted PDS
scheme, with a view to streamline the schemes to cover house holds below the official
poverty line by issuing special cards.
One reason for the restriction of coverage appears to be the objective, as part of structural
adjustment policy to reduce subsidies under PDS. According the Comptroller and Auditor
General, between 1992 and 1999, food, sugar and kerosene oil subsidy aggregated to Rs.
77,379 crores and in addition,Andhra Pradesh, Kerala , Karnataka, Tamilnadu and Gujarat
provided a subsidy of Rs. 6896 crores on their own schemes of food distribution. The
central issue prices for food grains have been revised frequently in the nineties as shown
below
(Rs.per Quintal)
Year Rice Wheat
1992 377 280
1993 437 330
1994,1995,1996 537 402
1997,1998 550 (APL) 450 (APL)
350 (BPL) 250 (BPL)
1999 700 (APL) 650
350 (BPL)
APL- Above poverty line , BPL-Below poverty line
A review of PDS operation between 1992-1999, by the Comptroller and Auditor general
with sample checks covering 4661 fair price shops in 172 districts in 25 states and U.Ts
revealed several deficiencies “ in respect of targeting of the beneficiaries , adequacy of
food and nutritional security ,meagre income transfer to the targeted groups , high cost of
operations higher prices charged from the consumers, poor quality and absence of proper
vigilance system which impacted the fulfillment of the objective of availability ,
affordability accessibility and acceptability of food grains.
According to the CAG , identification of families below the poverty line was not
completed in 18 out of 31 states and Union territories and even where identification was
completed , ration cards were not provided to a significant population below poverty line
- 170 -
families .On the other hand this adversely affected the offtake from PDS and the lifting of
stocks from FCI godown and state Government agencies. In a chain effect this has led to
increase in the stocks held by the food corporation of India , which had reached on Oct 1st
, 2001, 58.28 Million tonnes (21.45 million tonnes of Rice and 36.82 million tonnes of
wheat )as against the buffer stock requirement do 18.1 million tonnes ( 6.5 million tonnes
of rice and 11.6 million tonnes of wheat ) . A number of important issues have been raised
in this regard including the transfer of procurement responsibility and introduction of a
new scheme of income support to farmers rather than the present system of product
support through procurement by public agencies at Minimum Support prices. CAG report
concludes that “ the guaranteed procurement at Minimum Support price benefited the
farmers , the system did not benefit the general public and much less the people below
poverty line …” and that “ the PDS was not the preferred source of the food grains by the
general public . The prices of food grains from the fair price shop for the general public
was higher than the market price especially during the harvesting season . The general
public and also people below poverty line depended on PDS only for a small portion of
their requirement .”
The Mid Term Appraisal of the Ninth Five Year Plan has pointed out that “Despite hefty
increase in the annual food subsidy from Rs. 2,450 crores in 1990-91 to Rs. 9,200 crores
in 1999-00, all is not well with Public Distribution System in India. There is 36%
diversion of wheat, 31% diversion of rice ad 23% diversion of sugar form the system at
the national level. TPDS does not seem to be working in the poorest North and North-
Eastern States; The allocation of poorer states such as UP, Bihar and Assam got more than
doubled , as a result of shifting to TPDS, yet due to poor off- take by the States and even
poorer actual lifting by the BPL families , the scheme has not made any impact on the
nutrition levels in these States; There is lack of infrastructure and shortage of funds with
government organization in most States except the few in West and South. Adequate
infrastructural capacity, in addition to funds, should be ensured at the district and block
levels, otherwise wasting scarce resources through leakages helps only contractors and
corrupt Government staff, and does not in any way help the poor” (Planning Commission
Oct. 2000)
While the PDS provides a degree of food security to some sections of the population there
are doubts whether the benefits commensurate with the cost of running the system. The
principal criticism relates to lack of targeting. The PDS is accused of two kinds of
targeting errors, errors of exclusion and errors of failure to reach the target population and
inclusion of non eligible persons. A number of studies have been made by academic and
other agencies to analyse the efficacy and coverage of the public distribution scheme, and
- 171 -
to highlight the regional variations in the coverage and implementation of the scheme.
Bhaskara Datta and Bharath Ramaswamy (‘Targeting and efficiency in the public
distribution system’ EPW May 5th 2001) argue that ,”While large number of poor do not
have access to the PDS, there is on the other hand, little or no attempt to deny access to the
affluent”
While there is a general impression that the Public Distribution System is marked by a
high degree of leakage and wastage , it is necessary to take into account, the vastness of
the system spread in several states covering nearly 20 crores card holders , and in
particular the nature of leakage and the levels at which this takes place . In a study of the
Social Security System in Andhra Pradesh , S.Indrakant and M.C Swaminathan cover the
food security system and in particular the utilisation of PDS , by the card holders varying
with different degrees of dependence for different items like rice and Sugar and kerosene
.60 % for rice and sugar and 65 % for kerosene in rural areas . 50 % for rice and kerosene
and 70 % for sugar in the urban areas. They have also analysed three levels at which
leakages take place in the PDS stating that , “due to the policy of delivery of foodgrains at
the door steps of FPS the leakages at the fir st level, i.e. at the FCI godown level, is
minimal in the existing PDS network. The system of delivering the foodgrains at the
doorstep of the fair price shop appears to be working reasonably well in most parts of the
state. In Uttar Pradesh and Bihar, the FPS dealers have to lift their own expense.
Consequently, leakages at the first level is high and often the food grains do not reach the
villages.
The leakages at the second stage, i.e, village or town level, in Andhra Pradesh is likely to
be substantia l. The income of FPS dealers is very low . The dealer’s gross margin per
month varies in the range of Rs. 700-1165 (Indrakant, 1996). The FPS dealers tend to
increase income through bogus cards, diversion of quantities not taken by card holders,
etc. Venugopal (1992) found that in 1986, the number of ration cards in circulation (139
lakhs) exceeded the estimated number of house holds (121 lakhs) by about 15 percent or
by 8 lakhs. The leakages at the third level, i.e., household level, is not likely to be much
because the price of rice in the fair price shop is much lower than the open- market price of
coarse cereals.” ( S.Indrakant and M.C Swaminathan , ‘Social Security in Andhra
Pradesh’, in ‘Social and Economic Security in India’ , Edited by S.Mahedradev et.al ,
Institute for Human Development , 2001 pg 469-470)
Referring to the benefits of the PDS and costs on account of errors of targeting and other
aspects, the authors after a survey of selected villages have concluded that the benefits
match the cost of implementation of the schemes in certain villages while in others the
- 172 -
cost exceed the benefits and conclude that the impact of the PDS is not uniform across the
selected villages and the developed villages seem to have benefited more than the
backward villages .
Certain studies in respect the per capita gain per annum for PDS beneficiaries in relation
to open market prices have been made by Dr.R.Radha Krishna , Indrakant , Kirit Parekh ,
Stephen Howes and Shikha Jha , K.Hanumatha Rao and Jayashree. But these fine tuned
statistical calculations do not adequately bring out the magnitude of administrative
problems in operating a vast system spread across several states and covering 20 crore
ration card holders and the implications of introducing criteria like poverty line for
inclusion or exclusion of beneficiaries. It has emerged from several studies that the
poverty line estimates have their own limitations , including the number of people below
poverty line as per the Official methodology and the Lakdhawala Committee estimates
and their methodology .Resort to these concepts , can provide a broad measure of logic in
resource allocations at macro level but their application at the micro level for segregating
groups of beneficiaries in publicly funded schemes can lead to avoidable apprehensions
regarding proper utilisation and possible leakages if any .
As Madhura Swaminathan and Neeta Mishra have pointed out , the targeted PDS ignores ,
or does not take into account certain costs arising out of errors of exclusion and errors of
inclusion, and on the basis of a study of Maharashtra village they argue that there are
pitfalls in identifying the target group based on a income indicator in the context of
variability of employment for majority of workers in the country and associated
fluctuation in the incomes and consumption .Citing data of NSS survey of consumption in
1997 they argue , that around 70 to 80 % of rural population is eligible for food subsidy
programme and in such a situation targeting can impose high costs . The costs of
administering a targeted programme that excludes 20 or 30 % of the population , when
many of them may self select out of the programme will be high . At the same time , the
welfare costs due to targeting errors will rise. I n short it makes economic sense to provide
universal coverage and assume that the better off households will voluntarily opt out of
the scheme. “(Errors of targeting Public Distribution of Food in a Maharashtra Village
1995-2000, EPW, June 30, 2001 Pgs 2447-2454)
Such fine tuned analysis providing useful insights for the policy maker , can help in
restructuring the existing schemes , to eliminate some of the deficiencies pointed out by
the CAG’s review of Management and implementation of the PDS , the Re vamped PDS
and the Targeted PDS . While the structural adjustment policy and fiscal consolidation
measure have moved in the direction of reducing budgetary implications of subsidies in
- 173 -
the public distribution system , it may not be meaningful to carry them to such an extent as
to lead the system to another set of errors. The scheme as a whole , can be said to have
made useful contribution to increase the availability affordability and accessibility of food
grains , but there are still questions on the acceptability of quality. Frequent revisions of
criteria an introduction of restrictive clauses mainly with a view to reduce the budgetary
outgo of subsidies often affects , the quality of implementation of the schemes. For
instance while the PDS had universal coverage , the introduction of the TPDS restricting
issue of grains to people below poverty line and a simultaneous increase of issue price of
food grains have adversely affected the PDS .
Much of the discussion on food subsidy and its burden is taking place in an environment
of abundant faith in the market mechanism while the past experience has been that the
traders have not hesitated to place the profits above the minimum needs of the consuming
public and hold them to ransom during periods of shortage.
The ORG survey conducted in 1999 ,covering 64292 households (43205 in rural areas ,
21807 in Urban areas ) in 1223 villages and 285 towns spread in 140 districts, made
observations relating to the issue price of grains after several revisions . Even in 1999 rice
was made available to people below the poverty line , well below the market prices It also
ignores the fairly reliable system of interstate transfers of food grains from producing
states like Punjab , U.P, and Andhra Pradesh to the deficit states like Kerala , Maharashtra
,Rajasthan , and the North Eastern states. Such a system has also enabled some states like
Kerala to concentrate on commercial and plantation crops with export potential and
foreign exchange earnings. Thanks to the PDS the spectre of drought as and when it
emerges , is today not as frightening as it was in the sixties . We have moved from the
days of famine and food shortages to the days of mere adverse seasonal conditions
affecting farm operations in specific regions with the demand on the Centre to provide
relief by way of financial support for employment schemes and food grains allotment .
This qualitative change marking the Indian Economy , appears to have been overlooked in
the undue anxiety about reduction of subsidies and budgetary support for food
management system . Some errors of management of the food system appear to get
magnified through the lenses of audit with focus on the areas of flaws and ignoring the
areas of strengths of the system., It may be easier to address the persistent weakness in the
system rather than to bring down the existing structure and build a new one of income
support to farmers. And in due course of time we will have another Audit party pointing
out leakages and misdirection of income support.
- 174 -
It is forgotten that while the PDS has some weaknesses , it acts as a moderator of the
market mechanism , which when left to itself can manipulate the demand supply situation
to its advantage and to the detriment of the consumer , both in terms of price and
availability . The mere availability of a choice of grains from the PDS keeps the trader on
check and controls extreme fluctuations in prices. In years of surplus production there is
bound to be some degree of glut , which had in the past got evened out in the years of
drought in some parts of the country. The prescription of an income limit for access to the
PDS stocks and the increase in the issue price in from the FCI with consequent increase in
the rate of retail shop , has contributed to the present high level of stocks in the FCI. The
introduction of the food for work programme , to reduce the stocks may to some extent
relieve the pressure but this pressure could have been avoided had the PDS continued to
be universal in application and the increase in issue price been made more gradual .The
availability of a larger base of consumers would have enabled liquadation of the available
stock and quicker realisation of the invested capital even with a marginal increase in the
issue price .
Those critical of the Public Distribution system appear to forget that the scheme with the
universal coverage had provided the regular supplies to nearly 20 crores consumers while
the back up procurement operations of FCI and the state agencies had extended to 11
crores operational hoardings. It is possible that in the misconceived efforts to reduce
budgetary burden for food subsidy government may be introducing not only uncertainty
in availability and prices of food grains but also depriving the farmer of a fairly simple
system of marketing with out the hassles and agony caused by private rice millers and
traders . It is difficult to financially weigh the options of providing assurance to the
consumers and farmers with the state bearing a measure of responsibility and cost of
operations set against the buffeting winds of market operations to be met mostly by the
farmers and consumers with the state playing the role of mere monitor.
9 . 2 INTRA STATE DISPARITIES AND POLITICAL UNREST
While the persistence of backwardness in all the four states is acknowledged , it is
interesting to note the varied popular perceptions and policy and programme responses
from the state governments. While Andhra Pradesh with 23 districts and Karnataka with
19 districts ha ve faced problems and agitations stemming from local discontent, the
official responses have been by way of Study Teams and Constitution of Area
Development Boards. Andhra Pradesh witnessed Telangana and Rayalseema
Development Boards in the seventies and Karnataka came up with the Hyderabad -
Karnataka Area Development Board and the Malnad Area Development Board in
- 175 -
Eighties. The problem of inter district and regional imbalance has continued to be a major
problem in Maharashtra and has led to political pressures for development of
Marathwada and the Vidharba region . Similar differences in the levels of development
among districts in Tamilnadu and Kerala have not led to similar political agitations and
have been handled differently. Tamilnadu appears to have opted for creation of more
districts by bifurcating or trifurcating large districts and creating compact and more
manageable districts, with administration enabled to be closer to the people and respond
more quickly to the felt needs. Kerala has just this year announced creation of area
development boards.
The National Council of Applied Economic Research, in collaboration with Planning
Commission and UNDP has attempted to develop the database required for preparing a
human development profile for the country. While recognising that, “the Human
Development Index’ though superior to traditional aggregate indices such as GDP fails to
reveal disparities among population sub groups and therefore has a limited role in
deciding policy prescriptions for raising the level of human development” NCAER has
published in 2001, Human Development Report for South India. This Report covers
profiles of Andhra Pradesh, Karnataka, Tamilnadu and Kerala based on secondary data
with a Survey Report based on primary data collected by the NCAER Household survey
conducted in 1994. The report, based on rather dated data confirms the persistence of
inter-district disparities in states of A.P, Karnataka, Tamilnadu and Kerala.
NCAER Report states,” the overall level of development of A.P, measured in terms of
infrastructure, agricultural development, educational and health characteristics of the
population is lower than All India average. Intra Regional and Inter District disparities
indicate that the Coastal Andhra is the most developed region of the state (except for
Srikakulam and Vizianagaram districts) while Telangana is the least developed region
(NCAER South India HD Report 2001 p.1)
In Andhra Pradesh inter district disparities had led to violent agitations and demand for
separate Telangana in 1969.Change in the State political leadership and the Constitution
of Rayalaseema Development Board Telangana Development Board, and the Coastal
Andhra Planning Board, led to preparation of resource inventories for all the three regions
and formulation of region specific development strategies. Allocation of plan funds in
specific proportion seemed to assuage the political element. But in 1973, there was a
counter agitation with demand for separate Andhra State , on account of a Supreme Court
judgement upholding the formulae for employment of only locals in Telangana Area. It
was with the imposition of President’s Rule and Central intervention with a compromise
- 176 -
Six Point Formula dealing with services as also provision of development funds that some
degree of order could be restored.
The implementation of developmental programmes covering all sectors in the three
regions of Coastal Andhra , Telangana and Rayalaseema has met popular aspirations to
some extent but this could not completely eliminate the regional differences or the
simmering demand for a separate state of Telangana . The recent resurgence of separate
Telangana movement, with political group fighting the Panchayat Raj elections raises
critical question on the long term efficacy of the development plans and public
expenditure programmes in reducing inter district and intra state disparities in the state.
In Maharashtra , which was formed by integration of areas from old Bombay province ,
Marathi speaking areas from Hyderabad State has thirty three districts spread over a vast
area The state has a high rank of three in development in the country and has its own
regional problems owing to difference in resource endowment and topography . Demand
for development for Vidharbha region and Marathwada had led to the measures for
identification of backlog in development allocation and constitution of statutory
Development Boards for Vidharbha, Marathawara and rest of Maharashtra. With the
Governor of the State acting as the head, Statutory Development Boards, have been
given the power to allocate funds for irrigation and other development purposes . This
state has recently witnessed a revival of demands for allocation of funds for regional
development marked by the formation of a Vidharbha Backlog Removal and
Development Forum (VBRDF in 2001).
An Official Committee has estimated the backlog in allocation of irrigation funds to the
Vidharbha region at Rs. 4265 crores as per the rate structure in 1994 when the estimated
cost was worked out at Rs. 50,000 per hectare.
In the Budget for 2000-2001 , Finance Minister of Maharashtra has indicated that the
state Government has decided to accept in principle , the Indicator and Backlog
Committee Report and observed “ It may be recalled that we have been allocating
outlays for the last fifteen years to clear the Dandekar Committee Backlog . Honourable
Governor will be requested to have backlog determined for the Khandesh and scarcity
areas also as on first April 2000 along with Vidharbha , Marathwada and the rest of
Maharashtra. For the year 2000-2001 the outlay for backlog has been proposed at Rs.
1100 crores with the consent of the Governor.”
This is illustrative of the nature of pressures that get built up on account of development
aspirations in different regions . The Maharashtra Government has also proposed raising

- 177 -
funds through bonds for Irrigation Development Corporations constituted separately for
Vidharba , Marathwada and Konkan areas.
The Karnataka state was formed in 1956 , by the merger with Mysore state and four
districts of Bombay Karnataka region , Three districts of Hyderabad Karnataka region
and two districts of Madras Karnataka region .The differences in the levels of
development of these areas have been major source of concern for successive
governments of the state .Demands for allocation of funds for the development of
backward areas have been made backed up by assessments of relative levels of
development of different districts using various indicators . To illustrate the development
of three districts Gulbarga, Bidar and Raichur which were earlier part of Hyderabad , has
been a major source of concern.With the addition of Bellary which came from Madras,
this area covered by four districts came to as the Hyderabad – Karnataka region . The
constitution of a Committee (in May 1980) to study and report on the development of the
region resulted in a Report in Oct 1981 recommending the establishment of a statutory
board to formulate plans and setting up an area development corpoartion to execute these
plans and promote commercially viable schemes. Though the state government accepted
the recommendation , its approach to Planning Commission for financial assistance did
not meet with success. Subsequently the Hyderabad Karnataka Area Development Board
was proposed by the state government in 1989-90. The visit of a Central Study Team in
May 1990 to study a Rs. 634 crore Plan for the region submitted by the state government
did not result in flow of additional funds to the region. An High Power Committee was
set up to monitor the development of the region . After two years of this Committee a
full fledged Hyderabad Karnataka Area Development Board was constituted in December
1992 to implement the development plan earlier prepared with an outlay of Rs. 635 crores
over a five year period . A recent assessment shows that the Plan was heavily weighted in
favour of construction of roads and bridges and only 10 % each was earmarked for
education , health and water supply and the out lay was also reduced to Rs. 290 crores
during the Eighth Plan period.
Institute of Social and Economic Change (ISEC) organised a seminar in September 1994
to discuss the problems and prospect of promoting regional development in Karnataka ,
with a detailed study of the resource endowment, development strategies and
implementation of programmes in the Hyderabad Karnataka region . The proceedings of
the seminar appear to indicate that this backward region consisting of four districts, had
remained economically and socially backward inspite of conscious efforts made by the
Government of Karnataka to accelerate development and highlighted the constraints in
developing such areas . (see Regional Development Problems and Policy Measures,
Abdul Aziz and Sudhir Krishna, Institute for Social and Economic Change , 1996 ).
- 178 -
The NCAER Report , HDR South India observes with reference to Karnataka that “ the
districts in the North Eastern region of the state, Bidar , Gulbarga, Bijapur , Raichur and
Bellary are the most backward with regard to Education and Health Indicators. They also
lag behind in other institutional and infrastructural facilities that are necessary for
sustained economic growth .”(NCAER HD Report 2001 pg .112) Karnataka’s experience
in implementation of programmes for the Hyderabad – Karnataka Region ,Malenadu
Region and Maidan Region through Area Development Boards has not been a
conspicuous success . It would appear , that apart from creating problems of coordination
with the local bodies the efforts have met with local resistance from environmental and
local groups particularly for industrialisation in some region .
It would appear from the experience of Andhra Pradesh ,Karnataka and Maharashtra
which inherited areas forming part of the old Hyderabad state ruled by the Nizam , that
the persisting backwardness is an historical legacy of the old feudal regime. Not
withstanding the genuine aspirations of the people of the area which were integrated on
linguistic basis with better developed areas , from old Madras and Bombay Provinces,
the full burden of reversing past neglect could not be borne by the people of other
regions within the state. There also appear to be some cultural differences traceable to
their past history in old Hyderabad state . That this should be the case , forty five years
after the States’ Reorganisation in 1956 , is as much a commentary on the lack of for
emotional integration despite linguistic commoness , as on different levels of economic
development . Disparities and charges of neglect provide the main argument but the
importance of other factors should not be ignored.
Kerala represents another dimension of developmental effort, in a state with regional
differences on account of topography and resource endowment and also past political
history. . The state was formed in 1956 by integrating the former princely states of
Travancore in the South and Cochin in the North (which were united in 1949) and
Malabar area from the old Madras province . Geographically , Kerala has three distinct
regions , the Highlands close to the Western Ghats, the Midlands made up of undulating
hills and valleys and the Lowlands comprising of river deltas and backwaters .Each of
these regions has its own pattern of resource endowment and economic levels .
Kerala with its 14 districts exhibits high social development indicators but rather low
economic indicators, marked by differences in many aspects . Ranking of districts in
respect of five indicators (1) per capita income (2) percentage of urban population (3)
motor vehicles per kilometre roads (4) number of hospital beds per lakh population (5)
- 179 -
percentage of work seekers to total population show districts have a range of scores from
51 to 33, leading to their grouping into Group A -Better developed (four districts ) and
Group B -Medium Developed (six districts) Group C - Less developed (five districts).
NCAER study states that “ the comparatively high social consumption levels and the
highest physical quality of life do not obliterate ne gative aspects of Kerala’s Socio
economic development such as extreme fragmentation. ” (reproduced)
Conscious of the differences in the levels of development and the problems faced by the
people in different regions as also the need for area specific strategies , the Kerala
Government has in the Budget for 2001-2002 announced the constitution of (a) Coastal
Area Development Authority and (b) Hill Area Development Authority with a
preliminary provision of Rs. One crore each for the comprehensive development of the
respective regions. It doesnot appear that the Kerala Government has had the benefit of
studying the experience of the Rayalaseema and Telangana Development Boards of A.P
or the Hyderabad _ Karnataka Area Development Board and Malenadu Development
Board of Karnataka. While the constitution of such boards , appear to meet the immediate
political aspirations of the local leaders , with the obvious elements of patronage , their
utility in terms of genuine developmental needs of the regions or of the people appear to
be less than that of a palliative .
In Tamil Nadu which has also problems of inter district differential , did not face any
major political problem or the need to constitute any regional boards . Tamilnadu Govt’s
‘Tamilnadu an Economic Appraisal (1991) indicates that “the levels of development in
21 districts assessed by the construction of overall development index (with 17 indices)
Social Development Indices for districts with four indices ,show that the overall
development index , range from 186 to 68 but in terms of SDI , the range is much narrow
from 129 to 76 with three broad groups formed of a) Eight Districts with SDI above the
state level of 100 b) Eight districts with SDI between 90 and 100 c) Five districts with
SDI below 90. Tamil Nadu’s approach of forming new districts with manageable size
ensuring closer attention to people’s problem and better implementation of schemes
appears to have contained the political dimensions of the inter district differentials.
It must be ment ioned that the Regional Developmental aspirations and their political
manifestations in several states have been simmering , surfacing for some time and then
subsiding only to resurface again later. The recent upsurge in Andhra Pradesh and
Maharashtra is in a way attributable to the creation of Uttaranchal , Jharkand and the
Chattisgarh states . There should be no doubt that the creation of such states will add to
the expenditure on administrative services . And where such states are not created and
other mechanisms are created , sub optimal utilisation of resources by way of budgetary
- 180 -
allocations on political considerations can not be ruled out . Far too frequently, political
differences have led to compromises on the financial front.
Given the resource constraint faced by the State Governments , and the increasing
pressures of administrative expenditures , the need to avert such decisions appear to be
strong. This would seem even more compelling with the districts already having agencies
like the District Rural development Agency , not to mention the local bodies that need to
be given a fillip to implement the 73rd and 74th Amendment to the Indian Constitution.
9 . 3 DEVOLUTION TO LOCAL BODIES
An area of importance, that has not received as much attention at the operational level, as
at the theoretical level is the role and efficiency of local bodies in the formulation of plans
and implementations of public expenditure programmes.
Scanning the Five Year Plans, one finds that as far back as 1951, the Planning
Commission had observed, “Panchayat Legislation may be strengthened, if necessary, to
enable panchayat to assume responsibilities for such functions as (i) Planning
Programmes of production for the village (ii) planning budgets of requirements of
supplies and finances needed for carrying out the programme (iii) acting as the channel
through which, increasing government assistance, other than assistance given through
agencies like cooperatives, reaches the village,.” ( Planning Commission First Five Year
Plan p.39)
The emphasis on felt needs of the people and local participation as key elements in
formulation and implementation of plans has run like a continuos thread, through several
decades, but with varying degrees of translation into operation. Concepts of “planning
from below”, Community development, panchayati raj, “growth centres”, “districts level
planning,”, “multilevel planning,” democratic decentralisation and empowerment of
people, have all held the stage for sometime or other and played cameo roles during the
last five decades of development planning without any of them given time and scope for
getting operationalised in all States and opportunity for settling down in a country of near
continental dimensions with differences in local cultures and levels of economic
developments. One can almost see a pattern of “enter”, and “exit” of concepts scripted
into the drama of development over the decades.
The Approach Paper to the Ninth Five Year Plan reminded that “the process of
decentralisation and grant of autonomy does not stop at the state level but has to be
carried further by the state governments to the regional and sub regional levels.
- 181 -
Democratic decentralisation through the Panchayat Raj system was adopted by the 1950’s
in some state. However after the mid 1960’s the functions of this institutions declined.
Efforts were made to revive this institutions several times in the 1970’s and 1980’s, with
little success. However with the Constitution Amendment Act 1992, Panchayat Raj
Institutions have been revitalised and the process of democratic decentralisation has been
ushered in” para 5.18, Approach Paper to the Ninth Five Year Plan, Jan 1997.
Dwelling on the same theme the Ninth Five Year Plan (1997-2000) observed, “the Sixth,
Seventh and Eighth Plan re-emphasised district planning with a multilevel planning
framework. However, proper administrative arrangements were not made to facilitate this
process, there was also a lack of technical expertise and an absence of financial support
both of which acted as impediments in the process of democratic decentralisation.”. The
scope for removal of these constraints has been provided by the 73re and 74th
amendments to the Indian Constitution carried out in December, 1992, which has been
followed by the State Assemblies with enactments carrying further the process for
legislative backing for Panchayat Raj Institutions.
As per the Seventy Third Amendment, Article 242G of the Indian Constitution,
Panchayats are expected to attend to the preparation for plans for economic development
and social justice. They are also expected to attend to the implementation of the schemes
for economic development and social justice, as may be of interest to them including
those in relation to the matters listed in the Eleventh Schedule. Of the 29 items enlisted
for the panchayats 21 are of developmental and social responsibility, including
maintenance which can be better discharged locally. The Plans prepared by panchayats
are expected to be consolidated by a Distric t Planning Committee, created under Article
243-ZD, and become part of a draft development plan for the district as a whole to be
forwarded to the State Government.
While the Seventy Third Amendment was designed to revitalise the Panchayats by giving
statutory recognition for the third tier of governance, the devolution of power, functions
and finances to the panchayats has not been a smooth process. In 1996 a Committee
appointed by the Planning Commission suggested a number of measures to speed up
devolution. But State Government’s have been dragging their feet in this regard. The
Planning Commission in the Ninth Plan document however felt that the process of
devolution is at various stages of operationalisation in different states.
An analysis of the 13 State Panchayats Acts made by Shri. O.P. Bohra show that the
assignment of functional responsibilities at Gram Panchayat, Panchayat Samitis and Zilla
Parishad level varied from State to State, and that while assigning responsibilities no
- 182 -
selection criter ia were used, and the system as a whole was marked by inadequacies (see
O.P Bohra, Decentralisation and Devolution of Powers and Functions to Panchayats,
Journal of Rural Development, NIRD April-June 2000 P.185-195).
ShriD. Bandyopahyay, Former Secretary Rural Development Government of India has
also highlighted the absence of recognition for district plans prepared by the District
Planning Committees, and the need for a clear policy and operative statement in this
regard (see “Planning from Below, EPW Mar 18th 2000 p. 982).
In several states, the existence of bodies like District Rural Development Agency, and
district level societies for financing welfare and development activities for specific
targets groups like the Scheduled Caste, Scheduled Tribes, Backward Classes and
Minorities, with their own line of credit and government fund has made considerable
difference to the effectiveness of the Panchayat Raj Institutions which are financially
weaker in comparison. The Ninth Five Year Plan had in para 2.1.108 Vol- II had
observed that the DRDAs would be restructured in the light of the Seventy Third
Constitutional Amendment Act which has enhanced the area of operation commensurate
with a larger inflow of funds…. In the revised format the DRDAs would work under the
supervision and overall control of the Zilla Parishads”. This has not however materialized
in many of the states.
There has been also emphasis on providing funds by way of grants to non government
organisation for carrying out programmes, in the expectation that they would play an
enhanced role especially as “facilitators and social animators in bringing about greater
awareness through advocacy and that they would help the poor to form self help groups
with the objective of improving their economic status through concerted action.
The multiplicity of agencies of the district and lower levels have not only posed problems
of coordination but also given rise to unhealthy rivalry among them to the detriment of
development activity, and local amity. Attempts to reduce the number of agencies at the
district level, as announced in the Union Budgets, do not have appear to have reached the
grass root level.
A field level evaluation of Management of Poverty Alleviation programmes under
Panchayati Raj Institution in Karnataka by Abdul Azis, S.S Meenakshi Sundaram and
K.G. Gayatri Devi, (Journal of Social and Economic Development, July/ Dec 2000,
Institute of Social and Economic Change, observes that the performance of Panchayats in
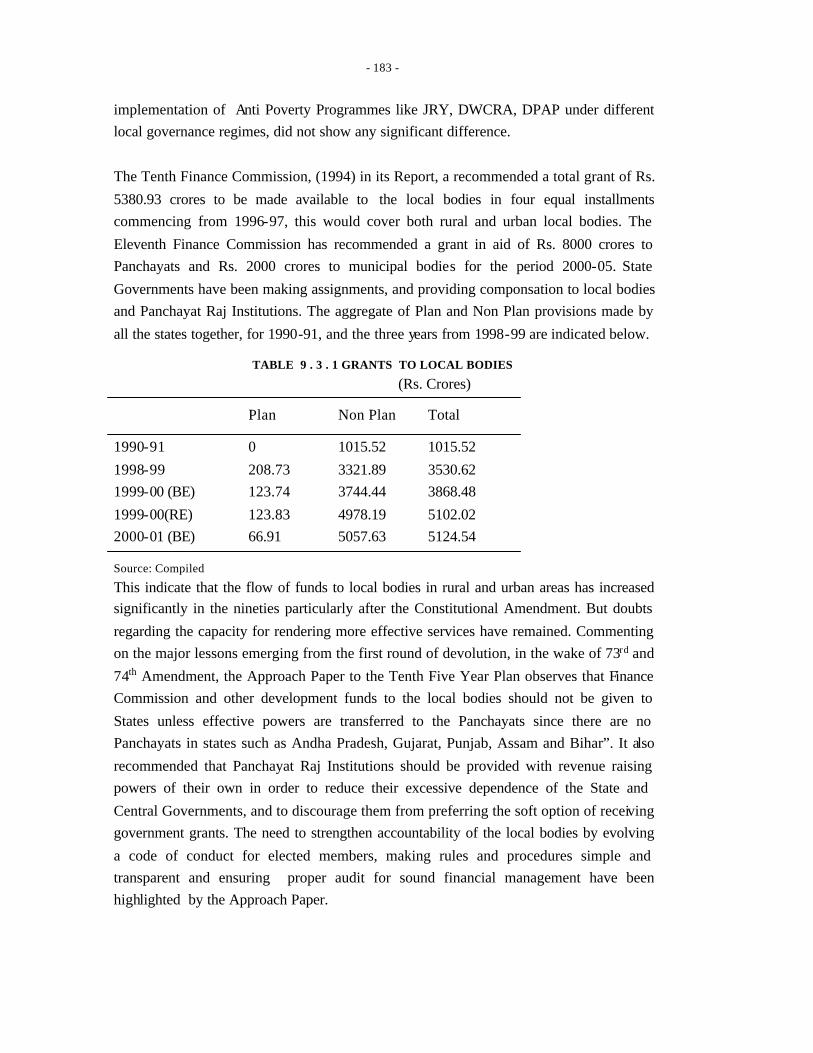
- 183 -
implementation of Anti Poverty Programmes like JRY, DWCRA, DPAP under different
local governance regimes, did not show any significant difference.
The Tenth Finance Commission, (1994) in its Report, a recommended a total grant of Rs.
5380.93 crores to be made available to the local bodies in four equal installments
commencing from 1996-97, this would cover both rural and urban local bodies. The
Eleventh Finance Commission has recommended a grant in aid of Rs. 8000 crores to
Panchayats and Rs. 2000 crores to municipal bodies for the period 2000-05. State
Governments have been making assignments, and providing componsation to local bodies
and Panchayat Raj Institutions. The aggregate of Plan and Non Plan provisions made by
all the states together, for 1990-91, and the three years from 1998-99 are indicated below.
TABLE 9 . 3 . 1 GRANTS TO LOCAL BODIES (Rs. Crores)
Plan Non Plan Total
1990-91 0 1015.52 1015.52
1998-99 208.73 3321.89 3530.62
1999-00 (BE) 123.74 3744.44 3868.48
1999-00(RE) 123.83 4978.19 5102.02
2000-01 (BE) 66.91 5057.63 5124.54
Source: Compiled
This indicate that the flow of funds to local bodies in rural and urban areas has increased
significantly in the nineties particularly after the Constitutional Amendment. But doubts
regarding the capacity for rendering more effective services have remained. Commenting
on the major lessons emerging from the first round of devolution, in the wake of 73rd and
74th Amendment, the Approach Paper to the Tenth Five Year Plan observes that Finance
Commission and other development funds to the local bodies should not be given to
States unless effective powers are transferred to the Panchayats since there are no
Panchayats in states such as Andha Pradesh, Gujarat, Punjab, Assam and Bihar”. It also
recommended that Panchayat Raj Institutions should be provided with revenue raising
powers of their own in order to reduce their excessive dependence of the State and
Central Governments, and to discourage them from preferring the soft option of receiving
government grants. The need to strengthen accountability of the local bodies by evolving
a code of conduct for elected members, making rules and procedures simple and
transparent and ensuring proper audit for sound financial management have been
highlighted by the Approach Paper.
- 184 -
While the nineties have been marked by not only philosophic changes on the role of the
States at National Level, and institutional changes at the village and district levels, all of
which have implications for flow of funds and quality of Public Expenditure
Management at the field level, the situation appears to be fluid and transitional still.
Settled patterns of governance and accountability for public funds are yet to emerge in
several states. Even while the emphasis on empowering Panchayats has received
constitutional expression, there are other experiments being tried out in States like
Rajasthan and Madhya Pradesh the State Governments decided on transferring nearly all
of the powers previously excersied by the Panc hayats to Gram Sabhas. Nagaland
provides another form of empowerment of community based traditional organisation with
the creation of village development boards. These experiments in direct democracy
replacing representing democracy seem to have the fascination for some while inspiring
fears in others. There appear to be different kinds of political considerations in these
experiments, and some of them are tracable to the flow of funds from the Centre to the
Panchayat Raj Institutions in recent years
These demonstrate the risk of increased flow of funds, increasing factional politics and
local tensions, where patronage plays a more prominent role than propriety in award of
contracts. These emerging tensions at the grass root levels will add a new dimension to
Public Expenditure Management in the states, and pose more severe challenges than have
been seen in devolution from Centre to the States.
9 . 4 FALLING LEVELS OF FISCAL MARKSMANSHIP AND DISCIPLINE
An important issue that emerges from our study of Budgetary documents of the various
state government is the magnitude of variations between the figures of budget estimates,
revised estimates and accounts in respect of various items of expenditure.
Some of the ills of the budgetary system can howeve r be traced to the nature and character
as also Volume of the Budgetary documents presented to the legislatures , as also their
bewildering multiplicity . As Dr.M.D.Godbole , a former Finance Secretary of Govt of
Maharashtra and Union Home Secretary obse rves , “the budget of the Govt of
Maharashtra for 2000-2001 consisted of 46 publications , comprising 352 ‘ demands’
running into 6336 pages . In addition are the supplementary demands presented during
each of the three sessions of the legislature . These total , on an average , about 500
demands in a year . This is not the end of the story . Each department of the state
government presents at the budget session of the legislature its performance budget. In the
budget session . held between March to May 2000, 57 such performance budgets running
- 185 -
into about 5000 pages were presented to the state legislature. Thus, each year, on an
average budget/budget related documents running to nearly 12000 pages are made
available to the legislature to the media and the entrusted organisation…. Most of these
budget publications comprise pages and pages of tabular material which an average person
finds most unreadable . It takes a Herculean effort to pin point the information one may be
looking for. In the maze of details , the larger and more important issues are lost sight of .
There are hardly any analytical writers which can enlighten an person on the critical
issues in the sector..” (see Dr.M.D.Godbole , Making State Budgets Transparent and User
Friendly, EPW April 21st 2001 pgs.1349 –1358)
This situation obtains even after the State governments have organised the presentation of
budgets along the lines of the Comptroller and Auditor general’s four digit accounting
classification with disaggregation into revenue and capital accounts and with additional
decomposition of expenditure into plan and non plan categories. Planning Commission
and the Reserve Bank of India have been presenting various budget details with functional
classification falling into developmental and non developmental categories .The RBI has
been publishing for the last several years an Annual Review of the Finances of the State
Governments presenting budgetary data with a certain degree of uniformity and making
adjustments for inter governme ntal transfers.
For the purpose of this study the Institute sought and obtained from Govt of Andhra
Pradesh , Govt of Tamilnadu and Govt of Maharashtra , the budget documents , and the
Governments of Karnataka and Kerala however did not send the original documents.Our
experience reveals that the critical remarks of Dr. Godbole are highly pertinent and
relevant .and need to be taken seriously for accelerating budgetary reforms towards greater
clarity , and much needed transparency.
With a view to obtaining greater transparency the Reserve Bank of India had constituted a
Core group on Voluntary Disclosure Norms for State budgets and in pursuance of the
recommendations of this group , the budgetary documents of several states for 2000-2001,
have begun to present some of the critical fiscal indicators.
Apart from the voluminous documentation there is another area where the state budget
need to be made are amenable to the Legislative control . An increasing part of the budget
of the states comprise significant proportion of expenditure which are of ‘committed’
nature . These include expenditure on salaries and wages , pension and gratuity ,
repayment of loan and payment of interest constituting over 60 % of the Consolidated
fund and accounting for 80 % of the revenue receipts , with the result that Legislature gets
- 186 -
very little scope for modifying the budget proposals to meet the needs of the people.
Discussions on state Budgets in the Legislature have become rather stereotyped and the
number of Demands that re ‘guillotined’ for want of time to discuss them in detail , is a
sorry commentary on Legislature control over state finances.
Review of the budgets of the state governments in the 1990s show that , there has been , a
pronounced tendency to treat the budget as a ritual , carried out with greater concern for
form than respect for content or accuracy. This is compounded by the increasingly glaring
deviations of actuals from estimates during the course of the year
As the Reserve Bank of India’s Study of State Finances (1999-2000) points out “ the
deviation between the actual outcome and the budget projections brings to the fore , the
important issue of ‘integrity of budgeting’ or the fiscal marksmanship of state budgets .
Fiscal marksmanship essentially reflects the degree of accuracy between ‘estimates’ and
‘actuals’ of the budget data. “ . After pointing out the deviations between estimates and
actuals in respect of revenue receipts, revenue expenditure , capital receipts , capital
disbursements , total expenditure as also of various deficits for several states for the years
1995-96, 1996-97 and 1997-98 , the RBI study observes “ the deviation between the
accounts and the budget/ revised estimates has often been large compromising the role and
discipline of the budgetary mechanism in promoting good fiscal management”. ( See
:RBI study , 1999-2000 pg.22)
Persistence of the problems led the RBI to comment in its study of State Finances 2000-
2001 that “ Poor marksmanship brings to the fore the issue of credibility in the
announcements about fiscal corrections that government often makes. The expenditure
overruns stem largely from the persistent rise of committed revenue expenditure and
persistent increase in consumption expenditure defrayed towards administrative services
(Wages , salaries , pensions etc.) continues to be a major item contributing to the
deviation in budgetary outcomes . This is clearly brought out in the Economic and
Functional Classification of the State Budgets” (See: RBI stud y 2000-2001 pg 26) .
Study of Budget documents along with Audit Reports can however be useful in assessing
financial management from the points of view of efficiency economy and effectiveness of
revenue gathering and of quality of Expenditure management .
The analysis of the budgetary document show that the estimates of Revenue are generally
high , and the actuals turn out to be much lower than projected to the legislature .
- 187 -
While it is understandable that estimate of tax revenues could at times be affected by
unforeseen changes in economic conditions like drought or recession the persistence of
shortfalls as for instance in Maharashtra 1989-90 1992-93 1997-98 and 1998-99 indicate
that the quality of estimates need to be improved . Similar is the case with some other
states. In Andhra Pradesh the actuals of Tax revenue for 1999-2000 was Rs.10,409 crores
as aginst the BE of 11048 crores , the actuals being 94.2 % . Estimate of non tax revenue
was better with actuals being 98.75 % of the estimates. The estimates of Grant-in-Aid and
contributions was far off the mark with the actuals turning out to be 77.93 % of the
estimate. Such errors lead to the state government to taking recourse to Ways and Means
Advances and overdraft during the course of the year . During 1999-2000 A.P took
recourse to Ways and Means Advance and overdraft for 291 days amounting to Rs. 7756
crores . Further at the end of the year , the A.P government took to extraordinary step of
resorting to freezing of expenditure to the tune of Rs.3035 crores pertaining to water
supply , sanitation , housing and urban development under Social Services and rural
development under Economic Services. Financial assistance to local bodies and other
institutions were also seriously affected .
Expenditure estimates call for more serious comments , as the reports of the CAG , for
states like Maharashtra, Andhra Pradesh and Kerala show that actual expenditure show
variation of high order from the budget estimate and even the revised estimate. The report
of the CAG for A.P and Kerala for the year 1999-2000 cite several instances where
appropriation estimates were modified during the year , reappropriations were made , and
supplementary estimates were presented but the actuals bore no relation to the BE or RE .
The CAG report for A.P for 1999-2000 indicates that an expenditure of Rs. 30783 crores
was incurred as against total grants and appropriations of Rs.34404 crores. The net saving
of Rs. 3621 crores was the end outcome after 109 items of expenditure showed savings of
Rs.4467 crores while 27 items showed an excess expenditure of Rs.846 crores. In all 126
items were not correctly estimated.
Under Article 205 of the Constitution , variations in Expenditure particularly excesses are
to be regularised by the Administrative Departments explaining the reasons for such
occurrences to the Public Accounts Committee of the legislature. In a number of cases of
the past from 1991 to 1998-99 such excesses have not been regularised though the
expenditure amount involved amounted to Rs.2001.80 crores. (See pg 29 and pg 195 of
CAG report 1999-2000 for A.P). In the case of Kerala , the CAG has reported that excess
expenditure amounting to Rs1412 .46 crores covering 163 items from 1983-84 to 1998-99
are yet to be regularised by Government furnishing explanation to the Public Accounts
Committee.
- 188 -
Incorrect anticipation of the expenditure to be incurred leads to presentation of
supplementary estimates for grants , Reports of CAG reveal that in many cases even the
request for supplementary provisions made during the year have not been correct . In the
case of Andhra Pradesh supplementary provision of Rs. 8964 crores obtained during 1999-
2000 constituted 35 % of the original estimate , and in the case of Kerala the
Supplementary provision of Rs. 2359 crores constituted 21 % of the original estimate. In
both the states , supplementary provision for many of the items have been found to be
unnecessary as the actual expenditure incurred , fell short of the budget estimates.
Even more glaring than the estimation failures are the impropriety involved in incurring
expenditure without securing the specific authorisation of the legislature required under
Article 205 of the constitution. CAG has reported that in 1999-2000 Govt of Andhra
Pradesh , incurred the expenditure of Rs. 172.29 crores without the provision having been
made in the original estimates or in supplementary demands and that Expenditure was also
incurred on new instruments of service in some irrigation projects . Similar instances have
been reported for town planning department in respect of Kerala.
The framework of budgetary rules provide for a mechanism for governments to draw
advances for meeting expenditure of an unforeseen and emergent character. Under Article
267(2) of the Constitution of India , Contingency funds are established with specified
limits to provide for drawal of such advances . These advances are to be later recouped at
the end of the year. CAG has reported that in Andhra Pradesh , out of Rs.15.78 crores
drawn from Contingency Fund during 1999-2000 , Rs. 8.52 crores remained unrecouped.
For Kerala , as against advance of Rs. 22.62 crores drawn from the fund several items
remained uncouped.
Failure to surrender budgetary provisions not likely to be used , is another impropriety in
P.D.A . A major tactic used by departments is to draw funds and keep them under deposit
outside the Public Account to report utilisation during the year and avoiding lapse. Such
cases are increasing in number in all the states .
The provisions for drawing money by presentation of Abstract Contingent bills and later
settling them by submission of detailed contingent bill are also being increasingly abused.
The CAG report for A.P mentions that as of March 2000 , as many as 117097 abstract
contingent bills for a total sum of Rs. 581 crores , for the period 1971-72 to 1999-2000
have been pending adjustment . This related to mostly Education and Family Welfare
Departments and over 70 % of the cases have been pending for over 10 years.
- 189 -
As even more serious inadequacy in budgeting relate to inadequate or no provision for
maintenance expenditure in respect of assets created at considerable capital costs. While
the Finance Commission and the Union Government have indicated norms for
Maintenance provision for irrigation projects, roads, bridges and buildings the provisions
made are far lower than the norms leading to deterioration in the quality of assets and
poor performance of infrastructural services. On the revenue side , the State governments
have been resorting to borrowing funds through corporation, often providing the fig leaf of
state guarantee and utilising this fund to meet the governments’ own expenditures. Andhra
Pradesh, Maharashtra and Kerala Governments provide numerous example of this
particularly in irrigation and power sectors. The Eleventh Finance Commission has drawn
attention to this tactic , but there is no impact on the state governments which are hard
pressed for resources .The Reserve Bank of India has drawn attention to the extent of
guarantees provided by the state governments and the implications of these contingent
liabilities for the size of the states outstanding liabilities.
While the Constitution , and the rules provide for a disciplined financial framework , the
budgetary trends of the nineties provide increasing evidence of the liberties taken by the
state governments with the requirements of Constitution and Parliamentary and
Legislative conventions .
Fiscal reform have to move not only in the direction of making budgets simple and
transparent but also in the direction of fiscal fidelity and financial Integrity .
The Report of Dr.M.D. Godbole on making Budgets simpler and more understandable ,
need to be circulated to all the state governments and consensus built on the changes
needed. While the four digit accounting classification stipulated by the Comptroller and
Auditor general have been adopted by all the states , and computerisation has made
information retrieval and monitoring of expenditure easy , the weaknesses flowing from
the calculated disregard of Budgetary propriety and legislature conventions are more
serious and need to be addressed .
9 . 5 FADING STANDARDS OF ACCOUNTABILITY
Articles 112 and 202 of the Indian Constitution have provisions in respect of Annual
Financial Statements (Budgets ), of the Union and States respectively has elaborately set
down the procedures.
According to The Public Accounts Committee of Parliament Budgeting “ is designed to
provide for Parliamentary Control, for administrative accountability for the auditing of
- 190 -
transactions for ensuring that the expenditure incurred by the Government is in the
specific manner and by the specified authority.” (cited in Government Budgeting
:Principles and Practices Dr.C.N.Sudarsanan , 2001 Pg. ---- ).
Sri T.N.Chaturvedi a former Comptroller and Auditor general and a Member of
Parliament has pointed out that “ the break down of India’s financial structure after the
first World war had led to the reorganisation of finances and initiation of the system of
financial control and audit”. … and that “ after attainment of Independence and the
launching of planning, the process of financial reforms has become a continuing function
....As we have a union of states it is of equal importance at both levels – Centre and the
States and also in their relationships. Since we are committed to democratic parameters of
the Constitution , control of finance is not just ritualism. Accountability and transparency
constitute it s life blood. Propriety , equity justice and integrity flow there from . “
(Preface to Control of Public Finance in India ,S.P.Gangualy , Concept Publishing 1997
pg 7.)
Elaborate procedures for conduct of Union Business are laid down by the President , under
Article 77(3) of the Constitution and the transaction of financial business is to be done
under the General Financial Rules of 1958 . Similarly under Article 166(3) , the rules of
Transaction of Business of the State Government are laid down by the Governor .The
procedures for legislative controls have also been laid down in the provisions stipulating
Preparation of Annual Financial Statement of the Government., The provisions relating to
Consolidated fund , Public Account and Contingency fund and stipulation regarding
Government Borrowings and Guarantees from articles 266 to 292.
While the Executive is charged with the responsibility of preparing an Annual Financial
Statement and submitting it for legislative approval and also the responsibility for
realising the revenues and utilisation of funds according to the approval granted by the
legislature, the Indian Public Finance System also provides for scrutiny of Govt Accounts
by Audit conducted by the Comptroller and Auditor General of India appointed by Article
148 (1) of the Constitution.
The duties , powers and conditions of service of the Comptroller and Auditor General ,
have been laid down by CAG;s Act of 1971. Which broadly follows follows the
Government of India (Audit and Accounts) Order issued in 1936 . The Act of 1971 has
also been amended in 1976,1984,1987)

- 191 -
CAG’s reports generally concentrate on what is known as Propriety Audit and cover ,
issues of accuracy in estimating receipts and expenditure, performance in the collection of
receipts , efficiency in incurring expenditure for the purpose for which money has been
voted by the Parliament/State legislature, and irregularities in collection of receipts and
expenditure . In broad terms the Audit report is expected to be a commentary on the
effectiveness of the government in revenue mobilisation and expenditure management.
The financial framework envisages that the accountability of the Executive to the
Parliament, for the manner in which it handles public finance is to be secured thro ugh the
reports of the Comptroller and Audit .
The procedures for submission of the reports of the Comptroller and Audit General to the
Parliament as required under Article 151 of the Constitution have also been laid down
under the Rules of Procedure and the Conduct of Business of the Lok Sabha and the
various State assemblies indicate the manner in which the reports on the Appropriation
Accounts and Audit are taken up for scrutiny by the Estimates Committee , Public
Accounts Committee and the Committee of Public Undertakings..Reports of these
Committees , do provide a clinical view of Governments Financial Management , Of late
these reports have become rather routine , lacking of fire and sharpness that one had seen
in the sixties.
In his book on Ind ian Administration Sri Ashok Chanda , a former Comptroller and
Auditor General has observed “ While the role assigned to the CAG in the Indian
Constitution conforms to that in other parliamentary democracy , it is unfortunate that his
relations with the Administration have tended to develop on some what unusual lines . In
all recognised democracies Audit is not just tolerated as a necessary evil but is looked
upon as a valued ally , which brings to notice , procedural and technical irregularities and
lapses on the part of individuals , whether they be errors of judgement , negligence or acts
and intents of dishonesty. The complimentary roles of Audit and Administration are
accepted as axiomatic being essential for toning up the machinery of the Government ….
Unfortunately in India this conception of complementary relationship has yet to be
evolved . Audit continues to be considered something alien , some thing extraneous and
something of the nature of an impediment . A natural resistance has thus , come to be
developed in administrative system to the absorption of the suggestions of Audit . This
trend has become more and more pronounced in recent years (see Indian Administration
Ashok Chanda )
A more recent view point , viewpoint has been presented by a former Indian Audit and
Accounts Officer Sri K.P.Joseph , while commenting on the Annual Report of the Indian
- 192 -
Audit and Accounts Department for 1998-99, and department’s admission that “its Audit
Reports are ignored by state Governments and legislatures , and that the Public Accounts
Committee donot discuss the Audit reports for several years. ”
Sri Joseph mentions that fraud , waste and corruption are on the increase in states like
Bihar. Delays in audit and issue of inspection report by CAG , poor state of accounts and
audit , by State Government Audit Officers archaic treasury system and lack of
specialisation in audit department are among the weaknesses in the system .Sri Joseph
observes , “ the audit department has no contacts with the public nor does it ever even
look at any suggestions from the public. It is happy in the constitutional ivory tower it
inhabits. (see K.P.Joseph ‘Growing fraud in Government ‘ EPW Febrauary 17 th 2001.
Reports of the Comptroller and Auditor General whether on the transactions of the Union
Government or on the state governments , make for very dreary reading cluttered with
jargon and spraying of figures . The CAG’s Report cover observations of Audit on
Finance , Accounts and Appropriation accounts of the Union and State Governments
along with Performance Appraisal of departments .For the knowledgeable digger , these
can provide valuable data for an assessment of the financial performance of the state and
union governments ,not withstanding the arcane character of the doc uments presented.
- 193 -
X FISCAL REFORM AND THE FUTURE
10 . 1 REVERSING FISCAL CRISIS
While our Study has clearly established the nature and pace of deterioration of fiscal
health of all states of governments, and have highlighted the manner in which some of the
states in the southern region which had a reputation for prudent management have
slipped, it must be noted that there are silver linings in the grey sky .The state
governments of Maharashtra, Andhra Pradesh, Tamil Nadu, Karnataka and Kerala have
all come up with announcement of specific steps to carry out fiscal reforms. This is
reassuring but one must await their implementation.
The White Paper on State finances presented by Govt. of Maharashtra in December 1999,
had brought out the deterioration in the fiscal situation, and had indicated that the states
government would make the revenue balance positive over a period of five years by
reducing the revenue deficit every year by 20%.
Presenting the Budget for 2000-01 of the Government of Maharashtra, on March 2000,
the Finance Minister Shri. Jayanth Patil had indicated that the faith of the public on the
financial health of the state, built on fiscal prudence and restraint exercised over almost
three and half decades has been shattered by fiscal imbalances, and that, he took it as his
“prime duty to restore the fiscal health of the state to its original glory”.The Finance
Minister indicated that the Revenue Deficit which had grown from Rs. 1591 crores in
1996-97 to Rs. 9484 crores in 1999- 2000 (R.E) will be reduced to Rs. 3939 crores in
2000-01.
This steps announced included reduction on interest payment, steps to reduce salary
related expenditure from the present level of 73% of revenue receipts to around 50% of
revenue receipts over the next three to five years by reviewing the norms for grants- in-
aid to institutions, and right sizing the government by a review of strength of employees
in Government Departments, Zilla Parishads and State Public Enterprises. He also
announced that borrowing will be done only to invest and not to meet current
consumptions.
With a view to ensuring better fiscal management , the State government has (a) set up
three member Board for Financial and Managerial Restructuring of State public sector
undertakings, (b) Revamped Expenditure Priority Committee and (c) formed
Expenditure Reform Committee under the Chairmanship of the Chief .Minister .
- 194 -
To bring about a greater transparency in the provision of budgetary information,
Maharashtra Government appointed Dr. M.D. Godbole to submit a report in consultation
with Comptroller and Auditor General . This report submitted in Dec 2000, has a number
of useful suggestions on making Budget Documents of the State Government user
friendly.
ANDHRA PRADESH
The Government of Andhra Pradesh which had begun in 1994 the practice of publishing
White Paper on State Finances, presented in June 1996 and February 2001, further papers
on State’s Finances. The Exercise in February 2001 included Sector specific strategy
papers apart from a paper on Strategy for Fiscal Reforms. This was circulated for
discussion in the legislature and among the enlightened public.
While admitting the fluctuations on states own revenue performance and worsening of the
fiscal indicators due to pressures on account of implementation of Pay Revision Award,
Legislative Assembly and Local Body Elections , natural calamities and Government
taking over of contingent liabilities on account of power sector restructuring, the Fiscal
Strategy Paper highlighted that the level of state debt, 24.16% of GSDP was higher than
the average of 21.5 % for all states. The paper revealed a medium term development
strategy for achieving the social and economic goals, and provided Medium Term Fiscal
Framework, for establishing “overall affordability of government spending within
reasonable revenue forecasts, while identifying a broad path for expenditures that
protects expenditures priorities”.Among the specific steps announced are those needed to
reverse the increase in civil service salaries and pensions and servicing of public debt.
Presenting a review of trends in tax revenue the Strategy Paper drew attention to the
declining share of central transfers and the need to make public services more cost
effective and efficient by streamlining administration staffing patterns, work norms and
process and adopting technological innovations.
The paper emphasised the need to reorient the mix of public expenditure from low
priority and inefficient applications to key social and developmental priorities. While
announcing the governments intention, to maintain levels of social expenditure and to
focus public investments on the building of social and economic infrastructure, the
Strategy Paper indicated that capital investment spending will be raised from the present
level of 1.3% of GSDP to 2.2% of GSDP in the near term and to 2.4% of GSDP by 2004.
The reduction of power and rice subsidies, as also others, from their present level of 1.5%
of GSDP to 1.2% of GSDP by 2005.
- 195 -
The Fiscal Strategy paper announced a ceiling of 9% of GSDP for government guarantees
to public enterprises and co-operatives, the adoption of zero based budgeting,
improvement in accounting procedures, and performance measurements .The Fiscal
Strategy Paper is clear in its diagnosis and precise in prognosis . But there is as yet no
indication that the treatment has commenced.
KARNATAKA
The Karnataka Government announced in July 2001, a Medium Term Fiscal Plan for the
period 2001-02 to 2004-05 and indica ted that this will be followed by a Fiscal
Responsibility Bill . Announcing the Plan the Chief Minister pointed out that the
budgetary position of the states has been marked by the conversion of surplus revenue of
Rs. 159 crores on 1995-96 to a deficit of Rs. 2325 crores in 1999-00 and increase in fiscal
deficit of Rs. 513 crores in 1991 to Rs. 4276 crores in 1999-2000. Attributing this to the
declining ratio of tax revenue to GSDP from 9.3% in 1990-91 to 8.2% in 1999-00, the
State Government announced its multi pronged plan.(a) to reduce budgetary support for
Public Sector Units and close some of them. (b)to cut implicit and explicit subsidies to
electricity and transport sectors. (c) to stop borrowing by Krishna Bhagya Jala Nigam and
Karnataka Niravani Nigam and (d) to shift to long term low cost borrowings from
agencies like World Bank and Asian Development Bank.
The Medium Term Fiscal Plan, announced the goals to be reached in the period 2000-01
to 2004-05 . Target for the terminal year 2004-05 are – (a) reduction of revenue deficit
from 1.49% GSDP in 2000-01 to a surplus of 0.4% (b) to reduce fiscal deficit from the
present 3.66% to 3% of GSDP (c) reduce consolidated fiscal deficit from 5.44% at
present to 3% of GSDP (d) reduce overall debt stock from the present 32.65% to 31.03%
and stabilise it at that level (d) cut expenditure on salaries from 4.86% to 3.72% of GSDP
(e) increase capital expenditure from the present 1.66% to 2.41% of GSDP.
The Medium Term Fiscal Plan of Karnataka covers Tax Refor m, Expenditure reforms
and Management, Levy of user charges and reform of Public Sector Units and
Administrative Services. The Plan is sharp in its focus and clear in its goals and
implementation is yet to begin.
TAMILNADU
The Tamilnadu Government has, in August 2001, presented a White paper on State
Finances for the period 1996-2001, and has sought political consensus on a fiscal
correction programme to be adopted.
- 196 -
The white paper draws attention to some “disquieting features “ of fiscal trends on Tamil
Nadu and the “steady deterioration” in state finances since 1996-97. The White Paper
indicated that the annual growth rate of revenue receipts, which was 16.2% during 1991-
96 declined to 11.7% during 1996-2001.
This was without concomitant reduction in growth of revenue expenditure as a result of
which revenue deficit as a percentage to total revenue increased from 2.7% in 1995-96 to
16% in 2000-.1, and in absolute terms from Rs. 311 crores in 1995-96 to Rs. 3922 crores
in 2000-01 Gross Fiscal Deficit (GFD) had increased from Rs. 1255 crores in 1995-96 ti
Rs. 5781 crores in 2000-01. Cash reserve of Rs. 649 crores by end of 1995-96, ended up
with a nil cash balance, Reserve Bank of India loan of Rs. 242 crores and unpaid cash
liabilities of Rs. 700 crores to suppliers, contractors and other agencies by March 2001.
Striking a note of caution the white paper observes “with the revenue receipts unable to
match the spiraling growth in revenue expenditure the government is left with little option
but to continue to borrow more to meet its cash requirements. If this trend continues for
some more time the government will end up using all its revenue resources to repay the
outstanding loans and the state will find itself in a debt trap.”
According to the White Paper, in 1993-94 outstanding public debt had increased from
16.22% of GSDP to 19.43% of GSDP in 2000-01, and will further go up from Rs. 23840
crores on March 31st 2000 to Rs. 29008 crores by 2000-01 and the overdraft facility was
availed 13 times for a period of 74 days during 1999-2000.
According to the white paper, the state’s predicament was attributable to (a) increase in
the salaries, pensions, loans and interest repayment liabilities. (b) unsustainable subsidy
regime (Public distribution scheme Rs. 1700 crores, Tarif compensation to electricity
board Rs. 250 crores, transport subsidy Rs. 16.5 crores and free sarees, Dhoti Scheme-
Rs. 140 crores) and (c) Decline on state’s share of central taxes from 20% in 1992-93 to
16% on 1999-2000.
The State Government has announced its intention to take measures for increasing
revenue generation to reduce the unbridged deficit of Rs. 692 crores in 2001-02 , maintain
tight control over expenditure, encourage small savings, and revise user charges and other
fees collected for various services to reflect the increase in cost. The state government has
constituted a Cell to analyse the implications of shifting to a value added tax scheme.
The Finance Minister , who tabled the white paper, pointed out that the growth in non
productive revenue expenditure had eroded the available pool of investible resources
- 197 -
and led to a decline of development expenditure from 77.9%. In 1991-92 to 57.8% in
2000.01. The State Government has also decided to take action on the recommendations
of a Committee which studied the Public Sectors Units and recommended a radical
restructuring, since, the sixty public sector units had reported a total accumulated loss of
Rs. 2292 crores thus, completely eroding the state governments share capital of Rs. 1298
crores.
KERALA
In June 2000, the Chief Minister of Kerala released a white paper on State Finances,
which indicated that the financial position of the state was alarming and as the media
reported , it was on the verge of bankruptcy .
The White Paper contrasted the period 1991-96 and 1996-2000 stating that the growth in
capital expenditure which was 14.89% between 1991-96 had declined to 3.56% in the
latter period, even while the gross fiscal deficit increased from 8.55% to 32.44% in the
same period.
The White Paper also indicated that the state had accumulated liabilities to the tune of Rs.
3477 crores which included loan from co-operatives Rs. 642 crore, Kerala infrastructure
investment fund Rs. 507 crores, dues to contractors Rs. 820 crores and retention in
treasury, public accounts Rs. 500 crores and placed the immediate fund requirement of
Rs. 2775 crores to cover a part of accumulated financial liabilities (Rs. 1200 crores),
finances for the Annual Plan Outlay (Rs. 900 crores), and resources developmental outlay
(Rs. 675 crores).
The White Paper could identify resource mobilization options for only Rs. 1435 crores
and proposed austerity measures to save Rs. 975 crores. While proposing a strategy for
enhancing tax collections including rationalisation and simplification of tax structure, and
improved tax compliance, step up small savings collection from Rs. 876 crores in 2000-
01 to Rs. 1200 crores in 2001-02 . The white paper suggested revision of fee structures
on some areas to increase non-tax revenues by Rs. 275 crores and revise tariff for power
supply for all categories of consumers by 60%.
In his Budget Speech, for 2001-02, the Minister for Finance, Kerala, Shri. Shankar
Narayanan, indicated that the investment of Rs. 16100 crores envisaged on the state’s
Ninth Plan (1997-2002) may not materialise and the achievement in real terms would be
about Rs. 13,000 crores. He announced the intention to adopt zero based approach to all
- 198 -
plan schemes, and to treat the budget for 2001-01 as a “corrective budget aimed at
restoring the fiscal balance significantly, though not fully without losing sight of the need
for investments in vital sectors.”
All in all , the Survey of the Finances of the Southern States and Maharashtra reveal that
while fiscal deterioration has been marked , in all the states , the realisation that this
should be arrested and prompt steps taken , seems to be equally pervading . The changes
in government brought about by General Election appears to have prompted the flurry of
White Papers , but it must be said , that in all the states , the diagnosis appear to be correct
and the treatment proposed on acceptable lines. It remains to be seen whether the
requisite political will materialise or not during the implementation stage or whether the
states in the South will also depend on a rescue mission from the Centre.
10 . 2 COST RECOVERY AND SUBSIDIES
An important issue that has emerged to the fore and dominated discussions on fiscal
consolidation in the nineties, is the stress on reduction of subsidies and recovery of costs
incurred by Government on the provision of services to the people. While opinions are
divided on the extent to which state can retreat from providing public services, by
increasing resort to privatisation of services hither to provided in the public sector, there
appears to be some measure of agreement on the need to reduce subsidy burden and move
towards recovery of some part, if not, the whole of the costs incurred by Government
Department on provision of public agency.
It may be recalled that in India, Planning has been committed to raising the levels of
income and living standards of the people and the role of the public sector, in its broader
sense was not only to control the commanding heights of the economy, but also to take
initiative in the provision of essential services and meeting the minimum needs of the
people. The role of public services in rearranging the flow of income was emphasized by
the Report of the Committee on distribution of Income and Levels of living, headed by
Dr. P.C. Mahalanobis, when it observed that “real incomes, particularly of the low
income groups are increasingly affected by the provision of various types of services
provided by the states which do not get reflected in the income data. Some of the services
like low cost housing, free primary education, health and social welfare services, improve
the relative income position of the low income groups and their trend to reduce
concentration in the distribution of real income.” (Government of India, Report of
Committee on Distribution of Income and Levels of Living, 1964, p.19)
The provision of services, in the social and economic sectors have been guided more by
equity considerations rather than economic or financial concerns, viewed in a narrower
- 199 -
frame. While the guiding philosophy in the fifties emphasized role of the state and public
sector in the production of goods and provision of services, there was slight shift in the
philosophical position in the eighties when the role of the public sector in the production
of goods came to be viewed differently and led to demand for restructuring of public
sector and its retreat form several areas.
In the nineties, this philosophy extended to provision of essential public services with the
need for change articulated by advocates of economic reform backed by international
financing agencies. This received impetus from the growing gap between the revenues of
the Central and State Government and their expenditure, with increasing revenue and
fiscal deficits.
The introduction to the Eighth Five Year Plan, drew pointed attention to the change in
philosophy, governing the withdrawal of the States and allowing increasing role for the
market mechanism. There was, no doubt, a word of caution in the words of the then
Prime Minister, Mr. P.V. Narsimha Rao, that “the market mechanism may not be able to
bring a balance between the ‘need’ and the ‘supply’ . He emphasized the necessity for
taking care of the poor and down trodden who are mostly outside the market system and
have little assets.”
The nineties were marked by varying levels of retreat of the State from the previous
philosophy of predominance of the Public Sector in the production of goods and
provision of services. The restructuring of Public Enterprises, and dis-investment
programmes marked the arena of production of goods and were carried out by Centre and
the State Government. Privatisation of Public Utilities in power, water supply, infra
structure and other areas were given a push. Privatisation of departmental Services, were
however marked by relatively hesitant steps, mainly on account of inability of the
government to devise a proper programme of social safetynet for the employees affected
by this programme. While confusion appears to mark these areas, it must be understood
that the private sector, guided as it is by motives of profit maximisation can not be
attracted to enter this sector without major administrative and legal backing for revising
the rates and tariffs prevailing in this service providing areas. Popular and user resistance
to tariff revision in this area has become prominent. The picture is one of mixed colours,
and not attractive at all.
Notwithstanding this, the Approach Paper to the Tenth Five Year Plan, has spoken of the
need for a development policy to make a break from the past, since “the government had
over the years taken on itself too many responsibilities with the result that it not only
marginalised individual initiatives but also succeeded in imposing severe strains on its
financial and administrative captivities.” It is against this shifting philosophical frame
- 200 -
work for provision of services that one must view the increasing emphasis on reduction of
subsidies and cost recovery measures as an important element in Public Expenditure
Management .
Analysts have sought to examine the benefits of public expenditure and its distribution,
across different groups. There are three broad approaches –(1) money flow approach (2)
benefits received approach and (3) benefits value approach and have dealt with the issues
of identification of beneficiaries, measurement of benefits, criteria for classification of
beneficiaries and the implications for patterns of government expenditure. (See Shri. K.N
Reddy (Distribut ion of Benefits of Public Expenditure Significance Conceptional Issue
Under an Empirical Frame Work, 1980) Shri. S.Sudhakar (Distribution of benefits of
public expenditure in India, Asian Economic Review Dec 1995 Pg 495-506) Shri.
S.Sudhakar (Cost Recovery of Government Budgetary Services, Asian Economic Review
Apr2001, p 62-94)
According to a Study made by the National Institute of Public Finance and Policy, (D.K.
Srivastava and T.K. Sen Government Subsidies in India NIPFP 1997), ‘the aggregate
Government Subsides (Centre and States) amounted to Rs. 1,36,844 crores constituting
14.35% of GDP at market prices in 1994-95’. About 70% of the Budgetary subsidies in
the country are borne in the State Budgets. The Study of 15 major States showed than
subsidization in 1993-94 was much higher and cost recovery rate correspondingly lower
at the State level than at the Centre. The overall recovery rate for social and economic
services taken together was only 5.81% of the total cost.
After the exclusion of expense s on general services and secretarial expenses in social and
economic services and expenditure on natural calamities, the NIPFP Study divided social
and economic services into merit and non merit groups. Merit group covered in social
services were elementary education, public health, sewage, information and publicity,
welfare of SC, ST, and OBC’s labour and nutrition . In Economic Services the merit
group covered soil and water conservation, environment forestry, agriculture research,
flood control, research in space oceanography and other sciences. In broad merit group
covered services benefiting the community as a whole.
According to NIPFP Study, out of the total subsidy of Rs. 73,100 crores provided by the
15 major states Rs. 21004 crores, (28.7% of the total subsidies went for the merit group
and the balance of Rs. 52096 crores (71.3% went to the non merit group. The Study also
traced the relationship between percapita income and percapita subsidies and indicated
that the percapita subsidy tends to go up with the increase in the percapita income with
non merit subsidies going up at a faster rate. The Study also pointed out that the
recovery rates in non merit services tend to go up faster with percapita income. Such
- 201 -
analysis enable policy makers acquire some insights into the prevalent situation and move
towards greater clarity in framing pricing policies, in public utilities and cost recovery in
government services.
Government of Andhra Pradesh for instance in its White Paper, State Finances the
Factual Position June 1996 pointed out that subsidies could be classified into two broad
categories (a) direct or transparent with a clear identification of beneficiaries and explicit
budgetary allocation and (b) indirect or hidden subsidy arising from non recovery of user
charges the White Paper also mention a third category arising from loans given to
cooperatives, public under taking and individuals for programmes of housing. The
Andhra Pradesh Government analysis of direct subsidies covering (rice subsid y, bus pass
concession, investment subsidy, reimbursement of registration fees paid by cooperatives,
managerial subsidy to select enterprises, subsidy for weaker section housing) had
increased from Rs. 416.49 crores to Rs. 805 cores in 1993-94 Rs. 800.24 crores in 1994-
95 Rs. 13.22 crores in 1995-96 .
As regard indirect subsidies, the White Paper mentioned , those involved in Irrigation
rates charged to the former lower than the historical cost and current cost of supply, low
rates for electricity supply to agriculture and industry, sales tax exemption given to
industries, concessional interest and loans to government employees. The indirect
subsidies cost the state budget Rs. 882 crores in 1991 R.1092 crores in 1991-92 rising to
Rs. 2205 crores in 1994-95 and Rs. 2506 crores in 1995-96. The White Paper gave two
computations of subsidies in water rates for canal irrigation, working out the cost on
historical basis and in current terms . In 1995-96 while the subsidy involved, on historical
cost basis was Rs. 557 crores, the subsidy in current cost terms was placed at Rs. 4366
crores. According to the White Paper, the total flow of direct subsidies in 1995-96 was
Rs. 1343 crores (2.4% of the GSDP and 26.9% of the States Own Tax Revenue, and the
indirect subsidies amounted to Rs. 6315 crores (11.3% of GSDP and 126.5% of States
Own Tax Revenue). The White Paper argued that “While direct subsidies have
contributed to the growth of revenue expenditure, indirect subsidies have lead to a near
stagnation in non tax revenues. Concerted efforts aimed at cuts on revenue expenditure on
the one hand and the growth of non tax revenue on the other hand are required for the
restoration of fiscal equilibrium… It is an accepted fact that subsidies erode allocation
and distribution efficiency in the economy. Even then government give subsidies aimed
at a specific objectives or to protect identified vulnerable groups. Given that there are cost
and benefits in every subsidy programmes the aim should be to minimise the cause for
achieving the identified objective”. There has been considerable discussion in the
Legislature and on the issue of reduction of subsidy and recovery of cost, with the
Government of Andhra Pradesh moving in the areas of reduction of rice subsidy by
- 202 -
increasing the issue price and redefining the target group for public distribution, revising
the power tariff for various categories of consumers in the phase of public education. But
in the crucial areas of irrigation rates and subsidised power supply to agriculture, which,
by the state government own admission, involved the highest subsidy of non merit growth
the state government has chosen to remain inactive. The vote bank politics has apparently
been the main factor.
Approaching the issue from a different angle, is the examination of the scope for raising
some revenue by levy of fees for provision of services, with a view to softening the
impact of raising expenditure and the budgetary position of the state. In other words faced
with the option of paring down expenditure on provision of services in privatization of
services, on the one hand and improving non tax revenues, especially by levy of user
charges and cost recovery on a range of public services, on the other hand there is a
preference for cost recovery.
Government of A.P moved in the direction of levying user charges. It has been argued,
by the Finance Department, that, “Government can recover cost from the user because
these services are individualised and users can be identified and charged according to the
extent of their usage. It is observed that while the costs of providing services has been
increasing, the fees and user charges have remained virtually frozen in nominal terms for
years. As a result implicit subsidization has increased, drawing the budgetary resources of
government and getting ultimately financed by borrowing. User charges have to be index
linked and the process of periodic revision should become automatic. However users can
be persuaded to pay if the quality of services is commusurate with the price charged and
the delivery of the services in cost efficient so that these users are not made to pay for the
inefficiency of the public against (Preamble to Government Order No. 170, Finance and
Planning Department, dated 23-4-2001, Government of Andhra Pradesh)
An important aspect of about this decision of Government of Andhra Pradesh is that it
recognizes the need to make the system more user friendly and cost efficient and
therefore permits the departments concerned to mobilise their own resources and retain
with them the amounts so collected to improve the services . Retention of the user fees
would also enable departments to take more initiatives and gather revenue to be retained
and utilised directly on provision of services. The detailed procedural instructions have
been issued by the Government of Andhra Pradesh on the levy of user charges by
departments like police, irrigation, sports, technical education, medical and public health
water supply and sanitation, informatio n and publicity, labour and employment , crop
husbandry, animal husbandry, fisheries, forests, industries, and tourism) While this effort
should be commended it should be noted that the rightly collection from these may
- 203 -
amount to only a small portion of the realisation, if water rates and power rates for
farmers are revised marginally.
To take the example of another state Maharashtra, has provided a very high level of
subsides amounting to Rs. 9607 crores in 1993-94 the highest among the states with
merit goods accounting for only 30% of the total subsidy . The percapita subsidy is placed
at Rs. 1157 crores. Maharashtra Government is yet to come to grip with the subsidy
burden and appears to be wavering . While presenting the budget for 2000-01 the Finance
Minister has announced the water rate for sugar cane growth in lift irrigation schemes
from Rs 1900 per hectare to Rs. 950 per hectare though the Irrigation corporations had
executed these schemes with loans carrying interest from 17 to 18%. The Maharashtra
Government provides another example of fiscal correction measures retreating in the face
of vote bank politics. If in Irrigation Government of Andhra Pradesh and Maharashtra
adopted a common approach for appraising the farmers an interesting compariso n of
public distribution systems provided by Shri. Bhaskar Dutta and Shri. Bharat
Ramaswamy (Targeting and Efficiency in Public Distribution System - case of A.P and
Maharashtra, EPW May 5th 2001p. 1524-1532) . Examining the differences in utilisation,
the extent of targeting , magnitude of income transfer and the cost effectiveness of food
subsidies the authors conclude that the scale of PDS is much larger in A.P. than in
Maharashtra, that there is not much to choose between the two states in terms of income
transfers to consumers on account of subsidies, that the cost of leakage is relatively higher
in Maharashtra and that the poor in A.P. receive the substantially higher subsidy than the
poor in Maharashtra but in rural A.P, even the non poor receive substantial subsidy
benefits because of the errors of inclusion. While there is realisation in both the
Governments , that the PDS needs to be streamlined administrative actions appears to be
lagging.
Dealing with the issue of cost recovery from a macro eco nomic point of view, the
Reserve Bank of India Study of State Finances, (1999-2000) observes that “a crucial
factor on the resources augmentation front is the need for cost effectiveness of the
governments investment in its undertakings thereby ensuring a viable and sustained
positive contribution to the state resource base, this can be achieved through an effective
cost recovery mechanism through user charges and phasing out of non merit subsidies. It
is accepted that the state governments will continue to play a crucial role in enhancing
social infra structure through investments in education, health sanitation etc. To ensure
that the critical level of investment is made in these sectors, it is necessary to rely on
effective cost recovery mechanisms in these sectors. Cost recovery on essential economic
and social services has been declining steadily over the years impacting there by a
product quality and resource augmentation for the respective sectors.”
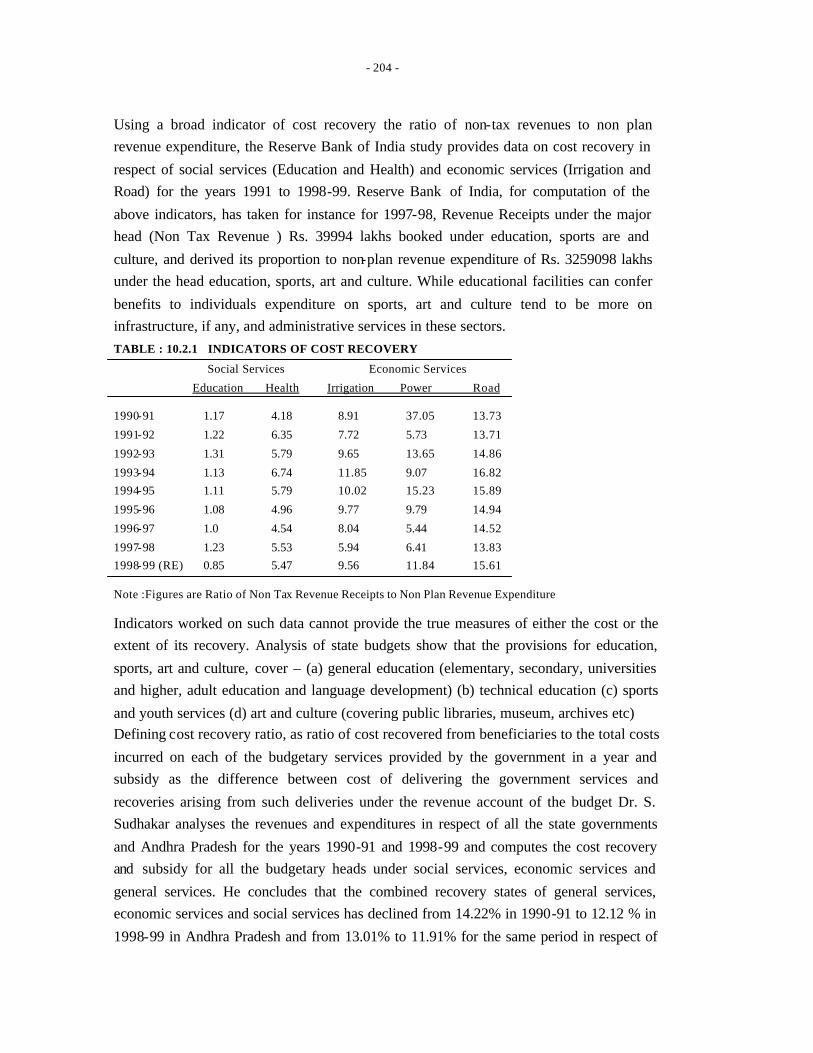
- 204 -
Using a broad indicator of cost recovery the ratio of non-tax revenues to non plan
revenue expenditure, the Reserve Bank of India study provides data on cost recovery in
respect of social services (Education and Health) and economic services (Irrigation and
Road) for the years 1991 to 1998-99. Reserve Bank of India, for computation of the
above indicators, has taken for instance for 1997-98, Revenue Receipts under the major
head (Non Tax Revenue ) Rs. 39994 lakhs booked under education, sports are and
culture, and derived its proportion to non-plan revenue expenditure of Rs. 3259098 lakhs
under the head education, sports, art and culture. While educational facilities can confer
benefits to individuals expenditure on sports, art and culture tend to be more on
infrastructure, if any, and administrative services in these sectors.
TABLE : 10.2.1 INDICATORS OF COST RECOVERY
Social Services Economic Services
Education Health Irrigation Power Road
1990-91 1.17 4.18 8.91 37.05 13.73
1991-92 1.22 6.35 7.72 5.73 13.71
1992-93 1.31 5.79 9.65 13.65 14.86
1993-94 1.13 6.74 11.85 9.07 16.82
1994-95 1.11 5.79 10.02 15.23 15.89
1995-96 1.08 4.96 9.77 9.79 14.94
1996-97 1.0 4.54 8.04 5.44 14.52
1997-98 1.23 5.53 5.94 6.41 13.83
1998-99 (RE) 0.85 5.47 9.56 11.84 15.61
Note :Figures are Ratio of Non Tax Revenue Receipts to Non Plan Revenue Expenditure
Indicators worked on such data cannot provide the true measures of either the cost or the
extent of its recovery. Analysis of state budgets show that the provisions for education,
sports, art and culture, cover – (a) general education (elementary, secondary, universities
and higher, adult education and language development) (b) technical education (c) sports
and youth services (d) art and culture (covering public libraries, museum, archives etc)
Defining cost recovery ratio, as ratio of cost recovered from beneficiaries to the total costs
incurred on each of the budgetary services provided by the government in a year and
subsidy as the difference between cost of delivering the government services and
recoveries arising from such deliveries under the revenue account of the budget Dr. S.
Sudhakar analyses the revenues and expenditures in respect of all the state governments
and Andhra Pradesh for the years 1990-91 and 1998-99 and computes the cost recovery
and subsidy for all the budgetary heads under social services, economic services and
general services. He concludes that the combined recovery states of general services,
economic services and social services has declined from 14.22% in 1990-91 to 12.12 % in
1998-99 in Andhra Pradesh and from 13.01% to 11.91% for the same period in respect of
- 205 -
All States. In respect of all states combined the cost recovery ratio came down from
19.65% in 1990-91 to 14.36% for general services, from 2.10% to 1.93% for social
services, while for economic services the cost recovery ratio improved from 20.59% to
23.43% for the same period.
Arguing that there is flow of benefits to the non –poor, defined as middle and high income
groups Dr. Sudhakar argues that if the subsidy derived by the non poor is recovered
through higher user charges by adopting normative cost, the cost recovery rate can go up
from 1.5% to 44.54% in Andhra Pradesh alone. While the analysis of distribution of
subsidies among income group is based on data collected by the NSSO, and its survey of
consumer expenditures, the suggestion appears to ignore the administrative difficulty in
operating such a system of differentials.On the other hand devising a system of recovery
of costs, based on a simple system of nominal charges for all individuals is likely to be
more effective.
There is clear need for different approaches to cost recovery for social sector, economic
sector and general sector. For instance, in the economic sector it is far easier to relate the
services provided, as for instance water for irrigation and power to computation of costs,
which take into account the capital and revenue expenditure. The computation of cost
recovery ratios for social sectors such as those made by Dr. Sudhakar omit the capital cost,
for convenience of calculations and concentrate only on revenue expenditure. Such a
simplistic approach may not be valid for economic services which involved heavy capital
expenditure.
To take the example of irrigation and flood control, which forms part of economic
services, revenue realised for all states in 1990-91 is shown as Rs. 253 crores as against an
expenditure of Rs. 3456 crores giving a cost recovery rate of 7.33% and a subsidy Rs.
3203 crores. By 1998-99, the revenue has increased to Rs. 799 crores and the expenditure
to Rs. 8827 crores giving a cost recovery rate of 9.05% . However the subsidy as a
percentage of total subsidy provided in economic services seems to have increased from
19.30% in 1990-91 to 21.45% in 1998-99.
This is largely on account of the fact that while laying considerable emphasis on recovery
of costs, making fine theoretical distinction between merit and non merit subsidies and
arguing for recovery of cost only from the non-poor, administrative difficulties in
ident ifying and classifying the beneficiaries into the poor and non poor, and evolving
workable system of recovery is overlooked.
There are also political pressures and class interests that get built into this. To cite an
example Mahashtra Government had fixed the water ratio for lift irrigation schemes,
constructed and implemented by the farmers on their own at Rs. 1900 per hectare for

- 206 -
sugar cane in the area of operations of Irrigation Development Corporation, where as the
water rates in the area under the jurisdiction of Government Departments was Rs. 775 per
hectare. On receiving representation from farmer regarding the differential the government
brought down the water ratio to Rs. 950 per hectare in respect of lift irrigation schemes
constructed and implemented by the farmers at their cost. This revision was with the
stipulation that the rates will be increased by 10% every year subject to the upper limit of
50% of water rate for flow irrigation. It is well known that there are capital costs and
operating costs differences between surface flow irrigation and lift irrigation and the
benefit received varies from crop to crop.
The realisation that water is a scarce input has led to the prescription in National Water
Policy of 1987 that water rate should be determined in such a manner as to convey its
scarcity value to the user motivating them towards efficient water use and at the same time
being adequate to cover annual maintenance and operation costs and recover a part of the
fixed cost. The Tenth Finance Commission also observed that the loses incurred by
irrigation projects have continued to mount increasing from Rs. 367 crores in 1987-88 to
Rs. 881 crores in 1992-93. The commission suggested that irrigation receipts should cover
not only operating and mainte nance costs, but also give a return of one percent per annum
on capital.
The Tenth Finance Commission assumed a norm of Rs. 300 per hectare for the utilized
potential and Rs. 100 per hectare for the unutilized potential to compute the operating and
maintenance costs as against Rs. 180 and Rs. 60 assumed by the Ninth Finance
Commission, In many of the states even this cost is not being recovered.
As the Tenth Finance Commission observed “while the tax revenues have been more
buoyant than estimated by successive Finance Commissions, non tax revenue have
consistently fallen behind. This has been a major reason for the yawning gaps between
receipts and the expenditures which have eroded the revenue resources of the states and
crippled their efforts in providing reasonable services in many vital sectors like power,
transport, irrigation and water supply. All these constitute vital elements of infra structure
and hold the key to faster development in the new economic regime. They are critical for
attracting investment. We are painfully conscious of the fact that most states have
preferred the softer option of letting services deteriorate rather than improving their spread
and quality by realising economic return on the investments in these areas and deploying
the additional resources for these purposes” (Report of the Tenth Finance Commission
1994 p.9)
It must however be noted that serious financial problems have made the various state
governments realise that the revision of rates and tariffs in power irrigation and other
- 207 -
sectors is long overdue . Government of Andhra Pradesh appears to have made in the right
direction in making public the costs involved in provision of subsidies and charging low
rates and moving towards levy of user charges and allowing them to be retained by the
departments for improving the quality of services Such an approach , if adopted by other
states , can make a significant difference , initially to the mindset of the people and
eventually to the budget figures.
While attention has been paid to cost recovery and levy of user charges for services porovided by
government departments like hospitals, registration department, etc required degree of detailed
attention to the fixation of tariff in the Power, Transport and Water is rather slow in coming.
Reform of the State Electricity Boards in the States of AP. Orissa , Arunachal Pradesh, Haryana ,
Karnataka and Kerala, Maharashtra have lead to the creation of statutory regulatory commissions
in some of the states. The considerable resistance in public to the fixation of revised tariff’s
primarly because, the element of cross subsidisation involved is very large. While agriculture
tariff continous to be low for political reasons, the burden of meeting the cost of inefficient
operations of the Electricity Board is cast almost entirely on Industrial and Domestic consumers.
Further privitasation and a large number of power purchase agreement with indipendent power
producers, has brought in its wake serious problems of financing arrangements, with sovereign
gurantee on the one hand and defective scrutiny of capital costs estimates of the private projects.
The earlier practice of Central Electricity Authority scrutinising and according technical
clearances need to be enforced without any exceptions, on the misconcieved process of
liberalisation.
Similarly the transport sector marked by State Road Transport Coorporations, appeared to be
getting infected with the new wave of privitasation. Public transport facilities have a role to play
in state commerce and services, and the context of fluctuating fuel charges resulting from
international oil prices, there is a need to insulate the sector from volatile oil price changes.
Consideration of Fuel Economy and Cost Recovery are vital aspects that need to be governed by
techno-economic considerations apart from passerger fares. Frequent changes in this areas
ostensibly to ensure economy of operation, results in voilent public protests and dislocation of
economy activity. A holistic view of the costs to the economy rather then a narrow view of cost
recovery by a corporate body need to be taken. Some initiatives at the national level, in this
regard can bring about a degree of uniformity and balancing of interests of the passengers. Road
transport undertakings, commercial vehicles manufacturers and petrolum products suppliers.
Water supply is a sensitive area in which attention should be paid both to rates revision as
well as conservation of the available restricted supplies. While irrigation water rates
continue to be kept low in many states, drinking water supply does not appear to indicate
any uniformity for tariff fixation from the State and municipal agencies. Some attention
to the rationalasation of the rates in these sectors is overdue.

- 208 -
XI. SUMMING UP AND SUGGESTIONS
The emergence and spread of fiscal problems in the States, following the persistent fiscal
challenges faced by the Centre has come to be widely acknowledged by the authorities at
the Centre and the States. Gross fiscal deficits of State Governments which was Rs.
18787 crores (3.3% fo GDP at current market prices) in 1990-91 has risen to an estimated
Rs. 96073 crores (3.9% of GDP) in the budgets for 2001-02 . Revenue deficit has risen
from Rs. 5309 crores (0.9% of GDP) to Rs. 48046 crores (1.9% fo GDP) during the same
period. The persistant fiscal deficits of the States had led to a steady accumulation of debt
with the outstanding debt reaching Rs. 504248 crores (23.1% of GDP) by end of March
2001, marking a five fold increase within a decade from a level of Rs. 110289 crores
(19.4 % of GDP).
State Finances have deteriorated particularly in the second half of nineties particularly
since 1995-96. In the five years between 1990-91 and 1995-96, Gross Fiscal Deficit of
State Governments had increased by just about Rs. 12639 crores and revenue deficit by
Rs. 2892 crores. But in the next five years upto 2000-01, Gross Fiscal Deficit increased
by Rs. 58691 crores and Revenue Deficits by Rs. 43117 crores. During this period the
outstanding liabilities increased by Rs. 379607 crores, as against Rs. 101936 crores in the
first five years. Further the average interest rate and debt steadly rose from 9.2% in 1990-
91 to 11.9% in 1995-96 and 13.3% in 1999-00.
The frightening dimensions of the financial situations was taken note of by not only
Union Government but also the State Governments. At the meeting of the inter-state
council held on January 22, 1999, the Chief Ministers of 12 States drew attention to the
poor financial health of the States and the ir high borrowing levels. With the worsening
situation in the following years, the Union Government, Planning Commission and
Reserve Bank of India initiated a number of measures to put the State Finances
back on rails. The State Governments were also quick to realise the depth of their
financial distress. This is reflected in the issue of fiscal strategy papers by
Government of Andhra Pradesh, the announcement of a medium term fiscal policy
by the Government of Karnataka, and the issue of ‘White Papers’ by the
Maharashtra, Kerala and Tamilnadu Government during 2001.
Some aspects of Centre- State relations, particularly the role and procedures of the
Planning Commission and the Finance Commission in the transfer of resources from
Centre to the States as also the new procedures regulating to Ways and Means
advance from RBI to the States, Overdraft regulations of the RBI and the MOUs for
- 209 -
sectoral reforms , all impact on the quality and pattern of Public Expenditure in the
States.
Finance Ministry’s Initiat ives
The Central Government, more specifically the Ministry of Finance has taken more active
role in redefining the modalities of arranging discretionary transfers as also inducing the
states to adopt measures of fiscal and budgetary reforms appropriate to their specific
situations. The Department of Expenditure of Ministry of Finance has also taken initiative
in introducing Memoranda of Understanding with the State Governments in sectors
like Power that impact on the State Government Finances, the Power Ministry had as part
of power reforms, signed an MOU with 14 State Governments, with the avowed purpose
of saving the State Electricity Boards, from falling into a debt trap apart from ensuring
supply of power in adequate quantum and quality. The Union Government had asked the
Finance Commission to draw a monitorable fiscal reforms programmmes aimed at
reduction of revenue deficits of the states and to recommend the manner in which
grants to cover deficits could be linked to implementation of fiscal reforms. The Eleventh
Finance Commission recommended the setting up of an Incentive Fund, with two parts;
the first comprising 15 % of the withheld portion of grants recommended to cover the
deficit (Rs. 5303.86 crores) and the second part to be created by Central contributioion
equavalent to 15% of the Revenue Deficit Grant recommemnded by the Finance
Commission (Rs. 5303.86 crores). The total availibility in the Incentive Funds is Rs.
10,607.72 crores to be aportioned at the rate of Rs. 2121.54 crores over a five year
period from 2000-01 to 2004-05. The Central Governemnt has setup this fund and the
releases will be based on single monitorable, fiscal objective, - each State should show
minimum improvement of 5% in the Revenue Deficit/ Surplus as a proportion of the
Revenue Receipt, and each state should prepare a medium term fiscal plan. A number of
states have prefered medium term plans and are in the process of implementing fiscal
reforms to increase revenue and improve quality of expenditure.
Emergency Relief
Patterns for providing Central assistance for natural calamity relief and disaster
management have also been criticized as lacking in operational flexibility and the
Eleventh Finance Commission was required to study this, and it has proposed some
changes. While recommending the continuation of the existing schemes for providing for
contribution by Centre and States in the ratio of 75 : 25 to calamity relief fund. It has also
recommended the discontinuance of the existing National Fund for Calamity Relief and
recommended the creation of the National Calamity Contingency Fund in public
account of Government of India. An initial core amount to Rs. 500 crores will be
- 210 -
provided by the Centre to this fund. Assistance provided by the Centre to States for
calamity relief will be financed by special surcharge on Central Taxes for a limited
period, and withdrawal from the fund will be replenished by the levy of special surcharge.
Government of India has accepted the recommendation.
Planning Commission As the Planning Commission has also begun to indicate approval for what has been
described as the ‘Core Plan’ in respect of the states which are not able to show
adequate resources to cover the proposed Plan Outlays for each Annual Plan, the
states have been obliged to look closer and deeper into their financial positions, marked
by lower growth of revenue as against sharp growth in committed expenditures such as
salaries, pensions and interest payments. Sri K.C.Pant, Dy. Chairman Planning
Commission, has indicated, to the Economic Editors Conference that after the
implementation of Fifth Pay Commission, the finances of the states were badly hit,
leading to diversion of funds from critical areas towards current conceptions, and that the
commission has begun to place conscious emphasis on project based assistance for
core critical sectors like power, irrigation, rural connectivity and rural electrification.
The Planning Commission has also begun to focus attention on issues relating to
implementation while designing pla n support to the state and is considering the setting
up of an annual fund at the Planning Commission for releasing funds to the states on the
basis of performance whereby the states undertake reforms and improve governance as
per agreed bench marks. Since external resources have to be tapped to ensure even flow
of resources to promote balanced development, the Planning Commission has setup
project preparation facility to assist the State Governments in preparing and posing
project reports for external assistance. In a bid to bring about the requisite degree of
focus of state level issues, the Planning Commission has also undertaken the preparation
of State Development Report in coordination with the State Governments and
independent agencies. (See Hindu Business Line, Oct 19th 2001 Pg.8)
State Initiatives RBI’s Study of State Finances, 2001 has detailed major policy initiatives of the States, in
fiscal, institutional and sectoral areas. As Dr. Y.V.Reddy, Deputy Governor, RBI has
pointed out in “Fiscal Reforms at State level Reviews and Prospects”, (RBI, Bulletin,
January 2001), that as the reforms progress, the relative balance between Centre and
States tend to tilt in favour of the States which have taken important policy initiatives that
could be classified broadly into, fiscal consolidation, institutional and sectoral reforms.
The initiatives fall in the broad categories of (a)revenue mobilisation, (b)expenditure
management (c)reforms of state public enterprises, (d)rationalization of posts in
- 211 -
Government Departments, (e)identification of performance indicators to assess the quality
of expenditure restructuring, (f)rationalisation of taxes and introduction of VAT,
(g)review of user charges, and (h)initiation of sectoral reforms in the areas of
infrastructural development and power. Some of these initiatives have made significant
progress in nearly all the states while certain others like the Public Sector Reform and
Power Sector Reform have faced heavy weather, in implementation schemes.
While the State Governments have begun the earnest efforts to ensure better expenditure
management, they have also, after initial hesitation, begun to respond to Centre’s
suggestion on rationalization of tax structure, better enforcement , and tax constraints.
Among the significant steps in this areas are the preparations for introduction of Value
Added Tax (VAT) by April 2002. Centre has also announced that it will transfer service
tax revenue to the states in order to compensate them for revenue losses on account of
switching over to VAT Regime from April1, 2002.
Review of the State Budgets for 2001-02 show that several states have proposed measures
aimed at strengthening the revenue base and containing expenditure. The additional
resource mobilisation proposed for 2001-02 amount to Rs. 1997 crores, with a substantial
increase in the States own revenue receipts.
Many of these improvements are in the nature of intentions announced, and not yet full
throated enough to compel serious attention from the implementing agencies. The fiscal
strategies announced have been covered in an earlier section.
Reserve Bank of India Measures
The RBI in its role as Central banker, debt manager and monetary authority has not only
taken steps to bring uniformity in the presentation of budgetary data, but also provided
guidance on cash management techniques, setting up of a consolidated sinking fund in
order to retire debts, introduction of flexibility in market borrowings and timing their
access to market and further recommend steps to ensure prudent financial management
and preserving credibility of guarantees.
Sinking Fund RBI had proposed in 1991-92 the creation of a Consolidated Sinking Fund for the States
and had reiterated it in 1993-94. The proposal was once again refloated in 1998, and a
Consolidated Sinking Fund (CSF) was set up in 1999-00 to meet redemption of Market
Loans of State Governments. According to this scheme each state government has to
contribute 1 to 3 % of its outstanding Market Loans each year to the CSF which is
- 212 -
administered by a Central Accounts Section of RBI. As on June30th 2001, Andhra
Pradesh , Arunachal Pradesh , Goa, Maharashtra , Mizoram , Meghalaya , Tripura ,
Assam and West Bengal have set up CSF.
Accretion to the funds are invested in Government of India Securities, and the amount
invested sofar is Rs. 670 crores. RBI has also begun to help State Governments in fine
tuning market borrowings, keeping a close watch on not only the size of market
borrowings, the weighted average yield of state government loans, and maturity profiles
of state government loans.
Ways and Means Advances An analysis of State Finances revealed increasing pressures and problems of liquidity
management, the Union Finance Ministry and the Reserve Bank of India began to pay
close attention to the health and the needs of State Finances by monitoring Ways and
Means advances and overdrafts provided by the RBI to the States.
The Reserve Bank of India also constituted in August 1998 an Advisory Committee on
Ways and Means Advances to the State Governments, with Sri B.P.R Vithal as the
Chairman, the Committee was requested to consider the rationalisation, and if need be
revision of the limits of Ways and Means Advance to the State Governments. It may be
mentioned that RBI had been operating, since 1938 a scheme for Ways and Means
Advance with a Minimum Balance to be kept by the states and the Ways and Means
Limits expressed as a multiple of the Minimum Balance for all the States. The Minimum
Balances and the limits have been period ically revised, as in 1967, 1972 ,1976 ,1978
1982, 1986, 1988, 1993 and 1996. The Vithal Committee recommendations covered,
normal and special Ways and Means Advance raising the limit from Rs. 2234 crores to
Rs. 3685 crores for all states specifying different limits for 23 states. It reviewed the
Overdraft Regulations Scheme, and held that the scheme had worked well as a
disciplinary mechanism and did not recommend any relaxation. It however suggested that
apart from the present limit of ten consecutive working days, there should be a ceiling on
over drafts, hundred percent of WMA limits and a restriction of the number of days the
states could operate over draft to 20 working days in a quarter. According to RBI records
16 states had resorted to overdrafts in 1999 and two states could not clear their overdrafts
within the stipulated time limits obliging RBI to stop payments on their behalf.
Based on the recommendations of the Report of Group of State Finance Secretaries
received in Jan 2001, the scheme of Ways and Means advance has been revised and made
effective from Feb 1, 2001 the main features of the Scheme is as follows
- 213 -
(i) The normal WMA limits are worked out taking into account the three years’
average of revenue receipts and capital expenditure for fisca l years 1997-98,
1998-99 and 1999-2000 and applying to this base a ratio of 2.4 per cent for non
special category States and 2.9 per cent for special category states.
(ii) As per the revised scheme , the total normal WMA limits work out to Rs. 5,283
crores as against the earlier limit of Rs. 3,941 crore.
(iii) The special WMA limits continue to be linked to the investments made by State
Governments in the Government of India dated securities and Treasury Bills.
(iv) A State is allowed to run an overdraft for 12 consecutive working days instead of
10 days earlier.
(v) The overdraft shall not exceed 100 percent of normal WMA limits. If overdraft
exceeds 100 percent of normal WMA limits in a financial year, the Reserve Bank
will on the first occasion advise the State Government; on the second or
subsequent occasions, the State shall be given five working days instead of the
notice period of three working days earlier to bring down the overdraft amount
within the level of 100 percent limit. If this is not adhered to, payments will be
stopped.
(vi) The WMA Scheme 2001 is subject to review in its entirety at the end of two
years.
According to the Reserve Bank of India the recourse to WMA has been generally higher
during to 2000-01 than in the previous year. As on March 31st 2001, the outstanding
WMA and Overdrafts of the State Governments amounted to Rs. 6811 crores as against
Rs. 7519 crores at the end of March 2000. Nineteen States resorted to Overdrafts as in the
previous year and only three states could not clear the Overdraft with in the stipulated
time, forcing RBI to stop payments on their behalf.
Guarantees
Since the fiscal position of the states is influenced by the nature and levels of contingent
liabilities including guarantees on behalf of PSU’s and Cooperatives, the position is
being closely reviewed. According to the RBI the Outstanding guarantees extended by the
17 major states amounted to Rs. 124813 crores i.e. (6.4% of the GDP) as at the end of
March 2001 marking a steep rise from the level of Rs. 40159 crores (6.5% of the GDP) at
the end of March 1992. The RBI Bulletin (Oct 2001) reports that many states have taken
initiatives to place a ceiling on guarantees and that statutory ceiling and gurantees have
been placed by Gujrat, Karnataka, Sikkim and W. Bengal while administrative ceiling
have been imposed by Rajasthan and Assam.
- 214 -
SUGGESTIONS With the advent of era of Economic Reforms , the Governments at both the Centre and
the States , had begun to articulate concern for fiscal health, and to make announcements
of measures, which few, if any of them are willing to pursue to their logical end. In the
early Nineties, one could doubt whether mere consciousness of a crisis round the corner,
was sufficient to improve the fiscal; health of the state governments but, it can now be
stated, that financial and economic crises, have been handled at the Centre and the States
in India with a measure of circumspection and determination with a multipronged
approach. Neither Expenditure control nor Austerity measures are new to the Unio n
Government but the State Governments were not consistent. The responses in the past
were in the nature of hesitant action, which appeared to be mere containment of the
problem. The responses could even be termed situational responses, and not long term
strategy.
In some periods, as in the mid Seventies, when drastic austerity measures like wage
freeze were taken up by the Union Government to control expenditure , and Emergency
was declared to bring discipline in the economy and political spheres, they were
attended with serious political consequences. They were assailed as impinging on the
democratic freedom of citizens. While the economy gained from the Emergency measures
of 1975, political and democratic freedom seriously suffered, The choice between
political freedom and economic prosperity has larger value implications. The present
Structural Adjustment Programmes carried out by the Centre for sometime now and
prescribed for the States more frequently now, does not answer satisfactorily the
questions relating to equity. Given the Federal character of the country, and its reasonable
success in operating a steady and stable democratic Government there are no easy
answers to questions of discipline whether in financial or any other sector.
With continuing Inter State Disparities in levels of development, strategies formulated by
the Centre for itself or by any particular state cannot be applied to other states. There is
need for state specific programmes of action , with a proper time frame, that
maintains a balance between Economic, Social and Political value systems and
factors operating at the ground level.
The rapid survey however indicates that even what were once considered financially
well managed States like Maharashtra and Tamil Nadu have begun to slip into the morass
of financial mismanagement, possibly because, tax performance and expenditure
control were not among the premium virtues in attracting devolution and transfers
of central resources, judging by the criteria of successive Finance Commissions and
the Planning Commission This needs to be reversed, and inter state disparities in
- 215 -
central assistance should be relatable to identifiable difficulties in the fiscal
performance, and differences in natural resource endowment and logis tical
problems as those faced by the ten special category states, most of which border
Himalayas and the hill ranges of the North East.
It is unfortunate that the recommendations for higher devolution and transfers of central
resources can, as in the case of the Eleventh Finance Commission, come to be viewed as
unduly leaning towards certain States like West Bengal, Bihar, Uttar Pradesh, Madhya
Pradesh and Rajasthan and not recognising the performance of the other states. In the
process, it has provided avoidable grounds for grievances to be felt by some States, who
appear to feel that prudence in financial management is not a preferred virtue in the fiscal
financial system of India. Such subterranean reasons render, lofty announcements of
fiscal reforms, and discipline less meaningful in the real world than they should be. The
creation of Incentive Fund by the Centre may make some difference to the perceptions
of State Governments.
The Union Finance Minister Shri Yeshwanth Sinha announced the appointment of the
Expenditure Reforms Commission in the Budget for 2000-01, and followed it up with
the declaration of his intention to carry out structural changes in the composition of
central government expenditure and effect economy in non plan revenue expenditure
with greater vigour while improving the quality of plan expenditure. Some of the
measures announced like levy of User Charges, scrutiny of staff strength with a
view to restricting new recruitment, creation of surplus pool employees to redeploy surplus staff and use of Information Technology to promote efficiency in activities
with large interface with people , could be equally applied to the State Governments.
Though the Union Government has received the report of Expenditure Reforms
Commission, in respect of six Ministries, the implementation appears to be rather slow,
on account of reluctance displayed by the Ministries. Finance Minister also introduced a
Fiscal Responsibility Bill in the Parliament in December 2000, seeking to reduce the
fiscal deficit to 2% and completely eliminate revenue deficit in the next five years. A
critical examination of the provision of this bill shows that the ambitions are rather lofty,
and operational problems in implementation considerable enough, to reduce the chances
of top gear implementation. The report of the Parliamentary Select Committee in Nov
2001, suggesting some modification in the provisions may enable a more widespread
acceptance by states of legislative measures for restoring fiscal health.
It must however be said, that the example set by the Union Finance Minister and the
Prime Minister in not hesitating to place before the Parliament and the pubic the true state

- 216 -
of fiscal health of the Centre and the States, have now been followed by all the States
taken up for study, with each coming up with a White Paper or a Strategy Paper on the
state of finances and the steps proposed to be taken to restore health to the system.
The Center’s lead and exhortation have led to fiscal reform measures by the State
Governments in 2000-01, which, as mentioned earlier can be classified into fiscal,
institutional and sectoral categories. These initiatives have been detailed by the Reserve
Bank of India in its Study of States Budgets 2000-01. (Pages 6-10). Whether this line of
treatment can completely cure the ills of the State Finances is a matter on which opinions
can differ, as the commitment of the State Governments, vary from state to state and
region to region. One should not miss the problem posed by slender majorities of the
parties in power in the states, and the coalition governments that have become a
conspicuous feature of the Indian Political System.
As summed up by Dr. Y.V. Reddy, “there is a wide spread realisation about the need for
fiscal stabilisation and reform. Each State has devised its own measures but most of these
have a common thread of reforms of public enterprises, reduction in subsidies,
expenditure containment and revenue augmentation. There are however severe
limitations in regard to the adjustment effort in view of the large magnitudes of
committed expenditures viz., salaries, pensions and interest charges.”(see RBI
Bulletin January 2001 Page 90)
While the difficulties pointed out by Dr.Reddy are real, we would like to suggest, in the
light of our study that the states should immediately pay greater attention to fiscal
integrity, audit and accountability, and regain for the system at least a part of the
sanctity associated with obtaining legislative approval. Persistence, year after year of
variations between budget estimates, revised estimates and actual expenditures is a bad
reflection on the quality of budget preparation and discipline. While budget preparation
and presentation to Legislature appear to involve, the gathering and disp laying of
disparate details running into 12,000 pages, as pointed by Dr.M.D.Godbole in a study of
Maharshtra budget, the responsibility for making budgetary provisions complied with
and respected by different Government departments appear to be very thinly
spread. This may be to some extent met by legal enactments like the Fiscal
Responsibility and Budget Management Bill (Bill no 220 of 2000) introduced in the
Parliament in Dec 2000. While the medium term fiscal policy statement, the fiscal
policy strategy statement and macro economic framework statement, proposed to be
presented to the Legislature along with annual budget may to some extent meet the
problems of preparing Annual Budgets without the Government having full control over
factors like those affecting revenue estimates, like seasonal conditions and business
- 217 -
environment influenced by external factors in a globalised economy, the essence of the
Bill should be seen in the three year rolling target for prescribed fiscal indicators
with specification of underlying assumptions. Such an approach can be made by the
state governments also. However, the measures to enforce compliance like presentation,
every quarter, trends in receipts and expenditure in relation to the budget, appear less
practical and needless. The present time frames in which government departments initiate
proposals, obtain approval and act on them militate against such a short time frame. It
must also be ensured that this does not become yet another ritual observed with regularity
but with little sanctity. In this connection, it is worth noting that, as observed by Dr.
A.Premchand that the relationship between Macro Economic Management and Micro
Economic Planning is important and that coordination within the Government agencies, concerned with micro management continues to be important. Such
coordination however needs to be examined not at the aggregate level of broad
relationships between planning and finance agencies but in terms of specific component
plans and budgets and the way in which bridges may be constructed between the two.
(A.Premchand, ‘Planning and Budgeting in Government, Practices and Issues’ in Ravi
Kathpalia, Financial Management and Accountability, 1994). In this connection, the
categorisation of accounts, into plan and non plan, developmental and non
developmental, have been helpful to some extent, but over the years, operational
departments appear to have lost track of the significance of this difference and
provisions are made and used without grasping the significance . In the Union Budget
1998-99, the Finance Minister had proposed the constitution of a Task Force to examine
the question of eliminating “the Plan and Non Plan” distinction in a Budget and to make
recommendations for a functionally viable and more focussed presentation of
Government expenditure in the budget. The Eleventh Finance Commission had also dealt
with this issue as in its view excessive attention on Plan Expenditure has resulted in
neglect of maintenance of past projects which is classified as non plan. While this
tendency needs to be curbed, mere removal of this distinction may not be sufficient,
as what is needed is improvement in the quality of budget preparation, with due
attention to, and prior determination of inter se priorities of alternative claims for
the ever shrinking resources of the state and Union Governments. If the quality of
decision making has to be improved State Governments may need to move in the
direction of reforms suggested in the case of Maharshtra Government. These include
presentation of only six documents in the legislature Financial Statements, Schedule of
Demands, Budget Memoranda, Budget at a Glance as presented by Government of India,
Budget in Brief in a revised form to provide essential information. Dr.Godbole has also
suggested presentation of a new document, Significant Pointers of finances of State
Government mostly related to the medium term plan. Reduction in number of grants,

- 218 -
presentation of profile of debt of the state, classification of state’s outstanding debt,
contingent liability, Explanation of variations in the estimate, consolidated list of
works in progress with details of original and revised cost estimates, quantum of
devolution to local bodies, data on salary and allowances of employees of
government, local bodies and grant-in-aid institutions, pension liability, details of
tax concession given, off budget transaction involving borrowing by state PSUs ,
performance of the PSUs, their credit rating, flow of funds from Central
government are among the significant pointers to be provided. Improving the
presentation aspects of the budget can help improve the quality of legislative
control, and monitoring of expenditure.
The real improvement in fiscal health of the state can come about only by more
detailed attention to the resources side, with studies of trends in tax and non tax
revenue, and review of the existing frame work for cost recovery and reduction of
subsidies. There appears to be a perceptible difference in the approaches to cost recovery
and reduction of subsidies in different sectors. Even the State Governments which have
moved in this direction, appear to have done it in Social Services and to some extent in
General Services rather than in Economic Services like irrigation where the scope for
recovery is higher.
It is also seen that while some State Governments have set up Expenditure Priority
Committees and others Expenditure Reforms Commission, the mechanism for scrutiny of
projects, particularly their estimates of cost and viability, have remained woefully
inadequate, in relation to the nature of commitments made. Mechanisms like
Expenditure Finance Committee and Public Investment Board, which provide some
degree of pre investment scrutiny of feasibility reports, now obtaining at the Cent re
need to be introduced in the States. The area which calls for serious attention is the
time phasing of investments, with provisions in the budget matching the needs of
approved projects. The practice of spreading available resources thinly over a large
number of projects in several sectors, continues to plague Public Expenditure
Management in the states. The proposed project preparation facility at the Planning
Commission can make some difference in due course, if the State Governments avail
this facility in adequate measure. For its part the Planning Commission could
consider a training State Government employees in project formulation and
appraisal rather than taking up the project preparation itself. In this connection it
may be recalled that the Finance Ministry and the Planning Commission had
initiated a similar scheme of training implemented by the Department of Personnel
and Administrative Reforms in the late nineties. The scheme meant for a Union
Ministry officials was implemented by Academic and Management Institutions.
- 219 -
The proposed scheme of training could however be implemented by the Planning
Commission with expert faculty from authorities like the Central Electricity
Authority (CEA).
It must be observed in this regard , that the liberalisation and deregulation, adopted as a
philosophical mode for governments in the 21st century has come to be interpreted as a
freedom from scrutiny and preinvestment appraisal. Stipulation of terms and
conditions of approval, for projects and schemes taken up with Public Funds, a common
practice in the earlier era, have become some what rare. Cost and time overruns, continue
to be condoned and funded further by both the governments and the financing
institutions, as a matter of course, without techno-economic scrutiny of the changes in the
scope of projects, and increasing costs relatable to factors, those outside and those within,
the control of project authorities. Tightening of procedures relating to approval of
revised costs estimates is an urgent necessity.
The prescriptions of Audit and Legialative Accountability have ceased to be matters of
serious import, to be given appropriate recognition by way of corrective action. The
Reports of the Public Accounts Committee, Estimates Committee and the Committe e on
Public Undertakings are at the moment expected to be presented to the Legislature along
with action taken reports by the governments. There appears to be serious time lag in the
presentation of the reports and much of it is of a postmortem of a dead cause. Creation of
a mechanism for concurrent audit and monitoring by a mutli-disciplinary group
with representatives with administrative, technical and audit professional background need to be deliberated and decided upon, as at the moment, project
authorities and audit appear to take adversarial positions .
Considering that the total outstanding debt of the states, had increased from a mere Rs.
23067 crores in 1980-81 to Rs. 108203 crores in 1990-91 and very sharply rising to Rs.
498841 crores, the need to consider action on a frequently made suggestion for a
constitutional cap on borrowings has become urgent. In this connection it must also be
observed that some of the state governments, like Andhra Pradesh appear to be
getting encouragement to access directly International Financial Agencies. This
needs to be curbed, for one of the major reasons for distortion of plan priorities and
expenditure are the subtle dictations of these agencies. Constitutional and fiscal
propriety both demand a firm decision in this area.
The implementation of all these Suggestions can certainly tone up the fiscal health of the
State Governments. Measures for systemic recovery have to be not only carefully
formulated, with states specific context but also implemented with a degree of

- 220 -
circumspection, combined with determination, without expecting results in the short
term. While the fiscal problems of the states in India have been diagnosed before they
turned terminally critical, the course of cure and treatment has certainly begun.
Given the grey environment in which gross fiscal deficits and outstanding debts of states
have been increasing, crying for attention for quite some time one must welcome that a
beginning has been made by the State Governments covered in the study setting an
example to the rest of India. The publication of white papers on State Finances by the
Governments of Maharashtra, Tamil Nadu and Kerala and the announcement of Medium
Term Fiscal Strategy by Governments of Andhra Pradesh and Karnataka are important
indicators of the New Financial Approach of the State Governments. It will be some time
before, the effect can be felt, in the Budgets presented to the State legislatures and in the
field level implementation.
It is interesting to note that the Finance Minister of the financially weakest of the states
studied is optimistic. Kerala’s Finance Minister, Shri. K. Sankarnarayanan in his Budget
speech 2001-02 has stated “No doubt, the economy of the state is under siege today. But,
we have to move beyond the fragmented and broken finances of the states, …… and
move towards the goal with an unwavering disposition characterised by an abounding
optimism that is so eloquently summed up in Kumaran Asan’s words:
As there are luminious stars even in eerie
darkness and islands in oceans, so shall we
find a way to lead us out of these dire straits.”
Such optimism should be reassuring even to the most cynical of Economists. It is
said that “It is darkest before dawn “. May be the dawn is around for the state
finances.
a
BIBLIOGRAPHY ARTICLES 1. Abdul Aziz, “Management of Poverty alleviation programmes under Panchayat Raj
Institutions in Karnataka”, Journal of Social and Economic Development, Vol-II, No-2, July-Dec 2002, p.174
2. Abdul Shaban and Bhole, L.M., “Regional Disparities in Rural Development in
India”, Journal of Rural Development, Vol-19, No-1, Jan-Mar 2000, p. 103 3. Amaresh Bagchi, - ‘Rethinking Federalism’ overview of current debates with some
reflections in Indian Context. EPW, August 19, 2000, pp.3025-3035. 4. Ansari, M.M., ‘Financing of the State’s plan – A Perspective for Regional
Development.”, p.p.211 to 223. In I.S. Gulati (ed) ‘Centre State Budgetary Transactions’, Sameeksha Trust, Oxford University Press, Bombay, 1987.
5. Arjun Sengupta ‘India’s Economic reforms and the act of the fesible’ Review article,
on the Book” I.G. Patel “Economic Reform & Global change” Macmillan India, New Delhi, 1998, EPW, Dec 16/2000, pp. 4485 to 4498.
6. Arjun Sengupta, “ The Budget on the Context of long term Development”, EPW,
March 17/2001, PP.885-888. 7. Arvind Panagariya, “Millennium Budget: Behind its time?” EPW, March 4/2000,
pp.755-758. 8. Ashok Gulati and Sudha Narayanan, “Demystifying fertiliser and power subsidies in
India”, EPW March 4/2000, pp.784-794. 9. Badyopadhyay, D., “Andhra Pradesh: Looking beyond vision 2020”, EPW, March
17/2001, pp.900-902. 10. Bandopadhyay, D., ‘Policies Public Expenditure’, New tasks & possibilities”. EPW,
Dec 16/2000, pp. 4482 to 4484. 11. Bandyopadhyay, D., “Planning from below: Is Planning Commission Performing its
note?”, EPW, March 18/2000, pp. 970-973. 12. Basanta K. Pradhan, P.K.Roy and M.R. Saluja and Shanta Venkataraman “Rural-
Urban disparities: Income distribution, Expenditure pattern and Social sector”, EPW, July 15/2000, pp.2527-2552.
13. Bhaskar Dut ta and Bharat Ramaswami, “Targeting and efficiency in the Public
Distribution system: Case of Andhra Pradesh & Maharashtra” EPW, May 5/2001, pp.1524-1532.
b
14. Bohra, O.P., “Decentralisation and Devolution of Powers and Functions to Panchayats”, Journal of Rural Development , Vol-19, No-2, Apr-Jun 2000.
15. D’Souza, E (1998): Budget 1998-99: “Inadequate Policy initiatives “, EPW, Vol
XXXIII, Vol 29-30. 16. Deepak lal, Rakesh Mohan, I. Natrajan, “Economic Reformal and and Poverty
alleviation –a tall of theo surveys”, EPW, March 24/2001, pp.1017-1028. 17. Editorials, EPW, “ The Budget: Wrong priorities in health” and “Disaster
Management: Beyond central Assistance”, EPW, March 17/2001, pp.880. 18. EPW “ IMF & World Bank, Controversial exits”, Corespondent, EPW, January 15,
2001, pp.77. 19. EPW Editorial, “Beyond Budgetary Sums”, “Food security on the verge of collapse”
and “Health: Area of Concern”, EPW, March 4/2000, pp.747-749. 20. EPW Editorial, “Blow from EAC”, EPW, February 24/2001, pp.600. 21. EPW Editorial, “Kerala Local bodies and State Finances”, EPW, March 3/2001,
pp.709. 22. EPW Editorials “Half Baked Reform” and “EFC’s Restructuring’ plan: How
realistic?’, EPW, August 5/2000, pp.2795-2796. 23. EPW Research Foundation- “ All round Financial Sickening”, EPW, April 21/2001,
pp.1278-1284. 24. EPW Research Foundation “Finances of State Governments; at one series
presentation”, Special Statistics-29, EPW, May 19,2001 pp. 1748-1761. 25. EPW Research Foundation, “ Finances of Government of India”, Special Statistics
28, EPW April, 14/2001, pp.1249-1268. 26. Finance India – “Budget Speech 2001-2002, by Yeshwant Sinha”, Finance India,
Vol-XV, No-1, March 2001 27. Gautam Navlakha “Whither People Security” EPW, June 9/2001, pp.2038-2043. 28. George Kopits “Fiscal policy rules for India?” EPW, March 3/2001., pp.749-756. 29. Godbole, Madhav, “Making State Budget Trans parent and user friendly” EPW, April
21/2001, pp.1349.

c
30. Goldan, Biswantu & Mehta, Rajesh “ The Budget and Custom duties”, EPW, March 24, 2001, pp.989/991.
31. Gosh, D.N., “Budget proposals on public sector banks”, EPW, March 25/2000, pp.
1055-1056. 32. Govinda Rao, M., Amarnath, H.K., “Fiscal Corrections: Illusion and Reality”, EPW,
August 5/2000, pp.2806-2809. 33. Guhan, S., ‘Devolution Criteria of Finance and Planning Commission: from gamble
to policy’, pp.- in I.S. Gulati (ed). ‘Centre –State Budgetary Transfers’ Sameeksha Trust, Oxford University Press, Bombay, 1987.
34. Gulati, I.S., ‘Approach of the Finance Commission’ pp. 63-85 in I.S. Gulati (ed)
‘Centre-State Budgetary Transfers’ Sameeksha Trust, Oxford University Press, Bombay, 1987.
35. J.L. Bajaj, ‘Impact of pay revision on State Government’s finances’, Special Article,
EPW, May 29, 1999, pp. 1341-1351. 36. Jagdish Bagwati, “Growth, poverty and Reforms” EPW, March 10/2001, pp.843-846. 37. Jena, P.R., “Declining Budgetary Transfers to Orissa State”, Indian Journal of
Regional Science, Vol. XXXI 1999, No.2. pp. 47-60. 38. John Harriss, “ Globalisation and World’s poor Institutions inequality and Justice”,
EPW June 9/2001, pp. 2034-2037. 39. Joseph, K.P, “Budget deficits an are for ever”, EPW, Aug 19,2000, pp.2998-3001. 40. Kerala Tax Reporter- “Government of Kerala, Budget Speech, 2001-2002”, Kerala
Tax Reporter, Vol-9, Part-VIII, Aug 2001, p.27 41. Kerala Tax Reporter-“The Kerala Finance Bill, 2001 “Kerala Tax Reporter, Vol-9,
Part-VIII, Aug 2001,p. 61 42. Kripa Shankar, ‘Finances of U.P. Government, towards Bankruptcy’ , EPW, January
17, 1998. Pp. 86-87. 43. Kripa Shankar, “U.P. on the financial brink: State Governmenr’s Budget 2001-2002”,
EPW, May 19,2001, pp.1677-1780. 44. Krishna Kumar, ‘Education and Society in Post-Independence India- loooking
towards the future’, EPW, June 6, 1998, pp. 1391-1395.
d
45. Loyd I Rudolph & Suramme Hoeben Rudolph, ‘Iconisation of Chandrababu sharing sovereignty in India’s Federal Market economy”, EPU, May 5/2001, pp. 1541-1552.
46. Madhav Godbole, “ Maharashtra: Budget 2001-2002 A direction less and empty
ritual”, EPW, April 14/2001, pp.1171-1174. 47. Madhav Godbole, “Tasks before the Eleventh Finance commission”, EPW, March
18/2000, pp. 970-973. 48. Mahendra Dev, S., “ Economic Reforms, Poverty, income distribution and
employment”, EPW March 4/2000, pp. 823-835. 49. Mahendra Dev, S., “Agricultural Development and PDS, Lack of initiatives”, EPW,
March 25/2000, pp.1046-1049. 50. Mahesh C. Purohit”, National & Sub National VATS: A Road map for India”, EPW,
March 3/2001. PP.757. 51. Manpower Journal , “Manpower information system”, Manpower Journal, Vol-
XXXV, No-4, Jan-Mar 2000. 52. Martin Ravallion, “What is needed for a more pro-poor growth process in India?”
EPW, March 25/2000, pp.1089-1100. 53. Mihir Rakshit, “Restoring fiscal balance through legislative fiat: The Indian
Experiment”, EPW, June 9/2001, pp. 2053-2062. 54. Mohanty , G., “ Regional Development on Andhra Pradesh Journal of Regional
Science, Vol XXXI 1999, No.2, pp.69-81 55. Mundle, S., and M. Govinda Rao (1991): “Volume and Composition of Government
Subsidies in India” EPW., May 4/1991. 56. Nagaraj, R., “Indian Economy since 1980: Virtuous Growth or Polarisation ?”, EPW,
August 5/2000, pp.2831-2839 57. Nagesh Kumar, “Economic Reforms and their Macroeconomic impact”, EPW March
4/2000, pp.803-812. 58. Narayanamoorthy, A., “Impact of Drip Irrigation on consumption of water and
electricity” The Asian Economic Review, Vol-XXXVIII, No. 3 of Dec 1996 p.350 59. Panchamukhi, P.R., “Social impact of economic Reforms in India: a critical
appraisal”, EPW, March 4/2000, pp.836-847.
e
60. Parthasarathi Shome, “Interventionist and Distortianist” EPW, March 4/2000, pp.759-761.
61. Pathak, H.D., “Central Monetary Authority, Management of Public debt and fiscal
operations in Indian context- 1970-1995”, Special No. in monetary economics, The Indian Economic Journal, Vol. 48, No. 1, July-Sep. 2000-01. P.117
62. Prabhat Patnaik, “On fiscal deficits and real interests rates”, EPW, April 14, 2001,
pp.1160-1163. 63. R.S. Deshpande & A. Narayana Moorthy, “Issues before second Irrigation Committee
of Maharashtra”, EPW, March 24/2001 pp. 1034-1042. 64. Ramaswammmy R. Iyer, ‘Water: Charting a Course for the future –I Special
Article,m EPW, March 31/2001, pp. 115-122. 65. Rejhabendra Jha, “A 20/20 view of Budget 2000”, EPW, March 18/2000, pp. 958-
963. 66. Rekesh Mohan, “Fiscal Correction for economic growth, Data Analysis and
Suggestions”, EPW, June 10/2000, pp. 2027-2036. 67. Renu Kohli, “ Capital Accounts Liberalisation: Empirical Evidence & Policy issue –
II, EPW, April 21/2001, pp. 1345-1348. 68. Renu Kohli, “ Capital Accounts Liberlisation : Empirical evidence & policy issues –
I”, EPW April 14/2001 pp.1199-1206. 69. Romar Correa, “Does the Government Budget constraint matter?”, EPW, March
18/2000, pp.964-966. 70. Ronata Serra, “Social Capital: Meaningful and measurable at the State level?”, EPW,
February 2/2001 pp.693-704. 71. Rukmini Banerji, “Poverty & Primary Schooling, field studies from Mumbai &
Delhi”, EPW March 4/2000, pp.795-802. 72. Santosh Mehrotra, Jan vandemoortele and Enrique Delamonica, ‘Re allocating public
spending for Basic Social Services in Developing Countries’, Special Articles, EPW, July 4, 1998., pp. 1717-1723.
73. Sarma, P.V., “Inequalities on the quality of life in India”, Indian Journal of Regional
Science, Vol. XXXI, 1999, No.2. pp 1-21.
f
74. Sengupta, Arjun, “Financial Management of Globalisation IMF and Developing Countries”, EPW, January 15, 2000. Pp.115-134.
75. Siddhartham, N.S., “ Globalisation & the Budget urgent need for institutional
reforms”, EPW, March 17/2001 pp. 889-892. 76. Siddhartham, N.S., “Declining investment rate and Union Budget”, EPW, March
25/2000, pp1050-56. 77. Sivasubramamiyan, K., “Tank Irrigation under the Periyar- Vaigai basin – a historical
perspective” Journal of Social and Economic Development, Vol-II, No-2, July-Dec 2002, p.247
78. Srinivasan, V.K., “Finance Commission Recommendations: some predicaments.”,
Yojana, November 2000; pp., 15-21. 79. Sudhakhar, S., “Distribution of Benefits of Public Expenditure in India”, The Asian
Economic Review, Vol.-XXXVII, No. 3, Dec 1995 p.491 80. Sujit Mishra, “Isolated & Proximate Illiteracy” Discussion, EPW, June 2, 2001,
pp.2003-2008. 81. Sukumar Mukhopadhyay, “Indirect Taxes: More said than Done”,EPW, March
3/2001, pp. 713-714. 82. Sulha Singh Gill & Ranjit Singh Ghuman, “Rural Health: Proactive role for the
State”, EPW, Delhi 16/2000 pp. 4474-4481. 83. Tarapore S.S., “Malaise of Indaian Financial System; Need for Reforms”, EPW,
August 5/2000,pp.2821-2826. 84. Veena Mishra, ‘Fiscal Deficits and Fiscal Responsibility Act” EPW, February
24/2001, pp.609-610. 85. Vidyanathan, A., “Poverty & Development policy” EPW, May 26,2001, pp. 1807-
1822 .
g
BOOKS 1. Abdul Aziz and Sudhir Krishna, “Regional Development: Problems and Policy
Measures.” , Concept Publication, 1996. 2. Amitabh Kundu, Alakh N. Sharma, “Informal Sector in India: Perspective and
Policies”, Institute for Human Development, 2001. 3. Bharadwaj, R., and Nadkarni, M.V., “Planning for Social and Economic
Development”, Sage Publication, 1992. 4. Bhatia, H.L., “Public Finance” Revised Edition, Nikar Publication., New Delhi, 1992. 5. Ganguly, S.P., “Control Over Public Finance in India”, Concept Publication, New
Delhi, 1997. 6. Geeta Gouri (ed) “Towards Equity: New Economic Policy, Oxford & IBH
Publication, 1995. 7. George, K.K., Sankaran Nair, V., Jose Jacab (eds)., - “Economics, Development and
the Quest for Alternatives”, Concept Publication, New Delhi, 1997. 8. Gulati, I.S., (ed), “Centre-State Budgetary Transfers”, Sameeksha Trust, Bambay,
1987. 9. Gupta, S.P., (ed) “Liberalisation : Its impact o the Indian Economy”, Macmillan India
Ltd, 1993. 10. Hemalata Rao., “Centre State Financial relations” Allied Publishers Pvt. Ltd., New
Delhi, 1981.
11. Mahender Reddy J., Yadav Reddy M., Upadhyay K.S., Raghuram Ch. (ed), “Seventh Five Year Plan – Performance and perspectives”, Sterling Publication., 1989.
12. Mahendra Dev, S., Piyush Antony, Gayathri V., and Mamgain, R.P., (ed), “Social and
Economic Security in India” Institute for Human Development, 2001. 13. Mathew, E.T., “Employment and Unemployment in Kerala”, Some Neglected
Aspects”, Sage Publications, N.Delhi, 1997. 14. Misra, B.R., “ Indian Federal Finance”, Orient Long mans Ltd Publication, Bombay.
1954. 15. Patel I.G., “Economic Reform and Global Change”, Macmillan India Ltd. 1998. 16. Pillai, P.P., “Kerala Economy:First Decades of Development”, Institute of Planning
and Applied Economic Research, Thrissur, 1994.
h
17. Prakash B.A., (ed)., “Kerala’s Economic Development: Issues and Problems”, Sage
Publication., New Delhi, 1999. 18. Rangarajan, L.N., “Kautilya: The Arthashastra”, Penguin Books, New Delhi, 1987 19. Ravi Kathpalia, (ed), “ International Conference on Financial Management and
Accountability in the Public Sector:, Strategies for Managing Change”, Oxford Publication., New Delhi, 1994.
20. Ruddar Dutt and K.P.M. Sundharam, “Indian Economy”, S. Chand & Company, New
Delhi, 1981. 21. Shri Bagwan Dahia, “Studies in Development Planning”, Spell bound Publication ,
Rothak, 1997. 22. Srinivasan, V.K., and Kanta Rao, M.L., “Developing Andhra Pradesh- Vision and its
Revision”, Discussion Papers, Indian Institute of Economics, Hyderabad, Mimeo. 23. Sudarsanan, C.N., “Government Budgeting: Principles and Practices”, Sree Sudarsan
Publication Chennai, 2001. 24. Tavaraj, M.J.K., “Financial Administration of India”, Sultan Chand & Sons, N.Delhi,
1978. 25. Thimmaiah, G., “Burden of Union Loans on the States”, Sterling Publication, New
Delhi, 1977.
i
REPORTS 1. Census of India, “Provisional Population Totals,” Paper-1 of 2001, Registrar General
and Census Commissioner, Government of India, 2001 2. Data News Features – “Andhra Pradesh Year book 1993”, Twelfth Annual Publication,
Data News Features Publications, Hyderabad, 1993. 3. Finance Commission – “Reports of Finance Commission”, different Finance
Commissions (from 1 to 11), New Delhi 4.Government of Andhra Pradesh – “Budget Speech”, 2000-2001 and 2001-2002,
Government of Andhra Pradesh, Hyderabad. - “Budget in Brief”, for various years, Government of
Andhra Pradesh, Hyderabad. - “State Domestic Product: Andhra Pradesh 2000”,
Special Monitoring Cell, Planning Department, Andhra Pradesh Secretariat, Hyderabad
- “Strategy Paper on fiscal reforms” Finance Department and Government of Andhra Pradesh, Hyderabad.
- Other relevant Budgetary documents, various departments, various years Government of Andhra Pradesh, Hyderabad.
- State Five Year Plan documents, various Five Year Plans, Government of Andhra Pradesh, Hyderabad.
- “Report of the Comptroller and Auditor General of India” for the year ended 31st March 2000, Civil, Government of Andhra Pradesh, Hyderabad.
- “Vision 20-20- Swarna Andhra Pradesh, Government of Andhra Pradesh, Hyderabad.1999.
- “Accounts at a glance 1999-2000”, Accountant General (Accounts and Entitlements) Government of Andhra Pradesh, Hyderabad.2001
- “Appropriation Accounts 1999-2000”, Government of Andhra Pradesh, Hyderabad,2001
- “Finance Accounts 1999-2000” Government of Andhra Pradesh, Hyderabad,2001
- “Economic Survey” – Several years, Finance and Planning (PLG. Wing) Dept, Government of Andhra Pradesh, Hyderabad.
- Memorandums to the various Finance Commissions, Finance and Planning (PLG. Wing) Dept, Government of Andhra Pradesh, Hyderabad, Various Years.
j
5. Government of India, - “Economic Survey”, Various Years - “Report of the Comptroller and Auditor General of
India, Union Government (Civil)”, Performance appraisals,
- No 3 of 2000 for the year ended March 1999
6. Government of Karnataka- “ Purpose classification of the Expenditure of General Government, Government of Karnataka, Bangalore, 1998-1999.
7. Government of Kerala – “Report of the Comptroller and Auditor General of India”,
For the Year ended 31st March 1999, No.3 (Civil), Government of Kerala, Thiruvanthapuram, 2000.
8. Government of Maharashtra – “Budget Memorandum 2000-2001”, Vol- 1& 2
Government of Maharashtra, Mumbai, 2000 - “Budget in Brief 2000-2001”, Finance Department,
Government of Maharashtra, Mumbai - “Budget Speech 2000-2001”, (Part 1 & 2)
Government of Maharashtra, Mumbai 9. Government of Tamil Nadu – “Policy Note”, different development departments,
Government of Tamil Nadu, Chennai, 2000 - “Annual Financial Statement 2000-2001”,
Government of Tamil Nadu Chennai, 2000 - “Budget Speech 2000-2001”, and Appendices to
Budget Speech 2000-2001, Government of Tamil Nadu, Chennai, 2000
- “Budget Memorandums 2000-2001”, (Part 1 & 2) and Appendices to Budget Memorandum 2000-2001, Government of Tamil Nadu, Chennai, 2000
- “Performance Budget 2000-2001”, Various Government Departments, Government of Tamil Nadu, Chennai, 2000
- “Tamil Nadu - An Economic Appraisal 1996-97”, Evaluation and Research Department, Government of Tamil Nadu, Chennai, 1998.
10. International Monetary Fund – “Making the Global Economy Work for All”, Annual
Report 2000. 11. Ministry of Human Resource Development, (Department of Education, “Selected
Educational Statistics: 1989-90”, Studies in Educational Statistics No.1 of 1991, Planning, Monitoring and Statistics Division, Government of India, New Delhi, 1991.
12. NCAER – “South India: Human Development Report”, NCAER, Oxford University
Press, New Delhi, 20001.
k
13. Public Accounts Committee- “Sixth Report: Excesses over voted grants and charged appropriations (1997-98)”, Lok Sabha Secretariat, New Delhi, 1999-2000.
14. Planning Commission – “Indian Planning Experience: A Statistical Profile”, Planning
Commission Government of India, Jan. 2001. - “Approach paper to the Tenth Five Year Plan”,
Planning Commission Government of India, 2001. - “Mid term Appraisal of Ninth Five Year Plan
(1997-2002); Highlights”, Planning Commission, Government of India , Oct 2000.
- Five Year Plan Documents, First Five Year Plan to Ninth Five Year Plan, Planning Commission, Government of India, various years.
15. RBI – Bulletins, various monthly issues RBI, India
- Annual Reports, Various years RBI, India - Studies on State Finances, various years, RBI, India - Report on Currently and Finance, various issues,
RBI, India - Hand book of Statistics, 1999, 2000, issues RBI
India - Report on trends in Banking in India,1999-2000,
RBI India - “Macro Economic and Monetary Developments in
2000-2001”, RBI, India, 2001
16. World Bank – “India - Country Economic Memorandum: Recent Economic Developments Achievements and Challenges”, Report No. 14402- IN, Country operations, Industry and Finance Division, Country Department II, South Asia Region, World Bank, 1995.
A STUDY ON MANAGEMENT OF PUBLIC EXPENDITURE
BY STATE GOVERNMENTS IN INDIA
PREPARED FOR PLANNING COMMISSION , GOVERNMENT OF INDIA
By Dr.Vathsala Ramji, Smt.Sujatha Suresh and V.K.Srinivasan
(THE INDIAN INSTITUTE OF ECONOMICS )
Statistical Tables
The Indian Institute of Economics 11-6-841, FAPCCI Complex
Red Hills, Hyderabad - 500 004
Phone : 040-3393512 Fax : 040-3395083 Email : [email protected]
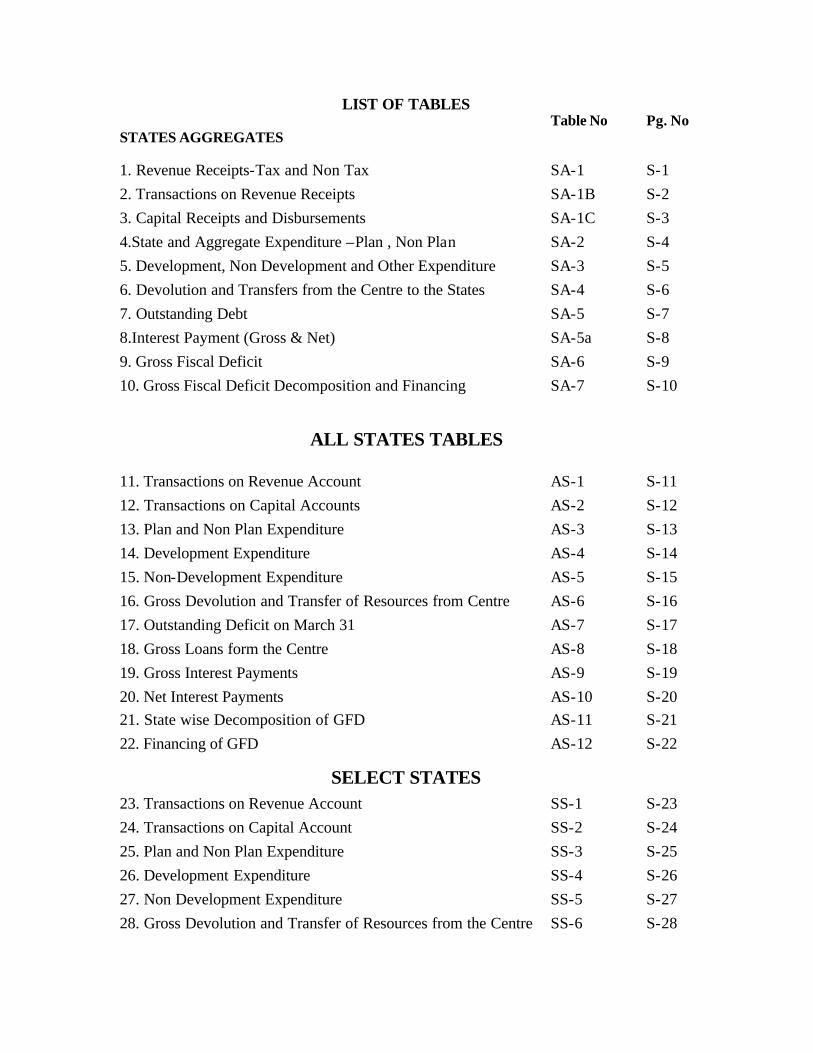
LIST OF TABLES Table No Pg. No STATES AGGREGATES 1. Revenue Receipts-Tax and Non Tax SA-1 S-1
2. Transactions on Revenue Receipts SA-1B S-2
3. Capital Receipts and Disbursements SA-1C S-3
4.State and Aggregate Expenditure –Plan , Non Plan SA-2 S-4
5. Development, Non Development and Other Expenditure SA-3 S-5
6. Devolution and Transfers from the Centre to the States SA-4 S-6
7. Outstanding Debt SA-5 S-7
8.Interest Payment (Gross & Net) SA-5a S-8
9. Gross Fiscal Deficit SA-6 S-9
10. Gross Fiscal Deficit Decomposition and Financing SA-7 S-10
ALL STATES TABLES 11. Transactions on Revenue Account AS-1 S-11
12. Transactions on Capital Accounts AS-2 S-12
13. Plan and Non Plan Expenditure AS-3 S-13
14. Development Expenditure AS-4 S-14
15. Non-Development Expenditure AS-5 S-15
16. Gross Devolution and Transfer of Resources from Centre AS-6 S-16
17. Outstanding Deficit on March 31 AS-7 S-17
18. Gross Loans form the Centre AS-8 S-18
19. Gross Interest Payments AS-9 S-19
20. Net Interest Payments AS-10 S-20
21. State wise Decomposition of GFD AS-11 S-21
22. Financing of GFD AS-12 S-22
SELECT STATES 23. Transactions on Revenue Account SS-1 S-23
24. Transactions on Capital Account SS-2 S-24
25. Plan and Non Plan Expenditure SS-3 S-25
26. Development Expenditure SS-4 S-26
27. Non Development Expenditure SS-5 S-27
28. Gross Devolution and Transfer of Resources from the Centre SS-6 S-28

LIST OF TABLES Table No Pg. No SELECT STATES (contd)
29. Outstanding Debt on March 31 SS-7 S-29
30. Gross Interest Payments SS-8 S-30
31. Net Interest Payments SS-9 S-31
32. Gross Loans from Centre SS-10 S-32
33. Decomposition of GFD SS-11 S-33
34. Financing of GFD SS-12 S-34
SELECT STATES: ITEM WISE DETAILS REVENUE ACCOUNT - : PLAN, NON PLAN EXPENDITURE
35. Maharashtra DET-1 S-35
36. Andhra Pradesh DET-2 S-36
37. Karnataka DET-3 S-37
38. Tamil Nadu DET-4 S-38
39. Kerala DET-5 S-39
40. All States DET-6 S-40
CAPITAL ACCOUNT : PLAN, NON PLAN
DISBURSEMENTS EXPENDITURE
41. Maharashtra DET-7 S-41
42. Andhra Pradesh DET-8 S-42
43. Karnataka DET-9 S-43
44. Tamil Nadu DET-10 S-44
45. Kerala DET-11 S-45
46. All States DET-12 S-46
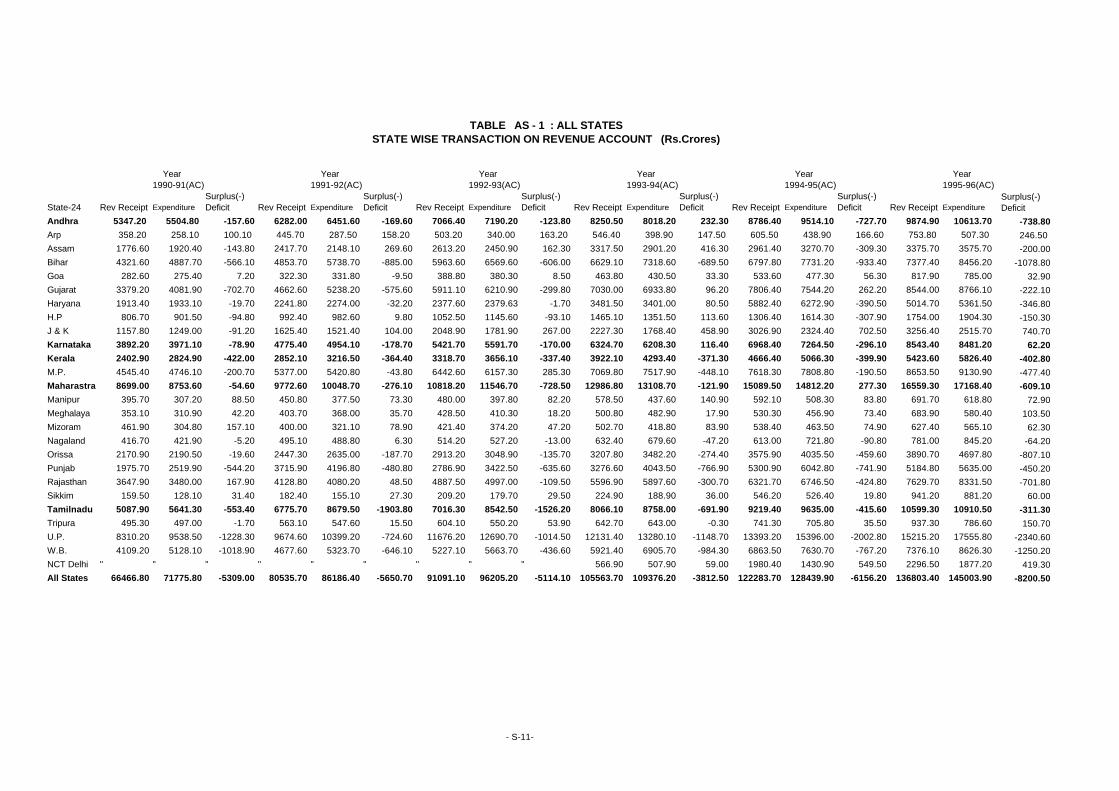
Year Year Year Year Year Year1990-91(AC) 1991-92(AC) 1992-93(AC) 1993-94(AC) 1994-95(AC) 1995-96(AC)
State-24 Rev Receipt Expenditure Surplus(-) Deficit Rev Receipt Expenditure
Surplus(-) Deficit Rev Receipt Expenditure
Surplus(-) Deficit Rev Receipt Expenditure
Surplus(-) Deficit Rev Receipt Expenditure
Surplus(-) Deficit Rev Receipt Expenditure
Andhra 5347.20 5504.80 -157.60 6282.00 6451.60 -169.60 7066.40 7190.20 -123.80 8250.50 8018.20 232.30 8786.40 9514.10 -727.70 9874.90 10613.70Arp 358.20 258.10 100.10 445.70 287.50 158.20 503.20 340.00 163.20 546.40 398.90 147.50 605.50 438.90 166.60 753.80 507.30Assam 1776.60 1920.40 -143.80 2417.70 2148.10 269.60 2613.20 2450.90 162.30 3317.50 2901.20 416.30 2961.40 3270.70 -309.30 3375.70 3575.70Bihar 4321.60 4887.70 -566.10 4853.70 5738.70 -885.00 5963.60 6569.60 -606.00 6629.10 7318.60 -689.50 6797.80 7731.20 -933.40 7377.40 8456.20Goa 282.60 275.40 7.20 322.30 331.80 -9.50 388.80 380.30 8.50 463.80 430.50 33.30 533.60 477.30 56.30 817.90 785.00Gujarat 3379.20 4081.90 -702.70 4662.60 5238.20 -575.60 5911.10 6210.90 -299.80 7030.00 6933.80 96.20 7806.40 7544.20 262.20 8544.00 8766.10Haryana 1913.40 1933.10 -19.70 2241.80 2274.00 -32.20 2377.60 2379.63 -1.70 3481.50 3401.00 80.50 5882.40 6272.90 -390.50 5014.70 5361.50H.P 806.70 901.50 -94.80 992.40 982.60 9.80 1052.50 1145.60 -93.10 1465.10 1351.50 113.60 1306.40 1614.30 -307.90 1754.00 1904.30J & K 1157.80 1249.00 -91.20 1625.40 1521.40 104.00 2048.90 1781.90 267.00 2227.30 1768.40 458.90 3026.90 2324.40 702.50 3256.40 2515.70Karnataka 3892.20 3971.10 -78.90 4775.40 4954.10 -178.70 5421.70 5591.70 -170.00 6324.70 6208.30 116.40 6968.40 7264.50 -296.10 8543.40 8481.20Kerala 2402.90 2824.90 -422.00 2852.10 3216.50 -364.40 3318.70 3656.10 -337.40 3922.10 4293.40 -371.30 4666.40 5066.30 -399.90 5423.60 5826.40M.P. 4545.40 4746.10 -200.70 5377.00 5420.80 -43.80 6442.60 6157.30 285.30 7069.80 7517.90 -448.10 7618.30 7808.80 -190.50 8653.50 9130.90Maharastra 8699.00 8753.60 -54.60 9772.60 10048.70 -276.10 10818.20 11546.70 -728.50 12986.80 13108.70 -121.90 15089.50 14812.20 277.30 16559.30 17168.40Manipur 395.70 307.20 88.50 450.80 377.50 73.30 480.00 397.80 82.20 578.50 437.60 140.90 592.10 508.30 83.80 691.70 618.80Meghalaya 353.10 310.90 42.20 403.70 368.00 35.70 428.50 410.30 18.20 500.80 482.90 17.90 530.30 456.90 73.40 683.90 580.40Mizoram 461.90 304.80 157.10 400.00 321.10 78.90 421.40 374.20 47.20 502.70 418.80 83.90 538.40 463.50 74.90 627.40 565.10Nagaland 416.70 421.90 -5.20 495.10 488.80 6.30 514.20 527.20 -13.00 632.40 679.60 -47.20 613.00 721.80 -90.80 781.00 845.20Orissa 2170.90 2190.50 -19.60 2447.30 2635.00 -187.70 2913.20 3048.90 -135.70 3207.80 3482.20 -274.40 3575.90 4035.50 -459.60 3890.70 4697.80Punjab 1975.70 2519.90 -544.20 3715.90 4196.80 -480.80 2786.90 3422.50 -635.60 3276.60 4043.50 -766.90 5300.90 6042.80 -741.90 5184.80 5635.00Rajasthan 3647.90 3480.00 167.90 4128.80 4080.20 48.50 4887.50 4997.00 -109.50 5596.90 5897.60 -300.70 6321.70 6746.50 -424.80 7629.70 8331.50Sikkim 159.50 128.10 31.40 182.40 155.10 27.30 209.20 179.70 29.50 224.90 188.90 36.00 546.20 526.40 19.80 941.20 881.20Tamilnadu 5087.90 5641.30 -553.40 6775.70 8679.50 -1903.80 7016.30 8542.50 -1526.20 8066.10 8758.00 -691.90 9219.40 9635.00 -415.60 10599.30 10910.50Tripura 495.30 497.00 -1.70 563.10 547.60 15.50 604.10 550.20 53.90 642.70 643.00 -0.30 741.30 705.80 35.50 937.30 786.60U.P. 8310.20 9538.50 -1228.30 9674.60 10399.20 -724.60 11676.20 12690.70 -1014.50 12131.40 13280.10 -1148.70 13393.20 15396.00 -2002.80 15215.20 17555.80W.B. 4109.20 5128.10 -1018.90 4677.60 5323.70 -646.10 5227.10 5663.70 -436.60 5921.40 6905.70 -984.30 6863.50 7630.70 -767.20 7376.10 8626.30NCT Delhi " " " " " " " " " 566.90 507.90 59.00 1980.40 1430.90 549.50 2296.50 1877.20All States 66466.80 71775.80 -5309.00 80535.70 86186.40 -5650.70 91091.10 96205.20 -5114.10 105563.70 109376.20 -3812.50 122283.70 128439.90 -6156.20 136803.40 145003.90
STATE WISE TRANSACTION ON REVENUE ACCOUNT (Rs.Crores)TABLE AS - 1 : ALL STATES
- S-11-
Surplus(-) Deficit
-738.80246.50-200.00
-1078.8032.90
-222.10-346.80-150.30740.70
62.20-402.80-477.40-609.10
72.90103.50
62.30-64.20
-807.10-450.20-701.80
60.00-311.30150.70
-2340.60-1250.20
419.30-8200.50
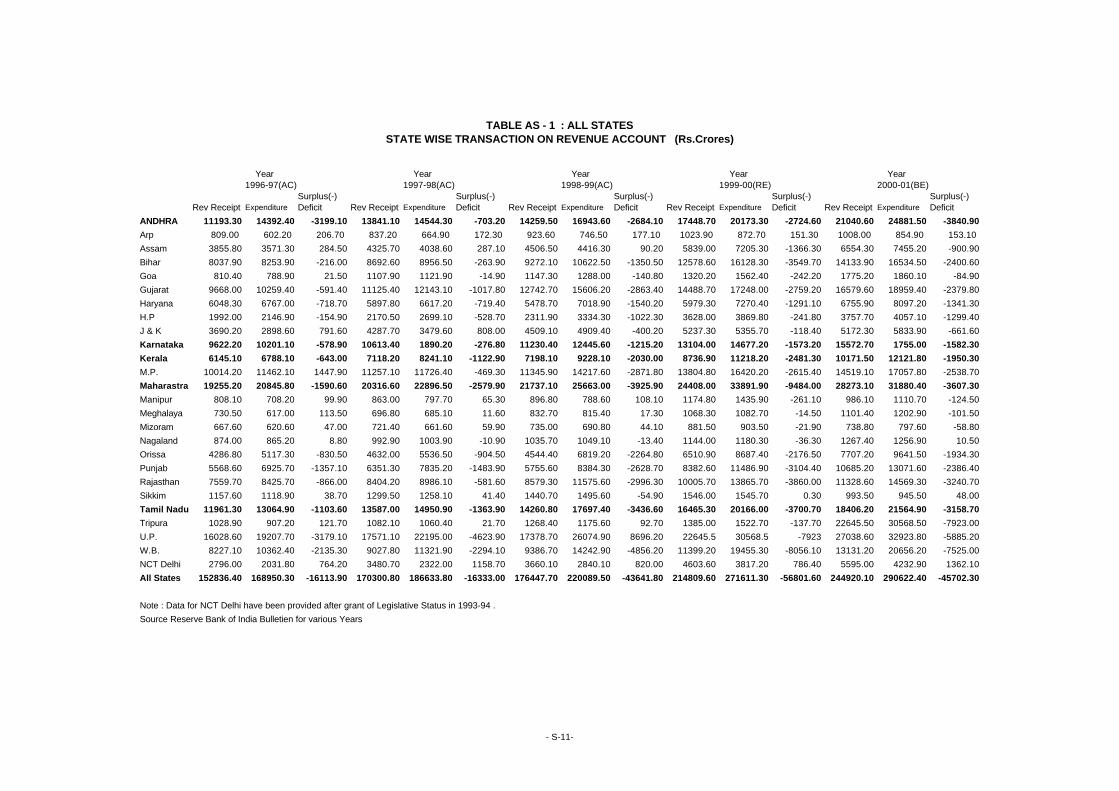
Year Year Year Year Year1996-97(AC) 1997-98(AC) 1998-99(AC) 1999-00(RE) 2000-01(BE)
Rev Receipt Expenditure Surplus(-) Deficit Rev Receipt Expenditure
Surplus(-) Deficit Rev Receipt Expenditure
Surplus(-) Deficit Rev Receipt Expenditure
Surplus(-) Deficit Rev Receipt Expenditure
Surplus(-) Deficit
ANDHRA 11193.30 14392.40 -3199.10 13841.10 14544.30 -703.20 14259.50 16943.60 -2684.10 17448.70 20173.30 -2724.60 21040.60 24881.50 -3840.90Arp 809.00 602.20 206.70 837.20 664.90 172.30 923.60 746.50 177.10 1023.90 872.70 151.30 1008.00 854.90 153.10Assam 3855.80 3571.30 284.50 4325.70 4038.60 287.10 4506.50 4416.30 90.20 5839.00 7205.30 -1366.30 6554.30 7455.20 -900.90Bihar 8037.90 8253.90 -216.00 8692.60 8956.50 -263.90 9272.10 10622.50 -1350.50 12578.60 16128.30 -3549.70 14133.90 16534.50 -2400.60Goa 810.40 788.90 21.50 1107.90 1121.90 -14.90 1147.30 1288.00 -140.80 1320.20 1562.40 -242.20 1775.20 1860.10 -84.90Gujarat 9668.00 10259.40 -591.40 11125.40 12143.10 -1017.80 12742.70 15606.20 -2863.40 14488.70 17248.00 -2759.20 16579.60 18959.40 -2379.80Haryana 6048.30 6767.00 -718.70 5897.80 6617.20 -719.40 5478.70 7018.90 -1540.20 5979.30 7270.40 -1291.10 6755.90 8097.20 -1341.30H.P 1992.00 2146.90 -154.90 2170.50 2699.10 -528.70 2311.90 3334.30 -1022.30 3628.00 3869.80 -241.80 3757.70 4057.10 -1299.40J & K 3690.20 2898.60 791.60 4287.70 3479.60 808.00 4509.10 4909.40 -400.20 5237.30 5355.70 -118.40 5172.30 5833.90 -661.60Karnataka 9622.20 10201.10 -578.90 10613.40 1890.20 -276.80 11230.40 12445.60 -1215.20 13104.00 14677.20 -1573.20 15572.70 1755.00 -1582.30Kerala 6145.10 6788.10 -643.00 7118.20 8241.10 -1122.90 7198.10 9228.10 -2030.00 8736.90 11218.20 -2481.30 10171.50 12121.80 -1950.30M.P. 10014.20 11462.10 1447.90 11257.10 11726.40 -469.30 11345.90 14217.60 -2871.80 13804.80 16420.20 -2615.40 14519.10 17057.80 -2538.70Maharastra 19255.20 20845.80 -1590.60 20316.60 22896.50 -2579.90 21737.10 25663.00 -3925.90 24408.00 33891.90 -9484.00 28273.10 31880.40 -3607.30Manipur 808.10 708.20 99.90 863.00 797.70 65.30 896.80 788.60 108.10 1174.80 1435.90 -261.10 986.10 1110.70 -124.50Meghalaya 730.50 617.00 113.50 696.80 685.10 11.60 832.70 815.40 17.30 1068.30 1082.70 -14.50 1101.40 1202.90 -101.50Mizoram 667.60 620.60 47.00 721.40 661.60 59.90 735.00 690.80 44.10 881.50 903.50 -21.90 738.80 797.60 -58.80Nagaland 874.00 865.20 8.80 992.90 1003.90 -10.90 1035.70 1049.10 -13.40 1144.00 1180.30 -36.30 1267.40 1256.90 10.50Orissa 4286.80 5117.30 -830.50 4632.00 5536.50 -904.50 4544.40 6819.20 -2264.80 6510.90 8687.40 -2176.50 7707.20 9641.50 -1934.30Punjab 5568.60 6925.70 -1357.10 6351.30 7835.20 -1483.90 5755.60 8384.30 -2628.70 8382.60 11486.90 -3104.40 10685.20 13071.60 -2386.40Rajasthan 7559.70 8425.70 -866.00 8404.20 8986.10 -581.60 8579.30 11575.60 -2996.30 10005.70 13865.70 -3860.00 11328.60 14569.30 -3240.70Sikkim 1157.60 1118.90 38.70 1299.50 1258.10 41.40 1440.70 1495.60 -54.90 1546.00 1545.70 0.30 993.50 945.50 48.00Tamil Nadu 11961.30 13064.90 -1103.60 13587.00 14950.90 -1363.90 14260.80 17697.40 -3436.60 16465.30 20166.00 -3700.70 18406.20 21564.90 -3158.70Tripura 1028.90 907.20 121.70 1082.10 1060.40 21.70 1268.40 1175.60 92.70 1385.00 1522.70 -137.70 22645.50 30568.50 -7923.00U.P. 16028.60 19207.70 -3179.10 17571.10 22195.00 -4623.90 17378.70 26074.90 8696.20 22645.5 30568.5 -7923 27038.60 32923.80 -5885.20W.B. 8227.10 10362.40 -2135.30 9027.80 11321.90 -2294.10 9386.70 14242.90 -4856.20 11399.20 19455.30 -8056.10 13131.20 20656.20 -7525.00NCT Delhi 2796.00 2031.80 764.20 3480.70 2322.00 1158.70 3660.10 2840.10 820.00 4603.60 3817.20 786.40 5595.00 4232.90 1362.10All States 152836.40 168950.30 -16113.90 170300.80 186633.80 -16333.00 176447.70 220089.50 -43641.80 214809.60 271611.30 -56801.60 244920.10 290622.40 -45702.30
Note : Data for NCT Delhi have been provided after grant of Legislative Status in 1993-94 .Source Reserve Bank of India Bulletien for various Years
TABLE AS - 1 : ALL STATESSTATE WISE TRANSACTION ON REVENUE ACCOUNT (Rs.Crores)
- S-11-

(Rs.Crores1990-91 (AC) 1991-92(AC) 1992-93(AC) 1993-94(AC) 1994-95(AC) 1995-96(AC)
StateCapital
Receipts Capital
Exp
Capital Surplus
(+) Deficit (-)
Capital Receipts
Capital Exp
Capital Surplus
(+) Deficit (-)
Capital Receipts
Capital Exp
Capital Surplus
(+) Deficit (-)
Capital Receipts
Capital Exp
Capital Surplus
(+) Deficit (-)
Capital Receipts
Capital Exp
Capital Surplus
(+) Deficit (-)
Capital Receipts
Capital Exp
Capital Surplus
(+) Deficit (-)
Andhra 1250.90 1065.70 185.20 1595.20 1334.30 260.90 1937.00 1793.30 143.70 2552.80 2523.00 29.80 3380.70 2944.90 435.80 4456.80 3687.00 796.80Arp 93.00 171.70 -78.70 12.70 164.90 -152.20 -17.80 163.10 -180.90 -37.10 176.00 -213.10 60.50 251.60 -191.10 59.90 296.00 -236.10Assam 986.60 783.50 203.10 330.10 632.70 -302.60 560.10 685.40 -125.30 164.10 718.80 -554.70 2356.00 727.10 1628.90 1204.60 814.60 389.90Bihar 1713.60 1328.80 384.80 1902.80 1065.90 836.90 1737.70 1173.90 563.80 1752.10 1114.60 637.50 1808.60 823.30 985.30 1726.70 960.80 765.90Goa 151.30 123.10 28.20 84.80 142.80 -58.00 72.10 118.80 46.70 86.30 127.80 -41.50 104.30 123.80 -19.50 109.60 157.80 -48.20Gujarat 2136.60 1393.40 743.20 2258.80 1710.20 548.60 1892.20 1775.70 116.50 1606.30 1474.10 132.20 1914.90 1953.50 -38.60 2544.70 2044.50 500.20Haryana 538.30 461.70 76.60 504.90 457.80 47.10 536.90 576.70 -39.80 682.00 708.00 -26.00 1128.30 638.90 489.40 3938.20 769.90 3168.30H.P 361.40 215.60 145.80 1267.20 1342.40 -75.20 285.40 301.20 -15.80 372.30 339.30 33.00 386.90 394.20 -7.30 39.60 445.70 -406.11J & K 588.10 771.90 -183.80 238.90 764.30 -525.40 231.70 538.60 -306.90 242.70 824.90 -582.20 312.40 1014.90 -702.50 316.20 1056.90 -740.70Karnataka 1324.00 1192.70 131.30 1465.80 1256.10 209.70 1305.00 1508.30 -203.30 1896.20 1880.90 15.30 2067.00 1594.80 472.20 1722.10 1924.90 -202.90Kerala 957.10 559.70 397.40 1105.00 813.20 291.80 1134.10 706.60 427.50 1315.70 844.90 470.80 1691.90 892.40 799.50 1563.30 1095.50 467.80M.P. 1351.90 1010.30 341.60 1076.80 1232.10 155.30 1340.30 1505.40 -165.10 1733.10 1359.70 373.40 1911.90 1505.80 406.10 1748.00 1450.70 297.30Maharastra 2349.20 2067.70 281.50 3260.10 2061.90 1198.20 2481.20 2466.90 14.30 2937.30 2874.40 62.90 5543.10 5214.10 329.00 5012.00 4208.10 803.90Manipur 85.70 146.80 -61.10 70.90 170.50 -99.60 338.30 426.10 -87.80 161.70 199.60 -37.90 53.60 166.60 -113.00 75.10 191.90 -116.80Meghalaya 47.70 87.50 -39.80 43.50 110.80 -67.30 64.00 132.60 -68.60 160.40 198.60 -38.20 67.10 130.10 -63.00 99.40 198.10 -98.70Mizoram 66.60 213.70 -147.10 2.70 97.20 -94.50 61.90 115.50 53.60 17.20 102.40 -85.50 58.60 128.80 -70.20 61.60 150.00 -88.40Nagaland 102.40 130.20 -27.80 91.00 159.10 -68.10 214.40 329.60 -115.20 304.90 252.00 52.90 168.90 184.20 -15.30 174.20 194.80 -20.60Orissa 1002.90 855.40 147.50 1126.80 1001.80 125.00 990.00 865.90 124.10 1315.00 973.30 341.70 1512.40 946.90 565.50 1503.60 864.90 638.70Punjab 1431.10 847.40 583.70 1174.90 821.20 323.70 4308.60 785.10 3523.50 1696.10 1177.20 518.90 2059.10 1462.50 596.60 1816.40 1368.70 447.80Rajasthan 997.60 1249.70 -252.10 1933.60 1727.60 206.00 1313.50 1350.30 -36.80 1764.10 1529.10 235.00 2159.70 1674.80 484.90 2829.10 2575.90 253.20Sikkim 28.00 49.70 -21.70 24.80 73.70 -48.90 51.40 70.50 -19.10 27.30 73.80 -46.50 59.00 74.90 -15.90 44.50 111.30 -66.80Tamil Nadu 1452.00 965.50 486.50 2827.90 1144.40 1683.50 2842.20 1205.90 1636.30 2125.80 1303.70 822.10 2702.30 1797.40 904.90 2330.70 1620.90 709.80Tripura 127.00 114.40 12.60 71.10 130.00 -58.90 117.90 106.60 11.30 131.90 141.70 -9.80 147.70 174.50 -26.80 103.80 202.90 -99.20U.P. 3884.40 2767.80 1116.60 3896.00 3076.70 819.30 4678.30 3444.70 1233.60 3541.70 2995.20 546.50 8796.10 5665.90 3130.20 6386.40 3231.20 3155.20W.B. 1819.40 892.30 927.10 1587.60 967.50 620.10 1596.50 982.70 613.80 1939.50 1067.20 872.30 2738.80 1651.90 1086.90 2938.60 1882.70 1056.00NCT Delhi 133.70 291.80 -158.10 548.00 976.10 -428.10 825.40 1074.30 -248.90All States 24846.80 19466.20 5380.60 27953.90 22459.10 5494.80 30072.90 23129.00 6943.50 28623.10 25272.30 3350.80 43737.80 33113.90 10623.90 43630.10 32579.80 11050.30
STATE WISE TRANSACTION ON THE CAPITAL ACCOUNTS (Rs.Crores)TABLE AS - 2 ALL STATES
- S-12 -
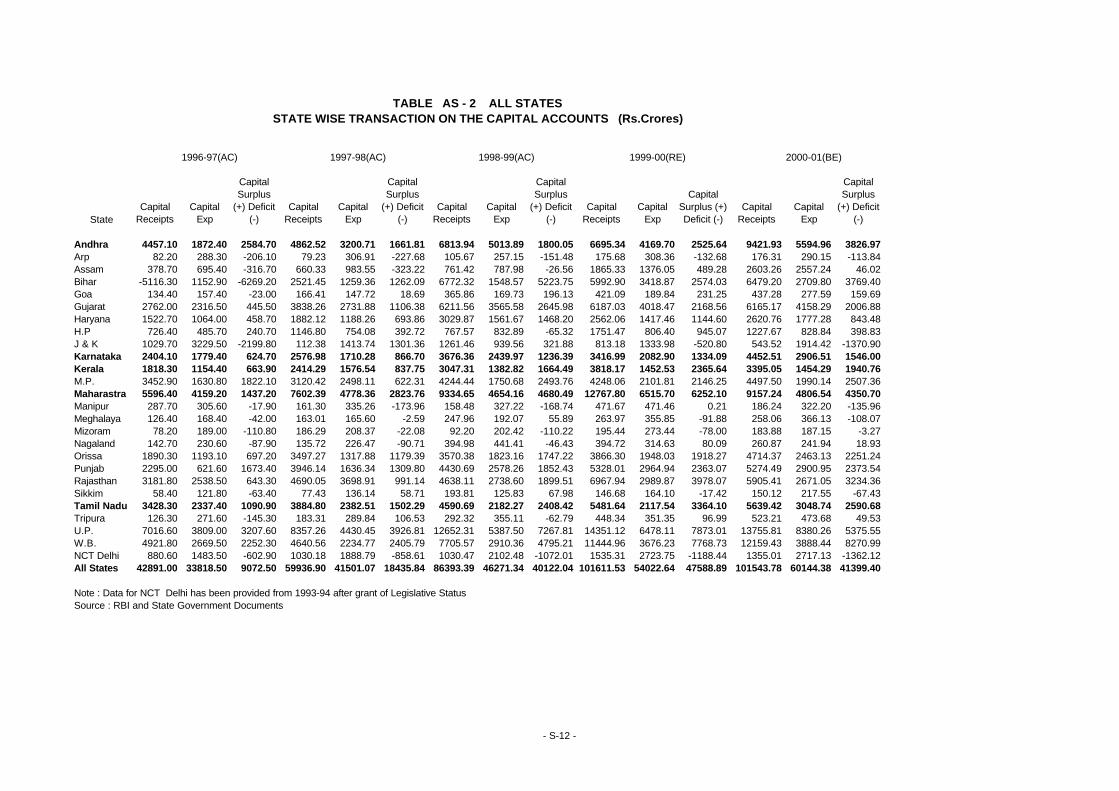
1996-97(AC) 1997-98(AC) 1998-99(AC) 1999-00(RE) 2000-01(BE)
StateCapital
Receipts Capital
Exp
Capital Surplus
(+) Deficit (-)
Capital Receipts
Capital Exp
Capital Surplus
(+) Deficit (-)
Capital Receipts
Capital Exp
Capital Surplus
(+) Deficit (-)
Capital Receipts
Capital Exp
Capital Surplus (+) Deficit (-)
Capital Receipts
Capital Exp
Capital Surplus
(+) Deficit (-)
Andhra 4457.10 1872.40 2584.70 4862.52 3200.71 1661.81 6813.94 5013.89 1800.05 6695.34 4169.70 2525.64 9421.93 5594.96 3826.97Arp 82.20 288.30 -206.10 79.23 306.91 -227.68 105.67 257.15 -151.48 175.68 308.36 -132.68 176.31 290.15 -113.84Assam 378.70 695.40 -316.70 660.33 983.55 -323.22 761.42 787.98 -26.56 1865.33 1376.05 489.28 2603.26 2557.24 46.02Bihar -5116.30 1152.90 -6269.20 2521.45 1259.36 1262.09 6772.32 1548.57 5223.75 5992.90 3418.87 2574.03 6479.20 2709.80 3769.40Goa 134.40 157.40 -23.00 166.41 147.72 18.69 365.86 169.73 196.13 421.09 189.84 231.25 437.28 277.59 159.69Gujarat 2762.00 2316.50 445.50 3838.26 2731.88 1106.38 6211.56 3565.58 2645.98 6187.03 4018.47 2168.56 6165.17 4158.29 2006.88Haryana 1522.70 1064.00 458.70 1882.12 1188.26 693.86 3029.87 1561.67 1468.20 2562.06 1417.46 1144.60 2620.76 1777.28 843.48H.P 726.40 485.70 240.70 1146.80 754.08 392.72 767.57 832.89 -65.32 1751.47 806.40 945.07 1227.67 828.84 398.83J & K 1029.70 3229.50 -2199.80 112.38 1413.74 1301.36 1261.46 939.56 321.88 813.18 1333.98 -520.80 543.52 1914.42 -1370.90Karnataka 2404.10 1779.40 624.70 2576.98 1710.28 866.70 3676.36 2439.97 1236.39 3416.99 2082.90 1334.09 4452.51 2906.51 1546.00Kerala 1818.30 1154.40 663.90 2414.29 1576.54 837.75 3047.31 1382.82 1664.49 3818.17 1452.53 2365.64 3395.05 1454.29 1940.76M.P. 3452.90 1630.80 1822.10 3120.42 2498.11 622.31 4244.44 1750.68 2493.76 4248.06 2101.81 2146.25 4497.50 1990.14 2507.36Maharastra 5596.40 4159.20 1437.20 7602.39 4778.36 2823.76 9334.65 4654.16 4680.49 12767.80 6515.70 6252.10 9157.24 4806.54 4350.70Manipur 287.70 305.60 -17.90 161.30 335.26 -173.96 158.48 327.22 -168.74 471.67 471.46 0.21 186.24 322.20 -135.96Meghalaya 126.40 168.40 -42.00 163.01 165.60 -2.59 247.96 192.07 55.89 263.97 355.85 -91.88 258.06 366.13 -108.07Mizoram 78.20 189.00 -110.80 186.29 208.37 -22.08 92.20 202.42 -110.22 195.44 273.44 -78.00 183.88 187.15 -3.27Nagaland 142.70 230.60 -87.90 135.72 226.47 -90.71 394.98 441.41 -46.43 394.72 314.63 80.09 260.87 241.94 18.93Orissa 1890.30 1193.10 697.20 3497.27 1317.88 1179.39 3570.38 1823.16 1747.22 3866.30 1948.03 1918.27 4714.37 2463.13 2251.24Punjab 2295.00 621.60 1673.40 3946.14 1636.34 1309.80 4430.69 2578.26 1852.43 5328.01 2964.94 2363.07 5274.49 2900.95 2373.54Rajasthan 3181.80 2538.50 643.30 4690.05 3698.91 991.14 4638.11 2738.60 1899.51 6967.94 2989.87 3978.07 5905.41 2671.05 3234.36Sikkim 58.40 121.80 -63.40 77.43 136.14 58.71 193.81 125.83 67.98 146.68 164.10 -17.42 150.12 217.55 -67.43Tamil Nadu 3428.30 2337.40 1090.90 3884.80 2382.51 1502.29 4590.69 2182.27 2408.42 5481.64 2117.54 3364.10 5639.42 3048.74 2590.68Tripura 126.30 271.60 -145.30 183.31 289.84 106.53 292.32 355.11 -62.79 448.34 351.35 96.99 523.21 473.68 49.53U.P. 7016.60 3809.00 3207.60 8357.26 4430.45 3926.81 12652.31 5387.50 7267.81 14351.12 6478.11 7873.01 13755.81 8380.26 5375.55W.B. 4921.80 2669.50 2252.30 4640.56 2234.77 2405.79 7705.57 2910.36 4795.21 11444.96 3676.23 7768.73 12159.43 3888.44 8270.99NCT Delhi 880.60 1483.50 -602.90 1030.18 1888.79 -858.61 1030.47 2102.48 -1072.01 1535.31 2723.75 -1188.44 1355.01 2717.13 -1362.12All States 42891.00 33818.50 9072.50 59936.90 41501.07 18435.84 86393.39 46271.34 40122.04 101611.53 54022.64 47588.89 101543.78 60144.38 41399.40
Note : Data for NCT Delhi has been provided from 1993-94 after grant of Legislative StatusSource : RBI and State Government Documents
TABLE AS - 2 ALL STATESSTATE WISE TRANSACTION ON THE CAPITAL ACCOUNTS (Rs.Crores)
- S-12 -
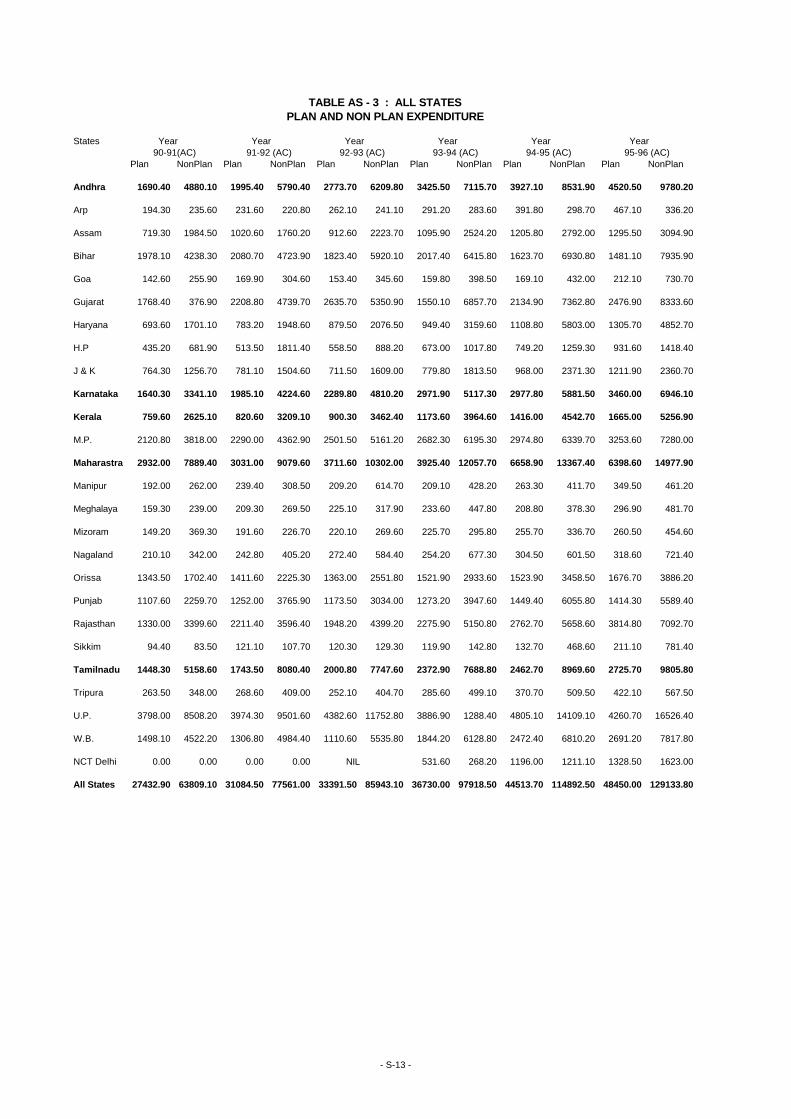
States Year Year Year Year Year Year 90-91(AC) 91-92 (AC) 92-93 (AC) 93-94 (AC) 94-95 (AC) 95-96 (AC)Plan NonPlan Plan NonPlan Plan NonPlan Plan NonPlan Plan NonPlan Plan NonPlan
Andhra 1690.40 4880.10 1995.40 5790.40 2773.70 6209.80 3425.50 7115.70 3927.10 8531.90 4520.50 9780.20
Arp 194.30 235.60 231.60 220.80 262.10 241.10 291.20 283.60 391.80 298.70 467.10 336.20
Assam 719.30 1984.50 1020.60 1760.20 912.60 2223.70 1095.90 2524.20 1205.80 2792.00 1295.50 3094.90
Bihar 1978.10 4238.30 2080.70 4723.90 1823.40 5920.10 2017.40 6415.80 1623.70 6930.80 1481.10 7935.90
Goa 142.60 255.90 169.90 304.60 153.40 345.60 159.80 398.50 169.10 432.00 212.10 730.70
Gujarat 1768.40 376.90 2208.80 4739.70 2635.70 5350.90 1550.10 6857.70 2134.90 7362.80 2476.90 8333.60
Haryana 693.60 1701.10 783.20 1948.60 879.50 2076.50 949.40 3159.60 1108.80 5803.00 1305.70 4852.70
H.P 435.20 681.90 513.50 1811.40 558.50 888.20 673.00 1017.80 749.20 1259.30 931.60 1418.40
J & K 764.30 1256.70 781.10 1504.60 711.50 1609.00 779.80 1813.50 968.00 2371.30 1211.90 2360.70
Karnataka 1640.30 3341.10 1985.10 4224.60 2289.80 4810.20 2971.90 5117.30 2977.80 5881.50 3460.00 6946.10
Kerala 759.60 2625.10 820.60 3209.10 900.30 3462.40 1173.60 3964.60 1416.00 4542.70 1665.00 5256.90
M.P. 2120.80 3818.00 2290.00 4362.90 2501.50 5161.20 2682.30 6195.30 2974.80 6339.70 3253.60 7280.00
Maharastra 2932.00 7889.40 3031.00 9079.60 3711.60 10302.00 3925.40 12057.70 6658.90 13367.40 6398.60 14977.90
Manipur 192.00 262.00 239.40 308.50 209.20 614.70 209.10 428.20 263.30 411.70 349.50 461.20
Meghalaya 159.30 239.00 209.30 269.50 225.10 317.90 233.60 447.80 208.80 378.30 296.90 481.70
Mizoram 149.20 369.30 191.60 226.70 220.10 269.60 225.70 295.80 255.70 336.70 260.50 454.60
Nagaland 210.10 342.00 242.80 405.20 272.40 584.40 254.20 677.30 304.50 601.50 318.60 721.40
Orissa 1343.50 1702.40 1411.60 2225.30 1363.00 2551.80 1521.90 2933.60 1523.90 3458.50 1676.70 3886.20
Punjab 1107.60 2259.70 1252.00 3765.90 1173.50 3034.00 1273.20 3947.60 1449.40 6055.80 1414.30 5589.40
Rajasthan 1330.00 3399.60 2211.40 3596.40 1948.20 4399.20 2275.90 5150.80 2762.70 5658.60 3814.80 7092.70
Sikkim 94.40 83.50 121.10 107.70 120.30 129.30 119.90 142.80 132.70 468.60 211.10 781.40
Tamilnadu 1448.30 5158.60 1743.50 8080.40 2000.80 7747.60 2372.90 7688.80 2462.70 8969.60 2725.70 9805.80
Tripura 263.50 348.00 268.60 409.00 252.10 404.70 285.60 499.10 370.70 509.50 422.10 567.50
U.P. 3798.00 8508.20 3974.30 9501.60 4382.60 11752.80 3886.90 1288.40 4805.10 14109.10 4260.70 16526.40
W.B. 1498.10 4522.20 1306.80 4984.40 1110.60 5535.80 1844.20 6128.80 2472.40 6810.20 2691.20 7817.80
NCT Delhi 0.00 0.00 0.00 0.00 NIL 531.60 268.20 1196.00 1211.10 1328.50 1623.00
All States 27432.90 63809.10 31084.50 77561.00 33391.50 85943.10 36730.00 97918.50 44513.70 114892.50 48450.00 129133.80
PLAN AND NON PLAN EXPENDITURETABLE AS - 3 : ALL STATES
- S-13 -
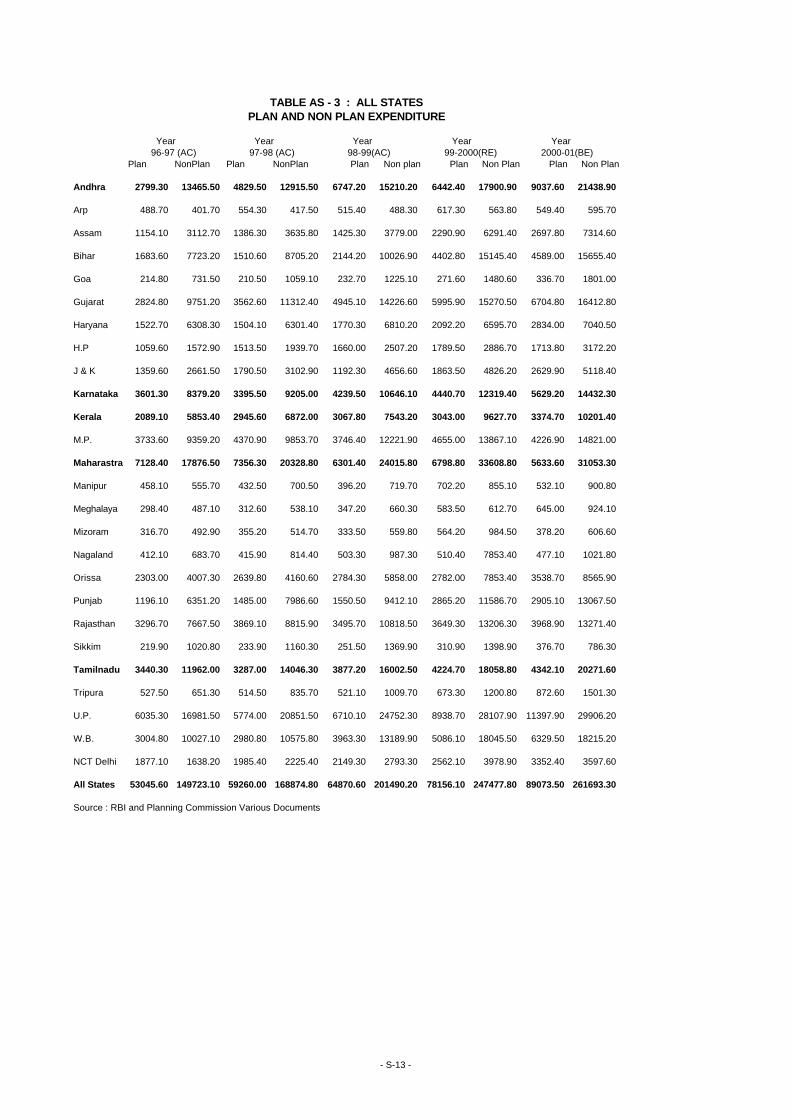
Year Year Year Year Year 96-97 (AC) 97-98 (AC) 98-99(AC) 99-2000(RE) 2000-01(BE)Plan NonPlan Plan NonPlan Plan Non plan Plan Non Plan Plan Non Plan
Andhra 2799.30 13465.50 4829.50 12915.50 6747.20 15210.20 6442.40 17900.90 9037.60 21438.90
Arp 488.70 401.70 554.30 417.50 515.40 488.30 617.30 563.80 549.40 595.70
Assam 1154.10 3112.70 1386.30 3635.80 1425.30 3779.00 2290.90 6291.40 2697.80 7314.60
Bihar 1683.60 7723.20 1510.60 8705.20 2144.20 10026.90 4402.80 15145.40 4589.00 15655.40
Goa 214.80 731.50 210.50 1059.10 232.70 1225.10 271.60 1480.60 336.70 1801.00
Gujarat 2824.80 9751.20 3562.60 11312.40 4945.10 14226.60 5995.90 15270.50 6704.80 16412.80
Haryana 1522.70 6308.30 1504.10 6301.40 1770.30 6810.20 2092.20 6595.70 2834.00 7040.50
H.P 1059.60 1572.90 1513.50 1939.70 1660.00 2507.20 1789.50 2886.70 1713.80 3172.20
J & K 1359.60 2661.50 1790.50 3102.90 1192.30 4656.60 1863.50 4826.20 2629.90 5118.40
Karnataka 3601.30 8379.20 3395.50 9205.00 4239.50 10646.10 4440.70 12319.40 5629.20 14432.30
Kerala 2089.10 5853.40 2945.60 6872.00 3067.80 7543.20 3043.00 9627.70 3374.70 10201.40
M.P. 3733.60 9359.20 4370.90 9853.70 3746.40 12221.90 4655.00 13867.10 4226.90 14821.00
Maharastra 7128.40 17876.50 7356.30 20328.80 6301.40 24015.80 6798.80 33608.80 5633.60 31053.30
Manipur 458.10 555.70 432.50 700.50 396.20 719.70 702.20 855.10 532.10 900.80
Meghalaya 298.40 487.10 312.60 538.10 347.20 660.30 583.50 612.70 645.00 924.10
Mizoram 316.70 492.90 355.20 514.70 333.50 559.80 564.20 984.50 378.20 606.60
Nagaland 412.10 683.70 415.90 814.40 503.30 987.30 510.40 7853.40 477.10 1021.80
Orissa 2303.00 4007.30 2639.80 4160.60 2784.30 5858.00 2782.00 7853.40 3538.70 8565.90
Punjab 1196.10 6351.20 1485.00 7986.60 1550.50 9412.10 2865.20 11586.70 2905.10 13067.50
Rajasthan 3296.70 7667.50 3869.10 8815.90 3495.70 10818.50 3649.30 13206.30 3968.90 13271.40
Sikkim 219.90 1020.80 233.90 1160.30 251.50 1369.90 310.90 1398.90 376.70 786.30
Tamilnadu 3440.30 11962.00 3287.00 14046.30 3877.20 16002.50 4224.70 18058.80 4342.10 20271.60
Tripura 527.50 651.30 514.50 835.70 521.10 1009.70 673.30 1200.80 872.60 1501.30
U.P. 6035.30 16981.50 5774.00 20851.50 6710.10 24752.30 8938.70 28107.90 11397.90 29906.20
W.B. 3004.80 10027.10 2980.80 10575.80 3963.30 13189.90 5086.10 18045.50 6329.50 18215.20
NCT Delhi 1877.10 1638.20 1985.40 2225.40 2149.30 2793.30 2562.10 3978.90 3352.40 3597.60
All States 53045.60 149723.10 59260.00 168874.80 64870.60 201490.20 78156.10 247477.80 89073.50 261693.30
Source : RBI and Planning Commission Various Documents
TABLE AS - 3 : ALL STATESPLAN AND NON PLAN EXPENDITURE
- S-13 -

(Rs in Crores)
States Year Year Year Year Year Year Year Year Year Year Year
90-91(AC) 91-92(AC) 92-93(AC) 93-94 (Ac) 94-95(AC) 95-96(AC) 96-97(AC) 97-98(AC) 98-99(AC) 99-00(RE) 00-01(BE)
Andhra 4784.40 5609.40 6499.20 7610.50 8916.90 10163.70 11127.40 12304.60 14515.50 16065.10 20712.30
(15.50) (17.20) (15.86) (17.10) (17.20) (13.98) (9.48) (10.60) (18.00) (10.70) (28.90)
Arp 301.30 337.40 394.00 454.90 548.40 643.40 703.50 746.70 732.50 875.80 808.60
(7.30) (12.00) (16.78) (15.50) (20.60) (17.32) (9.34) (6.10) (-1.9) (19.60) (-7.7)
Assam 1740.90 2127.60 1947.90 2249.90 2447.30 2788.40 2609.80 2904.20 3246.80 5372.50 6971.40
(15.40) (22.20) (-8.45) (15.50) (8.80) (13.94) (-6.41) (11.30) (11.80) (65.50) (29.80)
Bihar 4173.20 4390.50 4893.70 5267.40 5075.90 5514.40 5463.40 5874.40 7034.50 12052.40 12128.70
(21.30) (5.20) (11.46) (7.60) (-3.6) (8.64) (-0.93) (7.50) (19.80) (71.30) (0.60)
Goa 310.80 347.70 372.70 403.60 448.50 522.10 579.00 671.10 804.70 982.40 1114.70
(22.90) (11.90) (7.19) (8.30) (11.10) (16.41) (10.90) (15.90) (19.90) (22.10) (13.50)
Gujarat 4067.40 5139.00 5691.00 6013.40 6841.10 7798.00 8804.00 10619.20 13706.90 14835.10 15592.00
(15.00) (26.30) (10.74) (5.70) (13.80) (13.99) (12.90) (20.60) (29.10) (8.20) (5.10)
Haryana 1669.20 1852.00 2077.30 2324.00 3300.70 3424.50 3891.70 4263.50 5432.50 5461.90 6281.50
(14.20) (11.00) (12.17) (11.90) (42.00) (3.75) (13.64) (9.60) (27.40) (0.50) (15.00)
H.P 802.00 869.90 973.60 1153.20 1397.00 1646.80 1841.10 2503.80 2868.50 3015.50 3115.90
(11.00) (8.50) (11.92) (18.40) (21.10) (17.88) (11.80) (36.00) (14.60) (5.10) (3.30)
J & K 1340.80 1434.20 1518.20 1628.50 1975.00 2301.50 2586.30 3104.10 3624.20 3718.70 4526.80
(25.30) (7.00) (5.86) (7.30) (21.30) (16.53) (12.38) (20.00) (16.80) (2.60) (21.70)
Karnataka 3533.70 4505.40 5017.10 5804.50 6193.00 7350.10 8399.30 8394.60 9980.80 10532.80 13159.00
(16.40) (27.50) (11.36) (15.70) (6.70) (18.68) (14.28) (-0.1) (18.90) (5.50) (24.90)
Kerala 2187.70 2421.80 2682.20 3167.70 3731.50 4314.80 4973.50 6293.30 6626.20 7663.60 8133.40
(19.80) (10.70) (10.75) (18.10) (17.80) (15.63) (15.26) (26.50) (5.30) (15.70) (6.10)
M.P. 4188.90 4723.50 5431.00 6254.20 6389.40 7199.30 9096.60 9647.00 10316.70 11576.50 10613.60
(22.60) (12.70) (14.98) (15.20) (2.20) (12.68) (26.35) (6.10) (6.90) (12.20) (-8.3)
Maharastra 7732.50 8408.90 9778.70 11289.30 14562.80 15263.70 17627.60 18952.40 18664.50 25167.20 18654.80
(9.00) (8.70) (16.29) (15.40) (29.00) (4.81) (15.49) (7.50) (-1.5) (34.80) (-25.9)
Manipur 333.30 388.60 360.70 399.50 462.40 581.30 729.10 774.20 707.20 1329.90 970.30
(7.60) (16.60) (-7.18) (10.80) (15.70) (25.71) (25.43) (6.20) (-8.7) (88.10) (-27.0)
Meghalaya 303.00 370.60 401.30 437.70 409.10 544.30 547.40 585.30 696.20 990.90 1083.50
(17.30) (22.30) (8.23) (9.10) (-6.5) (33.05) (0.57) (6.90) (18.90) (42.30) (9.30)
Mizoram 280.10 326.20 379.40 398.40 448.00 530.80 607.70 627.80 635.60 849.20 641.20
(13.50) (16.50) (16.21) (5.00) (12.40) (18.48) (14.49) (3.30) (1.20) (33.60) (-24.5)
Nagaland 366.70 414.10 453.60 522.70 559.30 662.50 681.20 767.30 803.20 843.20 867.00
(5.60) (12.90) (9.54) (15.20) (7.00) (18.45) (2.82) (12.60) (4.70) (5.00) (2.80)
Orissa 2094.90 2472.50 2672.50 2916.40 3299.50 3658.10 4098.90 4203.40 5180.60 6723.80 7030.50
(25.70) (18.00) (8.09) (9.10) (13.10) (10.87) (12.05) (2.50) (23.20) (29.80) (4.60)
Punjab 2364.50 3879.20 2575.50 2872.10 3244.70 3481.20 4086.00 5113.50 5112.60 7149.10 7327.70
(16.60) (64.10) (-33.61) (11.50) (13.00) (7.29) (17.37) (25.10) 0.00 (39.80) (2.50)
Rajasthan 3067.50 4141.40 4426.50 5119.80 5646.50 7029.70 7223.30 8209.90 9136.10 9634.90 10408.00
(33.60) (35.00) (6.88) (15.70) (10.30) (24.50) (2.75) (13.70) (11.30) (5.50) (8.00)
Sikkim 147.70 182.30 197.10 200.10 221.70 312.30 332.90 373.70 456.10 540.70 590.80
(7.50) (23.40) (8.12) (1.50) (10.80) (40.87) (6.60) (12.30) (22.00) (18.60) (9.30)
Tamilnadu 4737.90 7421.80 7132.90 7117.50 8135.60 8559.40 10559.50 11309.90 12274.70 12938.90 14669.70
(15.40) (56.60) (-3.89) (-0.2) (14.30) (5.21) (23.37) (7.10) (8.50) (5.40) (13.40)
Tripura 446.10 495.90 449.30 522.40 623.80 697.40 836.70 907.50 956.70 1262.80 1563.80
(13.70) (11.20) (-9.40) (16.63) (19.40) (11.80) (19.97) (8.50) (5.40) (32.00) (23.80)
U.P. 8309.80 8388.90 10172.00 9637.40 11733.80 11191.90 13484.50 14936.70 17291.10 20018.80 21969.50
(31.40) (1.00) (21.26) (-5.3) (21.80) (-4.62) (20.48) (10.80) (15.80) (15.80) (9.70)
W.B. 4085.60 3938.90 4070.00 5025.60 6016.90 6708.60 8473.20 8178.50 10396.00 14387.90 14220.40
(25.90) (-3.6) (3.33) (23.50) (19.70) (11.50) (26.30) (-3.5) (27.10) (38.40) (-1.2)
NCTDelhi NA NA NA 596.90 1719.00 1931.40 2644.20 3002.00 3303.20 4332.40 5177.40
(-) (188.00) (12.36) (36.91) (13.50) (10.00) (31.20) (19.50)
All States 63369.90 74587.70 80566.90 89387.60 104347.80 114819.40 132007.70 145268.40 164503.50 198321.80 208332.40
(19.20) (17.70) (8.02) (10.90) (16.70) (10.04) (14.97) (10.00) (13.20) (20.60) (5.00)
Note: (1) NA denotes Not Available (2) Figures in brackets are percentage variation over previous yearSource: Reserve Bank of India, Finances of the State Government various years' issues.
STATEWISE DEVELOPMENT EXPENDITUTE TABLE AS - 4 : ALL STATES
- S-14 -
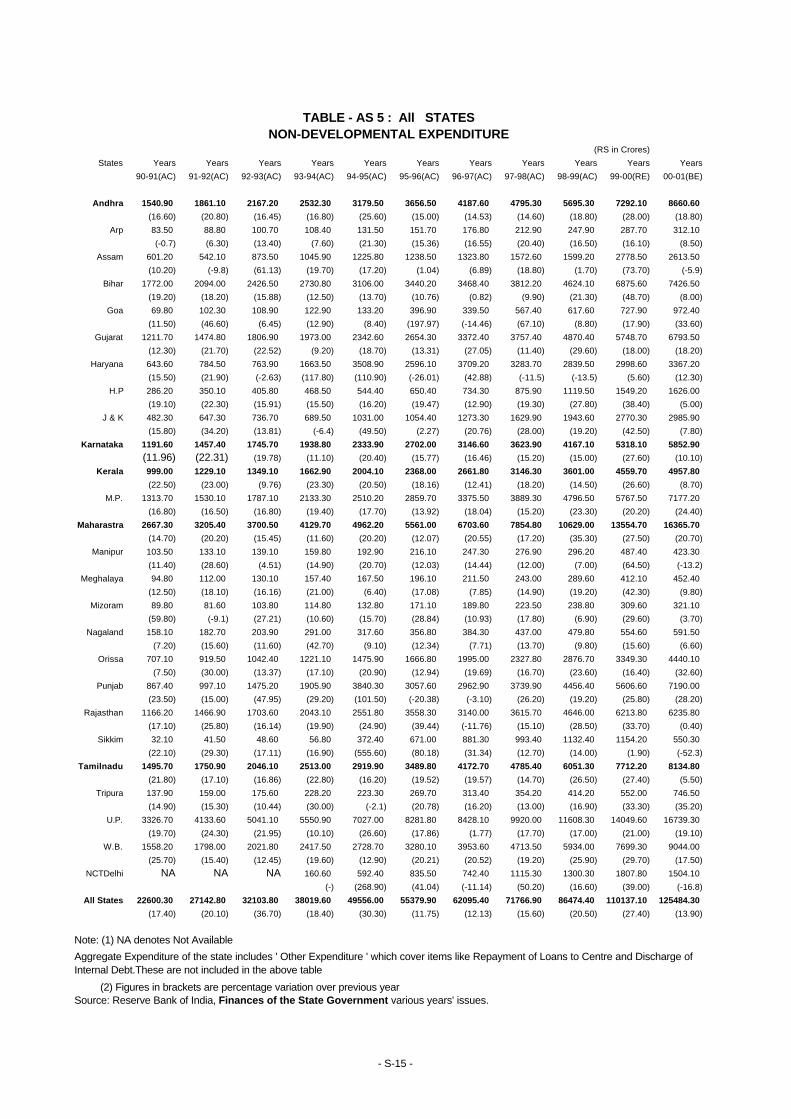
(RS in Crores)
States Years Years Years Years Years Years Years Years Years Years Years
90-91(AC) 91-92(AC) 92-93(AC) 93-94(AC) 94-95(AC) 95-96(AC) 96-97(AC) 97-98(AC) 98-99(AC) 99-00(RE) 00-01(BE)
Andhra 1540.90 1861.10 2167.20 2532.30 3179.50 3656.50 4187.60 4795.30 5695.30 7292.10 8660.60
(16.60) (20.80) (16.45) (16.80) (25.60) (15.00) (14.53) (14.60) (18.80) (28.00) (18.80)
Arp 83.50 88.80 100.70 108.40 131.50 151.70 176.80 212.90 247.90 287.70 312.10
(-0.7) (6.30) (13.40) (7.60) (21.30) (15.36) (16.55) (20.40) (16.50) (16.10) (8.50)
Assam 601.20 542.10 873.50 1045.90 1225.80 1238.50 1323.80 1572.60 1599.20 2778.50 2613.50
(10.20) (-9.8) (61.13) (19.70) (17.20) (1.04) (6.89) (18.80) (1.70) (73.70) (-5.9)
Bihar 1772.00 2094.00 2426.50 2730.80 3106.00 3440.20 3468.40 3812.20 4624.10 6875.60 7426.50
(19.20) (18.20) (15.88) (12.50) (13.70) (10.76) (0.82) (9.90) (21.30) (48.70) (8.00)
Goa 69.80 102.30 108.90 122.90 133.20 396.90 339.50 567.40 617.60 727.90 972.40
(11.50) (46.60) (6.45) (12.90) (8.40) (197.97) (-14.46) (67.10) (8.80) (17.90) (33.60)
Gujarat 1211.70 1474.80 1806.90 1973.00 2342.60 2654.30 3372.40 3757.40 4870.40 5748.70 6793.50
(12.30) (21.70) (22.52) (9.20) (18.70) (13.31) (27.05) (11.40) (29.60) (18.00) (18.20)
Haryana 643.60 784.50 763.90 1663.50 3508.90 2596.10 3709.20 3283.70 2839.50 2998.60 3367.20
(15.50) (21.90) (-2.63) (117.80) (110.90) (-26.01) (42.88) (-11.5) (-13.5) (5.60) (12.30)
H.P 286.20 350.10 405.80 468.50 544.40 650.40 734.30 875.90 1119.50 1549.20 1626.00
(19.10) (22.30) (15.91) (15.50) (16.20) (19.47) (12.90) (19.30) (27.80) (38.40) (5.00)
J & K 482.30 647.30 736.70 689.50 1031.00 1054.40 1273.30 1629.90 1943.60 2770.30 2985.90
(15.80) (34.20) (13.81) (-6.4) (49.50) (2.27) (20.76) (28.00) (19.20) (42.50) (7.80)
Karnataka 1191.60 1457.40 1745.70 1938.80 2333.90 2702.00 3146.60 3623.90 4167.10 5318.10 5852.90
(11.96) (22.31) (19.78) (11.10) (20.40) (15.77) (16.46) (15.20) (15.00) (27.60) (10.10)
Kerala 999.00 1229.10 1349.10 1662.90 2004.10 2368.00 2661.80 3146.30 3601.00 4559.70 4957.80
(22.50) (23.00) (9.76) (23.30) (20.50) (18.16) (12.41) (18.20) (14.50) (26.60) (8.70)
M.P. 1313.70 1530.10 1787.10 2133.30 2510.20 2859.70 3375.50 3889.30 4796.50 5767.50 7177.20
(16.80) (16.50) (16.80) (19.40) (17.70) (13.92) (18.04) (15.20) (23.30) (20.20) (24.40)
Maharastra 2667.30 3205.40 3700.50 4129.70 4962.20 5561.00 6703.60 7854.80 10629.00 13554.70 16365.70
(14.70) (20.20) (15.45) (11.60) (20.20) (12.07) (20.55) (17.20) (35.30) (27.50) (20.70)
Manipur 103.50 133.10 139.10 159.80 192.90 216.10 247.30 276.90 296.20 487.40 423.30
(11.40) (28.60) (4.51) (14.90) (20.70) (12.03) (14.44) (12.00) (7.00) (64.50) (-13.2)
Meghalaya 94.80 112.00 130.10 157.40 167.50 196.10 211.50 243.00 289.60 412.10 452.40
(12.50) (18.10) (16.16) (21.00) (6.40) (17.08) (7.85) (14.90) (19.20) (42.30) (9.80)
Mizoram 89.80 81.60 103.80 114.80 132.80 171.10 189.80 223.50 238.80 309.60 321.10
(59.80) (-9.1) (27.21) (10.60) (15.70) (28.84) (10.93) (17.80) (6.90) (29.60) (3.70)
Nagaland 158.10 182.70 203.90 291.00 317.60 356.80 384.30 437.00 479.80 554.60 591.50
(7.20) (15.60) (11.60) (42.70) (9.10) (12.34) (7.71) (13.70) (9.80) (15.60) (6.60)
Orissa 707.10 919.50 1042.40 1221.10 1475.90 1666.80 1995.00 2327.80 2876.70 3349.30 4440.10
(7.50) (30.00) (13.37) (17.10) (20.90) (12.94) (19.69) (16.70) (23.60) (16.40) (32.60)
Punjab 867.40 997.10 1475.20 1905.90 3840.30 3057.60 2962.90 3739.90 4456.40 5606.60 7190.00
(23.50) (15.00) (47.95) (29.20) (101.50) (-20.38) (-3.10) (26.20) (19.20) (25.80) (28.20)
Rajasthan 1166.20 1466.90 1703.60 2043.10 2551.80 3558.30 3140.00 3615.70 4646.00 6213.80 6235.80
(17.10) (25.80) (16.14) (19.90) (24.90) (39.44) (-11.76) (15.10) (28.50) (33.70) (0.40)
Sikkim 32.10 41.50 48.60 56.80 372.40 671.00 881.30 993.40 1132.40 1154.20 550.30
(22.10) (29.30) (17.11) (16.90) (555.60) (80.18) (31.34) (12.70) (14.00) (1.90) (-52.3)
Tamilnadu 1495.70 1750.90 2046.10 2513.00 2919.90 3489.80 4172.70 4785.40 6051.30 7712.20 8134.80
(21.80) (17.10) (16.86) (22.80) (16.20) (19.52) (19.57) (14.70) (26.50) (27.40) (5.50)
Tripura 137.90 159.00 175.60 228.20 223.30 269.70 313.40 354.20 414.20 552.00 746.50
(14.90) (15.30) (10.44) (30.00) (-2.1) (20.78) (16.20) (13.00) (16.90) (33.30) (35.20)
U.P. 3326.70 4133.60 5041.10 5550.90 7027.00 8281.80 8428.10 9920.00 11608.30 14049.60 16739.30
(19.70) (24.30) (21.95) (10.10) (26.60) (17.86) (1.77) (17.70) (17.00) (21.00) (19.10)
W.B. 1558.20 1798.00 2021.80 2417.50 2728.70 3280.10 3953.60 4713.50 5934.00 7699.30 9044.00
(25.70) (15.40) (12.45) (19.60) (12.90) (20.21) (20.52) (19.20) (25.90) (29.70) (17.50)
NCTDelhi NA NA NA 160.60 592.40 835.50 742.40 1115.30 1300.30 1807.80 1504.10
(-) (268.90) (41.04) (-11.14) (50.20) (16.60) (39.00) (-16.8)
All States 22600.30 27142.80 32103.80 38019.60 49556.00 55379.90 62095.40 71766.90 86474.40 110137.10 125484.30
(17.40) (20.10) (36.70) (18.40) (30.30) (11.75) (12.13) (15.60) (20.50) (27.40) (13.90)
Note: (1) NA denotes Not Available
(2) Figures in brackets are percentage variation over previous yearSource: Reserve Bank of India, Finances of the State Government various years' issues.
TABLE - AS 5 : All STATESNON-DEVELOPMENTAL EXPENDITURE
Aggregate Expenditure of the state includes ' Other Expenditure ' which cover items like Repayment of Loans to Centre and Discharge of Internal Debt.These are not included in the above table
- S-15 -
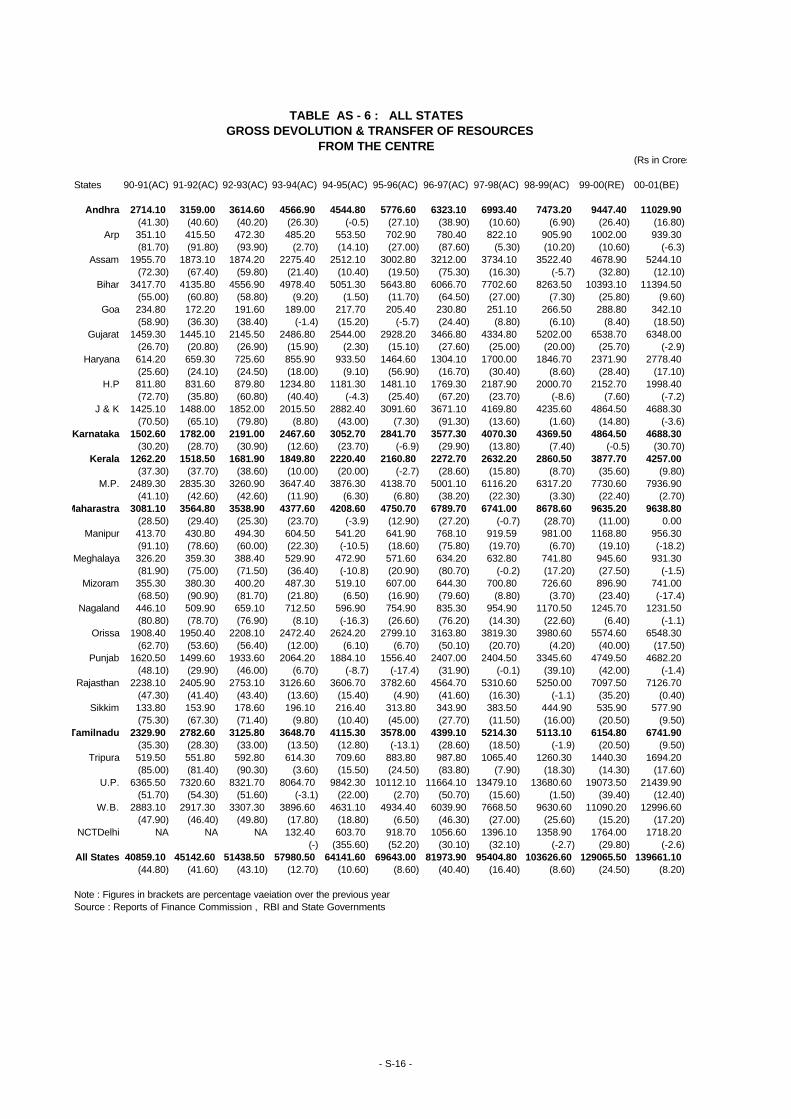
(Rs in Crores)
States 90-91(AC) 91-92(AC) 92-93(AC) 93-94(AC) 94-95(AC) 95-96(AC) 96-97(AC) 97-98(AC) 98-99(AC) 99-00(RE) 00-01(BE)
Andhra 2714.10 3159.00 3614.60 4566.90 4544.80 5776.60 6323.10 6993.40 7473.20 9447.40 11029.90(41.30) (40.60) (40.20) (26.30) (-0.5) (27.10) (38.90) (10.60) (6.90) (26.40) (16.80)
Arp 351.10 415.50 472.30 485.20 553.50 702.90 780.40 822.10 905.90 1002.00 939.30(81.70) (91.80) (93.90) (2.70) (14.10) (27.00) (87.60) (5.30) (10.20) (10.60) (-6.3)
Assam 1955.70 1873.10 1874.20 2275.40 2512.10 3002.80 3212.00 3734.10 3522.40 4678.90 5244.10(72.30) (67.40) (59.80) (21.40) (10.40) (19.50) (75.30) (16.30) (-5.7) (32.80) (12.10)
Bihar 3417.70 4135.80 4556.90 4978.40 5051.30 5643.80 6066.70 7702.60 8263.50 10393.10 11394.50(55.00) (60.80) (58.80) (9.20) (1.50) (11.70) (64.50) (27.00) (7.30) (25.80) (9.60)
Goa 234.80 172.20 191.60 189.00 217.70 205.40 230.80 251.10 266.50 288.80 342.10(58.90) (36.30) (38.40) (-1.4) (15.20) (-5.7) (24.40) (8.80) (6.10) (8.40) (18.50)
Gujarat 1459.30 1445.10 2145.50 2486.80 2544.00 2928.20 3466.80 4334.80 5202.00 6538.70 6348.00(26.70) (20.80) (26.90) (15.90) (2.30) (15.10) (27.60) (25.00) (20.00) (25.70) (-2.9)
Haryana 614.20 659.30 725.60 855.90 933.50 1464.60 1304.10 1700.00 1846.70 2371.90 2778.40(25.60) (24.10) (24.50) (18.00) (9.10) (56.90) (16.70) (30.40) (8.60) (28.40) (17.10)
H.P 811.80 831.60 879.80 1234.80 1181.30 1481.10 1769.30 2187.90 2000.70 2152.70 1998.40(72.70) (35.80) (60.80) (40.40) (-4.3) (25.40) (67.20) (23.70) (-8.6) (7.60) (-7.2)
J & K 1425.10 1488.00 1852.00 2015.50 2882.40 3091.60 3671.10 4169.80 4235.60 4864.50 4688.30(70.50) (65.10) (79.80) (8.80) (43.00) (7.30) (91.30) (13.60) (1.60) (14.80) (-3.6)
Karnataka 1502.60 1782.00 2191.00 2467.60 3052.70 2841.70 3577.30 4070.30 4369.50 4864.50 4688.30(30.20) (28.70) (30.90) (12.60) (23.70) (-6.9) (29.90) (13.80) (7.40) (-0.5) (30.70)
Kerala 1262.20 1518.50 1681.90 1849.80 2220.40 2160.80 2272.70 2632.20 2860.50 3877.70 4257.00(37.30) (37.70) (38.60) (10.00) (20.00) (-2.7) (28.60) (15.80) (8.70) (35.60) (9.80)
M.P. 2489.30 2835.30 3260.90 3647.40 3876.30 4138.70 5001.10 6116.20 6317.20 7730.60 7936.90(41.10) (42.60) (42.60) (11.90) (6.30) (6.80) (38.20) (22.30) (3.30) (22.40) (2.70)
Maharastra 3081.10 3564.80 3538.90 4377.60 4208.60 4750.70 6789.70 6741.00 8678.60 9635.20 9638.80(28.50) (29.40) (25.30) (23.70) (-3.9) (12.90) (27.20) (-0.7) (28.70) (11.00) 0.00
Manipur 413.70 430.80 494.30 604.50 541.20 641.90 768.10 919.59 981.00 1168.80 956.30(91.10) (78.60) (60.00) (22.30) (-10.5) (18.60) (75.80) (19.70) (6.70) (19.10) (-18.2)
Meghalaya 326.20 359.30 388.40 529.90 472.90 571.60 634.20 632.80 741.80 945.60 931.30(81.90) (75.00) (71.50) (36.40) (-10.8) (20.90) (80.70) (-0.2) (17.20) (27.50) (-1.5)
Mizoram 355.30 380.30 400.20 487.30 519.10 607.00 644.30 700.80 726.60 896.90 741.00(68.50) (90.90) (81.70) (21.80) (6.50) (16.90) (79.60) (8.80) (3.70) (23.40) (-17.4)
Nagaland 446.10 509.90 659.10 712.50 596.90 754.90 835.30 954.90 1170.50 1245.70 1231.50(80.80) (78.70) (76.90) (8.10) (-16.3) (26.60) (76.20) (14.30) (22.60) (6.40) (-1.1)
Orissa 1908.40 1950.40 2208.10 2472.40 2624.20 2799.10 3163.80 3819.30 3980.60 5574.60 6548.30(62.70) (53.60) (56.40) (12.00) (6.10) (6.70) (50.10) (20.70) (4.20) (40.00) (17.50)
Punjab 1620.50 1499.60 1933.60 2064.20 1884.10 1556.40 2407.00 2404.50 3345.60 4749.50 4682.20(48.10) (29.90) (46.00) (6.70) (-8.7) (-17.4) (31.90) (-0.1) (39.10) (42.00) (-1.4)
Rajasthan 2238.10 2405.90 2753.10 3126.60 3606.70 3782.60 4564.70 5310.60 5250.00 7097.50 7126.70(47.30) (41.40) (43.40) (13.60) (15.40) (4.90) (41.60) (16.30) (-1.1) (35.20) (0.40)
Sikkim 133.80 153.90 178.60 196.10 216.40 313.80 343.90 383.50 444.90 535.90 577.90(75.30) (67.30) (71.40) (9.80) (10.40) (45.00) (27.70) (11.50) (16.00) (20.50) (9.50)
Tamilnadu 2329.90 2782.60 3125.80 3648.70 4115.30 3578.00 4399.10 5214.30 5113.10 6154.80 6741.90(35.30) (28.30) (33.00) (13.50) (12.80) (-13.1) (28.60) (18.50) (-1.9) (20.50) (9.50)
Tripura 519.50 551.80 592.80 614.30 709.60 883.80 987.80 1065.40 1260.30 1440.30 1694.20(85.00) (81.40) (90.30) (3.60) (15.50) (24.50) (83.80) (7.90) (18.30) (14.30) (17.60)
U.P. 6365.50 7320.60 8321.70 8064.70 9842.30 10112.10 11664.10 13479.10 13680.60 19073.50 21439.90(51.70) (54.30) (51.60) (-3.1) (22.00) (2.70) (50.70) (15.60) (1.50) (39.40) (12.40)
W.B. 2883.10 2917.30 3307.30 3896.60 4631.10 4934.40 6039.90 7668.50 9630.60 11090.20 12996.60(47.90) (46.40) (49.80) (17.80) (18.80) (6.50) (46.30) (27.00) (25.60) (15.20) (17.20)
NCTDelhi NA NA NA 132.40 603.70 918.70 1056.60 1396.10 1358.90 1764.00 1718.20(-) (355.60) (52.20) (30.10) (32.10) (-2.7) (29.80) (-2.6)
All States 40859.10 45142.60 51438.50 57980.50 64141.60 69643.00 81973.90 95404.80 103626.60 129065.50 139661.10(44.80) (41.60) (43.10) (12.70) (10.60) (8.60) (40.40) (16.40) (8.60) (24.50) (8.20)
Note : Figures in brackets are percentage vaeiation over the previous yearSource : Reports of Finance Commission , RBI and State Governments
GROSS DEVOLUTION & TRANSFER OF RESOURCESFROM THE CENTRE
TABLE AS - 6 : ALL STATES
- S-16 -
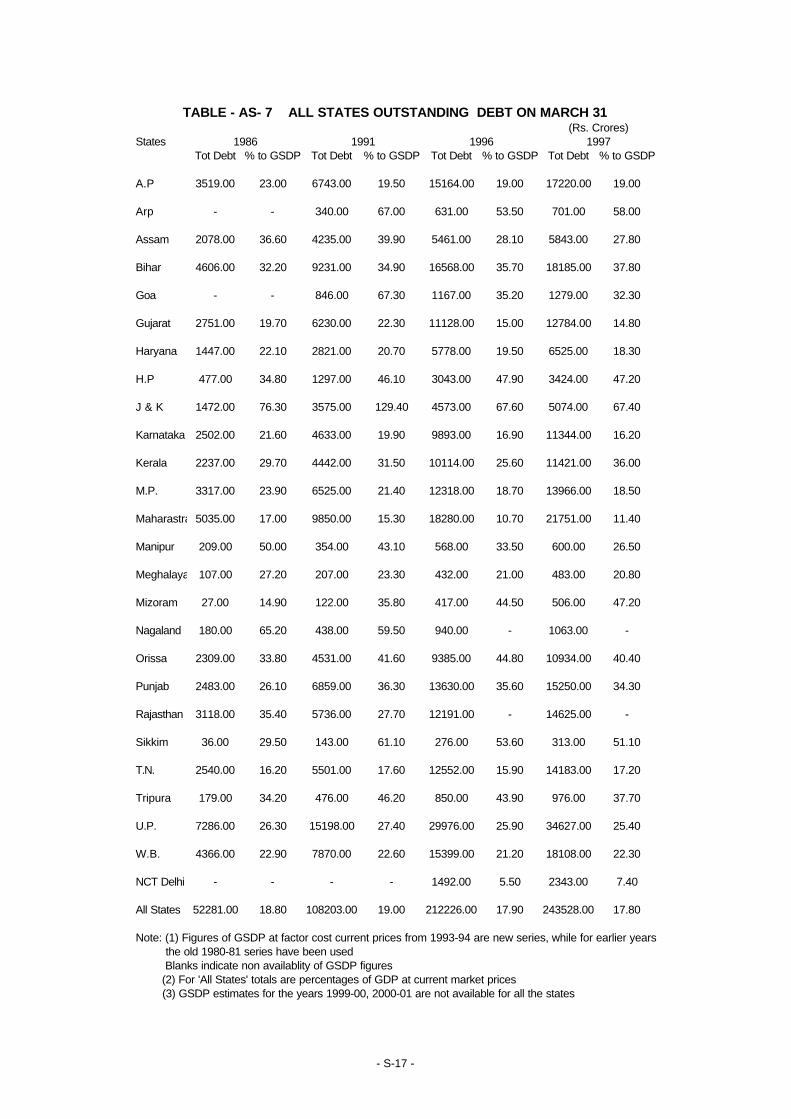
(Rs. Crores)States
Tot Debt % to GSDP Tot Debt % to GSDP Tot Debt % to GSDP Tot Debt % to GSDP
A.P 3519.00 23.00 6743.00 19.50 15164.00 19.00 17220.00 19.00
Arp - - 340.00 67.00 631.00 53.50 701.00 58.00
Assam 2078.00 36.60 4235.00 39.90 5461.00 28.10 5843.00 27.80
Bihar 4606.00 32.20 9231.00 34.90 16568.00 35.70 18185.00 37.80
Goa - - 846.00 67.30 1167.00 35.20 1279.00 32.30
Gujarat 2751.00 19.70 6230.00 22.30 11128.00 15.00 12784.00 14.80
Haryana 1447.00 22.10 2821.00 20.70 5778.00 19.50 6525.00 18.30
H.P 477.00 34.80 1297.00 46.10 3043.00 47.90 3424.00 47.20
J & K 1472.00 76.30 3575.00 129.40 4573.00 67.60 5074.00 67.40
Karnataka 2502.00 21.60 4633.00 19.90 9893.00 16.90 11344.00 16.20
Kerala 2237.00 29.70 4442.00 31.50 10114.00 25.60 11421.00 36.00
M.P. 3317.00 23.90 6525.00 21.40 12318.00 18.70 13966.00 18.50
Maharastra 5035.00 17.00 9850.00 15.30 18280.00 10.70 21751.00 11.40
Manipur 209.00 50.00 354.00 43.10 568.00 33.50 600.00 26.50
Meghalaya 107.00 27.20 207.00 23.30 432.00 21.00 483.00 20.80
Mizoram 27.00 14.90 122.00 35.80 417.00 44.50 506.00 47.20
Nagaland 180.00 65.20 438.00 59.50 940.00 - 1063.00 -
Orissa 2309.00 33.80 4531.00 41.60 9385.00 44.80 10934.00 40.40
Punjab 2483.00 26.10 6859.00 36.30 13630.00 35.60 15250.00 34.30
Rajasthan 3118.00 35.40 5736.00 27.70 12191.00 - 14625.00 -
Sikkim 36.00 29.50 143.00 61.10 276.00 53.60 313.00 51.10
T.N. 2540.00 16.20 5501.00 17.60 12552.00 15.90 14183.00 17.20
Tripura 179.00 34.20 476.00 46.20 850.00 43.90 976.00 37.70
U.P. 7286.00 26.30 15198.00 27.40 29976.00 25.90 34627.00 25.40
W.B. 4366.00 22.90 7870.00 22.60 15399.00 21.20 18108.00 22.30
NCT Delhi - - - - 1492.00 5.50 2343.00 7.40
All States 52281.00 18.80 108203.00 19.00 212226.00 17.90 243528.00 17.80
Note: (1) Figures of GSDP at factor cost current prices from 1993-94 are new series, while for earlier years the old 1980-81 series have been used Blanks indicate non availablity of GSDP figures (2) For 'All States' totals are percentages of GDP at current market prices (3) GSDP estimates for the years 1999-00, 2000-01 are not available for all the states
TABLE - AS- 7 ALL STATES OUTSTANDING DEBT ON MARCH 31
1986 1991 1996 1997
- S-17 -
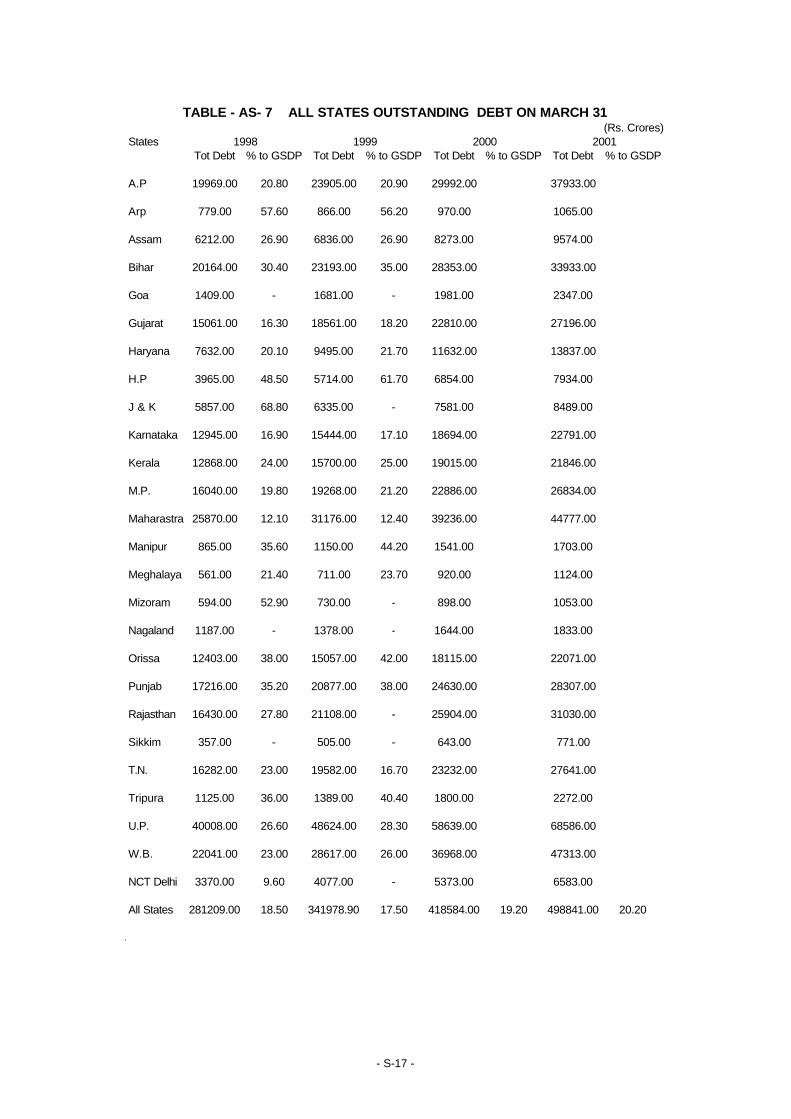
(Rs. Crores)States
Tot Debt % to GSDP Tot Debt % to GSDP Tot Debt % to GSDP Tot Debt % to GSDP
A.P 19969.00 20.80 23905.00 20.90 29992.00 37933.00
Arp 779.00 57.60 866.00 56.20 970.00 1065.00
Assam 6212.00 26.90 6836.00 26.90 8273.00 9574.00
Bihar 20164.00 30.40 23193.00 35.00 28353.00 33933.00
Goa 1409.00 - 1681.00 - 1981.00 2347.00
Gujarat 15061.00 16.30 18561.00 18.20 22810.00 27196.00
Haryana 7632.00 20.10 9495.00 21.70 11632.00 13837.00
H.P 3965.00 48.50 5714.00 61.70 6854.00 7934.00
J & K 5857.00 68.80 6335.00 - 7581.00 8489.00
Karnataka 12945.00 16.90 15444.00 17.10 18694.00 22791.00
Kerala 12868.00 24.00 15700.00 25.00 19015.00 21846.00
M.P. 16040.00 19.80 19268.00 21.20 22886.00 26834.00
Maharastra 25870.00 12.10 31176.00 12.40 39236.00 44777.00
Manipur 865.00 35.60 1150.00 44.20 1541.00 1703.00
Meghalaya 561.00 21.40 711.00 23.70 920.00 1124.00
Mizoram 594.00 52.90 730.00 - 898.00 1053.00
Nagaland 1187.00 - 1378.00 - 1644.00 1833.00
Orissa 12403.00 38.00 15057.00 42.00 18115.00 22071.00
Punjab 17216.00 35.20 20877.00 38.00 24630.00 28307.00
Rajasthan 16430.00 27.80 21108.00 - 25904.00 31030.00
Sikkim 357.00 - 505.00 - 643.00 771.00
T.N. 16282.00 23.00 19582.00 16.70 23232.00 27641.00
Tripura 1125.00 36.00 1389.00 40.40 1800.00 2272.00
U.P. 40008.00 26.60 48624.00 28.30 58639.00 68586.00
W.B. 22041.00 23.00 28617.00 26.00 36968.00 47313.00
NCT Delhi 3370.00 9.60 4077.00 - 5373.00 6583.00
All States 281209.00 18.50 341978.90 17.50 418584.00 19.20 498841.00 20.20
Note: (1) Figures of GSDP at factor cost current prices from 1993-94 are new series, while for earlier years
TABLE - AS- 7 ALL STATES OUTSTANDING DEBT ON MARCH 31
1998 1999 2000 2001
- S-17 -
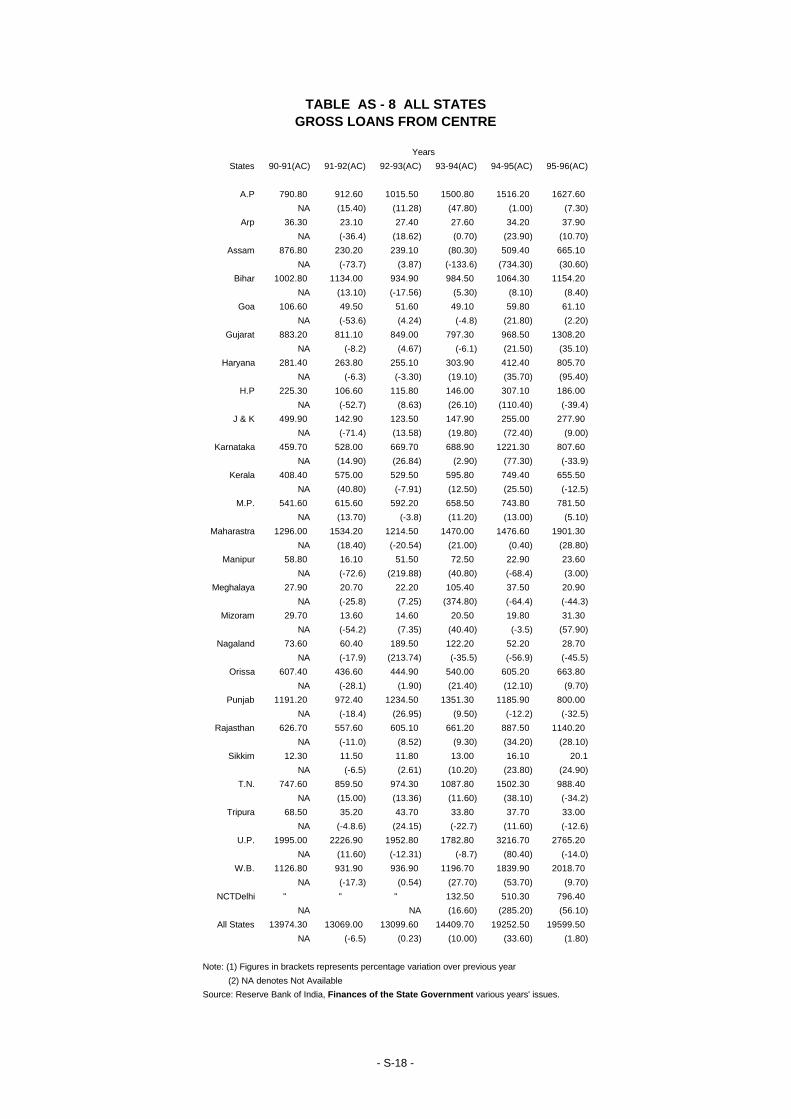
States 90-91(AC) 91-92(AC) 92-93(AC) 93-94(AC) 94-95(AC) 95-96(AC)
A.P 790.80 912.60 1015.50 1500.80 1516.20 1627.60
NA (15.40) (11.28) (47.80) (1.00) (7.30)
Arp 36.30 23.10 27.40 27.60 34.20 37.90
NA (-36.4) (18.62) (0.70) (23.90) (10.70)
Assam 876.80 230.20 239.10 (80.30) 509.40 665.10
NA (-73.7) (3.87) (-133.6) (734.30) (30.60)
Bihar 1002.80 1134.00 934.90 984.50 1064.30 1154.20
NA (13.10) (-17.56) (5.30) (8.10) (8.40)
Goa 106.60 49.50 51.60 49.10 59.80 61.10
NA (-53.6) (4.24) (-4.8) (21.80) (2.20)
Gujarat 883.20 811.10 849.00 797.30 968.50 1308.20
NA (-8.2) (4.67) (-6.1) (21.50) (35.10)
Haryana 281.40 263.80 255.10 303.90 412.40 805.70
NA (-6.3) (-3.30) (19.10) (35.70) (95.40)
H.P 225.30 106.60 115.80 146.00 307.10 186.00
NA (-52.7) (8.63) (26.10) (110.40) (-39.4)
J & K 499.90 142.90 123.50 147.90 255.00 277.90
NA (-71.4) (13.58) (19.80) (72.40) (9.00)
Karnataka 459.70 528.00 669.70 688.90 1221.30 807.60
NA (14.90) (26.84) (2.90) (77.30) (-33.9)
Kerala 408.40 575.00 529.50 595.80 749.40 655.50
NA (40.80) (-7.91) (12.50) (25.50) (-12.5)
M.P. 541.60 615.60 592.20 658.50 743.80 781.50
NA (13.70) (-3.8) (11.20) (13.00) (5.10)
Maharastra 1296.00 1534.20 1214.50 1470.00 1476.60 1901.30
NA (18.40) (-20.54) (21.00) (0.40) (28.80)
Manipur 58.80 16.10 51.50 72.50 22.90 23.60
NA (-72.6) (219.88) (40.80) (-68.4) (3.00)
Meghalaya 27.90 20.70 22.20 105.40 37.50 20.90
NA (-25.8) (7.25) (374.80) (-64.4) (-44.3)
Mizoram 29.70 13.60 14.60 20.50 19.80 31.30
NA (-54.2) (7.35) (40.40) (-3.5) (57.90)
Nagaland 73.60 60.40 189.50 122.20 52.20 28.70
NA (-17.9) (213.74) (-35.5) (-56.9) (-45.5)
Orissa 607.40 436.60 444.90 540.00 605.20 663.80
NA (-28.1) (1.90) (21.40) (12.10) (9.70)
Punjab 1191.20 972.40 1234.50 1351.30 1185.90 800.00
NA (-18.4) (26.95) (9.50) (-12.2) (-32.5)
Rajasthan 626.70 557.60 605.10 661.20 887.50 1140.20
NA (-11.0) (8.52) (9.30) (34.20) (28.10)
Sikkim 12.30 11.50 11.80 13.00 16.10 20.1
NA (-6.5) (2.61) (10.20) (23.80) (24.90)
T.N. 747.60 859.50 974.30 1087.80 1502.30 988.40
NA (15.00) (13.36) (11.60) (38.10) (-34.2)
Tripura 68.50 35.20 43.70 33.80 37.70 33.00
NA (-4.8.6) (24.15) (-22.7) (11.60) (-12.6)
U.P. 1995.00 2226.90 1952.80 1782.80 3216.70 2765.20
NA (11.60) (-12.31) (-8.7) (80.40) (-14.0)
W.B. 1126.80 931.90 936.90 1196.70 1839.90 2018.70
NA (-17.3) (0.54) (27.70) (53.70) (9.70)
NCTDelhi " " " 132.50 510.30 796.40
NA NA (16.60) (285.20) (56.10)
All States 13974.30 13069.00 13099.60 14409.70 19252.50 19599.50
NA (-6.5) (0.23) (10.00) (33.60) (1.80)
Note: (1) Figures in brackets represents percentage variation over previous year
(2) NA denotes Not AvailableSource: Reserve Bank of India, Finances of the State Government various years' issues.
Years
TABLE AS - 8 ALL STATESGROSS LOANS FROM CENTRE
- S-18 -
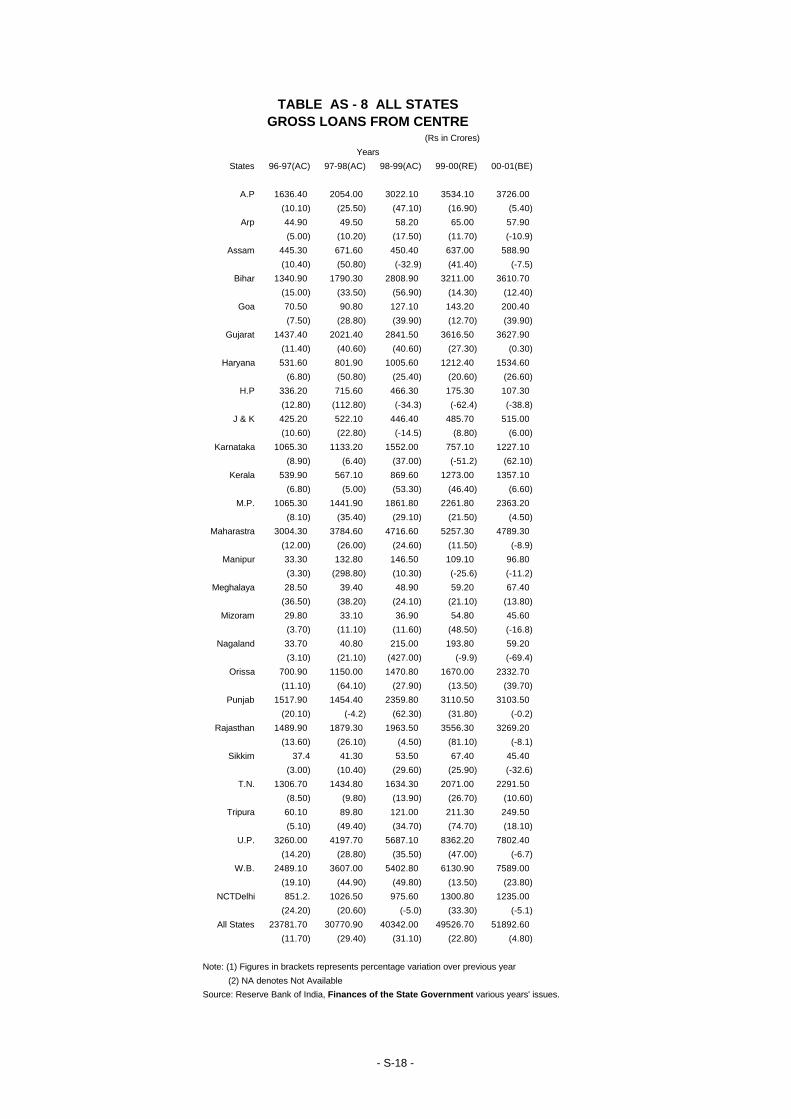
(Rs in Crores)
States 96-97(AC) 97-98(AC) 98-99(AC) 99-00(RE) 00-01(BE)
A.P 1636.40 2054.00 3022.10 3534.10 3726.00
(10.10) (25.50) (47.10) (16.90) (5.40)
Arp 44.90 49.50 58.20 65.00 57.90
(5.00) (10.20) (17.50) (11.70) (-10.9)
Assam 445.30 671.60 450.40 637.00 588.90
(10.40) (50.80) (-32.9) (41.40) (-7.5)
Bihar 1340.90 1790.30 2808.90 3211.00 3610.70
(15.00) (33.50) (56.90) (14.30) (12.40)
Goa 70.50 90.80 127.10 143.20 200.40
(7.50) (28.80) (39.90) (12.70) (39.90)
Gujarat 1437.40 2021.40 2841.50 3616.50 3627.90
(11.40) (40.60) (40.60) (27.30) (0.30)
Haryana 531.60 801.90 1005.60 1212.40 1534.60
(6.80) (50.80) (25.40) (20.60) (26.60)
H.P 336.20 715.60 466.30 175.30 107.30
(12.80) (112.80) (-34.3) (-62.4) (-38.8)
J & K 425.20 522.10 446.40 485.70 515.00
(10.60) (22.80) (-14.5) (8.80) (6.00)
Karnataka 1065.30 1133.20 1552.00 757.10 1227.10
(8.90) (6.40) (37.00) (-51.2) (62.10)
Kerala 539.90 567.10 869.60 1273.00 1357.10
(6.80) (5.00) (53.30) (46.40) (6.60)
M.P. 1065.30 1441.90 1861.80 2261.80 2363.20
(8.10) (35.40) (29.10) (21.50) (4.50)
Maharastra 3004.30 3784.60 4716.60 5257.30 4789.30
(12.00) (26.00) (24.60) (11.50) (-8.9)
Manipur 33.30 132.80 146.50 109.10 96.80
(3.30) (298.80) (10.30) (-25.6) (-11.2)
Meghalaya 28.50 39.40 48.90 59.20 67.40
(36.50) (38.20) (24.10) (21.10) (13.80)
Mizoram 29.80 33.10 36.90 54.80 45.60
(3.70) (11.10) (11.60) (48.50) (-16.8)
Nagaland 33.70 40.80 215.00 193.80 59.20
(3.10) (21.10) (427.00) (-9.9) (-69.4)
Orissa 700.90 1150.00 1470.80 1670.00 2332.70
(11.10) (64.10) (27.90) (13.50) (39.70)
Punjab 1517.90 1454.40 2359.80 3110.50 3103.50
(20.10) (-4.2) (62.30) (31.80) (-0.2)
Rajasthan 1489.90 1879.30 1963.50 3556.30 3269.20
(13.60) (26.10) (4.50) (81.10) (-8.1)
Sikkim 37.4 41.30 53.50 67.40 45.40
(3.00) (10.40) (29.60) (25.90) (-32.6)
T.N. 1306.70 1434.80 1634.30 2071.00 2291.50
(8.50) (9.80) (13.90) (26.70) (10.60)
Tripura 60.10 89.80 121.00 211.30 249.50
(5.10) (49.40) (34.70) (74.70) (18.10)
U.P. 3260.00 4197.70 5687.10 8362.20 7802.40
(14.20) (28.80) (35.50) (47.00) (-6.7)
W.B. 2489.10 3607.00 5402.80 6130.90 7589.00
(19.10) (44.90) (49.80) (13.50) (23.80)
NCTDelhi 851.2. 1026.50 975.60 1300.80 1235.00
(24.20) (20.60) (-5.0) (33.30) (-5.1)
All States 23781.70 30770.90 40342.00 49526.70 51892.60
(11.70) (29.40) (31.10) (22.80) (4.80)
Note: (1) Figures in brackets represents percentage variation over previous year
(2) NA denotes Not AvailableSource: Reserve Bank of India, Finances of the State Government various years' issues.
Years
TABLE AS - 8 ALL STATESGROSS LOANS FROM CENTRE
- S-18 -
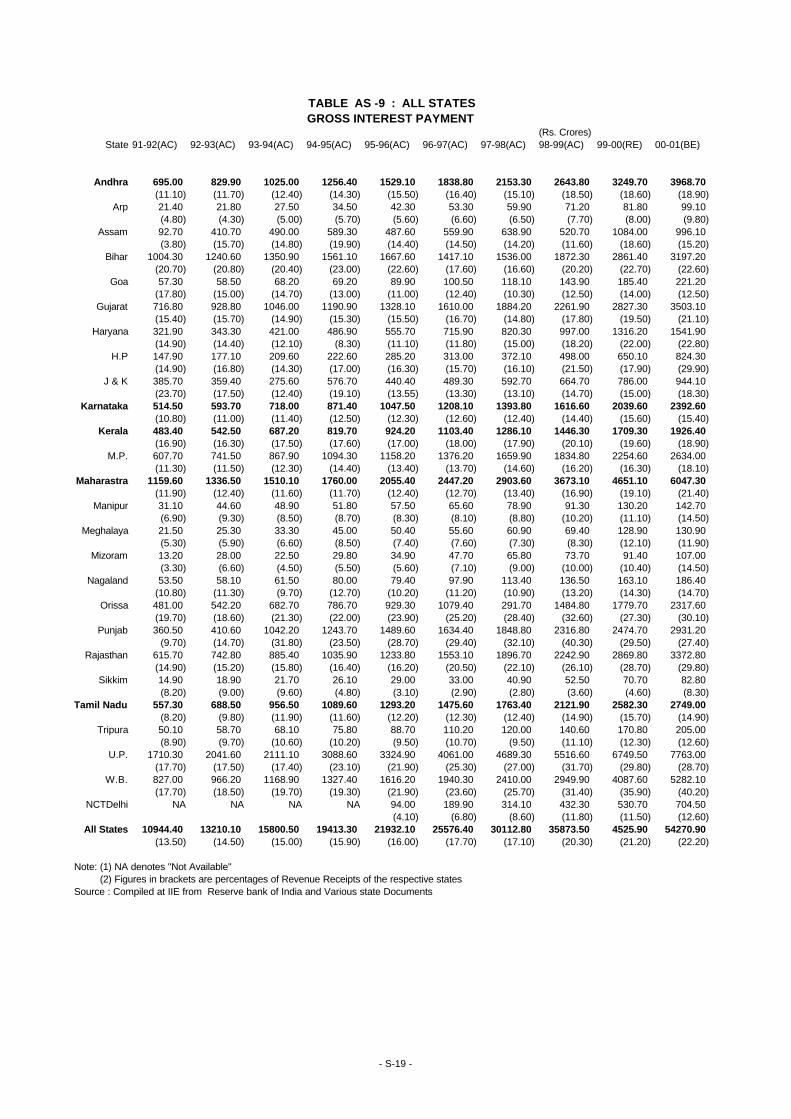
(Rs. Crores)State 91-92(AC) 92-93(AC) 93-94(AC) 94-95(AC) 95-96(AC) 96-97(AC) 97-98(AC) 98-99(AC) 99-00(RE) 00-01(BE)
Andhra 695.00 829.90 1025.00 1256.40 1529.10 1838.80 2153.30 2643.80 3249.70 3968.70(11.10) (11.70) (12.40) (14.30) (15.50) (16.40) (15.10) (18.50) (18.60) (18.90)
Arp 21.40 21.80 27.50 34.50 42.30 53.30 59.90 71.20 81.80 99.10(4.80) (4.30) (5.00) (5.70) (5.60) (6.60) (6.50) (7.70) (8.00) (9.80)
Assam 92.70 410.70 490.00 589.30 487.60 559.90 638.90 520.70 1084.00 996.10(3.80) (15.70) (14.80) (19.90) (14.40) (14.50) (14.20) (11.60) (18.60) (15.20)
Bihar 1004.30 1240.60 1350.90 1561.10 1667.60 1417.10 1536.00 1872.30 2861.40 3197.20(20.70) (20.80) (20.40) (23.00) (22.60) (17.60) (16.60) (20.20) (22.70) (22.60)
Goa 57.30 58.50 68.20 69.20 89.90 100.50 118.10 143.90 185.40 221.20(17.80) (15.00) (14.70) (13.00) (11.00) (12.40) (10.30) (12.50) (14.00) (12.50)
Gujarat 716.80 928.80 1046.00 1190.90 1328.10 1610.00 1884.20 2261.90 2827.30 3503.10(15.40) (15.70) (14.90) (15.30) (15.50) (16.70) (14.80) (17.80) (19.50) (21.10)
Haryana 321.90 343.30 421.00 486.90 555.70 715.90 820.30 997.00 1316.20 1541.90(14.90) (14.40) (12.10) (8.30) (11.10) (11.80) (15.00) (18.20) (22.00) (22.80)
H.P 147.90 177.10 209.60 222.60 285.20 313.00 372.10 498.00 650.10 824.30(14.90) (16.80) (14.30) (17.00) (16.30) (15.70) (16.10) (21.50) (17.90) (29.90)
J & K 385.70 359.40 275.60 576.70 440.40 489.30 592.70 664.70 786.00 944.10(23.70) (17.50) (12.40) (19.10) (13.55) (13.30) (13.10) (14.70) (15.00) (18.30)
Karnataka 514.50 593.70 718.00 871.40 1047.50 1208.10 1393.80 1616.60 2039.60 2392.60(10.80) (11.00) (11.40) (12.50) (12.30) (12.60) (12.40) (14.40) (15.60) (15.40)
Kerala 483.40 542.50 687.20 819.70 924.20 1103.40 1286.10 1446.30 1709.30 1926.40(16.90) (16.30) (17.50) (17.60) (17.00) (18.00) (17.90) (20.10) (19.60) (18.90)
M.P. 607.70 741.50 867.90 1094.30 1158.20 1376.20 1659.90 1834.80 2254.60 2634.00(11.30) (11.50) (12.30) (14.40) (13.40) (13.70) (14.60) (16.20) (16.30) (18.10)
Maharastra 1159.60 1336.50 1510.10 1760.00 2055.40 2447.20 2903.60 3673.10 4651.10 6047.30(11.90) (12.40) (11.60) (11.70) (12.40) (12.70) (13.40) (16.90) (19.10) (21.40)
Manipur 31.10 44.60 48.90 51.80 57.50 65.60 78.90 91.30 130.20 142.70(6.90) (9.30) (8.50) (8.70) (8.30) (8.10) (8.80) (10.20) (11.10) (14.50)
Meghalaya 21.50 25.30 33.30 45.00 50.40 55.60 60.90 69.40 128.90 130.90(5.30) (5.90) (6.60) (8.50) (7.40) (7.60) (7.30) (8.30) (12.10) (11.90)
Mizoram 13.20 28.00 22.50 29.80 34.90 47.70 65.80 73.70 91.40 107.00(3.30) (6.60) (4.50) (5.50) (5.60) (7.10) (9.00) (10.00) (10.40) (14.50)
Nagaland 53.50 58.10 61.50 80.00 79.40 97.90 113.40 136.50 163.10 186.40(10.80) (11.30) (9.70) (12.70) (10.20) (11.20) (10.90) (13.20) (14.30) (14.70)
Orissa 481.00 542.20 682.70 786.70 929.30 1079.40 291.70 1484.80 1779.70 2317.60(19.70) (18.60) (21.30) (22.00) (23.90) (25.20) (28.40) (32.60) (27.30) (30.10)
Punjab 360.50 410.60 1042.20 1243.70 1489.60 1634.40 1848.80 2316.80 2474.70 2931.20(9.70) (14.70) (31.80) (23.50) (28.70) (29.40) (32.10) (40.30) (29.50) (27.40)
Rajasthan 615.70 742.80 885.40 1035.90 1233.80 1553.10 1896.70 2242.90 2869.80 3372.80(14.90) (15.20) (15.80) (16.40) (16.20) (20.50) (22.10) (26.10) (28.70) (29.80)
Sikkim 14.90 18.90 21.70 26.10 29.00 33.00 40.90 52.50 70.70 82.80(8.20) (9.00) (9.60) (4.80) (3.10) (2.90) (2.80) (3.60) (4.60) (8.30)
Tamil Nadu 557.30 688.50 956.50 1089.60 1293.20 1475.60 1763.40 2121.90 2582.30 2749.00(8.20) (9.80) (11.90) (11.60) (12.20) (12.30) (12.40) (14.90) (15.70) (14.90)
Tripura 50.10 58.70 68.10 75.80 88.70 110.20 120.00 140.60 170.80 205.00(8.90) (9.70) (10.60) (10.20) (9.50) (10.70) (9.50) (11.10) (12.30) (12.60)
U.P. 1710.30 2041.60 2111.10 3088.60 3324.90 4061.00 4689.30 5516.60 6749.50 7763.00(17.70) (17.50) (17.40) (23.10) (21.90) (25.30) (27.00) (31.70) (29.80) (28.70)
W.B. 827.00 966.20 1168.90 1327.40 1616.20 1940.30 2410.00 2949.90 4087.60 5282.10(17.70) (18.50) (19.70) (19.30) (21.90) (23.60) (25.70) (31.40) (35.90) (40.20)
NCTDelhi NA NA NA NA 94.00 189.90 314.10 432.30 530.70 704.50(4.10) (6.80) (8.60) (11.80) (11.50) (12.60)
All States 10944.40 13210.10 15800.50 19413.30 21932.10 25576.40 30112.80 35873.50 4525.90 54270.90(13.50) (14.50) (15.00) (15.90) (16.00) (17.70) (17.10) (20.30) (21.20) (22.20)
Note: (1) NA denotes "Not Available" (2) Figures in brackets are percentages of Revenue Receipts of the respective statesSource : Compiled at IIE from Reserve bank of India and Various state Documents
GROSS INTEREST PAYMENT TABLE AS -9 : ALL STATES
- S-19 -
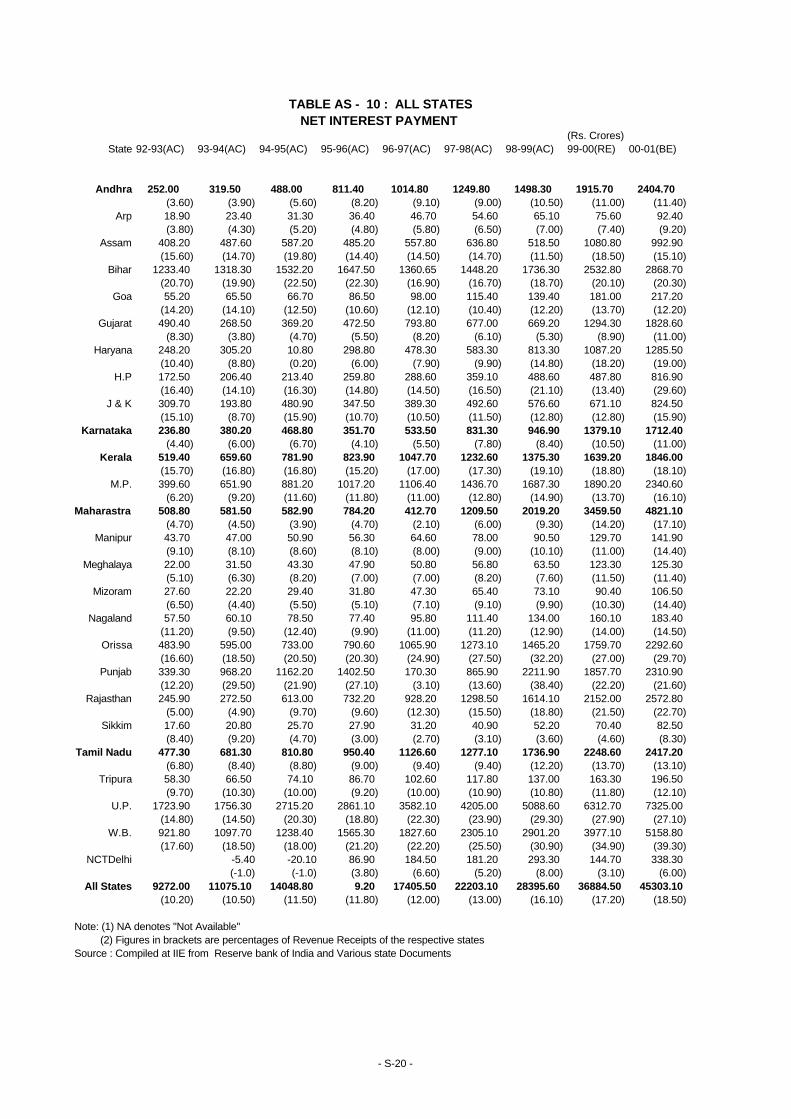
(Rs. Crores)State 92-93(AC) 93-94(AC) 94-95(AC) 95-96(AC) 96-97(AC) 97-98(AC) 98-99(AC) 99-00(RE) 00-01(BE)
Andhra 252.00 319.50 488.00 811.40 1014.80 1249.80 1498.30 1915.70 2404.70(3.60) (3.90) (5.60) (8.20) (9.10) (9.00) (10.50) (11.00) (11.40)
Arp 18.90 23.40 31.30 36.40 46.70 54.60 65.10 75.60 92.40(3.80) (4.30) (5.20) (4.80) (5.80) (6.50) (7.00) (7.40) (9.20)
Assam 408.20 487.60 587.20 485.20 557.80 636.80 518.50 1080.80 992.90(15.60) (14.70) (19.80) (14.40) (14.50) (14.70) (11.50) (18.50) (15.10)
Bihar 1233.40 1318.30 1532.20 1647.50 1360.65 1448.20 1736.30 2532.80 2868.70(20.70) (19.90) (22.50) (22.30) (16.90) (16.70) (18.70) (20.10) (20.30)
Goa 55.20 65.50 66.70 86.50 98.00 115.40 139.40 181.00 217.20(14.20) (14.10) (12.50) (10.60) (12.10) (10.40) (12.20) (13.70) (12.20)
Gujarat 490.40 268.50 369.20 472.50 793.80 677.00 669.20 1294.30 1828.60(8.30) (3.80) (4.70) (5.50) (8.20) (6.10) (5.30) (8.90) (11.00)
Haryana 248.20 305.20 10.80 298.80 478.30 583.30 813.30 1087.20 1285.50(10.40) (8.80) (0.20) (6.00) (7.90) (9.90) (14.80) (18.20) (19.00)
H.P 172.50 206.40 213.40 259.80 288.60 359.10 488.60 487.80 816.90(16.40) (14.10) (16.30) (14.80) (14.50) (16.50) (21.10) (13.40) (29.60)
J & K 309.70 193.80 480.90 347.50 389.30 492.60 576.60 671.10 824.50(15.10) (8.70) (15.90) (10.70) (10.50) (11.50) (12.80) (12.80) (15.90)
Karnataka 236.80 380.20 468.80 351.70 533.50 831.30 946.90 1379.10 1712.40(4.40) (6.00) (6.70) (4.10) (5.50) (7.80) (8.40) (10.50) (11.00)
Kerala 519.40 659.60 781.90 823.90 1047.70 1232.60 1375.30 1639.20 1846.00(15.70) (16.80) (16.80) (15.20) (17.00) (17.30) (19.10) (18.80) (18.10)
M.P. 399.60 651.90 881.20 1017.20 1106.40 1436.70 1687.30 1890.20 2340.60(6.20) (9.20) (11.60) (11.80) (11.00) (12.80) (14.90) (13.70) (16.10)
Maharastra 508.80 581.50 582.90 784.20 412.70 1209.50 2019.20 3459.50 4821.10(4.70) (4.50) (3.90) (4.70) (2.10) (6.00) (9.30) (14.20) (17.10)
Manipur 43.70 47.00 50.90 56.30 64.60 78.00 90.50 129.70 141.90(9.10) (8.10) (8.60) (8.10) (8.00) (9.00) (10.10) (11.00) (14.40)
Meghalaya 22.00 31.50 43.30 47.90 50.80 56.80 63.50 123.30 125.30(5.10) (6.30) (8.20) (7.00) (7.00) (8.20) (7.60) (11.50) (11.40)
Mizoram 27.60 22.20 29.40 31.80 47.30 65.40 73.10 90.40 106.50(6.50) (4.40) (5.50) (5.10) (7.10) (9.10) (9.90) (10.30) (14.40)
Nagaland 57.50 60.10 78.50 77.40 95.80 111.40 134.00 160.10 183.40(11.20) (9.50) (12.40) (9.90) (11.00) (11.20) (12.90) (14.00) (14.50)
Orissa 483.90 595.00 733.00 790.60 1065.90 1273.10 1465.20 1759.70 2292.60(16.60) (18.50) (20.50) (20.30) (24.90) (27.50) (32.20) (27.00) (29.70)
Punjab 339.30 968.20 1162.20 1402.50 170.30 865.90 2211.90 1857.70 2310.90(12.20) (29.50) (21.90) (27.10) (3.10) (13.60) (38.40) (22.20) (21.60)
Rajasthan 245.90 272.50 613.00 732.20 928.20 1298.50 1614.10 2152.00 2572.80(5.00) (4.90) (9.70) (9.60) (12.30) (15.50) (18.80) (21.50) (22.70)
Sikkim 17.60 20.80 25.70 27.90 31.20 40.90 52.20 70.40 82.50(8.40) (9.20) (4.70) (3.00) (2.70) (3.10) (3.60) (4.60) (8.30)
Tamil Nadu 477.30 681.30 810.80 950.40 1126.60 1277.10 1736.90 2248.60 2417.20(6.80) (8.40) (8.80) (9.00) (9.40) (9.40) (12.20) (13.70) (13.10)
Tripura 58.30 66.50 74.10 86.70 102.60 117.80 137.00 163.30 196.50(9.70) (10.30) (10.00) (9.20) (10.00) (10.90) (10.80) (11.80) (12.10)
U.P. 1723.90 1756.30 2715.20 2861.10 3582.10 4205.00 5088.60 6312.70 7325.00(14.80) (14.50) (20.30) (18.80) (22.30) (23.90) (29.30) (27.90) (27.10)
W.B. 921.80 1097.70 1238.40 1565.30 1827.60 2305.10 2901.20 3977.10 5158.80(17.60) (18.50) (18.00) (21.20) (22.20) (25.50) (30.90) (34.90) (39.30)
NCTDelhi -5.40 -20.10 86.90 184.50 181.20 293.30 144.70 338.30(-1.0) (-1.0) (3.80) (6.60) (5.20) (8.00) (3.10) (6.00)
All States 9272.00 11075.10 14048.80 9.20 17405.50 22203.10 28395.60 36884.50 45303.10(10.20) (10.50) (11.50) (11.80) (12.00) (13.00) (16.10) (17.20) (18.50)
Note: (1) NA denotes "Not Available" (2) Figures in brackets are percentages of Revenue Receipts of the respective statesSource : Compiled at IIE from Reserve bank of India and Various state Documents
TABLE AS - 10 : ALL STATESNET INTEREST PAYMENT
- S-20 -
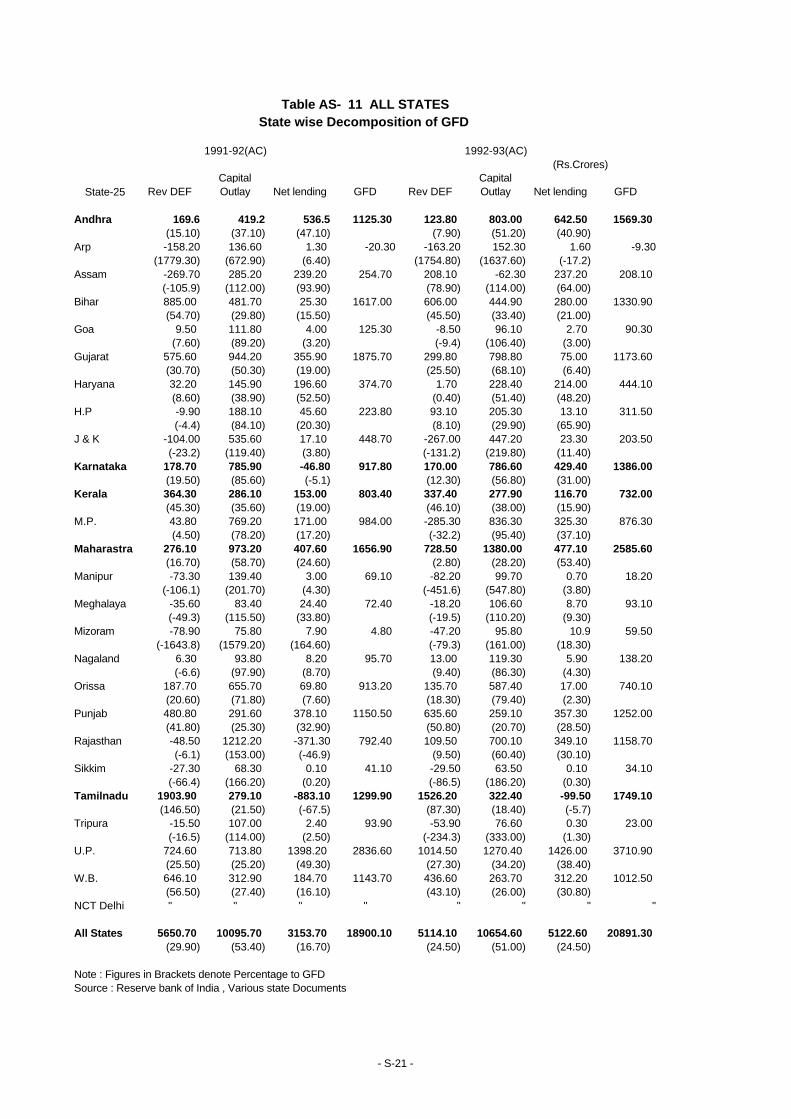
1991-92(AC) 1992-93(AC) (Rs.Crores)
State-25 Rev DEFCapital Outlay Net lending GFD Rev DEF
Capital Outlay Net lending GFD
Andhra 169.6 419.2 536.5 1125.30 123.80 803.00 642.50 1569.30(15.10) (37.10) (47.10) (7.90) (51.20) (40.90)
Arp -158.20 136.60 1.30 -20.30 -163.20 152.30 1.60 -9.30(1779.30) (672.90) (6.40) (1754.80) (1637.60) (-17.2)
Assam -269.70 285.20 239.20 254.70 208.10 -62.30 237.20 208.10(-105.9) (112.00) (93.90) (78.90) (114.00) (64.00)
Bihar 885.00 481.70 25.30 1617.00 606.00 444.90 280.00 1330.90(54.70) (29.80) (15.50) (45.50) (33.40) (21.00)
Goa 9.50 111.80 4.00 125.30 -8.50 96.10 2.70 90.30(7.60) (89.20) (3.20) (-9.4) (106.40) (3.00)
Gujarat 575.60 944.20 355.90 1875.70 299.80 798.80 75.00 1173.60(30.70) (50.30) (19.00) (25.50) (68.10) (6.40)
Haryana 32.20 145.90 196.60 374.70 1.70 228.40 214.00 444.10(8.60) (38.90) (52.50) (0.40) (51.40) (48.20)
H.P -9.90 188.10 45.60 223.80 93.10 205.30 13.10 311.50(-4.4) (84.10) (20.30) (8.10) (29.90) (65.90)
J & K -104.00 535.60 17.10 448.70 -267.00 447.20 23.30 203.50(-23.2) (119.40) (3.80) (-131.2) (219.80) (11.40)
Karnataka 178.70 785.90 -46.80 917.80 170.00 786.60 429.40 1386.00(19.50) (85.60) (-5.1) (12.30) (56.80) (31.00)
Kerala 364.30 286.10 153.00 803.40 337.40 277.90 116.70 732.00(45.30) (35.60) (19.00) (46.10) (38.00) (15.90)
M.P. 43.80 769.20 171.00 984.00 -285.30 836.30 325.30 876.30(4.50) (78.20) (17.20) (-32.2) (95.40) (37.10)
Maharastra 276.10 973.20 407.60 1656.90 728.50 1380.00 477.10 2585.60(16.70) (58.70) (24.60) (2.80) (28.20) (53.40)
Manipur -73.30 139.40 3.00 69.10 -82.20 99.70 0.70 18.20(-106.1) (201.70) (4.30) (-451.6) (547.80) (3.80)
Meghalaya -35.60 83.40 24.40 72.40 -18.20 106.60 8.70 93.10(-49.3) (115.50) (33.80) (-19.5) (110.20) (9.30)
Mizoram -78.90 75.80 7.90 4.80 -47.20 95.80 10.9 59.50(-1643.8) (1579.20) (164.60) (-79.3) (161.00) (18.30)
Nagaland 6.30 93.80 8.20 95.70 13.00 119.30 5.90 138.20(-6.6) (97.90) (8.70) (9.40) (86.30) (4.30)
Orissa 187.70 655.70 69.80 913.20 135.70 587.40 17.00 740.10(20.60) (71.80) (7.60) (18.30) (79.40) (2.30)
Punjab 480.80 291.60 378.10 1150.50 635.60 259.10 357.30 1252.00(41.80) (25.30) (32.90) (50.80) (20.70) (28.50)
Rajasthan -48.50 1212.20 -371.30 792.40 109.50 700.10 349.10 1158.70(-6.1) (153.00) (-46.9) (9.50) (60.40) (30.10)
Sikkim -27.30 68.30 0.10 41.10 -29.50 63.50 0.10 34.10(-66.4) (166.20) (0.20) (-86.5) (186.20) (0.30)
Tamilnadu 1903.90 279.10 -883.10 1299.90 1526.20 322.40 -99.50 1749.10(146.50) (21.50) (-67.5) (87.30) (18.40) (-5.7)
Tripura -15.50 107.00 2.40 93.90 -53.90 76.60 0.30 23.00(-16.5) (114.00) (2.50) (-234.3) (333.00) (1.30)
U.P. 724.60 713.80 1398.20 2836.60 1014.50 1270.40 1426.00 3710.90(25.50) (25.20) (49.30) (27.30) (34.20) (38.40)
W.B. 646.10 312.90 184.70 1143.70 436.60 263.70 312.20 1012.50(56.50) (27.40) (16.10) (43.10) (26.00) (30.80)
NCT Delhi " " " " " " " "
All States 5650.70 10095.70 3153.70 18900.10 5114.10 10654.60 5122.60 20891.30(29.90) (53.40) (16.70) (24.50) (51.00) (24.50)
Note : Figures in Brackets denote Percentage to GFDSource : Reserve bank of India , Various state Documents
Table AS- 11 ALL STATESState wise Decomposition of GFD
- S-21 -
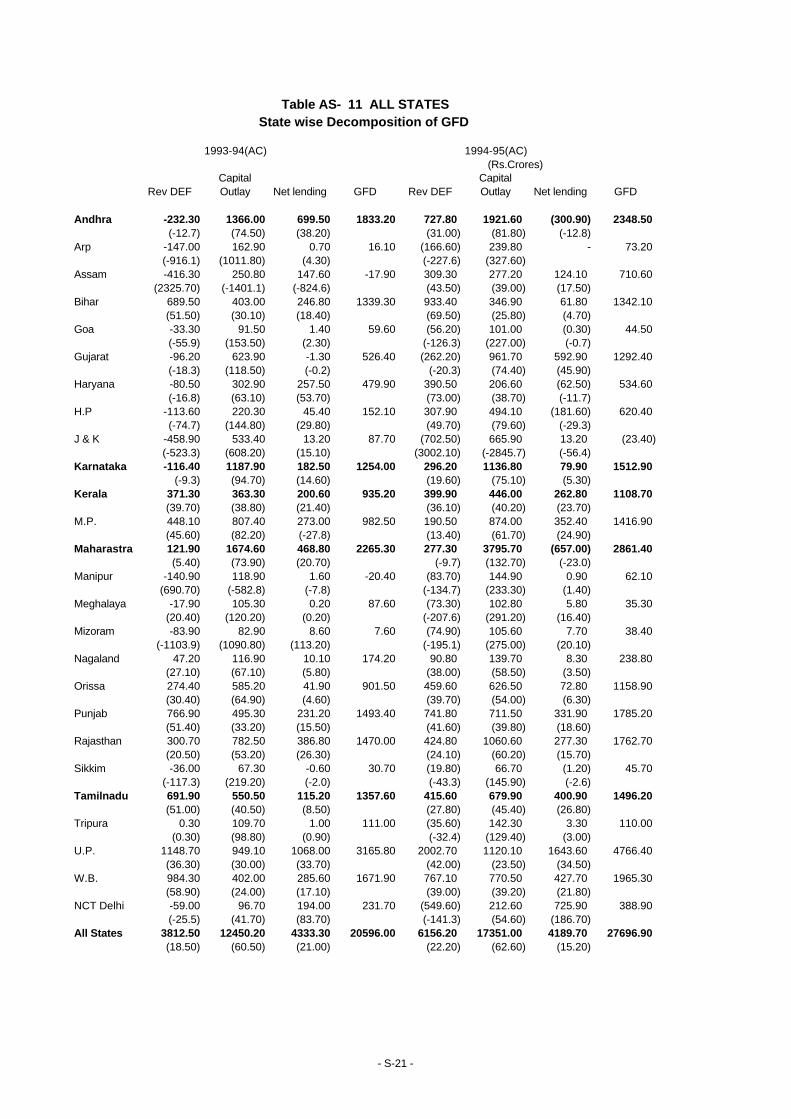
1993-94(AC) 1994-95(AC) (Rs.Crores)
Rev DEFCapital Outlay Net lending GFD Rev DEF
Capital Outlay Net lending GFD
Andhra -232.30 1366.00 699.50 1833.20 727.80 1921.60 (300.90) 2348.50(-12.7) (74.50) (38.20) (31.00) (81.80) (-12.8)
Arp -147.00 162.90 0.70 16.10 (166.60) 239.80 - 73.20(-916.1) (1011.80) (4.30) (-227.6) (327.60)
Assam -416.30 250.80 147.60 -17.90 309.30 277.20 124.10 710.60(2325.70) (-1401.1) (-824.6) (43.50) (39.00) (17.50)
Bihar 689.50 403.00 246.80 1339.30 933.40 346.90 61.80 1342.10(51.50) (30.10) (18.40) (69.50) (25.80) (4.70)
Goa -33.30 91.50 1.40 59.60 (56.20) 101.00 (0.30) 44.50(-55.9) (153.50) (2.30) (-126.3) (227.00) (-0.7)
Gujarat -96.20 623.90 -1.30 526.40 (262.20) 961.70 592.90 1292.40(-18.3) (118.50) (-0.2) (-20.3) (74.40) (45.90)
Haryana -80.50 302.90 257.50 479.90 390.50 206.60 (62.50) 534.60(-16.8) (63.10) (53.70) (73.00) (38.70) (-11.7)
H.P -113.60 220.30 45.40 152.10 307.90 494.10 (181.60) 620.40(-74.7) (144.80) (29.80) (49.70) (79.60) (-29.3)
J & K -458.90 533.40 13.20 87.70 (702.50) 665.90 13.20 (23.40)(-523.3) (608.20) (15.10) (3002.10) (-2845.7) (-56.4)
Karnataka -116.40 1187.90 182.50 1254.00 296.20 1136.80 79.90 1512.90(-9.3) (94.70) (14.60) (19.60) (75.10) (5.30)
Kerala 371.30 363.30 200.60 935.20 399.90 446.00 262.80 1108.70(39.70) (38.80) (21.40) (36.10) (40.20) (23.70)
M.P. 448.10 807.40 273.00 982.50 190.50 874.00 352.40 1416.90(45.60) (82.20) (-27.8) (13.40) (61.70) (24.90)
Maharastra 121.90 1674.60 468.80 2265.30 277.30 3795.70 (657.00) 2861.40(5.40) (73.90) (20.70) (-9.7) (132.70) (-23.0)
Manipur -140.90 118.90 1.60 -20.40 (83.70) 144.90 0.90 62.10(690.70) (-582.8) (-7.8) (-134.7) (233.30) (1.40)
Meghalaya -17.90 105.30 0.20 87.60 (73.30) 102.80 5.80 35.30(20.40) (120.20) (0.20) (-207.6) (291.20) (16.40)
Mizoram -83.90 82.90 8.60 7.60 (74.90) 105.60 7.70 38.40(-1103.9) (1090.80) (113.20) (-195.1) (275.00) (20.10)
Nagaland 47.20 116.90 10.10 174.20 90.80 139.70 8.30 238.80(27.10) (67.10) (5.80) (38.00) (58.50) (3.50)
Orissa 274.40 585.20 41.90 901.50 459.60 626.50 72.80 1158.90(30.40) (64.90) (4.60) (39.70) (54.00) (6.30)
Punjab 766.90 495.30 231.20 1493.40 741.80 711.50 331.90 1785.20(51.40) (33.20) (15.50) (41.60) (39.80) (18.60)
Rajasthan 300.70 782.50 386.80 1470.00 424.80 1060.60 277.30 1762.70(20.50) (53.20) (26.30) (24.10) (60.20) (15.70)
Sikkim -36.00 67.30 -0.60 30.70 (19.80) 66.70 (1.20) 45.70(-117.3) (219.20) (-2.0) (-43.3) (145.90) (-2.6)
Tamilnadu 691.90 550.50 115.20 1357.60 415.60 679.90 400.90 1496.20(51.00) (40.50) (8.50) (27.80) (45.40) (26.80)
Tripura 0.30 109.70 1.00 111.00 (35.60) 142.30 3.30 110.00(0.30) (98.80) (0.90) (-32.4) (129.40) (3.00)
U.P. 1148.70 949.10 1068.00 3165.80 2002.70 1120.10 1643.60 4766.40(36.30) (30.00) (33.70) (42.00) (23.50) (34.50)
W.B. 984.30 402.00 285.60 1671.90 767.10 770.50 427.70 1965.30(58.90) (24.00) (17.10) (39.00) (39.20) (21.80)
NCT Delhi -59.00 96.70 194.00 231.70 (549.60) 212.60 725.90 388.90(-25.5) (41.70) (83.70) (-141.3) (54.60) (186.70)
All States 3812.50 12450.20 4333.30 20596.00 6156.20 17351.00 4189.70 27696.90(18.50) (60.50) (21.00) (22.20) (62.60) (15.20)
Table AS- 11 ALL STATESState wise Decomposition of GFD
- S-21 -
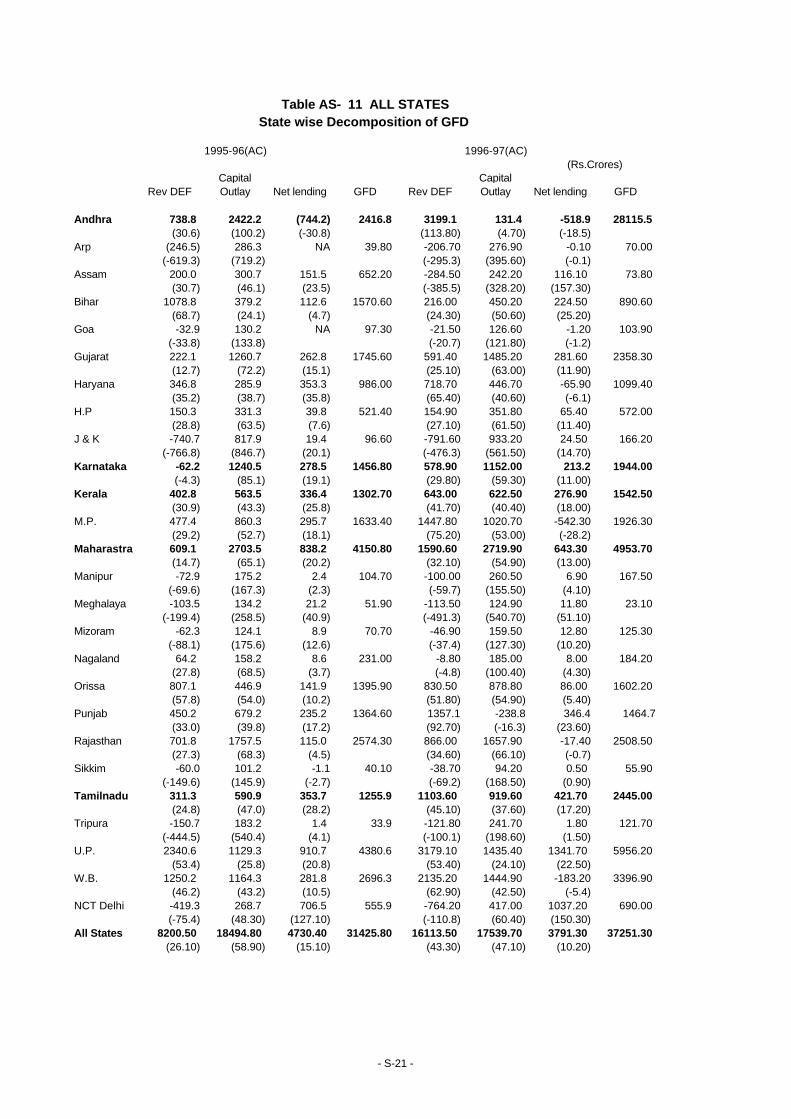
1995-96(AC) 1996-97(AC) (Rs.Crores)
Rev DEFCapital Outlay Net lending GFD Rev DEF
Capital Outlay Net lending GFD
Andhra 738.8 2422.2 (744.2) 2416.8 3199.1 131.4 -518.9 28115.5(30.6) (100.2) (-30.8) (113.80) (4.70) (-18.5)
Arp (246.5) 286.3 NA 39.80 -206.70 276.90 -0.10 70.00(-619.3) (719.2) (-295.3) (395.60) (-0.1)
Assam 200.0 300.7 151.5 652.20 -284.50 242.20 116.10 73.80(30.7) (46.1) (23.5) (-385.5) (328.20) (157.30)
Bihar 1078.8 379.2 112.6 1570.60 216.00 450.20 224.50 890.60(68.7) (24.1) (4.7) (24.30) (50.60) (25.20)
Goa -32.9 130.2 NA 97.30 -21.50 126.60 -1.20 103.90(-33.8) (133.8) (-20.7) (121.80) (-1.2)
Gujarat 222.1 1260.7 262.8 1745.60 591.40 1485.20 281.60 2358.30(12.7) (72.2) (15.1) (25.10) (63.00) (11.90)
Haryana 346.8 285.9 353.3 986.00 718.70 446.70 -65.90 1099.40(35.2) (38.7) (35.8) (65.40) (40.60) (-6.1)
H.P 150.3 331.3 39.8 521.40 154.90 351.80 65.40 572.00(28.8) (63.5) (7.6) (27.10) (61.50) (11.40)
J & K -740.7 817.9 19.4 96.60 -791.60 933.20 24.50 166.20(-766.8) (846.7) (20.1) (-476.3) (561.50) (14.70)
Karnataka -62.2 1240.5 278.5 1456.80 578.90 1152.00 213.2 1944.00(-4.3) (85.1) (19.1) (29.80) (59.30) (11.00)
Kerala 402.8 563.5 336.4 1302.70 643.00 622.50 276.90 1542.50(30.9) (43.3) (25.8) (41.70) (40.40) (18.00)
M.P. 477.4 860.3 295.7 1633.40 1447.80 1020.70 -542.30 1926.30(29.2) (52.7) (18.1) (75.20) (53.00) (-28.2)
Maharastra 609.1 2703.5 838.2 4150.80 1590.60 2719.90 643.30 4953.70(14.7) (65.1) (20.2) (32.10) (54.90) (13.00)
Manipur -72.9 175.2 2.4 104.70 -100.00 260.50 6.90 167.50(-69.6) (167.3) (2.3) (-59.7) (155.50) (4.10)
Meghalaya -103.5 134.2 21.2 51.90 -113.50 124.90 11.80 23.10(-199.4) (258.5) (40.9) (-491.3) (540.70) (51.10)
Mizoram -62.3 124.1 8.9 70.70 -46.90 159.50 12.80 125.30(-88.1) (175.6) (12.6) (-37.4) (127.30) (10.20)
Nagaland 64.2 158.2 8.6 231.00 -8.80 185.00 8.00 184.20(27.8) (68.5) (3.7) (-4.8) (100.40) (4.30)
Orissa 807.1 446.9 141.9 1395.90 830.50 878.80 86.00 1602.20(57.8) (54.0) (10.2) (51.80) (54.90) (5.40)
Punjab 450.2 679.2 235.2 1364.60 1357.1 -238.8 346.4 1464.7(33.0) (39.8) (17.2) (92.70) (-16.3) (23.60)
Rajasthan 701.8 1757.5 115.0 2574.30 866.00 1657.90 -17.40 2508.50(27.3) (68.3) (4.5) (34.60) (66.10) (-0.7)
Sikkim -60.0 101.2 -1.1 40.10 -38.70 94.20 0.50 55.90(-149.6) (145.9) (-2.7) (-69.2) (168.50) (0.90)
Tamilnadu 311.3 590.9 353.7 1255.9 1103.60 919.60 421.70 2445.00(24.8) (47.0) (28.2) (45.10) (37.60) (17.20)
Tripura -150.7 183.2 1.4 33.9 -121.80 241.70 1.80 121.70(-444.5) (540.4) (4.1) (-100.1) (198.60) (1.50)
U.P. 2340.6 1129.3 910.7 4380.6 3179.10 1435.40 1341.70 5956.20(53.4) (25.8) (20.8) (53.40) (24.10) (22.50)
W.B. 1250.2 1164.3 281.8 2696.3 2135.20 1444.90 -183.20 3396.90(46.2) (43.2) (10.5) (62.90) (42.50) (-5.4)
NCT Delhi -419.3 268.7 706.5 555.9 -764.20 417.00 1037.20 690.00(-75.4) (48.30) (127.10) (-110.8) (60.40) (150.30)
All States 8200.50 18494.80 4730.40 31425.80 16113.50 17539.70 3791.30 37251.30(26.10) (58.90) (15.10) (43.30) (47.10) (10.20)
Table AS- 11 ALL STATESState wise Decomposition of GFD
- S-21 -
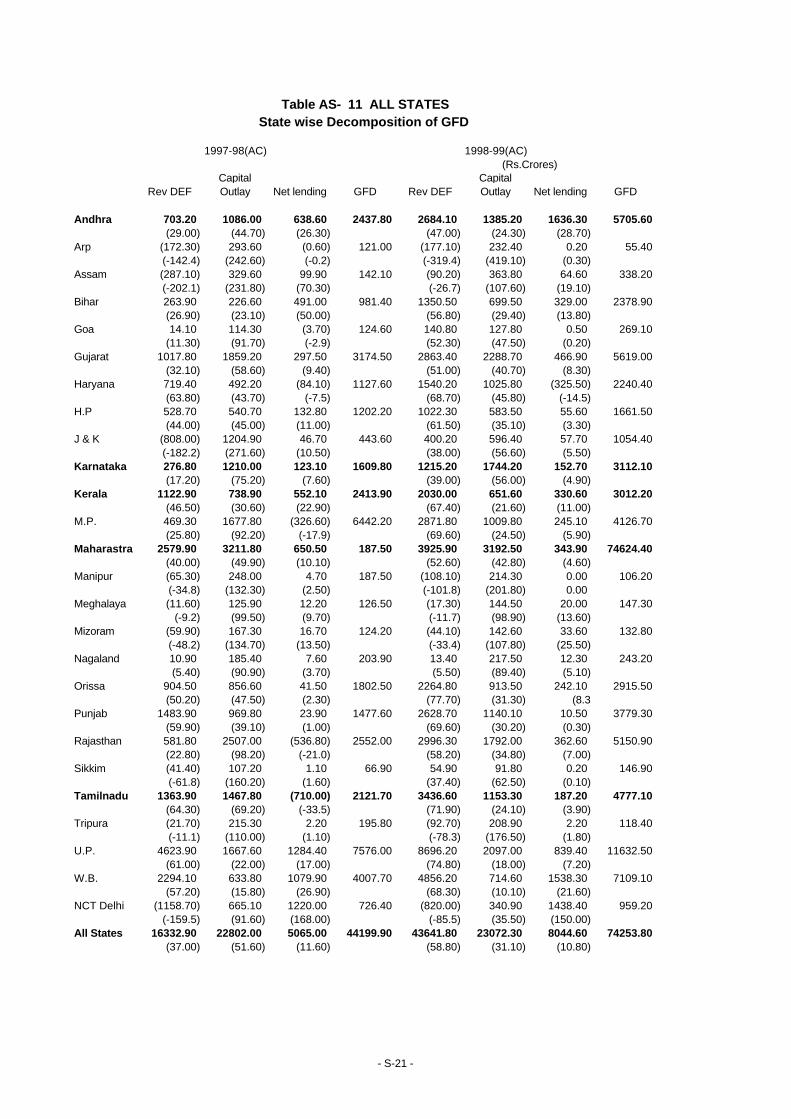
1997-98(AC) 1998-99(AC) (Rs.Crores)
Rev DEFCapital Outlay Net lending GFD Rev DEF
Capital Outlay Net lending GFD
Andhra 703.20 1086.00 638.60 2437.80 2684.10 1385.20 1636.30 5705.60(29.00) (44.70) (26.30) (47.00) (24.30) (28.70)
Arp (172.30) 293.60 (0.60) 121.00 (177.10) 232.40 0.20 55.40(-142.4) (242.60) (-0.2) (-319.4) (419.10) (0.30)
Assam (287.10) 329.60 99.90 142.10 (90.20) 363.80 64.60 338.20(-202.1) (231.80) (70.30) (-26.7) (107.60) (19.10)
Bihar 263.90 226.60 491.00 981.40 1350.50 699.50 329.00 2378.90(26.90) (23.10) (50.00) (56.80) (29.40) (13.80)
Goa 14.10 114.30 (3.70) 124.60 140.80 127.80 0.50 269.10(11.30) (91.70) (-2.9) (52.30) (47.50) (0.20)
Gujarat 1017.80 1859.20 297.50 3174.50 2863.40 2288.70 466.90 5619.00(32.10) (58.60) (9.40) (51.00) (40.70) (8.30)
Haryana 719.40 492.20 (84.10) 1127.60 1540.20 1025.80 (325.50) 2240.40(63.80) (43.70) (-7.5) (68.70) (45.80) (-14.5)
H.P 528.70 540.70 132.80 1202.20 1022.30 583.50 55.60 1661.50(44.00) (45.00) (11.00) (61.50) (35.10) (3.30)
J & K (808.00) 1204.90 46.70 443.60 400.20 596.40 57.70 1054.40(-182.2) (271.60) (10.50) (38.00) (56.60) (5.50)
Karnataka 276.80 1210.00 123.10 1609.80 1215.20 1744.20 152.70 3112.10(17.20) (75.20) (7.60) (39.00) (56.00) (4.90)
Kerala 1122.90 738.90 552.10 2413.90 2030.00 651.60 330.60 3012.20(46.50) (30.60) (22.90) (67.40) (21.60) (11.00)
M.P. 469.30 1677.80 (326.60) 6442.20 2871.80 1009.80 245.10 4126.70(25.80) (92.20) (-17.9) (69.60) (24.50) (5.90)
Maharastra 2579.90 3211.80 650.50 187.50 3925.90 3192.50 343.90 74624.40(40.00) (49.90) (10.10) (52.60) (42.80) (4.60)
Manipur (65.30) 248.00 4.70 187.50 (108.10) 214.30 0.00 106.20(-34.8) (132.30) (2.50) (-101.8) (201.80) 0.00
Meghalaya (11.60) 125.90 12.20 126.50 (17.30) 144.50 20.00 147.30(-9.2) (99.50) (9.70) (-11.7) (98.90) (13.60)
Mizoram (59.90) 167.30 16.70 124.20 (44.10) 142.60 33.60 132.80(-48.2) (134.70) (13.50) (-33.4) (107.80) (25.50)
Nagaland 10.90 185.40 7.60 203.90 13.40 217.50 12.30 243.20(5.40) (90.90) (3.70) (5.50) (89.40) (5.10)
Orissa 904.50 856.60 41.50 1802.50 2264.80 913.50 242.10 2915.50(50.20) (47.50) (2.30) (77.70) (31.30) (8.3
Punjab 1483.90 969.80 23.90 1477.60 2628.70 1140.10 10.50 3779.30(59.90) (39.10) (1.00) (69.60) (30.20) (0.30)
Rajasthan 581.80 2507.00 (536.80) 2552.00 2996.30 1792.00 362.60 5150.90(22.80) (98.20) (-21.0) (58.20) (34.80) (7.00)
Sikkim (41.40) 107.20 1.10 66.90 54.90 91.80 0.20 146.90(-61.8) (160.20) (1.60) (37.40) (62.50) (0.10)
Tamilnadu 1363.90 1467.80 (710.00) 2121.70 3436.60 1153.30 187.20 4777.10(64.30) (69.20) (-33.5) (71.90) (24.10) (3.90)
Tripura (21.70) 215.30 2.20 195.80 (92.70) 208.90 2.20 118.40(-11.1) (110.00) (1.10) (-78.3) (176.50) (1.80)
U.P. 4623.90 1667.60 1284.40 7576.00 8696.20 2097.00 839.40 11632.50(61.00) (22.00) (17.00) (74.80) (18.00) (7.20)
W.B. 2294.10 633.80 1079.90 4007.70 4856.20 714.60 1538.30 7109.10(57.20) (15.80) (26.90) (68.30) (10.10) (21.60)
NCT Delhi (1158.70) 665.10 1220.00 726.40 (820.00) 340.90 1438.40 959.20(-159.5) (91.60) (168.00) (-85.5) (35.50) (150.00)
All States 16332.90 22802.00 5065.00 44199.90 43641.80 23072.30 8044.60 74253.80(37.00) (51.60) (11.60) (58.80) (31.10) (10.80)
Table AS- 11 ALL STATESState wise Decomposition of GFD
- S-21 -

1999-2000(RE) 2000-2001(BE) (Rs.Crores)
Rev DEFCapital Outlay Net lending GFD Rev DEF
Capital Outlay Net lending GFD
Andhra 2724.60 2420.60 847.90 5993.10 3840.90 3417.70 1201.00 8459.60(45.50) (40.40) (14.10) (45.40) (40.40) (14.20)
Arp (151.30) 287.80 1.70 138.20 (153.10) 262.50 2.00 111.40(-109.4) (208.20) (1.30) (-137.5) (235.70) (1.80)
Assam 1366.30 693.50 253.80 2313.60 900.90 1824.00 (664.10) 2060.80(59.10) (30.00) (11.00) (43.70) (88.50) (-32.2)
Bihar 3549.70 1902.80 655.20 6107.70 2400.60 1990.30 789.80 5180.70(58.10) (31.20) (10.70) (46.30) (38.40) (15.20)
Goa 242.20 139.80 2.20 384.20 84.90 219.20 1.10 305.20(63.00) (36.40) (0.60) (27.80) (71.80) (0.40)
Gujarat 2759.20 2740.40 531.10 6030.80 2379.80 2814.90 510.10 5304.80(45.80) (45.40) (8.80) (44.90) (53.10) (9.60)
Haryana 1291.10 912.90 259.80 2463.70 1341.30 1196.10 328.20 2865.60(52.40) (37.10) (10.50) (46.80) (41.70) (11.50)
H.P 241.80 667.10 (471.60) 437.20 1299.40 666.10 15.00 1980.50(55.30) (152.60) (-107.9) (65.60) (33.60) (0.80)
J & K 118.40 1087.00 42.70 1248.10 661.60 1677.40 (2.20) 2336.70(9.50) (87.10) (3.40) (28.30) (71.80) (-0.1)
Karnataka 1573.20 1388.50 59.00 3020.70 1582.30 1974.50 254.90 3811.70(52.10) (46.00) (2.00) (41.50) (51.80) (6.70)
Kerala 2481.30 765.40 263.60 3510..3 1950.30 758.50 214.40 2923.20(70.70) (21.80) (7.50) (66.70) (25.90) (7.30)
M.P. 2615.40 1218.40 139.30 3973.20 2538.70 1094.60 223.40 3856.70(65.80) (30.70) (3.50) (65.80) (28.40) (5.80)
Maharastra 9484.00 3977.10 452.20 13913.30 3607.30 3071.30 351.20 7029.80(68.20) (28.60) (3.30) (51.30) (43.70) (5.00)
Manipur 261.10 374.90 6.00 642.00 124.50 274.00 8.30 406.90(40.70) (58.40) (0.90) (30.60) (67.30) (2.00)
Meghalaya 14.50 233.30 77.60 325.30 101.50 257.00 65.40 423.90(4.40) (71.70) (23.80) (23.90) (60.60) (15.40)
Mizoram 21.40 210.50 37.70 270.20 58.80 136.40 21.50 216.80(8.10) (77.90) (14.00) (27.10) (62.90) (9.90)
Nagaland 36.30 205.80 7.00 249.00 (10.60) 189.70 6.30 185.40(14.60) (82.60) (2.80) (-5.7) (102.30) (3.40)
Orissa 2176.50 864.10 220.20 3260.80 1934.20 1081.50 658.10 3673.80(66.70) (26.50) (6.80) (52.60) (29.40) (17.90)
Punjab 3104.40 1150.50 39.00 4293.80 2386.40 1218.20 69.70 3674.20(72.30) (26.80) (0.90) (64.90) (33.20) (1.90)
Rajasthan 3860.00 1666.10 246.50 5772.60 3240.70 1640.20 372.80 5253.60(66.90) (28.90) (4.30) (61.70) (31.20) (7.10)
Sikkim (0.30) 148.10 0.20 148.00 (48.00) 194.40 (0.10) 146.20(-0.2) (100.00) (0.10) (-32.9) (132.90) (-0.1)
Tamilnadu 3700.70 835.90 439.30 4975.00 3158.70 2006.00 117.90 5282.60(74.40) (16.80) (8.80) (59.80) (38.00) (2.20)
Tripura 137.80 304.80 4.40 447.00 273.20 417.70 4.50 695.40(30.80) (68.20) (1.00) (39.30) (60.10) (0.60)
U.P. 7923.00 2544.40 1788.90 12256.30 5885.20 4129.50 2343.30 12358.00(64.60) (20.80) (14.60) (47.60) (33.40) (19.00)
W.B. 8056.10 1248.00 1561.30 10865.40 7525.00 1402.20 1411.80 10338.90(74.10) (11.50) (14.40) (72.80) (13.60) (13.70)
NCT Delhi (786.30) 746.30 1738.20 1698.20 (1362.10) 1174.30 1397.70 1209.80(-46.3) (43.90) (102.40) (-112.6) (97.10) (115.50)
All States 56801.60 28733.80 9203.10 94738.50 45702.30 35088.20 9701.50 90092.00(60.00) (30.30) (9.70) (50.70) (38.90) (10.80)
Table AS- 11 ALL STATESState wise Decomposition of GFD
- S-21 -
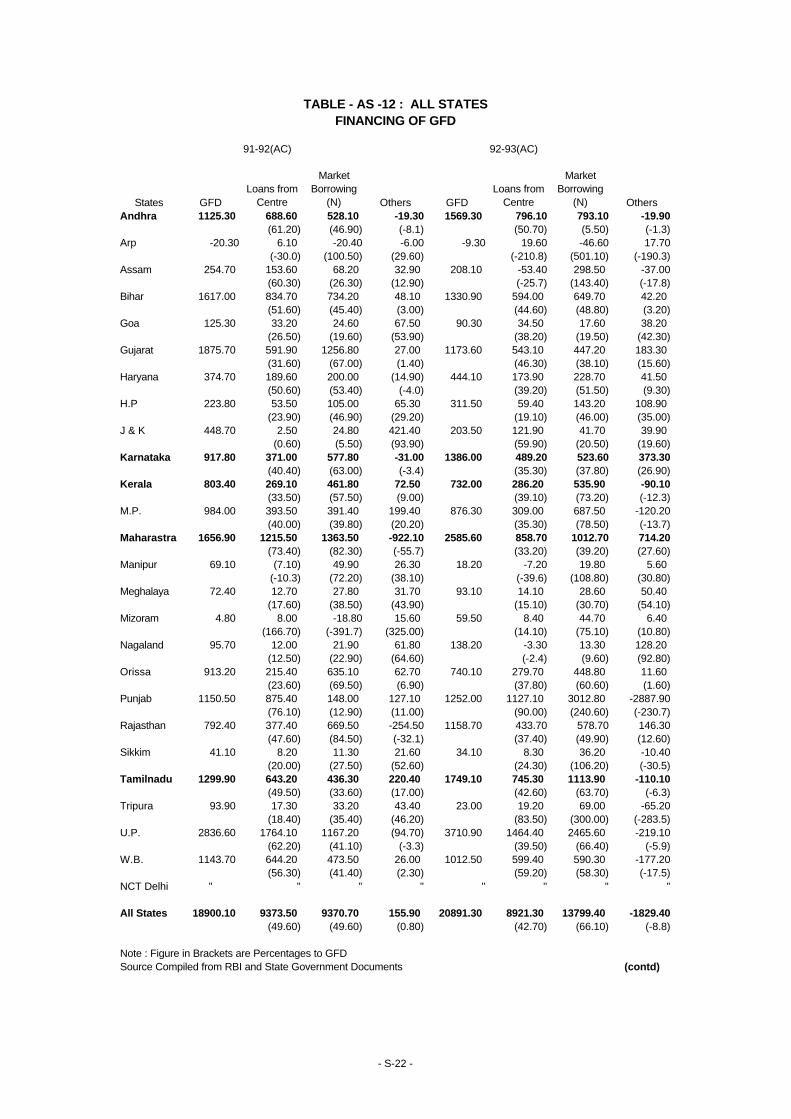
91-92(AC) 92-93(AC)
States GFDLoans from
Centre
Market Borrowing
(N) Others GFDLoans from
Centre
Market Borrowing
(N) OthersAndhra 1125.30 688.60 528.10 -19.30 1569.30 796.10 793.10 -19.90
(61.20) (46.90) (-8.1) (50.70) (5.50) (-1.3)Arp -20.30 6.10 -20.40 -6.00 -9.30 19.60 -46.60 17.70
(-30.0) (100.50) (29.60) (-210.8) (501.10) (-190.3)Assam 254.70 153.60 68.20 32.90 208.10 -53.40 298.50 -37.00
(60.30) (26.30) (12.90) (-25.7) (143.40) (-17.8)Bihar 1617.00 834.70 734.20 48.10 1330.90 594.00 649.70 42.20
(51.60) (45.40) (3.00) (44.60) (48.80) (3.20)Goa 125.30 33.20 24.60 67.50 90.30 34.50 17.60 38.20
(26.50) (19.60) (53.90) (38.20) (19.50) (42.30)Gujarat 1875.70 591.90 1256.80 27.00 1173.60 543.10 447.20 183.30
(31.60) (67.00) (1.40) (46.30) (38.10) (15.60)Haryana 374.70 189.60 200.00 (14.90) 444.10 173.90 228.70 41.50
(50.60) (53.40) (-4.0) (39.20) (51.50) (9.30)H.P 223.80 53.50 105.00 65.30 311.50 59.40 143.20 108.90
(23.90) (46.90) (29.20) (19.10) (46.00) (35.00)J & K 448.70 2.50 24.80 421.40 203.50 121.90 41.70 39.90
(0.60) (5.50) (93.90) (59.90) (20.50) (19.60)Karnataka 917.80 371.00 577.80 -31.00 1386.00 489.20 523.60 373.30
(40.40) (63.00) (-3.4) (35.30) (37.80) (26.90)Kerala 803.40 269.10 461.80 72.50 732.00 286.20 535.90 -90.10
(33.50) (57.50) (9.00) (39.10) (73.20) (-12.3)M.P. 984.00 393.50 391.40 199.40 876.30 309.00 687.50 -120.20
(40.00) (39.80) (20.20) (35.30) (78.50) (-13.7)Maharastra 1656.90 1215.50 1363.50 -922.10 2585.60 858.70 1012.70 714.20
(73.40) (82.30) (-55.7) (33.20) (39.20) (27.60)Manipur 69.10 (7.10) 49.90 26.30 18.20 -7.20 19.80 5.60
(-10.3) (72.20) (38.10) (-39.6) (108.80) (30.80)Meghalaya 72.40 12.70 27.80 31.70 93.10 14.10 28.60 50.40
(17.60) (38.50) (43.90) (15.10) (30.70) (54.10)Mizoram 4.80 8.00 -18.80 15.60 59.50 8.40 44.70 6.40
(166.70) (-391.7) (325.00) (14.10) (75.10) (10.80)Nagaland 95.70 12.00 21.90 61.80 138.20 -3.30 13.30 128.20
(12.50) (22.90) (64.60) (-2.4) (9.60) (92.80)Orissa 913.20 215.40 635.10 62.70 740.10 279.70 448.80 11.60
(23.60) (69.50) (6.90) (37.80) (60.60) (1.60)Punjab 1150.50 875.40 148.00 127.10 1252.00 1127.10 3012.80 -2887.90
(76.10) (12.90) (11.00) (90.00) (240.60) (-230.7)Rajasthan 792.40 377.40 669.50 -254.50 1158.70 433.70 578.70 146.30
(47.60) (84.50) (-32.1) (37.40) (49.90) (12.60)Sikkim 41.10 8.20 11.30 21.60 34.10 8.30 36.20 -10.40
(20.00) (27.50) (52.60) (24.30) (106.20) (-30.5)Tamilnadu 1299.90 643.20 436.30 220.40 1749.10 745.30 1113.90 -110.10
(49.50) (33.60) (17.00) (42.60) (63.70) (-6.3)Tripura 93.90 17.30 33.20 43.40 23.00 19.20 69.00 -65.20
(18.40) (35.40) (46.20) (83.50) (300.00) (-283.5)U.P. 2836.60 1764.10 1167.20 (94.70) 3710.90 1464.40 2465.60 -219.10
(62.20) (41.10) (-3.3) (39.50) (66.40) (-5.9)W.B. 1143.70 644.20 473.50 26.00 1012.50 599.40 590.30 -177.20
(56.30) (41.40) (2.30) (59.20) (58.30) (-17.5)NCT Delhi " " " " " " " "
All States 18900.10 9373.50 9370.70 155.90 20891.30 8921.30 13799.40 -1829.40(49.60) (49.60) (0.80) (42.70) (66.10) (-8.8)
Note : Figure in Brackets are Percentages to GFDSource Compiled from RBI and State Government Documents (contd)
TABLE - AS -12 : ALL STATESFINANCING OF GFD
- S-22 -
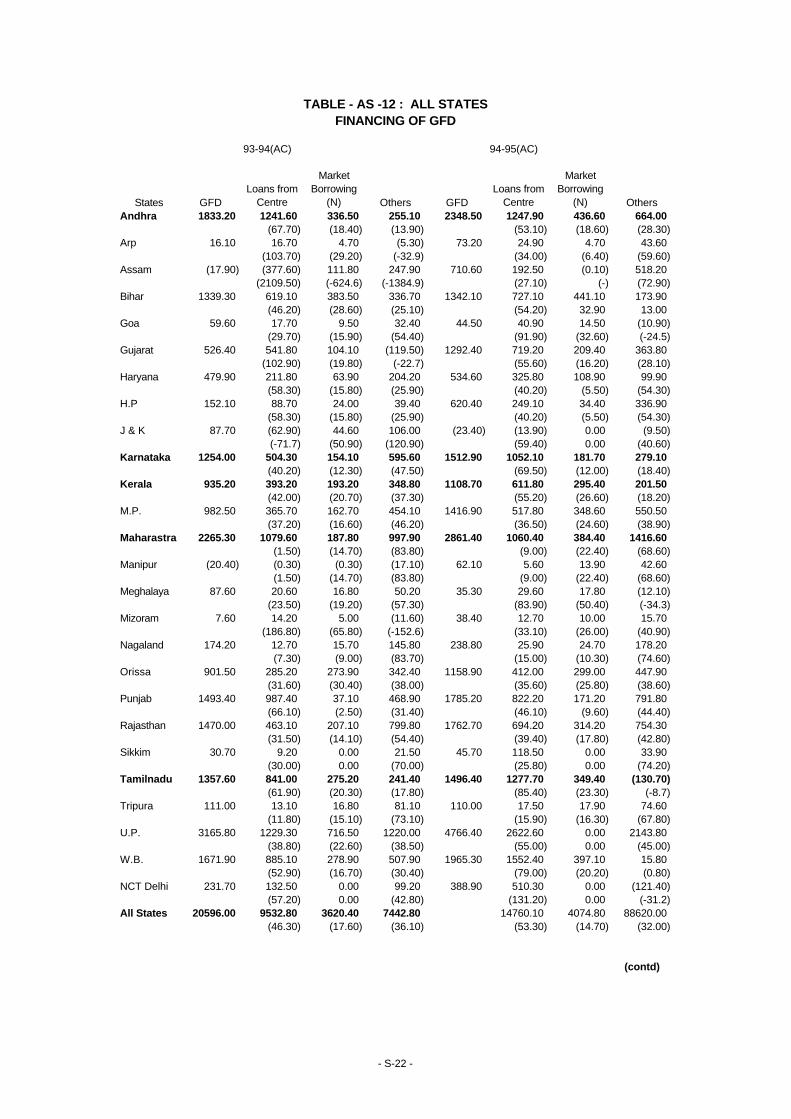
93-94(AC) 94-95(AC)
States GFDLoans from
Centre
Market Borrowing
(N) Others GFDLoans from
Centre
Market Borrowing
(N) OthersAndhra 1833.20 1241.60 336.50 255.10 2348.50 1247.90 436.60 664.00
(67.70) (18.40) (13.90) (53.10) (18.60) (28.30)Arp 16.10 16.70 4.70 (5.30) 73.20 24.90 4.70 43.60
(103.70) (29.20) (-32.9) (34.00) (6.40) (59.60)Assam (17.90) (377.60) 111.80 247.90 710.60 192.50 (0.10) 518.20
(2109.50) (-624.6) (-1384.9) (27.10) (-) (72.90)Bihar 1339.30 619.10 383.50 336.70 1342.10 727.10 441.10 173.90
(46.20) (28.60) (25.10) (54.20) 32.90 13.00Goa 59.60 17.70 9.50 32.40 44.50 40.90 14.50 (10.90)
(29.70) (15.90) (54.40) (91.90) (32.60) (-24.5)Gujarat 526.40 541.80 104.10 (119.50) 1292.40 719.20 209.40 363.80
(102.90) (19.80) (-22.7) (55.60) (16.20) (28.10)Haryana 479.90 211.80 63.90 204.20 534.60 325.80 108.90 99.90
(58.30) (15.80) (25.90) (40.20) (5.50) (54.30)H.P 152.10 88.70 24.00 39.40 620.40 249.10 34.40 336.90
(58.30) (15.80) (25.90) (40.20) (5.50) (54.30)J & K 87.70 (62.90) 44.60 106.00 (23.40) (13.90) 0.00 (9.50)
(-71.7) (50.90) (120.90) (59.40) 0.00 (40.60)Karnataka 1254.00 504.30 154.10 595.60 1512.90 1052.10 181.70 279.10
(40.20) (12.30) (47.50) (69.50) (12.00) (18.40)Kerala 935.20 393.20 193.20 348.80 1108.70 611.80 295.40 201.50
(42.00) (20.70) (37.30) (55.20) (26.60) (18.20)M.P. 982.50 365.70 162.70 454.10 1416.90 517.80 348.60 550.50
(37.20) (16.60) (46.20) (36.50) (24.60) (38.90)Maharastra 2265.30 1079.60 187.80 997.90 2861.40 1060.40 384.40 1416.60
(1.50) (14.70) (83.80) (9.00) (22.40) (68.60)Manipur (20.40) (0.30) (0.30) (17.10) 62.10 5.60 13.90 42.60
(1.50) (14.70) (83.80) (9.00) (22.40) (68.60)Meghalaya 87.60 20.60 16.80 50.20 35.30 29.60 17.80 (12.10)
(23.50) (19.20) (57.30) (83.90) (50.40) (-34.3)Mizoram 7.60 14.20 5.00 (11.60) 38.40 12.70 10.00 15.70
(186.80) (65.80) (-152.6) (33.10) (26.00) (40.90)Nagaland 174.20 12.70 15.70 145.80 238.80 25.90 24.70 178.20
(7.30) (9.00) (83.70) (15.00) (10.30) (74.60)Orissa 901.50 285.20 273.90 342.40 1158.90 412.00 299.00 447.90
(31.60) (30.40) (38.00) (35.60) (25.80) (38.60)Punjab 1493.40 987.40 37.10 468.90 1785.20 822.20 171.20 791.80
(66.10) (2.50) (31.40) (46.10) (9.60) (44.40)Rajasthan 1470.00 463.10 207.10 799.80 1762.70 694.20 314.20 754.30
(31.50) (14.10) (54.40) (39.40) (17.80) (42.80)Sikkim 30.70 9.20 0.00 21.50 45.70 118.50 0.00 33.90
(30.00) 0.00 (70.00) (25.80) 0.00 (74.20)Tamilnadu 1357.60 841.00 275.20 241.40 1496.40 1277.70 349.40 (130.70)
(61.90) (20.30) (17.80) (85.40) (23.30) (-8.7)Tripura 111.00 13.10 16.80 81.10 110.00 17.50 17.90 74.60
(11.80) (15.10) (73.10) (15.90) (16.30) (67.80)U.P. 3165.80 1229.30 716.50 1220.00 4766.40 2622.60 0.00 2143.80
(38.80) (22.60) (38.50) (55.00) 0.00 (45.00)W.B. 1671.90 885.10 278.90 507.90 1965.30 1552.40 397.10 15.80
(52.90) (16.70) (30.40) (79.00) (20.20) (0.80)NCT Delhi 231.70 132.50 0.00 99.20 388.90 510.30 0.00 (121.40)
(57.20) 0.00 (42.80) (131.20) 0.00 (-31.2)All States 20596.00 9532.80 3620.40 7442.80 14760.10 4074.80 88620.00
(46.30) (17.60) (36.10) (53.30) (14.70) (32.00)
(contd)
TABLE - AS -12 : ALL STATESFINANCING OF GFD
- S-22 -
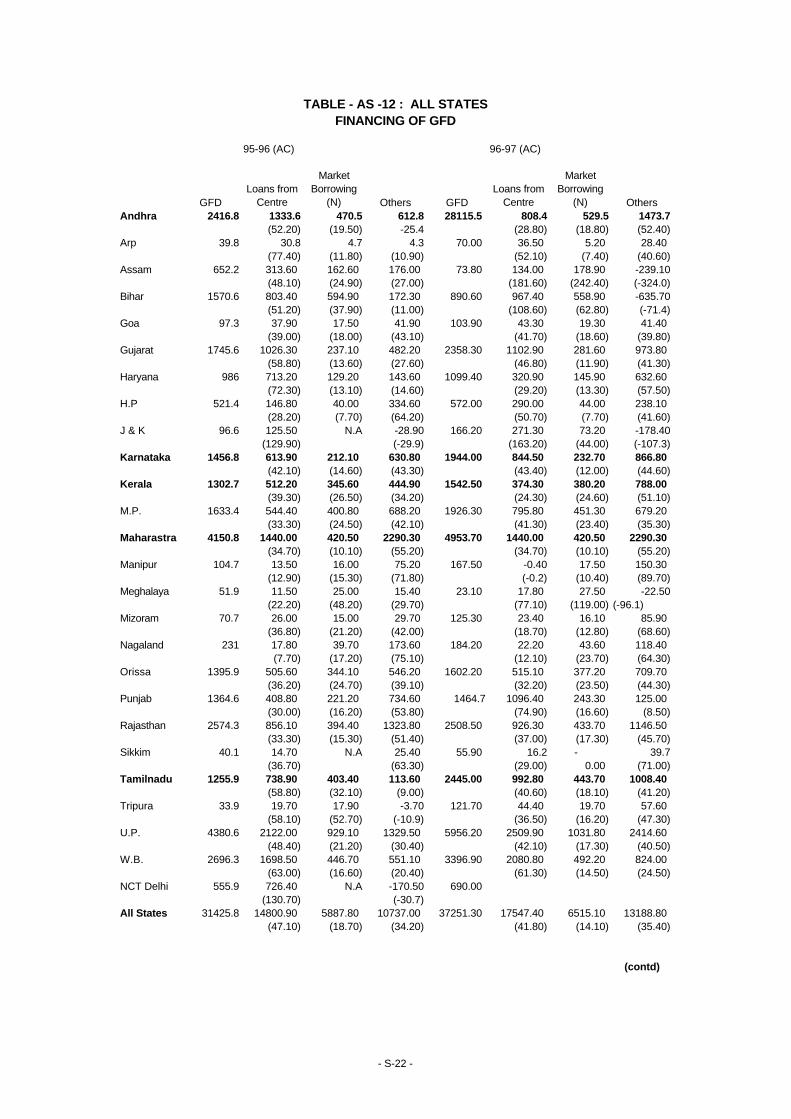
95-96 (AC) 96-97 (AC)
GFDLoans from
Centre
Market Borrowing
(N) Others GFDLoans from
Centre
Market Borrowing
(N) OthersAndhra 2416.8 1333.6 470.5 612.8 28115.5 808.4 529.5 1473.7
(52.20) (19.50) -25.4 (28.80) (18.80) (52.40)Arp 39.8 30.8 4.7 4.3 70.00 36.50 5.20 28.40
(77.40) (11.80) (10.90) (52.10) (7.40) (40.60)Assam 652.2 313.60 162.60 176.00 73.80 134.00 178.90 -239.10
(48.10) (24.90) (27.00) (181.60) (242.40) (-324.0)Bihar 1570.6 803.40 594.90 172.30 890.60 967.40 558.90 -635.70
(51.20) (37.90) (11.00) (108.60) (62.80) (-71.4)Goa 97.3 37.90 17.50 41.90 103.90 43.30 19.30 41.40
(39.00) (18.00) (43.10) (41.70) (18.60) (39.80)Gujarat 1745.6 1026.30 237.10 482.20 2358.30 1102.90 281.60 973.80
(58.80) (13.60) (27.60) (46.80) (11.90) (41.30)Haryana 986 713.20 129.20 143.60 1099.40 320.90 145.90 632.60
(72.30) (13.10) (14.60) (29.20) (13.30) (57.50)H.P 521.4 146.80 40.00 334.60 572.00 290.00 44.00 238.10
(28.20) (7.70) (64.20) (50.70) (7.70) (41.60)J & K 96.6 125.50 N.A -28.90 166.20 271.30 73.20 -178.40
(129.90) (-29.9) (163.20) (44.00) (-107.3)Karnataka 1456.8 613.90 212.10 630.80 1944.00 844.50 232.70 866.80
(42.10) (14.60) (43.30) (43.40) (12.00) (44.60)Kerala 1302.7 512.20 345.60 444.90 1542.50 374.30 380.20 788.00
(39.30) (26.50) (34.20) (24.30) (24.60) (51.10)M.P. 1633.4 544.40 400.80 688.20 1926.30 795.80 451.30 679.20
(33.30) (24.50) (42.10) (41.30) (23.40) (35.30)Maharastra 4150.8 1440.00 420.50 2290.30 4953.70 1440.00 420.50 2290.30
(34.70) (10.10) (55.20) (34.70) (10.10) (55.20)Manipur 104.7 13.50 16.00 75.20 167.50 -0.40 17.50 150.30
(12.90) (15.30) (71.80) (-0.2) (10.40) (89.70)Meghalaya 51.9 11.50 25.00 15.40 23.10 17.80 27.50 -22.50
(22.20) (48.20) (29.70) (77.10) (119.00) (-96.1)Mizoram 70.7 26.00 15.00 29.70 125.30 23.40 16.10 85.90
(36.80) (21.20) (42.00) (18.70) (12.80) (68.60)Nagaland 231 17.80 39.70 173.60 184.20 22.20 43.60 118.40
(7.70) (17.20) (75.10) (12.10) (23.70) (64.30)Orissa 1395.9 505.60 344.10 546.20 1602.20 515.10 377.20 709.70
(36.20) (24.70) (39.10) (32.20) (23.50) (44.30)Punjab 1364.6 408.80 221.20 734.60 1464.7 1096.40 243.30 125.00
(30.00) (16.20) (53.80) (74.90) (16.60) (8.50)Rajasthan 2574.3 856.10 394.40 1323.80 2508.50 926.30 433.70 1146.50
(33.30) (15.30) (51.40) (37.00) (17.30) (45.70)Sikkim 40.1 14.70 N.A 25.40 55.90 16.2 - 39.7
(36.70) (63.30) (29.00) 0.00 (71.00)Tamilnadu 1255.9 738.90 403.40 113.60 2445.00 992.80 443.70 1008.40
(58.80) (32.10) (9.00) (40.60) (18.10) (41.20)Tripura 33.9 19.70 17.90 -3.70 121.70 44.40 19.70 57.60
(58.10) (52.70) (-10.9) (36.50) (16.20) (47.30)U.P. 4380.6 2122.00 929.10 1329.50 5956.20 2509.90 1031.80 2414.60
(48.40) (21.20) (30.40) (42.10) (17.30) (40.50)W.B. 2696.3 1698.50 446.70 551.10 3396.90 2080.80 492.20 824.00
(63.00) (16.60) (20.40) (61.30) (14.50) (24.50)NCT Delhi 555.9 726.40 N.A -170.50 690.00
(130.70) (-30.7)All States 31425.8 14800.90 5887.80 10737.00 37251.30 17547.40 6515.10 13188.80
(47.10) (18.70) (34.20) (41.80) (14.10) (35.40)
(contd)
TABLE - AS -12 : ALL STATESFINANCING OF GFD
- S-22 -
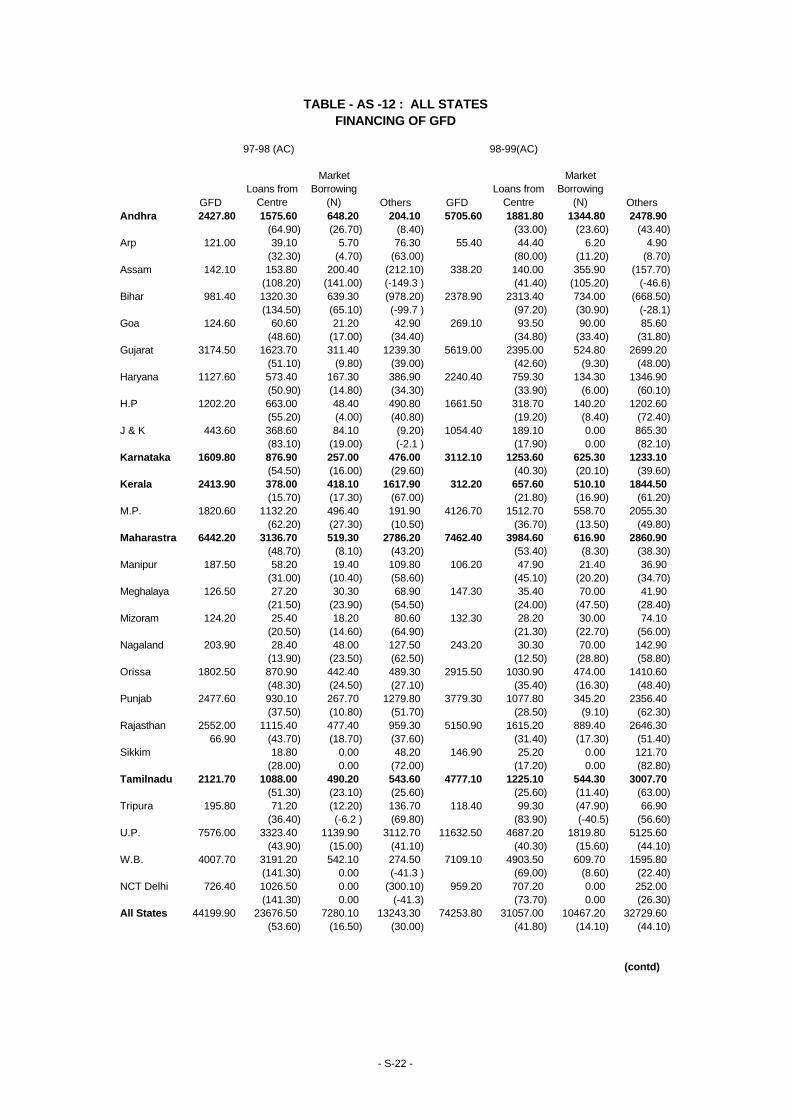
97-98 (AC) 98-99(AC)
GFDLoans from
Centre
Market Borrowing
(N) Others GFDLoans from
Centre
Market Borrowing
(N) OthersAndhra 2427.80 1575.60 648.20 204.10 5705.60 1881.80 1344.80 2478.90
(64.90) (26.70) (8.40) (33.00) (23.60) (43.40)Arp 121.00 39.10 5.70 76.30 55.40 44.40 6.20 4.90
(32.30) (4.70) (63.00) (80.00) (11.20) (8.70)Assam 142.10 153.80 200.40 (212.10) 338.20 140.00 355.90 (157.70)
(108.20) (141.00) (-149.3 ) (41.40) (105.20) (-46.6)Bihar 981.40 1320.30 639.30 (978.20) 2378.90 2313.40 734.00 (668.50)
(134.50) (65.10) (-99.7 ) (97.20) (30.90) (-28.1)Goa 124.60 60.60 21.20 42.90 269.10 93.50 90.00 85.60
(48.60) (17.00) (34.40) (34.80) (33.40) (31.80)Gujarat 3174.50 1623.70 311.40 1239.30 5619.00 2395.00 524.80 2699.20
(51.10) (9.80) (39.00) (42.60) (9.30) (48.00)Haryana 1127.60 573.40 167.30 386.90 2240.40 759.30 134.30 1346.90
(50.90) (14.80) (34.30) (33.90) (6.00) (60.10)H.P 1202.20 663.00 48.40 490.80 1661.50 318.70 140.20 1202.60
(55.20) (4.00) (40.80) (19.20) (8.40) (72.40)J & K 443.60 368.60 84.10 (9.20) 1054.40 189.10 0.00 865.30
(83.10) (19.00) (-2.1 ) (17.90) 0.00 (82.10)Karnataka 1609.80 876.90 257.00 476.00 3112.10 1253.60 625.30 1233.10
(54.50) (16.00) (29.60) (40.30) (20.10) (39.60)Kerala 2413.90 378.00 418.10 1617.90 312.20 657.60 510.10 1844.50
(15.70) (17.30) (67.00) (21.80) (16.90) (61.20)M.P. 1820.60 1132.20 496.40 191.90 4126.70 1512.70 558.70 2055.30
(62.20) (27.30) (10.50) (36.70) (13.50) (49.80)Maharastra 6442.20 3136.70 519.30 2786.20 7462.40 3984.60 616.90 2860.90
(48.70) (8.10) (43.20) (53.40) (8.30) (38.30)Manipur 187.50 58.20 19.40 109.80 106.20 47.90 21.40 36.90
(31.00) (10.40) (58.60) (45.10) (20.20) (34.70)Meghalaya 126.50 27.20 30.30 68.90 147.30 35.40 70.00 41.90
(21.50) (23.90) (54.50) (24.00) (47.50) (28.40)Mizoram 124.20 25.40 18.20 80.60 132.30 28.20 30.00 74.10
(20.50) (14.60) (64.90) (21.30) (22.70) (56.00)Nagaland 203.90 28.40 48.00 127.50 243.20 30.30 70.00 142.90
(13.90) (23.50) (62.50) (12.50) (28.80) (58.80)Orissa 1802.50 870.90 442.40 489.30 2915.50 1030.90 474.00 1410.60
(48.30) (24.50) (27.10) (35.40) (16.30) (48.40)Punjab 2477.60 930.10 267.70 1279.80 3779.30 1077.80 345.20 2356.40
(37.50) (10.80) (51.70) (28.50) (9.10) (62.30)Rajasthan 2552.00 1115.40 477.40 959.30 5150.90 1615.20 889.40 2646.30
66.90 (43.70) (18.70) (37.60) (31.40) (17.30) (51.40)Sikkim 18.80 0.00 48.20 146.90 25.20 0.00 121.70
(28.00) 0.00 (72.00) (17.20) 0.00 (82.80)Tamilnadu 2121.70 1088.00 490.20 543.60 4777.10 1225.10 544.30 3007.70
(51.30) (23.10) (25.60) (25.60) (11.40) (63.00)Tripura 195.80 71.20 (12.20) 136.70 118.40 99.30 (47.90) 66.90
(36.40) (-6.2 ) (69.80) (83.90) (-40.5) (56.60)U.P. 7576.00 3323.40 1139.90 3112.70 11632.50 4687.20 1819.80 5125.60
(43.90) (15.00) (41.10) (40.30) (15.60) (44.10)W.B. 4007.70 3191.20 542.10 274.50 7109.10 4903.50 609.70 1595.80
(141.30) 0.00 (-41.3 ) (69.00) (8.60) (22.40)NCT Delhi 726.40 1026.50 0.00 (300.10) 959.20 707.20 0.00 252.00
(141.30) 0.00 (-41.3) (73.70) 0.00 (26.30)All States 44199.90 23676.50 7280.10 13243.30 74253.80 31057.00 10467.20 32729.60
(53.60) (16.50) (30.00) (41.80) (14.10) (44.10)
(contd)
TABLE - AS -12 : ALL STATESFINANCING OF GFD
- S-22 -
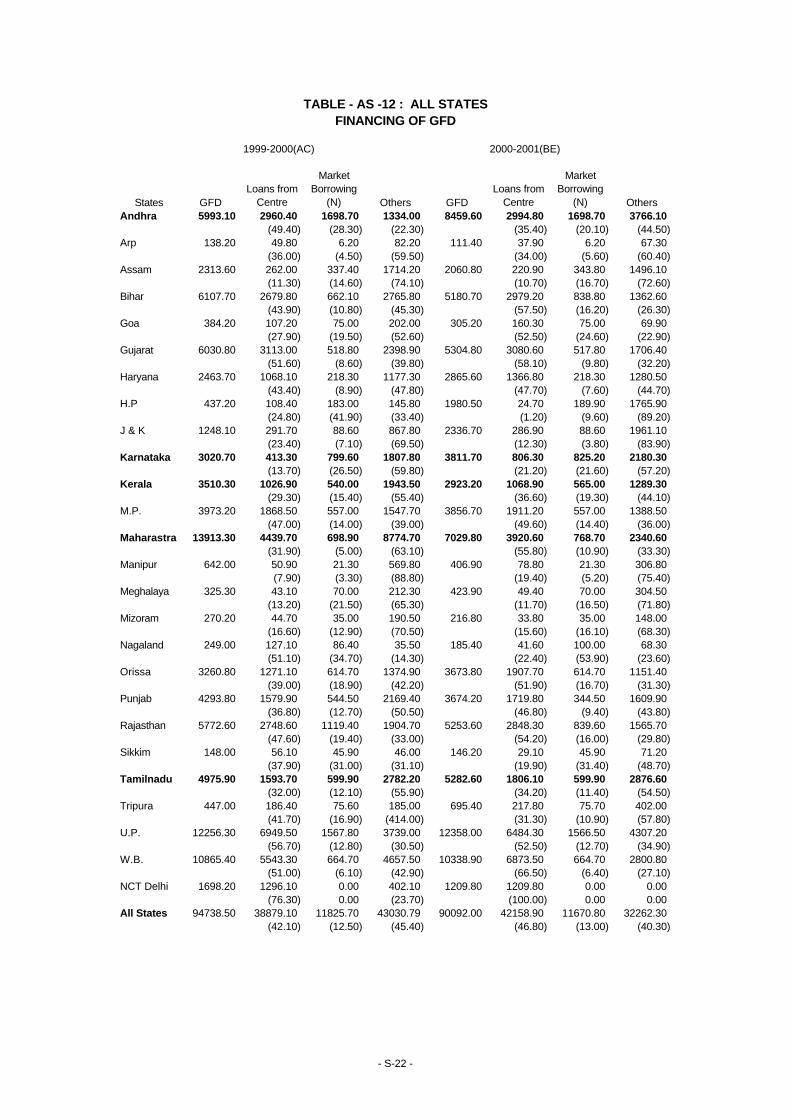
1999-2000(AC) 2000-2001(BE)
States GFDLoans from
Centre
Market Borrowing
(N) Others GFDLoans from
Centre
Market Borrowing
(N) OthersAndhra 5993.10 2960.40 1698.70 1334.00 8459.60 2994.80 1698.70 3766.10
(49.40) (28.30) (22.30) (35.40) (20.10) (44.50)Arp 138.20 49.80 6.20 82.20 111.40 37.90 6.20 67.30
(36.00) (4.50) (59.50) (34.00) (5.60) (60.40)Assam 2313.60 262.00 337.40 1714.20 2060.80 220.90 343.80 1496.10
(11.30) (14.60) (74.10) (10.70) (16.70) (72.60)Bihar 6107.70 2679.80 662.10 2765.80 5180.70 2979.20 838.80 1362.60
(43.90) (10.80) (45.30) (57.50) (16.20) (26.30)Goa 384.20 107.20 75.00 202.00 305.20 160.30 75.00 69.90
(27.90) (19.50) (52.60) (52.50) (24.60) (22.90)Gujarat 6030.80 3113.00 518.80 2398.90 5304.80 3080.60 517.80 1706.40
(51.60) (8.60) (39.80) (58.10) (9.80) (32.20)Haryana 2463.70 1068.10 218.30 1177.30 2865.60 1366.80 218.30 1280.50
(43.40) (8.90) (47.80) (47.70) (7.60) (44.70)H.P 437.20 108.40 183.00 145.80 1980.50 24.70 189.90 1765.90
(24.80) (41.90) (33.40) (1.20) (9.60) (89.20)J & K 1248.10 291.70 88.60 867.80 2336.70 286.90 88.60 1961.10
(23.40) (7.10) (69.50) (12.30) (3.80) (83.90)Karnataka 3020.70 413.30 799.60 1807.80 3811.70 806.30 825.20 2180.30
(13.70) (26.50) (59.80) (21.20) (21.60) (57.20)Kerala 3510.30 1026.90 540.00 1943.50 2923.20 1068.90 565.00 1289.30
(29.30) (15.40) (55.40) (36.60) (19.30) (44.10)M.P. 3973.20 1868.50 557.00 1547.70 3856.70 1911.20 557.00 1388.50
(47.00) (14.00) (39.00) (49.60) (14.40) (36.00)Maharastra 13913.30 4439.70 698.90 8774.70 7029.80 3920.60 768.70 2340.60
(31.90) (5.00) (63.10) (55.80) (10.90) (33.30)Manipur 642.00 50.90 21.30 569.80 406.90 78.80 21.30 306.80
(7.90) (3.30) (88.80) (19.40) (5.20) (75.40)Meghalaya 325.30 43.10 70.00 212.30 423.90 49.40 70.00 304.50
(13.20) (21.50) (65.30) (11.70) (16.50) (71.80)Mizoram 270.20 44.70 35.00 190.50 216.80 33.80 35.00 148.00
(16.60) (12.90) (70.50) (15.60) (16.10) (68.30)Nagaland 249.00 127.10 86.40 35.50 185.40 41.60 100.00 68.30
(51.10) (34.70) (14.30) (22.40) (53.90) (23.60)Orissa 3260.80 1271.10 614.70 1374.90 3673.80 1907.70 614.70 1151.40
(39.00) (18.90) (42.20) (51.90) (16.70) (31.30)Punjab 4293.80 1579.90 544.50 2169.40 3674.20 1719.80 344.50 1609.90
(36.80) (12.70) (50.50) (46.80) (9.40) (43.80)Rajasthan 5772.60 2748.60 1119.40 1904.70 5253.60 2848.30 839.60 1565.70
(47.60) (19.40) (33.00) (54.20) (16.00) (29.80)Sikkim 148.00 56.10 45.90 46.00 146.20 29.10 45.90 71.20
(37.90) (31.00) (31.10) (19.90) (31.40) (48.70)Tamilnadu 4975.90 1593.70 599.90 2782.20 5282.60 1806.10 599.90 2876.60
(32.00) (12.10) (55.90) (34.20) (11.40) (54.50)Tripura 447.00 186.40 75.60 185.00 695.40 217.80 75.70 402.00
(41.70) (16.90) (414.00) (31.30) (10.90) (57.80)U.P. 12256.30 6949.50 1567.80 3739.00 12358.00 6484.30 1566.50 4307.20
(56.70) (12.80) (30.50) (52.50) (12.70) (34.90)W.B. 10865.40 5543.30 664.70 4657.50 10338.90 6873.50 664.70 2800.80
(51.00) (6.10) (42.90) (66.50) (6.40) (27.10)NCT Delhi 1698.20 1296.10 0.00 402.10 1209.80 1209.80 0.00 0.00
(76.30) 0.00 (23.70) (100.00) 0.00 0.00All States 94738.50 38879.10 11825.70 43030.79 90092.00 42158.90 11670.80 32262.30
(42.10) (12.50) (45.40) (46.80) (13.00) (40.30)
TABLE - AS -12 : ALL STATESFINANCING OF GFD
- S-22 -

Year
Total Tax Revenue
(3+7)Own Tax Revenue
Total Non Tax
Revenue (5+8)
Own Non Tax
Revenue
Total Revenue
(2+4)
Shares in Central Taxes
Grants from Centre
1 2 3 4 5 6 7 8
1990-91 44586.00 30344.80 21881.00 9237.20 66467 14241.50 12643.3
(7.80) (5.30) (3.90) (1.60) (11.70) (15.60) (13.90)
1991-92 52603.90 35756.00 27934.80 12706.10 80538.7 16847.90 15225.7
(8.10) (5.50) (4.20) (1.90) (12.30) (15.60) (14.00)
1992-93 60448.00 39868.30 30643.00 12883.90 91091 20580.10 17758.8
(8.10) (5.30) (4.10) (1.70) (12.20) (17.20) (14.90)
1993-94 68818.90 46424.10 36744.80 15568.80 105563.7 22394.8 21176.00
(8.00) (5.40) (4.30) (1.80) (12.30) (16.60) (15.70)
1994-95 80619.30 55734.50 41664.50 21660.10 122283.8 24884.7 20004.40
(8.00) (5.50) (4.10) (2.10) (12.10) (15.40) (12.50)
1995-96 92912.80 63865.20 43991.00 22894.80 136803 29047.6 20995.80
(7.80) (5.40) (3.70) (1.90) (11.50) (16.40) (11.80)
1996-97 106139.00 71101.50 46697.00 23542.60 152836 35037.8 23154.70
(7.80) (5.20) (3.40) (1.70) (11.20) (17.30) (11.40)
1997-98 121640.90 81229.60 48660.30 24437.60 170301.2 40411.2 24222.50
(8.00) (5.30) (3.20) (1.70) (11.20) (17.70) (10.60)
1998-99 128416.50 88995.30 48031.30 24167.80 176447.8 39421.2 23863.40
(8.00) (5.10) (2.00) (1.40) (10.00) (14.80) (9.00)
1999-00 150095.30 105637.10 64714.40 29633.80 214809.7 44458.2 35080.60
(7.70) (5.40) (2.30) (1.50) (11.00) (13.70) (10.80)
2000-01 176368.50 125563.50 68551.60 31588.20 244920.1 50805.0 36963.50
(8.10) (5.80) (3.10) (1.50) (11.20) (14.50) (10.50)
Note:Figures in Brackets In columns 2 - 6 are percentage to GDPFigures in Brackets In columns 7 and 8 are percentage of State's Aggregate Expendituresource : compiled at IIE
TABLE SA1- STATES AGGREGATE REVENUE RECEIPTS- TAX & NON TAX (Rs.Crores)
- S-1 -
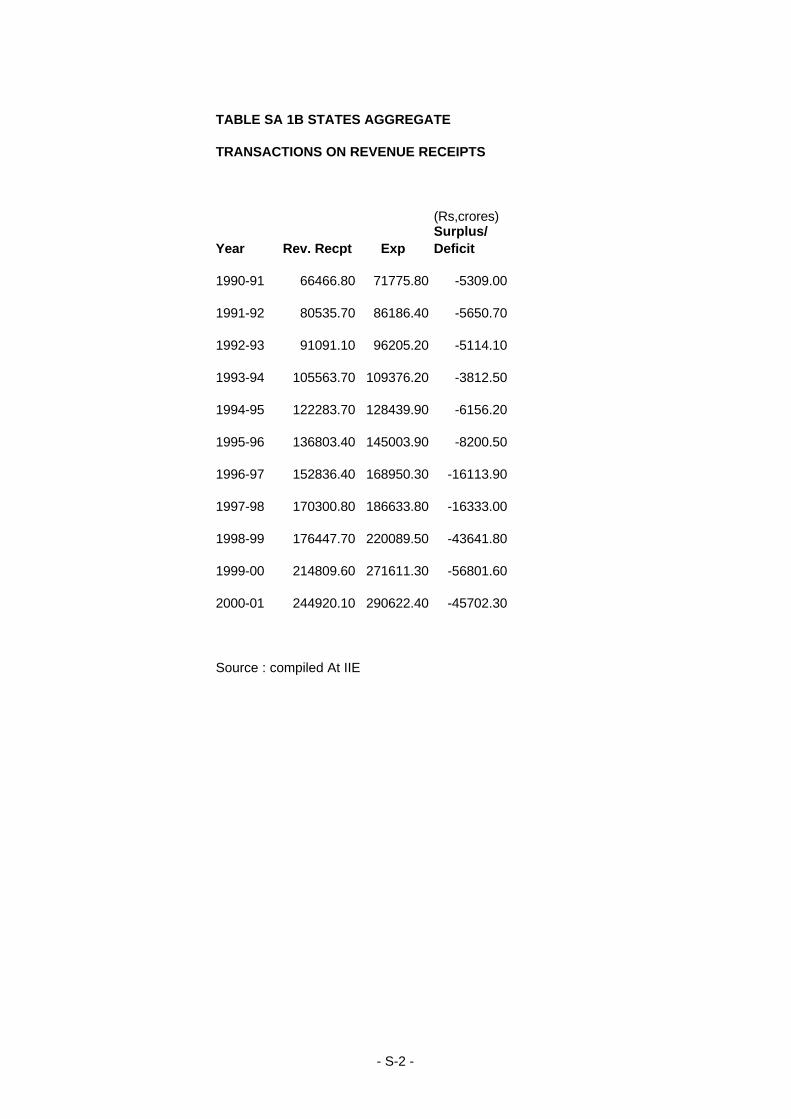
TABLE SA 1B STATES AGGREGATE
TRANSACTIONS ON REVENUE RECEIPTS
(Rs,crores)
Year Rev. Recpt Exp Surplus/ Deficit
1990-91 66466.80 71775.80 -5309.00
1991-92 80535.70 86186.40 -5650.70
1992-93 91091.10 96205.20 -5114.10
1993-94 105563.70 109376.20 -3812.50
1994-95 122283.70 128439.90 -6156.20
1995-96 136803.40 145003.90 -8200.50
1996-97 152836.40 168950.30 -16113.90
1997-98 170300.80 186633.80 -16333.00
1998-99 176447.70 220089.50 -43641.80
1999-00 214809.60 271611.30 -56801.60
2000-01 244920.10 290622.40 -45702.30
Source : compiled At IIE
- S-2 -
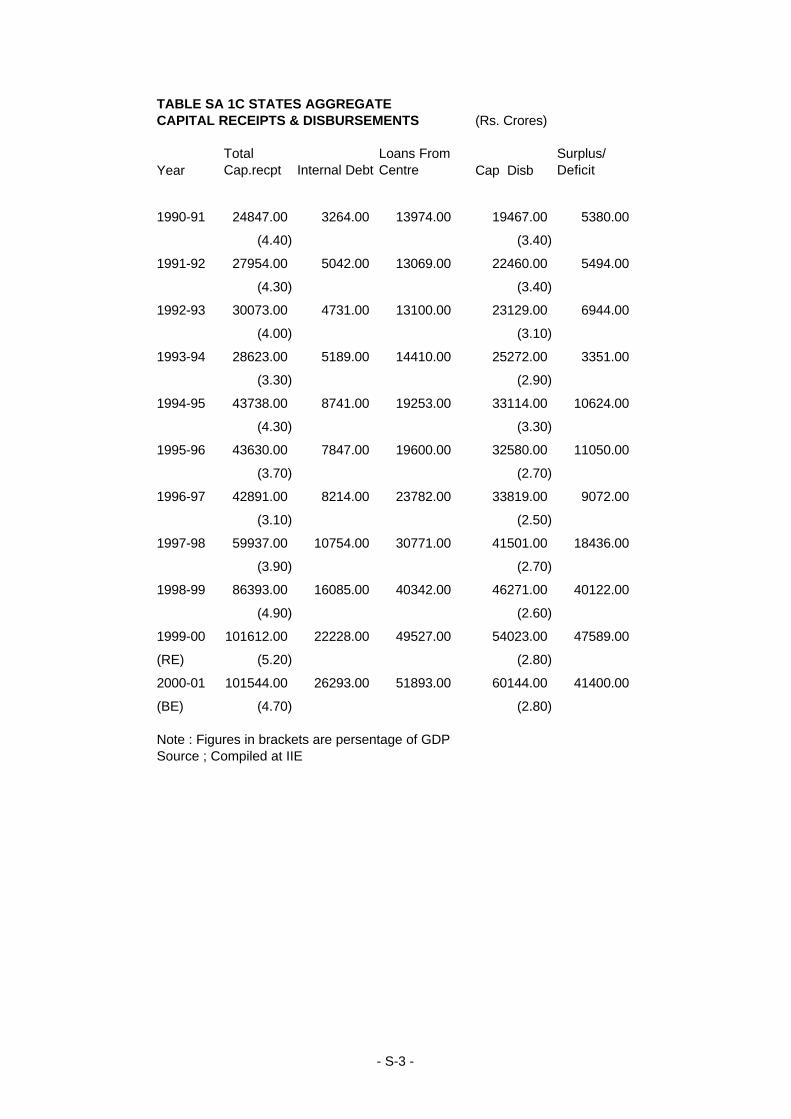
TABLE SA 1C STATES AGGREGATECAPITAL RECEIPTS & DISBURSEMENTS (Rs. Crores)
YearTotal Cap.recpt Internal Debt
Loans From Centre Cap Disb
Surplus/ Deficit
1990-91 24847.00 3264.00 13974.00 19467.00 5380.00
(4.40) (3.40)
1991-92 27954.00 5042.00 13069.00 22460.00 5494.00
(4.30) (3.40)
1992-93 30073.00 4731.00 13100.00 23129.00 6944.00
(4.00) (3.10)
1993-94 28623.00 5189.00 14410.00 25272.00 3351.00
(3.30) (2.90)
1994-95 43738.00 8741.00 19253.00 33114.00 10624.00
(4.30) (3.30)
1995-96 43630.00 7847.00 19600.00 32580.00 11050.00
(3.70) (2.70)
1996-97 42891.00 8214.00 23782.00 33819.00 9072.00
(3.10) (2.50)
1997-98 59937.00 10754.00 30771.00 41501.00 18436.00
(3.90) (2.70)
1998-99 86393.00 16085.00 40342.00 46271.00 40122.00
(4.90) (2.60)
1999-00 101612.00 22228.00 49527.00 54023.00 47589.00
(RE) (5.20) (2.80)
2000-01 101544.00 26293.00 51893.00 60144.00 41400.00
(BE) (4.70) (2.80)
Note : Figures in brackets are persentage of GDPSource ; Compiled at IIE
- S-3 -
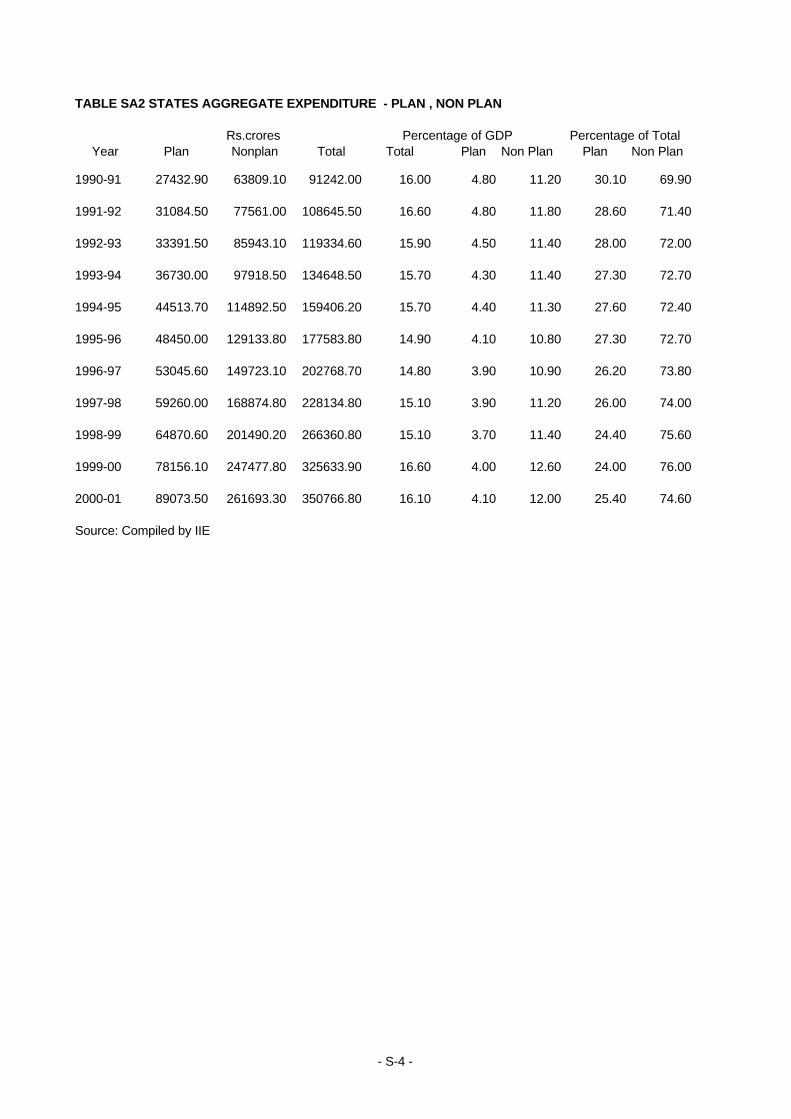
TABLE SA2 STATES AGGREGATE EXPENDITURE - PLAN , NON PLAN
Percentage of GDP Percentage of TotalYear Plan Nonplan Total Total Plan Non Plan Plan Non Plan
1990-91 27432.90 63809.10 91242.00 16.00 4.80 11.20 30.10 69.90
1991-92 31084.50 77561.00 108645.50 16.60 4.80 11.80 28.60 71.40
1992-93 33391.50 85943.10 119334.60 15.90 4.50 11.40 28.00 72.00
1993-94 36730.00 97918.50 134648.50 15.70 4.30 11.40 27.30 72.70
1994-95 44513.70 114892.50 159406.20 15.70 4.40 11.30 27.60 72.40
1995-96 48450.00 129133.80 177583.80 14.90 4.10 10.80 27.30 72.70
1996-97 53045.60 149723.10 202768.70 14.80 3.90 10.90 26.20 73.80
1997-98 59260.00 168874.80 228134.80 15.10 3.90 11.20 26.00 74.00
1998-99 64870.60 201490.20 266360.80 15.10 3.70 11.40 24.40 75.60
1999-00 78156.10 247477.80 325633.90 16.60 4.00 12.60 24.00 76.00
2000-01 89073.50 261693.30 350766.80 16.10 4.10 12.00 25.40 74.60
Source: Compiled by IIE
Rs.crores
- S-4 -
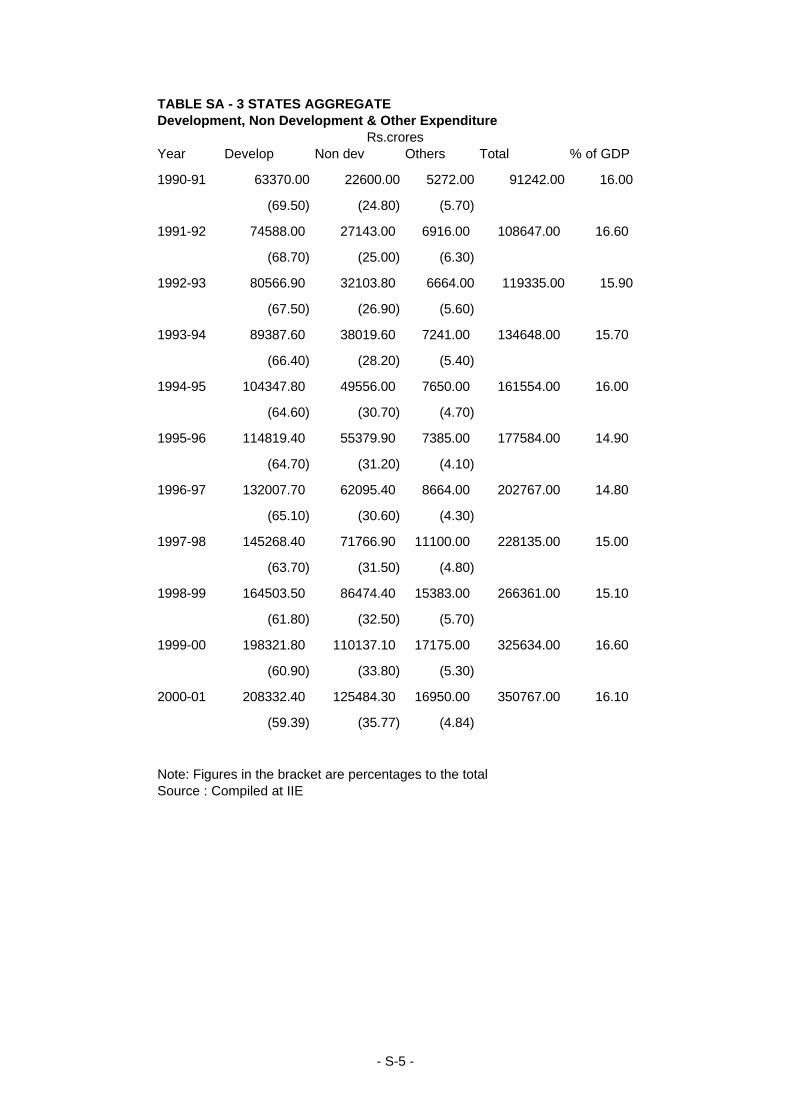
TABLE SA - 3 STATES AGGREGATEDevelopment, Non Development & Other Expenditure
Year Develop Non dev Others Total % of GDP
1990-91 63370.00 22600.00 5272.00 91242.00 16.00
(69.50) (24.80) (5.70)
1991-92 74588.00 27143.00 6916.00 108647.00 16.60
(68.70) (25.00) (6.30)
1992-93 80566.90 32103.80 6664.00 119335.00 15.90
(67.50) (26.90) (5.60)
1993-94 89387.60 38019.60 7241.00 134648.00 15.70
(66.40) (28.20) (5.40)
1994-95 104347.80 49556.00 7650.00 161554.00 16.00
(64.60) (30.70) (4.70)
1995-96 114819.40 55379.90 7385.00 177584.00 14.90
(64.70) (31.20) (4.10)
1996-97 132007.70 62095.40 8664.00 202767.00 14.80
(65.10) (30.60) (4.30)
1997-98 145268.40 71766.90 11100.00 228135.00 15.00
(63.70) (31.50) (4.80)
1998-99 164503.50 86474.40 15383.00 266361.00 15.10
(61.80) (32.50) (5.70)
1999-00 198321.80 110137.10 17175.00 325634.00 16.60
(60.90) (33.80) (5.30)
2000-01 208332.40 125484.30 16950.00 350767.00 16.10
(59.39) (35.77) (4.84)
Note: Figures in the bracket are percentages to the totalSource : Compiled at IIE
Rs.crores
- S-5 -
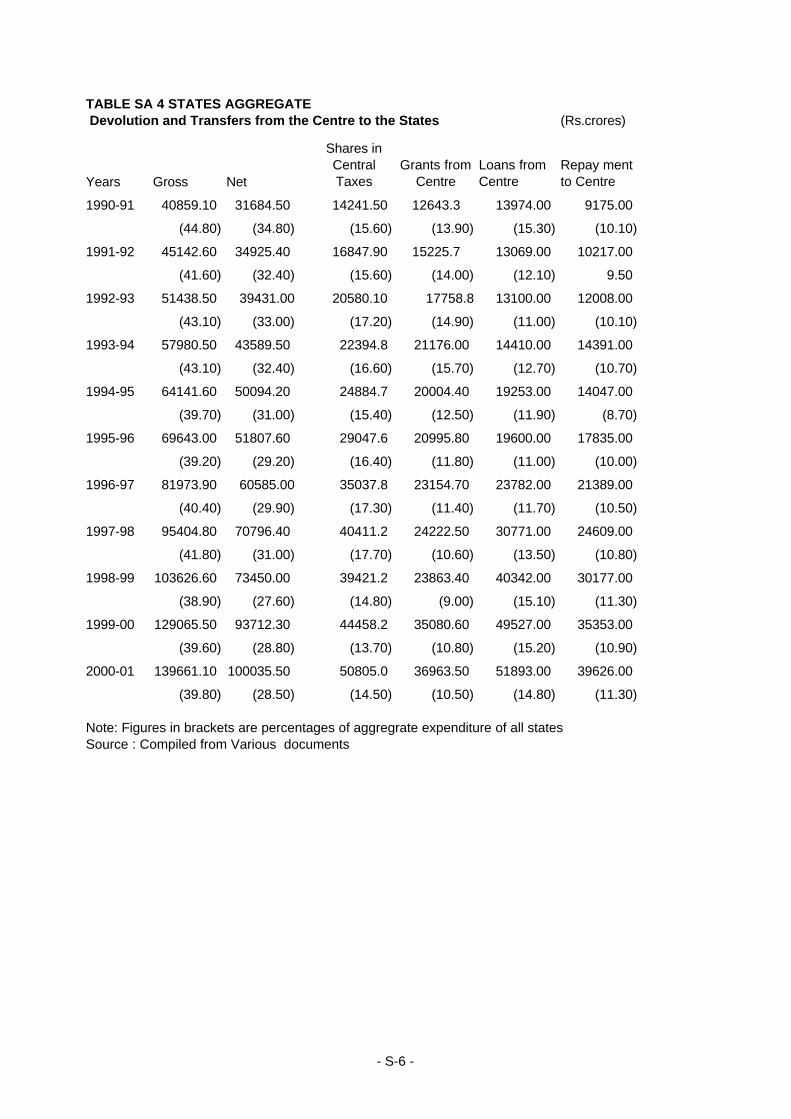
TABLE SA 4 STATES AGGREGATE Devolution and Transfers from the Centre to the States (Rs.crores)
Years Gross Net
Shares in Central Taxes
Grants from Centre
Loans from Centre
Repay ment to Centre
1990-91 40859.10 31684.50 14241.50 12643.3 13974.00 9175.00
(44.80) (34.80) (15.60) (13.90) (15.30) (10.10)
1991-92 45142.60 34925.40 16847.90 15225.7 13069.00 10217.00
(41.60) (32.40) (15.60) (14.00) (12.10) 9.50
1992-93 51438.50 39431.00 20580.10 17758.8 13100.00 12008.00
(43.10) (33.00) (17.20) (14.90) (11.00) (10.10)
1993-94 57980.50 43589.50 22394.8 21176.00 14410.00 14391.00
(43.10) (32.40) (16.60) (15.70) (12.70) (10.70)
1994-95 64141.60 50094.20 24884.7 20004.40 19253.00 14047.00
(39.70) (31.00) (15.40) (12.50) (11.90) (8.70)
1995-96 69643.00 51807.60 29047.6 20995.80 19600.00 17835.00
(39.20) (29.20) (16.40) (11.80) (11.00) (10.00)
1996-97 81973.90 60585.00 35037.8 23154.70 23782.00 21389.00
(40.40) (29.90) (17.30) (11.40) (11.70) (10.50)
1997-98 95404.80 70796.40 40411.2 24222.50 30771.00 24609.00
(41.80) (31.00) (17.70) (10.60) (13.50) (10.80)
1998-99 103626.60 73450.00 39421.2 23863.40 40342.00 30177.00
(38.90) (27.60) (14.80) (9.00) (15.10) (11.30)
1999-00 129065.50 93712.30 44458.2 35080.60 49527.00 35353.00
(39.60) (28.80) (13.70) (10.80) (15.20) (10.90)
2000-01 139661.10 100035.50 50805.0 36963.50 51893.00 39626.00
(39.80) (28.50) (14.50) (10.50) (14.80) (11.30)
Note: Figures in brackets are percentages of aggregrate expenditure of all statesSource : Compiled from Various documents
- S-6 -
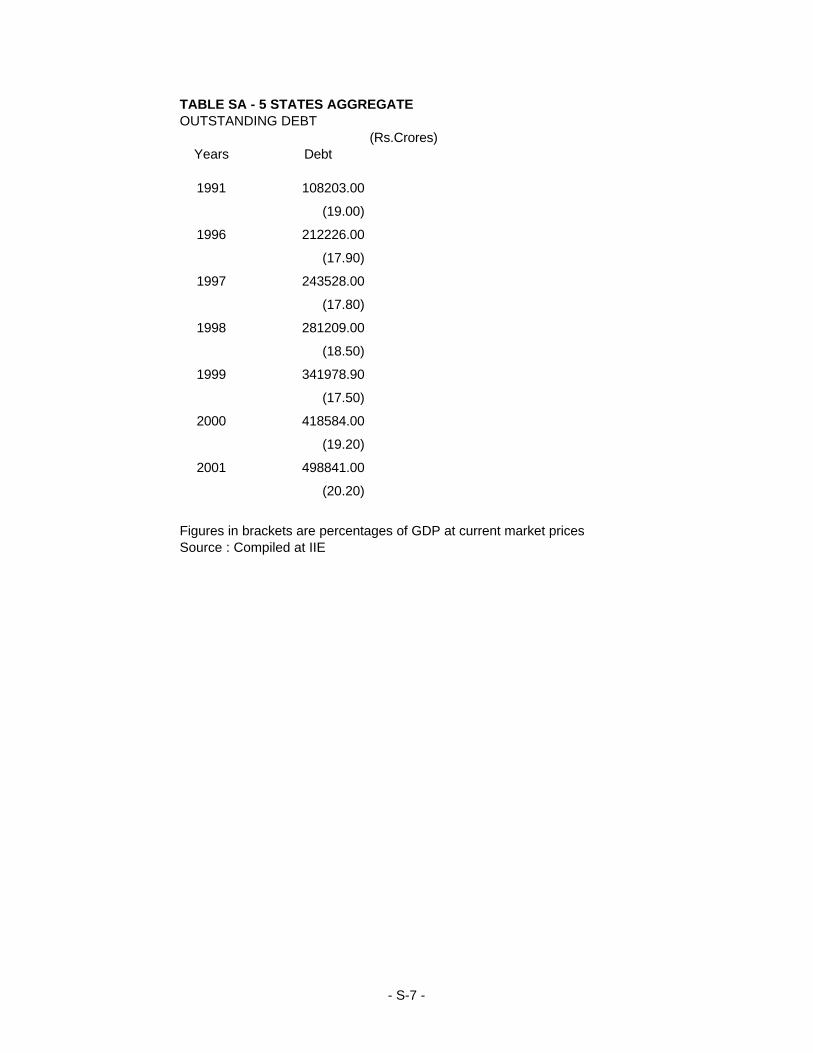
TABLE SA - 5 STATES AGGREGATEOUTSTANDING DEBT
(Rs.Crores)Years Debt
1991 108203.00
(19.00)
1996 212226.00
(17.90)
1997 243528.00
(17.80)
1998 281209.00
(18.50)
1999 341978.90
(17.50)
2000 418584.00
(19.20)
2001 498841.00
(20.20)
Figures in brackets are percentages of GDP at current market prices Source : Compiled at IIE
- S-7 -
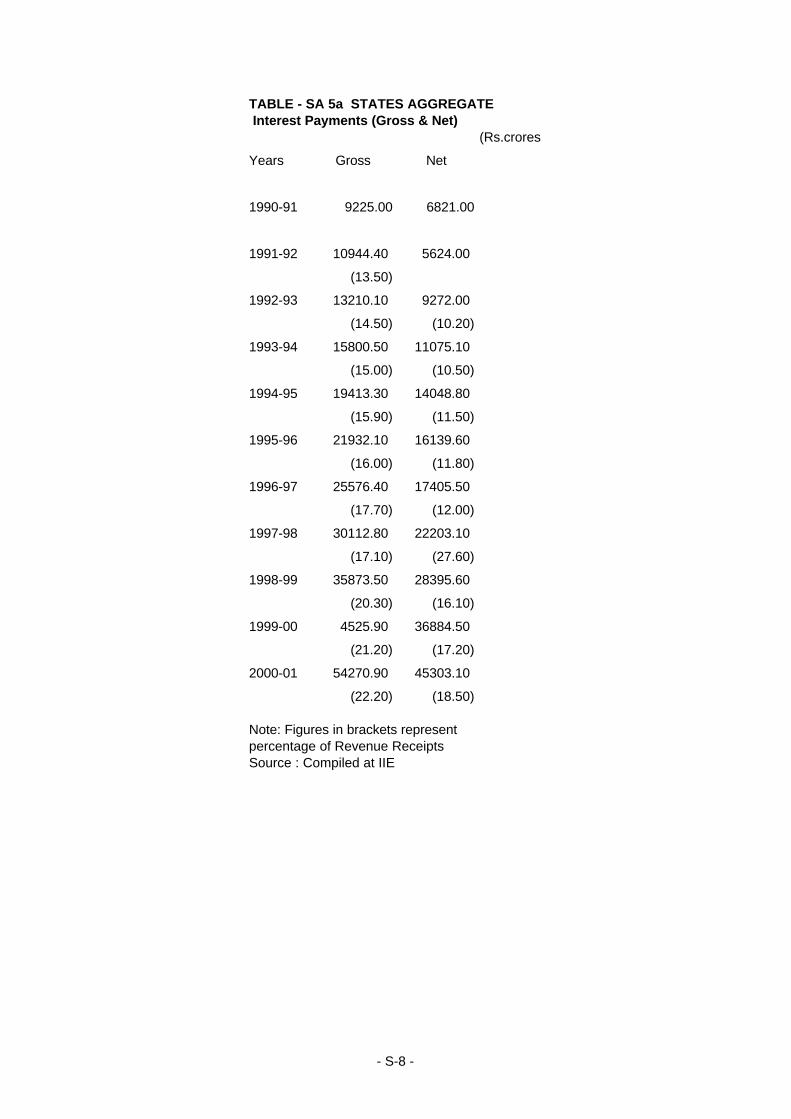
TABLE - SA 5a STATES AGGREGATE Interest Payments (Gross & Net)
(Rs.crores
Years Gross Net
1990-91 9225.00 6821.00
1991-92 10944.40 5624.00
(13.50)
1992-93 13210.10 9272.00
(14.50) (10.20)
1993-94 15800.50 11075.10
(15.00) (10.50)
1994-95 19413.30 14048.80
(15.90) (11.50)
1995-96 21932.10 16139.60
(16.00) (11.80)
1996-97 25576.40 17405.50
(17.70) (12.00)
1997-98 30112.80 22203.10
(17.10) (27.60)
1998-99 35873.50 28395.60
(20.30) (16.10)
1999-00 4525.90 36884.50
(21.20) (17.20)
2000-01 54270.90 45303.10
(22.20) (18.50)
Note: Figures in brackets represent percentage of Revenue ReceiptsSource : Compiled at IIE
- S-8 -
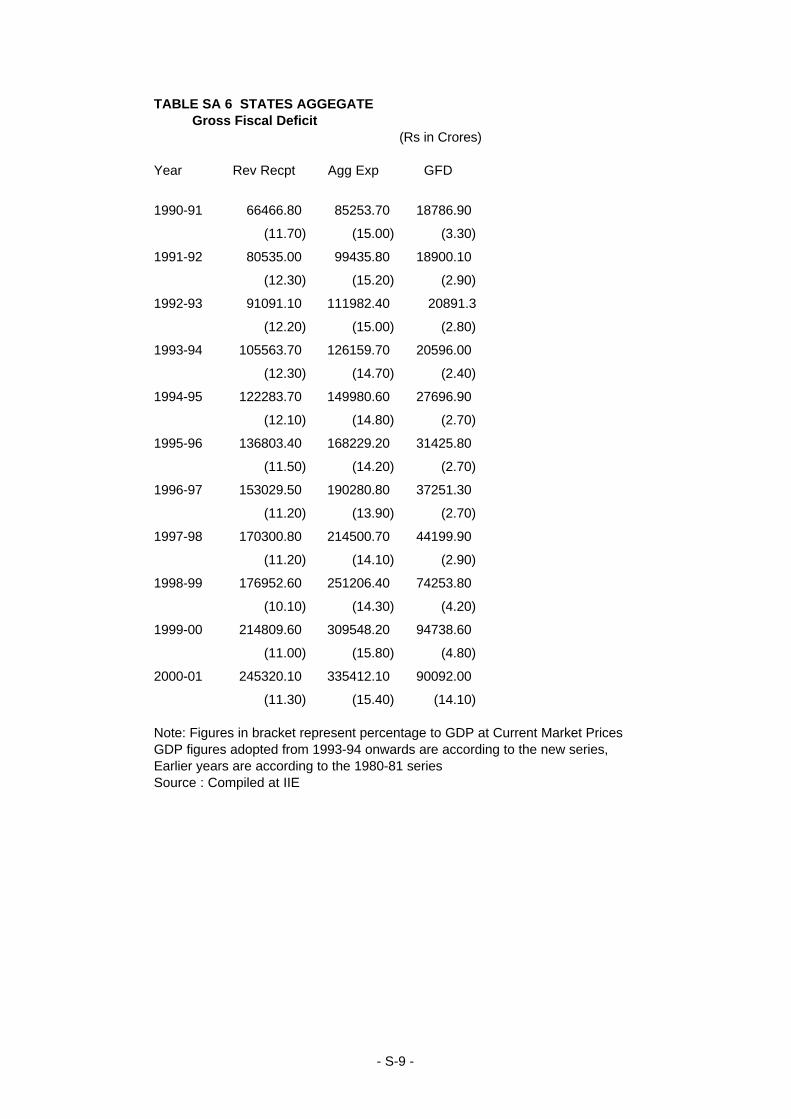
TABLE SA 6 STATES AGGEGATE Gross Fiscal Deficit
(Rs in Crores)
Year Rev Recpt Agg Exp GFD
1990-91 66466.80 85253.70 18786.90
(11.70) (15.00) (3.30)
1991-92 80535.00 99435.80 18900.10
(12.30) (15.20) (2.90)
1992-93 91091.10 111982.40 20891.3
(12.20) (15.00) (2.80)
1993-94 105563.70 126159.70 20596.00
(12.30) (14.70) (2.40)
1994-95 122283.70 149980.60 27696.90
(12.10) (14.80) (2.70)
1995-96 136803.40 168229.20 31425.80
(11.50) (14.20) (2.70)
1996-97 153029.50 190280.80 37251.30
(11.20) (13.90) (2.70)
1997-98 170300.80 214500.70 44199.90
(11.20) (14.10) (2.90)
1998-99 176952.60 251206.40 74253.80
(10.10) (14.30) (4.20)
1999-00 214809.60 309548.20 94738.60
(11.00) (15.80) (4.80)
2000-01 245320.10 335412.10 90092.00
(11.30) (15.40) (14.10)
Note: Figures in bracket represent percentage to GDP at Current Market PricesGDP figures adopted from 1993-94 onwards are according to the new series, Earlier years are according to the 1980-81 seriesSource : Compiled at IIE
- S-9 -
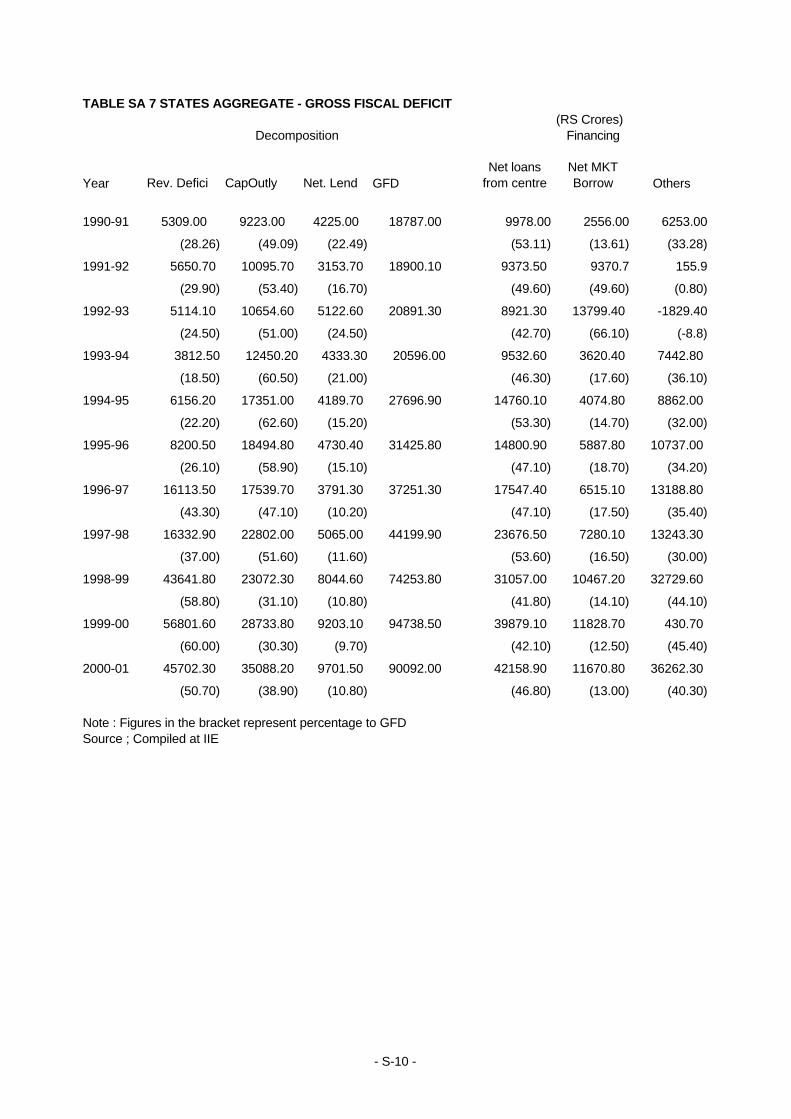
TABLE SA 7 STATES AGGREGATE - GROSS FISCAL DEFICIT(RS Crores)
Year Rev. Defici CapOutly Net. Lend GFDNet loans
from centreNet MKT Borrow Others
1990-91 5309.00 9223.00 4225.00 18787.00 9978.00 2556.00 6253.00
(28.26) (49.09) (22.49) (53.11) (13.61) (33.28)
1991-92 5650.70 10095.70 3153.70 18900.10 9373.50 9370.7 155.9
(29.90) (53.40) (16.70) (49.60) (49.60) (0.80)
1992-93 5114.10 10654.60 5122.60 20891.30 8921.30 13799.40 -1829.40
(24.50) (51.00) (24.50) (42.70) (66.10) (-8.8)
1993-94 3812.50 12450.20 4333.30 20596.00 9532.60 3620.40 7442.80
(18.50) (60.50) (21.00) (46.30) (17.60) (36.10)
1994-95 6156.20 17351.00 4189.70 27696.90 14760.10 4074.80 8862.00
(22.20) (62.60) (15.20) (53.30) (14.70) (32.00)
1995-96 8200.50 18494.80 4730.40 31425.80 14800.90 5887.80 10737.00
(26.10) (58.90) (15.10) (47.10) (18.70) (34.20)
1996-97 16113.50 17539.70 3791.30 37251.30 17547.40 6515.10 13188.80
(43.30) (47.10) (10.20) (47.10) (17.50) (35.40)
1997-98 16332.90 22802.00 5065.00 44199.90 23676.50 7280.10 13243.30
(37.00) (51.60) (11.60) (53.60) (16.50) (30.00)
1998-99 43641.80 23072.30 8044.60 74253.80 31057.00 10467.20 32729.60
(58.80) (31.10) (10.80) (41.80) (14.10) (44.10)
1999-00 56801.60 28733.80 9203.10 94738.50 39879.10 11828.70 430.70
(60.00) (30.30) (9.70) (42.10) (12.50) (45.40)
2000-01 45702.30 35088.20 9701.50 90092.00 42158.90 11670.80 36262.30
(50.70) (38.90) (10.80) (46.80) (13.00) (40.30)
Source ; Compiled at IIE
FinancingDecomposition
Note : Figures in the bracket represent percentage to GFD
- S-10 -
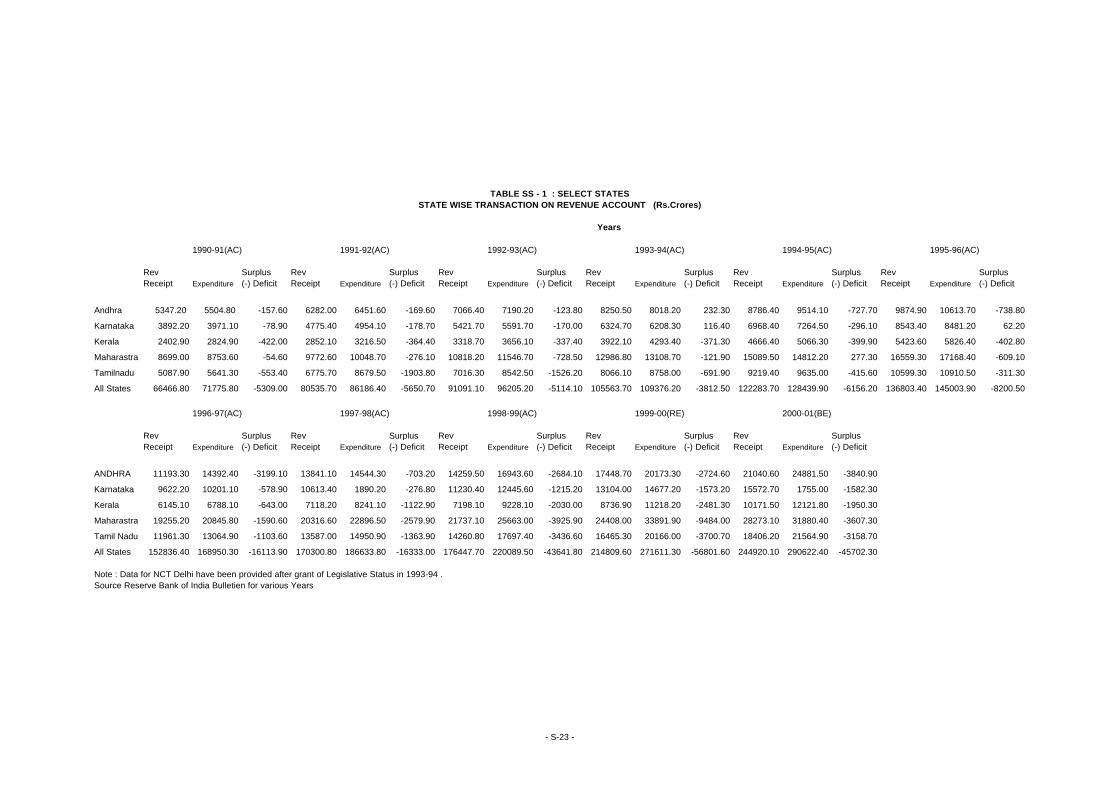
1990-91(AC) 1991-92(AC) 1992-93(AC) 1993-94(AC) 1994-95(AC) 1995-96(AC)
Rev Receipt Expenditure
Surplus (-) Deficit
Rev Receipt Expenditure
Surplus (-) Deficit
Rev Receipt Expenditure
Surplus (-) Deficit
Rev Receipt Expenditure
Surplus (-) Deficit
Rev Receipt Expenditure
Surplus (-) Deficit
Rev Receipt Expenditure
Surplus (-) Deficit
Andhra 5347.20 5504.80 -157.60 6282.00 6451.60 -169.60 7066.40 7190.20 -123.80 8250.50 8018.20 232.30 8786.40 9514.10 -727.70 9874.90 10613.70 -738.80
Karnataka 3892.20 3971.10 -78.90 4775.40 4954.10 -178.70 5421.70 5591.70 -170.00 6324.70 6208.30 116.40 6968.40 7264.50 -296.10 8543.40 8481.20 62.20
Kerala 2402.90 2824.90 -422.00 2852.10 3216.50 -364.40 3318.70 3656.10 -337.40 3922.10 4293.40 -371.30 4666.40 5066.30 -399.90 5423.60 5826.40 -402.80
Maharastra 8699.00 8753.60 -54.60 9772.60 10048.70 -276.10 10818.20 11546.70 -728.50 12986.80 13108.70 -121.90 15089.50 14812.20 277.30 16559.30 17168.40 -609.10
Tamilnadu 5087.90 5641.30 -553.40 6775.70 8679.50 -1903.80 7016.30 8542.50 -1526.20 8066.10 8758.00 -691.90 9219.40 9635.00 -415.60 10599.30 10910.50 -311.30
All States 66466.80 71775.80 -5309.00 80535.70 86186.40 -5650.70 91091.10 96205.20 -5114.10 105563.70 109376.20 -3812.50 122283.70 128439.90 -6156.20 136803.40 145003.90 -8200.50
1996-97(AC) 1997-98(AC) 1998-99(AC) 1999-00(RE) 2000-01(BE)
Rev Receipt Expenditure
Surplus (-) Deficit
Rev Receipt Expenditure
Surplus (-) Deficit
Rev Receipt Expenditure
Surplus (-) Deficit
Rev Receipt Expenditure
Surplus (-) Deficit
Rev Receipt Expenditure
Surplus (-) Deficit
ANDHRA 11193.30 14392.40 -3199.10 13841.10 14544.30 -703.20 14259.50 16943.60 -2684.10 17448.70 20173.30 -2724.60 21040.60 24881.50 -3840.90
Karnataka 9622.20 10201.10 -578.90 10613.40 1890.20 -276.80 11230.40 12445.60 -1215.20 13104.00 14677.20 -1573.20 15572.70 1755.00 -1582.30
Kerala 6145.10 6788.10 -643.00 7118.20 8241.10 -1122.90 7198.10 9228.10 -2030.00 8736.90 11218.20 -2481.30 10171.50 12121.80 -1950.30
Maharastra 19255.20 20845.80 -1590.60 20316.60 22896.50 -2579.90 21737.10 25663.00 -3925.90 24408.00 33891.90 -9484.00 28273.10 31880.40 -3607.30
Tamil Nadu 11961.30 13064.90 -1103.60 13587.00 14950.90 -1363.90 14260.80 17697.40 -3436.60 16465.30 20166.00 -3700.70 18406.20 21564.90 -3158.70
All States 152836.40 168950.30 -16113.90 170300.80 186633.80 -16333.00 176447.70 220089.50 -43641.80 214809.60 271611.30 -56801.60 244920.10 290622.40 -45702.30
Note : Data for NCT Delhi have been provided after grant of Legislative Status in 1993-94 .Source Reserve Bank of India Bulletien for various Years
Years
STATE WISE TRANSACTION ON REVENUE ACCOUNT (Rs.Crores)TABLE SS - 1 : SELECT STATES
- S-23 -
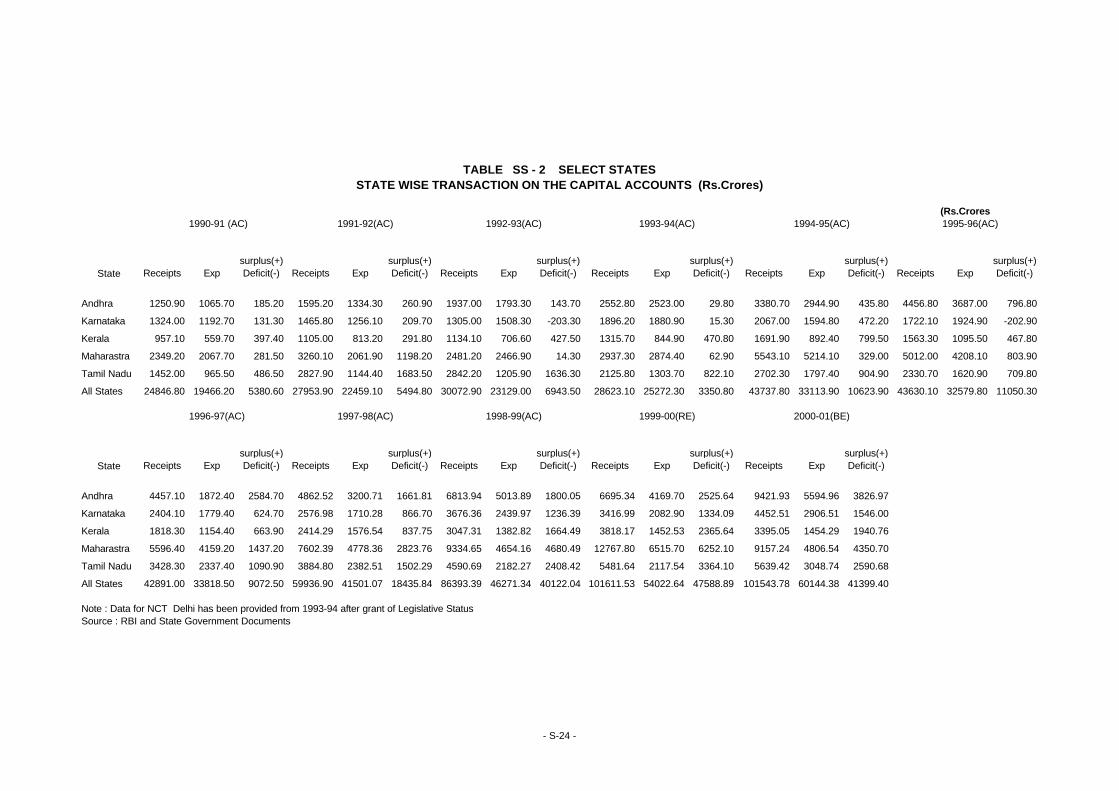
(Rs.Crores1990-91 (AC) 1991-92(AC) 1992-93(AC) 1993-94(AC) 1994-95(AC) 1995-96(AC)
State Receipts Expsurplus(+) Deficit(-) Receipts Exp
surplus(+) Deficit(-) Receipts Exp
surplus(+) Deficit(-) Receipts Exp
surplus(+) Deficit(-) Receipts Exp
surplus(+) Deficit(-) Receipts Exp
surplus(+) Deficit(-)
Andhra 1250.90 1065.70 185.20 1595.20 1334.30 260.90 1937.00 1793.30 143.70 2552.80 2523.00 29.80 3380.70 2944.90 435.80 4456.80 3687.00 796.80
Karnataka 1324.00 1192.70 131.30 1465.80 1256.10 209.70 1305.00 1508.30 -203.30 1896.20 1880.90 15.30 2067.00 1594.80 472.20 1722.10 1924.90 -202.90
Kerala 957.10 559.70 397.40 1105.00 813.20 291.80 1134.10 706.60 427.50 1315.70 844.90 470.80 1691.90 892.40 799.50 1563.30 1095.50 467.80
Maharastra 2349.20 2067.70 281.50 3260.10 2061.90 1198.20 2481.20 2466.90 14.30 2937.30 2874.40 62.90 5543.10 5214.10 329.00 5012.00 4208.10 803.90
Tamil Nadu 1452.00 965.50 486.50 2827.90 1144.40 1683.50 2842.20 1205.90 1636.30 2125.80 1303.70 822.10 2702.30 1797.40 904.90 2330.70 1620.90 709.80
All States 24846.80 19466.20 5380.60 27953.90 22459.10 5494.80 30072.90 23129.00 6943.50 28623.10 25272.30 3350.80 43737.80 33113.90 10623.90 43630.10 32579.80 11050.30
1996-97(AC) 1997-98(AC) 1998-99(AC) 1999-00(RE) 2000-01(BE)
State Receipts Expsurplus(+) Deficit(-) Receipts Exp
surplus(+) Deficit(-) Receipts Exp
surplus(+) Deficit(-) Receipts Exp
surplus(+) Deficit(-) Receipts Exp
surplus(+) Deficit(-)
Andhra 4457.10 1872.40 2584.70 4862.52 3200.71 1661.81 6813.94 5013.89 1800.05 6695.34 4169.70 2525.64 9421.93 5594.96 3826.97
Karnataka 2404.10 1779.40 624.70 2576.98 1710.28 866.70 3676.36 2439.97 1236.39 3416.99 2082.90 1334.09 4452.51 2906.51 1546.00
Kerala 1818.30 1154.40 663.90 2414.29 1576.54 837.75 3047.31 1382.82 1664.49 3818.17 1452.53 2365.64 3395.05 1454.29 1940.76
Maharastra 5596.40 4159.20 1437.20 7602.39 4778.36 2823.76 9334.65 4654.16 4680.49 12767.80 6515.70 6252.10 9157.24 4806.54 4350.70
Tamil Nadu 3428.30 2337.40 1090.90 3884.80 2382.51 1502.29 4590.69 2182.27 2408.42 5481.64 2117.54 3364.10 5639.42 3048.74 2590.68
All States 42891.00 33818.50 9072.50 59936.90 41501.07 18435.84 86393.39 46271.34 40122.04 101611.53 54022.64 47588.89 101543.78 60144.38 41399.40
Note : Data for NCT Delhi has been provided from 1993-94 after grant of Legislative StatusSource : RBI and State Government Documents
STATE WISE TRANSACTION ON THE CAPITAL ACCOUNTS (Rs.Crores)TABLE SS - 2 SELECT STATES
- S-24 -
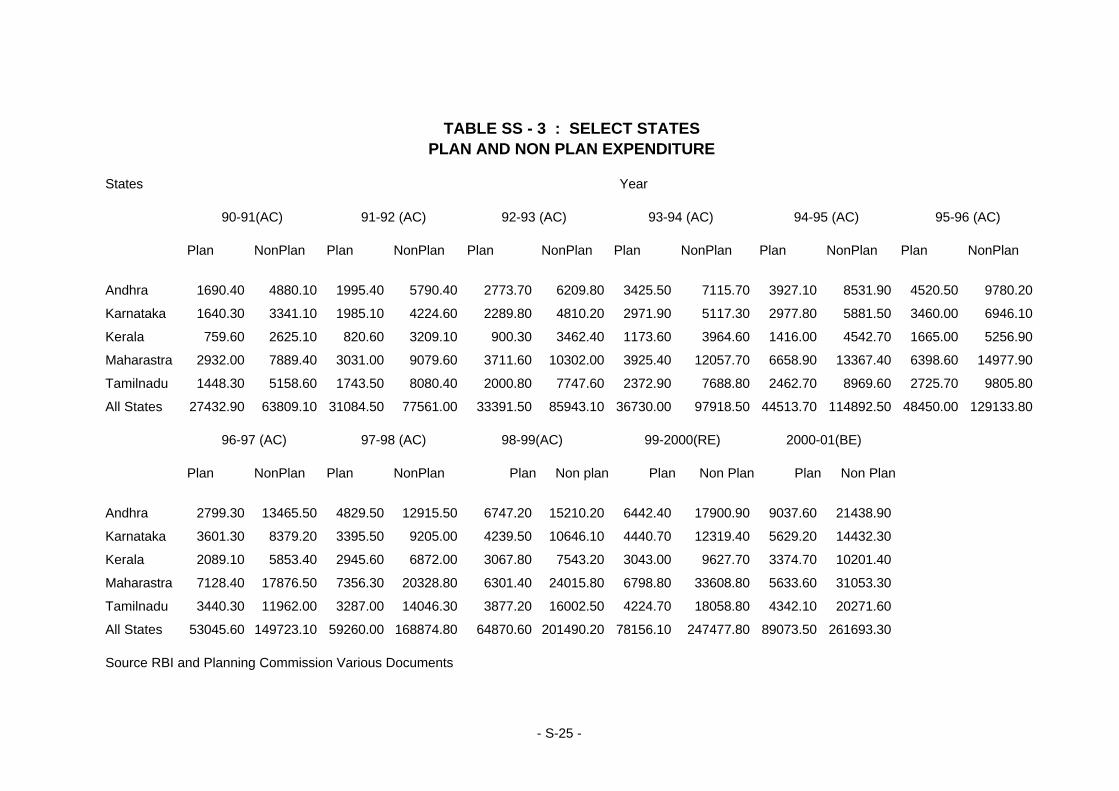
States
90-91(AC) 91-92 (AC) 92-93 (AC) 93-94 (AC) 94-95 (AC) 95-96 (AC)
Plan NonPlan Plan NonPlan Plan NonPlan Plan NonPlan Plan NonPlan Plan NonPlan
Andhra 1690.40 4880.10 1995.40 5790.40 2773.70 6209.80 3425.50 7115.70 3927.10 8531.90 4520.50 9780.20
Karnataka 1640.30 3341.10 1985.10 4224.60 2289.80 4810.20 2971.90 5117.30 2977.80 5881.50 3460.00 6946.10
Kerala 759.60 2625.10 820.60 3209.10 900.30 3462.40 1173.60 3964.60 1416.00 4542.70 1665.00 5256.90
Maharastra 2932.00 7889.40 3031.00 9079.60 3711.60 10302.00 3925.40 12057.70 6658.90 13367.40 6398.60 14977.90
Tamilnadu 1448.30 5158.60 1743.50 8080.40 2000.80 7747.60 2372.90 7688.80 2462.70 8969.60 2725.70 9805.80
All States 27432.90 63809.10 31084.50 77561.00 33391.50 85943.10 36730.00 97918.50 44513.70 114892.50 48450.00 129133.80
96-97 (AC) 97-98 (AC) 98-99(AC) 99-2000(RE) 2000-01(BE)
Plan NonPlan Plan NonPlan Plan Non plan Plan Non Plan Plan Non Plan
Andhra 2799.30 13465.50 4829.50 12915.50 6747.20 15210.20 6442.40 17900.90 9037.60 21438.90
Karnataka 3601.30 8379.20 3395.50 9205.00 4239.50 10646.10 4440.70 12319.40 5629.20 14432.30
Kerala 2089.10 5853.40 2945.60 6872.00 3067.80 7543.20 3043.00 9627.70 3374.70 10201.40
Maharastra 7128.40 17876.50 7356.30 20328.80 6301.40 24015.80 6798.80 33608.80 5633.60 31053.30
Tamilnadu 3440.30 11962.00 3287.00 14046.30 3877.20 16002.50 4224.70 18058.80 4342.10 20271.60
All States 53045.60 149723.10 59260.00 168874.80 64870.60 201490.20 78156.10 247477.80 89073.50 261693.30
Source RBI and Planning Commission Various Documents
PLAN AND NON PLAN EXPENDITURETABLE SS - 3 : SELECT STATES
Year
- S-25 -

(Rs in Crores)
States
90-91(AC) 91-92(AC) 92-93(AC) 93-94 (Ac) 94-95(AC) 95-96(AC) 96-97(AC) 97-98(AC) 98-99(AC) 99-00(RE) 00-01(BE)
Andhra 4784.40 5609.40 6499.20 7610.50 8916.90 10163.70 11127.40 12304.60 14515.50 16065.10 20712.30
(15.50) (17.20) (15.86) (17.10) (17.20) (13.98) (9.48) (10.60) (18.00) (10.70) (28.90)
Karnataka 3533.70 4505.40 5017.10 5804.50 6193.00 7350.10 8399.30 8394.60 9980.80 10532.80 13159.00
(16.40) (27.50) (11.36) (15.70) (6.70) (18.68) (14.28) (-0.1) (18.90) (5.50) (24.90)
Kerala 2187.70 2421.80 2682.20 3167.70 3731.50 4314.80 4973.50 6293.30 6626.20 7663.60 8133.40
(19.80) (10.70) (10.75) (18.10) (17.80) (15.63) (15.26) (26.50) (5.30) (15.70) (6.10)
Maharastra 7732.50 8408.90 9778.70 11289.30 14562.80 15263.70 17627.60 18952.40 18664.50 25167.20 18654.80
(9.00) (8.70) (16.29) (15.40) (29.00) (4.81) (15.49) (7.50) (-1.5) (34.80) (-25.9)
Tamilnadu 4737.90 7421.80 7132.90 7117.50 8135.60 8559.40 10559.50 11309.90 12274.70 12938.90 14669.70
(15.40) (56.60) (-3.89) (-0.2) (14.30) (5.21) (23.37) (7.10) (8.50) (5.40) (13.40)
All States 63369.90 74587.70 80566.90 89387.60 104347.80 114819.40 132007.70 145268.40 164503.50 198321.80 208332.40
(19.20) (17.70) (8.02) (10.90) (16.70) (10.04) (14.97) (10.00) (13.20) (20.60) (5.00)
Note: (1) NA denotes Not Available
(2) Figures in brackets are percentage variation over previous year
Source: Reserve Bank of India, Finances of the State Government various years' issues.
STATEWISE DEVELOPMENT EXPENDITUTE TABLE SS - 4 : SELECT STATES
Year
- S-26 -
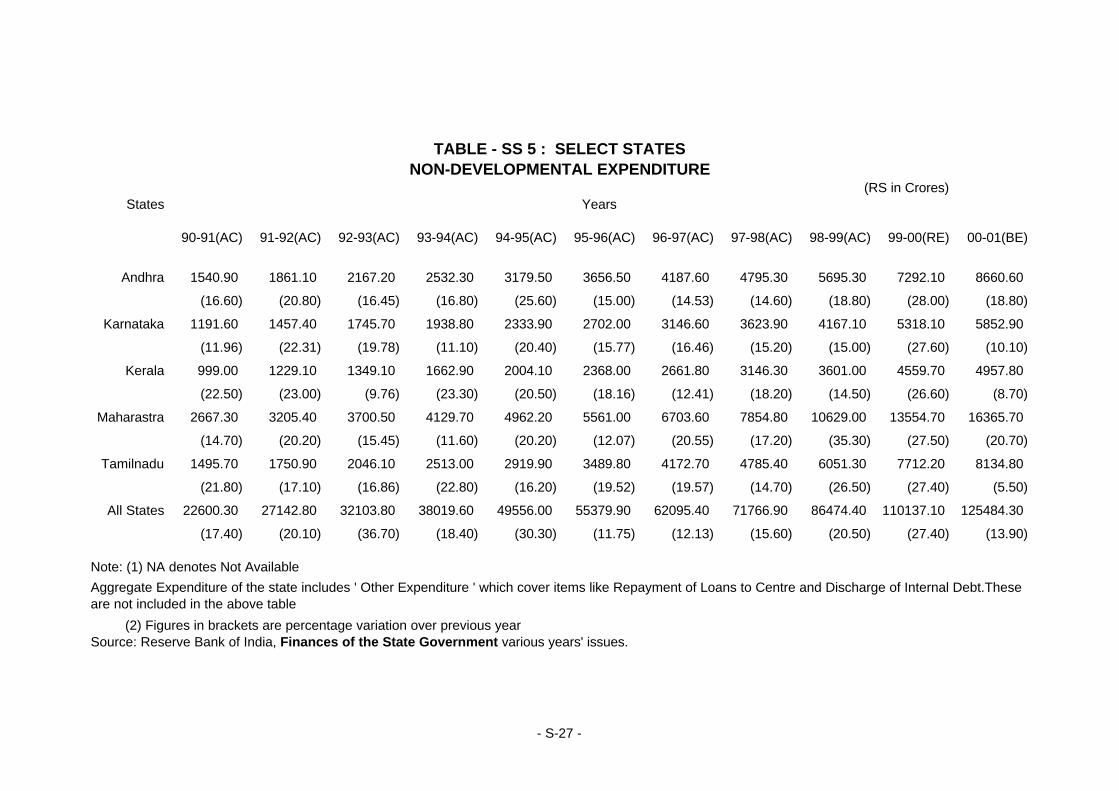
(RS in Crores)States
90-91(AC) 91-92(AC) 92-93(AC) 93-94(AC) 94-95(AC) 95-96(AC) 96-97(AC) 97-98(AC) 98-99(AC) 99-00(RE) 00-01(BE)
Andhra 1540.90 1861.10 2167.20 2532.30 3179.50 3656.50 4187.60 4795.30 5695.30 7292.10 8660.60
(16.60) (20.80) (16.45) (16.80) (25.60) (15.00) (14.53) (14.60) (18.80) (28.00) (18.80)
Karnataka 1191.60 1457.40 1745.70 1938.80 2333.90 2702.00 3146.60 3623.90 4167.10 5318.10 5852.90
(11.96) (22.31) (19.78) (11.10) (20.40) (15.77) (16.46) (15.20) (15.00) (27.60) (10.10)
Kerala 999.00 1229.10 1349.10 1662.90 2004.10 2368.00 2661.80 3146.30 3601.00 4559.70 4957.80
(22.50) (23.00) (9.76) (23.30) (20.50) (18.16) (12.41) (18.20) (14.50) (26.60) (8.70)
Maharastra 2667.30 3205.40 3700.50 4129.70 4962.20 5561.00 6703.60 7854.80 10629.00 13554.70 16365.70
(14.70) (20.20) (15.45) (11.60) (20.20) (12.07) (20.55) (17.20) (35.30) (27.50) (20.70)
Tamilnadu 1495.70 1750.90 2046.10 2513.00 2919.90 3489.80 4172.70 4785.40 6051.30 7712.20 8134.80
(21.80) (17.10) (16.86) (22.80) (16.20) (19.52) (19.57) (14.70) (26.50) (27.40) (5.50)
All States 22600.30 27142.80 32103.80 38019.60 49556.00 55379.90 62095.40 71766.90 86474.40 110137.10 125484.30
(17.40) (20.10) (36.70) (18.40) (30.30) (11.75) (12.13) (15.60) (20.50) (27.40) (13.90)
Note: (1) NA denotes Not Available
(2) Figures in brackets are percentage variation over previous yearSource: Reserve Bank of India, Finances of the State Government various years' issues.
TABLE - SS 5 : SELECT STATESNON-DEVELOPMENTAL EXPENDITURE
Aggregate Expenditure of the state includes ' Other Expenditure ' which cover items like Repayment of Loans to Centre and Discharge of Internal Debt.These are not included in the above table
Years
- S-27 -

(Rs in Crores)
States 90-91(AC) 91-92(AC) 92-93(AC) 93-94(AC) 94-95(AC) 95-96(AC) 96-97(AC) 97-98(AC) 98-99(AC) 99-00(RE) 00-01(BE)
Andhra 2714.10 3159.00 3614.60 4566.90 4544.80 5776.60 6323.10 6993.40 7473.20 9447.40 11029.90
(41.30) (40.60) (40.20) (26.30) (-0.5) (27.10) (38.90) (10.60) (6.90) (26.40) (16.80)
Karnataka 1502.60 1782.00 2191.00 2467.60 3052.70 2841.70 3577.30 4070.30 4369.50 4864.50 4688.30
(30.20) (28.70) (30.90) (12.60) (23.70) (-6.9) (29.90) (13.80) (7.40) (-0.5) (30.70)
Kerala 1262.20 1518.50 1681.90 1849.80 2220.40 2160.80 2272.70 2632.20 2860.50 3877.70 4257.00
(37.30) (37.70) (38.60) (10.00) (20.00) (-2.7) (28.60) (15.80) (8.70) (35.60) (9.80)
Maharastra 3081.10 3564.80 3538.90 4377.60 4208.60 4750.70 6789.70 6741.00 8678.60 9635.20 9638.80
(28.50) (29.40) (25.30) (23.70) (-3.9) (12.90) (27.20) (-0.7) (28.70) (11.00) 0.00
Tamilnadu 2329.90 2782.60 3125.80 3648.70 4115.30 3578.00 4399.10 5214.30 5113.10 6154.80 6741.90
(35.30) (28.30) (33.00) (13.50) (12.80) (-13.1) (28.60) (18.50) (-1.9) (20.50) (9.50)
All States 40859.10 45142.60 51438.50 57980.50 64141.60 69643.00 81973.90 95404.80 103626.60 129065.50 139661.10
(44.80) (41.60) (43.10) (12.70) (10.60) (8.60) (40.40) (16.40) (8.60) (24.50) (8.20)
Note : Figures in brackets are percentage vaeiation over the previous yearSource : Reports of Finance Commission , RBI and State Governments
GROSS DEVOLUTION & TRANSFER OF RESOURCESFROM THE CENTRE
TABLE SS - 6: SELECT STATES
- S-28 -
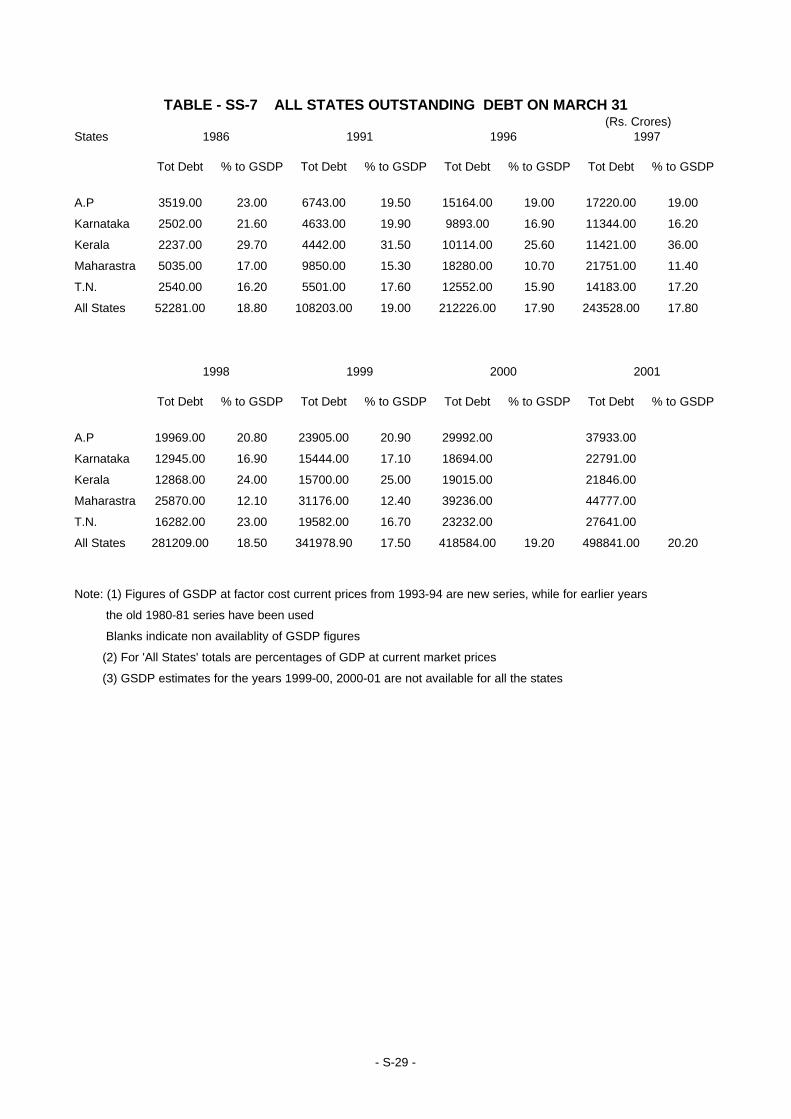
(Rs. Crores)States
Tot Debt % to GSDP Tot Debt % to GSDP Tot Debt % to GSDP Tot Debt % to GSDP
A.P 3519.00 23.00 6743.00 19.50 15164.00 19.00 17220.00 19.00
Karnataka 2502.00 21.60 4633.00 19.90 9893.00 16.90 11344.00 16.20
Kerala 2237.00 29.70 4442.00 31.50 10114.00 25.60 11421.00 36.00
Maharastra 5035.00 17.00 9850.00 15.30 18280.00 10.70 21751.00 11.40
T.N. 2540.00 16.20 5501.00 17.60 12552.00 15.90 14183.00 17.20
All States 52281.00 18.80 108203.00 19.00 212226.00 17.90 243528.00 17.80
Tot Debt % to GSDP Tot Debt % to GSDP Tot Debt % to GSDP Tot Debt % to GSDP
A.P 19969.00 20.80 23905.00 20.90 29992.00 37933.00
Karnataka 12945.00 16.90 15444.00 17.10 18694.00 22791.00
Kerala 12868.00 24.00 15700.00 25.00 19015.00 21846.00
Maharastra 25870.00 12.10 31176.00 12.40 39236.00 44777.00
T.N. 16282.00 23.00 19582.00 16.70 23232.00 27641.00
All States 281209.00 18.50 341978.90 17.50 418584.00 19.20 498841.00 20.20
Note: (1) Figures of GSDP at factor cost current prices from 1993-94 are new series, while for earlier years
the old 1980-81 series have been used
Blanks indicate non availablity of GSDP figures
(2) For 'All States' totals are percentages of GDP at current market prices
(3) GSDP estimates for the years 1999-00, 2000-01 are not available for all the states
TABLE - SS-7 ALL STATES OUTSTANDING DEBT ON MARCH 31
1986 1991 1996 1997
1998 1999 2000 2001
- S-29 -
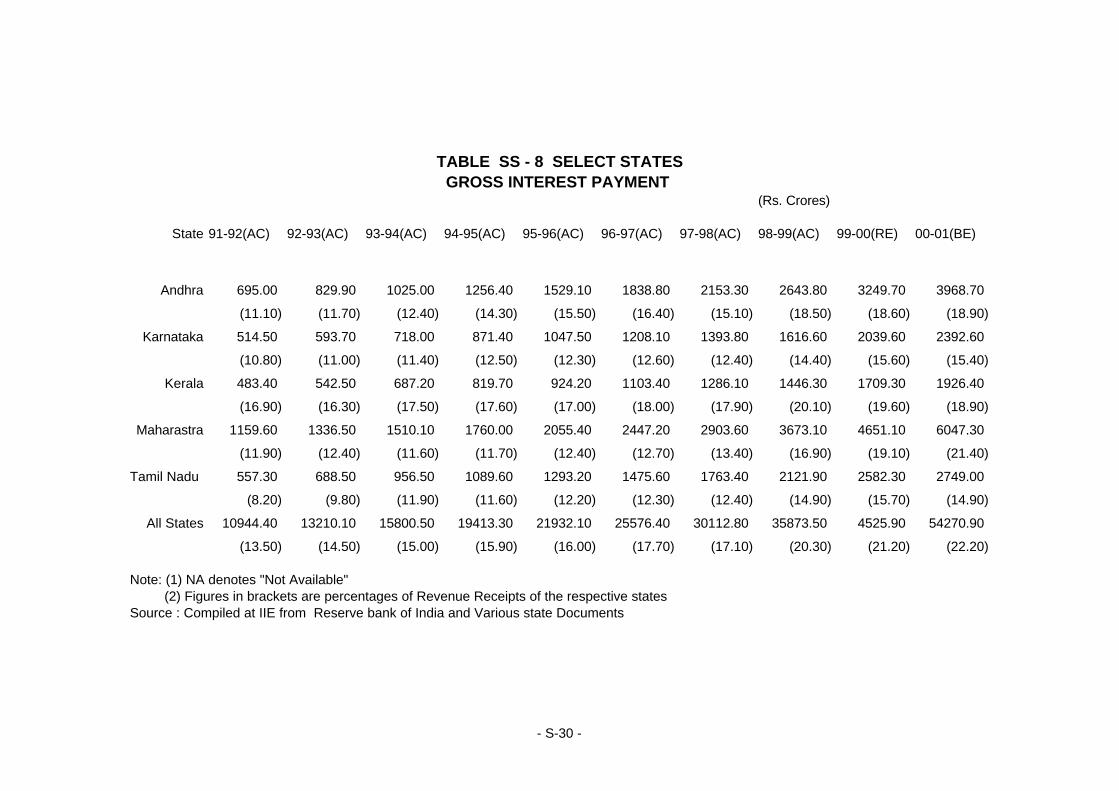
(Rs. Crores)
State 91-92(AC) 92-93(AC) 93-94(AC) 94-95(AC) 95-96(AC) 96-97(AC) 97-98(AC) 98-99(AC) 99-00(RE) 00-01(BE)
Andhra 695.00 829.90 1025.00 1256.40 1529.10 1838.80 2153.30 2643.80 3249.70 3968.70
(11.10) (11.70) (12.40) (14.30) (15.50) (16.40) (15.10) (18.50) (18.60) (18.90)
Karnataka 514.50 593.70 718.00 871.40 1047.50 1208.10 1393.80 1616.60 2039.60 2392.60
(10.80) (11.00) (11.40) (12.50) (12.30) (12.60) (12.40) (14.40) (15.60) (15.40)
Kerala 483.40 542.50 687.20 819.70 924.20 1103.40 1286.10 1446.30 1709.30 1926.40
(16.90) (16.30) (17.50) (17.60) (17.00) (18.00) (17.90) (20.10) (19.60) (18.90)
Maharastra 1159.60 1336.50 1510.10 1760.00 2055.40 2447.20 2903.60 3673.10 4651.10 6047.30
(11.90) (12.40) (11.60) (11.70) (12.40) (12.70) (13.40) (16.90) (19.10) (21.40)
Tamil Nadu 557.30 688.50 956.50 1089.60 1293.20 1475.60 1763.40 2121.90 2582.30 2749.00
(8.20) (9.80) (11.90) (11.60) (12.20) (12.30) (12.40) (14.90) (15.70) (14.90)
All States 10944.40 13210.10 15800.50 19413.30 21932.10 25576.40 30112.80 35873.50 4525.90 54270.90
(13.50) (14.50) (15.00) (15.90) (16.00) (17.70) (17.10) (20.30) (21.20) (22.20)
Note: (1) NA denotes "Not Available" (2) Figures in brackets are percentages of Revenue Receipts of the respective statesSource : Compiled at IIE from Reserve bank of India and Various state Documents
GROSS INTEREST PAYMENT TABLE SS - 8 SELECT STATES
- S-30 -
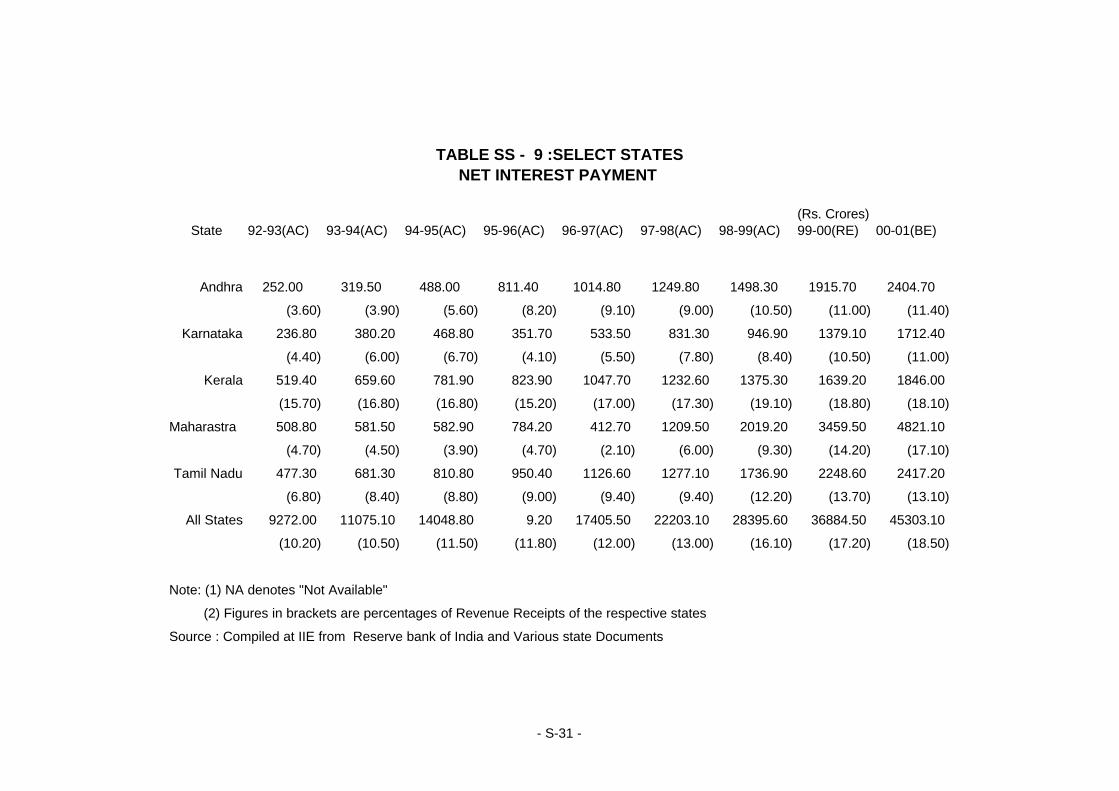
(Rs. Crores)State 92-93(AC) 93-94(AC) 94-95(AC) 95-96(AC) 96-97(AC) 97-98(AC) 98-99(AC) 99-00(RE) 00-01(BE)
Andhra 252.00 319.50 488.00 811.40 1014.80 1249.80 1498.30 1915.70 2404.70
(3.60) (3.90) (5.60) (8.20) (9.10) (9.00) (10.50) (11.00) (11.40)
Karnataka 236.80 380.20 468.80 351.70 533.50 831.30 946.90 1379.10 1712.40
(4.40) (6.00) (6.70) (4.10) (5.50) (7.80) (8.40) (10.50) (11.00)
Kerala 519.40 659.60 781.90 823.90 1047.70 1232.60 1375.30 1639.20 1846.00
(15.70) (16.80) (16.80) (15.20) (17.00) (17.30) (19.10) (18.80) (18.10)
Maharastra 508.80 581.50 582.90 784.20 412.70 1209.50 2019.20 3459.50 4821.10
(4.70) (4.50) (3.90) (4.70) (2.10) (6.00) (9.30) (14.20) (17.10)
Tamil Nadu 477.30 681.30 810.80 950.40 1126.60 1277.10 1736.90 2248.60 2417.20
(6.80) (8.40) (8.80) (9.00) (9.40) (9.40) (12.20) (13.70) (13.10)
All States 9272.00 11075.10 14048.80 9.20 17405.50 22203.10 28395.60 36884.50 45303.10
(10.20) (10.50) (11.50) (11.80) (12.00) (13.00) (16.10) (17.20) (18.50)
Note: (1) NA denotes "Not Available"
(2) Figures in brackets are percentages of Revenue Receipts of the respective states
Source : Compiled at IIE from Reserve bank of India and Various state Documents
TABLE SS - 9 :SELECT STATESNET INTEREST PAYMENT
- S-31 -
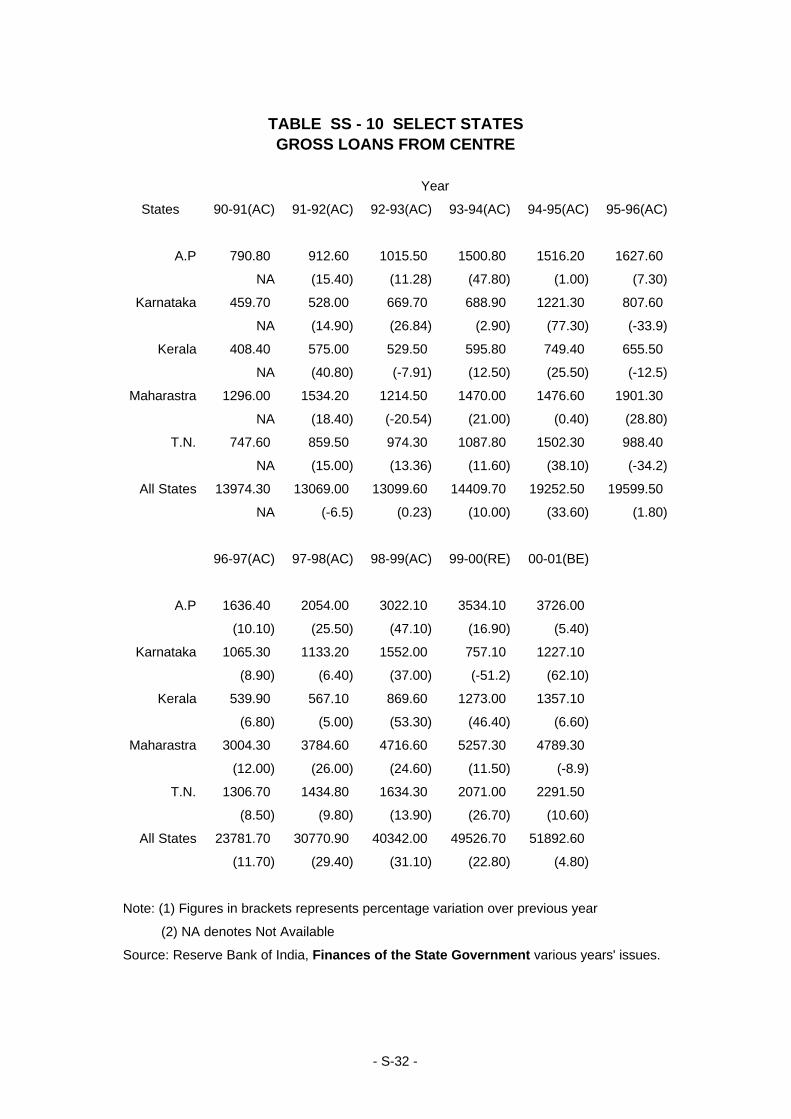
States 90-91(AC) 91-92(AC) 92-93(AC) 93-94(AC) 94-95(AC) 95-96(AC)
A.P 790.80 912.60 1015.50 1500.80 1516.20 1627.60
NA (15.40) (11.28) (47.80) (1.00) (7.30)
Karnataka 459.70 528.00 669.70 688.90 1221.30 807.60
NA (14.90) (26.84) (2.90) (77.30) (-33.9)
Kerala 408.40 575.00 529.50 595.80 749.40 655.50
NA (40.80) (-7.91) (12.50) (25.50) (-12.5)
Maharastra 1296.00 1534.20 1214.50 1470.00 1476.60 1901.30
NA (18.40) (-20.54) (21.00) (0.40) (28.80)
T.N. 747.60 859.50 974.30 1087.80 1502.30 988.40
NA (15.00) (13.36) (11.60) (38.10) (-34.2)
All States 13974.30 13069.00 13099.60 14409.70 19252.50 19599.50
NA (-6.5) (0.23) (10.00) (33.60) (1.80)
96-97(AC) 97-98(AC) 98-99(AC) 99-00(RE) 00-01(BE)
A.P 1636.40 2054.00 3022.10 3534.10 3726.00
(10.10) (25.50) (47.10) (16.90) (5.40)
Karnataka 1065.30 1133.20 1552.00 757.10 1227.10
(8.90) (6.40) (37.00) (-51.2) (62.10)
Kerala 539.90 567.10 869.60 1273.00 1357.10
(6.80) (5.00) (53.30) (46.40) (6.60)
Maharastra 3004.30 3784.60 4716.60 5257.30 4789.30
(12.00) (26.00) (24.60) (11.50) (-8.9)
T.N. 1306.70 1434.80 1634.30 2071.00 2291.50
(8.50) (9.80) (13.90) (26.70) (10.60)
All States 23781.70 30770.90 40342.00 49526.70 51892.60
(11.70) (29.40) (31.10) (22.80) (4.80)
Note: (1) Figures in brackets represents percentage variation over previous year
(2) NA denotes Not Available
Source: Reserve Bank of India, Finances of the State Government various years' issues.
TABLE SS - 10 SELECT STATESGROSS LOANS FROM CENTRE
Year
- S-32 -
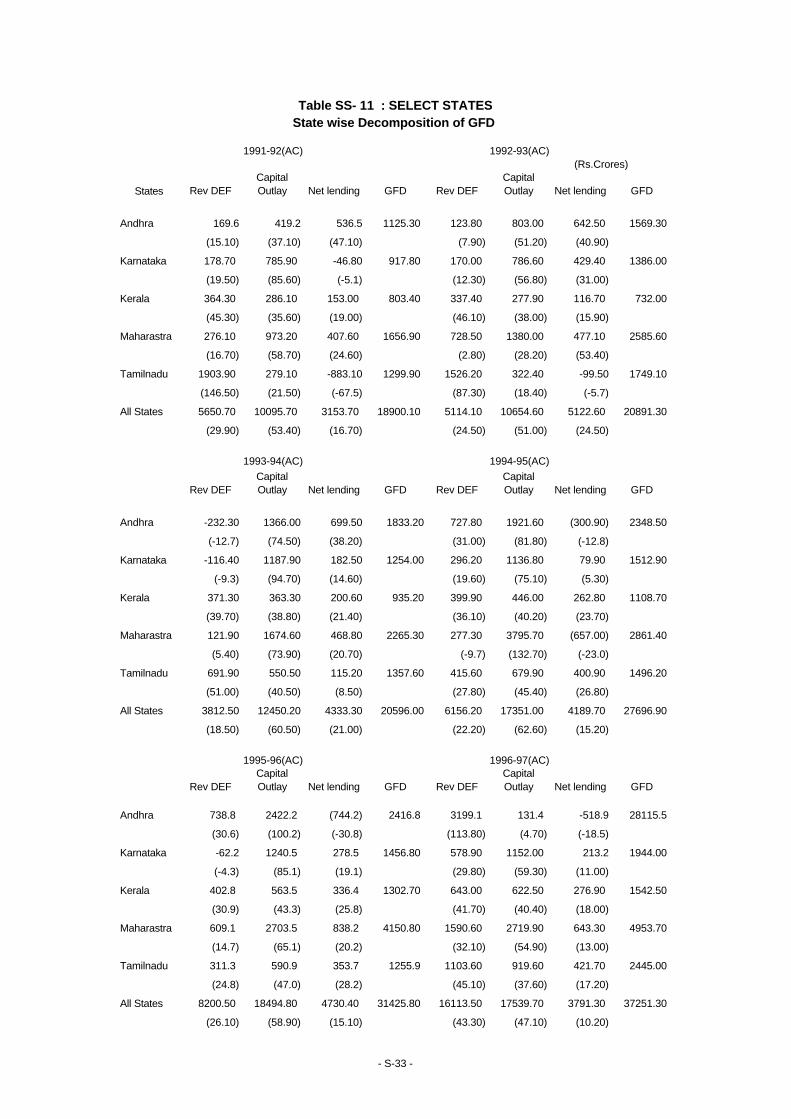
1991-92(AC) 1992-93(AC) (Rs.Crores)
States Rev DEFCapital Outlay Net lending GFD Rev DEF
Capital Outlay Net lending GFD
Andhra 169.6 419.2 536.5 1125.30 123.80 803.00 642.50 1569.30
(15.10) (37.10) (47.10) (7.90) (51.20) (40.90)
Karnataka 178.70 785.90 -46.80 917.80 170.00 786.60 429.40 1386.00
(19.50) (85.60) (-5.1) (12.30) (56.80) (31.00)
Kerala 364.30 286.10 153.00 803.40 337.40 277.90 116.70 732.00
(45.30) (35.60) (19.00) (46.10) (38.00) (15.90)
Maharastra 276.10 973.20 407.60 1656.90 728.50 1380.00 477.10 2585.60
(16.70) (58.70) (24.60) (2.80) (28.20) (53.40)
Tamilnadu 1903.90 279.10 -883.10 1299.90 1526.20 322.40 -99.50 1749.10
(146.50) (21.50) (-67.5) (87.30) (18.40) (-5.7)
All States 5650.70 10095.70 3153.70 18900.10 5114.10 10654.60 5122.60 20891.30
(29.90) (53.40) (16.70) (24.50) (51.00) (24.50)
1993-94(AC) 1994-95(AC)
Rev DEFCapital Outlay Net lending GFD Rev DEF
Capital Outlay Net lending GFD
Andhra -232.30 1366.00 699.50 1833.20 727.80 1921.60 (300.90) 2348.50
(-12.7) (74.50) (38.20) (31.00) (81.80) (-12.8)
Karnataka -116.40 1187.90 182.50 1254.00 296.20 1136.80 79.90 1512.90
(-9.3) (94.70) (14.60) (19.60) (75.10) (5.30)
Kerala 371.30 363.30 200.60 935.20 399.90 446.00 262.80 1108.70
(39.70) (38.80) (21.40) (36.10) (40.20) (23.70)
Maharastra 121.90 1674.60 468.80 2265.30 277.30 3795.70 (657.00) 2861.40
(5.40) (73.90) (20.70) (-9.7) (132.70) (-23.0)
Tamilnadu 691.90 550.50 115.20 1357.60 415.60 679.90 400.90 1496.20
(51.00) (40.50) (8.50) (27.80) (45.40) (26.80)
All States 3812.50 12450.20 4333.30 20596.00 6156.20 17351.00 4189.70 27696.90
(18.50) (60.50) (21.00) (22.20) (62.60) (15.20)
1995-96(AC) 1996-97(AC)
Rev DEFCapital Outlay Net lending GFD Rev DEF
Capital Outlay Net lending GFD
Andhra 738.8 2422.2 (744.2) 2416.8 3199.1 131.4 -518.9 28115.5
(30.6) (100.2) (-30.8) (113.80) (4.70) (-18.5)
Karnataka -62.2 1240.5 278.5 1456.80 578.90 1152.00 213.2 1944.00
(-4.3) (85.1) (19.1) (29.80) (59.30) (11.00)
Kerala 402.8 563.5 336.4 1302.70 643.00 622.50 276.90 1542.50
(30.9) (43.3) (25.8) (41.70) (40.40) (18.00)
Maharastra 609.1 2703.5 838.2 4150.80 1590.60 2719.90 643.30 4953.70
(14.7) (65.1) (20.2) (32.10) (54.90) (13.00)
Tamilnadu 311.3 590.9 353.7 1255.9 1103.60 919.60 421.70 2445.00
(24.8) (47.0) (28.2) (45.10) (37.60) (17.20)
All States 8200.50 18494.80 4730.40 31425.80 16113.50 17539.70 3791.30 37251.30
(26.10) (58.90) (15.10) (43.30) (47.10) (10.20)
Table SS- 11 : SELECT STATESState wise Decomposition of GFD
- S-33 -

1997-98(AC) 1998-99(AC)
(Rs.Crores)
Rev DEFCapital Outlay Net lending GFD Rev DEF
Capital Outlay Net lending GFD
Andhra 703.20 1086.00 638.60 2437.80 2684.10 1385.20 1636.30 5705.60
(29.00) (44.70) (26.30) (47.00) (24.30) (28.70)
Karnataka 276.80 1210.00 123.10 1609.80 1215.20 1744.20 152.70 3112.10
(17.20) (75.20) (7.60) (39.00) (56.00) (4.90)
Kerala 1122.90 738.90 552.10 2413.90 2030.00 651.60 330.60 3012.20
(46.50) (30.60) (22.90) (67.40) (21.60) (11.00)
Maharastra 2579.90 3211.80 650.50 187.50 3925.90 3192.50 343.90 74624.40
(40.00) (49.90) (10.10) (52.60) (42.80) (4.60)
Tamilnadu 1363.90 1467.80 (710.00) 2121.70 3436.60 1153.30 187.20 4777.10
(64.30) (69.20) (-33.5) (71.90) (24.10) (3.90)
All States 16332.90 22802.00 5065.00 44199.90 43641.80 23072.30 8044.60 74253.80
(37.00) (51.60) (11.60) (58.80) (31.10) (10.80)
1999-2000(RE) 2000-2001(BE)
(Rs.Crores)
Rev DEFCapital Outlay Net lending GFD Rev DEF
Capital Outlay Net lending GFD
Andhra 2724.60 2420.60 847.90 5993.10 3840.90 3417.70 1201.00 8459.60
(45.50) (40.40) (14.10) (45.40) (40.40) (14.20)
Karnataka 1573.20 1388.50 59.00 3020.70 1582.30 1974.50 254.90 3811.70
(52.10) (46.00) (2.00) (41.50) (51.80) (6.70)
Kerala 2481.30 765.40 263.60 3510..3 1950.30 758.50 214.40 2923.20
(70.70) (21.80) (7.50) (66.70) (25.90) (7.30)
Maharastra 9484.00 3977.10 452.20 13913.30 3607.30 3071.30 351.20 7029.80
(68.20) (28.60) (3.30) (51.30) (43.70) (5.00)
Tamilnadu 3700.70 835.90 439.30 4975.00 3158.70 2006.00 117.90 5282.60
(74.40) (16.80) (8.80) (59.80) (38.00) (2.20)
All States 56801.60 28733.80 9203.10 94738.50 45702.30 35088.20 9701.50 90092.00
(60.00) (30.30) (9.70) (50.70) (38.90) (10.80)
Note : Figures in Brackets denote Percentage to GFD
Source : Reserve bank of India , Various state Documents
Table SS- 11 : SELECT STATESState wise Decomposition of GFD
- S-33 -
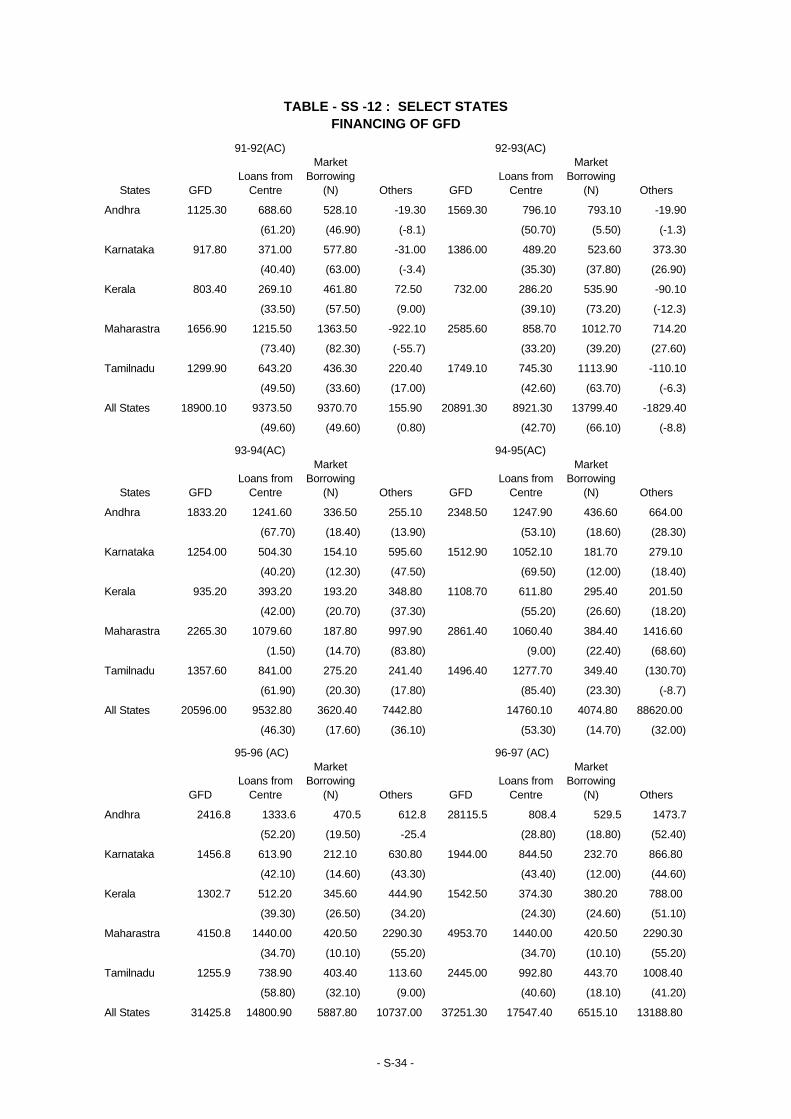
91-92(AC) 92-93(AC)
States GFDLoans from
Centre
Market Borrowing
(N) Others GFDLoans from
Centre
Market Borrowing
(N) Others
Andhra 1125.30 688.60 528.10 -19.30 1569.30 796.10 793.10 -19.90
(61.20) (46.90) (-8.1) (50.70) (5.50) (-1.3)
Karnataka 917.80 371.00 577.80 -31.00 1386.00 489.20 523.60 373.30
(40.40) (63.00) (-3.4) (35.30) (37.80) (26.90)
Kerala 803.40 269.10 461.80 72.50 732.00 286.20 535.90 -90.10
(33.50) (57.50) (9.00) (39.10) (73.20) (-12.3)
Maharastra 1656.90 1215.50 1363.50 -922.10 2585.60 858.70 1012.70 714.20
(73.40) (82.30) (-55.7) (33.20) (39.20) (27.60)
Tamilnadu 1299.90 643.20 436.30 220.40 1749.10 745.30 1113.90 -110.10
(49.50) (33.60) (17.00) (42.60) (63.70) (-6.3)
All States 18900.10 9373.50 9370.70 155.90 20891.30 8921.30 13799.40 -1829.40
(49.60) (49.60) (0.80) (42.70) (66.10) (-8.8)
93-94(AC) 94-95(AC)
States GFDLoans from
Centre
Market Borrowing
(N) Others GFDLoans from
Centre
Market Borrowing
(N) Others
Andhra 1833.20 1241.60 336.50 255.10 2348.50 1247.90 436.60 664.00
(67.70) (18.40) (13.90) (53.10) (18.60) (28.30)
Karnataka 1254.00 504.30 154.10 595.60 1512.90 1052.10 181.70 279.10
(40.20) (12.30) (47.50) (69.50) (12.00) (18.40)
Kerala 935.20 393.20 193.20 348.80 1108.70 611.80 295.40 201.50
(42.00) (20.70) (37.30) (55.20) (26.60) (18.20)
Maharastra 2265.30 1079.60 187.80 997.90 2861.40 1060.40 384.40 1416.60
(1.50) (14.70) (83.80) (9.00) (22.40) (68.60)
Tamilnadu 1357.60 841.00 275.20 241.40 1496.40 1277.70 349.40 (130.70)
(61.90) (20.30) (17.80) (85.40) (23.30) (-8.7)
All States 20596.00 9532.80 3620.40 7442.80 14760.10 4074.80 88620.00
(46.30) (17.60) (36.10) (53.30) (14.70) (32.00)
95-96 (AC) 96-97 (AC)
GFDLoans from
Centre
Market Borrowing
(N) Others GFDLoans from
Centre
Market Borrowing
(N) Others
Andhra 2416.8 1333.6 470.5 612.8 28115.5 808.4 529.5 1473.7
(52.20) (19.50) -25.4 (28.80) (18.80) (52.40)
Karnataka 1456.8 613.90 212.10 630.80 1944.00 844.50 232.70 866.80
(42.10) (14.60) (43.30) (43.40) (12.00) (44.60)
Kerala 1302.7 512.20 345.60 444.90 1542.50 374.30 380.20 788.00
(39.30) (26.50) (34.20) (24.30) (24.60) (51.10)
Maharastra 4150.8 1440.00 420.50 2290.30 4953.70 1440.00 420.50 2290.30
(34.70) (10.10) (55.20) (34.70) (10.10) (55.20)
Tamilnadu 1255.9 738.90 403.40 113.60 2445.00 992.80 443.70 1008.40
(58.80) (32.10) (9.00) (40.60) (18.10) (41.20)
All States 31425.8 14800.90 5887.80 10737.00 37251.30 17547.40 6515.10 13188.80
TABLE - SS -12 : SELECT STATESFINANCING OF GFD
- S-34 -
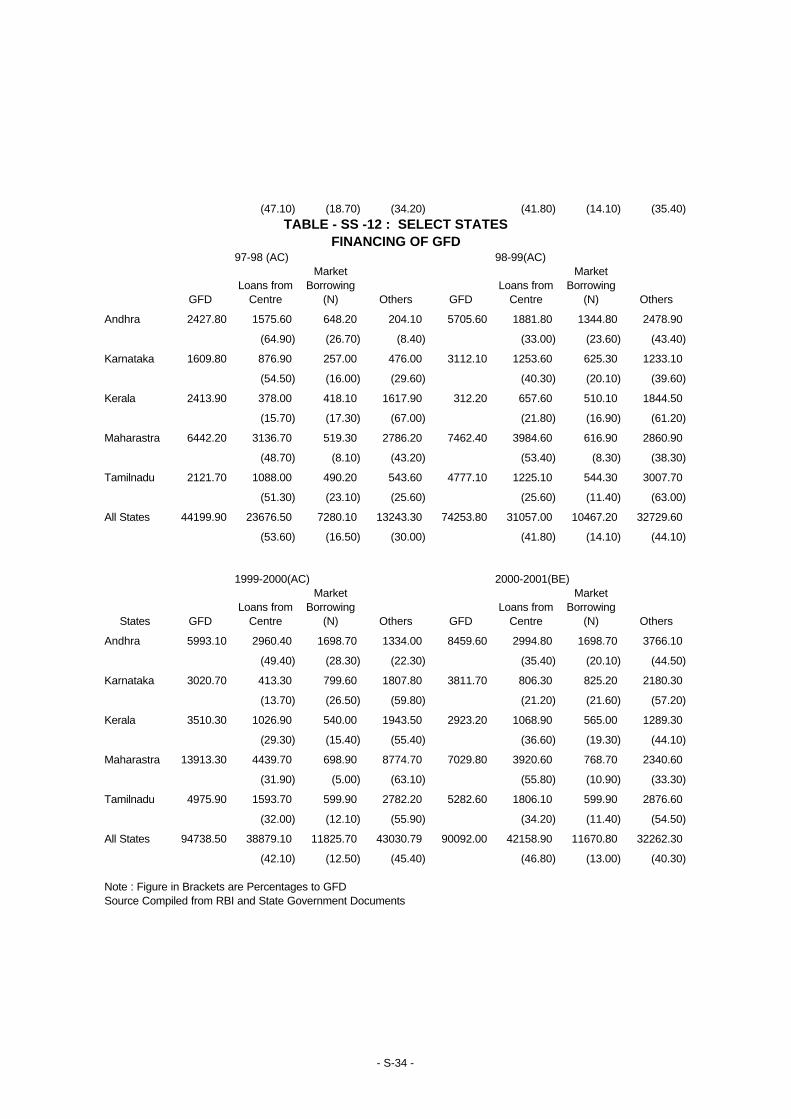
(47.10) (18.70) (34.20) (41.80) (14.10) (35.40)
97-98 (AC) 98-99(AC)
GFDLoans from
Centre
Market Borrowing
(N) Others GFDLoans from
Centre
Market Borrowing
(N) Others
Andhra 2427.80 1575.60 648.20 204.10 5705.60 1881.80 1344.80 2478.90
(64.90) (26.70) (8.40) (33.00) (23.60) (43.40)
Karnataka 1609.80 876.90 257.00 476.00 3112.10 1253.60 625.30 1233.10
(54.50) (16.00) (29.60) (40.30) (20.10) (39.60)
Kerala 2413.90 378.00 418.10 1617.90 312.20 657.60 510.10 1844.50
(15.70) (17.30) (67.00) (21.80) (16.90) (61.20)
Maharastra 6442.20 3136.70 519.30 2786.20 7462.40 3984.60 616.90 2860.90
(48.70) (8.10) (43.20) (53.40) (8.30) (38.30)
Tamilnadu 2121.70 1088.00 490.20 543.60 4777.10 1225.10 544.30 3007.70
(51.30) (23.10) (25.60) (25.60) (11.40) (63.00)
All States 44199.90 23676.50 7280.10 13243.30 74253.80 31057.00 10467.20 32729.60
(53.60) (16.50) (30.00) (41.80) (14.10) (44.10)
1999-2000(AC) 2000-2001(BE)
States GFDLoans from
Centre
Market Borrowing
(N) Others GFDLoans from
Centre
Market Borrowing
(N) Others
Andhra 5993.10 2960.40 1698.70 1334.00 8459.60 2994.80 1698.70 3766.10
(49.40) (28.30) (22.30) (35.40) (20.10) (44.50)
Karnataka 3020.70 413.30 799.60 1807.80 3811.70 806.30 825.20 2180.30
(13.70) (26.50) (59.80) (21.20) (21.60) (57.20)
Kerala 3510.30 1026.90 540.00 1943.50 2923.20 1068.90 565.00 1289.30
(29.30) (15.40) (55.40) (36.60) (19.30) (44.10)
Maharastra 13913.30 4439.70 698.90 8774.70 7029.80 3920.60 768.70 2340.60
(31.90) (5.00) (63.10) (55.80) (10.90) (33.30)
Tamilnadu 4975.90 1593.70 599.90 2782.20 5282.60 1806.10 599.90 2876.60
(32.00) (12.10) (55.90) (34.20) (11.40) (54.50)
All States 94738.50 38879.10 11825.70 43030.79 90092.00 42158.90 11670.80 32262.30
(42.10) (12.50) (45.40) (46.80) (13.00) (40.30)
Note : Figure in Brackets are Percentages to GFDSource Compiled from RBI and State Government Documents
TABLE - SS -12 : SELECT STATESFINANCING OF GFD
- S-34 -
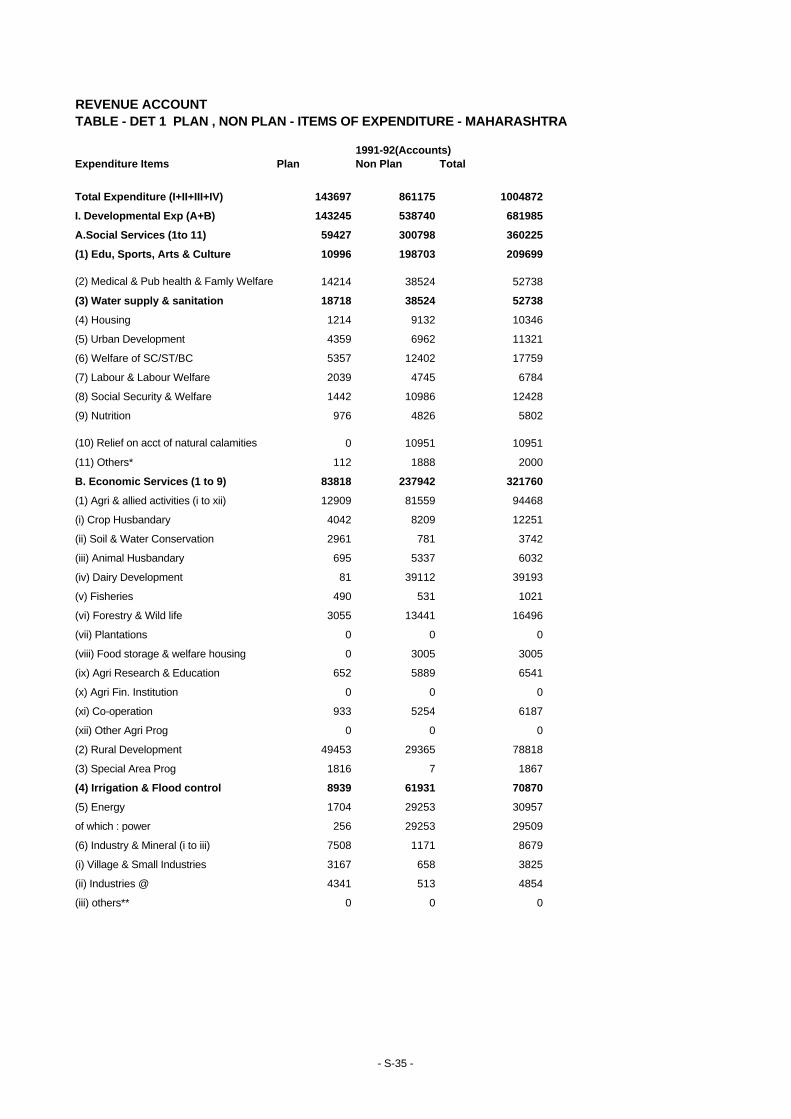
REVENUE ACCOUNTTABLE - DET 1 PLAN , NON PLAN - ITEMS OF EXPENDITURE - MAHARASHTRA
1991-92(Accounts)Expenditure Items Plan Non Plan Total
Total Expenditure (I+II+III+IV) 143697 861175 1004872
I. Developmental Exp (A+B) 143245 538740 681985
A.Social Services (1to 11) 59427 300798 360225
(1) Edu, Sports, Arts & Culture 10996 198703 209699
(2) Medical & Pub health & Famly Welfare 14214 38524 52738
(3) Water supply & sanitation 18718 38524 52738
(4) Housing 1214 9132 10346
(5) Urban Development 4359 6962 11321
(6) Welfare of SC/ST/BC 5357 12402 17759
(7) Labour & Labour Welfare 2039 4745 6784
(8) Social Security & Welfare 1442 10986 12428
(9) Nutrition 976 4826 5802
(10) Relief on acct of natural calamities 0 10951 10951
(11) Others* 112 1888 2000
B. Economic Services (1 to 9) 83818 237942 321760
(1) Agri & allied activities (i to xii) 12909 81559 94468
(i) Crop Husbandary 4042 8209 12251
(ii) Soil & Water Conservation 2961 781 3742
(iii) Animal Husbandary 695 5337 6032
(iv) Dairy Development 81 39112 39193
(v) Fisheries 490 531 1021
(vi) Forestry & Wild life 3055 13441 16496
(vii) Plantations 0 0 0
(viii) Food storage & welfare housing 0 3005 3005
(ix) Agri Research & Education 652 5889 6541
(x) Agri Fin. Institution 0 0 0
(xi) Co-operation 933 5254 6187
(xii) Other Agri Prog 0 0 0
(2) Rural Development 49453 29365 78818
(3) Special Area Prog 1816 7 1867
(4) Irrigation & Flood control 8939 61931 70870
(5) Energy 1704 29253 30957
of which : power 256 29253 29509
(6) Industry & Mineral (i to iii) 7508 1171 8679
(i) Village & Small Industries 3167 658 3825
(ii) Industries @ 4341 513 4854
(iii) others** 0 0 0
- S-35 -
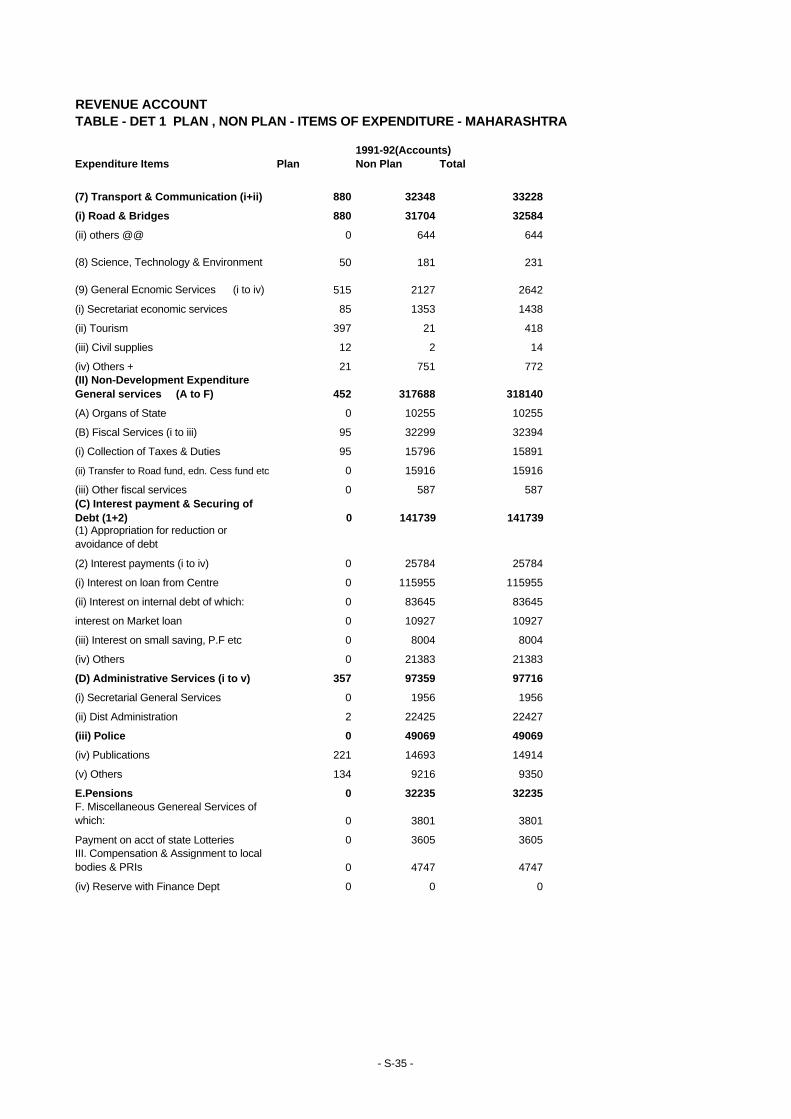
REVENUE ACCOUNTTABLE - DET 1 PLAN , NON PLAN - ITEMS OF EXPENDITURE - MAHARASHTRA
1991-92(Accounts)Expenditure Items Plan Non Plan Total
(7) Transport & Communication (i+ii) 880 32348 33228
(i) Road & Bridges 880 31704 32584
(ii) others @@ 0 644 644
(8) Science, Technology & Environment 50 181 231
(9) General Ecnomic Services (i to iv) 515 2127 2642
(i) Secretariat economic services 85 1353 1438
(ii) Tourism 397 21 418
(iii) Civil supplies 12 2 14
(iv) Others + 21 751 772(II) Non-Development Expenditure General services (A to F) 452 317688 318140
(A) Organs of State 0 10255 10255
(B) Fiscal Services (i to iii) 95 32299 32394
(i) Collection of Taxes & Duties 95 15796 15891
(ii) Transfer to Road fund, edn. Cess fund etc 0 15916 15916
(iii) Other fiscal services 0 587 587(C) Interest payment & Securing of Debt (1+2) 0 141739 141739(1) Appropriation for reduction or avoidance of debt
(2) Interest payments (i to iv) 0 25784 25784
(i) Interest on loan from Centre 0 115955 115955
(ii) Interest on internal debt of which: 0 83645 83645
interest on Market loan 0 10927 10927
(iii) Interest on small saving, P.F etc 0 8004 8004
(iv) Others 0 21383 21383
(D) Administrative Services (i to v) 357 97359 97716
(i) Secretarial General Services 0 1956 1956
(ii) Dist Administration 2 22425 22427
(iii) Police 0 49069 49069
(iv) Publications 221 14693 14914
(v) Others 134 9216 9350
E.Pensions 0 32235 32235F. Miscellaneous Genereal Services of which: 0 3801 3801
Payment on acct of state Lotteries 0 3605 3605III. Compensation & Assignment to local bodies & PRIs 0 4747 4747
(iv) Reserve with Finance Dept 0 0 0
- S-35 -
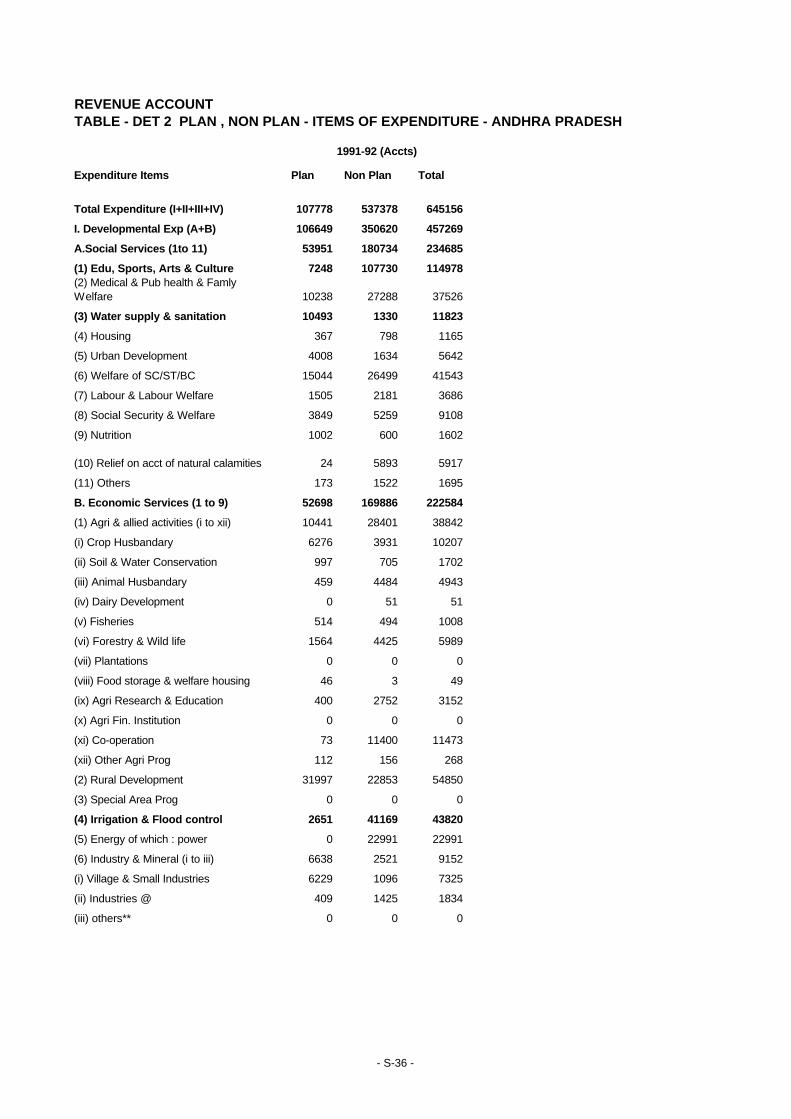
REVENUE ACCOUNTTABLE - DET 2 PLAN , NON PLAN - ITEMS OF EXPENDITURE - ANDHRA PRADESH
1991-92 (Accts)
Expenditure Items Plan Non Plan Total
Total Expenditure (I+II+III+IV) 107778 537378 645156
I. Developmental Exp (A+B) 106649 350620 457269
A.Social Services (1to 11) 53951 180734 234685
(1) Edu, Sports, Arts & Culture 7248 107730 114978(2) Medical & Pub health & Famly Welfare 10238 27288 37526
(3) Water supply & sanitation 10493 1330 11823
(4) Housing 367 798 1165
(5) Urban Development 4008 1634 5642
(6) Welfare of SC/ST/BC 15044 26499 41543
(7) Labour & Labour Welfare 1505 2181 3686
(8) Social Security & Welfare 3849 5259 9108
(9) Nutrition 1002 600 1602
(10) Relief on acct of natural calamities 24 5893 5917
(11) Others 173 1522 1695
B. Economic Services (1 to 9) 52698 169886 222584
(1) Agri & allied activities (i to xii) 10441 28401 38842
(i) Crop Husbandary 6276 3931 10207
(ii) Soil & Water Conservation 997 705 1702
(iii) Animal Husbandary 459 4484 4943
(iv) Dairy Development 0 51 51
(v) Fisheries 514 494 1008
(vi) Forestry & Wild life 1564 4425 5989
(vii) Plantations 0 0 0
(viii) Food storage & welfare housing 46 3 49
(ix) Agri Research & Education 400 2752 3152
(x) Agri Fin. Institution 0 0 0
(xi) Co-operation 73 11400 11473
(xii) Other Agri Prog 112 156 268
(2) Rural Development 31997 22853 54850
(3) Special Area Prog 0 0 0
(4) Irrigation & Flood control 2651 41169 43820
(5) Energy of which : power 0 22991 22991
(6) Industry & Mineral (i to iii) 6638 2521 9152
(i) Village & Small Industries 6229 1096 7325
(ii) Industries @ 409 1425 1834
(iii) others** 0 0 0
- S-36 -
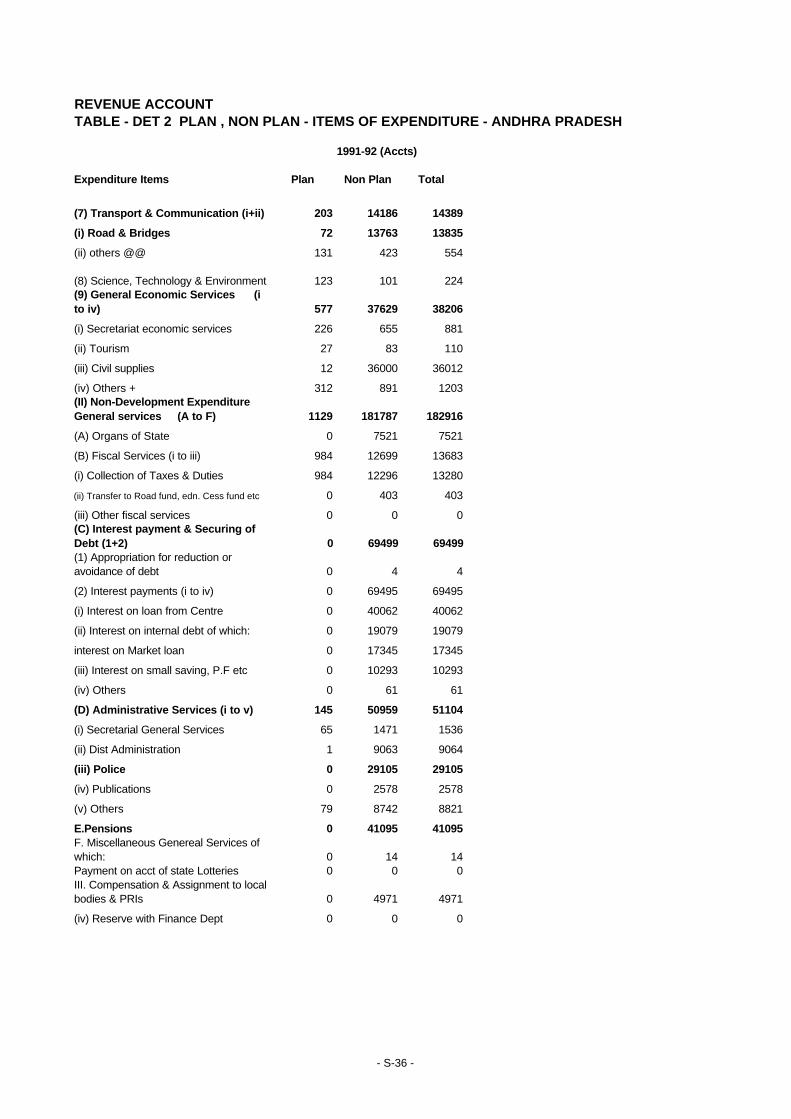
REVENUE ACCOUNTTABLE - DET 2 PLAN , NON PLAN - ITEMS OF EXPENDITURE - ANDHRA PRADESH
1991-92 (Accts)
Expenditure Items Plan Non Plan Total
(7) Transport & Communication (i+ii) 203 14186 14389
(i) Road & Bridges 72 13763 13835
(ii) others @@ 131 423 554
(8) Science, Technology & Environment 123 101 224(9) General Economic Services (i to iv) 577 37629 38206
(i) Secretariat economic services 226 655 881
(ii) Tourism 27 83 110
(iii) Civil supplies 12 36000 36012
(iv) Others + 312 891 1203(II) Non-Development Expenditure General services (A to F) 1129 181787 182916
(A) Organs of State 0 7521 7521
(B) Fiscal Services (i to iii) 984 12699 13683
(i) Collection of Taxes & Duties 984 12296 13280
(ii) Transfer to Road fund, edn. Cess fund etc 0 403 403
(iii) Other fiscal services 0 0 0(C) Interest payment & Securing of Debt (1+2) 0 69499 69499(1) Appropriation for reduction or avoidance of debt 0 4 4
(2) Interest payments (i to iv) 0 69495 69495
(i) Interest on loan from Centre 0 40062 40062
(ii) Interest on internal debt of which: 0 19079 19079
interest on Market loan 0 17345 17345
(iii) Interest on small saving, P.F etc 0 10293 10293
(iv) Others 0 61 61
(D) Administrative Services (i to v) 145 50959 51104
(i) Secretarial General Services 65 1471 1536
(ii) Dist Administration 1 9063 9064
(iii) Police 0 29105 29105
(iv) Publications 0 2578 2578
(v) Others 79 8742 8821
E.Pensions 0 41095 41095F. Miscellaneous Genereal Services of which: 0 14 14Payment on acct of state Lotteries 0 0 0III. Compensation & Assignment to local bodies & PRIs 0 4971 4971
(iv) Reserve with Finance Dept 0 0 0
- S-36 -
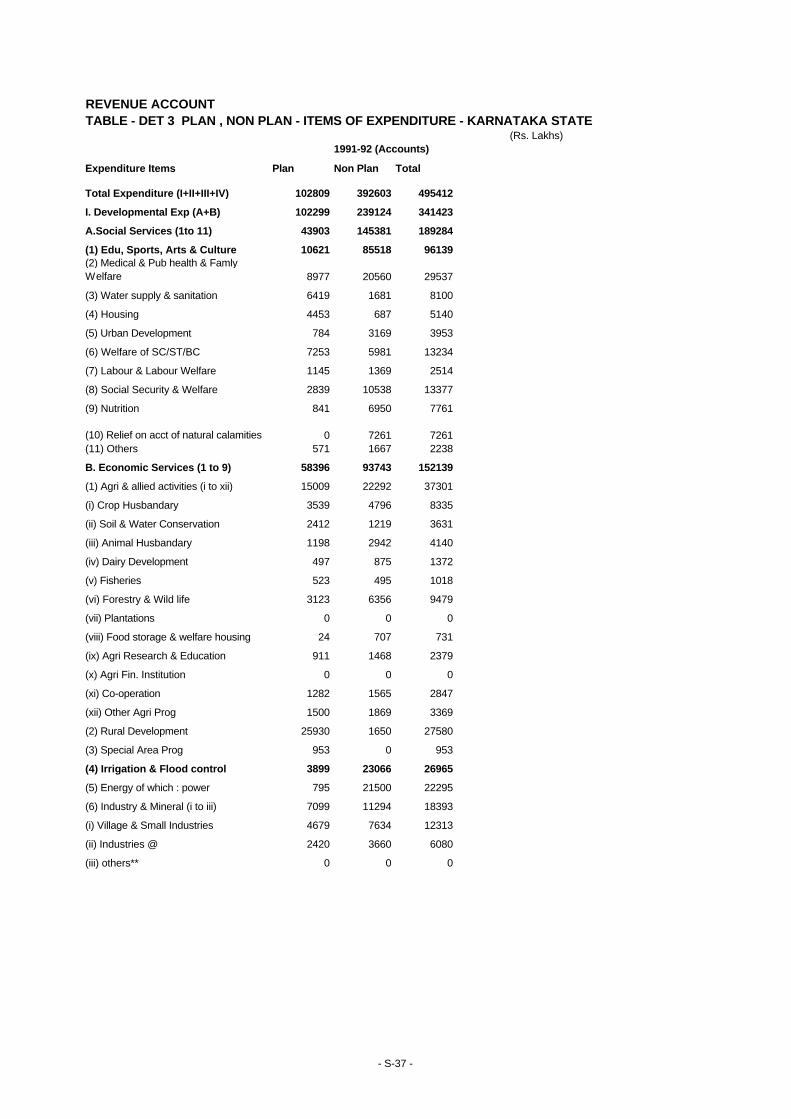
REVENUE ACCOUNTTABLE - DET 3 PLAN , NON PLAN - ITEMS OF EXPENDITURE - KARNATAKA STATE
(Rs. Lakhs)1991-92 (Accounts)
Expenditure Items Plan Non Plan Total
Total Expenditure (I+II+III+IV) 102809 392603 495412
I. Developmental Exp (A+B) 102299 239124 341423
A.Social Services (1to 11) 43903 145381 189284
(1) Edu, Sports, Arts & Culture 10621 85518 96139(2) Medical & Pub health & Famly Welfare 8977 20560 29537
(3) Water supply & sanitation 6419 1681 8100
(4) Housing 4453 687 5140
(5) Urban Development 784 3169 3953
(6) Welfare of SC/ST/BC 7253 5981 13234
(7) Labour & Labour Welfare 1145 1369 2514
(8) Social Security & Welfare 2839 10538 13377
(9) Nutrition 841 6950 7761
(10) Relief on acct of natural calamities 0 7261 7261(11) Others 571 1667 2238
B. Economic Services (1 to 9) 58396 93743 152139
(1) Agri & allied activities (i to xii) 15009 22292 37301
(i) Crop Husbandary 3539 4796 8335
(ii) Soil & Water Conservation 2412 1219 3631
(iii) Animal Husbandary 1198 2942 4140
(iv) Dairy Development 497 875 1372
(v) Fisheries 523 495 1018
(vi) Forestry & Wild life 3123 6356 9479
(vii) Plantations 0 0 0
(viii) Food storage & welfare housing 24 707 731
(ix) Agri Research & Education 911 1468 2379
(x) Agri Fin. Institution 0 0 0
(xi) Co-operation 1282 1565 2847
(xii) Other Agri Prog 1500 1869 3369
(2) Rural Development 25930 1650 27580
(3) Special Area Prog 953 0 953
(4) Irrigation & Flood control 3899 23066 26965
(5) Energy of which : power 795 21500 22295
(6) Industry & Mineral (i to iii) 7099 11294 18393
(i) Village & Small Industries 4679 7634 12313
(ii) Industries @ 2420 3660 6080
(iii) others** 0 0 0
- S-37 -
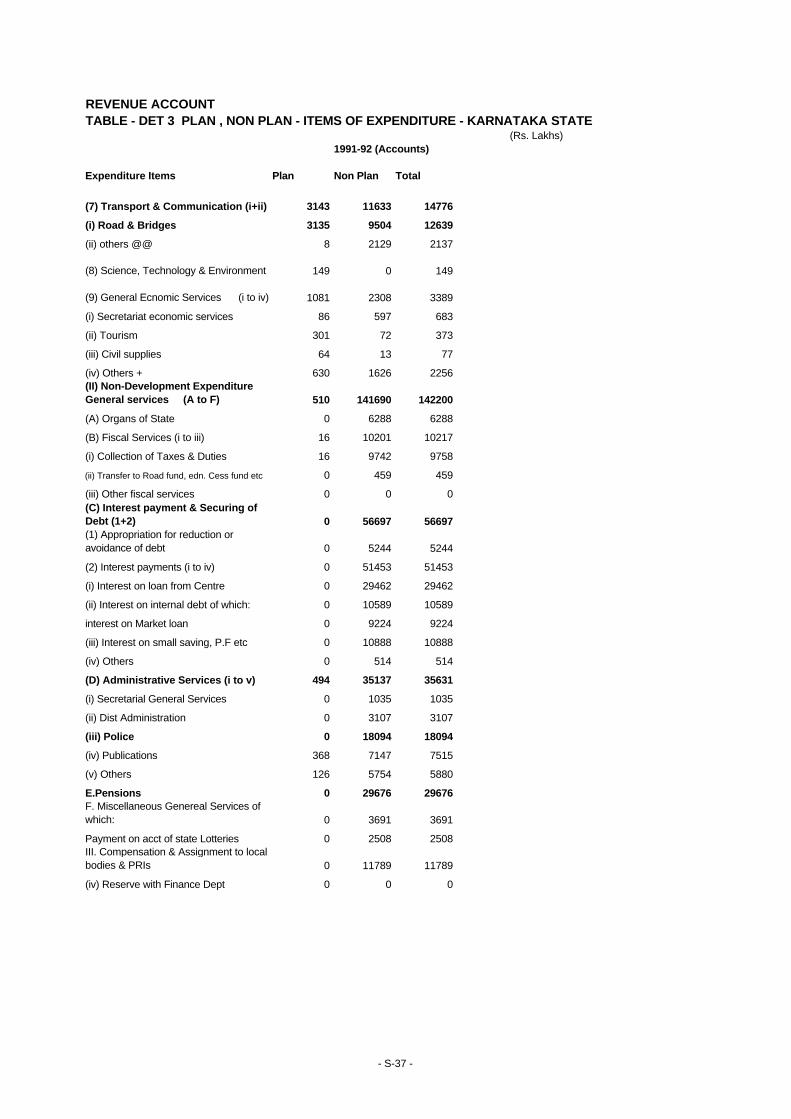
REVENUE ACCOUNTTABLE - DET 3 PLAN , NON PLAN - ITEMS OF EXPENDITURE - KARNATAKA STATE
(Rs. Lakhs)1991-92 (Accounts)
Expenditure Items Plan Non Plan Total
(7) Transport & Communication (i+ii) 3143 11633 14776
(i) Road & Bridges 3135 9504 12639
(ii) others @@ 8 2129 2137
(8) Science, Technology & Environment 149 0 149
(9) General Ecnomic Services (i to iv) 1081 2308 3389
(i) Secretariat economic services 86 597 683
(ii) Tourism 301 72 373
(iii) Civil supplies 64 13 77
(iv) Others + 630 1626 2256(II) Non-Development Expenditure General services (A to F) 510 141690 142200
(A) Organs of State 0 6288 6288
(B) Fiscal Services (i to iii) 16 10201 10217
(i) Collection of Taxes & Duties 16 9742 9758
(ii) Transfer to Road fund, edn. Cess fund etc 0 459 459
(iii) Other fiscal services 0 0 0(C) Interest payment & Securing of Debt (1+2) 0 56697 56697(1) Appropriation for reduction or avoidance of debt 0 5244 5244
(2) Interest payments (i to iv) 0 51453 51453
(i) Interest on loan from Centre 0 29462 29462
(ii) Interest on internal debt of which: 0 10589 10589
interest on Market loan 0 9224 9224
(iii) Interest on small saving, P.F etc 0 10888 10888
(iv) Others 0 514 514
(D) Administrative Services (i to v) 494 35137 35631
(i) Secretarial General Services 0 1035 1035
(ii) Dist Administration 0 3107 3107
(iii) Police 0 18094 18094
(iv) Publications 368 7147 7515
(v) Others 126 5754 5880
E.Pensions 0 29676 29676F. Miscellaneous Genereal Services of which: 0 3691 3691
Payment on acct of state Lotteries 0 2508 2508III. Compensation & Assignment to local bodies & PRIs 0 11789 11789
(iv) Reserve with Finance Dept 0 0 0
- S-37 -
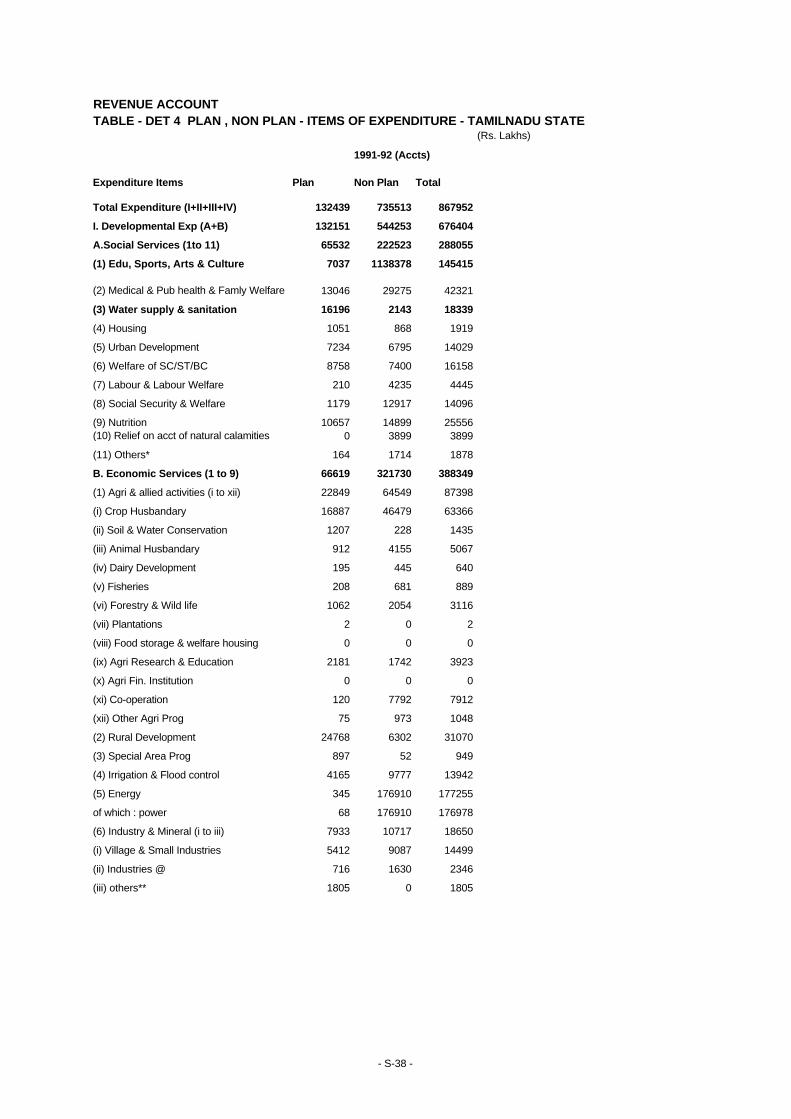
REVENUE ACCOUNTTABLE - DET 4 PLAN , NON PLAN - ITEMS OF EXPENDITURE - TAMILNADU STATE
(Rs. Lakhs)
1991-92 (Accts)
Expenditure Items Plan Non Plan Total
Total Expenditure (I+II+III+IV) 132439 735513 867952
I. Developmental Exp (A+B) 132151 544253 676404
A.Social Services (1to 11) 65532 222523 288055
(1) Edu, Sports, Arts & Culture 7037 1138378 145415
(2) Medical & Pub health & Famly Welfare 13046 29275 42321
(3) Water supply & sanitation 16196 2143 18339
(4) Housing 1051 868 1919
(5) Urban Development 7234 6795 14029
(6) Welfare of SC/ST/BC 8758 7400 16158
(7) Labour & Labour Welfare 210 4235 4445
(8) Social Security & Welfare 1179 12917 14096
(9) Nutrition 10657 14899 25556(10) Relief on acct of natural calamities 0 3899 3899
(11) Others* 164 1714 1878
B. Economic Services (1 to 9) 66619 321730 388349
(1) Agri & allied activities (i to xii) 22849 64549 87398
(i) Crop Husbandary 16887 46479 63366
(ii) Soil & Water Conservation 1207 228 1435
(iii) Animal Husbandary 912 4155 5067
(iv) Dairy Development 195 445 640
(v) Fisheries 208 681 889
(vi) Forestry & Wild life 1062 2054 3116
(vii) Plantations 2 0 2
(viii) Food storage & welfare housing 0 0 0
(ix) Agri Research & Education 2181 1742 3923
(x) Agri Fin. Institution 0 0 0
(xi) Co-operation 120 7792 7912
(xii) Other Agri Prog 75 973 1048
(2) Rural Development 24768 6302 31070
(3) Special Area Prog 897 52 949
(4) Irrigation & Flood control 4165 9777 13942
(5) Energy 345 176910 177255
of which : power 68 176910 176978
(6) Industry & Mineral (i to iii) 7933 10717 18650
(i) Village & Small Industries 5412 9087 14499
(ii) Industries @ 716 1630 2346
(iii) others** 1805 0 1805
- S-38 -

REVENUE ACCOUNTTABLE - DET 4 PLAN , NON PLAN - ITEMS OF EXPENDITURE - TAMILNADU STATE
(Rs. Lakhs)
1991-92 (Accts)
Expenditure Items Plan Non Plan Total
(7) Transport & Communication (i+ii) 4830 14735 19565
(i) Road & Bridges 4824 13717 18541
(ii) others @@ 6 1018 1024(8) Science, Technology & Environment 255 0 255
(9) General Economic Services (i to iv) 577 38688 39265
(i) Secretariat economic services 50 593 643
(ii) Tourism 53 56 109
(iii) Civil supplies 3 36963 36966
(iv) Others + 471 1076 1547(II) Non-Development Expenditure General services (A to F) 288 171460 171748
(A) Organs of State 0 6626 6626
(B) Fiscal Services (i to iii) 144 11071 11215
(i) Collection of Taxes & Duties 0 9996 9996(ii) Transfer to Road fund, edn. Cess fund etc 0 0 0
(iii) Other fiscal services 144 1075 1219
(C) Interest payment & Securing of Debt (1+2) 0 59394 59394(1) Appropriation for reduction or avoidance of debt 0 3665 3665
(2) Interest payments (i to iv) 0 55729 55729
(i) Interest on loan from Centre 0 31380 31380
(ii) Interest on internal debt of which: 0 15299 15299
interest on Market loan 0 12957 12957
(iii) Interest on small saving, P.F etc 0 6409 6409
(iv) Others 0 2641 2641
(D) Administrative Services (i to v) 144 52702 52846
(i) Secretarial General Services 34 1758 1792
(ii) Dist Administration 0 10026 10026
(iii) Police 17 24886 24903
(iv) Publications 0 4881 4881
(v) Others 93 11151 11244
E.Pensions 0 40113 40113F. Miscellaneous General Services of which: 0 1554 1554
Payment on acct of state Lotteries 0 1280 1280III. Compensation & Assignment to local bodies & PRIs 0 19800 19800
(iv) Reserve with Finance Dept 0 0 0
- S-38 -
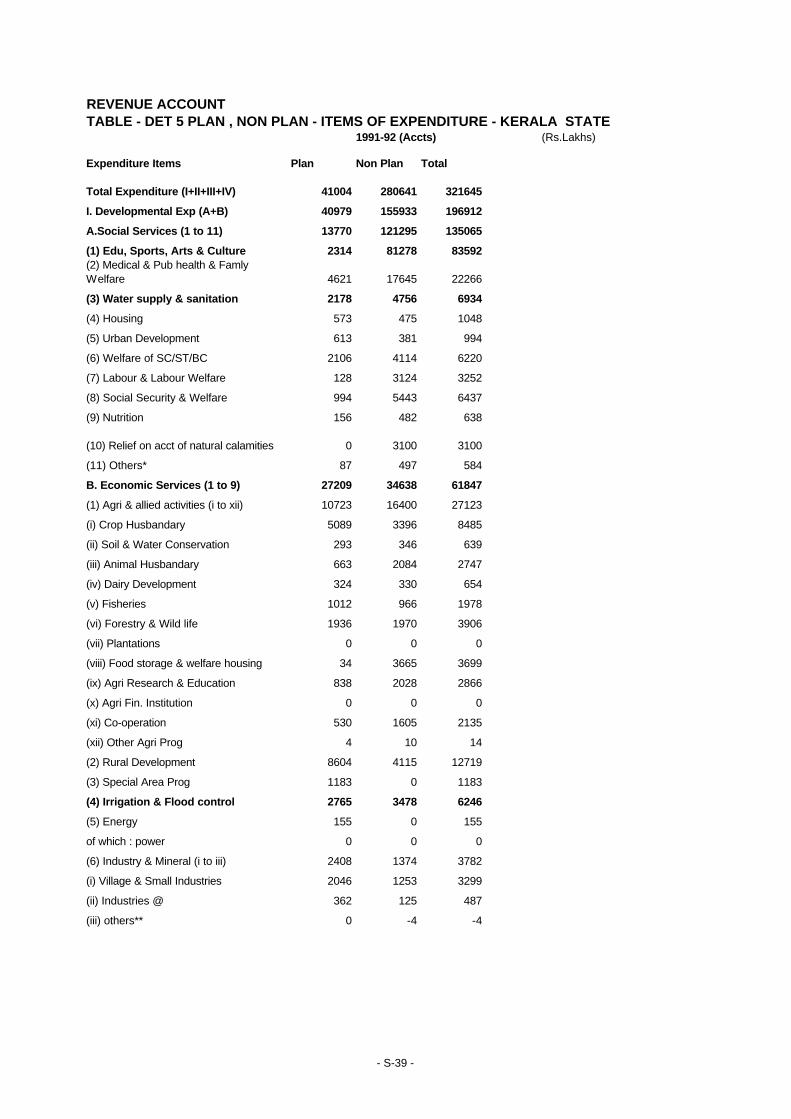
REVENUE ACCOUNTTABLE - DET 5 PLAN , NON PLAN - ITEMS OF EXPENDITURE - KERALA STATE
1991-92 (Accts) (Rs.Lakhs)
Expenditure Items Plan Non Plan Total
Total Expenditure (I+II+III+IV) 41004 280641 321645
I. Developmental Exp (A+B) 40979 155933 196912
A.Social Services (1 to 11) 13770 121295 135065
(1) Edu, Sports, Arts & Culture 2314 81278 83592(2) Medical & Pub health & Famly Welfare 4621 17645 22266
(3) Water supply & sanitation 2178 4756 6934
(4) Housing 573 475 1048
(5) Urban Development 613 381 994
(6) Welfare of SC/ST/BC 2106 4114 6220
(7) Labour & Labour Welfare 128 3124 3252
(8) Social Security & Welfare 994 5443 6437
(9) Nutrition 156 482 638
(10) Relief on acct of natural calamities 0 3100 3100
(11) Others* 87 497 584
B. Economic Services (1 to 9) 27209 34638 61847
(1) Agri & allied activities (i to xii) 10723 16400 27123
(i) Crop Husbandary 5089 3396 8485
(ii) Soil & Water Conservation 293 346 639
(iii) Animal Husbandary 663 2084 2747
(iv) Dairy Development 324 330 654
(v) Fisheries 1012 966 1978
(vi) Forestry & Wild life 1936 1970 3906
(vii) Plantations 0 0 0
(viii) Food storage & welfare housing 34 3665 3699
(ix) Agri Research & Education 838 2028 2866
(x) Agri Fin. Institution 0 0 0
(xi) Co-operation 530 1605 2135
(xii) Other Agri Prog 4 10 14
(2) Rural Development 8604 4115 12719
(3) Special Area Prog 1183 0 1183
(4) Irrigation & Flood control 2765 3478 6246
(5) Energy 155 0 155
of which : power 0 0 0
(6) Industry & Mineral (i to iii) 2408 1374 3782
(i) Village & Small Industries 2046 1253 3299
(ii) Industries @ 362 125 487
(iii) others** 0 -4 -4
- S-39 -
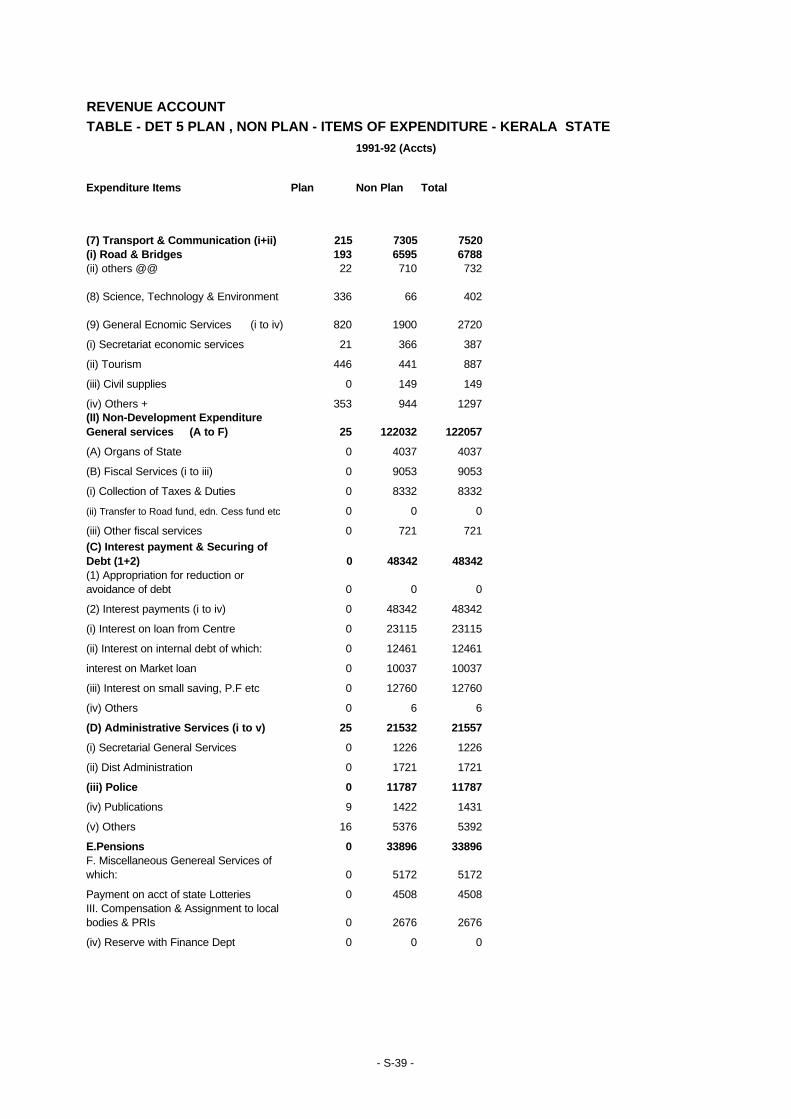
REVENUE ACCOUNTTABLE - DET 5 PLAN , NON PLAN - ITEMS OF EXPENDITURE - KERALA STATE
1991-92 (Accts)
Expenditure Items Plan Non Plan Total
(7) Transport & Communication (i+ii) 215 7305 7520(i) Road & Bridges 193 6595 6788(ii) others @@ 22 710 732
(8) Science, Technology & Environment 336 66 402
(9) General Ecnomic Services (i to iv) 820 1900 2720
(i) Secretariat economic services 21 366 387
(ii) Tourism 446 441 887
(iii) Civil supplies 0 149 149
(iv) Others + 353 944 1297(II) Non-Development Expenditure General services (A to F) 25 122032 122057
(A) Organs of State 0 4037 4037
(B) Fiscal Services (i to iii) 0 9053 9053
(i) Collection of Taxes & Duties 0 8332 8332
(ii) Transfer to Road fund, edn. Cess fund etc 0 0 0
(iii) Other fiscal services 0 721 721(C) Interest payment & Securing of Debt (1+2) 0 48342 48342(1) Appropriation for reduction or avoidance of debt 0 0 0
(2) Interest payments (i to iv) 0 48342 48342
(i) Interest on loan from Centre 0 23115 23115
(ii) Interest on internal debt of which: 0 12461 12461
interest on Market loan 0 10037 10037
(iii) Interest on small saving, P.F etc 0 12760 12760
(iv) Others 0 6 6
(D) Administrative Services (i to v) 25 21532 21557
(i) Secretarial General Services 0 1226 1226
(ii) Dist Administration 0 1721 1721
(iii) Police 0 11787 11787
(iv) Publications 9 1422 1431
(v) Others 16 5376 5392
E.Pensions 0 33896 33896F. Miscellaneous Genereal Services of which: 0 5172 5172
Payment on acct of state Lotteries 0 4508 4508III. Compensation & Assignment to local bodies & PRIs 0 2676 2676
(iv) Reserve with Finance Dept 0 0 0
- S-39 -
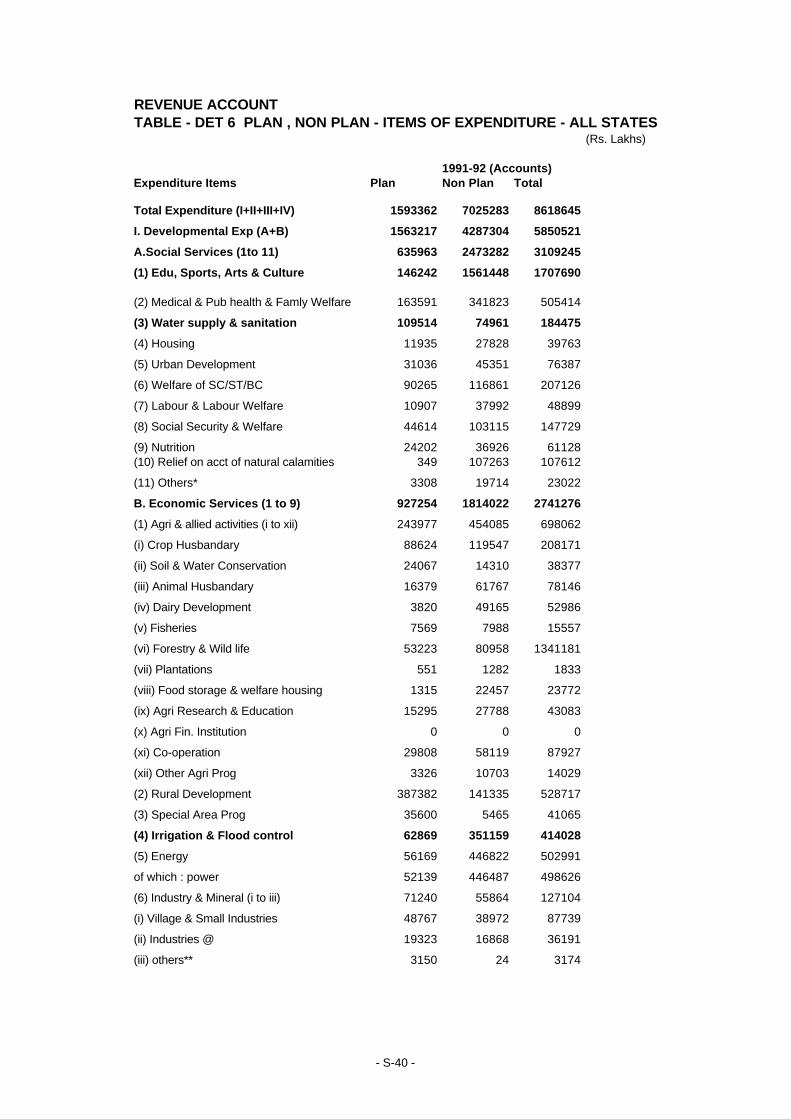
REVENUE ACCOUNTTABLE - DET 6 PLAN , NON PLAN - ITEMS OF EXPENDITURE - ALL STATES
(Rs. Lakhs)
1991-92 (Accounts)Expenditure Items Plan Non Plan Total
Total Expenditure (I+II+III+IV) 1593362 7025283 8618645
I. Developmental Exp (A+B) 1563217 4287304 5850521
A.Social Services (1to 11) 635963 2473282 3109245
(1) Edu, Sports, Arts & Culture 146242 1561448 1707690
(2) Medical & Pub health & Famly Welfare 163591 341823 505414
(3) Water supply & sanitation 109514 74961 184475
(4) Housing 11935 27828 39763
(5) Urban Development 31036 45351 76387
(6) Welfare of SC/ST/BC 90265 116861 207126
(7) Labour & Labour Welfare 10907 37992 48899
(8) Social Security & Welfare 44614 103115 147729
(9) Nutrition 24202 36926 61128(10) Relief on acct of natural calamities 349 107263 107612
(11) Others* 3308 19714 23022
B. Economic Services (1 to 9) 927254 1814022 2741276
(1) Agri & allied activities (i to xii) 243977 454085 698062
(i) Crop Husbandary 88624 119547 208171
(ii) Soil & Water Conservation 24067 14310 38377
(iii) Animal Husbandary 16379 61767 78146
(iv) Dairy Development 3820 49165 52986
(v) Fisheries 7569 7988 15557
(vi) Forestry & Wild life 53223 80958 1341181
(vii) Plantations 551 1282 1833
(viii) Food storage & welfare housing 1315 22457 23772
(ix) Agri Research & Education 15295 27788 43083
(x) Agri Fin. Institution 0 0 0
(xi) Co-operation 29808 58119 87927
(xii) Other Agri Prog 3326 10703 14029
(2) Rural Development 387382 141335 528717
(3) Special Area Prog 35600 5465 41065
(4) Irrigation & Flood control 62869 351159 414028
(5) Energy 56169 446822 502991
of which : power 52139 446487 498626
(6) Industry & Mineral (i to iii) 71240 55864 127104
(i) Village & Small Industries 48767 38972 87739
(ii) Industries @ 19323 16868 36191
(iii) others** 3150 24 3174
- S-40 -
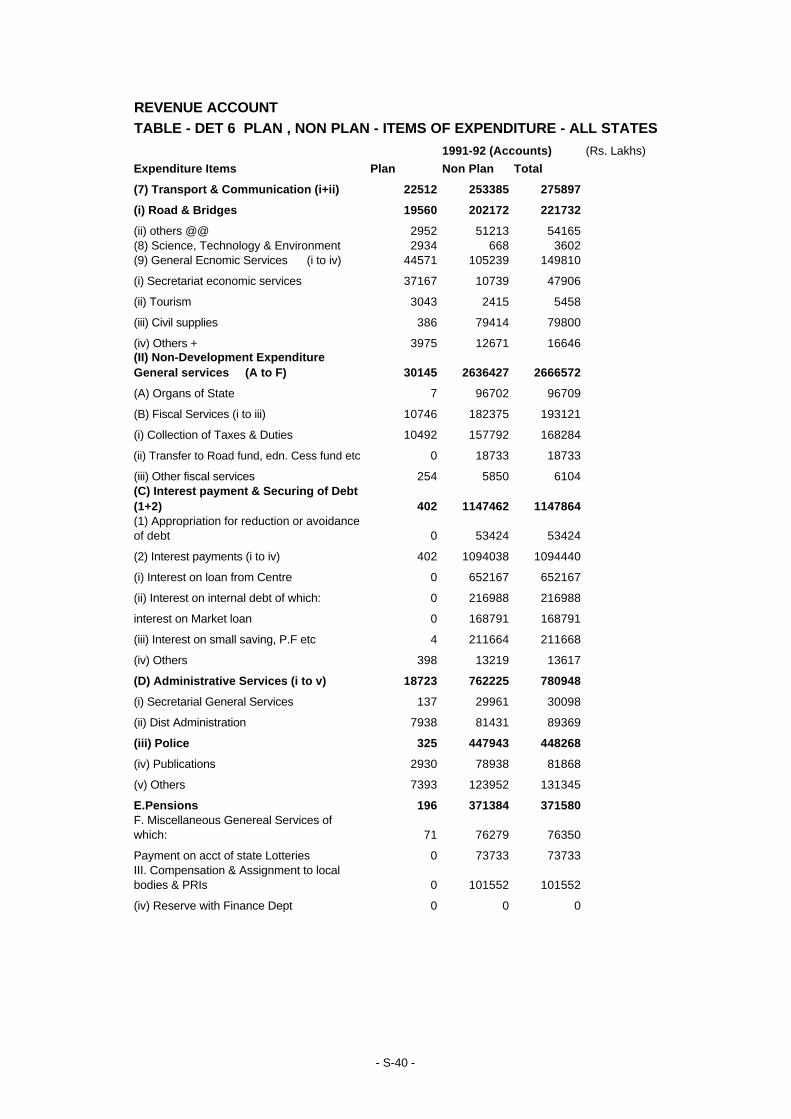
REVENUE ACCOUNTTABLE - DET 6 PLAN , NON PLAN - ITEMS OF EXPENDITURE - ALL STATES
1991-92 (Accounts) (Rs. Lakhs)Expenditure Items Plan Non Plan Total
(7) Transport & Communication (i+ii) 22512 253385 275897
(i) Road & Bridges 19560 202172 221732
(ii) others @@ 2952 51213 54165(8) Science, Technology & Environment 2934 668 3602(9) General Ecnomic Services (i to iv) 44571 105239 149810
(i) Secretariat economic services 37167 10739 47906
(ii) Tourism 3043 2415 5458
(iii) Civil supplies 386 79414 79800
(iv) Others + 3975 12671 16646(II) Non-Development Expenditure General services (A to F) 30145 2636427 2666572
(A) Organs of State 7 96702 96709
(B) Fiscal Services (i to iii) 10746 182375 193121
(i) Collection of Taxes & Duties 10492 157792 168284
(ii) Transfer to Road fund, edn. Cess fund etc 0 18733 18733
(iii) Other fiscal services 254 5850 6104(C) Interest payment & Securing of Debt (1+2) 402 1147462 1147864(1) Appropriation for reduction or avoidance of debt 0 53424 53424
(2) Interest payments (i to iv) 402 1094038 1094440
(i) Interest on loan from Centre 0 652167 652167
(ii) Interest on internal debt of which: 0 216988 216988
interest on Market loan 0 168791 168791
(iii) Interest on small saving, P.F etc 4 211664 211668
(iv) Others 398 13219 13617
(D) Administrative Services (i to v) 18723 762225 780948
(i) Secretarial General Services 137 29961 30098
(ii) Dist Administration 7938 81431 89369
(iii) Police 325 447943 448268
(iv) Publications 2930 78938 81868
(v) Others 7393 123952 131345
E.Pensions 196 371384 371580F. Miscellaneous Genereal Services of which: 71 76279 76350
Payment on acct of state Lotteries 0 73733 73733III. Compensation & Assignment to local bodies & PRIs 0 101552 101552
(iv) Reserve with Finance Dept 0 0 0
- S-40 -
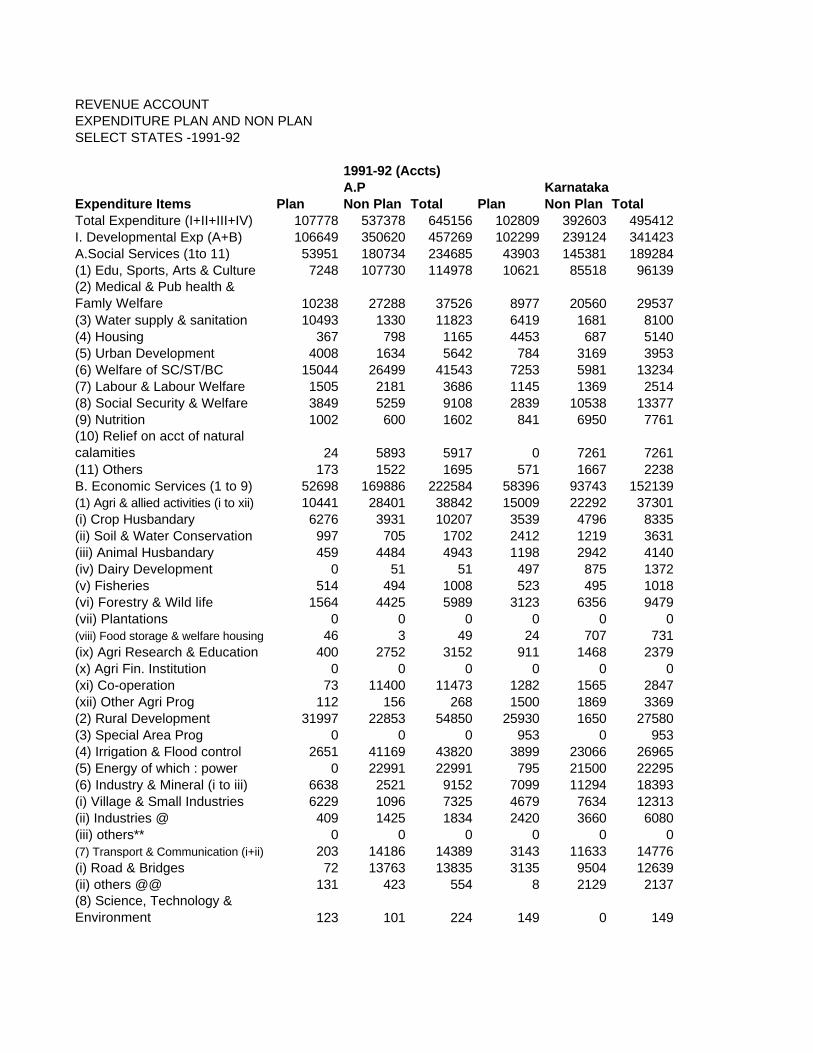
REVENUE ACCOUNTEXPENDITURE PLAN AND NON PLANSELECT STATES -1991-92
1991-92 (Accts)A.P Karnataka
Expenditure Items Plan Non Plan Total Plan Non Plan TotalTotal Expenditure (I+II+III+IV) 107778 537378 645156 102809 392603 495412I. Developmental Exp (A+B) 106649 350620 457269 102299 239124 341423A.Social Services (1to 11) 53951 180734 234685 43903 145381 189284(1) Edu, Sports, Arts & Culture 7248 107730 114978 10621 85518 96139(2) Medical & Pub health & Famly Welfare 10238 27288 37526 8977 20560 29537(3) Water supply & sanitation 10493 1330 11823 6419 1681 8100(4) Housing 367 798 1165 4453 687 5140(5) Urban Development 4008 1634 5642 784 3169 3953(6) Welfare of SC/ST/BC 15044 26499 41543 7253 5981 13234(7) Labour & Labour Welfare 1505 2181 3686 1145 1369 2514(8) Social Security & Welfare 3849 5259 9108 2839 10538 13377(9) Nutrition 1002 600 1602 841 6950 7761(10) Relief on acct of natural calamities 24 5893 5917 0 7261 7261(11) Others 173 1522 1695 571 1667 2238B. Economic Services (1 to 9) 52698 169886 222584 58396 93743 152139(1) Agri & allied activities (i to xii) 10441 28401 38842 15009 22292 37301(i) Crop Husbandary 6276 3931 10207 3539 4796 8335(ii) Soil & Water Conservation 997 705 1702 2412 1219 3631(iii) Animal Husbandary 459 4484 4943 1198 2942 4140(iv) Dairy Development 0 51 51 497 875 1372(v) Fisheries 514 494 1008 523 495 1018(vi) Forestry & Wild life 1564 4425 5989 3123 6356 9479(vii) Plantations 0 0 0 0 0 0(viii) Food storage & welfare housing 46 3 49 24 707 731(ix) Agri Research & Education 400 2752 3152 911 1468 2379(x) Agri Fin. Institution 0 0 0 0 0 0(xi) Co-operation 73 11400 11473 1282 1565 2847(xii) Other Agri Prog 112 156 268 1500 1869 3369(2) Rural Development 31997 22853 54850 25930 1650 27580(3) Special Area Prog 0 0 0 953 0 953(4) Irrigation & Flood control 2651 41169 43820 3899 23066 26965(5) Energy of which : power 0 22991 22991 795 21500 22295(6) Industry & Mineral (i to iii) 6638 2521 9152 7099 11294 18393(i) Village & Small Industries 6229 1096 7325 4679 7634 12313(ii) Industries @ 409 1425 1834 2420 3660 6080(iii) others** 0 0 0 0 0 0(7) Transport & Communication (i+ii) 203 14186 14389 3143 11633 14776(i) Road & Bridges 72 13763 13835 3135 9504 12639(ii) others @@ 131 423 554 8 2129 2137(8) Science, Technology & Environment 123 101 224 149 0 149
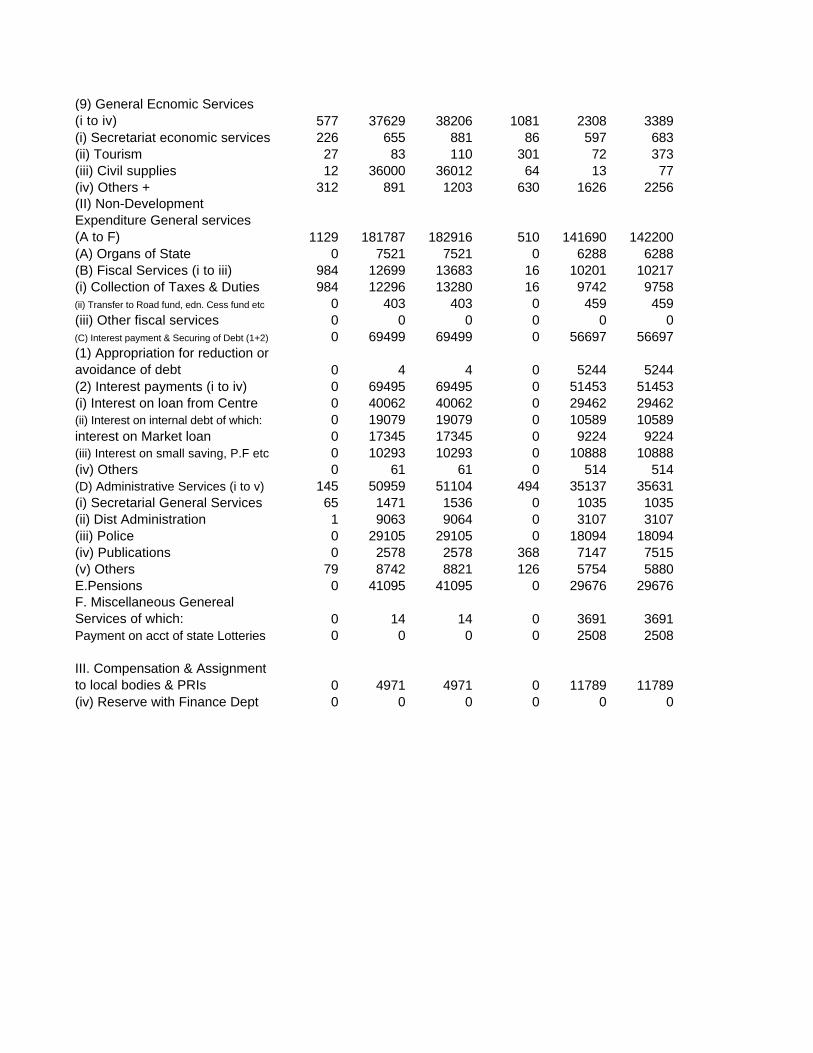
(9) General Ecnomic Services (i to iv) 577 37629 38206 1081 2308 3389(i) Secretariat economic services 226 655 881 86 597 683(ii) Tourism 27 83 110 301 72 373(iii) Civil supplies 12 36000 36012 64 13 77(iv) Others + 312 891 1203 630 1626 2256(II) Non-Development Expenditure General services (A to F) 1129 181787 182916 510 141690 142200(A) Organs of State 0 7521 7521 0 6288 6288(B) Fiscal Services (i to iii) 984 12699 13683 16 10201 10217(i) Collection of Taxes & Duties 984 12296 13280 16 9742 9758(ii) Transfer to Road fund, edn. Cess fund etc 0 403 403 0 459 459(iii) Other fiscal services 0 0 0 0 0 0(C) Interest payment & Securing of Debt (1+2) 0 69499 69499 0 56697 56697(1) Appropriation for reduction or avoidance of debt 0 4 4 0 5244 5244(2) Interest payments (i to iv) 0 69495 69495 0 51453 51453(i) Interest on loan from Centre 0 40062 40062 0 29462 29462(ii) Interest on internal debt of which: 0 19079 19079 0 10589 10589interest on Market loan 0 17345 17345 0 9224 9224(iii) Interest on small saving, P.F etc 0 10293 10293 0 10888 10888(iv) Others 0 61 61 0 514 514(D) Administrative Services (i to v) 145 50959 51104 494 35137 35631(i) Secretarial General Services 65 1471 1536 0 1035 1035(ii) Dist Administration 1 9063 9064 0 3107 3107(iii) Police 0 29105 29105 0 18094 18094(iv) Publications 0 2578 2578 368 7147 7515(v) Others 79 8742 8821 126 5754 5880E.Pensions 0 41095 41095 0 29676 29676F. Miscellaneous Genereal Services of which: 0 14 14 0 3691 3691Payment on acct of state Lotteries 0 0 0 0 2508 2508
III. Compensation & Assignment to local bodies & PRIs 0 4971 4971 0 11789 11789(iv) Reserve with Finance Dept 0 0 0 0 0 0
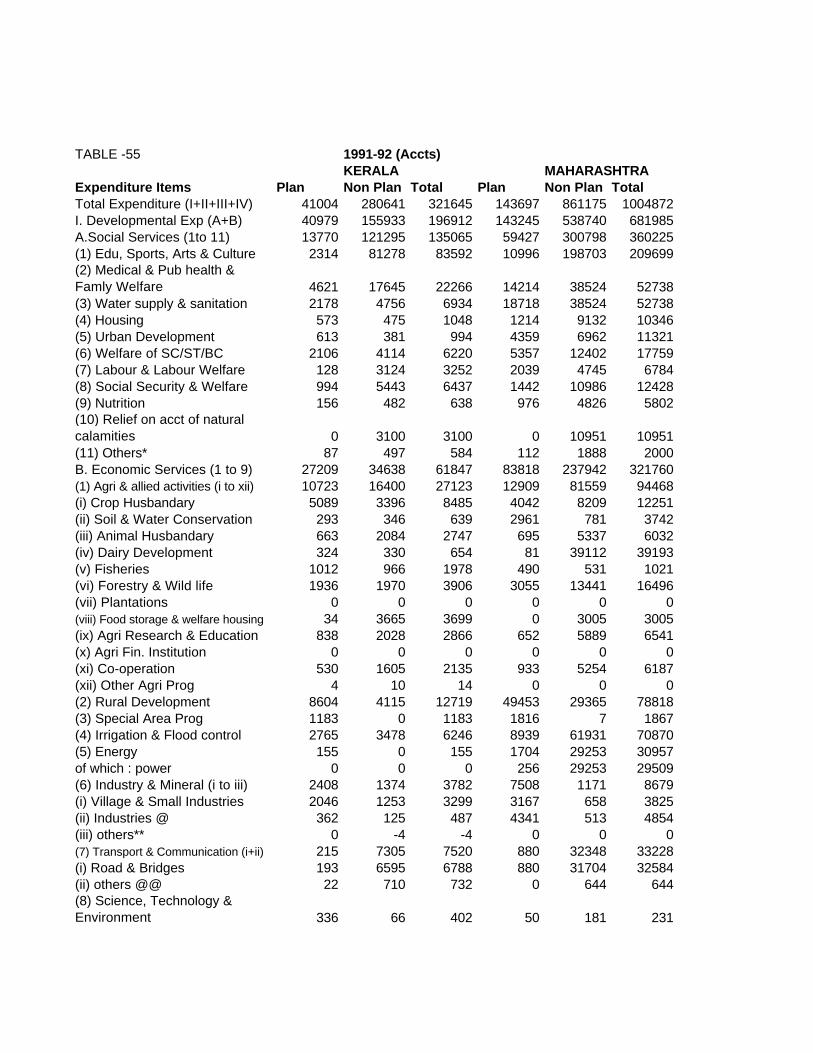
TABLE -55 1991-92 (Accts)KERALA MAHARASHTRA
Expenditure Items Plan Non Plan Total Plan Non Plan TotalTotal Expenditure (I+II+III+IV) 41004 280641 321645 143697 861175 1004872I. Developmental Exp (A+B) 40979 155933 196912 143245 538740 681985A.Social Services (1to 11) 13770 121295 135065 59427 300798 360225(1) Edu, Sports, Arts & Culture 2314 81278 83592 10996 198703 209699(2) Medical & Pub health & Famly Welfare 4621 17645 22266 14214 38524 52738(3) Water supply & sanitation 2178 4756 6934 18718 38524 52738(4) Housing 573 475 1048 1214 9132 10346(5) Urban Development 613 381 994 4359 6962 11321(6) Welfare of SC/ST/BC 2106 4114 6220 5357 12402 17759(7) Labour & Labour Welfare 128 3124 3252 2039 4745 6784(8) Social Security & Welfare 994 5443 6437 1442 10986 12428(9) Nutrition 156 482 638 976 4826 5802(10) Relief on acct of natural calamities 0 3100 3100 0 10951 10951(11) Others* 87 497 584 112 1888 2000B. Economic Services (1 to 9) 27209 34638 61847 83818 237942 321760(1) Agri & allied activities (i to xii) 10723 16400 27123 12909 81559 94468(i) Crop Husbandary 5089 3396 8485 4042 8209 12251(ii) Soil & Water Conservation 293 346 639 2961 781 3742(iii) Animal Husbandary 663 2084 2747 695 5337 6032(iv) Dairy Development 324 330 654 81 39112 39193(v) Fisheries 1012 966 1978 490 531 1021(vi) Forestry & Wild life 1936 1970 3906 3055 13441 16496(vii) Plantations 0 0 0 0 0 0(viii) Food storage & welfare housing 34 3665 3699 0 3005 3005(ix) Agri Research & Education 838 2028 2866 652 5889 6541(x) Agri Fin. Institution 0 0 0 0 0 0(xi) Co-operation 530 1605 2135 933 5254 6187(xii) Other Agri Prog 4 10 14 0 0 0(2) Rural Development 8604 4115 12719 49453 29365 78818(3) Special Area Prog 1183 0 1183 1816 7 1867(4) Irrigation & Flood control 2765 3478 6246 8939 61931 70870(5) Energy 155 0 155 1704 29253 30957of which : power 0 0 0 256 29253 29509(6) Industry & Mineral (i to iii) 2408 1374 3782 7508 1171 8679(i) Village & Small Industries 2046 1253 3299 3167 658 3825(ii) Industries @ 362 125 487 4341 513 4854(iii) others** 0 -4 -4 0 0 0(7) Transport & Communication (i+ii) 215 7305 7520 880 32348 33228(i) Road & Bridges 193 6595 6788 880 31704 32584(ii) others @@ 22 710 732 0 644 644(8) Science, Technology & Environment 336 66 402 50 181 231
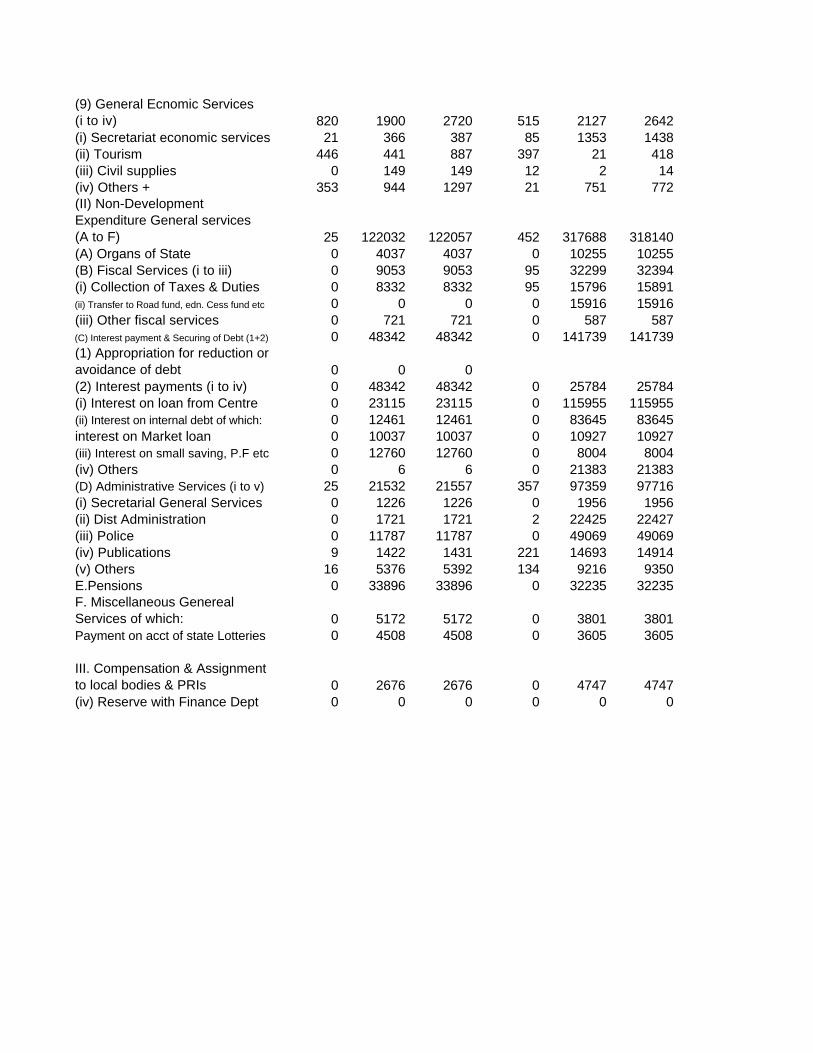
(9) General Ecnomic Services (i to iv) 820 1900 2720 515 2127 2642(i) Secretariat economic services 21 366 387 85 1353 1438(ii) Tourism 446 441 887 397 21 418(iii) Civil supplies 0 149 149 12 2 14(iv) Others + 353 944 1297 21 751 772(II) Non-Development Expenditure General services (A to F) 25 122032 122057 452 317688 318140(A) Organs of State 0 4037 4037 0 10255 10255(B) Fiscal Services (i to iii) 0 9053 9053 95 32299 32394(i) Collection of Taxes & Duties 0 8332 8332 95 15796 15891(ii) Transfer to Road fund, edn. Cess fund etc 0 0 0 0 15916 15916(iii) Other fiscal services 0 721 721 0 587 587(C) Interest payment & Securing of Debt (1+2) 0 48342 48342 0 141739 141739(1) Appropriation for reduction or avoidance of debt 0 0 0(2) Interest payments (i to iv) 0 48342 48342 0 25784 25784(i) Interest on loan from Centre 0 23115 23115 0 115955 115955(ii) Interest on internal debt of which: 0 12461 12461 0 83645 83645interest on Market loan 0 10037 10037 0 10927 10927(iii) Interest on small saving, P.F etc 0 12760 12760 0 8004 8004(iv) Others 0 6 6 0 21383 21383(D) Administrative Services (i to v) 25 21532 21557 357 97359 97716(i) Secretarial General Services 0 1226 1226 0 1956 1956(ii) Dist Administration 0 1721 1721 2 22425 22427(iii) Police 0 11787 11787 0 49069 49069(iv) Publications 9 1422 1431 221 14693 14914(v) Others 16 5376 5392 134 9216 9350E.Pensions 0 33896 33896 0 32235 32235F. Miscellaneous Genereal Services of which: 0 5172 5172 0 3801 3801Payment on acct of state Lotteries 0 4508 4508 0 3605 3605
III. Compensation & Assignment to local bodies & PRIs 0 2676 2676 0 4747 4747(iv) Reserve with Finance Dept 0 0 0 0 0 0
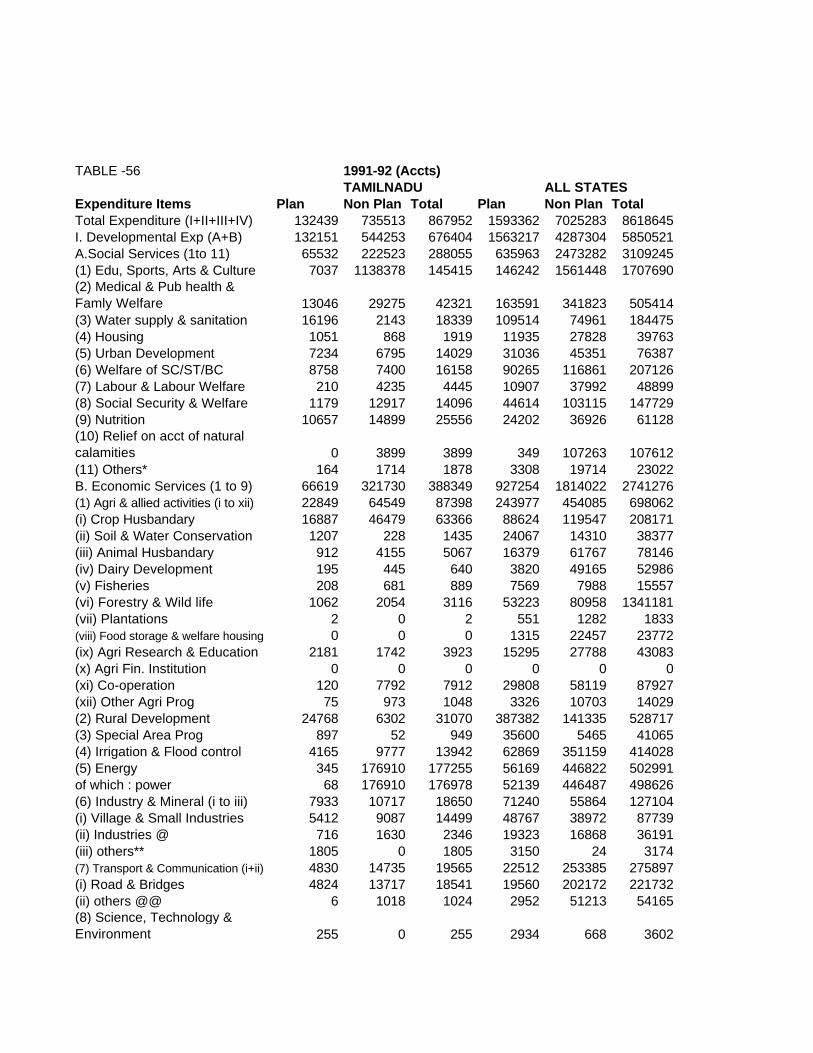
TABLE -56 1991-92 (Accts)TAMILNADU ALL STATES
Expenditure Items Plan Non Plan Total Plan Non Plan TotalTotal Expenditure (I+II+III+IV) 132439 735513 867952 1593362 7025283 8618645I. Developmental Exp (A+B) 132151 544253 676404 1563217 4287304 5850521A.Social Services (1to 11) 65532 222523 288055 635963 2473282 3109245(1) Edu, Sports, Arts & Culture 7037 1138378 145415 146242 1561448 1707690(2) Medical & Pub health & Famly Welfare 13046 29275 42321 163591 341823 505414(3) Water supply & sanitation 16196 2143 18339 109514 74961 184475(4) Housing 1051 868 1919 11935 27828 39763(5) Urban Development 7234 6795 14029 31036 45351 76387(6) Welfare of SC/ST/BC 8758 7400 16158 90265 116861 207126(7) Labour & Labour Welfare 210 4235 4445 10907 37992 48899(8) Social Security & Welfare 1179 12917 14096 44614 103115 147729(9) Nutrition 10657 14899 25556 24202 36926 61128(10) Relief on acct of natural calamities 0 3899 3899 349 107263 107612(11) Others* 164 1714 1878 3308 19714 23022B. Economic Services (1 to 9) 66619 321730 388349 927254 1814022 2741276(1) Agri & allied activities (i to xii) 22849 64549 87398 243977 454085 698062(i) Crop Husbandary 16887 46479 63366 88624 119547 208171(ii) Soil & Water Conservation 1207 228 1435 24067 14310 38377(iii) Animal Husbandary 912 4155 5067 16379 61767 78146(iv) Dairy Development 195 445 640 3820 49165 52986(v) Fisheries 208 681 889 7569 7988 15557(vi) Forestry & Wild life 1062 2054 3116 53223 80958 1341181(vii) Plantations 2 0 2 551 1282 1833(viii) Food storage & welfare housing 0 0 0 1315 22457 23772(ix) Agri Research & Education 2181 1742 3923 15295 27788 43083(x) Agri Fin. Institution 0 0 0 0 0 0(xi) Co-operation 120 7792 7912 29808 58119 87927(xii) Other Agri Prog 75 973 1048 3326 10703 14029(2) Rural Development 24768 6302 31070 387382 141335 528717(3) Special Area Prog 897 52 949 35600 5465 41065(4) Irrigation & Flood control 4165 9777 13942 62869 351159 414028(5) Energy 345 176910 177255 56169 446822 502991of which : power 68 176910 176978 52139 446487 498626(6) Industry & Mineral (i to iii) 7933 10717 18650 71240 55864 127104(i) Village & Small Industries 5412 9087 14499 48767 38972 87739(ii) Industries @ 716 1630 2346 19323 16868 36191(iii) others** 1805 0 1805 3150 24 3174(7) Transport & Communication (i+ii) 4830 14735 19565 22512 253385 275897(i) Road & Bridges 4824 13717 18541 19560 202172 221732(ii) others @@ 6 1018 1024 2952 51213 54165(8) Science, Technology & Environment 255 0 255 2934 668 3602
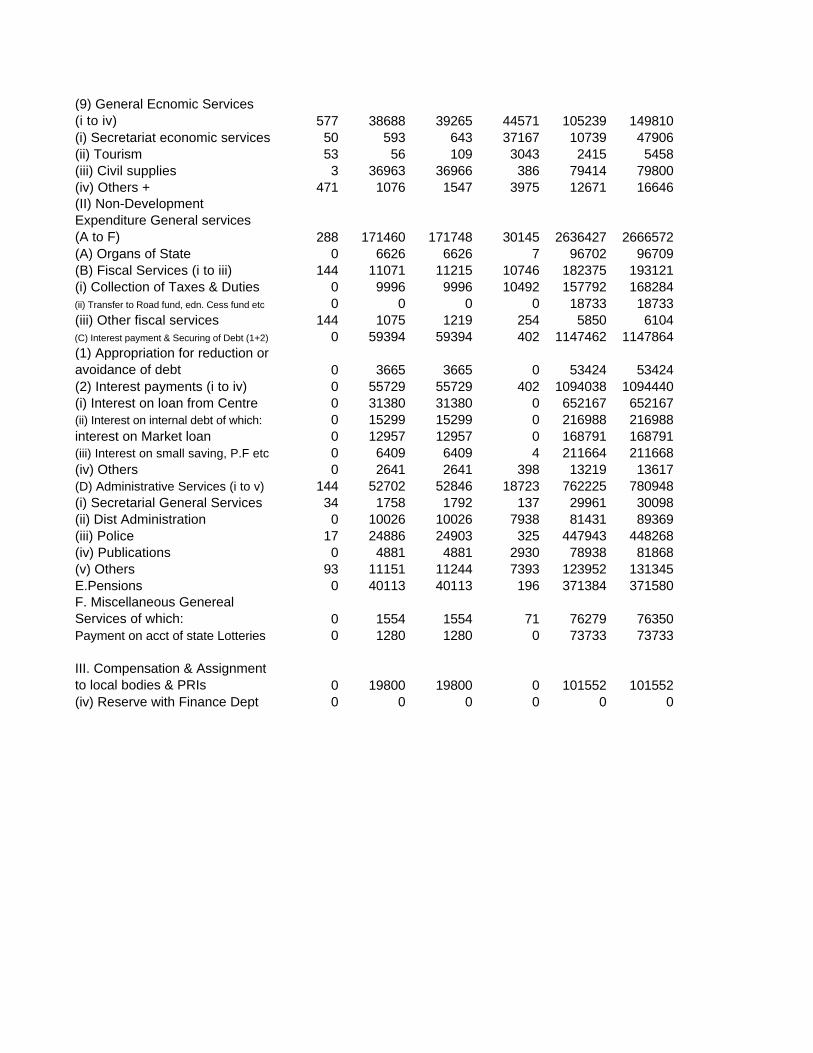
(9) General Ecnomic Services (i to iv) 577 38688 39265 44571 105239 149810(i) Secretariat economic services 50 593 643 37167 10739 47906(ii) Tourism 53 56 109 3043 2415 5458(iii) Civil supplies 3 36963 36966 386 79414 79800(iv) Others + 471 1076 1547 3975 12671 16646(II) Non-Development Expenditure General services (A to F) 288 171460 171748 30145 2636427 2666572(A) Organs of State 0 6626 6626 7 96702 96709(B) Fiscal Services (i to iii) 144 11071 11215 10746 182375 193121(i) Collection of Taxes & Duties 0 9996 9996 10492 157792 168284(ii) Transfer to Road fund, edn. Cess fund etc 0 0 0 0 18733 18733(iii) Other fiscal services 144 1075 1219 254 5850 6104(C) Interest payment & Securing of Debt (1+2) 0 59394 59394 402 1147462 1147864(1) Appropriation for reduction or avoidance of debt 0 3665 3665 0 53424 53424(2) Interest payments (i to iv) 0 55729 55729 402 1094038 1094440(i) Interest on loan from Centre 0 31380 31380 0 652167 652167(ii) Interest on internal debt of which: 0 15299 15299 0 216988 216988interest on Market loan 0 12957 12957 0 168791 168791(iii) Interest on small saving, P.F etc 0 6409 6409 4 211664 211668(iv) Others 0 2641 2641 398 13219 13617(D) Administrative Services (i to v) 144 52702 52846 18723 762225 780948(i) Secretarial General Services 34 1758 1792 137 29961 30098(ii) Dist Administration 0 10026 10026 7938 81431 89369(iii) Police 17 24886 24903 325 447943 448268(iv) Publications 0 4881 4881 2930 78938 81868(v) Others 93 11151 11244 7393 123952 131345E.Pensions 0 40113 40113 196 371384 371580F. Miscellaneous Genereal Services of which: 0 1554 1554 71 76279 76350Payment on acct of state Lotteries 0 1280 1280 0 73733 73733
III. Compensation & Assignment to local bodies & PRIs 0 19800 19800 0 101552 101552(iv) Reserve with Finance Dept 0 0 0 0 0 0
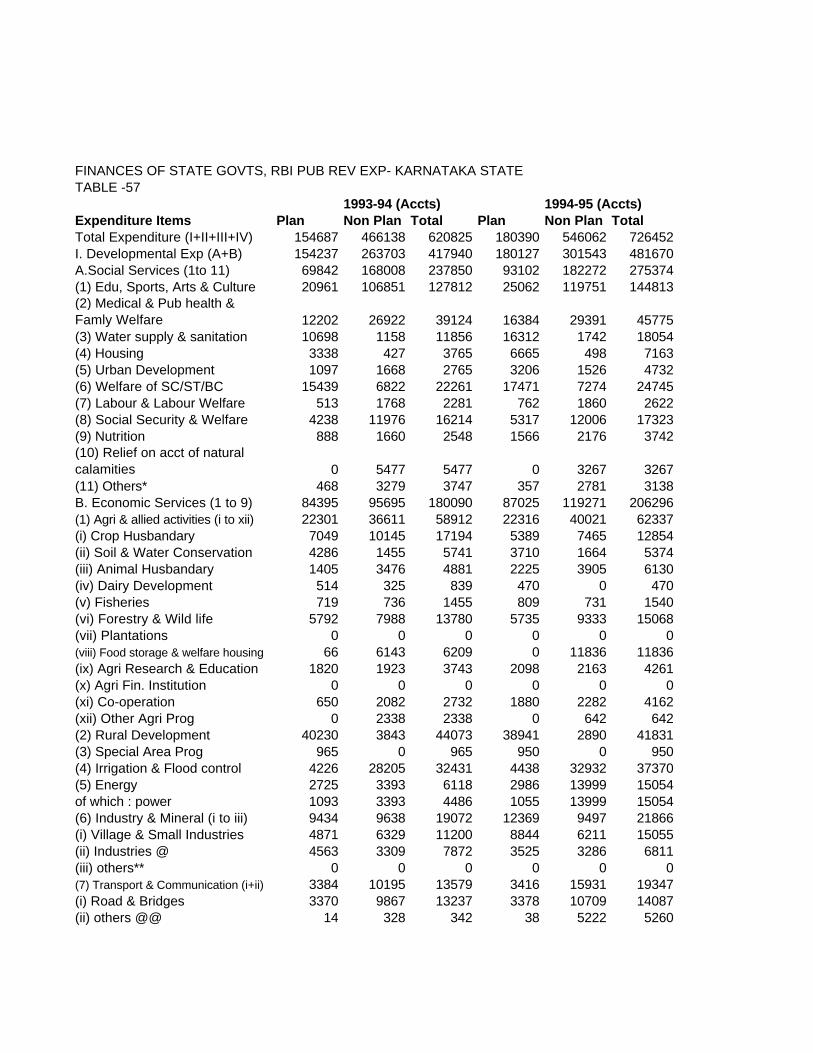
FINANCES OF STATE GOVTS, RBI PUB REV EXP- KARNATAKA STATETABLE -57
1993-94 (Accts) 1994-95 (Accts)Expenditure Items Plan Non Plan Total Plan Non Plan TotalTotal Expenditure (I+II+III+IV) 154687 466138 620825 180390 546062 726452I. Developmental Exp (A+B) 154237 263703 417940 180127 301543 481670A.Social Services (1to 11) 69842 168008 237850 93102 182272 275374(1) Edu, Sports, Arts & Culture 20961 106851 127812 25062 119751 144813(2) Medical & Pub health & Famly Welfare 12202 26922 39124 16384 29391 45775(3) Water supply & sanitation 10698 1158 11856 16312 1742 18054(4) Housing 3338 427 3765 6665 498 7163(5) Urban Development 1097 1668 2765 3206 1526 4732(6) Welfare of SC/ST/BC 15439 6822 22261 17471 7274 24745(7) Labour & Labour Welfare 513 1768 2281 762 1860 2622(8) Social Security & Welfare 4238 11976 16214 5317 12006 17323(9) Nutrition 888 1660 2548 1566 2176 3742(10) Relief on acct of natural calamities 0 5477 5477 0 3267 3267(11) Others* 468 3279 3747 357 2781 3138B. Economic Services (1 to 9) 84395 95695 180090 87025 119271 206296(1) Agri & allied activities (i to xii) 22301 36611 58912 22316 40021 62337(i) Crop Husbandary 7049 10145 17194 5389 7465 12854(ii) Soil & Water Conservation 4286 1455 5741 3710 1664 5374(iii) Animal Husbandary 1405 3476 4881 2225 3905 6130(iv) Dairy Development 514 325 839 470 0 470(v) Fisheries 719 736 1455 809 731 1540(vi) Forestry & Wild life 5792 7988 13780 5735 9333 15068(vii) Plantations 0 0 0 0 0 0(viii) Food storage & welfare housing 66 6143 6209 0 11836 11836(ix) Agri Research & Education 1820 1923 3743 2098 2163 4261(x) Agri Fin. Institution 0 0 0 0 0 0(xi) Co-operation 650 2082 2732 1880 2282 4162(xii) Other Agri Prog 0 2338 2338 0 642 642(2) Rural Development 40230 3843 44073 38941 2890 41831(3) Special Area Prog 965 0 965 950 0 950(4) Irrigation & Flood control 4226 28205 32431 4438 32932 37370(5) Energy 2725 3393 6118 2986 13999 15054of which : power 1093 3393 4486 1055 13999 15054(6) Industry & Mineral (i to iii) 9434 9638 19072 12369 9497 21866(i) Village & Small Industries 4871 6329 11200 8844 6211 15055(ii) Industries @ 4563 3309 7872 3525 3286 6811(iii) others** 0 0 0 0 0 0(7) Transport & Communication (i+ii) 3384 10195 13579 3416 15931 19347(i) Road & Bridges 3370 9867 13237 3378 10709 14087(ii) others @@ 14 328 342 38 5222 5260
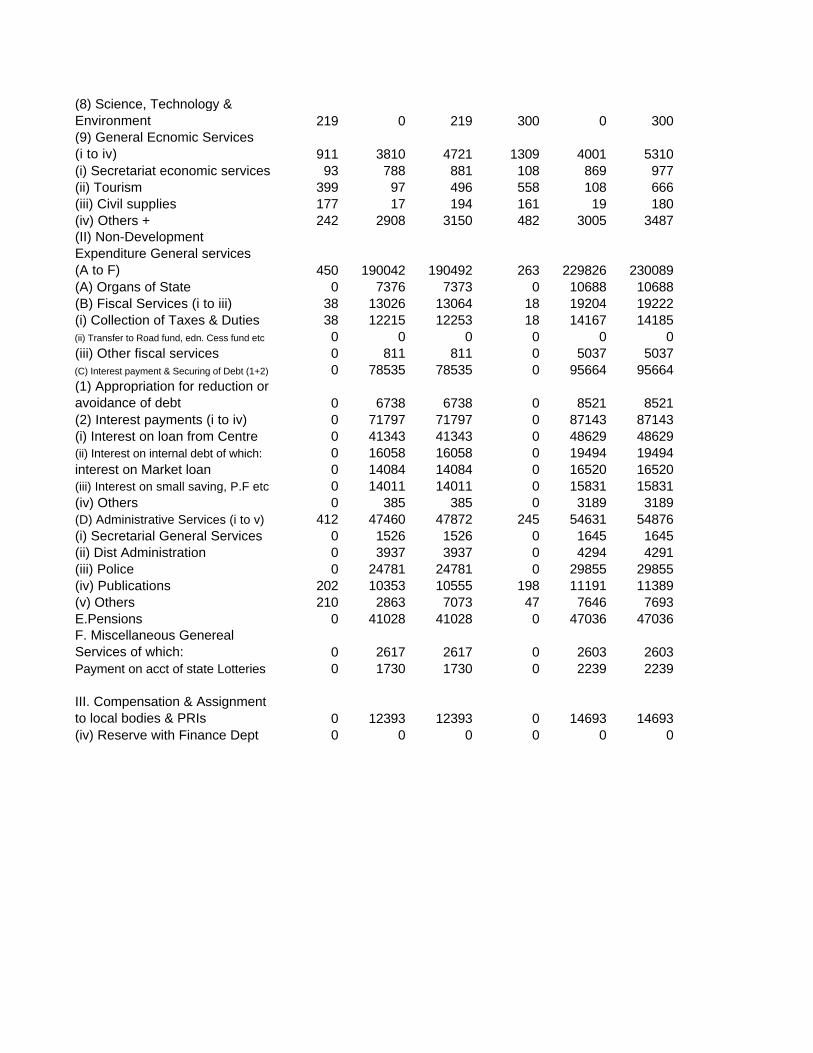
(8) Science, Technology & Environment 219 0 219 300 0 300(9) General Ecnomic Services (i to iv) 911 3810 4721 1309 4001 5310(i) Secretariat economic services 93 788 881 108 869 977(ii) Tourism 399 97 496 558 108 666(iii) Civil supplies 177 17 194 161 19 180(iv) Others + 242 2908 3150 482 3005 3487(II) Non-Development Expenditure General services (A to F) 450 190042 190492 263 229826 230089(A) Organs of State 0 7376 7373 0 10688 10688(B) Fiscal Services (i to iii) 38 13026 13064 18 19204 19222(i) Collection of Taxes & Duties 38 12215 12253 18 14167 14185(ii) Transfer to Road fund, edn. Cess fund etc 0 0 0 0 0 0(iii) Other fiscal services 0 811 811 0 5037 5037(C) Interest payment & Securing of Debt (1+2) 0 78535 78535 0 95664 95664(1) Appropriation for reduction or avoidance of debt 0 6738 6738 0 8521 8521(2) Interest payments (i to iv) 0 71797 71797 0 87143 87143(i) Interest on loan from Centre 0 41343 41343 0 48629 48629(ii) Interest on internal debt of which: 0 16058 16058 0 19494 19494interest on Market loan 0 14084 14084 0 16520 16520(iii) Interest on small saving, P.F etc 0 14011 14011 0 15831 15831(iv) Others 0 385 385 0 3189 3189(D) Administrative Services (i to v) 412 47460 47872 245 54631 54876(i) Secretarial General Services 0 1526 1526 0 1645 1645(ii) Dist Administration 0 3937 3937 0 4294 4291(iii) Police 0 24781 24781 0 29855 29855(iv) Publications 202 10353 10555 198 11191 11389(v) Others 210 2863 7073 47 7646 7693E.Pensions 0 41028 41028 0 47036 47036F. Miscellaneous Genereal Services of which: 0 2617 2617 0 2603 2603Payment on acct of state Lotteries 0 1730 1730 0 2239 2239
III. Compensation & Assignment to local bodies & PRIs 0 12393 12393 0 14693 14693(iv) Reserve with Finance Dept 0 0 0 0 0 0
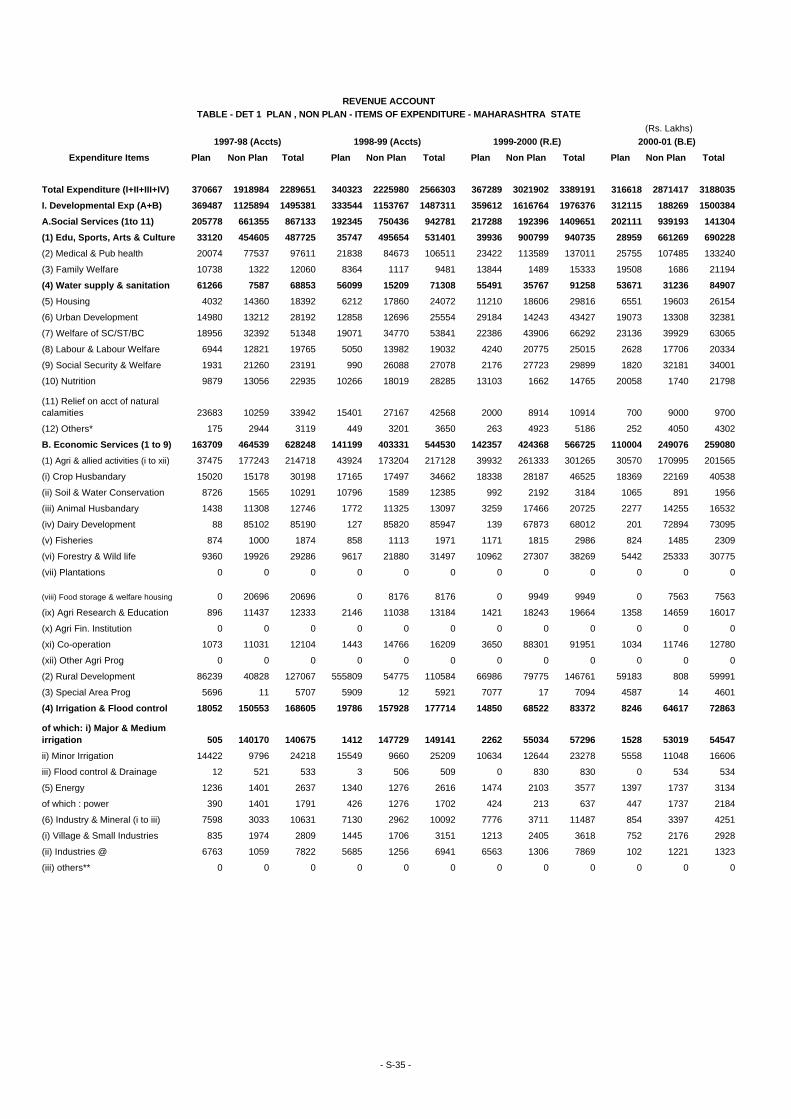
(Rs. Lakhs)1997-98 (Accts) 1998-99 (Accts) 1999-2000 (R.E) 2000-01 (B.E)
Expenditure Items Plan Non Plan Total Plan Non Plan Total Plan Non Plan Total Plan Non Plan Total
Total Expenditure (I+II+III+IV) 370667 1918984 2289651 340323 2225980 2566303 367289 3021902 3389191 316618 2871417 3188035
I. Developmental Exp (A+B) 369487 1125894 1495381 333544 1153767 1487311 359612 1616764 1976376 312115 188269 1500384
A.Social Services (1to 11) 205778 661355 867133 192345 750436 942781 217288 192396 1409651 202111 939193 141304
(1) Edu, Sports, Arts & Culture 33120 454605 487725 35747 495654 531401 39936 900799 940735 28959 661269 690228
(2) Medical & Pub health 20074 77537 97611 21838 84673 106511 23422 113589 137011 25755 107485 133240
(3) Family Welfare 10738 1322 12060 8364 1117 9481 13844 1489 15333 19508 1686 21194
(4) Water supply & sanitation 61266 7587 68853 56099 15209 71308 55491 35767 91258 53671 31236 84907
(5) Housing 4032 14360 18392 6212 17860 24072 11210 18606 29816 6551 19603 26154
(6) Urban Development 14980 13212 28192 12858 12696 25554 29184 14243 43427 19073 13308 32381
(7) Welfare of SC/ST/BC 18956 32392 51348 19071 34770 53841 22386 43906 66292 23136 39929 63065
(8) Labour & Labour Welfare 6944 12821 19765 5050 13982 19032 4240 20775 25015 2628 17706 20334
(9) Social Security & Welfare 1931 21260 23191 990 26088 27078 2176 27723 29899 1820 32181 34001
(10) Nutrition 9879 13056 22935 10266 18019 28285 13103 1662 14765 20058 1740 21798
(11) Relief on acct of natural calamities 23683 10259 33942 15401 27167 42568 2000 8914 10914 700 9000 9700
(12) Others* 175 2944 3119 449 3201 3650 263 4923 5186 252 4050 4302
B. Economic Services (1 to 9) 163709 464539 628248 141199 403331 544530 142357 424368 566725 110004 249076 259080
(1) Agri & allied activities (i to xii) 37475 177243 214718 43924 173204 217128 39932 261333 301265 30570 170995 201565
(i) Crop Husbandary 15020 15178 30198 17165 17497 34662 18338 28187 46525 18369 22169 40538
(ii) Soil & Water Conservation 8726 1565 10291 10796 1589 12385 992 2192 3184 1065 891 1956
(iii) Animal Husbandary 1438 11308 12746 1772 11325 13097 3259 17466 20725 2277 14255 16532
(iv) Dairy Development 88 85102 85190 127 85820 85947 139 67873 68012 201 72894 73095
(v) Fisheries 874 1000 1874 858 1113 1971 1171 1815 2986 824 1485 2309
(vi) Forestry & Wild life 9360 19926 29286 9617 21880 31497 10962 27307 38269 5442 25333 30775
(vii) Plantations 0 0 0 0 0 0 0 0 0 0 0 0
(viii) Food storage & welfare housing 0 20696 20696 0 8176 8176 0 9949 9949 0 7563 7563
(ix) Agri Research & Education 896 11437 12333 2146 11038 13184 1421 18243 19664 1358 14659 16017
(x) Agri Fin. Institution 0 0 0 0 0 0 0 0 0 0 0 0
(xi) Co-operation 1073 11031 12104 1443 14766 16209 3650 88301 91951 1034 11746 12780
(xii) Other Agri Prog 0 0 0 0 0 0 0 0 0 0 0 0
(2) Rural Development 86239 40828 127067 555809 54775 110584 66986 79775 146761 59183 808 59991
(3) Special Area Prog 5696 11 5707 5909 12 5921 7077 17 7094 4587 14 4601
(4) Irrigation & Flood control 18052 150553 168605 19786 157928 177714 14850 68522 83372 8246 64617 72863
of which: i) Major & Medium irrigation 505 140170 140675 1412 147729 149141 2262 55034 57296 1528 53019 54547
ii) Minor Irrigation 14422 9796 24218 15549 9660 25209 10634 12644 23278 5558 11048 16606
iii) Flood control & Drainage 12 521 533 3 506 509 0 830 830 0 534 534
(5) Energy 1236 1401 2637 1340 1276 2616 1474 2103 3577 1397 1737 3134
of which : power 390 1401 1791 426 1276 1702 424 213 637 447 1737 2184
(6) Industry & Mineral (i to iii) 7598 3033 10631 7130 2962 10092 7776 3711 11487 854 3397 4251
(i) Village & Small Industries 835 1974 2809 1445 1706 3151 1213 2405 3618 752 2176 2928
(ii) Industries @ 6763 1059 7822 5685 1256 6941 6563 1306 7869 102 1221 1323
(iii) others** 0 0 0 0 0 0 0 0 0 0 0 0
REVENUE ACCOUNTTABLE - DET 1 PLAN , NON PLAN - ITEMS OF EXPENDITURE - MAHARASHTRA STATE
- S-35 -
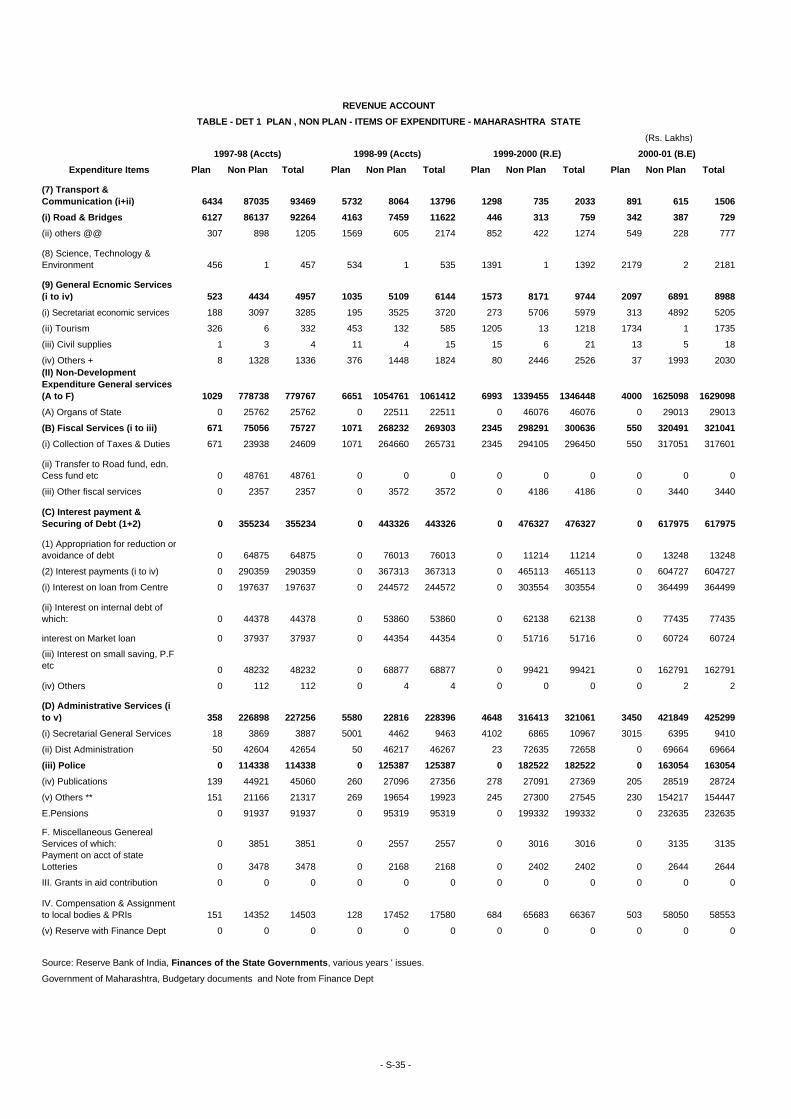
(Rs. Lakhs)
1997-98 (Accts) 1998-99 (Accts) 1999-2000 (R.E) 2000-01 (B.E)
Expenditure Items Plan Non Plan Total Plan Non Plan Total Plan Non Plan Total Plan Non Plan Total
(7) Transport & Communication (i+ii) 6434 87035 93469 5732 8064 13796 1298 735 2033 891 615 1506
(i) Road & Bridges 6127 86137 92264 4163 7459 11622 446 313 759 342 387 729
(ii) others @@ 307 898 1205 1569 605 2174 852 422 1274 549 228 777
(8) Science, Technology & Environment 456 1 457 534 1 535 1391 1 1392 2179 2 2181
(9) General Ecnomic Services (i to iv) 523 4434 4957 1035 5109 6144 1573 8171 9744 2097 6891 8988
(i) Secretariat economic services 188 3097 3285 195 3525 3720 273 5706 5979 313 4892 5205
(ii) Tourism 326 6 332 453 132 585 1205 13 1218 1734 1 1735
(iii) Civil supplies 1 3 4 11 4 15 15 6 21 13 5 18
(iv) Others + 8 1328 1336 376 1448 1824 80 2446 2526 37 1993 2030(II) Non-Development Expenditure General services (A to F) 1029 778738 779767 6651 1054761 1061412 6993 1339455 1346448 4000 1625098 1629098
(A) Organs of State 0 25762 25762 0 22511 22511 0 46076 46076 0 29013 29013
(B) Fiscal Services (i to iii) 671 75056 75727 1071 268232 269303 2345 298291 300636 550 320491 321041
(i) Collection of Taxes & Duties 671 23938 24609 1071 264660 265731 2345 294105 296450 550 317051 317601
(ii) Transfer to Road fund, edn. Cess fund etc 0 48761 48761 0 0 0 0 0 0 0 0 0
(iii) Other fiscal services 0 2357 2357 0 3572 3572 0 4186 4186 0 3440 3440
(C) Interest payment & Securing of Debt (1+2) 0 355234 355234 0 443326 443326 0 476327 476327 0 617975 617975
(1) Appropriation for reduction or avoidance of debt 0 64875 64875 0 76013 76013 0 11214 11214 0 13248 13248
(2) Interest payments (i to iv) 0 290359 290359 0 367313 367313 0 465113 465113 0 604727 604727
(i) Interest on loan from Centre 0 197637 197637 0 244572 244572 0 303554 303554 0 364499 364499
(ii) Interest on internal debt of which: 0 44378 44378 0 53860 53860 0 62138 62138 0 77435 77435
interest on Market loan 0 37937 37937 0 44354 44354 0 51716 51716 0 60724 60724
(iii) Interest on small saving, P.F etc 0 48232 48232 0 68877 68877 0 99421 99421 0 162791 162791
(iv) Others 0 112 112 0 4 4 0 0 0 0 2 2
(D) Administrative Services (i to v) 358 226898 227256 5580 22816 228396 4648 316413 321061 3450 421849 425299
(i) Secretarial General Services 18 3869 3887 5001 4462 9463 4102 6865 10967 3015 6395 9410
(ii) Dist Administration 50 42604 42654 50 46217 46267 23 72635 72658 0 69664 69664
(iii) Police 0 114338 114338 0 125387 125387 0 182522 182522 0 163054 163054
(iv) Publications 139 44921 45060 260 27096 27356 278 27091 27369 205 28519 28724
(v) Others ** 151 21166 21317 269 19654 19923 245 27300 27545 230 154217 154447
E.Pensions 0 91937 91937 0 95319 95319 0 199332 199332 0 232635 232635
F. Miscellaneous Genereal Services of which: 0 3851 3851 0 2557 2557 0 3016 3016 0 3135 3135Payment on acct of state Lotteries 0 3478 3478 0 2168 2168 0 2402 2402 0 2644 2644
III. Grants in aid contribution 0 0 0 0 0 0 0 0 0 0 0 0
IV. Compensation & Assignment to local bodies & PRIs 151 14352 14503 128 17452 17580 684 65683 66367 503 58050 58553
(v) Reserve with Finance Dept 0 0 0 0 0 0 0 0 0 0 0 0
Source: Reserve Bank of India, Finances of the State Governments, various years ' issues.
Government of Maharashtra, Budgetary documents and Note from Finance Dept
REVENUE ACCOUNT
TABLE - DET 1 PLAN , NON PLAN - ITEMS OF EXPENDITURE - MAHARASHTRA STATE
- S-35 -

(Rs. Lakhs)1997-98 (Accts) 1998-99 (Accts) 1999-2000 (R.E) 2000-01 (B.E)
Expenditure Items Plan Non Plan Total Plan Non Plan Total Plan Non Plan Total Plan Non Plan Total
Total Expenditure (I+II+III+IV) 234906 1219523 1454429 356830 1337526 1694356 372215 1645116 2017331 520112 1968041 2488153
I. Developmental Exp (A+B) 231578 736890 968468 355962 761517 1117479 366755 911505 1278260 507253 1101108 1608361
A.Social Services (1to 12) 135734 411658 547392 213103 492468 705571 209213 572669 781882 230684 683726 914410
(1) Edu, Sports, Arts & Culture 17443 206850 224293 53625 230441 284066 62179 281244 343423 59762 348471 408233
(2) Medical & Pub health 15367 52861 68228 22156 59655 81811 22453 79301 101754 24757 86117 110874
(3)Family Welfare 16408 168 16576 21924 150 22074 22046 236 22282 29269 251 29520
(4) Water supply & sanitation 36931 3164 40095 50697 16921 67618 9957 4770 14727 15189 4997 20186
(5) Housing 13118 813 13931 15693 895 16588 16870 1663 18533 12654 931 13585
(6) Urban Development 5549 1534 7083 9014 5354 14368 9259 3006 12265 14406 17835 32241
(7) Welfare of SC/ST/BC 17721 45338 63059 23749 55698 79447 41366 58441 99807 45623 71706 117329
(8) Labour & Labour Welfare 1546 3854 5400 1037 4289 5326 3624 5563 9187 1346 6023 7369
(9) Social Security & Welfare 9148 9586 18734 11263 9947 21210 19473 12175 31648 19581 18556 38137
(10) Nutrition 2341 66422 68763 3795 77665 81460 1800 107286 109086 6556 101425 107981
(11) Relief on acct of natural calamities 0 17509 17509 0 25706 25706 0 14646 14646 0 20100 20100
(12) Others* 162 3559 3721 150 5747 5897 186 4338 4524 1541 7314 8855
B. Economic Services (1 to 9) 95844 325232 421076 142859 269049 411908 157542 338836 496378 276569 417382 693951
(1) Agri & allied activities (i to xii) 23036 36644 59680 25233 42747 67980 27708 51696 79404 30649 54794 85443
(i) Crop Husbandary 10543 7176 17719 11467 7959 19426 11224 10373 21597 16920 11205 28125
(ii) Soil & Water Conservation 810 1233 2043 732 1314 2046 2002 295 10373 280 1783 2063
(iii) Animal Husbandary 429 9940 9511 515 10742 11257 628 13640 14268 867 15672 16539
(iv) Dairy Development 0 50 50 669 184 853
(v) Fisheries 227 1576 1803 422 1050 1472 729 1474 2203 734 1477 2211
(vi) Forestry & Wild life 8523 7945 16468 10063 8269 18332 11622 10474 20096 9958 10912 20870
(vii) Plantations(VII) Food storage & ware housing
(ix) Agri Research & Education 2335 5029 7364 1154 5161 6315 3018 6061 9079 1585 7784 9369
(x) Agri Fin. Institution
(xi) Co-operation 169 3926 4095 206 7743 7949 192 7547 7739 305 5520 5825
(xii) Other Agri Prog 0 298 298 5 325 330 0 420 420 0 441 441
(2) Rural Development 54676 43813 98489 83958 64466 148424 81587 68902 150489 38796 77642 116438
(3) Special Area Prog
(4) Irrigation & Flood control 5759 103696 109455 17146 105783 122929 31063 127412 158475 22000 137616 159616
(I) Major & Medium Irrigation 2798 91641 94439 14157 90734 104891 22539 116141 138680 13500 126426 139926
(ii) Minor Irrigation 2388 7772 5384 2661 3146 5807 7585 4722 12307 7788 4121 11909
(iii) Flood Control
(5) Energy 80 95908 95828 227 5691 5918 100 16774 16784 162700 80481 243181
of which : power 10 95793 95803 9265 7306 16571 0 16703 16703 162600 80417 243017
(6) Industry & Mineral (i to iii) 9498 6683 16181 9265 7306 16571 8550 6276 14826 9660 6714 16374
(i) Village & Small Industries 6324 2974 9298 8343 3896 12239 7796 3132 10928 8256 3392 11648
(ii) Industries @ 3154 3709 6863 897 3410 4307 750 3144 3894 1306 3322 4628
(iii) others** 20 0 20 25 0 25 4 0 4 98 0 98
REVENUE ACCOUNTTABLE - DET 2 PLAN , NON PLAN - ITEMS OF EXPENDITURE - ANDHRA PRADESH STATE
- S-36 -
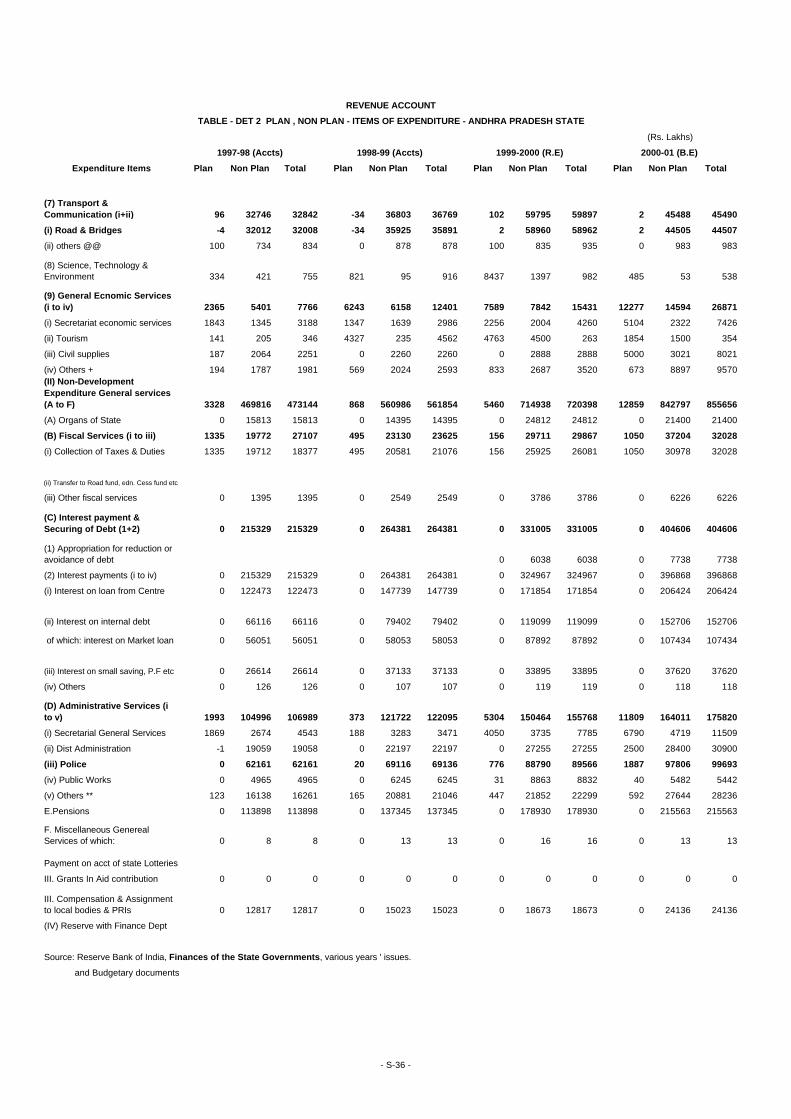
(Rs. Lakhs)
1997-98 (Accts) 1998-99 (Accts) 1999-2000 (R.E) 2000-01 (B.E)
Expenditure Items Plan Non Plan Total Plan Non Plan Total Plan Non Plan Total Plan Non Plan Total
(7) Transport & Communication (i+ii) 96 32746 32842 -34 36803 36769 102 59795 59897 2 45488 45490
(i) Road & Bridges -4 32012 32008 -34 35925 35891 2 58960 58962 2 44505 44507
(ii) others @@ 100 734 834 0 878 878 100 835 935 0 983 983
(8) Science, Technology & Environment 334 421 755 821 95 916 8437 1397 982 485 53 538
(9) General Ecnomic Services (i to iv) 2365 5401 7766 6243 6158 12401 7589 7842 15431 12277 14594 26871
(i) Secretariat economic services 1843 1345 3188 1347 1639 2986 2256 2004 4260 5104 2322 7426
(ii) Tourism 141 205 346 4327 235 4562 4763 4500 263 1854 1500 354
(iii) Civil supplies 187 2064 2251 0 2260 2260 0 2888 2888 5000 3021 8021
(iv) Others + 194 1787 1981 569 2024 2593 833 2687 3520 673 8897 9570(II) Non-Development Expenditure General services (A to F) 3328 469816 473144 868 560986 561854 5460 714938 720398 12859 842797 855656
(A) Organs of State 0 15813 15813 0 14395 14395 0 24812 24812 0 21400 21400
(B) Fiscal Services (i to iii) 1335 19772 27107 495 23130 23625 156 29711 29867 1050 37204 32028
(i) Collection of Taxes & Duties 1335 19712 18377 495 20581 21076 156 25925 26081 1050 30978 32028
(ii) Transfer to Road fund, edn. Cess fund etc
(iii) Other fiscal services 0 1395 1395 0 2549 2549 0 3786 3786 0 6226 6226
(C) Interest payment & Securing of Debt (1+2) 0 215329 215329 0 264381 264381 0 331005 331005 0 404606 404606
(1) Appropriation for reduction or avoidance of debt 0 6038 6038 0 7738 7738
(2) Interest payments (i to iv) 0 215329 215329 0 264381 264381 0 324967 324967 0 396868 396868
(i) Interest on loan from Centre 0 122473 122473 0 147739 147739 0 171854 171854 0 206424 206424
(ii) Interest on internal debt 0 66116 66116 0 79402 79402 0 119099 119099 0 152706 152706
of which: interest on Market loan 0 56051 56051 0 58053 58053 0 87892 87892 0 107434 107434
(iii) Interest on small saving, P.F etc 0 26614 26614 0 37133 37133 0 33895 33895 0 37620 37620
(iv) Others 0 126 126 0 107 107 0 119 119 0 118 118
(D) Administrative Services (i to v) 1993 104996 106989 373 121722 122095 5304 150464 155768 11809 164011 175820
(i) Secretarial General Services 1869 2674 4543 188 3283 3471 4050 3735 7785 6790 4719 11509
(ii) Dist Administration -1 19059 19058 0 22197 22197 0 27255 27255 2500 28400 30900
(iii) Police 0 62161 62161 20 69116 69136 776 88790 89566 1887 97806 99693
(iv) Public Works 0 4965 4965 0 6245 6245 31 8863 8832 40 5482 5442
(v) Others ** 123 16138 16261 165 20881 21046 447 21852 22299 592 27644 28236
E.Pensions 0 113898 113898 0 137345 137345 0 178930 178930 0 215563 215563
F. Miscellaneous Genereal Services of which: 0 8 8 0 13 13 0 16 16 0 13 13
Payment on acct of state Lotteries
III. Grants In Aid contribution 0 0 0 0 0 0 0 0 0 0 0 0
III. Compensation & Assignment to local bodies & PRIs 0 12817 12817 0 15023 15023 0 18673 18673 0 24136 24136
(IV) Reserve with Finance Dept
Source: Reserve Bank of India, Finances of the State Governments, various years ' issues.
and Budgetary documents
REVENUE ACCOUNT
TABLE - DET 2 PLAN , NON PLAN - ITEMS OF EXPENDITURE - ANDHRA PRADESH STATE
- S-36 -
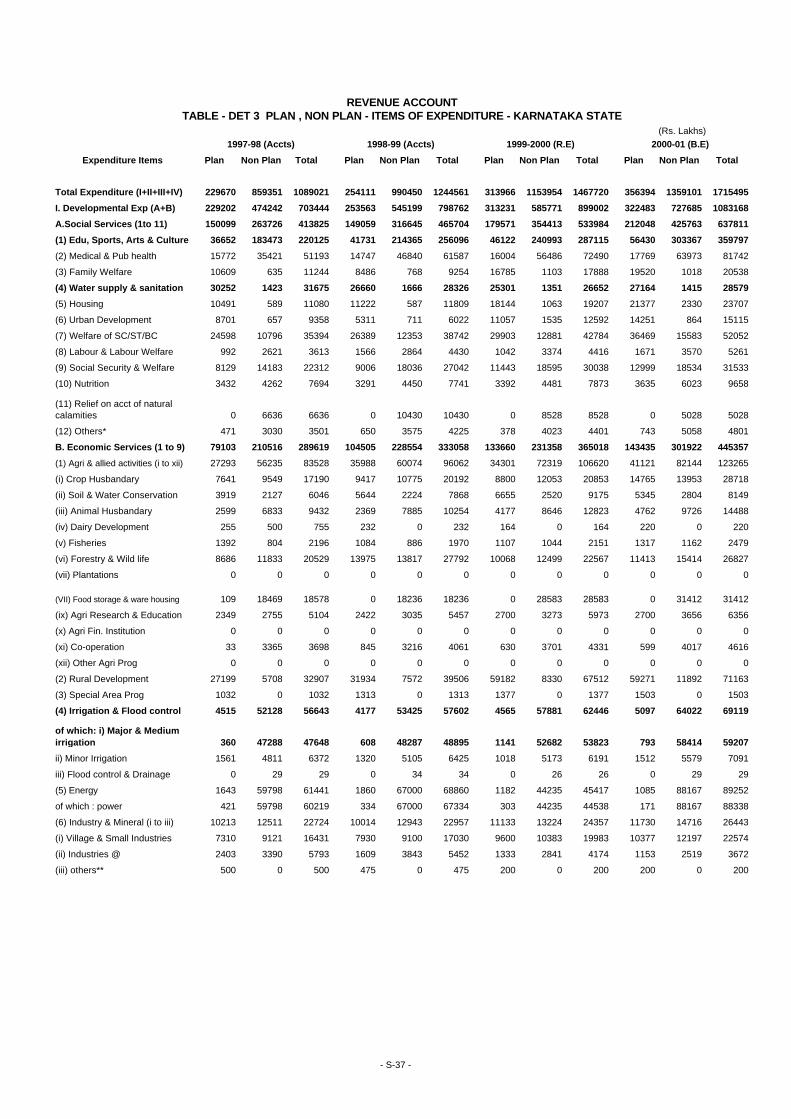
(Rs. Lakhs)1997-98 (Accts) 1998-99 (Accts) 1999-2000 (R.E) 2000-01 (B.E)
Expenditure Items Plan Non Plan Total Plan Non Plan Total Plan Non Plan Total Plan Non Plan Total
Total Expenditure (I+II+III+IV) 229670 859351 1089021 254111 990450 1244561 313966 1153954 1467720 356394 1359101 1715495
I. Developmental Exp (A+B) 229202 474242 703444 253563 545199 798762 313231 585771 899002 322483 727685 1083168
A.Social Services (1to 11) 150099 263726 413825 149059 316645 465704 179571 354413 533984 212048 425763 637811
(1) Edu, Sports, Arts & Culture 36652 183473 220125 41731 214365 256096 46122 240993 287115 56430 303367 359797
(2) Medical & Pub health 15772 35421 51193 14747 46840 61587 16004 56486 72490 17769 63973 81742
(3) Family Welfare 10609 635 11244 8486 768 9254 16785 1103 17888 19520 1018 20538
(4) Water supply & sanitation 30252 1423 31675 26660 1666 28326 25301 1351 26652 27164 1415 28579
(5) Housing 10491 589 11080 11222 587 11809 18144 1063 19207 21377 2330 23707
(6) Urban Development 8701 657 9358 5311 711 6022 11057 1535 12592 14251 864 15115
(7) Welfare of SC/ST/BC 24598 10796 35394 26389 12353 38742 29903 12881 42784 36469 15583 52052
(8) Labour & Labour Welfare 992 2621 3613 1566 2864 4430 1042 3374 4416 1671 3570 5261
(9) Social Security & Welfare 8129 14183 22312 9006 18036 27042 11443 18595 30038 12999 18534 31533
(10) Nutrition 3432 4262 7694 3291 4450 7741 3392 4481 7873 3635 6023 9658
(11) Relief on acct of natural calamities 0 6636 6636 0 10430 10430 0 8528 8528 0 5028 5028
(12) Others* 471 3030 3501 650 3575 4225 378 4023 4401 743 5058 4801
B. Economic Services (1 to 9) 79103 210516 289619 104505 228554 333058 133660 231358 365018 143435 301922 445357
(1) Agri & allied activities (i to xii) 27293 56235 83528 35988 60074 96062 34301 72319 106620 41121 82144 123265
(i) Crop Husbandary 7641 9549 17190 9417 10775 20192 8800 12053 20853 14765 13953 28718
(ii) Soil & Water Conservation 3919 2127 6046 5644 2224 7868 6655 2520 9175 5345 2804 8149
(iii) Animal Husbandary 2599 6833 9432 2369 7885 10254 4177 8646 12823 4762 9726 14488
(iv) Dairy Development 255 500 755 232 0 232 164 0 164 220 0 220
(v) Fisheries 1392 804 2196 1084 886 1970 1107 1044 2151 1317 1162 2479
(vi) Forestry & Wild life 8686 11833 20529 13975 13817 27792 10068 12499 22567 11413 15414 26827
(vii) Plantations 0 0 0 0 0 0 0 0 0 0 0 0
(VII) Food storage & ware housing 109 18469 18578 0 18236 18236 0 28583 28583 0 31412 31412
(ix) Agri Research & Education 2349 2755 5104 2422 3035 5457 2700 3273 5973 2700 3656 6356
(x) Agri Fin. Institution 0 0 0 0 0 0 0 0 0 0 0 0
(xi) Co-operation 33 3365 3698 845 3216 4061 630 3701 4331 599 4017 4616
(xii) Other Agri Prog 0 0 0 0 0 0 0 0 0 0 0 0
(2) Rural Development 27199 5708 32907 31934 7572 39506 59182 8330 67512 59271 11892 71163
(3) Special Area Prog 1032 0 1032 1313 0 1313 1377 0 1377 1503 0 1503
(4) Irrigation & Flood control 4515 52128 56643 4177 53425 57602 4565 57881 62446 5097 64022 69119
of which: i) Major & Medium irrigation 360 47288 47648 608 48287 48895 1141 52682 53823 793 58414 59207
ii) Minor Irrigation 1561 4811 6372 1320 5105 6425 1018 5173 6191 1512 5579 7091
iii) Flood control & Drainage 0 29 29 0 34 34 0 26 26 0 29 29
(5) Energy 1643 59798 61441 1860 67000 68860 1182 44235 45417 1085 88167 89252
of which : power 421 59798 60219 334 67000 67334 303 44235 44538 171 88167 88338
(6) Industry & Mineral (i to iii) 10213 12511 22724 10014 12943 22957 11133 13224 24357 11730 14716 26443
(i) Village & Small Industries 7310 9121 16431 7930 9100 17030 9600 10383 19983 10377 12197 22574
(ii) Industries @ 2403 3390 5793 1609 3843 5452 1333 2841 4174 1153 2519 3672
(iii) others** 500 0 500 475 0 475 200 0 200 200 0 200
REVENUE ACCOUNTTABLE - DET 3 PLAN , NON PLAN - ITEMS OF EXPENDITURE - KARNATAKA STATE
- S-37 -
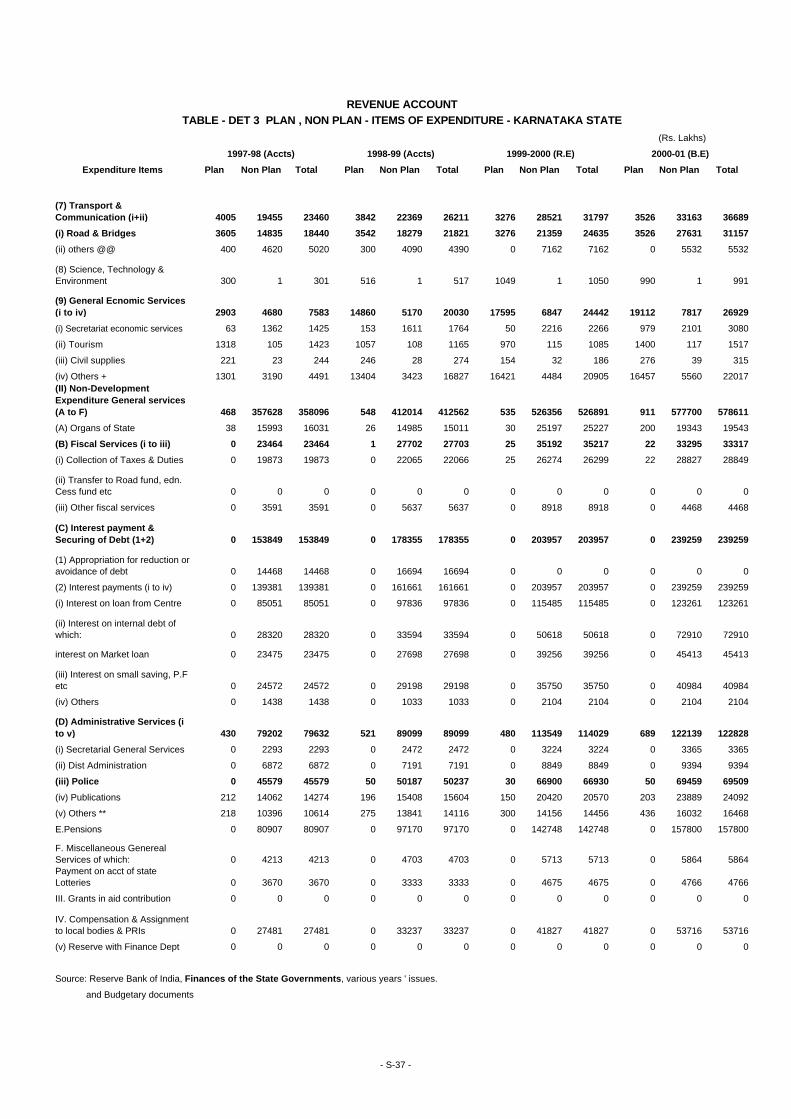
(Rs. Lakhs)
1997-98 (Accts) 1998-99 (Accts) 1999-2000 (R.E) 2000-01 (B.E)
Expenditure Items Plan Non Plan Total Plan Non Plan Total Plan Non Plan Total Plan Non Plan Total
(7) Transport & Communication (i+ii) 4005 19455 23460 3842 22369 26211 3276 28521 31797 3526 33163 36689
(i) Road & Bridges 3605 14835 18440 3542 18279 21821 3276 21359 24635 3526 27631 31157
(ii) others @@ 400 4620 5020 300 4090 4390 0 7162 7162 0 5532 5532
(8) Science, Technology & Environment 300 1 301 516 1 517 1049 1 1050 990 1 991
(9) General Ecnomic Services (i to iv) 2903 4680 7583 14860 5170 20030 17595 6847 24442 19112 7817 26929
(i) Secretariat economic services 63 1362 1425 153 1611 1764 50 2216 2266 979 2101 3080
(ii) Tourism 1318 105 1423 1057 108 1165 970 115 1085 1400 117 1517
(iii) Civil supplies 221 23 244 246 28 274 154 32 186 276 39 315
(iv) Others + 1301 3190 4491 13404 3423 16827 16421 4484 20905 16457 5560 22017(II) Non-Development Expenditure General services (A to F) 468 357628 358096 548 412014 412562 535 526356 526891 911 577700 578611
(A) Organs of State 38 15993 16031 26 14985 15011 30 25197 25227 200 19343 19543
(B) Fiscal Services (i to iii) 0 23464 23464 1 27702 27703 25 35192 35217 22 33295 33317
(i) Collection of Taxes & Duties 0 19873 19873 0 22065 22066 25 26274 26299 22 28827 28849
(ii) Transfer to Road fund, edn. Cess fund etc 0 0 0 0 0 0 0 0 0 0 0 0
(iii) Other fiscal services 0 3591 3591 0 5637 5637 0 8918 8918 0 4468 4468
(C) Interest payment & Securing of Debt (1+2) 0 153849 153849 0 178355 178355 0 203957 203957 0 239259 239259
(1) Appropriation for reduction or avoidance of debt 0 14468 14468 0 16694 16694 0 0 0 0 0 0
(2) Interest payments (i to iv) 0 139381 139381 0 161661 161661 0 203957 203957 0 239259 239259
(i) Interest on loan from Centre 0 85051 85051 0 97836 97836 0 115485 115485 0 123261 123261
(ii) Interest on internal debt of which: 0 28320 28320 0 33594 33594 0 50618 50618 0 72910 72910
interest on Market loan 0 23475 23475 0 27698 27698 0 39256 39256 0 45413 45413
(iii) Interest on small saving, P.F etc 0 24572 24572 0 29198 29198 0 35750 35750 0 40984 40984
(iv) Others 0 1438 1438 0 1033 1033 0 2104 2104 0 2104 2104
(D) Administrative Services (i to v) 430 79202 79632 521 89099 89099 480 113549 114029 689 122139 122828
(i) Secretarial General Services 0 2293 2293 0 2472 2472 0 3224 3224 0 3365 3365
(ii) Dist Administration 0 6872 6872 0 7191 7191 0 8849 8849 0 9394 9394
(iii) Police 0 45579 45579 50 50187 50237 30 66900 66930 50 69459 69509
(iv) Publications 212 14062 14274 196 15408 15604 150 20420 20570 203 23889 24092
(v) Others ** 218 10396 10614 275 13841 14116 300 14156 14456 436 16032 16468
E.Pensions 0 80907 80907 0 97170 97170 0 142748 142748 0 157800 157800
F. Miscellaneous Genereal Services of which: 0 4213 4213 0 4703 4703 0 5713 5713 0 5864 5864Payment on acct of state Lotteries 0 3670 3670 0 3333 3333 0 4675 4675 0 4766 4766
III. Grants in aid contribution 0 0 0 0 0 0 0 0 0 0 0 0
IV. Compensation & Assignment to local bodies & PRIs 0 27481 27481 0 33237 33237 0 41827 41827 0 53716 53716
(v) Reserve with Finance Dept 0 0 0 0 0 0 0 0 0 0 0 0
Source: Reserve Bank of India, Finances of the State Governments, various years ' issues.
and Budgetary documents
REVENUE ACCOUNTTABLE - DET 3 PLAN , NON PLAN - ITEMS OF EXPENDITURE - KARNATAKA STATE
- S-37 -

(Rs. Lakhs)1997-98 (Accts) 1998-99 (Accts) 1999-2000 (R.E) 2000-01 (B.E)
Expenditure Items Plan Non Plan Total Plan Non Plan Total Plan Non Plan Total Plan Non Plan Total
Total Expenditure (I+II+III+IV) 213214 1281871 1495085 243013 1526727 1769740 242421 1774181 2016602 221294 1935193 2156487
I. Developmental Exp (A+B) 203206 741646 944852 232890 845375 1078265 230699 937161 1167860 217060 1029590 1246650
A.Social Services (1to 12) 107919 453426 561345 128274 581860 710134 128542 634152 762694 119890 696152 816042
(1) Edu, Sports, Arts & Culture 16347 272610 288957 18754 366549 385303 24297 395286 419583 24238 437466 461704
(2) Medical & Pub health 12076 62520 74596 12150 78669 90819 11687 82838 94525 13317 92307 105624
(3)Family Welfare 14921 439 1536 17919 1240 19159 15477 1305 16782 16029 1382 17411
(4) Water supply & sanitation 15750 6049 21799 21429 4904 26333 17960 7710 25670 5434 10024 15458
(5) Housing 1370 1382 2752 5865 1575 7440 835 1705 2540 618 1841 2459
(6) Urban Development 11133 1827 12960 9896 2513 12409 10191 2627 12818 12759 2860 15619
(7) Welfare of SC/ST/BC 19966 18729 38695 21066 23849 44915 25882 26458 52340 26227 29150 55377
(8) Labour & Labour Welfare 433 7130 7563 282 8906 9188 269 11659 11928 291 12662 12953
(9) Social Security & Welfare 2285 43199 45484 2459 51438 53897 3025 52762 55787 3061 56000 59061
(10) Nutrition 13514 27062 40576 18225 30453 48678 18787 40276 59063 17882 40237 58119
(11) Relief on acct of natural calamities 2 9402 9404 -2 5550 5548 NA 6863 6863 NA 6863 6863
(12) Others* 122 3077 3199 231 6214 6445 132 4663 4795 34 5360 5394
B. Economic Services (1 to 9) 95287 288220 383507 104616 263515 368131 102157 303009 405166 97170 333438 430608
(1) Agri & allied activities (i to xii) 23814 100536 124350 28630 116508 145138 36173 165927 202100 33528 88780 122308
(i) Crop Husbandary 11715 72726 84441 12477 84561 94038 16336 128115 144451 16048 47646 63694
(ii) Soil & Water Conservation 3132 293 3425 4866 397 5263 5247 420 5667 6826 520 7346
(iii) Animal Husbandary 923 8596 9519 1569 10716 12285 1278 11034 12312 1332 12557 13889
(iv) Dairy Development 2 829 831 26 1654 1680 29 2620 2649 39 1270 1309
(v) Fisheries 1321 1098 2419 1960 1612 3572 1605 1452 3057 1495 1625 3120
(vi) Forestry & Wild life 1973 4173 6146 2729 5397 8126 2999 5323 8322 3031 6127 9158
(vii) Plantations 1 0 1 1 0 1 1 0 1 1 0 1
(VII) Food storage & ware housing 0 0 0 0 0 0 0 0 0 0 0 0
(ix) Agri Research & Education 3664 3793 7457 4094 4077 8191 7218 5601 12819 4343 6015 10358
(x) Agri Fin. Institution 0 0 0 0 0 0 0 0 0 0 0 0
(xi) Co-operation 291 6881 7172 368 8197 8565 1183 8380 9563 154 9678 9832
(xii) Other Agri Prog 792 2147 2939 540 2897 3437 277 2982 3259 259 3342 3601
(2) Rural Development 42316 10861 53177 43980 12682 56662 40545 13687 54232 38703 16581 55284
(3) Special Area Prog 1513 19 1532 1635 27 1662 1437 29 1466 1438 33 1471
(4) Irrigation & Flood control 9705 22898 32603 11033 28517 39550 9893 13532 23425 8996 14681 23677
(I) Major & Medium Irrigation 4193 19817 24010 4479 24684 29163 4849 9981 14830 5043 10788 15831
(ii) Minor Irrigation 2166 2929 5095 3159 3594 6753 1982 3552 5534 637 3894 4531
(iii) Flood Control 0 151 151 0 238 238 0 0 0 0 0 0
(5) Energy 116 0 116 118 0 118 175 52 227 181 100 281
of which : power 0 0 0 0 0 0 0 0 0 0 0 0
(6) Industry & Mineral (i to iii) 14915 10048 24963 14511 15741 30252 9156 10494 19650 9955 12055 22010
(i) Village & Small Industries 7256 7872 15128 9475 13775 23250 6939 9475 16414 6851 11058 17909
(ii) Industries @ 1522 882 2404 975 1756 2731 601 1019 1620 1104 998 2102
(iii) others** 6137 1294 7431 4061 210 4271 1616 0 1616 2000 0 2000
REVENUE ACCOUNTTABLE - DET 4 PLAN , NON PLAN - ITEMS OF EXPENDITURE - TAMILNADU STATE
- S-38 -
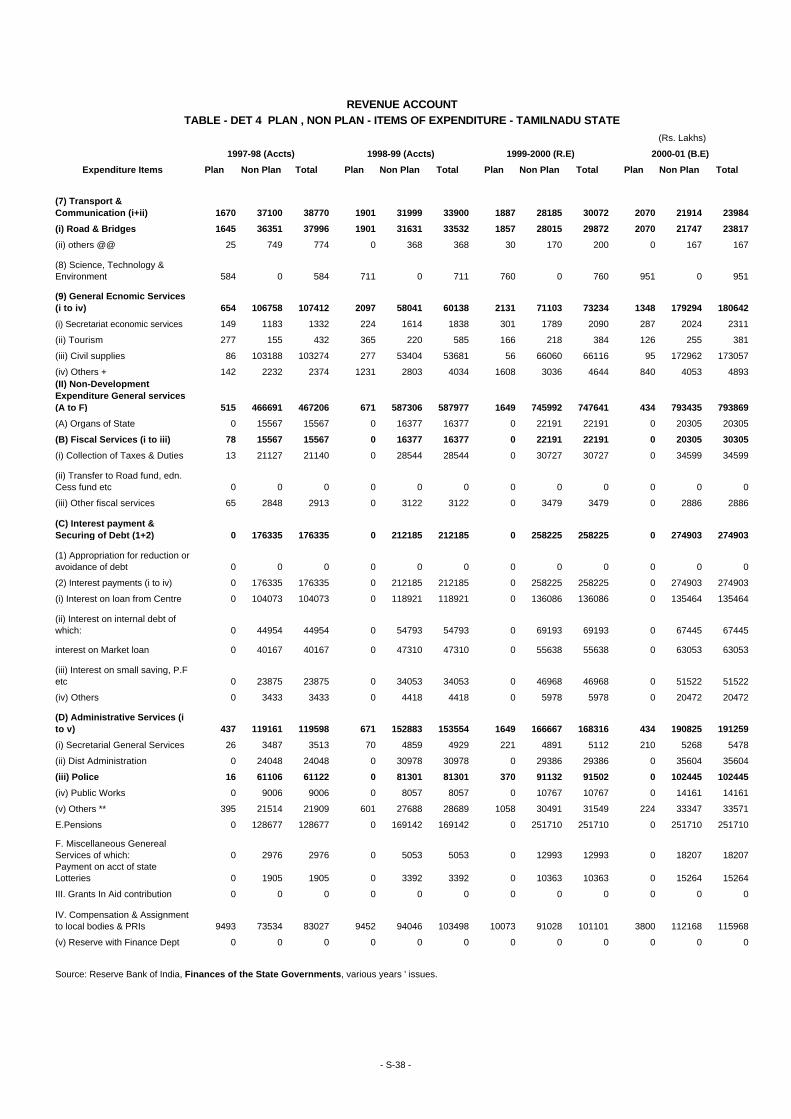
(Rs. Lakhs)
1997-98 (Accts) 1998-99 (Accts) 1999-2000 (R.E) 2000-01 (B.E)
Expenditure Items Plan Non Plan Total Plan Non Plan Total Plan Non Plan Total Plan Non Plan Total
(7) Transport & Communication (i+ii) 1670 37100 38770 1901 31999 33900 1887 28185 30072 2070 21914 23984
(i) Road & Bridges 1645 36351 37996 1901 31631 33532 1857 28015 29872 2070 21747 23817
(ii) others @@ 25 749 774 0 368 368 30 170 200 0 167 167
(8) Science, Technology & Environment 584 0 584 711 0 711 760 0 760 951 0 951
(9) General Ecnomic Services (i to iv) 654 106758 107412 2097 58041 60138 2131 71103 73234 1348 179294 180642
(i) Secretariat economic services 149 1183 1332 224 1614 1838 301 1789 2090 287 2024 2311
(ii) Tourism 277 155 432 365 220 585 166 218 384 126 255 381
(iii) Civil supplies 86 103188 103274 277 53404 53681 56 66060 66116 95 172962 173057
(iv) Others + 142 2232 2374 1231 2803 4034 1608 3036 4644 840 4053 4893(II) Non-Development Expenditure General services (A to F) 515 466691 467206 671 587306 587977 1649 745992 747641 434 793435 793869
(A) Organs of State 0 15567 15567 0 16377 16377 0 22191 22191 0 20305 20305
(B) Fiscal Services (i to iii) 78 15567 15567 0 16377 16377 0 22191 22191 0 20305 30305
(i) Collection of Taxes & Duties 13 21127 21140 0 28544 28544 0 30727 30727 0 34599 34599
(ii) Transfer to Road fund, edn. Cess fund etc 0 0 0 0 0 0 0 0 0 0 0 0
(iii) Other fiscal services 65 2848 2913 0 3122 3122 0 3479 3479 0 2886 2886
(C) Interest payment & Securing of Debt (1+2) 0 176335 176335 0 212185 212185 0 258225 258225 0 274903 274903
(1) Appropriation for reduction or avoidance of debt 0 0 0 0 0 0 0 0 0 0 0 0
(2) Interest payments (i to iv) 0 176335 176335 0 212185 212185 0 258225 258225 0 274903 274903
(i) Interest on loan from Centre 0 104073 104073 0 118921 118921 0 136086 136086 0 135464 135464
(ii) Interest on internal debt of which: 0 44954 44954 0 54793 54793 0 69193 69193 0 67445 67445
interest on Market loan 0 40167 40167 0 47310 47310 0 55638 55638 0 63053 63053
(iii) Interest on small saving, P.F etc 0 23875 23875 0 34053 34053 0 46968 46968 0 51522 51522
(iv) Others 0 3433 3433 0 4418 4418 0 5978 5978 0 20472 20472
(D) Administrative Services (i to v) 437 119161 119598 671 152883 153554 1649 166667 168316 434 190825 191259
(i) Secretarial General Services 26 3487 3513 70 4859 4929 221 4891 5112 210 5268 5478
(ii) Dist Administration 0 24048 24048 0 30978 30978 0 29386 29386 0 35604 35604
(iii) Police 16 61106 61122 0 81301 81301 370 91132 91502 0 102445 102445
(iv) Public Works 0 9006 9006 0 8057 8057 0 10767 10767 0 14161 14161
(v) Others ** 395 21514 21909 601 27688 28689 1058 30491 31549 224 33347 33571
E.Pensions 0 128677 128677 0 169142 169142 0 251710 251710 0 251710 251710
F. Miscellaneous Genereal Services of which: 0 2976 2976 0 5053 5053 0 12993 12993 0 18207 18207Payment on acct of state Lotteries 0 1905 1905 0 3392 3392 0 10363 10363 0 15264 15264
III. Grants In Aid contribution 0 0 0 0 0 0 0 0 0 0 0 0
IV. Compensation & Assignment to local bodies & PRIs 9493 73534 83027 9452 94046 103498 10073 91028 101101 3800 112168 115968
(v) Reserve with Finance Dept 0 0 0 0 0 0 0 0 0 0 0 0
Source: Reserve Bank of India, Finances of the State Governments, various years ' issues.
REVENUE ACCOUNTTABLE - DET 4 PLAN , NON PLAN - ITEMS OF EXPENDITURE - TAMILNADU STATE
- S-38 -
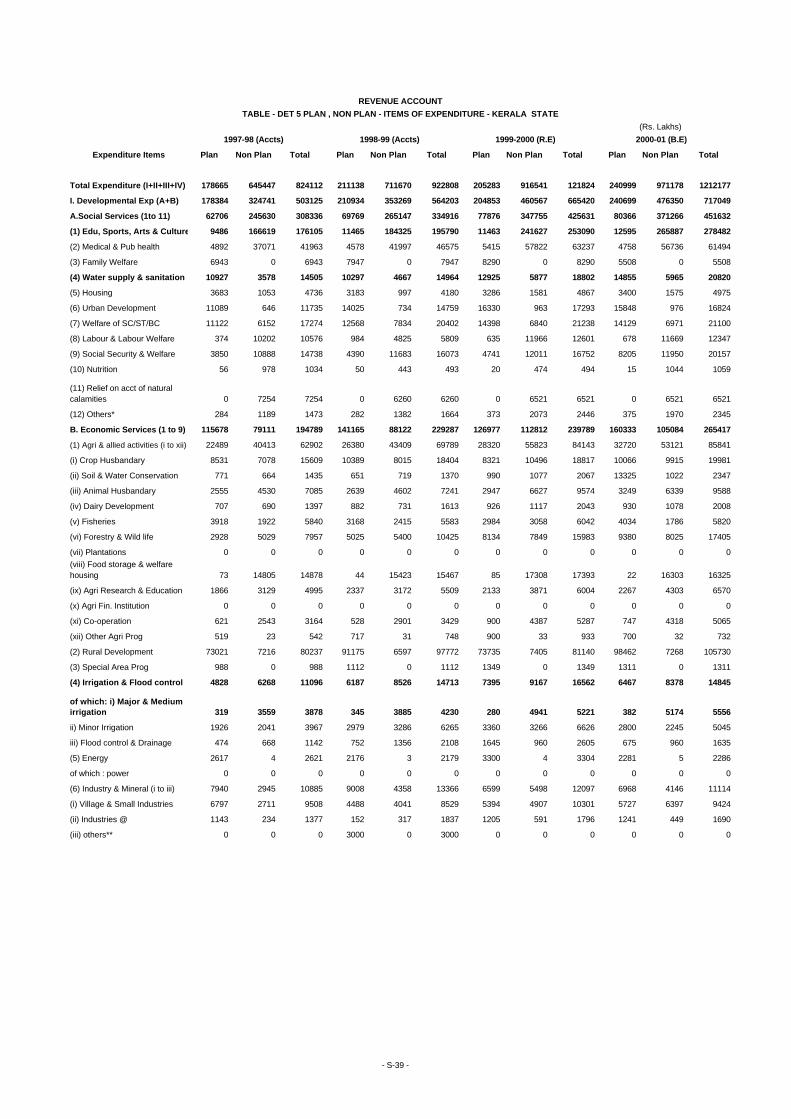
(Rs. Lakhs)1997-98 (Accts) 1998-99 (Accts) 1999-2000 (R.E) 2000-01 (B.E)
Expenditure Items Plan Non Plan Total Plan Non Plan Total Plan Non Plan Total Plan Non Plan Total
Total Expenditure (I+II+III+IV) 178665 645447 824112 211138 711670 922808 205283 916541 121824 240999 971178 1212177
I. Developmental Exp (A+B) 178384 324741 503125 210934 353269 564203 204853 460567 665420 240699 476350 717049
A.Social Services (1to 11) 62706 245630 308336 69769 265147 334916 77876 347755 425631 80366 371266 451632
(1) Edu, Sports, Arts & Culture 9486 166619 176105 11465 184325 195790 11463 241627 253090 12595 265887 278482
(2) Medical & Pub health 4892 37071 41963 4578 41997 46575 5415 57822 63237 4758 56736 61494
(3) Family Welfare 6943 0 6943 7947 0 7947 8290 0 8290 5508 0 5508
(4) Water supply & sanitation 10927 3578 14505 10297 4667 14964 12925 5877 18802 14855 5965 20820
(5) Housing 3683 1053 4736 3183 997 4180 3286 1581 4867 3400 1575 4975
(6) Urban Development 11089 646 11735 14025 734 14759 16330 963 17293 15848 976 16824
(7) Welfare of SC/ST/BC 11122 6152 17274 12568 7834 20402 14398 6840 21238 14129 6971 21100
(8) Labour & Labour Welfare 374 10202 10576 984 4825 5809 635 11966 12601 678 11669 12347
(9) Social Security & Welfare 3850 10888 14738 4390 11683 16073 4741 12011 16752 8205 11950 20157
(10) Nutrition 56 978 1034 50 443 493 20 474 494 15 1044 1059
(11) Relief on acct of natural calamities 0 7254 7254 0 6260 6260 0 6521 6521 0 6521 6521
(12) Others* 284 1189 1473 282 1382 1664 373 2073 2446 375 1970 2345
B. Economic Services (1 to 9) 115678 79111 194789 141165 88122 229287 126977 112812 239789 160333 105084 265417
(1) Agri & allied activities (i to xii) 22489 40413 62902 26380 43409 69789 28320 55823 84143 32720 53121 85841
(i) Crop Husbandary 8531 7078 15609 10389 8015 18404 8321 10496 18817 10066 9915 19981
(ii) Soil & Water Conservation 771 664 1435 651 719 1370 990 1077 2067 13325 1022 2347
(iii) Animal Husbandary 2555 4530 7085 2639 4602 7241 2947 6627 9574 3249 6339 9588
(iv) Dairy Development 707 690 1397 882 731 1613 926 1117 2043 930 1078 2008
(v) Fisheries 3918 1922 5840 3168 2415 5583 2984 3058 6042 4034 1786 5820
(vi) Forestry & Wild life 2928 5029 7957 5025 5400 10425 8134 7849 15983 9380 8025 17405
(vii) Plantations 0 0 0 0 0 0 0 0 0 0 0 0(viii) Food storage & welfare housing 73 14805 14878 44 15423 15467 85 17308 17393 22 16303 16325
(ix) Agri Research & Education 1866 3129 4995 2337 3172 5509 2133 3871 6004 2267 4303 6570
(x) Agri Fin. Institution 0 0 0 0 0 0 0 0 0 0 0 0
(xi) Co-operation 621 2543 3164 528 2901 3429 900 4387 5287 747 4318 5065
(xii) Other Agri Prog 519 23 542 717 31 748 900 33 933 700 32 732
(2) Rural Development 73021 7216 80237 91175 6597 97772 73735 7405 81140 98462 7268 105730
(3) Special Area Prog 988 0 988 1112 0 1112 1349 0 1349 1311 0 1311
(4) Irrigation & Flood control 4828 6268 11096 6187 8526 14713 7395 9167 16562 6467 8378 14845
of which: i) Major & Medium irrigation 319 3559 3878 345 3885 4230 280 4941 5221 382 5174 5556
ii) Minor Irrigation 1926 2041 3967 2979 3286 6265 3360 3266 6626 2800 2245 5045
iii) Flood control & Drainage 474 668 1142 752 1356 2108 1645 960 2605 675 960 1635
(5) Energy 2617 4 2621 2176 3 2179 3300 4 3304 2281 5 2286
of which : power 0 0 0 0 0 0 0 0 0 0 0 0
(6) Industry & Mineral (i to iii) 7940 2945 10885 9008 4358 13366 6599 5498 12097 6968 4146 11114
(i) Village & Small Industries 6797 2711 9508 4488 4041 8529 5394 4907 10301 5727 6397 9424
(ii) Industries @ 1143 234 1377 152 317 1837 1205 591 1796 1241 449 1690
(iii) others** 0 0 0 3000 0 3000 0 0 0 0 0 0
TABLE - DET 5 PLAN , NON PLAN - ITEMS OF EXPENDITURE - KERALA STATEREVENUE ACCOUNT
- S-39 -
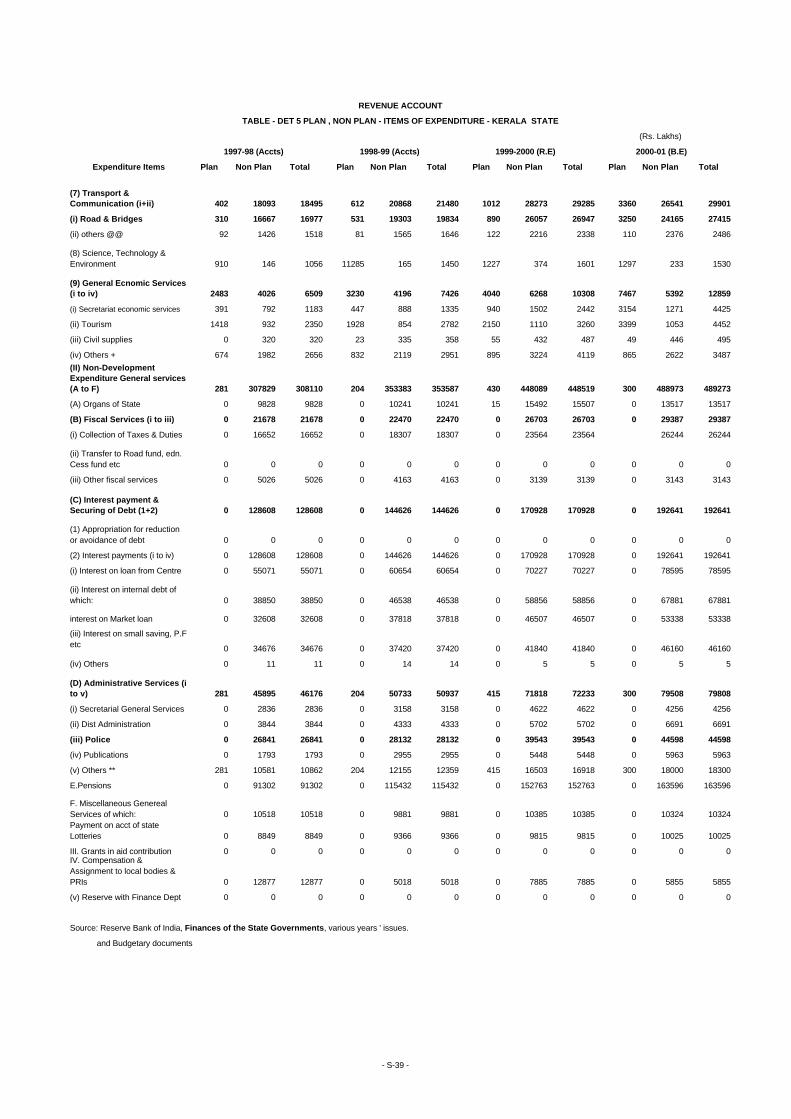
(Rs. Lakhs)
1997-98 (Accts) 1998-99 (Accts) 1999-2000 (R.E) 2000-01 (B.E)
Expenditure Items Plan Non Plan Total Plan Non Plan Total Plan Non Plan Total Plan Non Plan Total
(7) Transport & Communication (i+ii) 402 18093 18495 612 20868 21480 1012 28273 29285 3360 26541 29901
(i) Road & Bridges 310 16667 16977 531 19303 19834 890 26057 26947 3250 24165 27415
(ii) others @@ 92 1426 1518 81 1565 1646 122 2216 2338 110 2376 2486
(8) Science, Technology & Environment 910 146 1056 11285 165 1450 1227 374 1601 1297 233 1530
(9) General Ecnomic Services (i to iv) 2483 4026 6509 3230 4196 7426 4040 6268 10308 7467 5392 12859
(i) Secretariat economic services 391 792 1183 447 888 1335 940 1502 2442 3154 1271 4425
(ii) Tourism 1418 932 2350 1928 854 2782 2150 1110 3260 3399 1053 4452
(iii) Civil supplies 0 320 320 23 335 358 55 432 487 49 446 495
(iv) Others + 674 1982 2656 832 2119 2951 895 3224 4119 865 2622 3487(II) Non-Development Expenditure General services (A to F) 281 307829 308110 204 353383 353587 430 448089 448519 300 488973 489273
(A) Organs of State 0 9828 9828 0 10241 10241 15 15492 15507 0 13517 13517
(B) Fiscal Services (i to iii) 0 21678 21678 0 22470 22470 0 26703 26703 0 29387 29387
(i) Collection of Taxes & Duties 0 16652 16652 0 18307 18307 0 23564 23564 26244 26244
(ii) Transfer to Road fund, edn. Cess fund etc 0 0 0 0 0 0 0 0 0 0 0 0
(iii) Other fiscal services 0 5026 5026 0 4163 4163 0 3139 3139 0 3143 3143
(C) Interest payment & Securing of Debt (1+2) 0 128608 128608 0 144626 144626 0 170928 170928 0 192641 192641
(1) Appropriation for reduction or avoidance of debt 0 0 0 0 0 0 0 0 0 0 0 0
(2) Interest payments (i to iv) 0 128608 128608 0 144626 144626 0 170928 170928 0 192641 192641
(i) Interest on loan from Centre 0 55071 55071 0 60654 60654 0 70227 70227 0 78595 78595
(ii) Interest on internal debt of which: 0 38850 38850 0 46538 46538 0 58856 58856 0 67881 67881
interest on Market loan 0 32608 32608 0 37818 37818 0 46507 46507 0 53338 53338
(iii) Interest on small saving, P.F etc 0 34676 34676 0 37420 37420 0 41840 41840 0 46160 46160
(iv) Others 0 11 11 0 14 14 0 5 5 0 5 5
(D) Administrative Services (i to v) 281 45895 46176 204 50733 50937 415 71818 72233 300 79508 79808
(i) Secretarial General Services 0 2836 2836 0 3158 3158 0 4622 4622 0 4256 4256
(ii) Dist Administration 0 3844 3844 0 4333 4333 0 5702 5702 0 6691 6691
(iii) Police 0 26841 26841 0 28132 28132 0 39543 39543 0 44598 44598
(iv) Publications 0 1793 1793 0 2955 2955 0 5448 5448 0 5963 5963
(v) Others ** 281 10581 10862 204 12155 12359 415 16503 16918 300 18000 18300
E.Pensions 0 91302 91302 0 115432 115432 0 152763 152763 0 163596 163596
F. Miscellaneous Genereal Services of which: 0 10518 10518 0 9881 9881 0 10385 10385 0 10324 10324Payment on acct of state Lotteries 0 8849 8849 0 9366 9366 0 9815 9815 0 10025 10025
III. Grants in aid contribution 0 0 0 0 0 0 0 0 0 0 0 0IV. Compensation & Assignment to local bodies & PRIs 0 12877 12877 0 5018 5018 0 7885 7885 0 5855 5855
(v) Reserve with Finance Dept 0 0 0 0 0 0 0 0 0 0 0 0
Source: Reserve Bank of India, Finances of the State Governments, various years ' issues.
and Budgetary documents
REVENUE ACCOUNT
TABLE - DET 5 PLAN , NON PLAN - ITEMS OF EXPENDITURE - KERALA STATE
- S-39 -
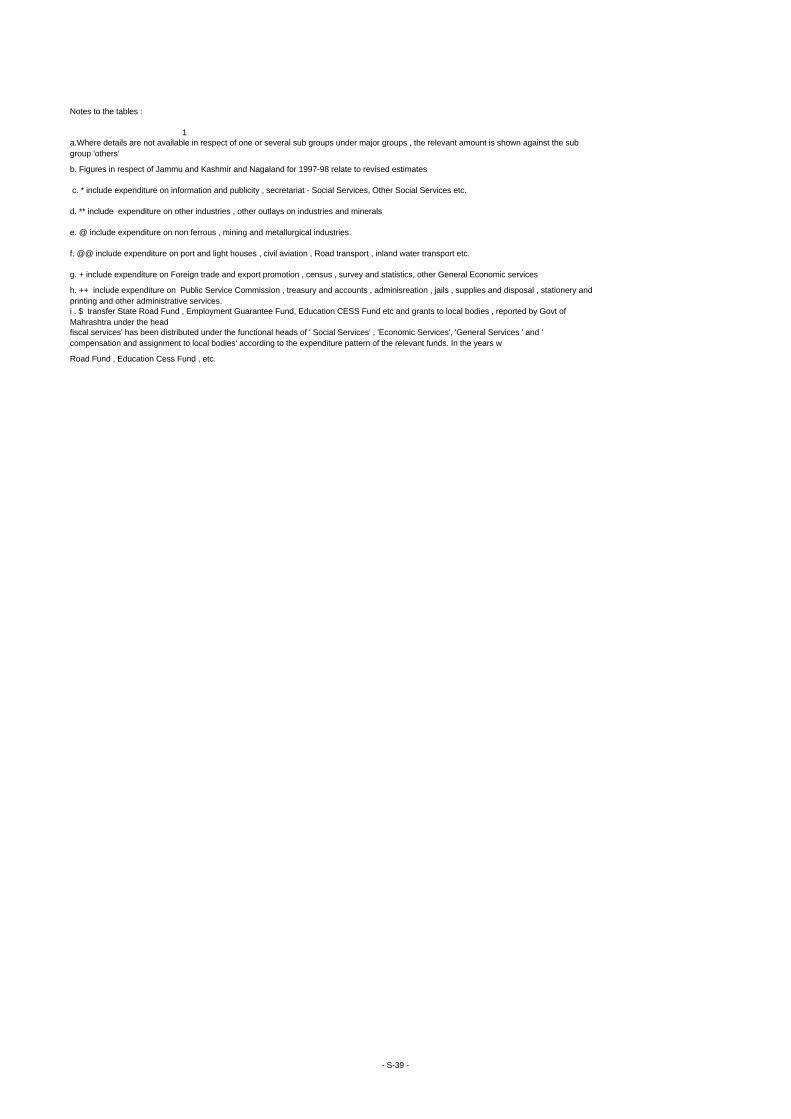
Notes to the tables :
1
Road Fund , Education Cess Fund , etc.
e. @ include expenditure on non ferrous , mining and metallurgical industries.
f. @@ include expenditure on port and light houses , civil aviation , Road transport , inland water transport etc.
g. + include expenditure on Foreign trade and export promotion , census , survey and statistics, other General Economic services
h. ++ include expenditure on Public Service Commission , treasury and accounts , adminisreation , jails , supplies and disposal , stationery and printing and other administrative services.
c. * include expenditure on information and publicity , secretariat - Social Services, Other Social Services etc.
d. ** include expenditure on other industries , other outlays on industries and minerals
i . $ transfer State Road Fund , Employment Guarantee Fund, Education CESS Fund etc and grants to local bodies , reported by Govt of Mahrashtra under the head fiscal services' has been distributed under the functional heads of ' Social Services' , 'Economic Services', 'General Services ' and ' compensation and assignment to local bodies' according to the expenditure pattern of the relevant funds. In the years w
a.Where details are not available in respect of one or several sub groups under major groups , the relevant amount is shown against the sub group 'others'
b. Figures in respect of Jammu and Kashmir and Nagaland for 1997-98 relate to revised estimates
- S-39 -
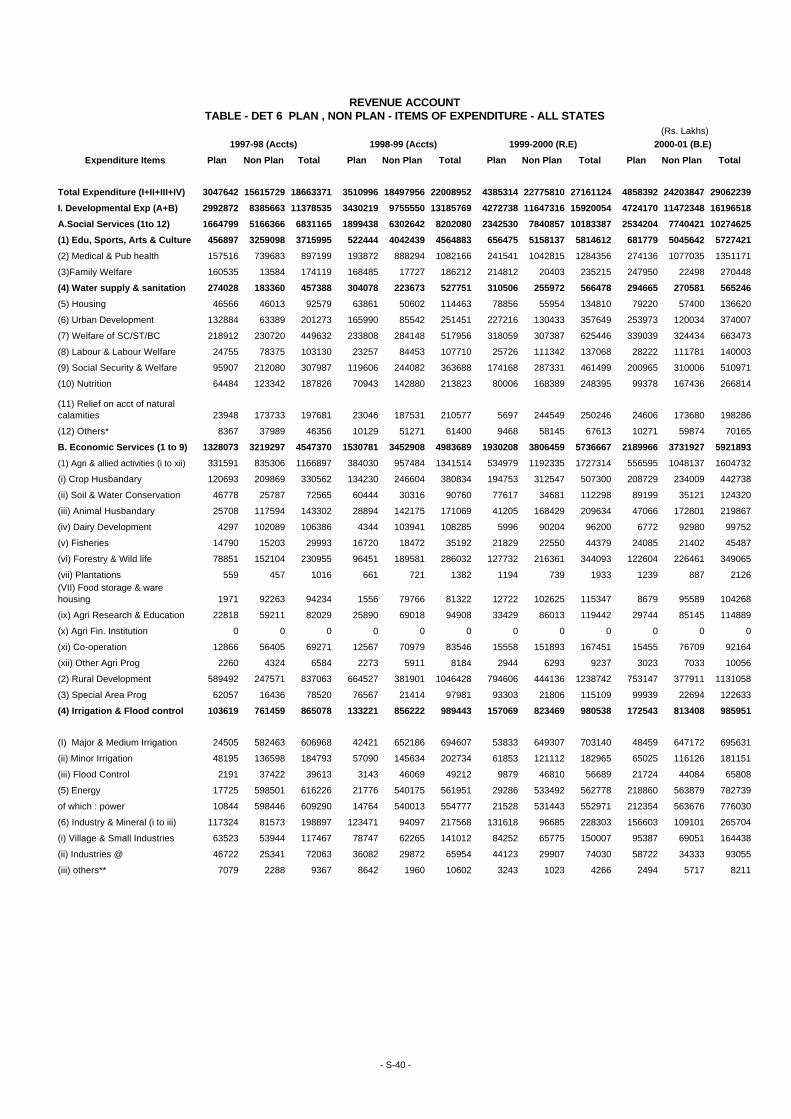
(Rs. Lakhs)1997-98 (Accts) 1998-99 (Accts) 1999-2000 (R.E) 2000-01 (B.E)
Expenditure Items Plan Non Plan Total Plan Non Plan Total Plan Non Plan Total Plan Non Plan Total
Total Expenditure (I+II+III+IV) 3047642 15615729 18663371 3510996 18497956 22008952 4385314 22775810 27161124 4858392 24203847 29062239
I. Developmental Exp (A+B) 2992872 8385663 11378535 3430219 9755550 13185769 4272738 11647316 15920054 4724170 11472348 16196518
A.Social Services (1to 12) 1664799 5166366 6831165 1899438 6302642 8202080 2342530 7840857 10183387 2534204 7740421 10274625
(1) Edu, Sports, Arts & Culture 456897 3259098 3715995 522444 4042439 4564883 656475 5158137 5814612 681779 5045642 5727421
(2) Medical & Pub health 157516 739683 897199 193872 888294 1082166 241541 1042815 1284356 274136 1077035 1351171
(3)Family Welfare 160535 13584 174119 168485 17727 186212 214812 20403 235215 247950 22498 270448
(4) Water supply & sanitation 274028 183360 457388 304078 223673 527751 310506 255972 566478 294665 270581 565246
(5) Housing 46566 46013 92579 63861 50602 114463 78856 55954 134810 79220 57400 136620
(6) Urban Development 132884 63389 201273 165990 85542 251451 227216 130433 357649 253973 120034 374007
(7) Welfare of SC/ST/BC 218912 230720 449632 233808 284148 517956 318059 307387 625446 339039 324434 663473
(8) Labour & Labour Welfare 24755 78375 103130 23257 84453 107710 25726 111342 137068 28222 111781 140003
(9) Social Security & Welfare 95907 212080 307987 119606 244082 363688 174168 287331 461499 200965 310006 510971
(10) Nutrition 64484 123342 187826 70943 142880 213823 80006 168389 248395 99378 167436 266814
(11) Relief on acct of natural calamities 23948 173733 197681 23046 187531 210577 5697 244549 250246 24606 173680 198286
(12) Others* 8367 37989 46356 10129 51271 61400 9468 58145 67613 10271 59874 70165
B. Economic Services (1 to 9) 1328073 3219297 4547370 1530781 3452908 4983689 1930208 3806459 5736667 2189966 3731927 5921893
(1) Agri & allied activities (i to xii) 331591 835306 1166897 384030 957484 1341514 534979 1192335 1727314 556595 1048137 1604732
(i) Crop Husbandary 120693 209869 330562 134230 246604 380834 194753 312547 507300 208729 234009 442738
(ii) Soil & Water Conservation 46778 25787 72565 60444 30316 90760 77617 34681 112298 89199 35121 124320
(iii) Animal Husbandary 25708 117594 143302 28894 142175 171069 41205 168429 209634 47066 172801 219867
(iv) Dairy Development 4297 102089 106386 4344 103941 108285 5996 90204 96200 6772 92980 99752
(v) Fisheries 14790 15203 29993 16720 18472 35192 21829 22550 44379 24085 21402 45487
(vi) Forestry & Wild life 78851 152104 230955 96451 189581 286032 127732 216361 344093 122604 226461 349065
(vii) Plantations 559 457 1016 661 721 1382 1194 739 1933 1239 887 2126(VII) Food storage & ware housing 1971 92263 94234 1556 79766 81322 12722 102625 115347 8679 95589 104268
(ix) Agri Research & Education 22818 59211 82029 25890 69018 94908 33429 86013 119442 29744 85145 114889
(x) Agri Fin. Institution 0 0 0 0 0 0 0 0 0 0 0 0
(xi) Co-operation 12866 56405 69271 12567 70979 83546 15558 151893 167451 15455 76709 92164
(xii) Other Agri Prog 2260 4324 6584 2273 5911 8184 2944 6293 9237 3023 7033 10056
(2) Rural Development 589492 247571 837063 664527 381901 1046428 794606 444136 1238742 753147 377911 1131058
(3) Special Area Prog 62057 16436 78520 76567 21414 97981 93303 21806 115109 99939 22694 122633
(4) Irrigation & Flood control 103619 761459 865078 133221 856222 989443 157069 823469 980538 172543 813408 985951
(I) Major & Medium Irrigation 24505 582463 606968 42421 652186 694607 53833 649307 703140 48459 647172 695631
(ii) Minor Irrigation 48195 136598 184793 57090 145634 202734 61853 121112 182965 65025 116126 181151
(iii) Flood Control 2191 37422 39613 3143 46069 49212 9879 46810 56689 21724 44084 65808
(5) Energy 17725 598501 616226 21776 540175 561951 29286 533492 562778 218860 563879 782739
of which : power 10844 598446 609290 14764 540013 554777 21528 531443 552971 212354 563676 776030
(6) Industry & Mineral (i to iii) 117324 81573 198897 123471 94097 217568 131618 96685 228303 156603 109101 265704
(i) Village & Small Industries 63523 53944 117467 78747 62265 141012 84252 65775 150007 95387 69051 164438
(ii) Industries @ 46722 25341 72063 36082 29872 65954 44123 29907 74030 58722 34333 93055
(iii) others** 7079 2288 9367 8642 1960 10602 3243 1023 4266 2494 5717 8211
REVENUE ACCOUNTTABLE - DET 6 PLAN , NON PLAN - ITEMS OF EXPENDITURE - ALL STATES
- S-40 -
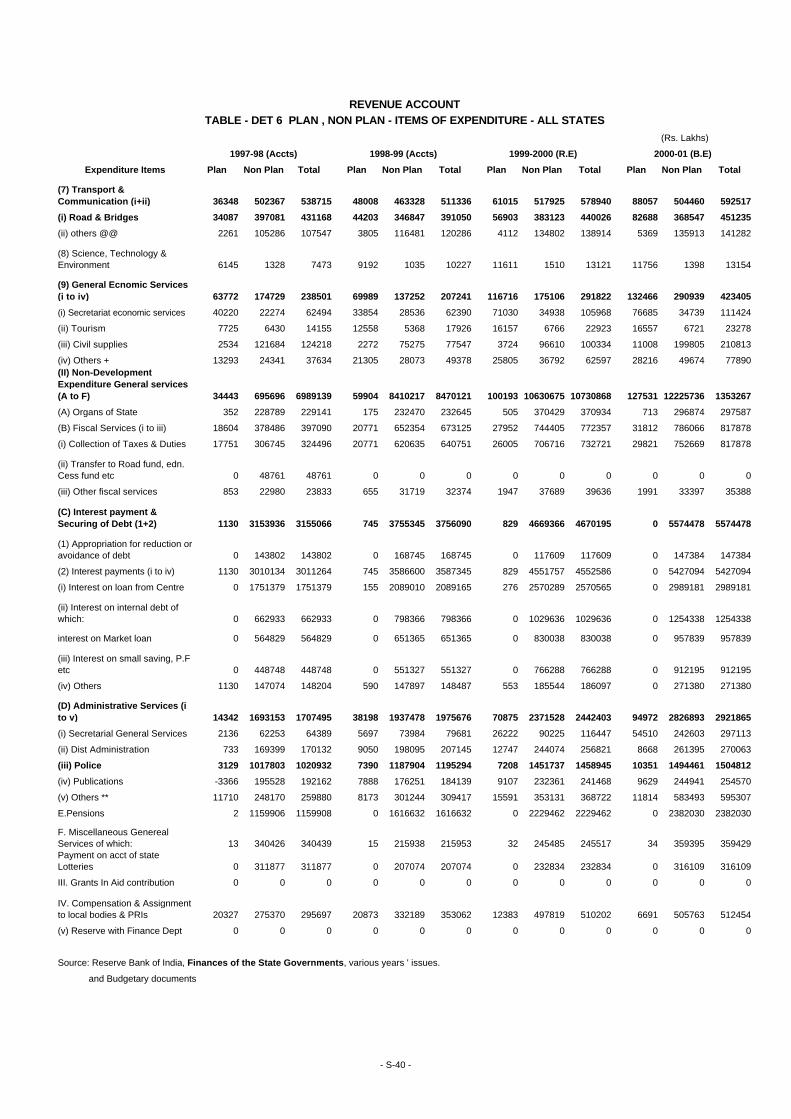
(Rs. Lakhs)
1997-98 (Accts) 1998-99 (Accts) 1999-2000 (R.E) 2000-01 (B.E)
Expenditure Items Plan Non Plan Total Plan Non Plan Total Plan Non Plan Total Plan Non Plan Total
(7) Transport & Communication (i+ii) 36348 502367 538715 48008 463328 511336 61015 517925 578940 88057 504460 592517
(i) Road & Bridges 34087 397081 431168 44203 346847 391050 56903 383123 440026 82688 368547 451235
(ii) others @@ 2261 105286 107547 3805 116481 120286 4112 134802 138914 5369 135913 141282
(8) Science, Technology & Environment 6145 1328 7473 9192 1035 10227 11611 1510 13121 11756 1398 13154
(9) General Ecnomic Services (i to iv) 63772 174729 238501 69989 137252 207241 116716 175106 291822 132466 290939 423405
(i) Secretariat economic services 40220 22274 62494 33854 28536 62390 71030 34938 105968 76685 34739 111424
(ii) Tourism 7725 6430 14155 12558 5368 17926 16157 6766 22923 16557 6721 23278
(iii) Civil supplies 2534 121684 124218 2272 75275 77547 3724 96610 100334 11008 199805 210813
(iv) Others + 13293 24341 37634 21305 28073 49378 25805 36792 62597 28216 49674 77890(II) Non-Development Expenditure General services (A to F) 34443 695696 6989139 59904 8410217 8470121 100193 10630675 10730868 127531 12225736 1353267
(A) Organs of State 352 228789 229141 175 232470 232645 505 370429 370934 713 296874 297587
(B) Fiscal Services (i to iii) 18604 378486 397090 20771 652354 673125 27952 744405 772357 31812 786066 817878
(i) Collection of Taxes & Duties 17751 306745 324496 20771 620635 640751 26005 706716 732721 29821 752669 817878
(ii) Transfer to Road fund, edn. Cess fund etc 0 48761 48761 0 0 0 0 0 0 0 0 0
(iii) Other fiscal services 853 22980 23833 655 31719 32374 1947 37689 39636 1991 33397 35388
(C) Interest payment & Securing of Debt (1+2) 1130 3153936 3155066 745 3755345 3756090 829 4669366 4670195 0 5574478 5574478
(1) Appropriation for reduction or avoidance of debt 0 143802 143802 0 168745 168745 0 117609 117609 0 147384 147384
(2) Interest payments (i to iv) 1130 3010134 3011264 745 3586600 3587345 829 4551757 4552586 0 5427094 5427094
(i) Interest on loan from Centre 0 1751379 1751379 155 2089010 2089165 276 2570289 2570565 0 2989181 2989181
(ii) Interest on internal debt of which: 0 662933 662933 0 798366 798366 0 1029636 1029636 0 1254338 1254338
interest on Market loan 0 564829 564829 0 651365 651365 0 830038 830038 0 957839 957839
(iii) Interest on small saving, P.F etc 0 448748 448748 0 551327 551327 0 766288 766288 0 912195 912195
(iv) Others 1130 147074 148204 590 147897 148487 553 185544 186097 0 271380 271380
(D) Administrative Services (i to v) 14342 1693153 1707495 38198 1937478 1975676 70875 2371528 2442403 94972 2826893 2921865
(i) Secretarial General Services 2136 62253 64389 5697 73984 79681 26222 90225 116447 54510 242603 297113
(ii) Dist Administration 733 169399 170132 9050 198095 207145 12747 244074 256821 8668 261395 270063
(iii) Police 3129 1017803 1020932 7390 1187904 1195294 7208 1451737 1458945 10351 1494461 1504812
(iv) Publications -3366 195528 192162 7888 176251 184139 9107 232361 241468 9629 244941 254570
(v) Others ** 11710 248170 259880 8173 301244 309417 15591 353131 368722 11814 583493 595307
E.Pensions 2 1159906 1159908 0 1616632 1616632 0 2229462 2229462 0 2382030 2382030
F. Miscellaneous Genereal Services of which: 13 340426 340439 15 215938 215953 32 245485 245517 34 359395 359429Payment on acct of state Lotteries 0 311877 311877 0 207074 207074 0 232834 232834 0 316109 316109
III. Grants In Aid contribution 0 0 0 0 0 0 0 0 0 0 0 0
IV. Compensation & Assignment to local bodies & PRIs 20327 275370 295697 20873 332189 353062 12383 497819 510202 6691 505763 512454
(v) Reserve with Finance Dept 0 0 0 0 0 0 0 0 0 0 0 0
Source: Reserve Bank of India, Finances of the State Governments, various years ' issues.
and Budgetary documents
REVENUE ACCOUNTTABLE - DET 6 PLAN , NON PLAN - ITEMS OF EXPENDITURE - ALL STATES
- S-40 -
Notes to the tables :
a.Where details are not available in respect of one or several sub groups under major groups , the relevant amount is shown against the sub group 'others'
b. Figures in respect of Jammu and Kashmir and Nagaland for 1997-98 relate to revised estimates
c. * include expenditure on information and publicity , secretariat - Social Services, Other Social Services etc.
d. ** include expenditure on other industries , other outlays on industries and minerals
i . $ transfer State Road Fund , Employment Guarantee Fund, Education CESS Fund etc and grants to local bodies , reported by Govt of Mahrashtra under the head fiscal services' has been distributed under the functional heads of ' Social Services' , 'Economic Services', 'General Services ' and ' compensation and assignment to local bodies' according to the expenditure pattern of the relevant funds. In the years w
Road Fund , Education Cess Fund , etc.
e. @ include expenditure on non ferrous , mining and metallurgical industries.
f. @@ include expenditure on port and light houses , civil aviation , Road transport , inland water transport etc.
g. + include expenditure on Foreign trade and export promotion , census , survey and statistics, other General Economic services
h. ++ include expenditure on Public Service Commission , treasury and accounts , adminisreation , jails , supplies and disposal , stationery and printing and other administrative services.
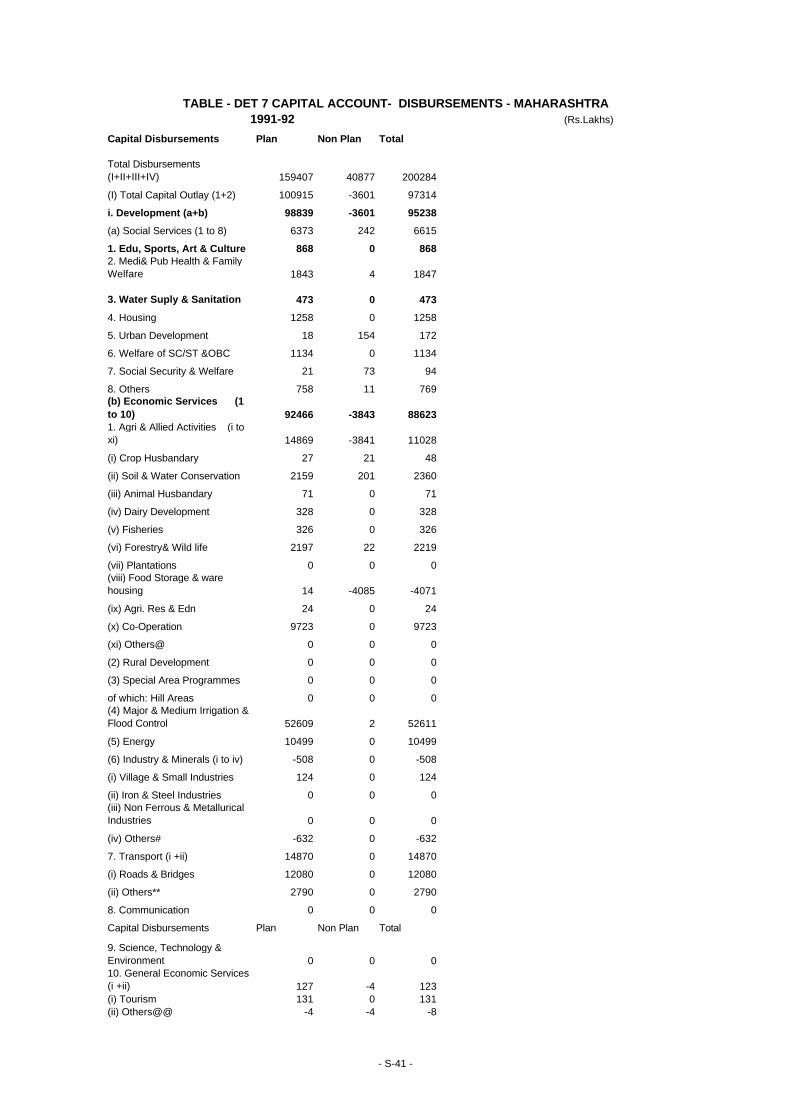
(Rs.Lakhs)
Capital Disbursements Plan Non Plan Total
Total Disbursements (I+II+III+IV) 159407 40877 200284
(I) Total Capital Outlay (1+2) 100915 -3601 97314
i. Development (a+b) 98839 -3601 95238
(a) Social Services (1 to 8) 6373 242 6615
1. Edu, Sports, Art & Culture 868 0 8682. Medi& Pub Health & Family Welfare 1843 4 1847
3. Water Suply & Sanitation 473 0 473
4. Housing 1258 0 1258
5. Urban Development 18 154 172
6. Welfare of SC/ST &OBC 1134 0 1134
7. Social Security & Welfare 21 73 94
8. Others 758 11 769(b) Economic Services (1 to 10) 92466 -3843 886231. Agri & Allied Activities (i to xi) 14869 -3841 11028
(i) Crop Husbandary 27 21 48
(ii) Soil & Water Conservation 2159 201 2360
(iii) Animal Husbandary 71 0 71
(iv) Dairy Development 328 0 328
(v) Fisheries 326 0 326
(vi) Forestry& Wild life 2197 22 2219
(vii) Plantations 0 0 0(viii) Food Storage & ware housing 14 -4085 -4071
(ix) Agri. Res & Edn 24 0 24
(x) Co-Operation 9723 0 9723
(xi) Others@ 0 0 0
(2) Rural Development 0 0 0
(3) Special Area Programmes 0 0 0
of which: Hill Areas 0 0 0(4) Major & Medium Irrigation & Flood Control 52609 2 52611
(5) Energy 10499 0 10499
(6) Industry & Minerals (i to iv) -508 0 -508
(i) Village & Small Industries 124 0 124
(ii) Iron & Steel Industries 0 0 0(iii) Non Ferrous & Metallurical Industries 0 0 0
(iv) Others# -632 0 -632
7. Transport (i +ii) 14870 0 14870
(i) Roads & Bridges 12080 0 12080
(ii) Others** 2790 0 2790
8. Communication 0 0 0
Capital Disbursements Plan Non Plan Total
9. Science, Technology & Environment 0 0 010. General Economic Services (i +ii) 127 -4 123(i) Tourism 131 0 131(ii) Others@@ -4 -4 -8
TABLE - DET 7 CAPITAL ACCOUNT- DISBURSEMENTS - MAHARASHTRA1991-92
- S-41 -

(Rs.Lakhs)Capital Disbursements Plan Non Plan Total
2. Non Developmental (General Services) 2076 0 2076(ii) Discharge of internal Debt ++ (1 to 5) 0 7110 71101. Market Loans 0 15 152. Loans from LIC 0 132 1323. Loans from NABARD 0 5831 58314. Loans from National Co-op Development Corp 0 1021 10215. Others 0 111 111of which: Land Compensation Bonds 0 17 17(iii) Repayment of Loan to the Centre 0 31870 31870(iv) Loans & Advances by State Govt (1+2) 58492 5498 639901. Developmental Purpose (a+b) 58492 5172 63664(a) Social Services (1 to 3) 14534 995 155291. Housing 5173 718 58912. Govt Servants (Housing) 782 9 7913. Others 8579 268 8847(b) Economic Services (1 to 7) 43958 4177 48135
1. Co-operation 2638 0 2638
2. Crop Husbandary 3 2934 2937
3. Soil & Water Conservation 0 0 0
4. Power Projects 39800 0 39800
5. Village & Small Industries 109 92 201
6. Other Industries & Minerals 927 105 1032
7. Others 481 1046 1527(2) Non developmental purposes (a+b) 0 326 326(a) Govt Servants (Other than housing) 0 607 607
(b) Miscellaneous 0 -281 -281(A) Surplus(+)/ Deficit (-) on Capital Account 125728
(B) Remittances (net) -5912(C) Surplus (+)/ Deficit (-) on Revenue Account -27613(D) Overall Surplus(+)/Deficit(-) (A+B+C) Financing of Surplus(+)/Deficit(-) 92203(E)Increase(+)/ Decrease(-) in cash Balances 4308
(a) Opening Balances -7955
(b) Closing Balances -3647
(F) Withdrawals from (-) / Additions to (+) Cash Balance Investment Account(net) 87895(G) Increase(-) /Decrease (+) in ways & means advances & over drafts from RBI (net) 0
TABLE - DET 7 CAPITAL ACCOUNT- DISBURSEMENTS - MAHARASHTRA1991-92
- S-41 -
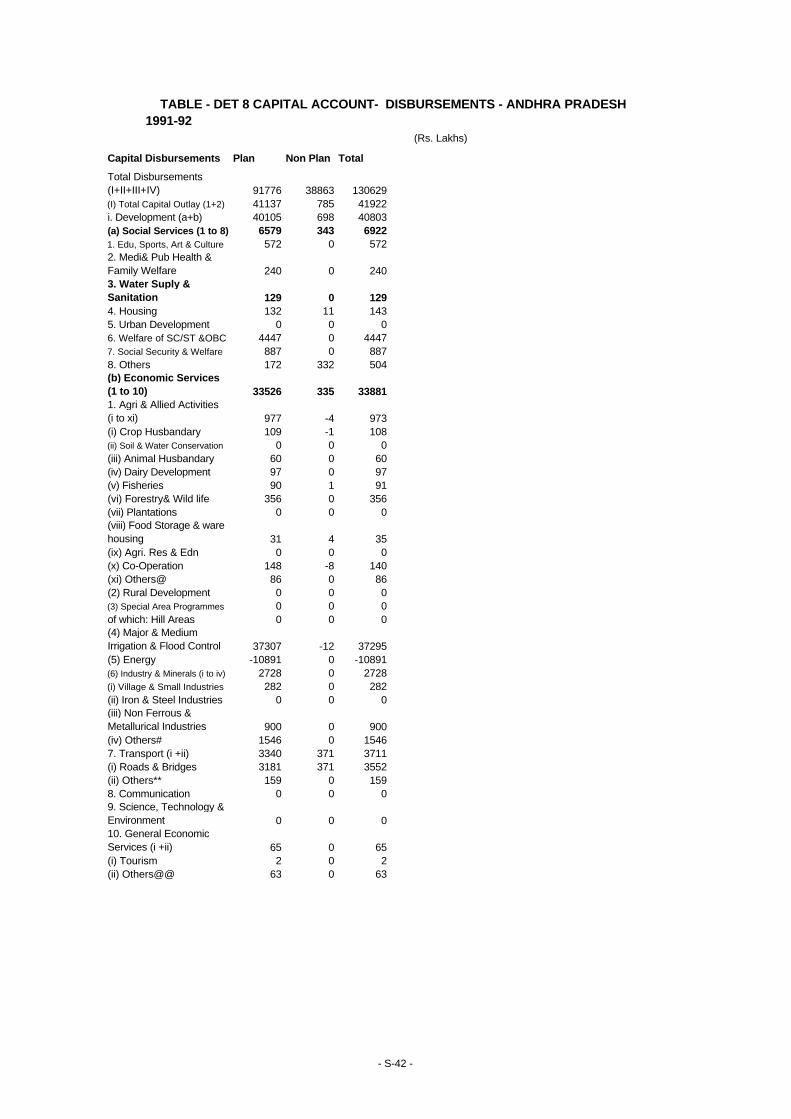
1991-92 (Rs. Lakhs)
Capital Disbursements Plan Non Plan Total
Total Disbursements (I+II+III+IV) 91776 38863 130629(I) Total Capital Outlay (1+2) 41137 785 41922i. Development (a+b) 40105 698 40803(a) Social Services (1 to 8) 6579 343 69221. Edu, Sports, Art & Culture 572 0 5722. Medi& Pub Health & Family Welfare 240 0 2403. Water Suply & Sanitation 129 0 1294. Housing 132 11 1435. Urban Development 0 0 06. Welfare of SC/ST &OBC 4447 0 44477. Social Security & Welfare 887 0 8878. Others 172 332 504(b) Economic Services (1 to 10) 33526 335 338811. Agri & Allied Activities (i to xi) 977 -4 973(i) Crop Husbandary 109 -1 108(ii) Soil & Water Conservation 0 0 0(iii) Animal Husbandary 60 0 60(iv) Dairy Development 97 0 97(v) Fisheries 90 1 91(vi) Forestry& Wild life 356 0 356(vii) Plantations 0 0 0(viii) Food Storage & ware housing 31 4 35(ix) Agri. Res & Edn 0 0 0(x) Co-Operation 148 -8 140(xi) Others@ 86 0 86(2) Rural Development 0 0 0(3) Special Area Programmes 0 0 0of which: Hill Areas 0 0 0(4) Major & Medium Irrigation & Flood Control 37307 -12 37295(5) Energy -10891 0 -10891(6) Industry & Minerals (i to iv) 2728 0 2728(i) Village & Small Industries 282 0 282(ii) Iron & Steel Industries 0 0 0(iii) Non Ferrous & Metallurical Industries 900 0 900(iv) Others# 1546 0 15467. Transport (i +ii) 3340 371 3711(i) Roads & Bridges 3181 371 3552(ii) Others** 159 0 1598. Communication 0 0 09. Science, Technology & Environment 0 0 010. General Economic Services (i +ii) 65 0 65(i) Tourism 2 0 2(ii) Others@@ 63 0 63
TABLE - DET 8 CAPITAL ACCOUNT- DISBURSEMENTS - ANDHRA PRADESH
- S-42 -
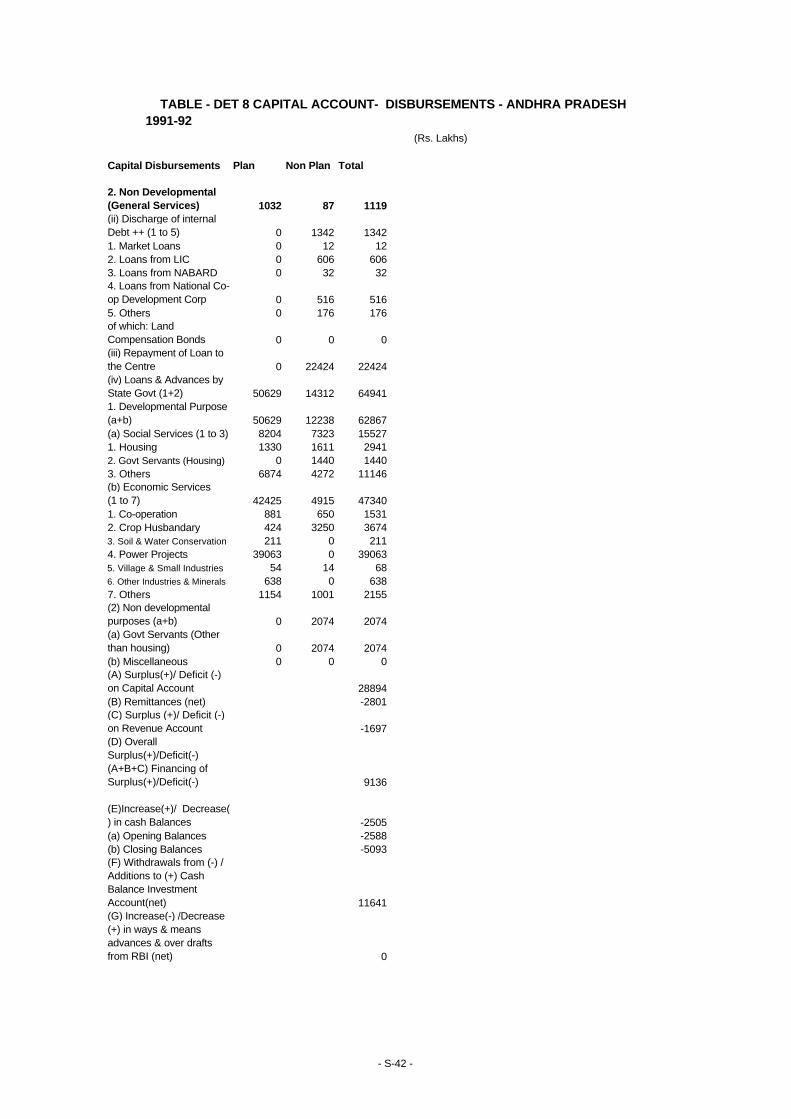
1991-92 (Rs. Lakhs)
Capital Disbursements Plan Non Plan Total
2. Non Developmental (General Services) 1032 87 1119(ii) Discharge of internal Debt ++ (1 to 5) 0 1342 13421. Market Loans 0 12 122. Loans from LIC 0 606 6063. Loans from NABARD 0 32 324. Loans from National Co-op Development Corp 0 516 5165. Others 0 176 176of which: Land Compensation Bonds 0 0 0(iii) Repayment of Loan to the Centre 0 22424 22424(iv) Loans & Advances by State Govt (1+2) 50629 14312 649411. Developmental Purpose (a+b) 50629 12238 62867(a) Social Services (1 to 3) 8204 7323 155271. Housing 1330 1611 29412. Govt Servants (Housing) 0 1440 14403. Others 6874 4272 11146(b) Economic Services (1 to 7) 42425 4915 473401. Co-operation 881 650 15312. Crop Husbandary 424 3250 36743. Soil & Water Conservation 211 0 2114. Power Projects 39063 0 390635. Village & Small Industries 54 14 686. Other Industries & Minerals 638 0 6387. Others 1154 1001 2155(2) Non developmental purposes (a+b) 0 2074 2074(a) Govt Servants (Other than housing) 0 2074 2074(b) Miscellaneous 0 0 0(A) Surplus(+)/ Deficit (-) on Capital Account 28894(B) Remittances (net) -2801(C) Surplus (+)/ Deficit (-) on Revenue Account -1697(D) Overall Surplus(+)/Deficit(-) (A+B+C) Financing of Surplus(+)/Deficit(-) 9136
(E)Increase(+)/ Decrease(-) in cash Balances -2505(a) Opening Balances -2588(b) Closing Balances -5093(F) Withdrawals from (-) / Additions to (+) Cash Balance Investment Account(net) 11641(G) Increase(-) /Decrease (+) in ways & means advances & over drafts from RBI (net) 0
TABLE - DET 8 CAPITAL ACCOUNT- DISBURSEMENTS - ANDHRA PRADESH
- S-42 -
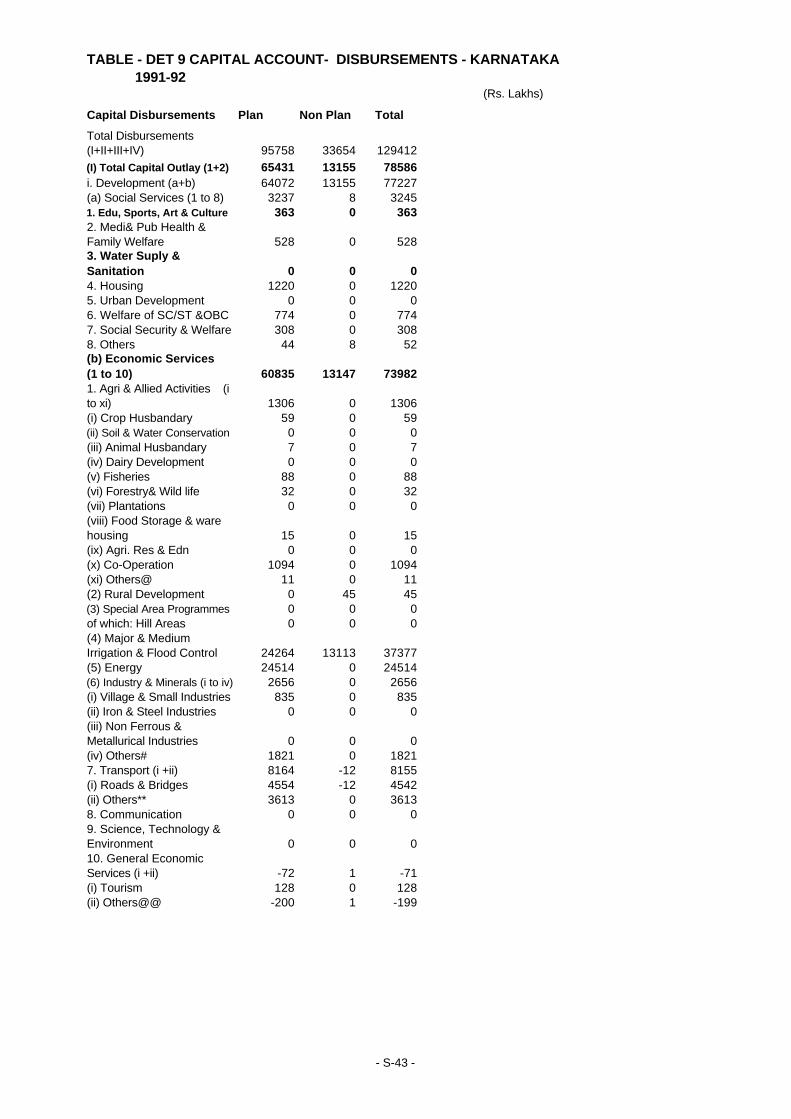
1991-92(Rs. Lakhs)
Capital Disbursements Plan Non Plan Total
Total Disbursements (I+II+III+IV) 95758 33654 129412(I) Total Capital Outlay (1+2) 65431 13155 78586i. Development (a+b) 64072 13155 77227(a) Social Services (1 to 8) 3237 8 32451. Edu, Sports, Art & Culture 363 0 3632. Medi& Pub Health & Family Welfare 528 0 5283. Water Suply & Sanitation 0 0 04. Housing 1220 0 12205. Urban Development 0 0 06. Welfare of SC/ST &OBC 774 0 7747. Social Security & Welfare 308 0 3088. Others 44 8 52(b) Economic Services (1 to 10) 60835 13147 739821. Agri & Allied Activities (i to xi) 1306 0 1306(i) Crop Husbandary 59 0 59(ii) Soil & Water Conservation 0 0 0(iii) Animal Husbandary 7 0 7(iv) Dairy Development 0 0 0(v) Fisheries 88 0 88(vi) Forestry& Wild life 32 0 32(vii) Plantations 0 0 0(viii) Food Storage & ware housing 15 0 15(ix) Agri. Res & Edn 0 0 0(x) Co-Operation 1094 0 1094(xi) Others@ 11 0 11(2) Rural Development 0 45 45(3) Special Area Programmes 0 0 0of which: Hill Areas 0 0 0(4) Major & Medium Irrigation & Flood Control 24264 13113 37377(5) Energy 24514 0 24514(6) Industry & Minerals (i to iv) 2656 0 2656(i) Village & Small Industries 835 0 835(ii) Iron & Steel Industries 0 0 0(iii) Non Ferrous & Metallurical Industries 0 0 0(iv) Others# 1821 0 18217. Transport (i +ii) 8164 -12 8155(i) Roads & Bridges 4554 -12 4542(ii) Others** 3613 0 36138. Communication 0 0 09. Science, Technology & Environment 0 0 010. General Economic Services (i +ii) -72 1 -71(i) Tourism 128 0 128(ii) Others@@ -200 1 -199
TABLE - DET 9 CAPITAL ACCOUNT- DISBURSEMENTS - KARNATAKA
- S-43 -
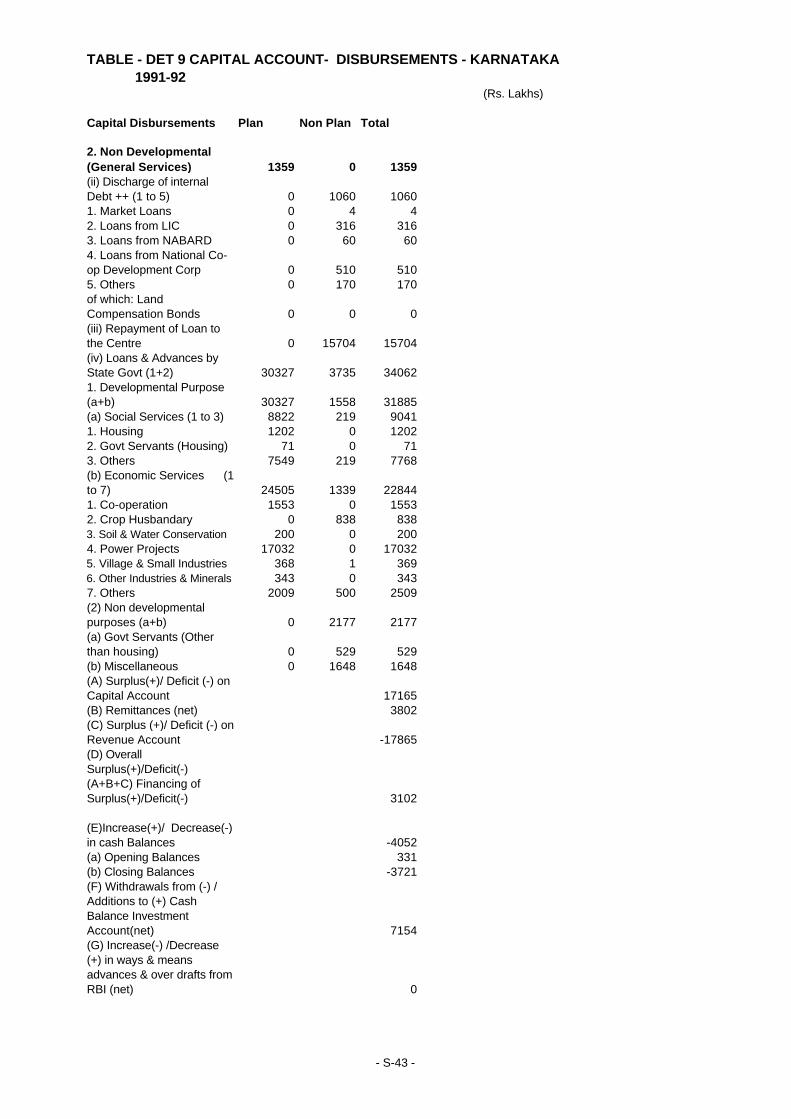
1991-92(Rs. Lakhs)
Capital Disbursements Plan Non Plan Total
2. Non Developmental (General Services) 1359 0 1359(ii) Discharge of internal Debt ++ (1 to 5) 0 1060 10601. Market Loans 0 4 42. Loans from LIC 0 316 3163. Loans from NABARD 0 60 604. Loans from National Co-op Development Corp 0 510 5105. Others 0 170 170of which: Land Compensation Bonds 0 0 0(iii) Repayment of Loan to the Centre 0 15704 15704(iv) Loans & Advances by State Govt (1+2) 30327 3735 340621. Developmental Purpose (a+b) 30327 1558 31885(a) Social Services (1 to 3) 8822 219 90411. Housing 1202 0 12022. Govt Servants (Housing) 71 0 713. Others 7549 219 7768(b) Economic Services (1 to 7) 24505 1339 228441. Co-operation 1553 0 15532. Crop Husbandary 0 838 8383. Soil & Water Conservation 200 0 2004. Power Projects 17032 0 170325. Village & Small Industries 368 1 3696. Other Industries & Minerals 343 0 3437. Others 2009 500 2509(2) Non developmental purposes (a+b) 0 2177 2177(a) Govt Servants (Other than housing) 0 529 529(b) Miscellaneous 0 1648 1648(A) Surplus(+)/ Deficit (-) on Capital Account 17165(B) Remittances (net) 3802(C) Surplus (+)/ Deficit (-) on Revenue Account -17865(D) Overall Surplus(+)/Deficit(-) (A+B+C) Financing of Surplus(+)/Deficit(-) 3102
(E)Increase(+)/ Decrease(-) in cash Balances -4052(a) Opening Balances 331(b) Closing Balances -3721(F) Withdrawals from (-) / Additions to (+) Cash Balance Investment Account(net) 7154(G) Increase(-) /Decrease (+) in ways & means advances & over drafts from RBI (net) 0
TABLE - DET 9 CAPITAL ACCOUNT- DISBURSEMENTS - KARNATAKA
- S-43 -

TABLE - DET 10 CAPITAL ACCOUNT- DISBURSEMENTS - TAMILNADU1991-92 (Rs.Lakhs)
Capital Disbursements Plan Non Plan Total
Total Disbursements (I+II+III+IV) 41912 50104 92016(I) Total Capital Outlay (1+2) 26766 1143 27909i. Development (a+b) 25996 1034 27030(a) Social Services (1 to 8) 8391 80 84711. Edu, Sports, Art & Culture 834 0 8342. Medi& Pub Health & Family Welfare 1537 0 15373. Water Suply & Sanitation 1738 0 17384. Housing 1894 18 19125. Urban Development 0 0 06. Welfare of SC/ST &OBC 1281 0 12817. Social Security & Welfare 121 0 1218. Others 986 62 1048(b) Economic Services (1 to 10) 17605 954 18559
1. Agri & Allied Activities (i to xi) 4147 -207 3940(i) Crop Husbandary 103 0 103(ii) Soil & Water Conservation 148 0 148(iii) Animal Husbandary 219 6 225(iv) Dairy Development 5 0 5(v) Fisheries 121 27 128(vi) Forestry& Wild life 2530 0 2530(vii) Plantations 6 0 6(viii) Food Storage & ware housing 50 0 50(ix) Agri. Res & Edn 89 0 89(x) Co-Operation 876 -240 636(xi) Others@ 0 0 0(2) Rural Development 980 0 980(3) Special Area Programmes 569 0 569of which: Hill Areas 559 0 559(4) Major & Medium Irrigation & Flood Control 4776 161 4937(5) Energy 21 0 21(6) Industry & Minerals (i to iv) 2853 0 2853(i) Village & Small Industries 1109 0 1109(ii) Iron & Steel Industries 0 0 0(iii) Non Ferrous & Metallurical Industries 0 0 0(iv) Others# 1744 0 17447. Transport (i +ii) 3849 0 3849(i) Roads & Bridges 3783 0 3783(ii) Others** 66 0 668. Communication 0 0 09. Science, Technology & Environment 0 0 010. General Economic Services (i +ii) 410 1000 1410(i) Tourism 54 0 54(ii) Others@@ 356 1000 1356
- S-44 -
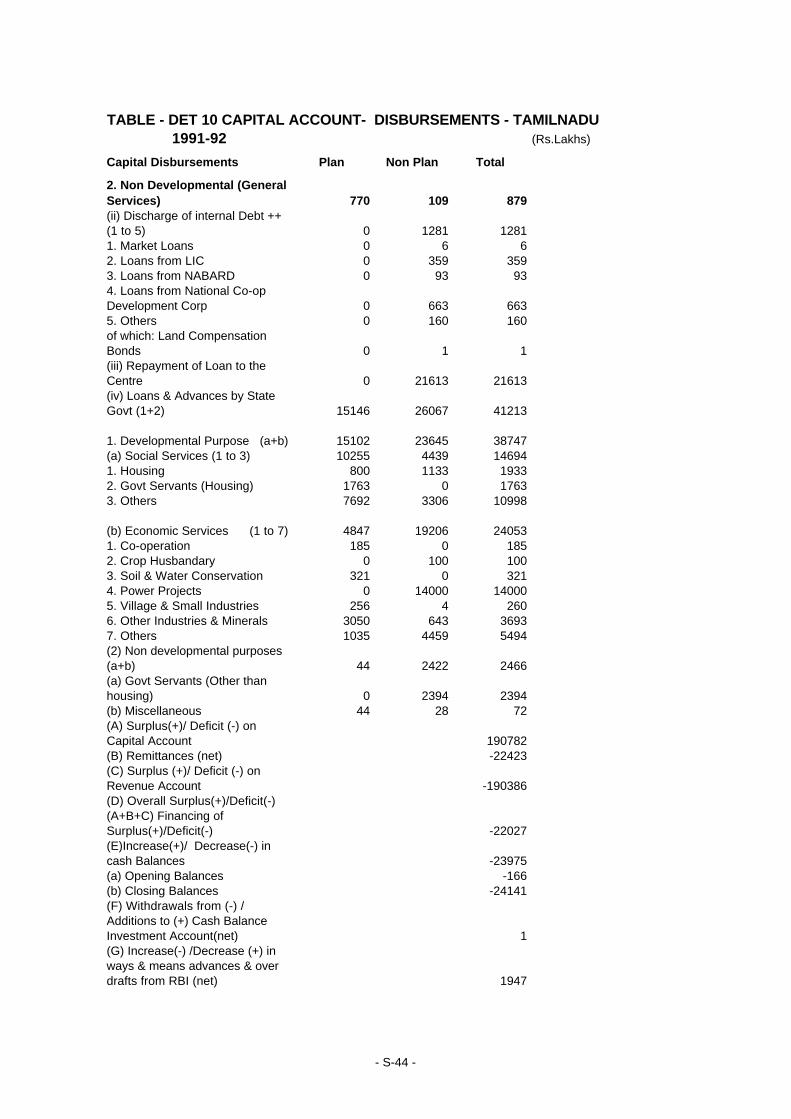
TABLE - DET 10 CAPITAL ACCOUNT- DISBURSEMENTS - TAMILNADU1991-92 (Rs.Lakhs)
Capital Disbursements Plan Non Plan Total
2. Non Developmental (General Services) 770 109 879(ii) Discharge of internal Debt ++ (1 to 5) 0 1281 12811. Market Loans 0 6 62. Loans from LIC 0 359 3593. Loans from NABARD 0 93 934. Loans from National Co-op Development Corp 0 663 6635. Others 0 160 160of which: Land Compensation Bonds 0 1 1(iii) Repayment of Loan to the Centre 0 21613 21613(iv) Loans & Advances by State Govt (1+2) 15146 26067 41213
1. Developmental Purpose (a+b) 15102 23645 38747(a) Social Services (1 to 3) 10255 4439 146941. Housing 800 1133 19332. Govt Servants (Housing) 1763 0 17633. Others 7692 3306 10998
(b) Economic Services (1 to 7) 4847 19206 240531. Co-operation 185 0 1852. Crop Husbandary 0 100 1003. Soil & Water Conservation 321 0 3214. Power Projects 0 14000 140005. Village & Small Industries 256 4 2606. Other Industries & Minerals 3050 643 36937. Others 1035 4459 5494(2) Non developmental purposes (a+b) 44 2422 2466(a) Govt Servants (Other than housing) 0 2394 2394(b) Miscellaneous 44 28 72(A) Surplus(+)/ Deficit (-) on Capital Account 190782(B) Remittances (net) -22423(C) Surplus (+)/ Deficit (-) on Revenue Account -190386(D) Overall Surplus(+)/Deficit(-) (A+B+C) Financing of Surplus(+)/Deficit(-) -22027(E)Increase(+)/ Decrease(-) in cash Balances -23975(a) Opening Balances -166(b) Closing Balances -24141(F) Withdrawals from (-) / Additions to (+) Cash Balance Investment Account(net) 1(G) Increase(-) /Decrease (+) in ways & means advances & over drafts from RBI (net) 1947
- S-44 -
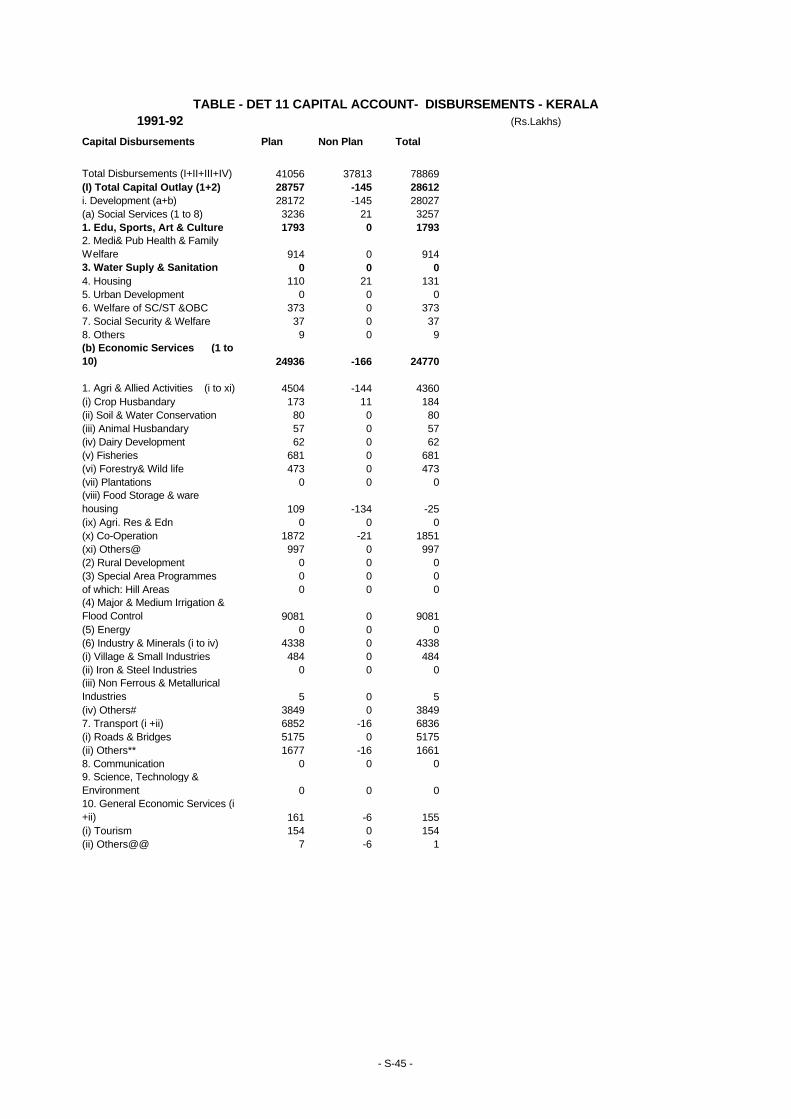
1991-92 (Rs.Lakhs)
Capital Disbursements Plan Non Plan Total
Total Disbursements (I+II+III+IV) 41056 37813 78869(I) Total Capital Outlay (1+2) 28757 -145 28612i. Development (a+b) 28172 -145 28027(a) Social Services (1 to 8) 3236 21 32571. Edu, Sports, Art & Culture 1793 0 17932. Medi& Pub Health & Family Welfare 914 0 9143. Water Suply & Sanitation 0 0 04. Housing 110 21 1315. Urban Development 0 0 06. Welfare of SC/ST &OBC 373 0 3737. Social Security & Welfare 37 0 378. Others 9 0 9(b) Economic Services (1 to 10) 24936 -166 24770
1. Agri & Allied Activities (i to xi) 4504 -144 4360(i) Crop Husbandary 173 11 184(ii) Soil & Water Conservation 80 0 80(iii) Animal Husbandary 57 0 57(iv) Dairy Development 62 0 62(v) Fisheries 681 0 681(vi) Forestry& Wild life 473 0 473(vii) Plantations 0 0 0(viii) Food Storage & ware housing 109 -134 -25(ix) Agri. Res & Edn 0 0 0(x) Co-Operation 1872 -21 1851(xi) Others@ 997 0 997(2) Rural Development 0 0 0(3) Special Area Programmes 0 0 0of which: Hill Areas 0 0 0(4) Major & Medium Irrigation & Flood Control 9081 0 9081(5) Energy 0 0 0(6) Industry & Minerals (i to iv) 4338 0 4338(i) Village & Small Industries 484 0 484(ii) Iron & Steel Industries 0 0 0(iii) Non Ferrous & Metallurical Industries 5 0 5(iv) Others# 3849 0 38497. Transport (i +ii) 6852 -16 6836(i) Roads & Bridges 5175 0 5175(ii) Others** 1677 -16 16618. Communication 0 0 09. Science, Technology & Environment 0 0 010. General Economic Services (i +ii) 161 -6 155(i) Tourism 154 0 154(ii) Others@@ 7 -6 1
TABLE - DET 11 CAPITAL ACCOUNT- DISBURSEMENTS - KERALA
- S-45 -
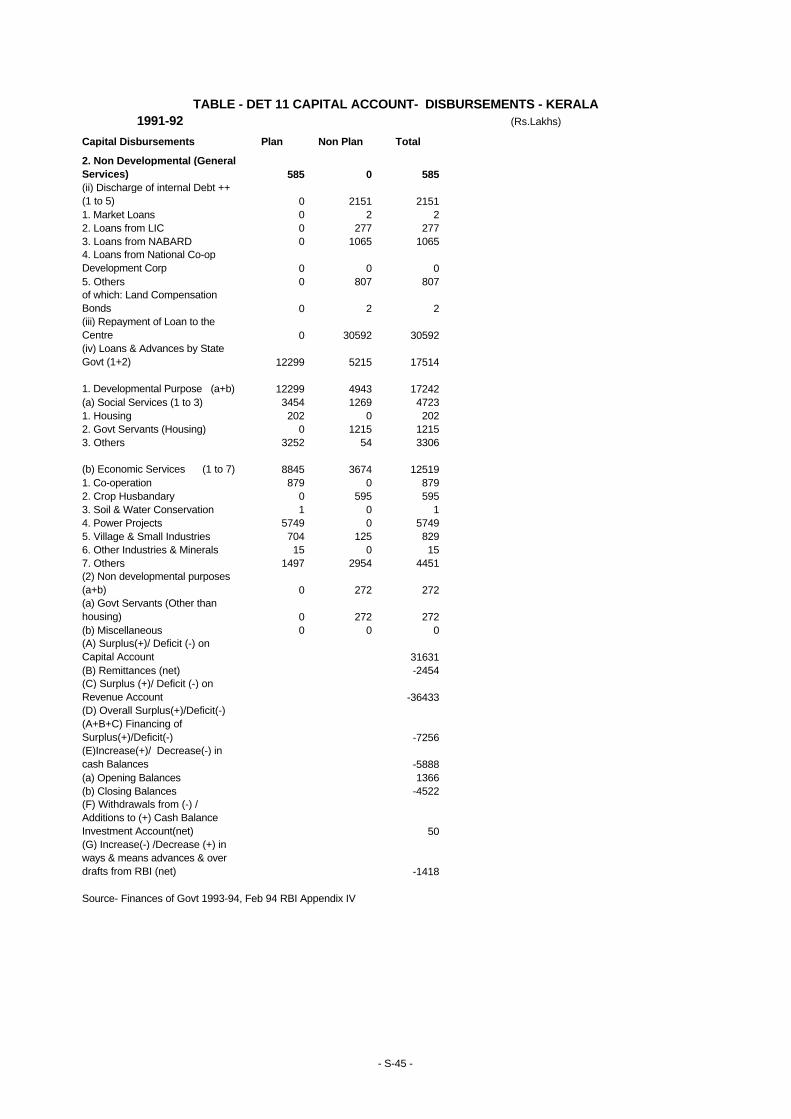
1991-92 (Rs.Lakhs)
Capital Disbursements Plan Non Plan Total
2. Non Developmental (General Services) 585 0 585(ii) Discharge of internal Debt ++ (1 to 5) 0 2151 21511. Market Loans 0 2 22. Loans from LIC 0 277 2773. Loans from NABARD 0 1065 10654. Loans from National Co-op Development Corp 0 0 05. Others 0 807 807of which: Land Compensation Bonds 0 2 2(iii) Repayment of Loan to the Centre 0 30592 30592(iv) Loans & Advances by State Govt (1+2) 12299 5215 17514
1. Developmental Purpose (a+b) 12299 4943 17242(a) Social Services (1 to 3) 3454 1269 47231. Housing 202 0 2022. Govt Servants (Housing) 0 1215 12153. Others 3252 54 3306
(b) Economic Services (1 to 7) 8845 3674 125191. Co-operation 879 0 8792. Crop Husbandary 0 595 5953. Soil & Water Conservation 1 0 14. Power Projects 5749 0 57495. Village & Small Industries 704 125 8296. Other Industries & Minerals 15 0 157. Others 1497 2954 4451(2) Non developmental purposes (a+b) 0 272 272(a) Govt Servants (Other than housing) 0 272 272(b) Miscellaneous 0 0 0(A) Surplus(+)/ Deficit (-) on Capital Account 31631(B) Remittances (net) -2454(C) Surplus (+)/ Deficit (-) on Revenue Account -36433(D) Overall Surplus(+)/Deficit(-) (A+B+C) Financing of Surplus(+)/Deficit(-) -7256(E)Increase(+)/ Decrease(-) in cash Balances -5888(a) Opening Balances 1366(b) Closing Balances -4522(F) Withdrawals from (-) / Additions to (+) Cash Balance Investment Account(net) 50(G) Increase(-) /Decrease (+) in ways & means advances & over drafts from RBI (net) -1418
Source- Finances of Govt 1993-94, Feb 94 RBI Appendix IV
TABLE - DET 11 CAPITAL ACCOUNT- DISBURSEMENTS - KERALA
- S-45 -
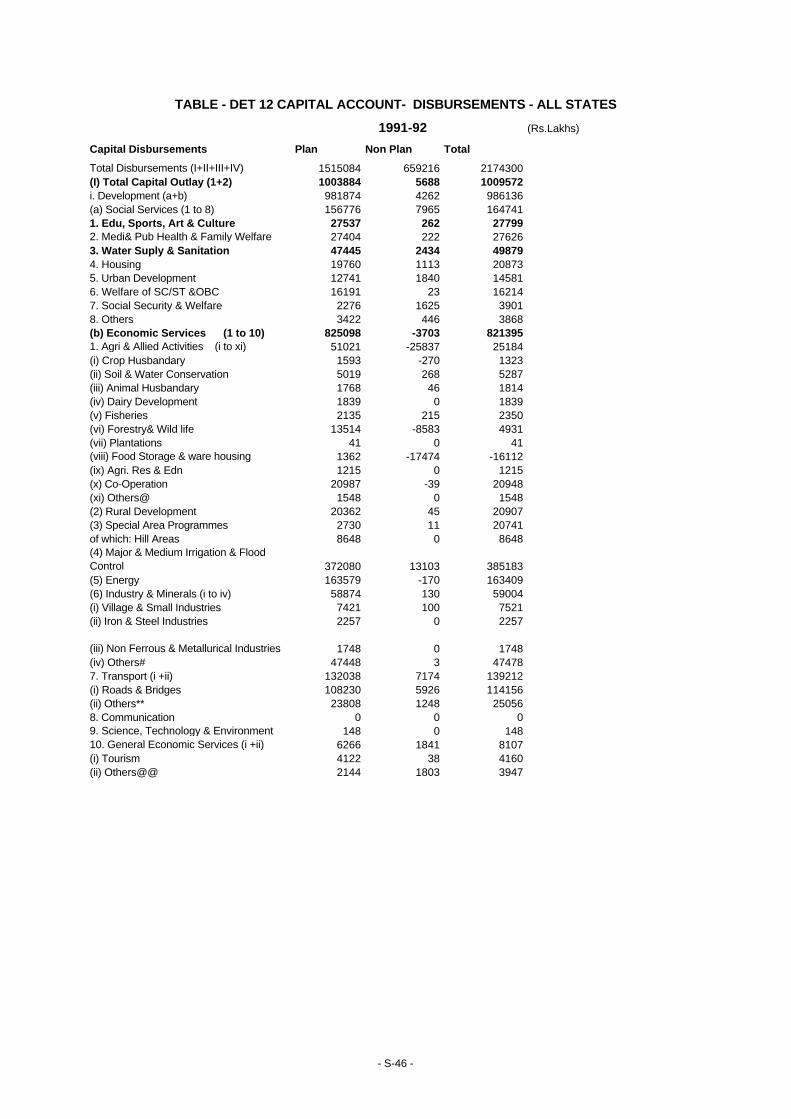
1991-92 (Rs.Lakhs)
Capital Disbursements Plan Non Plan Total
Total Disbursements (I+II+III+IV) 1515084 659216 2174300(I) Total Capital Outlay (1+2) 1003884 5688 1009572i. Development (a+b) 981874 4262 986136(a) Social Services (1 to 8) 156776 7965 1647411. Edu, Sports, Art & Culture 27537 262 277992. Medi& Pub Health & Family Welfare 27404 222 276263. Water Suply & Sanitation 47445 2434 498794. Housing 19760 1113 208735. Urban Development 12741 1840 145816. Welfare of SC/ST &OBC 16191 23 162147. Social Security & Welfare 2276 1625 39018. Others 3422 446 3868(b) Economic Services (1 to 10) 825098 -3703 8213951. Agri & Allied Activities (i to xi) 51021 -25837 25184(i) Crop Husbandary 1593 -270 1323(ii) Soil & Water Conservation 5019 268 5287(iii) Animal Husbandary 1768 46 1814(iv) Dairy Development 1839 0 1839(v) Fisheries 2135 215 2350(vi) Forestry& Wild life 13514 -8583 4931(vii) Plantations 41 0 41(viii) Food Storage & ware housing 1362 -17474 -16112(ix) Agri. Res & Edn 1215 0 1215(x) Co-Operation 20987 -39 20948(xi) Others@ 1548 0 1548(2) Rural Development 20362 45 20907(3) Special Area Programmes 2730 11 20741of which: Hill Areas 8648 0 8648(4) Major & Medium Irrigation & Flood Control 372080 13103 385183(5) Energy 163579 -170 163409(6) Industry & Minerals (i to iv) 58874 130 59004(i) Village & Small Industries 7421 100 7521(ii) Iron & Steel Industries 2257 0 2257
(iii) Non Ferrous & Metallurical Industries 1748 0 1748(iv) Others# 47448 3 474787. Transport (i +ii) 132038 7174 139212(i) Roads & Bridges 108230 5926 114156(ii) Others** 23808 1248 250568. Communication 0 0 09. Science, Technology & Environment 148 0 14810. General Economic Services (i +ii) 6266 1841 8107(i) Tourism 4122 38 4160(ii) Others@@ 2144 1803 3947
TABLE - DET 12 CAPITAL ACCOUNT- DISBURSEMENTS - ALL STATES
- S-46 -
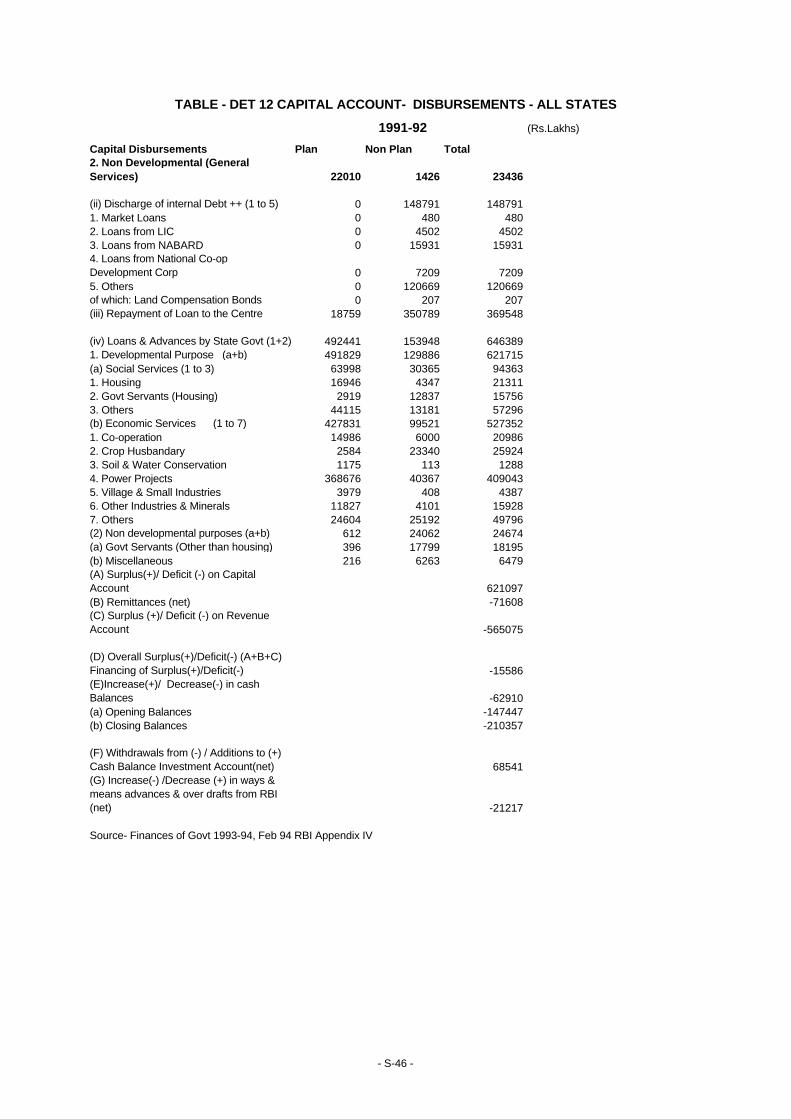
1991-92 (Rs.Lakhs)
Capital Disbursements Plan Non Plan Total2. Non Developmental (General Services) 22010 1426 23436
(ii) Discharge of internal Debt ++ (1 to 5) 0 148791 1487911. Market Loans 0 480 4802. Loans from LIC 0 4502 45023. Loans from NABARD 0 15931 159314. Loans from National Co-op Development Corp 0 7209 72095. Others 0 120669 120669of which: Land Compensation Bonds 0 207 207(iii) Repayment of Loan to the Centre 18759 350789 369548
(iv) Loans & Advances by State Govt (1+2) 492441 153948 6463891. Developmental Purpose (a+b) 491829 129886 621715(a) Social Services (1 to 3) 63998 30365 943631. Housing 16946 4347 213112. Govt Servants (Housing) 2919 12837 157563. Others 44115 13181 57296(b) Economic Services (1 to 7) 427831 99521 5273521. Co-operation 14986 6000 209862. Crop Husbandary 2584 23340 259243. Soil & Water Conservation 1175 113 12884. Power Projects 368676 40367 4090435. Village & Small Industries 3979 408 43876. Other Industries & Minerals 11827 4101 159287. Others 24604 25192 49796(2) Non developmental purposes (a+b) 612 24062 24674(a) Govt Servants (Other than housing) 396 17799 18195(b) Miscellaneous 216 6263 6479(A) Surplus(+)/ Deficit (-) on Capital Account 621097(B) Remittances (net) -71608(C) Surplus (+)/ Deficit (-) on Revenue Account -565075
(D) Overall Surplus(+)/Deficit(-) (A+B+C) Financing of Surplus(+)/Deficit(-) -15586(E)Increase(+)/ Decrease(-) in cash Balances -62910(a) Opening Balances -147447(b) Closing Balances -210357
(F) Withdrawals from (-) / Additions to (+) Cash Balance Investment Account(net) 68541(G) Increase(-) /Decrease (+) in ways & means advances & over drafts from RBI (net) -21217
Source- Finances of Govt 1993-94, Feb 94 RBI Appendix IV
TABLE - DET 12 CAPITAL ACCOUNT- DISBURSEMENTS - ALL STATES
- S-46 -
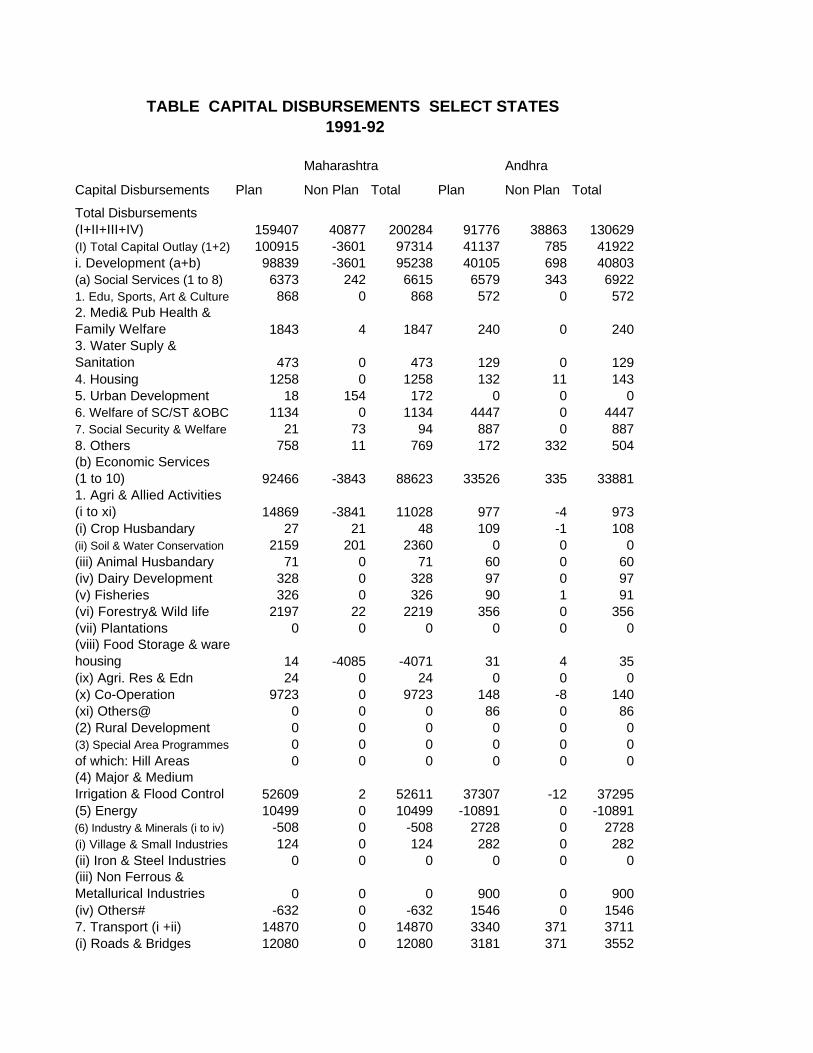
Maharashtra Andhra
Capital Disbursements Plan Non Plan Total Plan Non Plan Total
Total Disbursements (I+II+III+IV) 159407 40877 200284 91776 38863 130629(I) Total Capital Outlay (1+2) 100915 -3601 97314 41137 785 41922i. Development (a+b) 98839 -3601 95238 40105 698 40803(a) Social Services (1 to 8) 6373 242 6615 6579 343 69221. Edu, Sports, Art & Culture 868 0 868 572 0 5722. Medi& Pub Health & Family Welfare 1843 4 1847 240 0 2403. Water Suply & Sanitation 473 0 473 129 0 1294. Housing 1258 0 1258 132 11 1435. Urban Development 18 154 172 0 0 06. Welfare of SC/ST &OBC 1134 0 1134 4447 0 44477. Social Security & Welfare 21 73 94 887 0 8878. Others 758 11 769 172 332 504(b) Economic Services (1 to 10) 92466 -3843 88623 33526 335 338811. Agri & Allied Activities (i to xi) 14869 -3841 11028 977 -4 973(i) Crop Husbandary 27 21 48 109 -1 108(ii) Soil & Water Conservation 2159 201 2360 0 0 0(iii) Animal Husbandary 71 0 71 60 0 60(iv) Dairy Development 328 0 328 97 0 97(v) Fisheries 326 0 326 90 1 91(vi) Forestry& Wild life 2197 22 2219 356 0 356(vii) Plantations 0 0 0 0 0 0(viii) Food Storage & ware housing 14 -4085 -4071 31 4 35(ix) Agri. Res & Edn 24 0 24 0 0 0(x) Co-Operation 9723 0 9723 148 -8 140(xi) Others@ 0 0 0 86 0 86(2) Rural Development 0 0 0 0 0 0(3) Special Area Programmes 0 0 0 0 0 0of which: Hill Areas 0 0 0 0 0 0(4) Major & Medium Irrigation & Flood Control 52609 2 52611 37307 -12 37295(5) Energy 10499 0 10499 -10891 0 -10891(6) Industry & Minerals (i to iv) -508 0 -508 2728 0 2728(i) Village & Small Industries 124 0 124 282 0 282(ii) Iron & Steel Industries 0 0 0 0 0 0(iii) Non Ferrous & Metallurical Industries 0 0 0 900 0 900(iv) Others# -632 0 -632 1546 0 15467. Transport (i +ii) 14870 0 14870 3340 371 3711(i) Roads & Bridges 12080 0 12080 3181 371 3552
TABLE CAPITAL DISBURSEMENTS SELECT STATES 1991-92
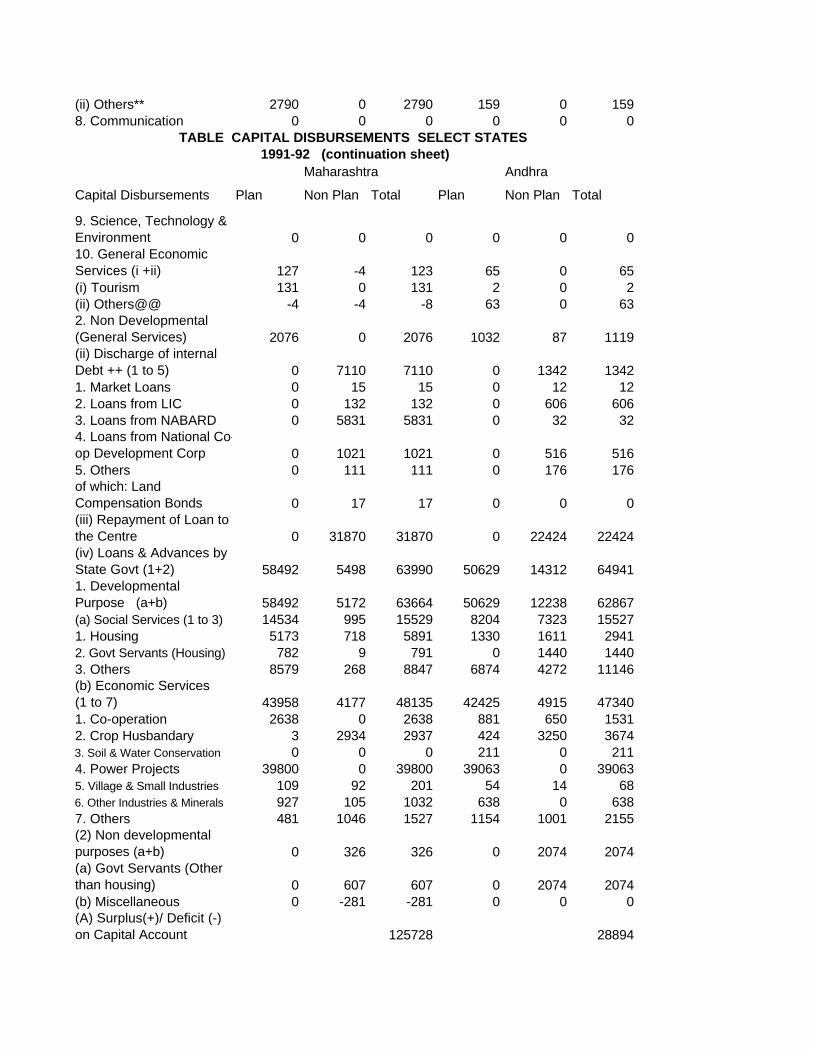
(ii) Others** 2790 0 2790 159 0 1598. Communication 0 0 0 0 0 0
Maharashtra Andhra
Capital Disbursements Plan Non Plan Total Plan Non Plan Total
9. Science, Technology & Environment 0 0 0 0 0 010. General Economic Services (i +ii) 127 -4 123 65 0 65(i) Tourism 131 0 131 2 0 2(ii) Others@@ -4 -4 -8 63 0 632. Non Developmental (General Services) 2076 0 2076 1032 87 1119(ii) Discharge of internal Debt ++ (1 to 5) 0 7110 7110 0 1342 13421. Market Loans 0 15 15 0 12 122. Loans from LIC 0 132 132 0 606 6063. Loans from NABARD 0 5831 5831 0 32 324. Loans from National Co-op Development Corp 0 1021 1021 0 516 5165. Others 0 111 111 0 176 176of which: Land Compensation Bonds 0 17 17 0 0 0(iii) Repayment of Loan to the Centre 0 31870 31870 0 22424 22424(iv) Loans & Advances by State Govt (1+2) 58492 5498 63990 50629 14312 649411. Developmental Purpose (a+b) 58492 5172 63664 50629 12238 62867(a) Social Services (1 to 3) 14534 995 15529 8204 7323 155271. Housing 5173 718 5891 1330 1611 29412. Govt Servants (Housing) 782 9 791 0 1440 14403. Others 8579 268 8847 6874 4272 11146(b) Economic Services (1 to 7) 43958 4177 48135 42425 4915 473401. Co-operation 2638 0 2638 881 650 15312. Crop Husbandary 3 2934 2937 424 3250 36743. Soil & Water Conservation 0 0 0 211 0 2114. Power Projects 39800 0 39800 39063 0 390635. Village & Small Industries 109 92 201 54 14 686. Other Industries & Minerals 927 105 1032 638 0 6387. Others 481 1046 1527 1154 1001 2155(2) Non developmental purposes (a+b) 0 326 326 0 2074 2074(a) Govt Servants (Other than housing) 0 607 607 0 2074 2074(b) Miscellaneous 0 -281 -281 0 0 0(A) Surplus(+)/ Deficit (-) on Capital Account 125728 28894
TABLE CAPITAL DISBURSEMENTS SELECT STATES 1991-92 (continuation sheet)
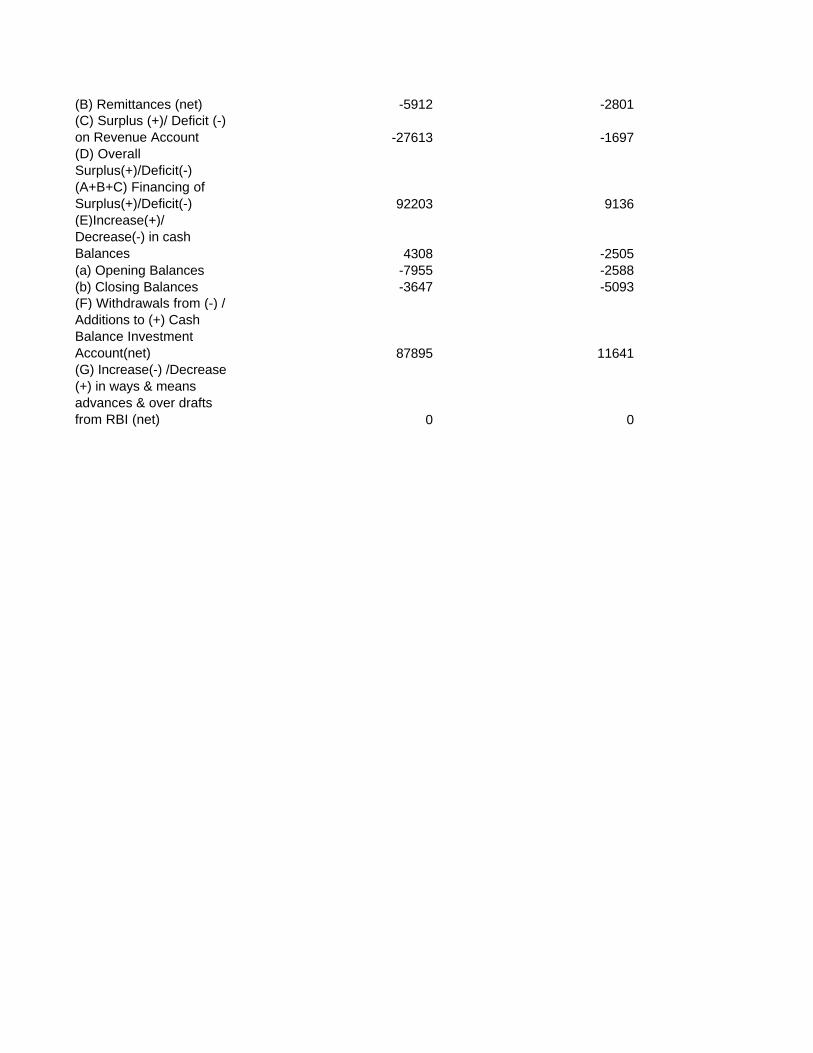
(B) Remittances (net) -5912 -2801(C) Surplus (+)/ Deficit (-) on Revenue Account -27613 -1697(D) Overall Surplus(+)/Deficit(-) (A+B+C) Financing of Surplus(+)/Deficit(-) 92203 9136(E)Increase(+)/ Decrease(-) in cash Balances 4308 -2505(a) Opening Balances -7955 -2588(b) Closing Balances -3647 -5093(F) Withdrawals from (-) / Additions to (+) Cash Balance Investment Account(net) 87895 11641(G) Increase(-) /Decrease (+) in ways & means advances & over drafts from RBI (net) 0 0
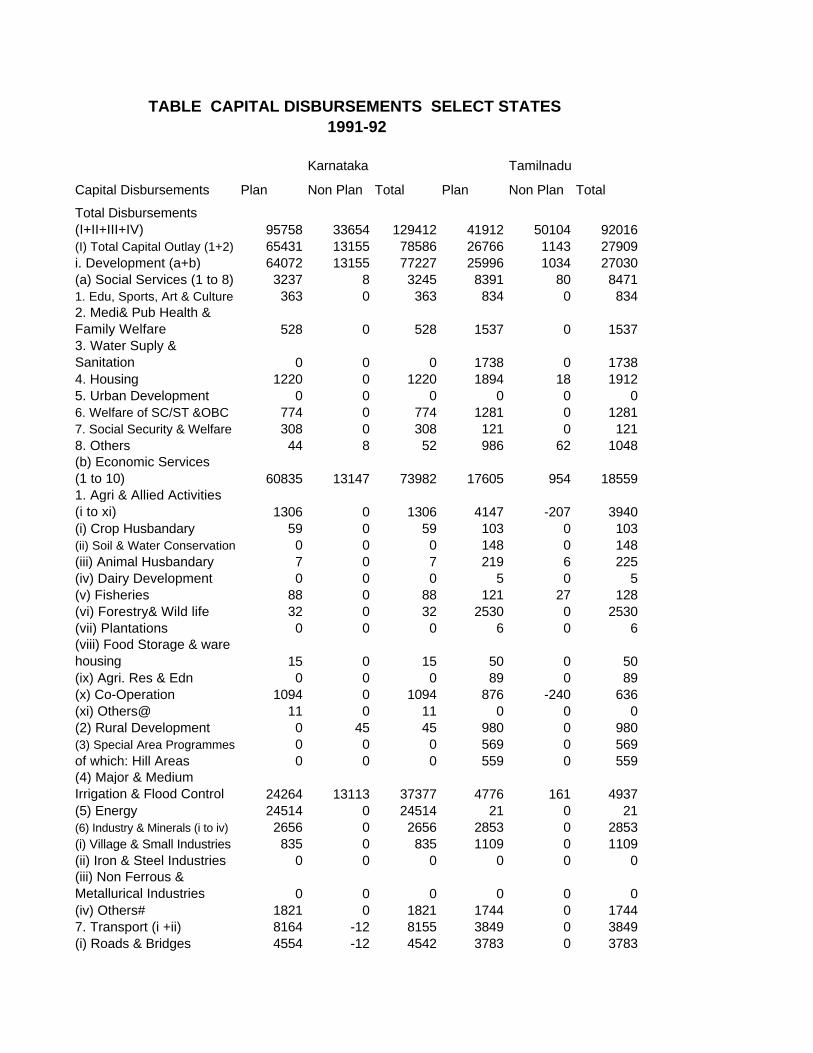
Karnataka Tamilnadu
Capital Disbursements Plan Non Plan Total Plan Non Plan Total
Total Disbursements (I+II+III+IV) 95758 33654 129412 41912 50104 92016(I) Total Capital Outlay (1+2) 65431 13155 78586 26766 1143 27909i. Development (a+b) 64072 13155 77227 25996 1034 27030(a) Social Services (1 to 8) 3237 8 3245 8391 80 84711. Edu, Sports, Art & Culture 363 0 363 834 0 8342. Medi& Pub Health & Family Welfare 528 0 528 1537 0 15373. Water Suply & Sanitation 0 0 0 1738 0 17384. Housing 1220 0 1220 1894 18 19125. Urban Development 0 0 0 0 0 06. Welfare of SC/ST &OBC 774 0 774 1281 0 12817. Social Security & Welfare 308 0 308 121 0 1218. Others 44 8 52 986 62 1048(b) Economic Services (1 to 10) 60835 13147 73982 17605 954 185591. Agri & Allied Activities (i to xi) 1306 0 1306 4147 -207 3940(i) Crop Husbandary 59 0 59 103 0 103(ii) Soil & Water Conservation 0 0 0 148 0 148(iii) Animal Husbandary 7 0 7 219 6 225(iv) Dairy Development 0 0 0 5 0 5(v) Fisheries 88 0 88 121 27 128(vi) Forestry& Wild life 32 0 32 2530 0 2530(vii) Plantations 0 0 0 6 0 6(viii) Food Storage & ware housing 15 0 15 50 0 50(ix) Agri. Res & Edn 0 0 0 89 0 89(x) Co-Operation 1094 0 1094 876 -240 636(xi) Others@ 11 0 11 0 0 0(2) Rural Development 0 45 45 980 0 980(3) Special Area Programmes 0 0 0 569 0 569of which: Hill Areas 0 0 0 559 0 559(4) Major & Medium Irrigation & Flood Control 24264 13113 37377 4776 161 4937(5) Energy 24514 0 24514 21 0 21(6) Industry & Minerals (i to iv) 2656 0 2656 2853 0 2853(i) Village & Small Industries 835 0 835 1109 0 1109(ii) Iron & Steel Industries 0 0 0 0 0 0(iii) Non Ferrous & Metallurical Industries 0 0 0 0 0 0(iv) Others# 1821 0 1821 1744 0 17447. Transport (i +ii) 8164 -12 8155 3849 0 3849(i) Roads & Bridges 4554 -12 4542 3783 0 3783
TABLE CAPITAL DISBURSEMENTS SELECT STATES 1991-92

(ii) Others** 3613 0 3613 66 0 668. Communication 0 0 0 0 0 0
Karnataka Tamilnadu
Capital Disbursements Plan Non Plan Total Plan Non Plan Total
9. Science, Technology & Environment 0 0 0 0 0 010. General Economic Services (i +ii) -72 1 -71 410 1000 1410(i) Tourism 128 0 128 54 0 54(ii) Others@@ -200 1 -199 356 1000 13562. Non Developmental (General Services) 1359 0 1359 770 109 879(ii) Discharge of internal Debt ++ (1 to 5) 0 1060 1060 0 1281 12811. Market Loans 0 4 4 0 6 62. Loans from LIC 0 316 316 0 359 3593. Loans from NABARD 0 60 60 0 93 934. Loans from National Co-op Development Corp 0 510 510 0 663 6635. Others 0 170 170 0 160 160of which: Land Compensation Bonds 0 0 0 0 1 1(iii) Repayment of Loan to the Centre 0 15704 15704 0 21613 21613(iv) Loans & Advances by State Govt (1+2) 30327 3735 34062 15146 26067 412131. Developmental Purpose (a+b) 30327 1558 31885 15102 23645 38747(a) Social Services (1 to 3) 8822 219 9041 10255 4439 146941. Housing 1202 0 1202 800 1133 19332. Govt Servants (Housing) 71 0 71 1763 0 17633. Others 7549 219 7768 7692 3306 10998(b) Economic Services (1 to 7) 24505 1339 22844 4847 19206 240531. Co-operation 1553 0 1553 185 0 1852. Crop Husbandary 0 838 838 0 100 1003. Soil & Water Conservation 200 0 200 321 0 3214. Power Projects 17032 0 17032 0 14000 140005. Village & Small Industries 368 1 369 256 4 2606. Other Industries & Minerals 343 0 343 3050 643 36937. Others 2009 500 2509 1035 4459 5494(2) Non developmental purposes (a+b) 0 2177 2177 44 2422 2466(a) Govt Servants (Other than housing) 0 529 529 0 2394 2394(b) Miscellaneous 0 1648 1648 44 28 72(A) Surplus(+)/ Deficit (-) on Capital Account 17165 190782
TABLE CAPITAL DISBURSEMENTS SELECT STATES 1991-92 (continuation sheet)
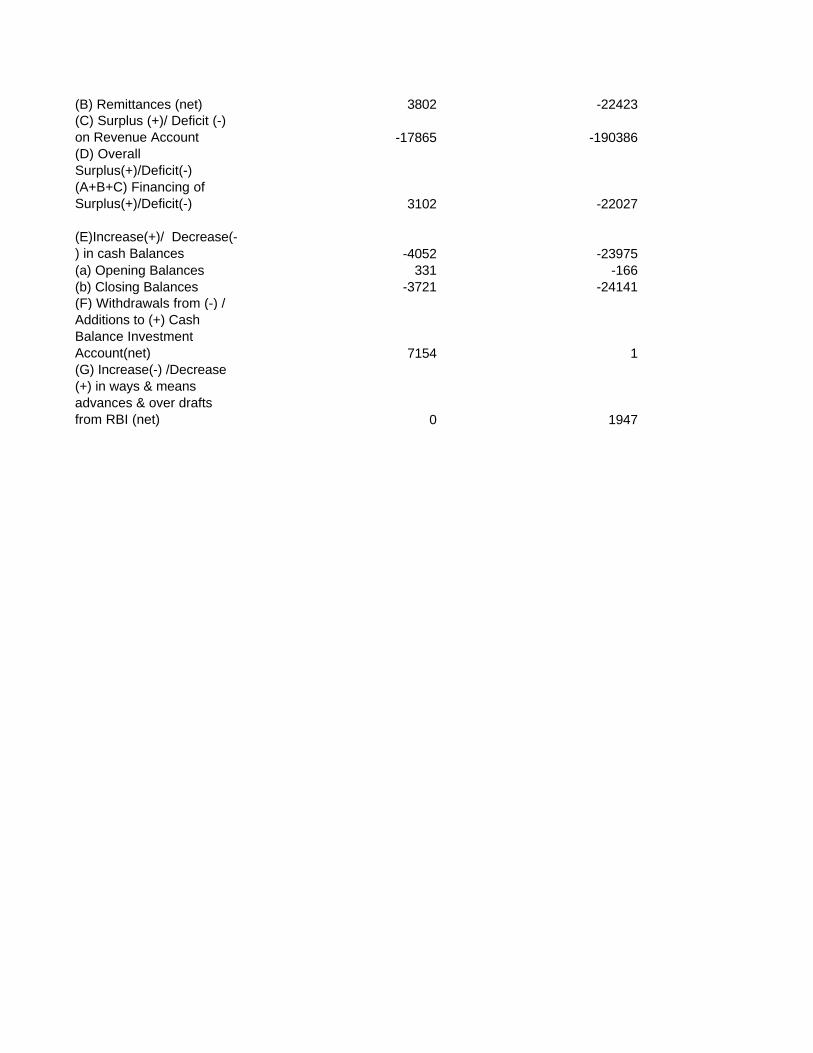
(B) Remittances (net) 3802 -22423(C) Surplus (+)/ Deficit (-) on Revenue Account -17865 -190386(D) Overall Surplus(+)/Deficit(-) (A+B+C) Financing of Surplus(+)/Deficit(-) 3102 -22027
(E)Increase(+)/ Decrease(-) in cash Balances -4052 -23975(a) Opening Balances 331 -166(b) Closing Balances -3721 -24141(F) Withdrawals from (-) / Additions to (+) Cash Balance Investment Account(net) 7154 1(G) Increase(-) /Decrease (+) in ways & means advances & over drafts from RBI (net) 0 1947
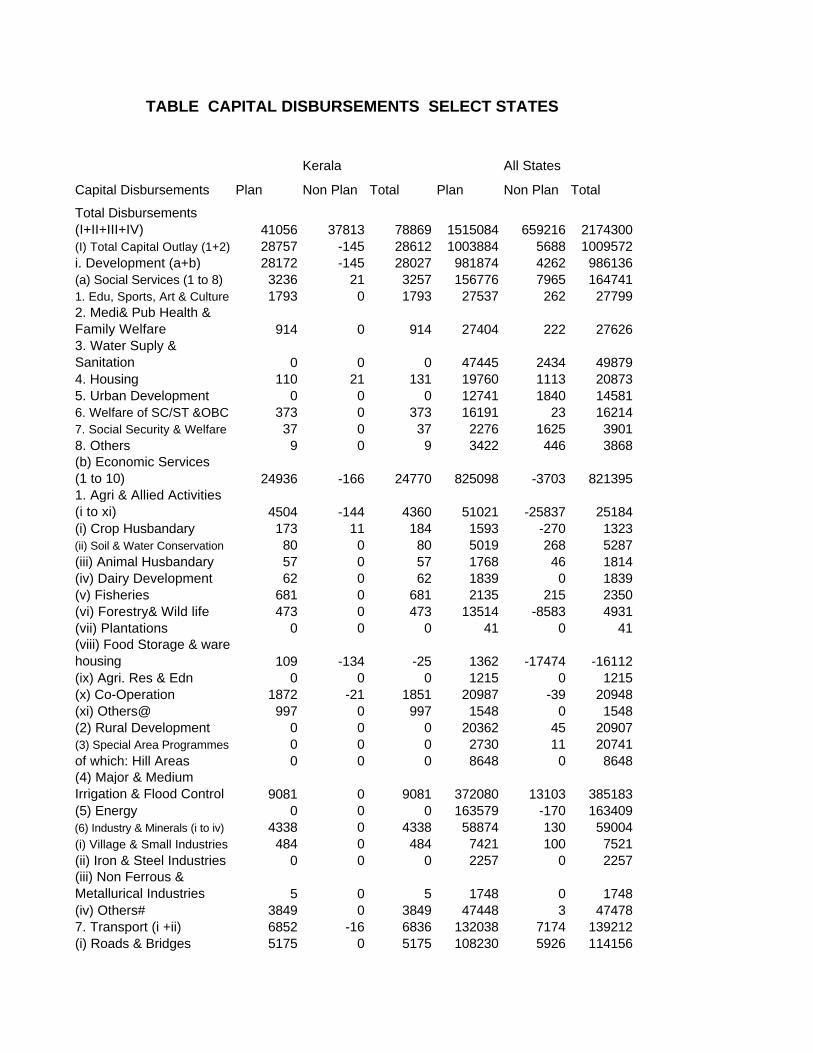
Kerala All States
Capital Disbursements Plan Non Plan Total Plan Non Plan Total
Total Disbursements (I+II+III+IV) 41056 37813 78869 1515084 659216 2174300(I) Total Capital Outlay (1+2) 28757 -145 28612 1003884 5688 1009572i. Development (a+b) 28172 -145 28027 981874 4262 986136(a) Social Services (1 to 8) 3236 21 3257 156776 7965 1647411. Edu, Sports, Art & Culture 1793 0 1793 27537 262 277992. Medi& Pub Health & Family Welfare 914 0 914 27404 222 276263. Water Suply & Sanitation 0 0 0 47445 2434 498794. Housing 110 21 131 19760 1113 208735. Urban Development 0 0 0 12741 1840 145816. Welfare of SC/ST &OBC 373 0 373 16191 23 162147. Social Security & Welfare 37 0 37 2276 1625 39018. Others 9 0 9 3422 446 3868(b) Economic Services (1 to 10) 24936 -166 24770 825098 -3703 8213951. Agri & Allied Activities (i to xi) 4504 -144 4360 51021 -25837 25184(i) Crop Husbandary 173 11 184 1593 -270 1323(ii) Soil & Water Conservation 80 0 80 5019 268 5287(iii) Animal Husbandary 57 0 57 1768 46 1814(iv) Dairy Development 62 0 62 1839 0 1839(v) Fisheries 681 0 681 2135 215 2350(vi) Forestry& Wild life 473 0 473 13514 -8583 4931(vii) Plantations 0 0 0 41 0 41(viii) Food Storage & ware housing 109 -134 -25 1362 -17474 -16112(ix) Agri. Res & Edn 0 0 0 1215 0 1215(x) Co-Operation 1872 -21 1851 20987 -39 20948(xi) Others@ 997 0 997 1548 0 1548(2) Rural Development 0 0 0 20362 45 20907(3) Special Area Programmes 0 0 0 2730 11 20741of which: Hill Areas 0 0 0 8648 0 8648(4) Major & Medium Irrigation & Flood Control 9081 0 9081 372080 13103 385183(5) Energy 0 0 0 163579 -170 163409(6) Industry & Minerals (i to iv) 4338 0 4338 58874 130 59004(i) Village & Small Industries 484 0 484 7421 100 7521(ii) Iron & Steel Industries 0 0 0 2257 0 2257(iii) Non Ferrous & Metallurical Industries 5 0 5 1748 0 1748(iv) Others# 3849 0 3849 47448 3 474787. Transport (i +ii) 6852 -16 6836 132038 7174 139212(i) Roads & Bridges 5175 0 5175 108230 5926 114156
TABLE CAPITAL DISBURSEMENTS SELECT STATES

(ii) Others** 1677 -16 1661 23808 1248 250568. Communication 0 0 0 0 0 0
Kerala All States
Capital Disbursements Plan Non Plan Total Plan Non Plan Total
9. Science, Technology & Environment 0 0 0 148 0 14810. General Economic Services (i +ii) 161 -6 155 6266 1841 8107(i) Tourism 154 0 154 4122 38 4160(ii) Others@@ 7 -6 1 2144 1803 39472. Non Developmental (General Services) 585 0 585 22010 1426 23436(ii) Discharge of internal Debt ++ (1 to 5) 0 2151 2151 0 148791 1487911. Market Loans 0 2 2 0 480 4802. Loans from LIC 0 277 277 0 4502 45023. Loans from NABARD 0 1065 1065 0 15931 159314. Loans from National Co-op Development Corp 0 0 0 0 7209 72095. Others 0 807 807 0 120669 120669of which: Land Compensation Bonds 0 2 2 0 207 207(iii) Repayment of Loan to the Centre 0 30592 30592 18759 350789 369548(iv) Loans & Advances by State Govt (1+2) 12299 5215 17514 492441 153948 6463891. Developmental Purpose (a+b) 12299 4943 17242 491829 129886 621715(a) Social Services (1 to 3) 3454 1269 4723 63998 30365 943631. Housing 202 0 202 16946 4347 213112. Govt Servants (Housing) 0 1215 1215 2919 12837 157563. Others 3252 54 3306 44115 13181 57296(b) Economic Services (1 to 7) 8845 3674 12519 427831 99521 5273521. Co-operation 879 0 879 14986 6000 209862. Crop Husbandary 0 595 595 2584 23340 259243. Soil & Water Conservation 1 0 1 1175 113 12884. Power Projects 5749 0 5749 368676 40367 4090435. Village & Small Industries 704 125 829 3979 408 43876. Other Industries & Minerals 15 0 15 11827 4101 159287. Others 1497 2954 4451 24604 25192 49796(2) Non developmental purposes (a+b) 0 272 272 612 24062 24674(a) Govt Servants (Other than housing) 0 272 272 396 17799 18195(b) Miscellaneous 0 0 0 216 6263 6479(A) Surplus(+)/ Deficit (-) on Capital Account 31631 621097
TABLE CAPITAL DISBURSEMENTS SELECT STATES 1991-92 (continuation sheet)
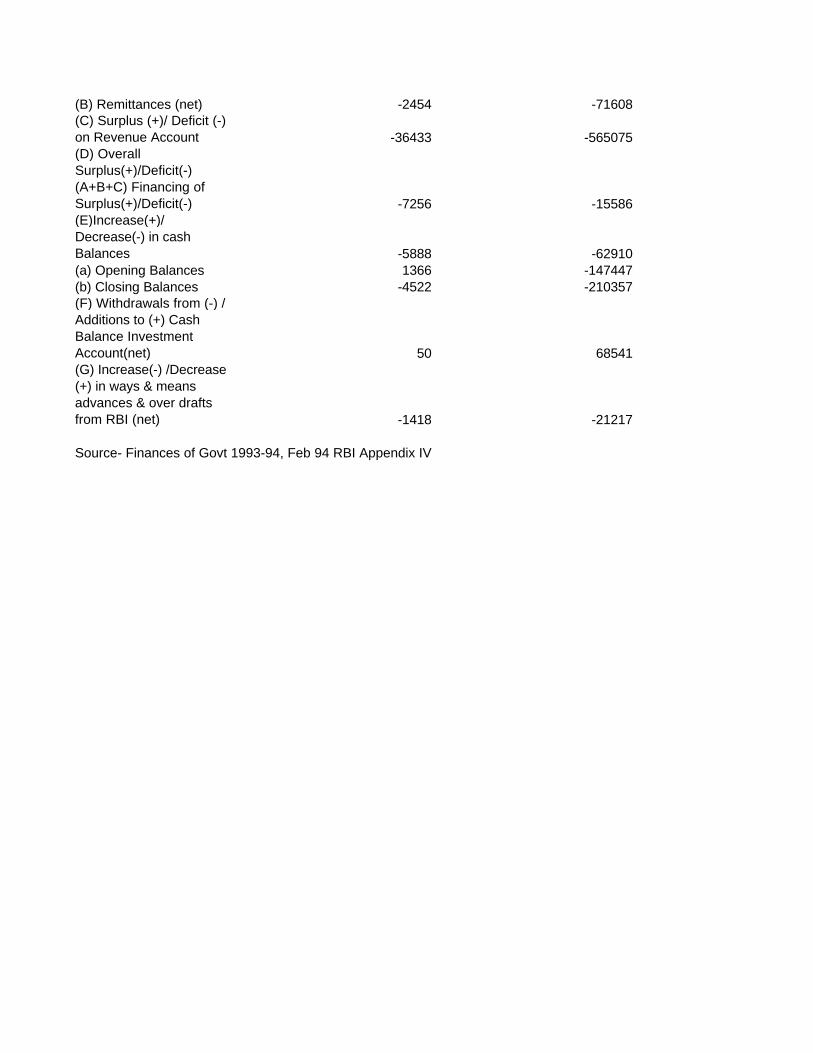
(B) Remittances (net) -2454 -71608(C) Surplus (+)/ Deficit (-) on Revenue Account -36433 -565075(D) Overall Surplus(+)/Deficit(-) (A+B+C) Financing of Surplus(+)/Deficit(-) -7256 -15586(E)Increase(+)/ Decrease(-) in cash Balances -5888 -62910(a) Opening Balances 1366 -147447(b) Closing Balances -4522 -210357(F) Withdrawals from (-) / Additions to (+) Cash Balance Investment Account(net) 50 68541(G) Increase(-) /Decrease (+) in ways & means advances & over drafts from RBI (net) -1418 -21217
Source- Finances of Govt 1993-94, Feb 94 RBI Appendix IV
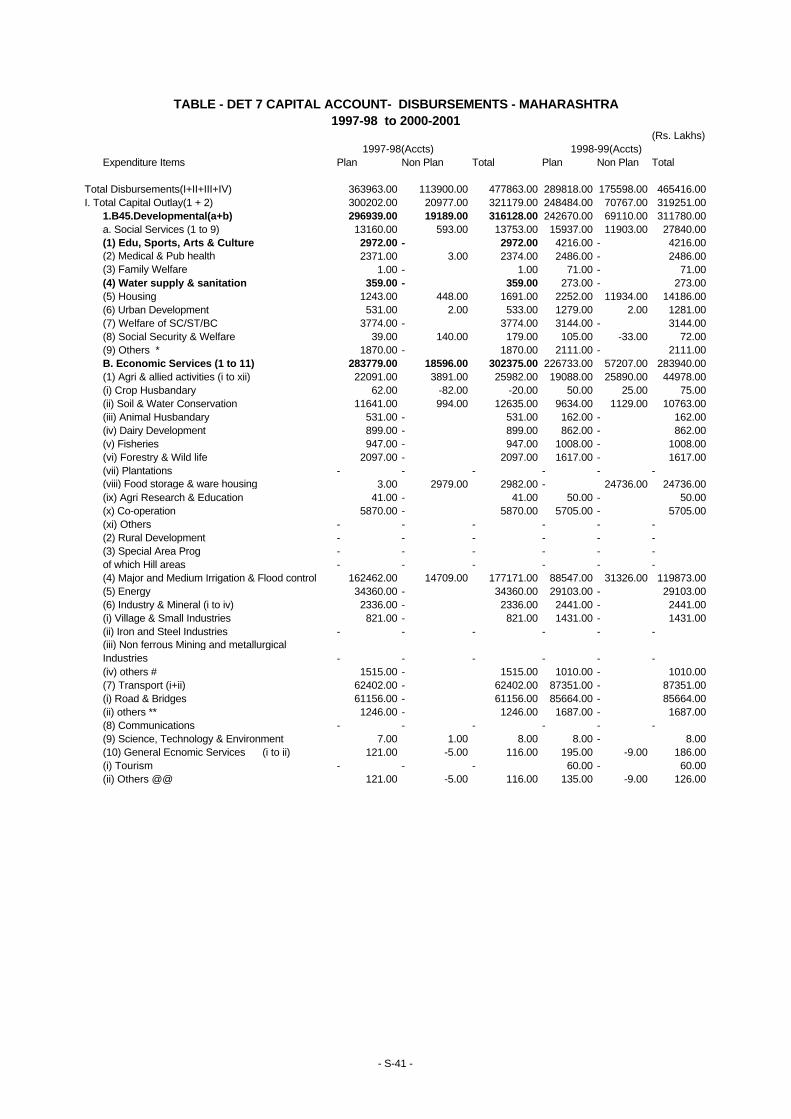
(Rs. Lakhs) 1997-98(Accts) 1998-99(Accts)
Expenditure Items Plan Non Plan Total Plan Non Plan Total
Total Disbursements(I+II+III+IV) 363963.00 113900.00 477863.00 289818.00 175598.00 465416.00I. Total Capital Outlay(1 + 2) 300202.00 20977.00 321179.00 248484.00 70767.00 319251.00
1.B45.Developmental(a+b) 296939.00 19189.00 316128.00 242670.00 69110.00 311780.00a. Social Services (1 to 9) 13160.00 593.00 13753.00 15937.00 11903.00 27840.00(1) Edu, Sports, Arts & Culture 2972.00 - 2972.00 4216.00 - 4216.00(2) Medical & Pub health 2371.00 3.00 2374.00 2486.00 - 2486.00(3) Family Welfare 1.00 - 1.00 71.00 - 71.00(4) Water supply & sanitation 359.00 - 359.00 273.00 - 273.00(5) Housing 1243.00 448.00 1691.00 2252.00 11934.00 14186.00(6) Urban Development 531.00 2.00 533.00 1279.00 2.00 1281.00(7) Welfare of SC/ST/BC 3774.00 - 3774.00 3144.00 - 3144.00(8) Social Security & Welfare 39.00 140.00 179.00 105.00 -33.00 72.00(9) Others * 1870.00 - 1870.00 2111.00 - 2111.00B. Economic Services (1 to 11) 283779.00 18596.00 302375.00 226733.00 57207.00 283940.00(1) Agri & allied activities (i to xii) 22091.00 3891.00 25982.00 19088.00 25890.00 44978.00(i) Crop Husbandary 62.00 -82.00 -20.00 50.00 25.00 75.00(ii) Soil & Water Conservation 11641.00 994.00 12635.00 9634.00 1129.00 10763.00(iii) Animal Husbandary 531.00 - 531.00 162.00 - 162.00(iv) Dairy Development 899.00 - 899.00 862.00 - 862.00(v) Fisheries 947.00 - 947.00 1008.00 - 1008.00(vi) Forestry & Wild life 2097.00 - 2097.00 1617.00 - 1617.00(vii) Plantations - - - - - -(viii) Food storage & ware housing 3.00 2979.00 2982.00 - 24736.00 24736.00(ix) Agri Research & Education 41.00 - 41.00 50.00 - 50.00(x) Co-operation 5870.00 - 5870.00 5705.00 - 5705.00(xi) Others - - - - - -(2) Rural Development - - - - - -(3) Special Area Prog - - - - - -of which Hill areas - - - - - -(4) Major and Medium Irrigation & Flood control 162462.00 14709.00 177171.00 88547.00 31326.00 119873.00(5) Energy 34360.00 - 34360.00 29103.00 - 29103.00(6) Industry & Mineral (i to iv) 2336.00 - 2336.00 2441.00 - 2441.00(i) Village & Small Industries 821.00 - 821.00 1431.00 - 1431.00(ii) Iron and Steel Industries - - - - - -(iii) Non ferrous Mining and metallurgical Industries - - - - - -(iv) others # 1515.00 - 1515.00 1010.00 - 1010.00(7) Transport (i+ii) 62402.00 - 62402.00 87351.00 - 87351.00(i) Road & Bridges 61156.00 - 61156.00 85664.00 - 85664.00(ii) others ** 1246.00 - 1246.00 1687.00 - 1687.00(8) Communications - - - - - -(9) Science, Technology & Environment 7.00 1.00 8.00 8.00 - 8.00(10) General Ecnomic Services (i to ii) 121.00 -5.00 116.00 195.00 -9.00 186.00(i) Tourism - - - 60.00 - 60.00(ii) Others @@ 121.00 -5.00 116.00 135.00 -9.00 126.00
1997-98 to 2000-2001TABLE - DET 7 CAPITAL ACCOUNT- DISBURSEMENTS - MAHARASHTRA
- S-41 -
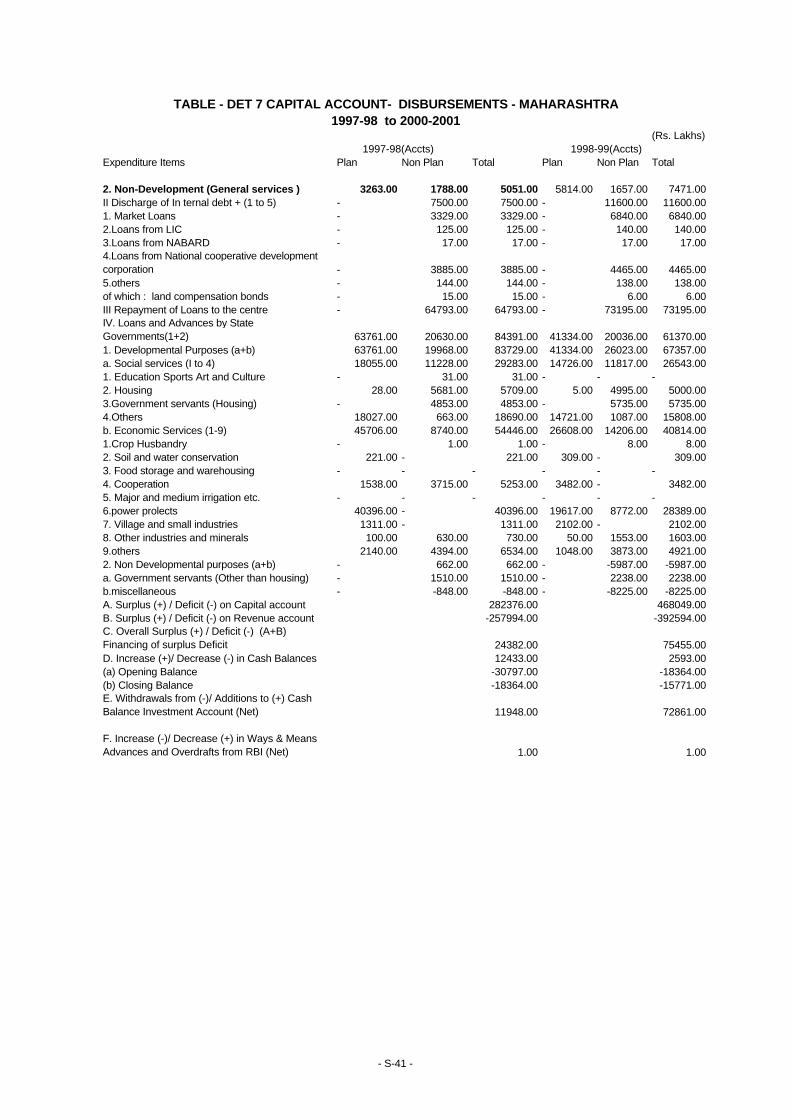
(Rs. Lakhs) 1997-98(Accts) 1998-99(Accts)
Expenditure Items Plan Non Plan Total Plan Non Plan Total
2. Non-Development (General services ) 3263.00 1788.00 5051.00 5814.00 1657.00 7471.00II Discharge of In ternal debt + (1 to 5) - 7500.00 7500.00 - 11600.00 11600.001. Market Loans - 3329.00 3329.00 - 6840.00 6840.002.Loans from LIC - 125.00 125.00 - 140.00 140.003.Loans from NABARD - 17.00 17.00 - 17.00 17.004.Loans from National cooperative development corporation - 3885.00 3885.00 - 4465.00 4465.005.others - 144.00 144.00 - 138.00 138.00of which : land compensation bonds - 15.00 15.00 - 6.00 6.00III Repayment of Loans to the centre - 64793.00 64793.00 - 73195.00 73195.00IV. Loans and Advances by State Governments(1+2) 63761.00 20630.00 84391.00 41334.00 20036.00 61370.001. Developmental Purposes (a+b) 63761.00 19968.00 83729.00 41334.00 26023.00 67357.00a. Social services (I to 4) 18055.00 11228.00 29283.00 14726.00 11817.00 26543.001. Education Sports Art and Culture - 31.00 31.00 - - -2. Housing 28.00 5681.00 5709.00 5.00 4995.00 5000.003.Government servants (Housing) - 4853.00 4853.00 - 5735.00 5735.004.Others 18027.00 663.00 18690.00 14721.00 1087.00 15808.00b. Economic Services (1-9) 45706.00 8740.00 54446.00 26608.00 14206.00 40814.001.Crop Husbandry - 1.00 1.00 - 8.00 8.002. Soil and water conservation 221.00 - 221.00 309.00 - 309.003. Food storage and warehousing - - - - - -4. Cooperation 1538.00 3715.00 5253.00 3482.00 - 3482.005. Major and medium irrigation etc. - - - - - -6.power prolects 40396.00 - 40396.00 19617.00 8772.00 28389.007. Village and small industries 1311.00 - 1311.00 2102.00 - 2102.008. Other industries and minerals 100.00 630.00 730.00 50.00 1553.00 1603.009.others 2140.00 4394.00 6534.00 1048.00 3873.00 4921.002. Non Developmental purposes (a+b) - 662.00 662.00 - -5987.00 -5987.00a. Government servants (Other than housing) - 1510.00 1510.00 - 2238.00 2238.00b.miscellaneous - -848.00 -848.00 - -8225.00 -8225.00A. Surplus (+) / Deficit (-) on Capital account 282376.00 468049.00B. Surplus (+) / Deficit (-) on Revenue account -257994.00 -392594.00C. Overall Surplus (+) / Deficit (-) (A+B) Financing of surplus Deficit 24382.00 75455.00D. Increase (+)/ Decrease (-) in Cash Balances 12433.00 2593.00(a) Opening Balance -30797.00 -18364.00(b) Closing Balance -18364.00 -15771.00E. Withdrawals from (-)/ Additions to (+) Cash Balance Investment Account (Net) 11948.00 72861.00
F. Increase (-)/ Decrease (+) in Ways & Means Advances and Overdrafts from RBI (Net) 1.00 1.00
1997-98 to 2000-2001TABLE - DET 7 CAPITAL ACCOUNT- DISBURSEMENTS - MAHARASHTRA
- S-41 -
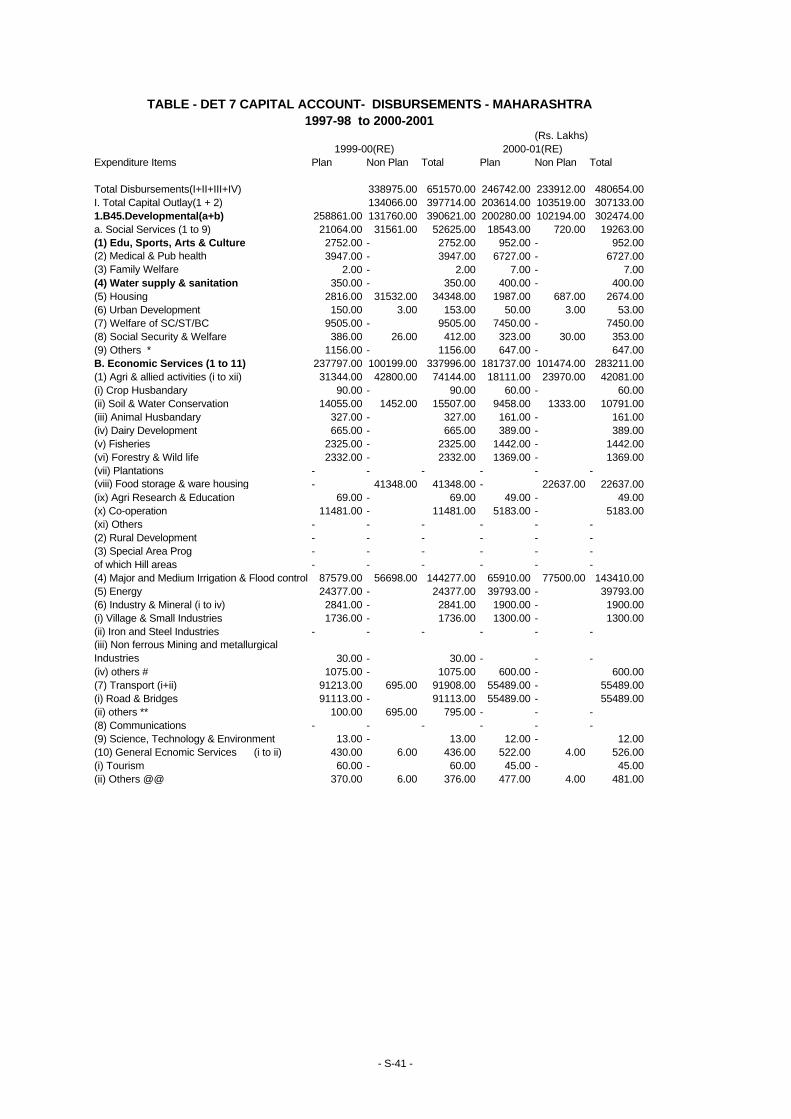
(Rs. Lakhs) 1999-00(RE) 2000-01(RE)
Expenditure Items Plan Non Plan Total Plan Non Plan Total
Total Disbursements(I+II+III+IV) 338975.00 651570.00 246742.00 233912.00 480654.00I. Total Capital Outlay(1 + 2) 134066.00 397714.00 203614.00 103519.00 307133.001.B45.Developmental(a+b) 258861.00 131760.00 390621.00 200280.00 102194.00 302474.00a. Social Services (1 to 9) 21064.00 31561.00 52625.00 18543.00 720.00 19263.00(1) Edu, Sports, Arts & Culture 2752.00 - 2752.00 952.00 - 952.00(2) Medical & Pub health 3947.00 - 3947.00 6727.00 - 6727.00(3) Family Welfare 2.00 - 2.00 7.00 - 7.00(4) Water supply & sanitation 350.00 - 350.00 400.00 - 400.00(5) Housing 2816.00 31532.00 34348.00 1987.00 687.00 2674.00(6) Urban Development 150.00 3.00 153.00 50.00 3.00 53.00(7) Welfare of SC/ST/BC 9505.00 - 9505.00 7450.00 - 7450.00(8) Social Security & Welfare 386.00 26.00 412.00 323.00 30.00 353.00(9) Others * 1156.00 - 1156.00 647.00 - 647.00B. Economic Services (1 to 11) 237797.00 100199.00 337996.00 181737.00 101474.00 283211.00(1) Agri & allied activities (i to xii) 31344.00 42800.00 74144.00 18111.00 23970.00 42081.00(i) Crop Husbandary 90.00 - 90.00 60.00 - 60.00(ii) Soil & Water Conservation 14055.00 1452.00 15507.00 9458.00 1333.00 10791.00(iii) Animal Husbandary 327.00 - 327.00 161.00 - 161.00(iv) Dairy Development 665.00 - 665.00 389.00 - 389.00(v) Fisheries 2325.00 - 2325.00 1442.00 - 1442.00(vi) Forestry & Wild life 2332.00 - 2332.00 1369.00 - 1369.00(vii) Plantations - - - - - -(viii) Food storage & ware housing - 41348.00 41348.00 - 22637.00 22637.00(ix) Agri Research & Education 69.00 - 69.00 49.00 - 49.00(x) Co-operation 11481.00 - 11481.00 5183.00 - 5183.00(xi) Others - - - - - -(2) Rural Development - - - - - -(3) Special Area Prog - - - - - -of which Hill areas - - - - - -(4) Major and Medium Irrigation & Flood control 87579.00 56698.00 144277.00 65910.00 77500.00 143410.00(5) Energy 24377.00 - 24377.00 39793.00 - 39793.00(6) Industry & Mineral (i to iv) 2841.00 - 2841.00 1900.00 - 1900.00(i) Village & Small Industries 1736.00 - 1736.00 1300.00 - 1300.00(ii) Iron and Steel Industries - - - - - -(iii) Non ferrous Mining and metallurgical Industries 30.00 - 30.00 - - -(iv) others # 1075.00 - 1075.00 600.00 - 600.00(7) Transport (i+ii) 91213.00 695.00 91908.00 55489.00 - 55489.00(i) Road & Bridges 91113.00 - 91113.00 55489.00 - 55489.00(ii) others ** 100.00 695.00 795.00 - - -(8) Communications - - - - - -(9) Science, Technology & Environment 13.00 - 13.00 12.00 - 12.00(10) General Ecnomic Services (i to ii) 430.00 6.00 436.00 522.00 4.00 526.00(i) Tourism 60.00 - 60.00 45.00 - 45.00(ii) Others @@ 370.00 6.00 376.00 477.00 4.00 481.00
TABLE - DET 7 CAPITAL ACCOUNT- DISBURSEMENTS - MAHARASHTRA1997-98 to 2000-2001
- S-41 -
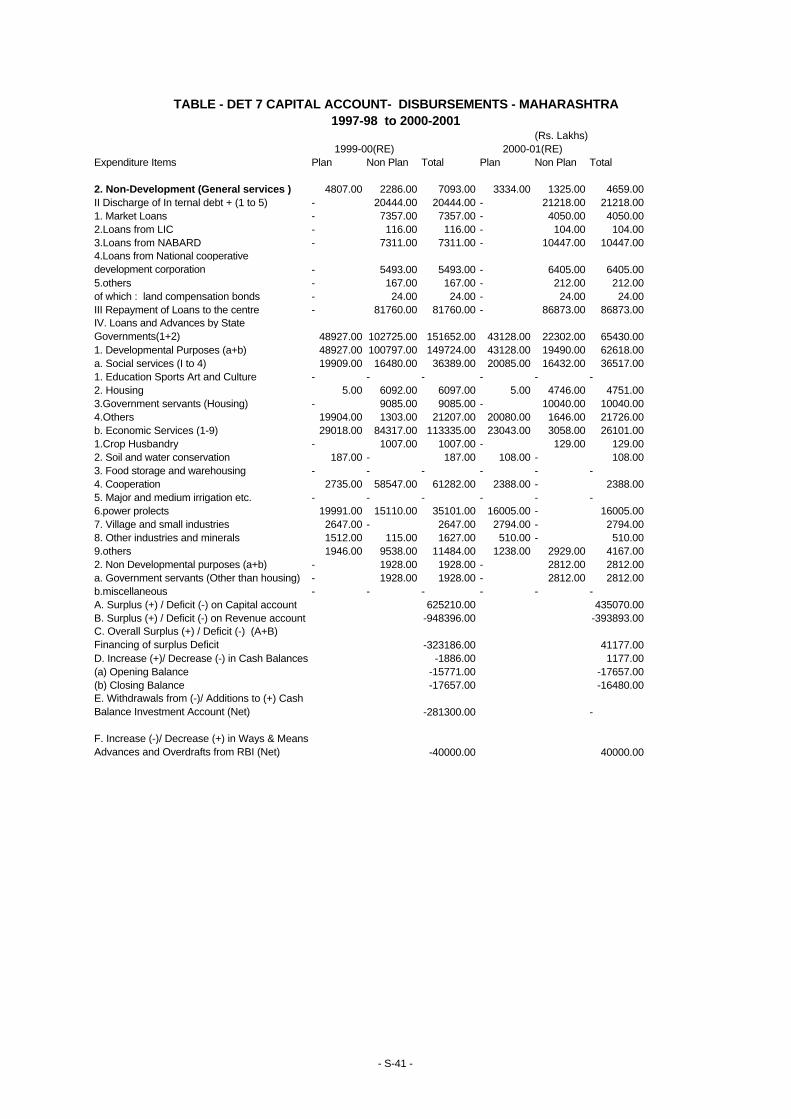
(Rs. Lakhs) 1999-00(RE) 2000-01(RE)
Expenditure Items Plan Non Plan Total Plan Non Plan Total
2. Non-Development (General services ) 4807.00 2286.00 7093.00 3334.00 1325.00 4659.00II Discharge of In ternal debt + (1 to 5) - 20444.00 20444.00 - 21218.00 21218.001. Market Loans - 7357.00 7357.00 - 4050.00 4050.002.Loans from LIC - 116.00 116.00 - 104.00 104.003.Loans from NABARD - 7311.00 7311.00 - 10447.00 10447.004.Loans from National cooperative development corporation - 5493.00 5493.00 - 6405.00 6405.005.others - 167.00 167.00 - 212.00 212.00of which : land compensation bonds - 24.00 24.00 - 24.00 24.00III Repayment of Loans to the centre - 81760.00 81760.00 - 86873.00 86873.00IV. Loans and Advances by State Governments(1+2) 48927.00 102725.00 151652.00 43128.00 22302.00 65430.001. Developmental Purposes (a+b) 48927.00 100797.00 149724.00 43128.00 19490.00 62618.00a. Social services (I to 4) 19909.00 16480.00 36389.00 20085.00 16432.00 36517.001. Education Sports Art and Culture - - - - - -2. Housing 5.00 6092.00 6097.00 5.00 4746.00 4751.003.Government servants (Housing) - 9085.00 9085.00 - 10040.00 10040.004.Others 19904.00 1303.00 21207.00 20080.00 1646.00 21726.00b. Economic Services (1-9) 29018.00 84317.00 113335.00 23043.00 3058.00 26101.001.Crop Husbandry - 1007.00 1007.00 - 129.00 129.002. Soil and water conservation 187.00 - 187.00 108.00 - 108.003. Food storage and warehousing - - - - - -4. Cooperation 2735.00 58547.00 61282.00 2388.00 - 2388.005. Major and medium irrigation etc. - - - - - -6.power prolects 19991.00 15110.00 35101.00 16005.00 - 16005.007. Village and small industries 2647.00 - 2647.00 2794.00 - 2794.008. Other industries and minerals 1512.00 115.00 1627.00 510.00 - 510.009.others 1946.00 9538.00 11484.00 1238.00 2929.00 4167.002. Non Developmental purposes (a+b) - 1928.00 1928.00 - 2812.00 2812.00a. Government servants (Other than housing) - 1928.00 1928.00 - 2812.00 2812.00b.miscellaneous - - - - - -A. Surplus (+) / Deficit (-) on Capital account 625210.00 435070.00B. Surplus (+) / Deficit (-) on Revenue account -948396.00 -393893.00C. Overall Surplus (+) / Deficit (-) (A+B) Financing of surplus Deficit -323186.00 41177.00D. Increase (+)/ Decrease (-) in Cash Balances -1886.00 1177.00(a) Opening Balance -15771.00 -17657.00(b) Closing Balance -17657.00 -16480.00E. Withdrawals from (-)/ Additions to (+) Cash Balance Investment Account (Net) -281300.00 -
F. Increase (-)/ Decrease (+) in Ways & Means Advances and Overdrafts from RBI (Net) -40000.00 40000.00
TABLE - DET 7 CAPITAL ACCOUNT- DISBURSEMENTS - MAHARASHTRA1997-98 to 2000-2001
- S-41 -
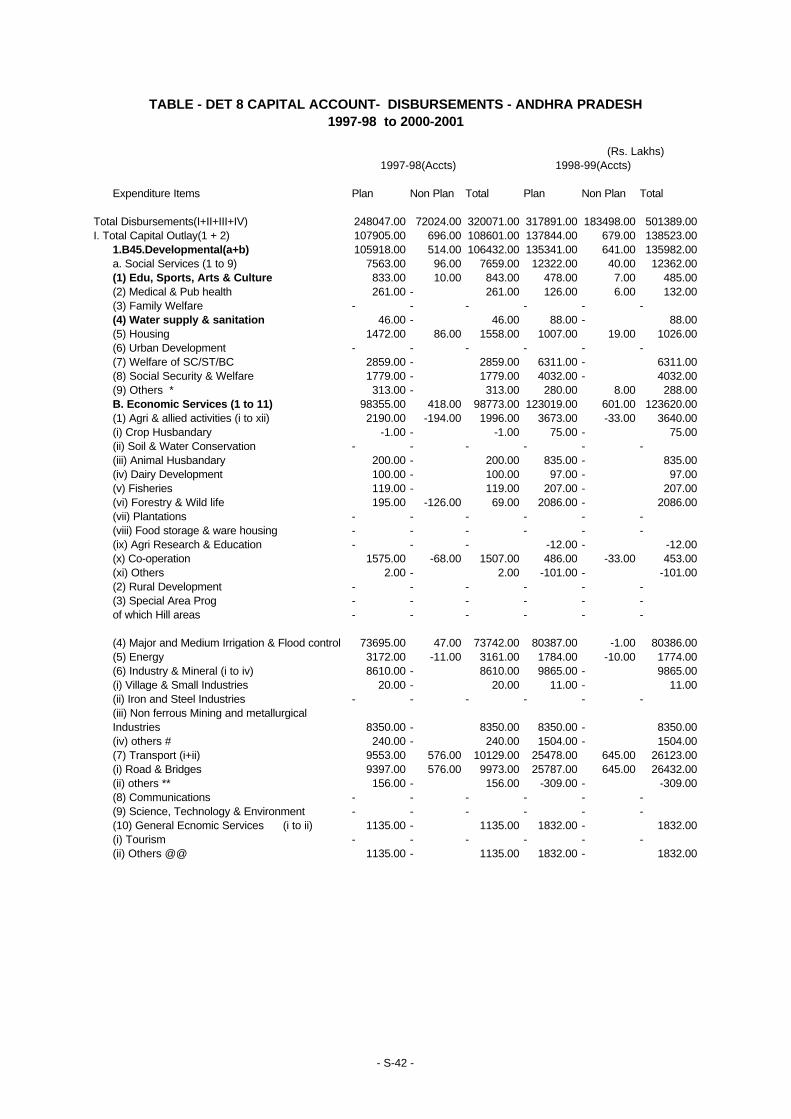
(Rs. Lakhs) 1997-98(Accts) 1998-99(Accts)
Expenditure Items Plan Non Plan Total Plan Non Plan Total
Total Disbursements(I+II+III+IV) 248047.00 72024.00 320071.00 317891.00 183498.00 501389.00I. Total Capital Outlay(1 + 2) 107905.00 696.00 108601.00 137844.00 679.00 138523.00
1.B45.Developmental(a+b) 105918.00 514.00 106432.00 135341.00 641.00 135982.00a. Social Services (1 to 9) 7563.00 96.00 7659.00 12322.00 40.00 12362.00(1) Edu, Sports, Arts & Culture 833.00 10.00 843.00 478.00 7.00 485.00(2) Medical & Pub health 261.00 - 261.00 126.00 6.00 132.00(3) Family Welfare - - - - - -(4) Water supply & sanitation 46.00 - 46.00 88.00 - 88.00(5) Housing 1472.00 86.00 1558.00 1007.00 19.00 1026.00(6) Urban Development - - - - - -(7) Welfare of SC/ST/BC 2859.00 - 2859.00 6311.00 - 6311.00(8) Social Security & Welfare 1779.00 - 1779.00 4032.00 - 4032.00(9) Others * 313.00 - 313.00 280.00 8.00 288.00B. Economic Services (1 to 11) 98355.00 418.00 98773.00 123019.00 601.00 123620.00(1) Agri & allied activities (i to xii) 2190.00 -194.00 1996.00 3673.00 -33.00 3640.00(i) Crop Husbandary -1.00 - -1.00 75.00 - 75.00(ii) Soil & Water Conservation - - - - - -(iii) Animal Husbandary 200.00 - 200.00 835.00 - 835.00(iv) Dairy Development 100.00 - 100.00 97.00 - 97.00(v) Fisheries 119.00 - 119.00 207.00 - 207.00(vi) Forestry & Wild life 195.00 -126.00 69.00 2086.00 - 2086.00(vii) Plantations - - - - - -(viii) Food storage & ware housing - - - - - -(ix) Agri Research & Education - - - -12.00 - -12.00(x) Co-operation 1575.00 -68.00 1507.00 486.00 -33.00 453.00(xi) Others 2.00 - 2.00 -101.00 - -101.00(2) Rural Development - - - - - -(3) Special Area Prog - - - - - -of which Hill areas - - - - - -
(4) Major and Medium Irrigation & Flood control 73695.00 47.00 73742.00 80387.00 -1.00 80386.00(5) Energy 3172.00 -11.00 3161.00 1784.00 -10.00 1774.00(6) Industry & Mineral (i to iv) 8610.00 - 8610.00 9865.00 - 9865.00(i) Village & Small Industries 20.00 - 20.00 11.00 - 11.00(ii) Iron and Steel Industries - - - - - -(iii) Non ferrous Mining and metallurgical Industries 8350.00 - 8350.00 8350.00 - 8350.00(iv) others # 240.00 - 240.00 1504.00 - 1504.00(7) Transport (i+ii) 9553.00 576.00 10129.00 25478.00 645.00 26123.00(i) Road & Bridges 9397.00 576.00 9973.00 25787.00 645.00 26432.00(ii) others ** 156.00 - 156.00 -309.00 - -309.00(8) Communications - - - - - -(9) Science, Technology & Environment - - - - - -(10) General Ecnomic Services (i to ii) 1135.00 - 1135.00 1832.00 - 1832.00(i) Tourism - - - - - -(ii) Others @@ 1135.00 - 1135.00 1832.00 - 1832.00
TABLE - DET 8 CAPITAL ACCOUNT- DISBURSEMENTS - ANDHRA PRADESH1997-98 to 2000-2001
- S-42 -
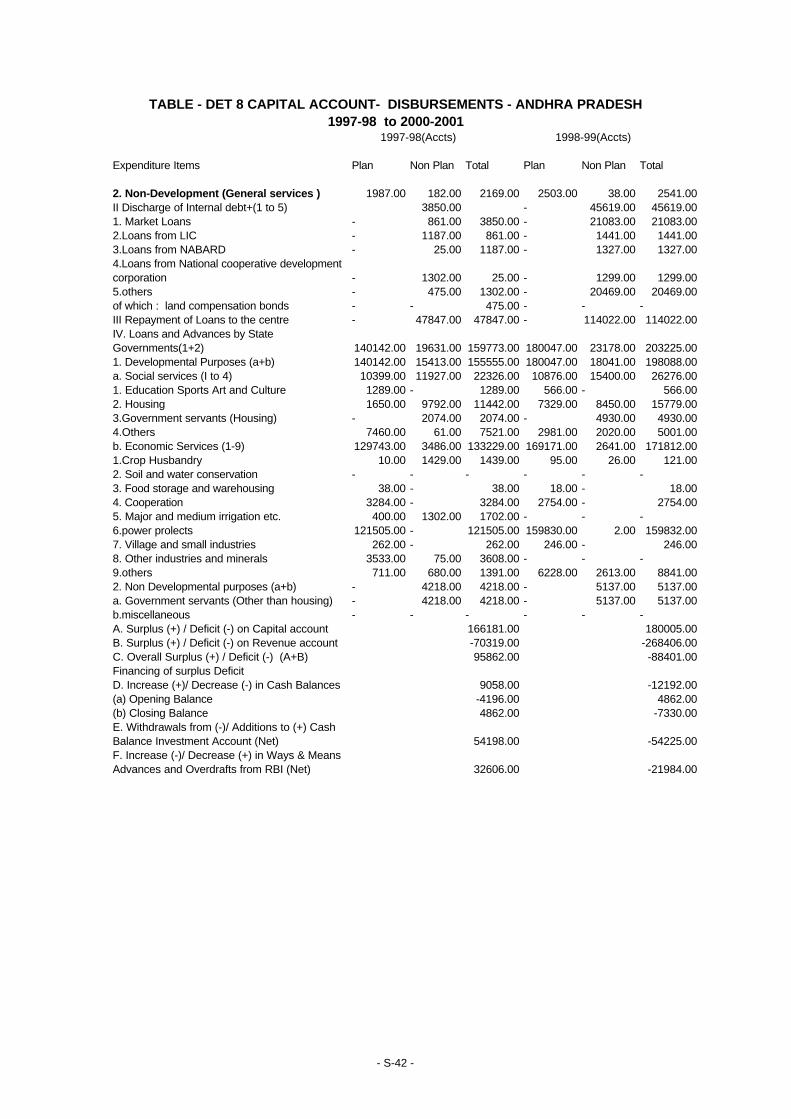
1997-98(Accts) 1998-99(Accts)
Expenditure Items Plan Non Plan Total Plan Non Plan Total
2. Non-Development (General services ) 1987.00 182.00 2169.00 2503.00 38.00 2541.00II Discharge of Internal debt+(1 to 5) 3850.00 - 45619.00 45619.001. Market Loans - 861.00 3850.00 - 21083.00 21083.002.Loans from LIC - 1187.00 861.00 - 1441.00 1441.003.Loans from NABARD - 25.00 1187.00 - 1327.00 1327.004.Loans from National cooperative development corporation - 1302.00 25.00 - 1299.00 1299.005.others - 475.00 1302.00 - 20469.00 20469.00of which : land compensation bonds - - 475.00 - - -III Repayment of Loans to the centre - 47847.00 47847.00 - 114022.00 114022.00IV. Loans and Advances by State Governments(1+2) 140142.00 19631.00 159773.00 180047.00 23178.00 203225.001. Developmental Purposes (a+b) 140142.00 15413.00 155555.00 180047.00 18041.00 198088.00a. Social services (I to 4) 10399.00 11927.00 22326.00 10876.00 15400.00 26276.001. Education Sports Art and Culture 1289.00 - 1289.00 566.00 - 566.002. Housing 1650.00 9792.00 11442.00 7329.00 8450.00 15779.003.Government servants (Housing) - 2074.00 2074.00 - 4930.00 4930.004.Others 7460.00 61.00 7521.00 2981.00 2020.00 5001.00b. Economic Services (1-9) 129743.00 3486.00 133229.00 169171.00 2641.00 171812.001.Crop Husbandry 10.00 1429.00 1439.00 95.00 26.00 121.002. Soil and water conservation - - - - - -3. Food storage and warehousing 38.00 - 38.00 18.00 - 18.004. Cooperation 3284.00 - 3284.00 2754.00 - 2754.005. Major and medium irrigation etc. 400.00 1302.00 1702.00 - - -6.power prolects 121505.00 - 121505.00 159830.00 2.00 159832.007. Village and small industries 262.00 - 262.00 246.00 - 246.008. Other industries and minerals 3533.00 75.00 3608.00 - - -9.others 711.00 680.00 1391.00 6228.00 2613.00 8841.002. Non Developmental purposes (a+b) - 4218.00 4218.00 - 5137.00 5137.00a. Government servants (Other than housing) - 4218.00 4218.00 - 5137.00 5137.00b.miscellaneous - - - - - -A. Surplus (+) / Deficit (-) on Capital account 166181.00 180005.00B. Surplus (+) / Deficit (-) on Revenue account -70319.00 -268406.00C. Overall Surplus (+) / Deficit (-) (A+B) 95862.00 -88401.00Financing of surplus DeficitD. Increase (+)/ Decrease (-) in Cash Balances 9058.00 -12192.00(a) Opening Balance -4196.00 4862.00(b) Closing Balance 4862.00 -7330.00E. Withdrawals from (-)/ Additions to (+) Cash Balance Investment Account (Net) 54198.00 -54225.00F. Increase (-)/ Decrease (+) in Ways & MeansAdvances and Overdrafts from RBI (Net) 32606.00 -21984.00
1997-98 to 2000-2001TABLE - DET 8 CAPITAL ACCOUNT- DISBURSEMENTS - ANDHRA PRADESH
- S-42 -
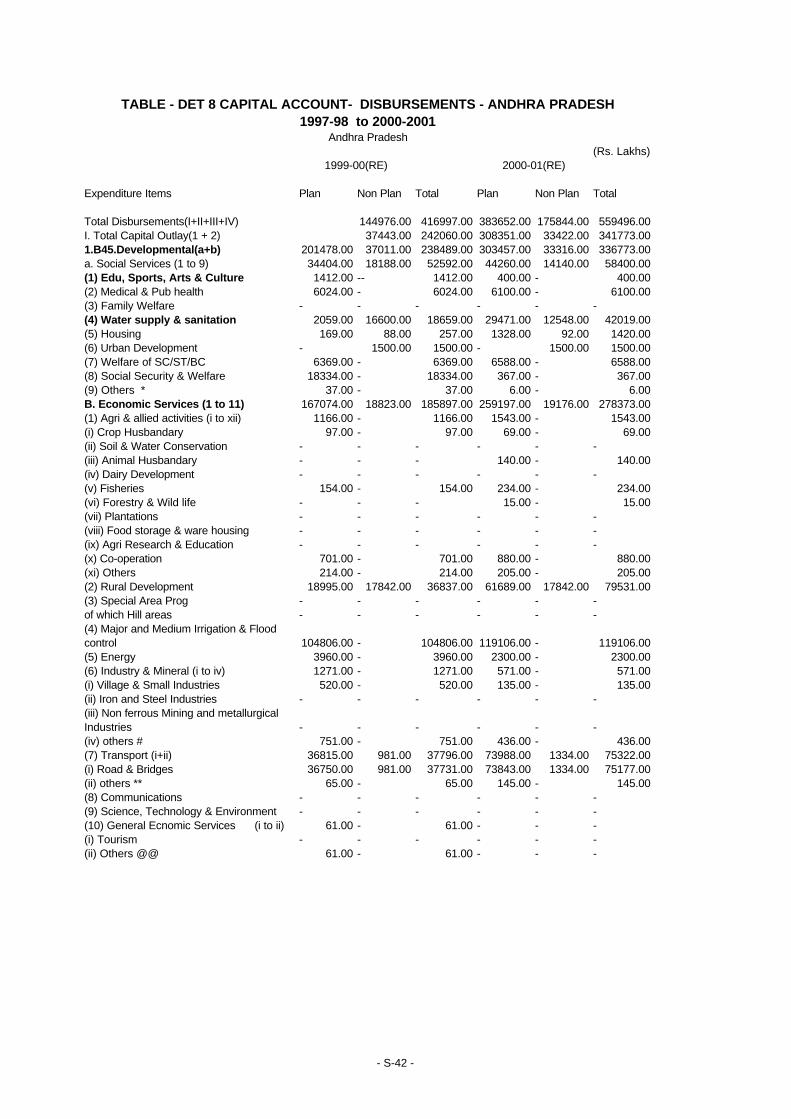
(Rs. Lakhs) 1999-00(RE) 2000-01(RE)
Expenditure Items Plan Non Plan Total Plan Non Plan Total
Total Disbursements(I+II+III+IV) 144976.00 416997.00 383652.00 175844.00 559496.00I. Total Capital Outlay(1 + 2) 37443.00 242060.00 308351.00 33422.00 341773.001.B45.Developmental(a+b) 201478.00 37011.00 238489.00 303457.00 33316.00 336773.00a. Social Services (1 to 9) 34404.00 18188.00 52592.00 44260.00 14140.00 58400.00(1) Edu, Sports, Arts & Culture 1412.00 -- 1412.00 400.00 - 400.00(2) Medical & Pub health 6024.00 - 6024.00 6100.00 - 6100.00(3) Family Welfare - - - - - -(4) Water supply & sanitation 2059.00 16600.00 18659.00 29471.00 12548.00 42019.00(5) Housing 169.00 88.00 257.00 1328.00 92.00 1420.00(6) Urban Development - 1500.00 1500.00 - 1500.00 1500.00(7) Welfare of SC/ST/BC 6369.00 - 6369.00 6588.00 - 6588.00(8) Social Security & Welfare 18334.00 - 18334.00 367.00 - 367.00(9) Others * 37.00 - 37.00 6.00 - 6.00B. Economic Services (1 to 11) 167074.00 18823.00 185897.00 259197.00 19176.00 278373.00(1) Agri & allied activities (i to xii) 1166.00 - 1166.00 1543.00 - 1543.00(i) Crop Husbandary 97.00 - 97.00 69.00 - 69.00(ii) Soil & Water Conservation - - - - - -(iii) Animal Husbandary - - - 140.00 - 140.00(iv) Dairy Development - - - - - -(v) Fisheries 154.00 - 154.00 234.00 - 234.00(vi) Forestry & Wild life - - - 15.00 - 15.00(vii) Plantations - - - - - -(viii) Food storage & ware housing - - - - - -(ix) Agri Research & Education - - - - - -(x) Co-operation 701.00 - 701.00 880.00 - 880.00(xi) Others 214.00 - 214.00 205.00 - 205.00(2) Rural Development 18995.00 17842.00 36837.00 61689.00 17842.00 79531.00(3) Special Area Prog - - - - - -of which Hill areas - - - - - -(4) Major and Medium Irrigation & Flood control 104806.00 - 104806.00 119106.00 - 119106.00(5) Energy 3960.00 - 3960.00 2300.00 - 2300.00(6) Industry & Mineral (i to iv) 1271.00 - 1271.00 571.00 - 571.00(i) Village & Small Industries 520.00 - 520.00 135.00 - 135.00(ii) Iron and Steel Industries - - - - - -(iii) Non ferrous Mining and metallurgical Industries - - - - - -(iv) others # 751.00 - 751.00 436.00 - 436.00(7) Transport (i+ii) 36815.00 981.00 37796.00 73988.00 1334.00 75322.00(i) Road & Bridges 36750.00 981.00 37731.00 73843.00 1334.00 75177.00(ii) others ** 65.00 - 65.00 145.00 - 145.00(8) Communications - - - - - -(9) Science, Technology & Environment - - - - - -(10) General Ecnomic Services (i to ii) 61.00 - 61.00 - - -(i) Tourism - - - - - -(ii) Others @@ 61.00 - 61.00 - - -
TABLE - DET 8 CAPITAL ACCOUNT- DISBURSEMENTS - ANDHRA PRADESH1997-98 to 2000-2001
Andhra Pradesh
- S-42 -
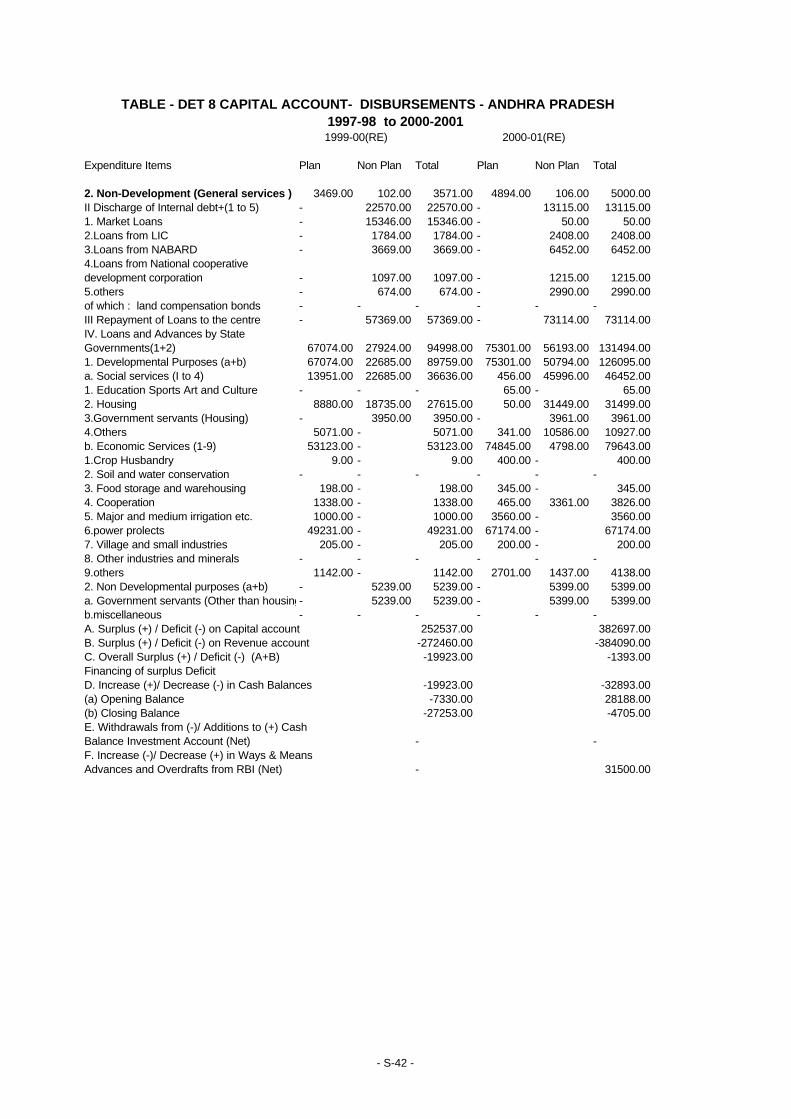
1999-00(RE) 2000-01(RE)
Expenditure Items Plan Non Plan Total Plan Non Plan Total
2. Non-Development (General services ) 3469.00 102.00 3571.00 4894.00 106.00 5000.00II Discharge of Internal debt+(1 to 5) - 22570.00 22570.00 - 13115.00 13115.001. Market Loans - 15346.00 15346.00 - 50.00 50.002.Loans from LIC - 1784.00 1784.00 - 2408.00 2408.003.Loans from NABARD - 3669.00 3669.00 - 6452.00 6452.004.Loans from National cooperative development corporation - 1097.00 1097.00 - 1215.00 1215.005.others - 674.00 674.00 - 2990.00 2990.00of which : land compensation bonds - - - - - -III Repayment of Loans to the centre - 57369.00 57369.00 - 73114.00 73114.00IV. Loans and Advances by State Governments(1+2) 67074.00 27924.00 94998.00 75301.00 56193.00 131494.001. Developmental Purposes (a+b) 67074.00 22685.00 89759.00 75301.00 50794.00 126095.00a. Social services (I to 4) 13951.00 22685.00 36636.00 456.00 45996.00 46452.001. Education Sports Art and Culture - - - 65.00 - 65.002. Housing 8880.00 18735.00 27615.00 50.00 31449.00 31499.003.Government servants (Housing) - 3950.00 3950.00 - 3961.00 3961.004.Others 5071.00 - 5071.00 341.00 10586.00 10927.00b. Economic Services (1-9) 53123.00 - 53123.00 74845.00 4798.00 79643.001.Crop Husbandry 9.00 - 9.00 400.00 - 400.002. Soil and water conservation - - - - - -3. Food storage and warehousing 198.00 - 198.00 345.00 - 345.004. Cooperation 1338.00 - 1338.00 465.00 3361.00 3826.005. Major and medium irrigation etc. 1000.00 - 1000.00 3560.00 - 3560.006.power prolects 49231.00 - 49231.00 67174.00 - 67174.007. Village and small industries 205.00 - 205.00 200.00 - 200.008. Other industries and minerals - - - - - -9.others 1142.00 - 1142.00 2701.00 1437.00 4138.002. Non Developmental purposes (a+b) - 5239.00 5239.00 - 5399.00 5399.00a. Government servants (Other than housing)- 5239.00 5239.00 - 5399.00 5399.00b.miscellaneous - - - - - -A. Surplus (+) / Deficit (-) on Capital account 252537.00 382697.00B. Surplus (+) / Deficit (-) on Revenue account -272460.00 -384090.00C. Overall Surplus (+) / Deficit (-) (A+B) -19923.00 -1393.00Financing of surplus DeficitD. Increase (+)/ Decrease (-) in Cash Balances -19923.00 -32893.00(a) Opening Balance -7330.00 28188.00(b) Closing Balance -27253.00 -4705.00E. Withdrawals from (-)/ Additions to (+) Cash Balance Investment Account (Net) - -F. Increase (-)/ Decrease (+) in Ways & MeansAdvances and Overdrafts from RBI (Net) - 31500.00
1997-98 to 2000-2001TABLE - DET 8 CAPITAL ACCOUNT- DISBURSEMENTS - ANDHRA PRADESH
- S-42 -

(Rs. Lakhs) 1997-98(Accts) 1998-99(Accts)
Expenditure Items Plan Non Plan Total Plan Non Plan Total
Total Disbursements(I+II+III+IV) 109882 61146.00 171028.00 169834.00 74163.00 243997.00I. Total Capital Outlay(1 + 2) 91351.00 29644.00 120995.00 145084.00 29339.00 174423.00
1.B45.Developmental(a+b) 87828.00 29644.00 117472.00 141628.00 29339.00 170697.00a. Social Services (1 to 9) 13754.00 - 13754.00 45289.00 249.00 45538.00(1) Edu, Sports, Arts & Culture 880.00 - 880.00 10776.00 247.00 11023.00(2) Medical & Pub health 6816.00 - 6816.00 8788.00 - 8788.00(3) Family Welfare 1553.00 - 1553.00 2252.00 - 2252.00(4) Water supply & sanitation - - - 14793.00 - 14793.00(5) Housing 911.00 - 911.00 5691.00 - 5691.00(6) Urban Development 36.00 - 36.00 30.00 - 30.00(7) Welfare of SC/ST/BC 3240.00 - 3240.00 2672.00 - 2672.00(8) Social Security & Welfare 246.00 - 216.00 128.00 - 128.00(9) Others * 102.00 - 102.00 159.00 2.00 161.00B. Economic Services (1 to 11) 74074.00 29644.00 103718.00 96339.00 29090.00 125429.00(1) Agri & allied activities (i to xii) 1886.00 - 1886.00 2093.00 - 2093.00(i) Crop Husbandary 107.00 - 107.00 51.00 - 51.00(ii) Soil & Water Conservation - - - - - -(iii) Animal Husbandary 13.00 - 13.00 111.00 - 111.00(iv) Dairy Development - - - - - -(v) Fisheries 517.00 - 517.00 848.00 - 848.00(vi) Forestry & Wild life 189.00 - 189.00 123.00 - 123.00(vii) Plantations - - - - - -(viii) Food storage & ware housing 20.00 - 20.00 15.00 - 15.00(ix) Agri Research & Education 241.00 - 241.00 63.00 - 63.00(x) Co-operation 799.00 - 799.00 882.00 - 882.00(xi) Others - - - - - -(2) Rural Development - - 19.00 - 220.00 220.00(3) Special Area Prog - - - - - -of which Hill areas - - - - - -(4) Major and Medium Irrigation & Flood control 55641.00 29623.00 85264.00 71223.00 28870.00 100103.00(5) Energy - - - - - -(6) Industry & Mineral (i to iv) 3634.00 - 3634.00 6608.00 - 6608.00(i) Village & Small Industries 1056.00 - 1056.00 849.00 - 849.00(ii) Iron and Steel Industries 899.00 - 899.00 929.00 - 929.00(iii) Non ferrous Mining and metallurgical Industries - - - - - -(iv) others # 1679.00 - 1679.00 4830.00 - 4830.00(7) Transport (i+ii) 12989.00 1.00 12990.00 16470.00 - 16470.00(i) Road & Bridges 10622.00 1.00 10623.00 15846.00 - 15846.00(ii) others ** 2367.00 - 2367.00 624.00 - 624.00(8) Communications - - - - - -(9) Science, Technology & Environment - - - - - -(10) General Ecnomic Services (i to ii) -76.00 -75.00 -75.00 -65.00 - -65.00(i) Tourism 8.00 - 8.00 - - -(ii) Others @@ -84.00 1.00 -83.00 -65.00 - -65.00
1997-98 to 2000-2001TABLE - DET 9 CAPITAL ACCOUNT- DISBURSEMENTS - KARNATAKA
- S-43 -
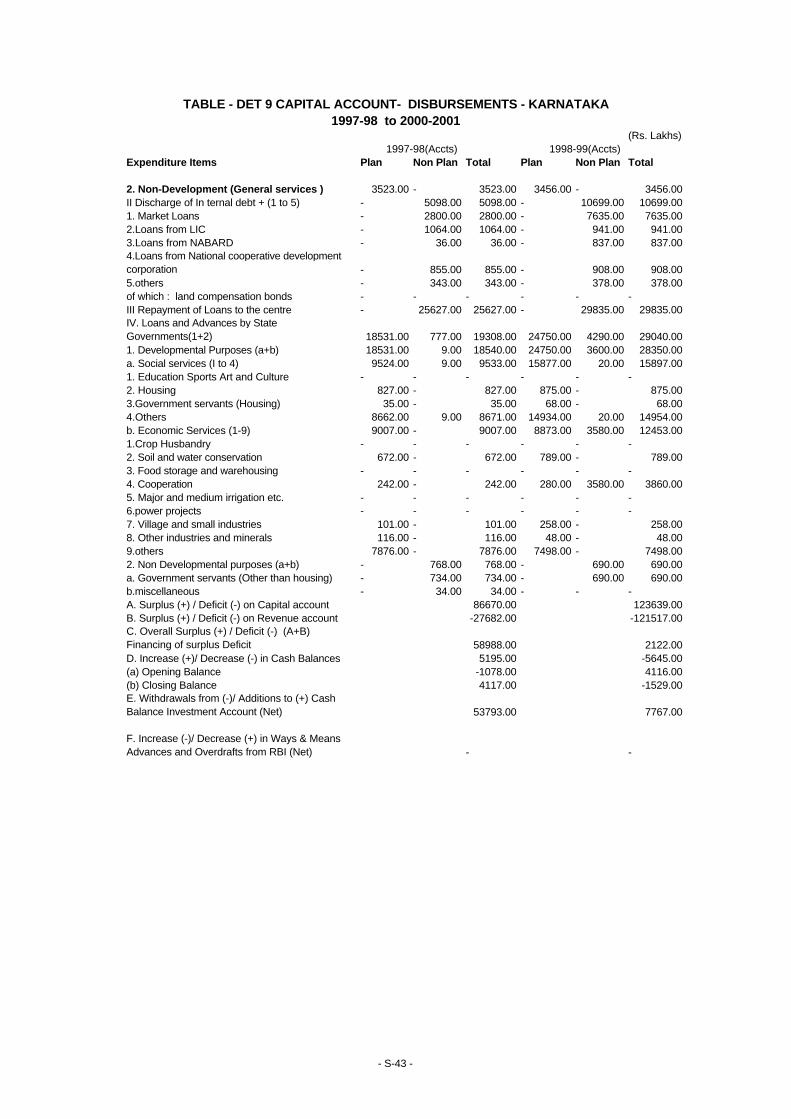
(Rs. Lakhs) 1997-98(Accts) 1998-99(Accts)
Expenditure Items Plan Non Plan Total Plan Non Plan Total 2. Non-Development (General services ) 3523.00 - 3523.00 3456.00 - 3456.00II Discharge of In ternal debt + (1 to 5) - 5098.00 5098.00 - 10699.00 10699.001. Market Loans - 2800.00 2800.00 - 7635.00 7635.002.Loans from LIC - 1064.00 1064.00 - 941.00 941.003.Loans from NABARD - 36.00 36.00 - 837.00 837.004.Loans from National cooperative development corporation - 855.00 855.00 - 908.00 908.005.others - 343.00 343.00 - 378.00 378.00of which : land compensation bonds - - - - - -III Repayment of Loans to the centre - 25627.00 25627.00 - 29835.00 29835.00IV. Loans and Advances by State Governments(1+2) 18531.00 777.00 19308.00 24750.00 4290.00 29040.001. Developmental Purposes (a+b) 18531.00 9.00 18540.00 24750.00 3600.00 28350.00a. Social services (I to 4) 9524.00 9.00 9533.00 15877.00 20.00 15897.001. Education Sports Art and Culture - - - - - -2. Housing 827.00 - 827.00 875.00 - 875.003.Government servants (Housing) 35.00 - 35.00 68.00 - 68.004.Others 8662.00 9.00 8671.00 14934.00 20.00 14954.00b. Economic Services (1-9) 9007.00 - 9007.00 8873.00 3580.00 12453.001.Crop Husbandry - - - - - -2. Soil and water conservation 672.00 - 672.00 789.00 - 789.003. Food storage and warehousing - - - - - -4. Cooperation 242.00 - 242.00 280.00 3580.00 3860.005. Major and medium irrigation etc. - - - - - -6.power projects - - - - - -7. Village and small industries 101.00 - 101.00 258.00 - 258.008. Other industries and minerals 116.00 - 116.00 48.00 - 48.009.others 7876.00 - 7876.00 7498.00 - 7498.002. Non Developmental purposes (a+b) - 768.00 768.00 - 690.00 690.00a. Government servants (Other than housing) - 734.00 734.00 - 690.00 690.00b.miscellaneous - 34.00 34.00 - - -A. Surplus (+) / Deficit (-) on Capital account 86670.00 123639.00B. Surplus (+) / Deficit (-) on Revenue account -27682.00 -121517.00C. Overall Surplus (+) / Deficit (-) (A+B) Financing of surplus Deficit 58988.00 2122.00D. Increase (+)/ Decrease (-) in Cash Balances 5195.00 -5645.00(a) Opening Balance -1078.00 4116.00(b) Closing Balance 4117.00 -1529.00E. Withdrawals from (-)/ Additions to (+) Cash Balance Investment Account (Net) 53793.00 7767.00
F. Increase (-)/ Decrease (+) in Ways & Means Advances and Overdrafts from RBI (Net) - -
TABLE - DET 9 CAPITAL ACCOUNT- DISBURSEMENTS - KARNATAKA1997-98 to 2000-2001
- S-43 -
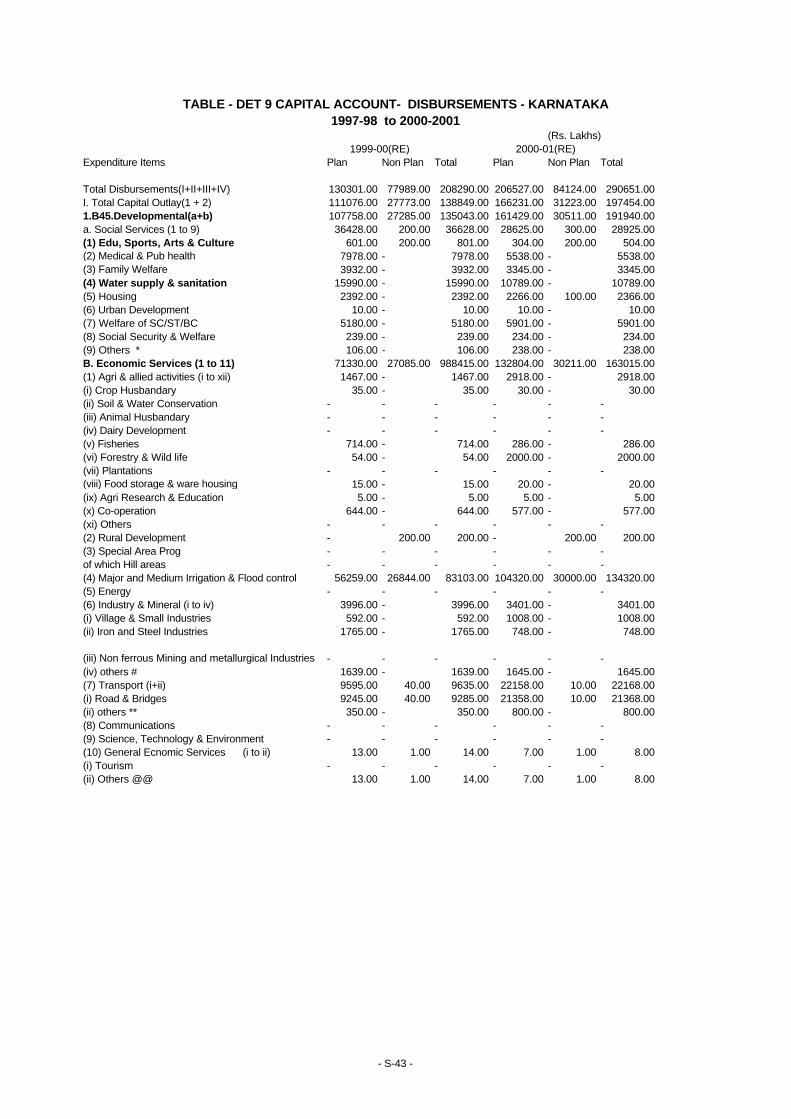
(Rs. Lakhs) 1999-00(RE) 2000-01(RE)
Expenditure Items Plan Non Plan Total Plan Non Plan Total
Total Disbursements(I+II+III+IV) 130301.00 77989.00 208290.00 206527.00 84124.00 290651.00I. Total Capital Outlay(1 + 2) 111076.00 27773.00 138849.00 166231.00 31223.00 197454.001.B45.Developmental(a+b) 107758.00 27285.00 135043.00 161429.00 30511.00 191940.00a. Social Services (1 to 9) 36428.00 200.00 36628.00 28625.00 300.00 28925.00(1) Edu, Sports, Arts & Culture 601.00 200.00 801.00 304.00 200.00 504.00(2) Medical & Pub health 7978.00 - 7978.00 5538.00 - 5538.00(3) Family Welfare 3932.00 - 3932.00 3345.00 - 3345.00(4) Water supply & sanitation 15990.00 - 15990.00 10789.00 - 10789.00(5) Housing 2392.00 - 2392.00 2266.00 100.00 2366.00(6) Urban Development 10.00 - 10.00 10.00 - 10.00(7) Welfare of SC/ST/BC 5180.00 - 5180.00 5901.00 - 5901.00(8) Social Security & Welfare 239.00 - 239.00 234.00 - 234.00(9) Others * 106.00 - 106.00 238.00 - 238.00B. Economic Services (1 to 11) 71330.00 27085.00 988415.00 132804.00 30211.00 163015.00(1) Agri & allied activities (i to xii) 1467.00 - 1467.00 2918.00 - 2918.00(i) Crop Husbandary 35.00 - 35.00 30.00 - 30.00(ii) Soil & Water Conservation - - - - - -(iii) Animal Husbandary - - - - - -(iv) Dairy Development - - - - - -(v) Fisheries 714.00 - 714.00 286.00 - 286.00(vi) Forestry & Wild life 54.00 - 54.00 2000.00 - 2000.00(vii) Plantations - - - - - -(viii) Food storage & ware housing 15.00 - 15.00 20.00 - 20.00(ix) Agri Research & Education 5.00 - 5.00 5.00 - 5.00(x) Co-operation 644.00 - 644.00 577.00 - 577.00(xi) Others - - - - - -(2) Rural Development - 200.00 200.00 - 200.00 200.00(3) Special Area Prog - - - - - -of which Hill areas - - - - - -(4) Major and Medium Irrigation & Flood control 56259.00 26844.00 83103.00 104320.00 30000.00 134320.00(5) Energy - - - - - -(6) Industry & Mineral (i to iv) 3996.00 - 3996.00 3401.00 - 3401.00(i) Village & Small Industries 592.00 - 592.00 1008.00 - 1008.00(ii) Iron and Steel Industries 1765.00 - 1765.00 748.00 - 748.00
(iii) Non ferrous Mining and metallurgical Industries - - - - - -(iv) others # 1639.00 - 1639.00 1645.00 - 1645.00(7) Transport (i+ii) 9595.00 40.00 9635.00 22158.00 10.00 22168.00(i) Road & Bridges 9245.00 40.00 9285.00 21358.00 10.00 21368.00(ii) others ** 350.00 - 350.00 800.00 - 800.00(8) Communications - - - - - -(9) Science, Technology & Environment - - - - - -(10) General Ecnomic Services (i to ii) 13.00 1.00 14.00 7.00 1.00 8.00(i) Tourism - - - - - -(ii) Others @@ 13.00 1.00 14.00 7.00 1.00 8.00
TABLE - DET 9 CAPITAL ACCOUNT- DISBURSEMENTS - KARNATAKA1997-98 to 2000-2001
- S-43 -

(Rs. Lakhs) 1999-00(RE) 2000-01(RE)
Expenditure Items Plan Non Plan Total Plan Non Plan Total
2. Non-Development (General services ) 3318.00 488.00 3806.00 4802.00 712.00 5514.00II Discharge of In ternal debt + (1 to 5) - 14723.00 14723.00 - 9158.00 9158.001. Market Loans - 7877.00 7877.00 - 40.00 40.002.Loans from LIC - 1775.00 1775.00 - 1775.00 1775.003.Loans from NABARD - 3074.00 3074.00 - 5236.00 5236.004.Loans from National cooperative development corporation - 1535.00 1535.00 - 1650.00 1650.005.others - 462.00 462.00 - 457.00 457.00of which : land compensation bonds - - - - - -III Repayment of Loans to the centre - 34376.00 34376.00 - 42086.00 42086.00
IV. Loans and Advances by State Governments(1+2) 19225.00 1117.00 20342.00 40296.00 1657.00 41953.001. Developmental Purposes (a+b) 19225.00 5.00 19230.00 40296.00 495.00 40791.00a. Social services (I to 4) 14939.00 5.00 14944.00 37664.00 10.00 37674.001. Education Sports Art and Culture - - - - - -2. Housing 1331.00 - 1331.00 555.00 - 555.003.Government servants (Housing) 302.00 - 302.00 300.00 - 300.004.Others 13306.00 5.00 13311.00 36809.00 10.00 36819.00b. Economic Services (1-9) 4286.00 - 4286.00 2632.00 485.00 3117.001.Crop Husbandry - - - - - -2. Soil and water conservation 1183.00 - 1183.00 1174.00 - 1174.003. Food storage and warehousing - - - 228.00 - -4. Cooperation 329.00 - 329.00 - - 228.005. Major and medium irrigation etc. - - - - - -6.power projects - - - 228.00 - -7. Village and small industries 92.00 - 92.00 50.00 484.00 228.008. Other industries and minerals 525.00 - 525.00 952.00 1 534.009.others 2157.00 - 2157.00 - 1162.00 953.002. Non Developmental purposes (a+b) - 1112.00 1112.00 - 1062.00 1162.00a. Government servants (Other than housing) - 1062.00 1062.00 - 100.00 1062.00b.miscellaneous - 50.00 50.00 100.00A. Surplus (+) / Deficit (-) on Capital account 133409.00 154600.00B. Surplus (+) / Deficit (-) on Revenue account -157320.00 -194230.00C. Overall Surplus (+) / Deficit (-) (A+B) Financing of surplus Deficit -23911.00 -39630.00D. Increase (+)/ Decrease (-) in Cash Balances -23911.00 -39630.00(a) Opening Balance -1529.00 -25440.00(b) Closing Balance -25440.00 -65070.00E. Withdrawals from (-)/ Additions to (+) Cash Balance Investment Account (Net) - -
F. Increase (-)/ Decrease (+) in Ways & Means Advances and Overdrafts from RBI (Net) - -
TABLE - DET 9 CAPITAL ACCOUNT- DISBURSEMENTS - KARNATAKA1997-98 to 2000-2001
- S-43 -
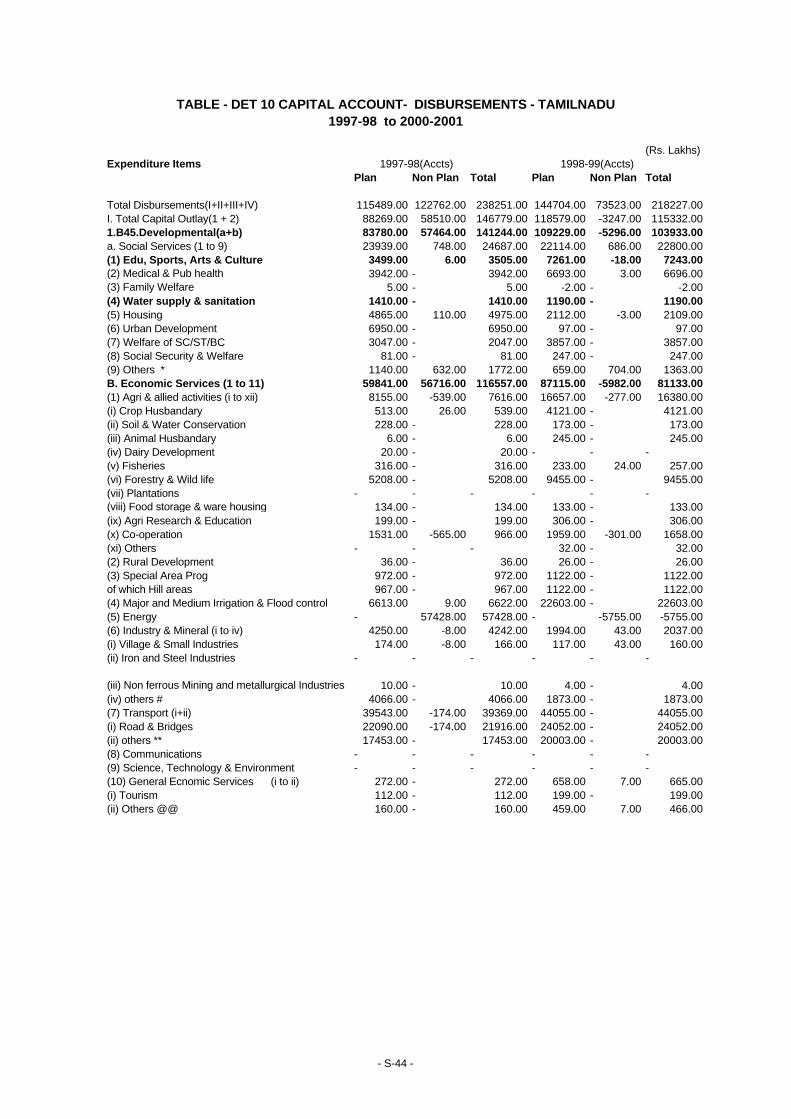
(Rs. Lakhs)Expenditure Items 1997-98(Accts) 1998-99(Accts)
Plan Non Plan Total Plan Non Plan Total
Total Disbursements(I+II+III+IV) 115489.00 122762.00 238251.00 144704.00 73523.00 218227.00I. Total Capital Outlay(1 + 2) 88269.00 58510.00 146779.00 118579.00 -3247.00 115332.001.B45.Developmental(a+b) 83780.00 57464.00 141244.00 109229.00 -5296.00 103933.00a. Social Services (1 to 9) 23939.00 748.00 24687.00 22114.00 686.00 22800.00(1) Edu, Sports, Arts & Culture 3499.00 6.00 3505.00 7261.00 -18.00 7243.00(2) Medical & Pub health 3942.00 - 3942.00 6693.00 3.00 6696.00(3) Family Welfare 5.00 - 5.00 -2.00 - -2.00(4) Water supply & sanitation 1410.00 - 1410.00 1190.00 - 1190.00(5) Housing 4865.00 110.00 4975.00 2112.00 -3.00 2109.00(6) Urban Development 6950.00 - 6950.00 97.00 - 97.00(7) Welfare of SC/ST/BC 3047.00 - 2047.00 3857.00 - 3857.00(8) Social Security & Welfare 81.00 - 81.00 247.00 - 247.00(9) Others * 1140.00 632.00 1772.00 659.00 704.00 1363.00B. Economic Services (1 to 11) 59841.00 56716.00 116557.00 87115.00 -5982.00 81133.00(1) Agri & allied activities (i to xii) 8155.00 -539.00 7616.00 16657.00 -277.00 16380.00(i) Crop Husbandary 513.00 26.00 539.00 4121.00 - 4121.00(ii) Soil & Water Conservation 228.00 - 228.00 173.00 - 173.00(iii) Animal Husbandary 6.00 - 6.00 245.00 - 245.00(iv) Dairy Development 20.00 - 20.00 - - -(v) Fisheries 316.00 - 316.00 233.00 24.00 257.00(vi) Forestry & Wild life 5208.00 - 5208.00 9455.00 - 9455.00(vii) Plantations - - - - - -(viii) Food storage & ware housing 134.00 - 134.00 133.00 - 133.00(ix) Agri Research & Education 199.00 - 199.00 306.00 - 306.00(x) Co-operation 1531.00 -565.00 966.00 1959.00 -301.00 1658.00(xi) Others - - - 32.00 - 32.00(2) Rural Development 36.00 - 36.00 26.00 - 26.00(3) Special Area Prog 972.00 - 972.00 1122.00 - 1122.00of which Hill areas 967.00 - 967.00 1122.00 - 1122.00(4) Major and Medium Irrigation & Flood control 6613.00 9.00 6622.00 22603.00 - 22603.00(5) Energy - 57428.00 57428.00 - -5755.00 -5755.00(6) Industry & Mineral (i to iv) 4250.00 -8.00 4242.00 1994.00 43.00 2037.00(i) Village & Small Industries 174.00 -8.00 166.00 117.00 43.00 160.00(ii) Iron and Steel Industries - - - - - -
(iii) Non ferrous Mining and metallurgical Industries 10.00 - 10.00 4.00 - 4.00(iv) others # 4066.00 - 4066.00 1873.00 - 1873.00(7) Transport (i+ii) 39543.00 -174.00 39369.00 44055.00 - 44055.00(i) Road & Bridges 22090.00 -174.00 21916.00 24052.00 - 24052.00(ii) others ** 17453.00 - 17453.00 20003.00 - 20003.00(8) Communications - - - - - -(9) Science, Technology & Environment - - - - - -(10) General Ecnomic Services (i to ii) 272.00 - 272.00 658.00 7.00 665.00(i) Tourism 112.00 - 112.00 199.00 - 199.00(ii) Others @@ 160.00 - 160.00 459.00 7.00 466.00
TABLE - DET 10 CAPITAL ACCOUNT- DISBURSEMENTS - TAMILNADU1997-98 to 2000-2001
- S-44 -
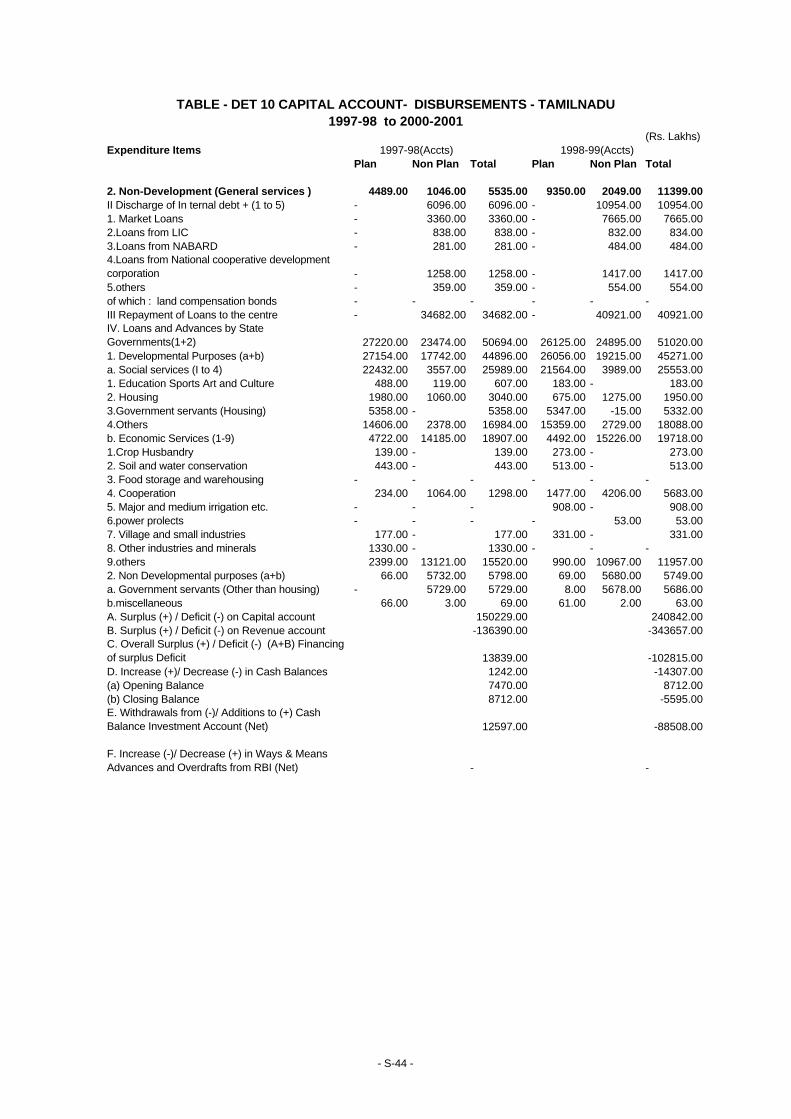
(Rs. Lakhs)Expenditure Items 1997-98(Accts) 1998-99(Accts)
Plan Non Plan Total Plan Non Plan Total
2. Non-Development (General services ) 4489.00 1046.00 5535.00 9350.00 2049.00 11399.00II Discharge of In ternal debt + (1 to 5) - 6096.00 6096.00 - 10954.00 10954.001. Market Loans - 3360.00 3360.00 - 7665.00 7665.002.Loans from LIC - 838.00 838.00 - 832.00 834.003.Loans from NABARD - 281.00 281.00 - 484.00 484.004.Loans from National cooperative development corporation - 1258.00 1258.00 - 1417.00 1417.005.others - 359.00 359.00 - 554.00 554.00of which : land compensation bonds - - - - - -III Repayment of Loans to the centre - 34682.00 34682.00 - 40921.00 40921.00IV. Loans and Advances by State Governments(1+2) 27220.00 23474.00 50694.00 26125.00 24895.00 51020.001. Developmental Purposes (a+b) 27154.00 17742.00 44896.00 26056.00 19215.00 45271.00a. Social services (I to 4) 22432.00 3557.00 25989.00 21564.00 3989.00 25553.001. Education Sports Art and Culture 488.00 119.00 607.00 183.00 - 183.002. Housing 1980.00 1060.00 3040.00 675.00 1275.00 1950.003.Government servants (Housing) 5358.00 - 5358.00 5347.00 -15.00 5332.004.Others 14606.00 2378.00 16984.00 15359.00 2729.00 18088.00b. Economic Services (1-9) 4722.00 14185.00 18907.00 4492.00 15226.00 19718.001.Crop Husbandry 139.00 - 139.00 273.00 - 273.002. Soil and water conservation 443.00 - 443.00 513.00 - 513.003. Food storage and warehousing - - - - - -4. Cooperation 234.00 1064.00 1298.00 1477.00 4206.00 5683.005. Major and medium irrigation etc. - - - 908.00 - 908.006.power prolects - - - - 53.00 53.007. Village and small industries 177.00 - 177.00 331.00 - 331.008. Other industries and minerals 1330.00 - 1330.00 - - -9.others 2399.00 13121.00 15520.00 990.00 10967.00 11957.002. Non Developmental purposes (a+b) 66.00 5732.00 5798.00 69.00 5680.00 5749.00a. Government servants (Other than housing) - 5729.00 5729.00 8.00 5678.00 5686.00b.miscellaneous 66.00 3.00 69.00 61.00 2.00 63.00A. Surplus (+) / Deficit (-) on Capital account 150229.00 240842.00B. Surplus (+) / Deficit (-) on Revenue account -136390.00 -343657.00C. Overall Surplus (+) / Deficit (-) (A+B) Financing of surplus Deficit 13839.00 -102815.00D. Increase (+)/ Decrease (-) in Cash Balances 1242.00 -14307.00(a) Opening Balance 7470.00 8712.00(b) Closing Balance 8712.00 -5595.00E. Withdrawals from (-)/ Additions to (+) Cash Balance Investment Account (Net) 12597.00 -88508.00
F. Increase (-)/ Decrease (+) in Ways & Means Advances and Overdrafts from RBI (Net) - -
1997-98 to 2000-2001TABLE - DET 10 CAPITAL ACCOUNT- DISBURSEMENTS - TAMILNADU
- S-44 -
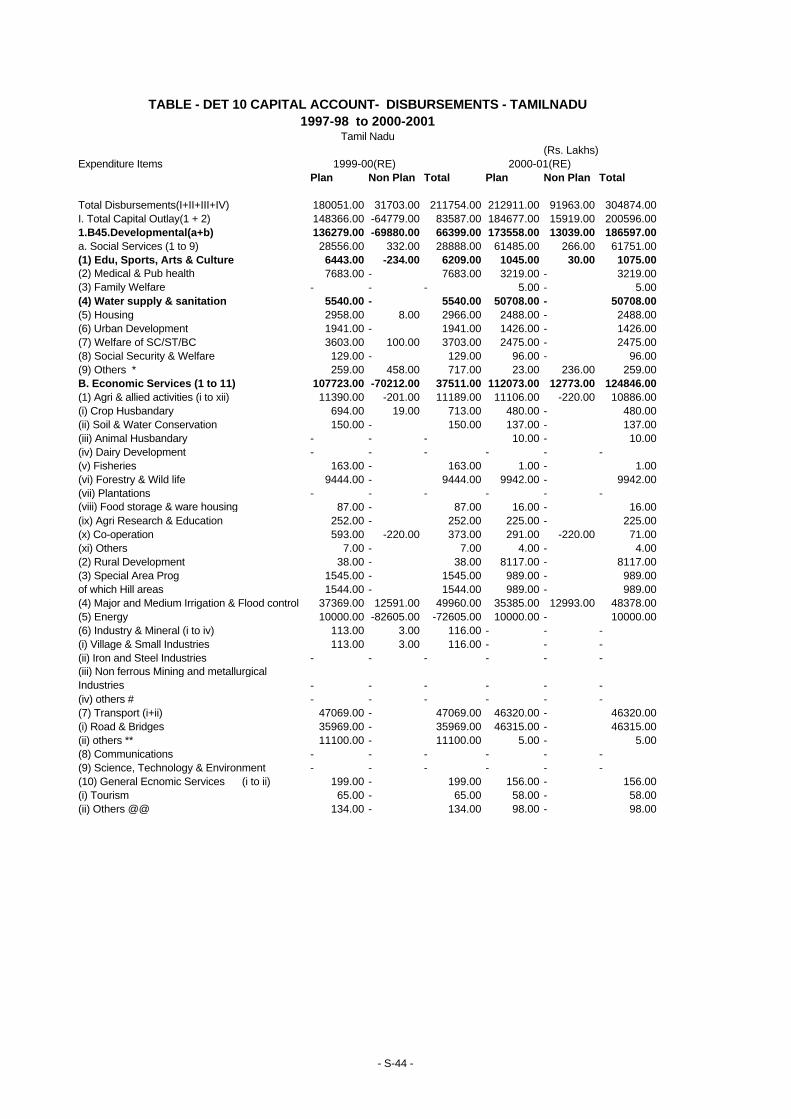
(Rs. Lakhs)Expenditure Items 1999-00(RE) 2000-01(RE)
Plan Non Plan Total Plan Non Plan Total
Total Disbursements(I+II+III+IV) 180051.00 31703.00 211754.00 212911.00 91963.00 304874.00I. Total Capital Outlay(1 + 2) 148366.00 -64779.00 83587.00 184677.00 15919.00 200596.001.B45.Developmental(a+b) 136279.00 -69880.00 66399.00 173558.00 13039.00 186597.00a. Social Services (1 to 9) 28556.00 332.00 28888.00 61485.00 266.00 61751.00(1) Edu, Sports, Arts & Culture 6443.00 -234.00 6209.00 1045.00 30.00 1075.00(2) Medical & Pub health 7683.00 - 7683.00 3219.00 - 3219.00(3) Family Welfare - - - 5.00 - 5.00(4) Water supply & sanitation 5540.00 - 5540.00 50708.00 - 50708.00(5) Housing 2958.00 8.00 2966.00 2488.00 - 2488.00(6) Urban Development 1941.00 - 1941.00 1426.00 - 1426.00(7) Welfare of SC/ST/BC 3603.00 100.00 3703.00 2475.00 - 2475.00(8) Social Security & Welfare 129.00 - 129.00 96.00 - 96.00(9) Others * 259.00 458.00 717.00 23.00 236.00 259.00B. Economic Services (1 to 11) 107723.00 -70212.00 37511.00 112073.00 12773.00 124846.00(1) Agri & allied activities (i to xii) 11390.00 -201.00 11189.00 11106.00 -220.00 10886.00(i) Crop Husbandary 694.00 19.00 713.00 480.00 - 480.00(ii) Soil & Water Conservation 150.00 - 150.00 137.00 - 137.00(iii) Animal Husbandary - - - 10.00 - 10.00(iv) Dairy Development - - - - - -(v) Fisheries 163.00 - 163.00 1.00 - 1.00(vi) Forestry & Wild life 9444.00 - 9444.00 9942.00 - 9942.00(vii) Plantations - - - - - -(viii) Food storage & ware housing 87.00 - 87.00 16.00 - 16.00(ix) Agri Research & Education 252.00 - 252.00 225.00 - 225.00(x) Co-operation 593.00 -220.00 373.00 291.00 -220.00 71.00(xi) Others 7.00 - 7.00 4.00 - 4.00(2) Rural Development 38.00 - 38.00 8117.00 - 8117.00(3) Special Area Prog 1545.00 - 1545.00 989.00 - 989.00of which Hill areas 1544.00 - 1544.00 989.00 - 989.00(4) Major and Medium Irrigation & Flood control 37369.00 12591.00 49960.00 35385.00 12993.00 48378.00(5) Energy 10000.00 -82605.00 -72605.00 10000.00 - 10000.00(6) Industry & Mineral (i to iv) 113.00 3.00 116.00 - - -(i) Village & Small Industries 113.00 3.00 116.00 - - -(ii) Iron and Steel Industries - - - - - -(iii) Non ferrous Mining and metallurgical Industries - - - - - -(iv) others # - - - - - -(7) Transport (i+ii) 47069.00 - 47069.00 46320.00 - 46320.00(i) Road & Bridges 35969.00 - 35969.00 46315.00 - 46315.00(ii) others ** 11100.00 - 11100.00 5.00 - 5.00(8) Communications - - - - - -(9) Science, Technology & Environment - - - - - -(10) General Ecnomic Services (i to ii) 199.00 - 199.00 156.00 - 156.00(i) Tourism 65.00 - 65.00 58.00 - 58.00(ii) Others @@ 134.00 - 134.00 98.00 - 98.00
TABLE - DET 10 CAPITAL ACCOUNT- DISBURSEMENTS - TAMILNADU1997-98 to 2000-2001
Tamil Nadu
- S-44 -
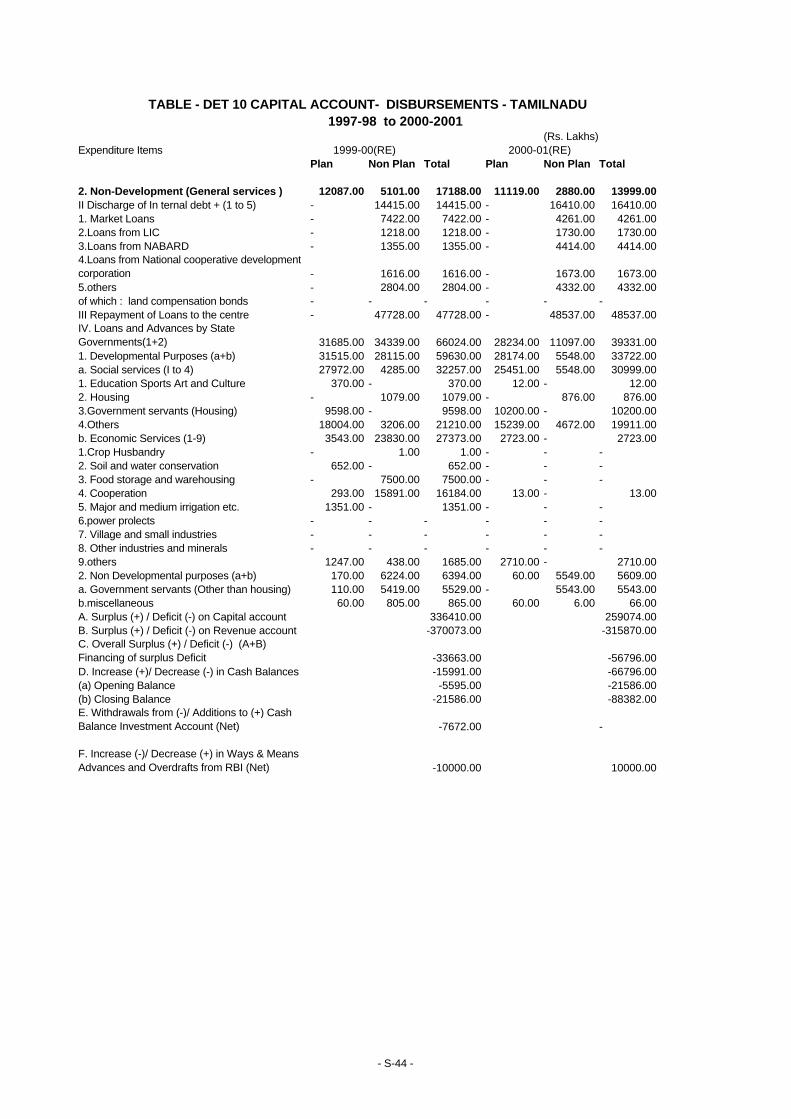
(Rs. Lakhs)Expenditure Items 1999-00(RE) 2000-01(RE)
Plan Non Plan Total Plan Non Plan Total
2. Non-Development (General services ) 12087.00 5101.00 17188.00 11119.00 2880.00 13999.00II Discharge of In ternal debt + (1 to 5) - 14415.00 14415.00 - 16410.00 16410.001. Market Loans - 7422.00 7422.00 - 4261.00 4261.002.Loans from LIC - 1218.00 1218.00 - 1730.00 1730.003.Loans from NABARD - 1355.00 1355.00 - 4414.00 4414.004.Loans from National cooperative development corporation - 1616.00 1616.00 - 1673.00 1673.005.others - 2804.00 2804.00 - 4332.00 4332.00of which : land compensation bonds - - - - - -III Repayment of Loans to the centre - 47728.00 47728.00 - 48537.00 48537.00IV. Loans and Advances by State Governments(1+2) 31685.00 34339.00 66024.00 28234.00 11097.00 39331.001. Developmental Purposes (a+b) 31515.00 28115.00 59630.00 28174.00 5548.00 33722.00a. Social services (I to 4) 27972.00 4285.00 32257.00 25451.00 5548.00 30999.001. Education Sports Art and Culture 370.00 - 370.00 12.00 - 12.002. Housing - 1079.00 1079.00 - 876.00 876.003.Government servants (Housing) 9598.00 - 9598.00 10200.00 - 10200.004.Others 18004.00 3206.00 21210.00 15239.00 4672.00 19911.00b. Economic Services (1-9) 3543.00 23830.00 27373.00 2723.00 - 2723.001.Crop Husbandry - 1.00 1.00 - - -2. Soil and water conservation 652.00 - 652.00 - - -3. Food storage and warehousing - 7500.00 7500.00 - - -4. Cooperation 293.00 15891.00 16184.00 13.00 - 13.005. Major and medium irrigation etc. 1351.00 - 1351.00 - - -6.power prolects - - - - - -7. Village and small industries - - - - - -8. Other industries and minerals - - - - - -9.others 1247.00 438.00 1685.00 2710.00 - 2710.002. Non Developmental purposes (a+b) 170.00 6224.00 6394.00 60.00 5549.00 5609.00a. Government servants (Other than housing) 110.00 5419.00 5529.00 - 5543.00 5543.00b.miscellaneous 60.00 805.00 865.00 60.00 6.00 66.00A. Surplus (+) / Deficit (-) on Capital account 336410.00 259074.00B. Surplus (+) / Deficit (-) on Revenue account -370073.00 -315870.00C. Overall Surplus (+) / Deficit (-) (A+B) Financing of surplus Deficit -33663.00 -56796.00D. Increase (+)/ Decrease (-) in Cash Balances -15991.00 -66796.00(a) Opening Balance -5595.00 -21586.00(b) Closing Balance -21586.00 -88382.00E. Withdrawals from (-)/ Additions to (+) Cash Balance Investment Account (Net) -7672.00 -
F. Increase (-)/ Decrease (+) in Ways & Means Advances and Overdrafts from RBI (Net) -10000.00 10000.00
TABLE - DET 10 CAPITAL ACCOUNT- DISBURSEMENTS - TAMILNADU1997-98 to 2000-2001
- S-44 -
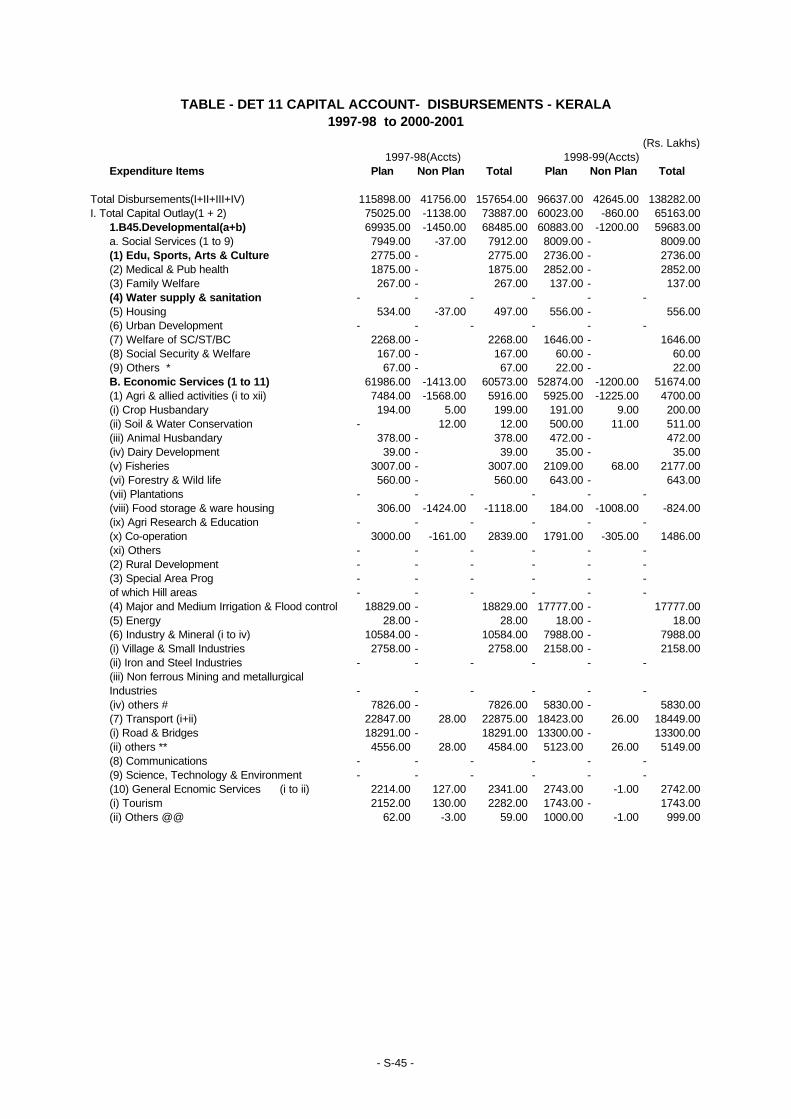
(Rs. Lakhs) 1997-98(Accts) 1998-99(Accts)
Expenditure Items Plan Non Plan Total Plan Non Plan Total
Total Disbursements(I+II+III+IV) 115898.00 41756.00 157654.00 96637.00 42645.00 138282.00I. Total Capital Outlay(1 + 2) 75025.00 -1138.00 73887.00 60023.00 -860.00 65163.00
1.B45.Developmental(a+b) 69935.00 -1450.00 68485.00 60883.00 -1200.00 59683.00a. Social Services (1 to 9) 7949.00 -37.00 7912.00 8009.00 - 8009.00(1) Edu, Sports, Arts & Culture 2775.00 - 2775.00 2736.00 - 2736.00(2) Medical & Pub health 1875.00 - 1875.00 2852.00 - 2852.00(3) Family Welfare 267.00 - 267.00 137.00 - 137.00(4) Water supply & sanitation - - - - - -(5) Housing 534.00 -37.00 497.00 556.00 - 556.00(6) Urban Development - - - - - -(7) Welfare of SC/ST/BC 2268.00 - 2268.00 1646.00 - 1646.00(8) Social Security & Welfare 167.00 - 167.00 60.00 - 60.00(9) Others * 67.00 - 67.00 22.00 - 22.00B. Economic Services (1 to 11) 61986.00 -1413.00 60573.00 52874.00 -1200.00 51674.00(1) Agri & allied activities (i to xii) 7484.00 -1568.00 5916.00 5925.00 -1225.00 4700.00(i) Crop Husbandary 194.00 5.00 199.00 191.00 9.00 200.00(ii) Soil & Water Conservation - 12.00 12.00 500.00 11.00 511.00(iii) Animal Husbandary 378.00 - 378.00 472.00 - 472.00(iv) Dairy Development 39.00 - 39.00 35.00 - 35.00(v) Fisheries 3007.00 - 3007.00 2109.00 68.00 2177.00(vi) Forestry & Wild life 560.00 - 560.00 643.00 - 643.00(vii) Plantations - - - - - -(viii) Food storage & ware housing 306.00 -1424.00 -1118.00 184.00 -1008.00 -824.00(ix) Agri Research & Education - - - - - -(x) Co-operation 3000.00 -161.00 2839.00 1791.00 -305.00 1486.00(xi) Others - - - - - -(2) Rural Development - - - - - -(3) Special Area Prog - - - - - -of which Hill areas - - - - - -(4) Major and Medium Irrigation & Flood control 18829.00 - 18829.00 17777.00 - 17777.00(5) Energy 28.00 - 28.00 18.00 - 18.00(6) Industry & Mineral (i to iv) 10584.00 - 10584.00 7988.00 - 7988.00(i) Village & Small Industries 2758.00 - 2758.00 2158.00 - 2158.00(ii) Iron and Steel Industries - - - - - -(iii) Non ferrous Mining and metallurgical Industries - - - - - -(iv) others # 7826.00 - 7826.00 5830.00 - 5830.00(7) Transport (i+ii) 22847.00 28.00 22875.00 18423.00 26.00 18449.00(i) Road & Bridges 18291.00 - 18291.00 13300.00 - 13300.00(ii) others ** 4556.00 28.00 4584.00 5123.00 26.00 5149.00(8) Communications - - - - - -(9) Science, Technology & Environment - - - - - -(10) General Ecnomic Services (i to ii) 2214.00 127.00 2341.00 2743.00 -1.00 2742.00(i) Tourism 2152.00 130.00 2282.00 1743.00 - 1743.00(ii) Others @@ 62.00 -3.00 59.00 1000.00 -1.00 999.00
1997-98 to 2000-2001TABLE - DET 11 CAPITAL ACCOUNT- DISBURSEMENTS - KERALA
- S-45 -
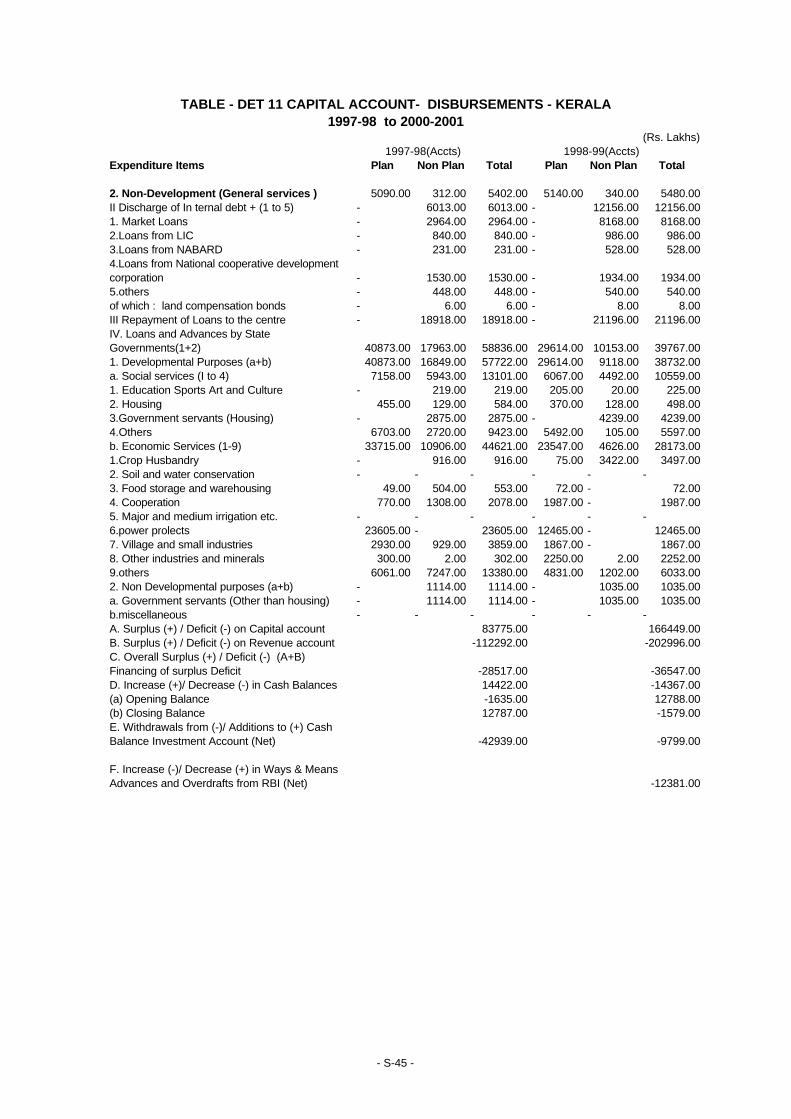
(Rs. Lakhs) 1997-98(Accts) 1998-99(Accts)
Expenditure Items Plan Non Plan Total Plan Non Plan Total
2. Non-Development (General services ) 5090.00 312.00 5402.00 5140.00 340.00 5480.00II Discharge of In ternal debt + (1 to 5) - 6013.00 6013.00 - 12156.00 12156.001. Market Loans - 2964.00 2964.00 - 8168.00 8168.002.Loans from LIC - 840.00 840.00 - 986.00 986.003.Loans from NABARD - 231.00 231.00 - 528.00 528.004.Loans from National cooperative development corporation - 1530.00 1530.00 - 1934.00 1934.005.others - 448.00 448.00 - 540.00 540.00of which : land compensation bonds - 6.00 6.00 - 8.00 8.00III Repayment of Loans to the centre - 18918.00 18918.00 - 21196.00 21196.00IV. Loans and Advances by State Governments(1+2) 40873.00 17963.00 58836.00 29614.00 10153.00 39767.001. Developmental Purposes (a+b) 40873.00 16849.00 57722.00 29614.00 9118.00 38732.00a. Social services (I to 4) 7158.00 5943.00 13101.00 6067.00 4492.00 10559.001. Education Sports Art and Culture - 219.00 219.00 205.00 20.00 225.002. Housing 455.00 129.00 584.00 370.00 128.00 498.003.Government servants (Housing) - 2875.00 2875.00 - 4239.00 4239.004.Others 6703.00 2720.00 9423.00 5492.00 105.00 5597.00b. Economic Services (1-9) 33715.00 10906.00 44621.00 23547.00 4626.00 28173.001.Crop Husbandry - 916.00 916.00 75.00 3422.00 3497.002. Soil and water conservation - - - - - -3. Food storage and warehousing 49.00 504.00 553.00 72.00 - 72.004. Cooperation 770.00 1308.00 2078.00 1987.00 - 1987.005. Major and medium irrigation etc. - - - - - -6.power prolects 23605.00 - 23605.00 12465.00 - 12465.007. Village and small industries 2930.00 929.00 3859.00 1867.00 - 1867.008. Other industries and minerals 300.00 2.00 302.00 2250.00 2.00 2252.009.others 6061.00 7247.00 13380.00 4831.00 1202.00 6033.002. Non Developmental purposes (a+b) - 1114.00 1114.00 - 1035.00 1035.00a. Government servants (Other than housing) - 1114.00 1114.00 - 1035.00 1035.00b.miscellaneous - - - - - -A. Surplus (+) / Deficit (-) on Capital account 83775.00 166449.00B. Surplus (+) / Deficit (-) on Revenue account -112292.00 -202996.00C. Overall Surplus (+) / Deficit (-) (A+B) Financing of surplus Deficit -28517.00 -36547.00D. Increase (+)/ Decrease (-) in Cash Balances 14422.00 -14367.00(a) Opening Balance -1635.00 12788.00(b) Closing Balance 12787.00 -1579.00E. Withdrawals from (-)/ Additions to (+) Cash Balance Investment Account (Net) -42939.00 -9799.00
F. Increase (-)/ Decrease (+) in Ways & Means Advances and Overdrafts from RBI (Net) -12381.00
1997-98 to 2000-2001TABLE - DET 11 CAPITAL ACCOUNT- DISBURSEMENTS - KERALA
- S-45 -
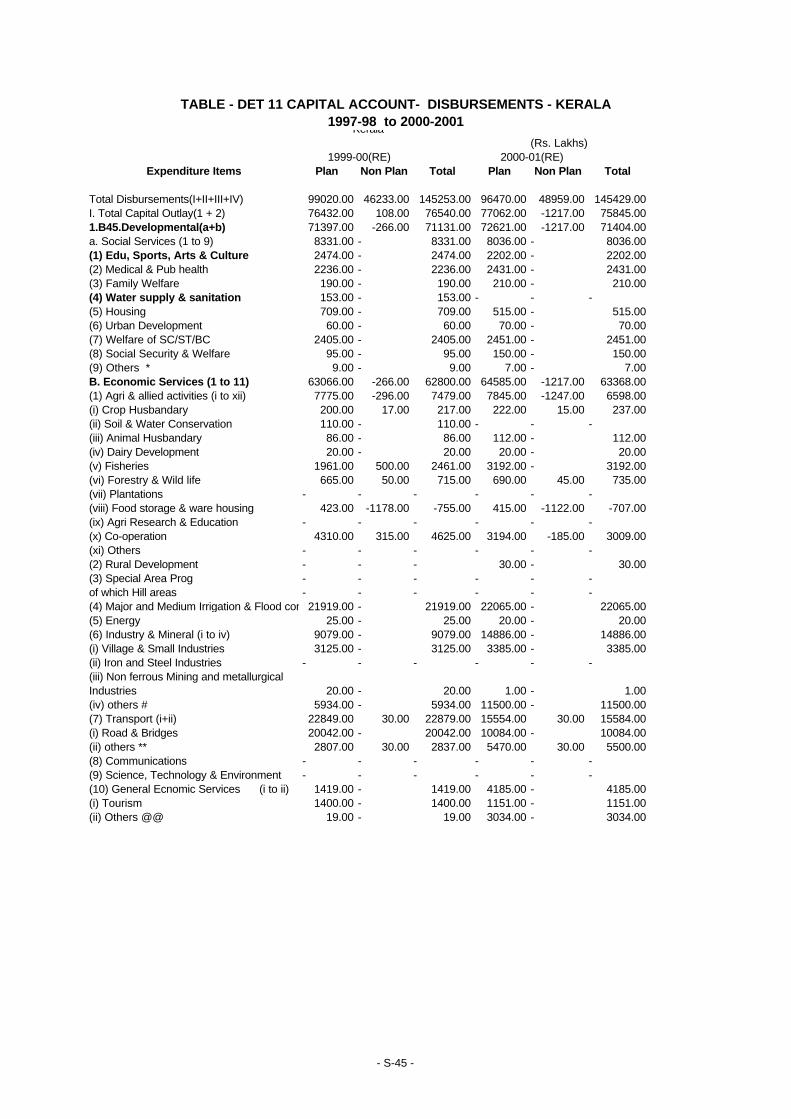
(Rs. Lakhs) 1999-00(RE) 2000-01(RE)
Expenditure Items Plan Non Plan Total Plan Non Plan Total
Total Disbursements(I+II+III+IV) 99020.00 46233.00 145253.00 96470.00 48959.00 145429.00I. Total Capital Outlay(1 + 2) 76432.00 108.00 76540.00 77062.00 -1217.00 75845.001.B45.Developmental(a+b) 71397.00 -266.00 71131.00 72621.00 -1217.00 71404.00a. Social Services (1 to 9) 8331.00 - 8331.00 8036.00 - 8036.00(1) Edu, Sports, Arts & Culture 2474.00 - 2474.00 2202.00 - 2202.00(2) Medical & Pub health 2236.00 - 2236.00 2431.00 - 2431.00(3) Family Welfare 190.00 - 190.00 210.00 - 210.00(4) Water supply & sanitation 153.00 - 153.00 - - -(5) Housing 709.00 - 709.00 515.00 - 515.00(6) Urban Development 60.00 - 60.00 70.00 - 70.00(7) Welfare of SC/ST/BC 2405.00 - 2405.00 2451.00 - 2451.00(8) Social Security & Welfare 95.00 - 95.00 150.00 - 150.00(9) Others * 9.00 - 9.00 7.00 - 7.00B. Economic Services (1 to 11) 63066.00 -266.00 62800.00 64585.00 -1217.00 63368.00(1) Agri & allied activities (i to xii) 7775.00 -296.00 7479.00 7845.00 -1247.00 6598.00(i) Crop Husbandary 200.00 17.00 217.00 222.00 15.00 237.00(ii) Soil & Water Conservation 110.00 - 110.00 - - -(iii) Animal Husbandary 86.00 - 86.00 112.00 - 112.00(iv) Dairy Development 20.00 - 20.00 20.00 - 20.00(v) Fisheries 1961.00 500.00 2461.00 3192.00 - 3192.00(vi) Forestry & Wild life 665.00 50.00 715.00 690.00 45.00 735.00(vii) Plantations - - - - - -(viii) Food storage & ware housing 423.00 -1178.00 -755.00 415.00 -1122.00 -707.00(ix) Agri Research & Education - - - - - -(x) Co-operation 4310.00 315.00 4625.00 3194.00 -185.00 3009.00(xi) Others - - - - - -(2) Rural Development - - - 30.00 - 30.00(3) Special Area Prog - - - - - -of which Hill areas - - - - - -(4) Major and Medium Irrigation & Flood control21919.00 - 21919.00 22065.00 - 22065.00(5) Energy 25.00 - 25.00 20.00 - 20.00(6) Industry & Mineral (i to iv) 9079.00 - 9079.00 14886.00 - 14886.00(i) Village & Small Industries 3125.00 - 3125.00 3385.00 - 3385.00(ii) Iron and Steel Industries - - - - - -(iii) Non ferrous Mining and metallurgical Industries 20.00 - 20.00 1.00 - 1.00(iv) others # 5934.00 - 5934.00 11500.00 - 11500.00(7) Transport (i+ii) 22849.00 30.00 22879.00 15554.00 30.00 15584.00(i) Road & Bridges 20042.00 - 20042.00 10084.00 - 10084.00(ii) others ** 2807.00 30.00 2837.00 5470.00 30.00 5500.00(8) Communications - - - - - -(9) Science, Technology & Environment - - - - - -(10) General Ecnomic Services (i to ii) 1419.00 - 1419.00 4185.00 - 4185.00(i) Tourism 1400.00 - 1400.00 1151.00 - 1151.00(ii) Others @@ 19.00 - 19.00 3034.00 - 3034.00
Kerala
TABLE - DET 11 CAPITAL ACCOUNT- DISBURSEMENTS - KERALA1997-98 to 2000-2001
- S-45 -
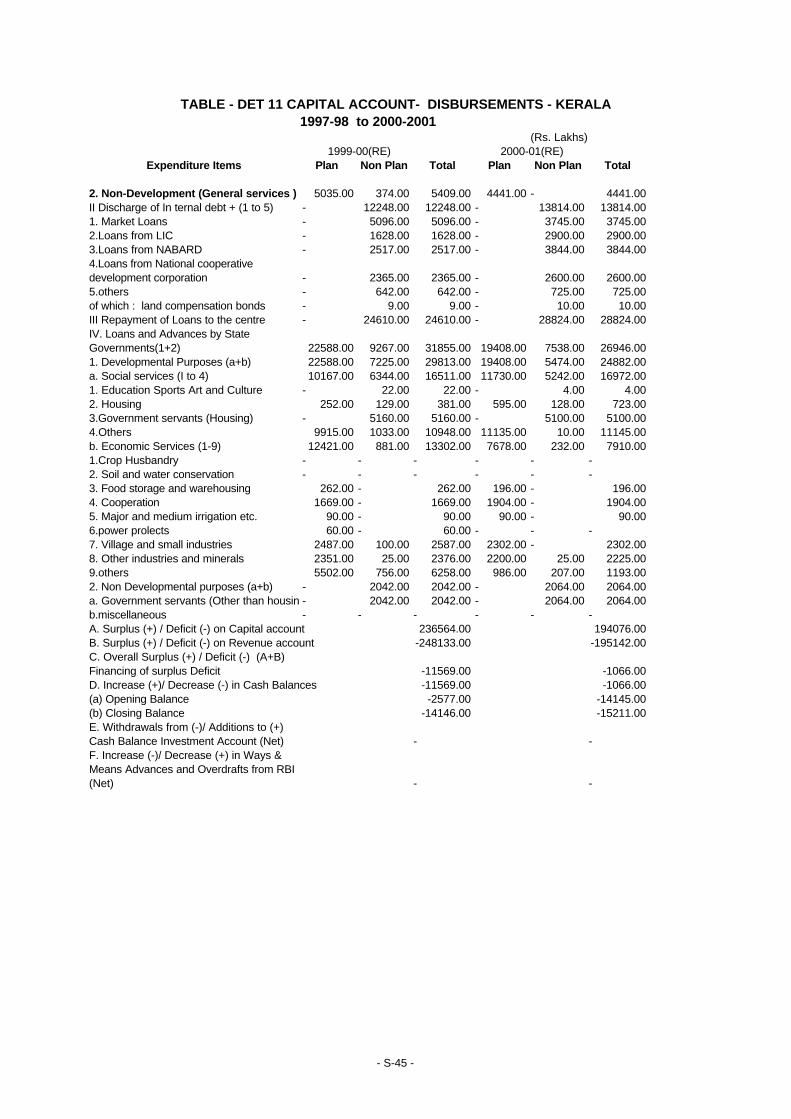
(Rs. Lakhs) 1999-00(RE) 2000-01(RE)
Expenditure Items Plan Non Plan Total Plan Non Plan Total
2. Non-Development (General services ) 5035.00 374.00 5409.00 4441.00 - 4441.00II Discharge of In ternal debt + (1 to 5) - 12248.00 12248.00 - 13814.00 13814.001. Market Loans - 5096.00 5096.00 - 3745.00 3745.002.Loans from LIC - 1628.00 1628.00 - 2900.00 2900.003.Loans from NABARD - 2517.00 2517.00 - 3844.00 3844.004.Loans from National cooperative development corporation - 2365.00 2365.00 - 2600.00 2600.005.others - 642.00 642.00 - 725.00 725.00of which : land compensation bonds - 9.00 9.00 - 10.00 10.00III Repayment of Loans to the centre - 24610.00 24610.00 - 28824.00 28824.00IV. Loans and Advances by State Governments(1+2) 22588.00 9267.00 31855.00 19408.00 7538.00 26946.001. Developmental Purposes (a+b) 22588.00 7225.00 29813.00 19408.00 5474.00 24882.00a. Social services (I to 4) 10167.00 6344.00 16511.00 11730.00 5242.00 16972.001. Education Sports Art and Culture - 22.00 22.00 - 4.00 4.002. Housing 252.00 129.00 381.00 595.00 128.00 723.003.Government servants (Housing) - 5160.00 5160.00 - 5100.00 5100.004.Others 9915.00 1033.00 10948.00 11135.00 10.00 11145.00b. Economic Services (1-9) 12421.00 881.00 13302.00 7678.00 232.00 7910.001.Crop Husbandry - - - - - -2. Soil and water conservation - - - - - -3. Food storage and warehousing 262.00 - 262.00 196.00 - 196.004. Cooperation 1669.00 - 1669.00 1904.00 - 1904.005. Major and medium irrigation etc. 90.00 - 90.00 90.00 - 90.006.power prolects 60.00 - 60.00 - - -7. Village and small industries 2487.00 100.00 2587.00 2302.00 - 2302.008. Other industries and minerals 2351.00 25.00 2376.00 2200.00 25.00 2225.009.others 5502.00 756.00 6258.00 986.00 207.00 1193.002. Non Developmental purposes (a+b) - 2042.00 2042.00 - 2064.00 2064.00a. Government servants (Other than housing)- 2042.00 2042.00 - 2064.00 2064.00b.miscellaneous - - - - - -A. Surplus (+) / Deficit (-) on Capital account 236564.00 194076.00B. Surplus (+) / Deficit (-) on Revenue account -248133.00 -195142.00C. Overall Surplus (+) / Deficit (-) (A+B) Financing of surplus Deficit -11569.00 -1066.00D. Increase (+)/ Decrease (-) in Cash Balances -11569.00 -1066.00(a) Opening Balance -2577.00 -14145.00(b) Closing Balance -14146.00 -15211.00E. Withdrawals from (-)/ Additions to (+) Cash Balance Investment Account (Net) - -F. Increase (-)/ Decrease (+) in Ways & Means Advances and Overdrafts from RBI (Net) - -
1997-98 to 2000-2001TABLE - DET 11 CAPITAL ACCOUNT- DISBURSEMENTS - KERALA
- S-45 -
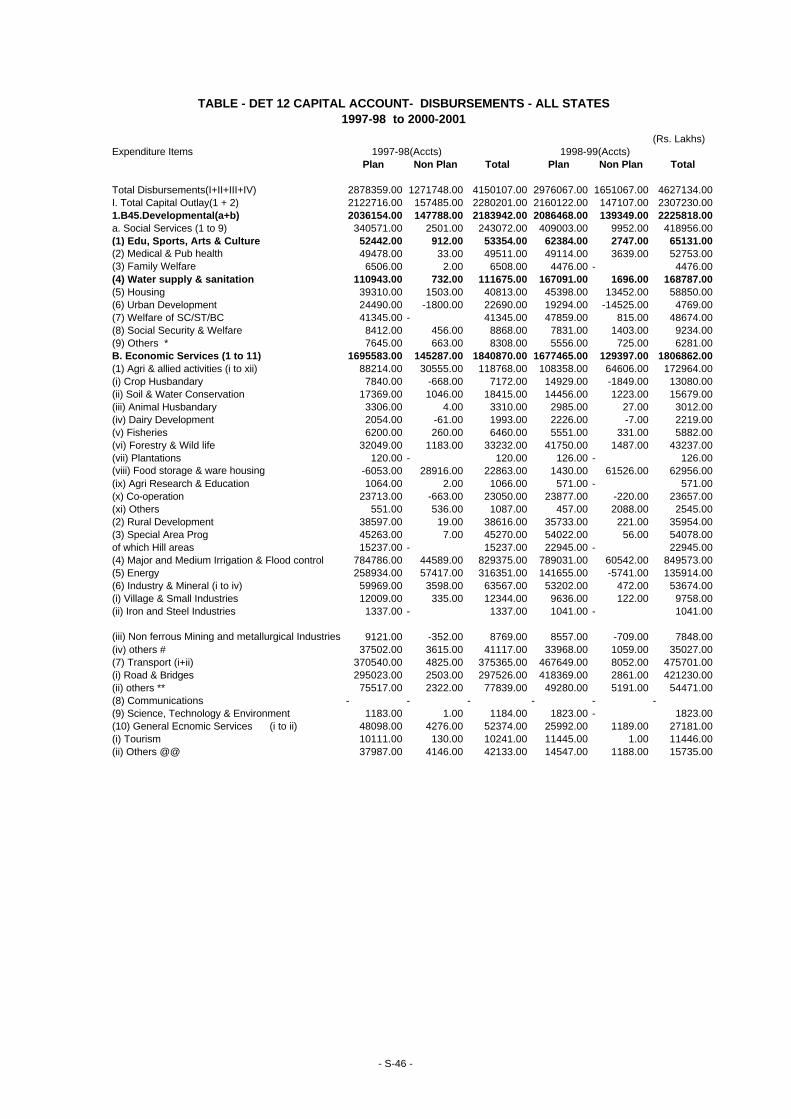
(Rs. Lakhs)Expenditure Items 1997-98(Accts) 1998-99(Accts)
Plan Non Plan Total Plan Non Plan Total
Total Disbursements(I+II+III+IV) 2878359.00 1271748.00 4150107.00 2976067.00 1651067.00 4627134.00I. Total Capital Outlay(1 + 2) 2122716.00 157485.00 2280201.00 2160122.00 147107.00 2307230.001.B45.Developmental(a+b) 2036154.00 147788.00 2183942.00 2086468.00 139349.00 2225818.00a. Social Services (1 to 9) 340571.00 2501.00 243072.00 409003.00 9952.00 418956.00(1) Edu, Sports, Arts & Culture 52442.00 912.00 53354.00 62384.00 2747.00 65131.00(2) Medical & Pub health 49478.00 33.00 49511.00 49114.00 3639.00 52753.00(3) Family Welfare 6506.00 2.00 6508.00 4476.00 - 4476.00(4) Water supply & sanitation 110943.00 732.00 111675.00 167091.00 1696.00 168787.00(5) Housing 39310.00 1503.00 40813.00 45398.00 13452.00 58850.00(6) Urban Development 24490.00 -1800.00 22690.00 19294.00 -14525.00 4769.00(7) Welfare of SC/ST/BC 41345.00 - 41345.00 47859.00 815.00 48674.00(8) Social Security & Welfare 8412.00 456.00 8868.00 7831.00 1403.00 9234.00(9) Others * 7645.00 663.00 8308.00 5556.00 725.00 6281.00B. Economic Services (1 to 11) 1695583.00 145287.00 1840870.00 1677465.00 129397.00 1806862.00(1) Agri & allied activities (i to xii) 88214.00 30555.00 118768.00 108358.00 64606.00 172964.00(i) Crop Husbandary 7840.00 -668.00 7172.00 14929.00 -1849.00 13080.00(ii) Soil & Water Conservation 17369.00 1046.00 18415.00 14456.00 1223.00 15679.00(iii) Animal Husbandary 3306.00 4.00 3310.00 2985.00 27.00 3012.00(iv) Dairy Development 2054.00 -61.00 1993.00 2226.00 -7.00 2219.00(v) Fisheries 6200.00 260.00 6460.00 5551.00 331.00 5882.00(vi) Forestry & Wild life 32049.00 1183.00 33232.00 41750.00 1487.00 43237.00(vii) Plantations 120.00 - 120.00 126.00 - 126.00(viii) Food storage & ware housing -6053.00 28916.00 22863.00 1430.00 61526.00 62956.00(ix) Agri Research & Education 1064.00 2.00 1066.00 571.00 - 571.00(x) Co-operation 23713.00 -663.00 23050.00 23877.00 -220.00 23657.00(xi) Others 551.00 536.00 1087.00 457.00 2088.00 2545.00(2) Rural Development 38597.00 19.00 38616.00 35733.00 221.00 35954.00(3) Special Area Prog 45263.00 7.00 45270.00 54022.00 56.00 54078.00of which Hill areas 15237.00 - 15237.00 22945.00 - 22945.00(4) Major and Medium Irrigation & Flood control 784786.00 44589.00 829375.00 789031.00 60542.00 849573.00(5) Energy 258934.00 57417.00 316351.00 141655.00 -5741.00 135914.00(6) Industry & Mineral (i to iv) 59969.00 3598.00 63567.00 53202.00 472.00 53674.00(i) Village & Small Industries 12009.00 335.00 12344.00 9636.00 122.00 9758.00(ii) Iron and Steel Industries 1337.00 - 1337.00 1041.00 - 1041.00
(iii) Non ferrous Mining and metallurgical Industries 9121.00 -352.00 8769.00 8557.00 -709.00 7848.00(iv) others # 37502.00 3615.00 41117.00 33968.00 1059.00 35027.00(7) Transport (i+ii) 370540.00 4825.00 375365.00 467649.00 8052.00 475701.00(i) Road & Bridges 295023.00 2503.00 297526.00 418369.00 2861.00 421230.00(ii) others ** 75517.00 2322.00 77839.00 49280.00 5191.00 54471.00(8) Communications - - - - - -(9) Science, Technology & Environment 1183.00 1.00 1184.00 1823.00 - 1823.00(10) General Ecnomic Services (i to ii) 48098.00 4276.00 52374.00 25992.00 1189.00 27181.00(i) Tourism 10111.00 130.00 10241.00 11445.00 1.00 11446.00(ii) Others @@ 37987.00 4146.00 42133.00 14547.00 1188.00 15735.00
TABLE - DET 12 CAPITAL ACCOUNT- DISBURSEMENTS - ALL STATES1997-98 to 2000-2001
- S-46 -
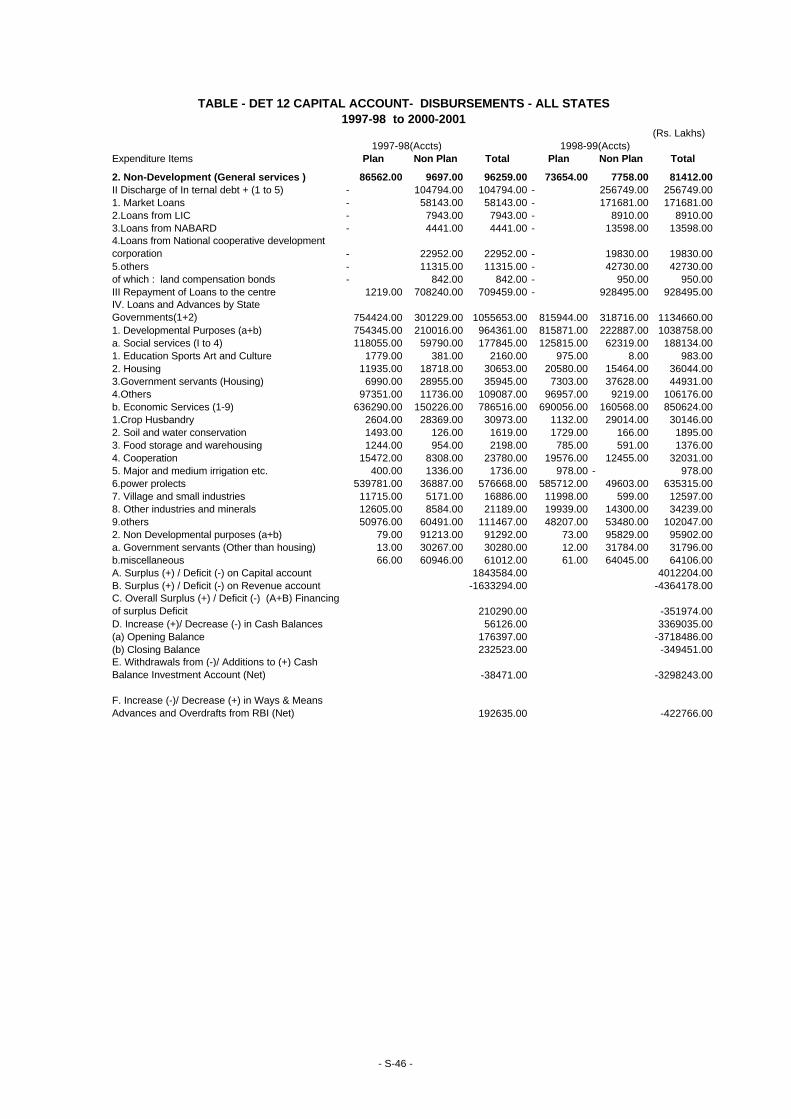
(Rs. Lakhs) 1997-98(Accts) 1998-99(Accts)
Expenditure Items Plan Non Plan Total Plan Non Plan Total
2. Non-Development (General services ) 86562.00 9697.00 96259.00 73654.00 7758.00 81412.00II Discharge of In ternal debt + (1 to 5) - 104794.00 104794.00 - 256749.00 256749.001. Market Loans - 58143.00 58143.00 - 171681.00 171681.002.Loans from LIC - 7943.00 7943.00 - 8910.00 8910.003.Loans from NABARD - 4441.00 4441.00 - 13598.00 13598.004.Loans from National cooperative development corporation - 22952.00 22952.00 - 19830.00 19830.005.others - 11315.00 11315.00 - 42730.00 42730.00of which : land compensation bonds - 842.00 842.00 - 950.00 950.00III Repayment of Loans to the centre 1219.00 708240.00 709459.00 - 928495.00 928495.00IV. Loans and Advances by State Governments(1+2) 754424.00 301229.00 1055653.00 815944.00 318716.00 1134660.001. Developmental Purposes (a+b) 754345.00 210016.00 964361.00 815871.00 222887.00 1038758.00a. Social services (I to 4) 118055.00 59790.00 177845.00 125815.00 62319.00 188134.001. Education Sports Art and Culture 1779.00 381.00 2160.00 975.00 8.00 983.002. Housing 11935.00 18718.00 30653.00 20580.00 15464.00 36044.003.Government servants (Housing) 6990.00 28955.00 35945.00 7303.00 37628.00 44931.004.Others 97351.00 11736.00 109087.00 96957.00 9219.00 106176.00b. Economic Services (1-9) 636290.00 150226.00 786516.00 690056.00 160568.00 850624.001.Crop Husbandry 2604.00 28369.00 30973.00 1132.00 29014.00 30146.002. Soil and water conservation 1493.00 126.00 1619.00 1729.00 166.00 1895.003. Food storage and warehousing 1244.00 954.00 2198.00 785.00 591.00 1376.004. Cooperation 15472.00 8308.00 23780.00 19576.00 12455.00 32031.005. Major and medium irrigation etc. 400.00 1336.00 1736.00 978.00 - 978.006.power prolects 539781.00 36887.00 576668.00 585712.00 49603.00 635315.007. Village and small industries 11715.00 5171.00 16886.00 11998.00 599.00 12597.008. Other industries and minerals 12605.00 8584.00 21189.00 19939.00 14300.00 34239.009.others 50976.00 60491.00 111467.00 48207.00 53480.00 102047.002. Non Developmental purposes (a+b) 79.00 91213.00 91292.00 73.00 95829.00 95902.00a. Government servants (Other than housing) 13.00 30267.00 30280.00 12.00 31784.00 31796.00b.miscellaneous 66.00 60946.00 61012.00 61.00 64045.00 64106.00A. Surplus (+) / Deficit (-) on Capital account 1843584.00 4012204.00B. Surplus (+) / Deficit (-) on Revenue account -1633294.00 -4364178.00C. Overall Surplus (+) / Deficit (-) (A+B) Financing of surplus Deficit 210290.00 -351974.00D. Increase (+)/ Decrease (-) in Cash Balances 56126.00 3369035.00(a) Opening Balance 176397.00 -3718486.00(b) Closing Balance 232523.00 -349451.00E. Withdrawals from (-)/ Additions to (+) Cash Balance Investment Account (Net) -38471.00 -3298243.00
F. Increase (-)/ Decrease (+) in Ways & Means Advances and Overdrafts from RBI (Net) 192635.00 -422766.00
1997-98 to 2000-2001TABLE - DET 12 CAPITAL ACCOUNT- DISBURSEMENTS - ALL STATES
- S-46 -
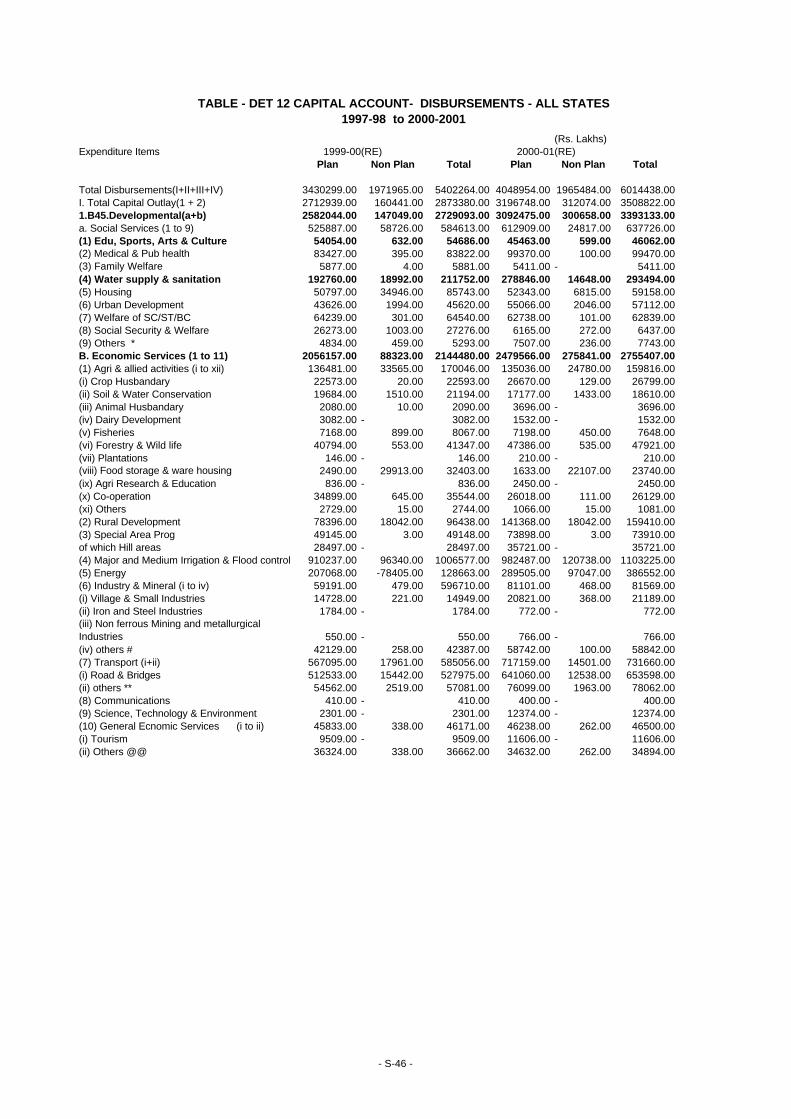
(Rs. Lakhs)Expenditure Items 1999-00(RE) 2000-01(RE)
Plan Non Plan Total Plan Non Plan Total
Total Disbursements(I+II+III+IV) 3430299.00 1971965.00 5402264.00 4048954.00 1965484.00 6014438.00I. Total Capital Outlay(1 + 2) 2712939.00 160441.00 2873380.00 3196748.00 312074.00 3508822.001.B45.Developmental(a+b) 2582044.00 147049.00 2729093.00 3092475.00 300658.00 3393133.00a. Social Services (1 to 9) 525887.00 58726.00 584613.00 612909.00 24817.00 637726.00(1) Edu, Sports, Arts & Culture 54054.00 632.00 54686.00 45463.00 599.00 46062.00(2) Medical & Pub health 83427.00 395.00 83822.00 99370.00 100.00 99470.00(3) Family Welfare 5877.00 4.00 5881.00 5411.00 - 5411.00(4) Water supply & sanitation 192760.00 18992.00 211752.00 278846.00 14648.00 293494.00(5) Housing 50797.00 34946.00 85743.00 52343.00 6815.00 59158.00(6) Urban Development 43626.00 1994.00 45620.00 55066.00 2046.00 57112.00(7) Welfare of SC/ST/BC 64239.00 301.00 64540.00 62738.00 101.00 62839.00(8) Social Security & Welfare 26273.00 1003.00 27276.00 6165.00 272.00 6437.00(9) Others * 4834.00 459.00 5293.00 7507.00 236.00 7743.00B. Economic Services (1 to 11) 2056157.00 88323.00 2144480.00 2479566.00 275841.00 2755407.00(1) Agri & allied activities (i to xii) 136481.00 33565.00 170046.00 135036.00 24780.00 159816.00(i) Crop Husbandary 22573.00 20.00 22593.00 26670.00 129.00 26799.00(ii) Soil & Water Conservation 19684.00 1510.00 21194.00 17177.00 1433.00 18610.00(iii) Animal Husbandary 2080.00 10.00 2090.00 3696.00 - 3696.00(iv) Dairy Development 3082.00 - 3082.00 1532.00 - 1532.00(v) Fisheries 7168.00 899.00 8067.00 7198.00 450.00 7648.00(vi) Forestry & Wild life 40794.00 553.00 41347.00 47386.00 535.00 47921.00(vii) Plantations 146.00 - 146.00 210.00 - 210.00(viii) Food storage & ware housing 2490.00 29913.00 32403.00 1633.00 22107.00 23740.00(ix) Agri Research & Education 836.00 - 836.00 2450.00 - 2450.00(x) Co-operation 34899.00 645.00 35544.00 26018.00 111.00 26129.00(xi) Others 2729.00 15.00 2744.00 1066.00 15.00 1081.00(2) Rural Development 78396.00 18042.00 96438.00 141368.00 18042.00 159410.00(3) Special Area Prog 49145.00 3.00 49148.00 73898.00 3.00 73910.00of which Hill areas 28497.00 - 28497.00 35721.00 - 35721.00(4) Major and Medium Irrigation & Flood control 910237.00 96340.00 1006577.00 982487.00 120738.00 1103225.00(5) Energy 207068.00 -78405.00 128663.00 289505.00 97047.00 386552.00(6) Industry & Mineral (i to iv) 59191.00 479.00 596710.00 81101.00 468.00 81569.00(i) Village & Small Industries 14728.00 221.00 14949.00 20821.00 368.00 21189.00(ii) Iron and Steel Industries 1784.00 - 1784.00 772.00 - 772.00(iii) Non ferrous Mining and metallurgical Industries 550.00 - 550.00 766.00 - 766.00(iv) others # 42129.00 258.00 42387.00 58742.00 100.00 58842.00(7) Transport (i+ii) 567095.00 17961.00 585056.00 717159.00 14501.00 731660.00(i) Road & Bridges 512533.00 15442.00 527975.00 641060.00 12538.00 653598.00(ii) others ** 54562.00 2519.00 57081.00 76099.00 1963.00 78062.00(8) Communications 410.00 - 410.00 400.00 - 400.00(9) Science, Technology & Environment 2301.00 - 2301.00 12374.00 - 12374.00(10) General Ecnomic Services (i to ii) 45833.00 338.00 46171.00 46238.00 262.00 46500.00(i) Tourism 9509.00 - 9509.00 11606.00 - 11606.00(ii) Others @@ 36324.00 338.00 36662.00 34632.00 262.00 34894.00
TABLE - DET 12 CAPITAL ACCOUNT- DISBURSEMENTS - ALL STATES1997-98 to 2000-2001
- S-46 -
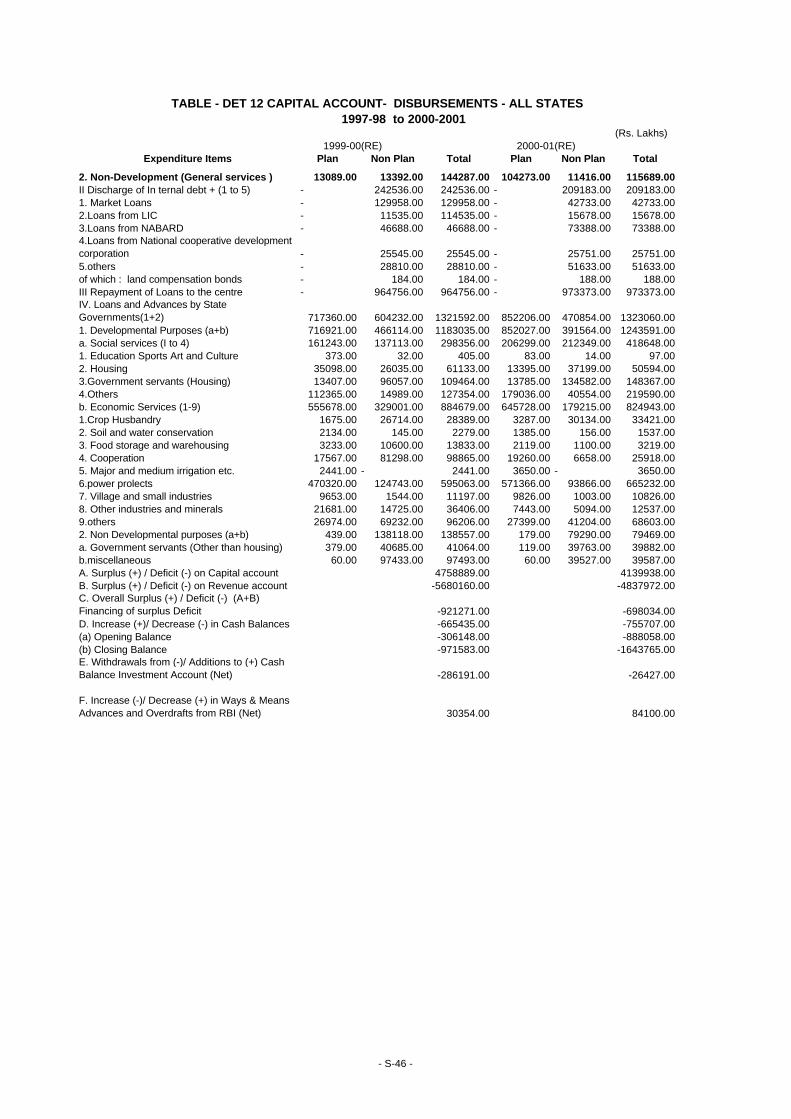
(Rs. Lakhs) 1999-00(RE) 2000-01(RE)
Expenditure Items Plan Non Plan Total Plan Non Plan Total
2. Non-Development (General services ) 13089.00 13392.00 144287.00 104273.00 11416.00 115689.00II Discharge of In ternal debt + (1 to 5) - 242536.00 242536.00 - 209183.00 209183.001. Market Loans - 129958.00 129958.00 - 42733.00 42733.002.Loans from LIC - 11535.00 114535.00 - 15678.00 15678.003.Loans from NABARD - 46688.00 46688.00 - 73388.00 73388.004.Loans from National cooperative development corporation - 25545.00 25545.00 - 25751.00 25751.005.others - 28810.00 28810.00 - 51633.00 51633.00of which : land compensation bonds - 184.00 184.00 - 188.00 188.00III Repayment of Loans to the centre - 964756.00 964756.00 - 973373.00 973373.00IV. Loans and Advances by State Governments(1+2) 717360.00 604232.00 1321592.00 852206.00 470854.00 1323060.001. Developmental Purposes (a+b) 716921.00 466114.00 1183035.00 852027.00 391564.00 1243591.00a. Social services (I to 4) 161243.00 137113.00 298356.00 206299.00 212349.00 418648.001. Education Sports Art and Culture 373.00 32.00 405.00 83.00 14.00 97.002. Housing 35098.00 26035.00 61133.00 13395.00 37199.00 50594.003.Government servants (Housing) 13407.00 96057.00 109464.00 13785.00 134582.00 148367.004.Others 112365.00 14989.00 127354.00 179036.00 40554.00 219590.00b. Economic Services (1-9) 555678.00 329001.00 884679.00 645728.00 179215.00 824943.001.Crop Husbandry 1675.00 26714.00 28389.00 3287.00 30134.00 33421.002. Soil and water conservation 2134.00 145.00 2279.00 1385.00 156.00 1537.003. Food storage and warehousing 3233.00 10600.00 13833.00 2119.00 1100.00 3219.004. Cooperation 17567.00 81298.00 98865.00 19260.00 6658.00 25918.005. Major and medium irrigation etc. 2441.00 - 2441.00 3650.00 - 3650.006.power prolects 470320.00 124743.00 595063.00 571366.00 93866.00 665232.007. Village and small industries 9653.00 1544.00 11197.00 9826.00 1003.00 10826.008. Other industries and minerals 21681.00 14725.00 36406.00 7443.00 5094.00 12537.009.others 26974.00 69232.00 96206.00 27399.00 41204.00 68603.002. Non Developmental purposes (a+b) 439.00 138118.00 138557.00 179.00 79290.00 79469.00a. Government servants (Other than housing) 379.00 40685.00 41064.00 119.00 39763.00 39882.00b.miscellaneous 60.00 97433.00 97493.00 60.00 39527.00 39587.00A. Surplus (+) / Deficit (-) on Capital account 4758889.00 4139938.00B. Surplus (+) / Deficit (-) on Revenue account -5680160.00 -4837972.00C. Overall Surplus (+) / Deficit (-) (A+B) Financing of surplus Deficit -921271.00 -698034.00D. Increase (+)/ Decrease (-) in Cash Balances -665435.00 -755707.00(a) Opening Balance -306148.00 -888058.00(b) Closing Balance -971583.00 -1643765.00E. Withdrawals from (-)/ Additions to (+) Cash Balance Investment Account (Net) -286191.00 -26427.00
F. Increase (-)/ Decrease (+) in Ways & Means Advances and Overdrafts from RBI (Net) 30354.00 84100.00
1997-98 to 2000-2001TABLE - DET 12 CAPITAL ACCOUNT- DISBURSEMENTS - ALL STATES
- S-46 -
Note: (1) Figures given here (I) are not comparable with those published in the Article prior to 1974-75
due to changes in budgetary classification and (ii) differ from given in the states budget papers due to
adjustment made to ensure uniformity in the presentation
(2) Where details are not available in respect of one or several sub-groups under major groups,
the relevant amount is shown against the sub-group 'others' in the columns which present the total
for all the states together
(3) Figures in respect of Nagaland for 1998-99 relate to revised estimates
(4) @ include outlay on other agricultural programmes etc.
(5) * include outlay on information and publicity, other social services etc.
(6) # include outlay on cement and non metallic industries, petrochemical industries, chemical industries,
engineering industries, telecommunication and electronic industries, consumer industries, atomic energy
industries, other industries and minerals etc
(7) ** includes outlay on Indian Railway - commercial lines, Indian Railway strategic lines, ports and light
houses, shipping, civil aviation, road transport, inland water transport, other transport etc .
(8)+ excludes Ways and Means advances and over drafts from RBI and loans to the SBI and other Banks
(9) @@ include outlay on foreign trade and export promotion, technology, other general economic services
and investments in general financial and trading institutions, international financial institutions etc.
(10) - Nil or not available