Embed Size (px)
Citation preview

www.ijcrt.org © 2020 IJCRT | Volume 8, Issue 2 February 2020 | ISSN: 2320-2882
IJCRT2002040 International Journal of Creative Research Thoughts (IJCRT) www.ijcrt.org 295
A STUDY ON SAVINGS AND INVESTMENT
PATTERN OF ASSISTANT PROFESSORS OF
SELF-FINANCE COLLEGES IN THENI
DISTRICT
E.VELMURUGAN, M.com
Dr. P.AMARJOTHI
Assistant professor,
Department of Commerce,
Madurai Kamarai University,
Madurai.
ABSTRACT
This study investing the savings and investment pattern of assistant professors of self-finance
colleges in theni district. This study discuss about the factors infusing the savings and
investment pattern of assistant professors of towards different investment avenues with special
reference to theni district. A variety of different investment options on available that are bank
deposit, Post office Recurring Deposit, National Savings Certificate, recurring and fixed
deposits, insurance policy, government securities, Public Provident Fund and the like. Investor
always savings the money with different type of purposes and objective such as wealth, tax
savings future expenses, to be secured at old age, to meet contingent expenses. The researcher
selected 50 respondents an sample in theni district. The respondents were selected on the basis
of convenience sampling technics for collecting primary data.
KEYWORDS: Profits, Money, Income, Savings and Investment, Salary Assistant professors, plan

www.ijcrt.org © 2020 IJCRT | Volume 8, Issue 2 February 2020 | ISSN: 2320-2882
IJCRT2002040 International Journal of Creative Research Thoughts (IJCRT) www.ijcrt.org 296
INTRODUCTION:
Saving means different things to different people. To some, it means putting money in the
bank. To others, it means buying stocks or contributing to a pension plan, medical plan, future plan,
specific purpose plan but to economists, saving means only one thing consuming less out of a given
amount of resources in the present in order to consume more in the future. Saving is often confused
with investing, but they are not the same. Although most people think of purchases of stocks and
bonds as investments, economists use the term “investment” to mean additions to the real stock of
capital plants, factories, equipment, and the like. Investment is usually the result of forgoing
consumption. In a purely agrarian society, early humans had to choose how much grain to eat after the
harvest and how much to save for future planting. The latter was investment. In a more modern
society, we allocate our productive capacity to producing pure consumer goods such as hamburgers
and hot dogs, and investment goods such as semiconductor foundries. If we create one dollar worth of
hamburgers today, then our gross national product is higher by one dollar. If we create one dollar
worth of semiconductor foundry today, gross national product is higher by one dollar, but it will also
be higher next year because the foundry will still produce computer chips long after the hamburger
has disappeared. This is how investment leads to economic growth. Without it, human progress would
halt. Investment need not always take the form of a privately owned physical product. The most
common example of nonphysical investment is investment in human capital. When a student chooses
study over leisure, that student has invested in his own future just as surely as the factory owner who
has purchased machines. Investment theory just as easily applies to this decision. Pharmaceutical
products that establish heightened well-being can also be thought of as investments that reap higher
future productivity. Moreover, government also invests. A bridge or a road is just as much an
investment in tomorrow’s activity as a machine. The review literature discussed below focuses on the
study of physical capital purchases, but the analysis is more widely applicable.
History of savings and investment:
In India savings based on a legislative framework of Government banks has a history of nearly
130 years. Some historians trace the genesis of the savings movement to 1834, when the first savings
bank was established in Calcutta by the Government. However, the Government Savings Bank Act
was passed in 1873, and it was in 1882 that the Post Office Savings Bank of India came into existence.
In 1886 The Government District Savings Banks were merged with the Post Office Savings Bank
(POSB). After independence, in 1947, it was felt that more of an impetus has to be given to the
savings movement and the National Savings Organization NSO (now NSI) was created in 1948. The
words of the then Prime Minister Pandit Jawaharlal Nehru signify the crucial role envisaged for the

www.ijcrt.org © 2020 IJCRT | Volume 8, Issue 2 February 2020 | ISSN: 2320-2882
IJCRT2002040 International Journal of Creative Research Thoughts (IJCRT) www.ijcrt.org 297
national savings movement in the context of domestic savings as a force for national development.
Small savings were considered a priority concern of the Government.
STATEMENT OF THE PROBLEM:
There are many ways to get involved types of investments, but they vary widely in degree
of risk and return and certainly not appropriate or necessary for all investors. As a savings and
investment pattern of assistant professors of self- finance colleges in Theni district is concerned,
selection of best saving and investment tool is a complicated process. This paper traces to analysis’s
the assistant professors savings and investment habit and their awareness on different types of avenues
of expectations.
SCOPE OF THE STUDY
The treatment of savings and related variables are further complex because of the host of
variables influencing savings. The determinants of savings in an urban environment need not be
relevant in a rural environment. Considering all these issues, the primary focus of this study is to
identify the determinants of income, saving and investment pattern of assistant professors. The income
and expenditure pattern, and sources of income of the have a bearing on the saving and investment
pattern. In the same way, disposal of savings by the assistant professors, which, in turn, depends on
occupation, level of income and level of education needs a detailed analysis along with the
determinants of income, saving and investment of assistant professors.
REVIEW OF LITERATURE:
Nallakannu and Selvaraj (2018) titled “Saving and Investment Pattern of College Teachers” Investors
are sensitive about their safety of their investments are made. They need safety and reliability for their
investments. Current trend had not affected investment. College teachers invest their money in safer
environment, need regular income from their investment made with lower risk. It is evident from the
study that most of the teachers are considered safety for selecting the mode of saving and Bank
deposits were considered as the main option of the investment followed by Insurance.
Chitra and Malarvizhi (2018) a study on their “Savings and Investment Pattern of Lecturers in Theni
District” the was Savings and proper investment is important for every human life. They avoid
spending money on heavy luxurious life style and preferring the normal living standard. All the
lecturers are Know about the different investment avenues like safe and low risk avenues, Moderate
risk avenues, high risk avenues, traditional investment avenues and emerging investment avenues.
Likewise their annual income and percentage of investment is closely related. In the ultimate analysis

www.ijcrt.org © 2020 IJCRT | Volume 8, Issue 2 February 2020 | ISSN: 2320-2882
IJCRT2002040 International Journal of Creative Research Thoughts (IJCRT) www.ijcrt.org 298
individual characteristics of teachers such as age, gender, marital status, and lifestyle determined the
savings and investment behavior of teaching community in the study region.
Bindu (2017) in the study captioned “Analysis of Investment pattern of college teachers in Kerala” based
on their research Project explored the fact that the flow of Individual investor’s investments is backed
by benefits and money. Individual investor still prefers to invest in financial products which give risk
free returns. The study shows that all the teachers have a provident Fund, but the rate of investment in
bonds and company shares are less. The main influencing factors for investment are liquidity, high
returns, capital appreciation and tax benefit.
Manasi Kulkarni (Killedar) and Rawal (2016) in her study titled “Investment Patterns of College
Teachers With Respect To Navi-Mumbai city” So from above research it is clear that money plays a
vital role in every individual‘s life. Teacher’s community also started recognizing the importance of
investment and savings. From the above research study researcher came to know about how much
teaching community is aware about investment knowledge. Their most preferred avenues are all
traditional investments like bank deposits, government securities, bullions ( gold , silver) and then real
estate.
Yasodha and Ravindran (2015) in their study “Savings and Investment Pattern of Teachers Working in
Arts and Science Colleges in Coimbatore District” Investors are sensitive about their safety of their
investments made. They need safety and reliability for their investments. Current trend had not
affected investment. College teachers invest their money in safer environment, need regular income
from their investment made with lower risk. The investment preference is influenced by creating
awareness, information factors and features to invest instruments. This will bring the changes in
investment pattern of respondents in the years to come.
Jeyakumari and soundaravalli (2015) in their study title with “A study on saving and investment
pattern of college teachers with reference to thanjavur city corporation” The study is conducted by
taking a limited number of sample sizes which is stated earlier. And this study reflects the exceptions
of those respondents who are residing in Thanjavur .There might be a chance that the perceptions of
the different respondents are varied due to diversity in social life, living pattern, Income level and the
like. All the age groups give more important to invest in Insurance, bank deposit, post office rather
than any other investment avenues. The respondents are more aware about various investment
avenues like Insurance, PPF, bank deposits, small savings like post office savings and the like. Stock
brokering firms has to conduct more awareness program as most of the respondents unaware about
the new services and about stock market.

www.ijcrt.org © 2020 IJCRT | Volume 8, Issue 2 February 2020 | ISSN: 2320-2882
IJCRT2002040 International Journal of Creative Research Thoughts (IJCRT) www.ijcrt.org 299
OBJECTIVES OF THE STUDY:
To study about the profile of finding area and salary factors in self-finance colleges in assistant
professors theni district.
To analysis social economic condition level of income and savings pattern.
To study about the on salary level factors of savings and investment of self-finance colleges in
assistant professors theni district.
To know the level of savings and investment pattern of self-finance colleges in assistant
professors theni district.
HYPOTHESES OF THE STYDY:
There is no significant difference in the present investment status of assistant professors savings
and investors with respect to their age level.
There is significant relationship between education level influencing of select savings and
investment avenues.
There is significant relationship between monthly income level of the sample respondents of the
assistant professors savings and investors towards select investment avenues.
METHODOLOGY:
Are the specific procedures or techniques used to identify select, process and analysis information
about the topic.
COLLECTION OF DATA:
The data required for the study is primary in nature. Questionnaire method has been used for the
collection of data. In this regard, a structured questionnaire was prepared and administered among the
sample respondents. The secondary data have also been gathered from the books, journals and
magazines and the like.
SAMPLING PROCEDURE:
Convening sampling method has been followed to choose the respondents from the Assistant
professors investors in theni District. The size of the sample is determined to be 50. Though size of the
sample is little when compared to the population of the study colleges, it represents the different
sections of Assistant professors savings and investors.
For the purpose of self- finance colleges, the theni District has been divided into 5 colleges by the
education department salary employs – Nadar Saraswathi College of Arts and Science, Mary Matha
College of arts and sconce, Theni College of Arts and Science, TKS College of Arts and Science and
www.ijcrt.org © 2020 IJCRT | Volume 8, Issue 2 February 2020 | ISSN: 2320-2882
IJCRT2002040 International Journal of Creative Research Thoughts (IJCRT) www.ijcrt.org 300
Thiraviam College of Arts and Science for Women. Hence, the samples were selected from the
colleges by giving equal weight age. 10 respondents from each of these self- finance colleges of theni
District have been selected and total size of the sample is 50.
Period of study
The period of study consists of six months, i.e., from 2018-19. The identification of problem,
framing of objectives and preparation of questionnaire were done during 2019. The data collection
was made during 2019. The grouping and regrouping of data was made and analysis has been made
during the year 2019. The preparation and presentation of the thesis have been made during the period
from April 2019.
FRAMEWORK OF ANALYSIS:
Simple percentage analyses
The data analyzed by using under mentioned Techniques:
Garret ranking technic
Chi-square test
DATA PROCESSING:
After the collection of primary data a thorough of the data was made the missing data were identify
collected and arranged systematically for proper presentation of the classification table were prepared.
LIMITATIONS OF THE STUDY:
The study is confined to 50 Assistant Professors Savings and Investors Only in Theni District.
Respondents’ bias is another limitation of the study. The result of analysis made in the study
depends fully on the information given by the respondents.
Assistant professors savings and investment were unwilling to answer several questions. However
with great difficulty the response was obtained
The preference on schemes of savings and investment avenues may change from time to Time;
Therefore the study is valid for specific period / time only

www.ijcrt.org © 2020 IJCRT | Volume 8, Issue 2 February 2020 | ISSN: 2320-2882
IJCRT2002040 International Journal of Creative Research Thoughts (IJCRT) www.ijcrt.org 301
ANALYSIS AND INTERPRETATION
Socio-economic status of the respondents
From the above table socio economic status states that 46 per cent of the respondents belong to age
respondents of the mostly below- 30 Years. 46 per cent of the respondents belong to female and rest
belongs to male. being PG with PhD as the minimum qualification for become assistant professor in
private self-finance collages and form the analysis 50 per cent respondents having basic additional
qualification on 54 per cent of the respondents on none of those. 60 per cent of the respondents got
married. 60 per cent of the respondents was to Religion on Hindu. 26 per cent of the respondents on
size of family in four members. 54 percent of the respondents on place of Residency in Rural people.
34 per cent of the respondents in Monthly income in Rs.10001-15000 level. 34 per cent of the
respondents having Teaching experience of Below 3 years. Table 1:
S NO STATUS NUMBER OF RESPONDENTS PERCENTAGE
AGE OF THE RESPONDENTS
1 Below-30 years 23 46.0
2 31-35 years 10 20.0
3 36-40 years 5 10.0
4 41-45 years 7 14.0
5 Above-45 years 5 10.0
Total 50 100.0
GENDER OF THE RESPONDENTS
1 Male 23 46.0
2 Female 27 54.0
Total 50 100.0
EDUCATION QUALIFICATION
1 PG 7 14.0
2 PG with M. Phil 8 16.0
3 M. Phil with PhD 20 20.0
4 PG with PhD 25 50.0
Total 50 100.0
ADDITIONAL EDUCATION QUALIFICATION
1 SET 13 26.0
2 NET 10 20.0
3 None of those 27 54.0

www.ijcrt.org © 2020 IJCRT | Volume 8, Issue 2 February 2020 | ISSN: 2320-2882
IJCRT2002040 International Journal of Creative Research Thoughts (IJCRT) www.ijcrt.org 302
Total 50 100.0
MARITAL STATUS
1 Married 30 60.0
2 Unmarried 20 40.0
Total 50 100.0
RELIGION
1 Hindu 30 60.0
2 Muslim 10 20.0
3 Christian 10 20.0
Total 50 100.0
SIZE OF FAMILY
1 Two members 17 34.0
2 Three members 10 20.0
3 Four members 13 26.0
4 Above four members 10 20.0
Total 50 100.0
PLACE OF RESIDENCE
1 Rural 27 54.0
2 Urban 10 20.0
3 Semi –urban 13 0.0
Total 50 100.0
MONTHLY INCOME
1 Below Rs.5000 7 14.0
2 Rs.5001-10000 8 16.0
3 Rs.10001-15000 17 34.0
4 Rs.15001-20001 9 18.0
5 Above Rs. 20001 9 18.0
Total 50 100.0
TECHING EXPERIENCE
1 Below 3 years 17 34.0
2 4 -6 years 15 30.0
3 6-10 years 9 18.0
4 Above 10 years 9 18.0
Total 50 100.0
Sources: Primary data

www.ijcrt.org © 2020 IJCRT | Volume 8, Issue 2 February 2020 | ISSN: 2320-2882
IJCRT2002040 International Journal of Creative Research Thoughts (IJCRT) www.ijcrt.org 303
Table 3: Habit of savings
S. no. Habit of savings No. of Respondents Percentage
1 Yes 45 90.0
2 No 5 10.0
Total 50 100.0
Sources: Primary data
It is exhibits from Table that the 50 respondents, 45 (90.0%) per cent are saving the money, 5
(10.0%) per cent are not saving the money.
Table 4: Nature of savings
S. no. Nature of savings No. of Respondents Percentage
1 3 months 17 34.0
2 6 months 13 26.0
3 9 months 9 18.0
4 12 months 11 22.0
Total 50 100.0
Sources: Primary data
From the Table shows 50 respondents, 17 (34.0%) per cent are savings the money 3 months,
13(26.0%) per cent are saving the money 6 months, 9 (18.0%) per cent are saving the money 12
months, 8(18.0%) per cent are saving the money 9 months of the nature of savings
Table 4: Reason for savings if Respondents
S. no. Reason of savings No. of
Respondents
Percentage
1 Wealth creation 5 10.0
2 Tax savings 5 10.0
3 Future expenses 20 40.0
4 To be secured at old age 10 20.0
5 To meet contingent expenses 10 20.0
Total 50 100.0
Sources: Primary data
From the shows the Table 4 shows that out of 50 respondents are majority of respondents, 20
(40.0%) per cent of the respondents are saving the money because of to meet contingent expenses.

www.ijcrt.org © 2020 IJCRT | Volume 8, Issue 2 February 2020 | ISSN: 2320-2882
IJCRT2002040 International Journal of Creative Research Thoughts (IJCRT) www.ijcrt.org 304
Table 4: Factors consider being for investing of sample Respondents
S. no Factors consider to be for investing No. of Respondents Percentage
1 Safety of principal 17 36.0
2 Low risk 5 10.0
3 High returns 13 26.0
4 Others 9 18.0
5 Tax benefits 6 12.0
Total 50 100.0
Sources: Primary data
From the exhibit Table 4 show that out of 50 respondents are majority of respondents, 17 (36.0%)
per cent of the respondents are saving money because of safety of principal.
Table 5: Prefer to investment
S. no. Prefer to investment No .of Respondents Percentage
1 Bank deposits 17 34.0
2 Post office RD, NSC, recurring and
fixed deposits
10 20.0
3 Insurance policies 13 26.0
4 Government securities, public
provident fount (PPF)
4 8.0
5 Others 6 12.0
Total 50 100.0
Sources: Primary data
From the reveals that Table 5 explains 50 respondents are majority of respondents, 17 (34.0%) per
cent of the respondents are preferring by Bank deposits.

www.ijcrt.org © 2020 IJCRT | Volume 8, Issue 2 February 2020 | ISSN: 2320-2882
IJCRT2002040 International Journal of Creative Research Thoughts (IJCRT) www.ijcrt.org 305
Table 6: Period of investments of sample Respondents
S. no. Period of investments No. of Respondents Percentage
1 Long-term (more than 1 years) 17 34.0
2 Medium-term (more than 5 years) 13 26.0
3 Short-term (more than 1 years) 14 28.0
4 Very short-term(less than 1 years) 6 12.0
Total 50 100.0
Sources: Primary data
From the above the Table 6 exhibit out of 50 respondents is majority of respondents, 17 (34.0%)
per cent of the respondents are investing the money in long – term (more than 1 year),
Table 7: Decision taken by investing of sample Respondents
S. no. Decision investing No .of Respondents Percentage
1 Husband and family members 16 32.0
2 Financial advisors 10 20.0
3 Friends and colleague 11 22.0
4 Self-decision 13 26.0
Total 50 100.0
Sources: Primary data
From the reveals the table 7 clear that out of 50 respondents is majority of respondents, 16 (32.0%)
per cent of the respondents are decision by the Self decision
Table 8: Source of information of sample Respondents
S. no. Sources of information No. of Respondents Percentage
1 TV and radio 13 26.0
2 friends and relatives 17 34.0
3 Advertisement 7 14.0
4 Newspaper / Magazine 7 14.0
5 Others 6 12.0
Total 100 100.0
Sources: Primary data

www.ijcrt.org © 2020 IJCRT | Volume 8, Issue 2 February 2020 | ISSN: 2320-2882
IJCRT2002040 International Journal of Creative Research Thoughts (IJCRT) www.ijcrt.org 306
From the above table 8 it is clear that majority of respondents takes help of their friends and
relatives in investment sources of investment. 17 (34.0%) per cent of the respondents take investment
sources of independently.
Table 9: Type of investment
S. no. Type of investment No .of Respondents Percentage
1 Regular return plan 17 34.0
2 Medical plan 8 16.0
3 Pension plan 12 24.0
4 Specific purpose 13 26.0
Total 50 100.0
Sources: Primary data
The above table 9 stats that majority of the respondents are the 17 (34.0%) per cent of the respondents
investment the plan of regular return plan.
GARETT RANKING METHOD:
GARETT RANKING METHOD
Table 10:
S. no. Factor Total score Mean Rank
1 Safety 2567 / 50 51.34 2
2 Time perspective of decision 2454 / 50 49.08 4
3 Risk bearing 2293/ 50 45.86 6
4 Sources of information 2349/ 50 46.98 5
5 Regular return 2293/ 50 45.86 7
6 Size of investment 2748/ 50 54.96 1
7 Premature withdrawal 2556/ 50 51.12 3
Sources: Primary data
From above table 10 the reveals that which assigned as Size of investment first rank, Safety
assigned as second rank, Premature withdrawal assigned as third ranking, Time perspective of
decision assigned as forth ranking, Sources of information assigned as fifth ranking, Risk bearing
assigned as sixth ranking, Regular return assigned as seventh ranking.

www.ijcrt.org © 2020 IJCRT | Volume 8, Issue 2 February 2020 | ISSN: 2320-2882
IJCRT2002040 International Journal of Creative Research Thoughts (IJCRT) www.ijcrt.org 307
CHI – SRUARE TEST:
Score for five point scale (likert scale)
Particulars Strong agree Agree No opinion Disagree Strongly disagree
Statement 1 2 3 4 5
After giving score for each statement. The total score for each statement was calculated, the overall
position of all the respondents has been consolidated and deviation categorizing them into three
groups namely, high, medium low level of reason according to the individual scores.
Mean + standard deviation = High = 13
(Mean + standard deviation) = Medium = 27
(Mean – standard deviation)
Mean + standard deviation = low = 10
Level of satisfaction in attitude of savings and investment
Table 11
S. no. Level of satisfaction No. Of respondents Percentage
1 High 13 26.0
2 Medium 27 54.0
3 Low 10 20.0
Total 50 100.0
From the Table 11 shows that the out of 50 respondents, 13(26.0%) per cent respondents are high
level satisfaction, 27 (54.0%) per cent respondents are medium level of satisfaction, 10 (20.0%) per
cent respondents are low level of satisfaction.
Testing of hypotheses of personal variables and level of attitude
i. Age of the Respondents
ii. Education Qualification of Respondents
iii. Monthly income of Respondents

www.ijcrt.org © 2020 IJCRT | Volume 8, Issue 2 February 2020 | ISSN: 2320-2882
IJCRT2002040 International Journal of Creative Research Thoughts (IJCRT) www.ijcrt.org 308
Age and level of attitude of the sample respondents
𝐇𝟏: Gender of the sample respondents influences the level of attitude on savings and investment.
Age and level of reason for the sample Respondents
Table 12
Table 12 Inferred that out of 26 respondents in above 30 years categories, 8 respondents are come
under the high level, 14 respondents are come under the medium level and remaining 4 respondents
are fall under the low level. The following are the hypothesis formulated to test the relationship
between the age and level of attitude of the sample respondents.
Calculated value = 2.57
Table value at 5% level = 5.99
Degree of freedom = 2
Since the calculated value is less than Table value, the null hypothesis accepted and the age level
of the sample respondents influence the level of attitude of the respondents. Therefore, there is no
signification relationship between the age factor and level of attitude of the sample respondents.
Education qualification and level of attitude of the sample Respondents
𝐇𝟏: Education qualification of the sample respondents influences the level of attitude on savings and
investment.
S. no.
Age
Level of attitude
Total High Medium Low
1 Up to 30 years 5 13 6 24
2 Above 30 years 8 14 4 26
Total 13 27 10 50

www.ijcrt.org © 2020 IJCRT | Volume 8, Issue 2 February 2020 | ISSN: 2320-2882
IJCRT2002040 International Journal of Creative Research Thoughts (IJCRT) www.ijcrt.org 309
Table 13
Educational qualification and level of attitude of the sample Respondents
S. no.
Education
Level of attitude
Total High Medium Low
1 Upto PG 3 7 4 14
2 Above PG 10 20 6 36
Total 13 27 10 50
The above Table 13 Inferred at out of 36 respondents in upto PG categories, 10 respondents are
come under the high level, 20 respondents are come under the medium level and remaining 6
respondents are fall under the low level. The following are the hypothesis formulated to test the
relationship between the Education al qualification and level of attitude of the sample respondents.
Degrees of freedom = (r-1) (c-1) = (2-1) (3-1) =2
Calculated value = 7.96
Table value at 5% level = 5.99
Degree of freedom = 2
Since the calculated value is less than Table value, the null hypothesis rejected and the Monthly
income level of the sample respondents influence the level of attitude of the respondents. Therefore,
there is significant relationship between the Educational qualification factor and level of attitude of the
sample respondents.
www.ijcrt.org © 2020 IJCRT | Volume 8, Issue 2 February 2020 | ISSN: 2320-2882
IJCRT2002040 International Journal of Creative Research Thoughts (IJCRT) www.ijcrt.org 310
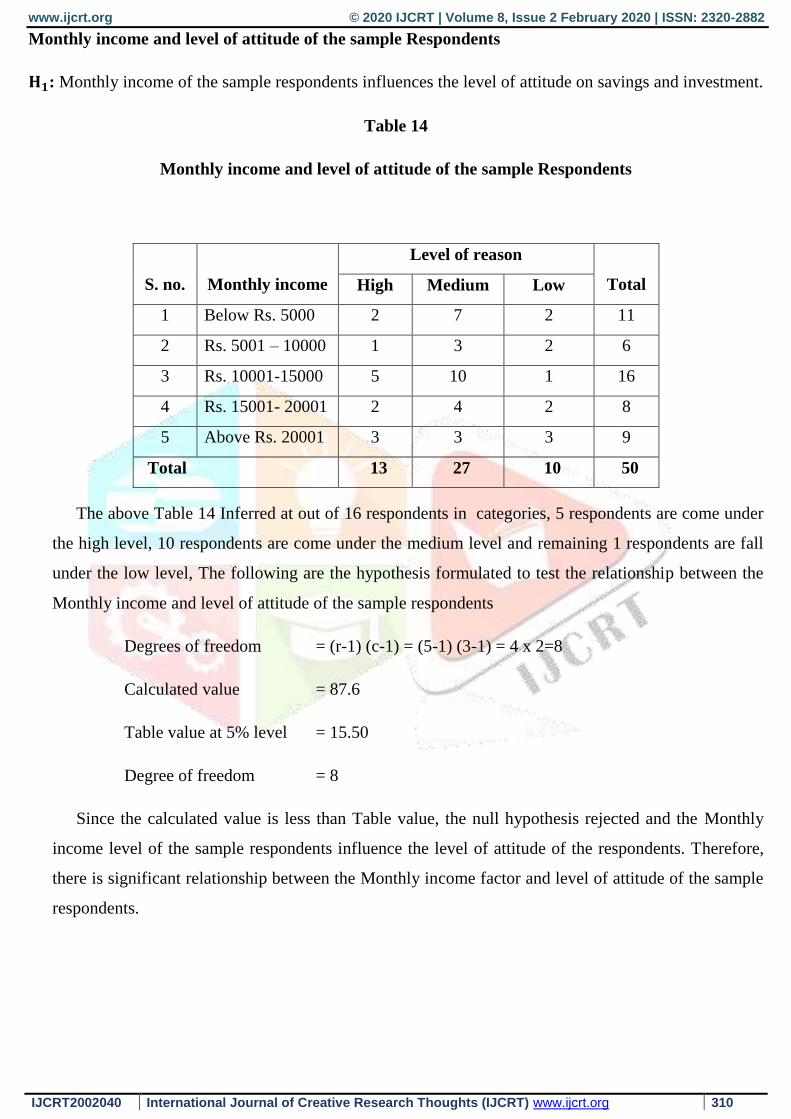
Monthly income and level of attitude of the sample Respondents
𝐇𝟏: Monthly income of the sample respondents influences the level of attitude on savings and investment.
Table 14
Monthly income and level of attitude of the sample Respondents
The above Table 14 Inferred at out of 16 respondents in categories, 5 respondents are come under
the high level, 10 respondents are come under the medium level and remaining 1 respondents are fall
under the low level, The following are the hypothesis formulated to test the relationship between the
Monthly income and level of attitude of the sample respondents
Degrees of freedom = (r-1) (c-1) = (5-1) (3-1) = 4 x 2=8
Calculated value = 87.6
Table value at 5% level = 15.50
Degree of freedom = 8
Since the calculated value is less than Table value, the null hypothesis rejected and the Monthly
income level of the sample respondents influence the level of attitude of the respondents. Therefore,
there is significant relationship between the Monthly income factor and level of attitude of the sample
respondents.
S. no.
Monthly income
Level of reason
Total High Medium Low
1 Below Rs. 5000 2 7 2 11
2 Rs. 5001 – 10000 1 3 2 6
3 Rs. 10001-15000 5 10 1 16
4 Rs. 15001- 20001 2 4 2 8
5 Above Rs. 20001 3 3 3 9
Total 13 27 10 50

www.ijcrt.org © 2020 IJCRT | Volume 8, Issue 2 February 2020 | ISSN: 2320-2882
IJCRT2002040 International Journal of Creative Research Thoughts (IJCRT) www.ijcrt.org 311
CONCLUSION:
Savings and proper investment is important for every human life. Individual investor’s investments
are backed by benefits and money. They need safety and reliability for their investments. Self-finance
Colleges assistant professors savings and invest their money in safer environment, need regular
income from their investment made with lower risk. The respondents are more avenues about various
investments bank deposed, post office RD, NSC, recurring and fixed deposits, insurance police,
government securities i.e. RPF, KGID, PE GPF/PPF small savings bank deposited like a savings. It is
evident from the study that most of the assistant professors are considered safety for selecting the
mode of saving and Bank deposits was considered as the main option of the investment.
Reference
Bindu PK (2017) “Analysis of Investment pattern of college teachers in Kerala”: International Journal of
Advanced Research and Development, 2017: 2 (2): 87-89
Chitra S and Malarvizhi M (2018) “Savings and Investment Pattern of Lecturers in Theni District”:
International Journal of Research Culture Society, 2018: 2 (2)
Jeyakumari J.J & soundaravalli S.V (2015) “A study on saving and investment pattern of college
teachers with reference to thanjavur City Corporation”: Intercontinental Journal of Finance
Research Review, 2015: 3(9): 1-9
Manasi Kulkarni (Killedar) & Rawal (2016) “Investment Patterns of College Teachers With Respect
To Navi-Mumbai city”: International Research Journal of Multidisciplinary Studies, 2016: 1 (5):
1-13
Meenakshi chaturvedi & Shruti khare (2012) “Study of Saving Pattern and Investment Preferences of
Individual Household in India”: International Journal of Management and Social Studies, 2012: 3
(5): 115-121
Nallakannu M & Selvaraj V.M (2018) “Saving and Investment Pattern of College Teachers”:
International Journal of Management Studies, 2018; V (1(1)): 13-19
Umamaheswari S & Ashok Kumar M (2013) “A Study on Investment Pattern and Awareness of
Salaried Class Investors in Coimbatore District”: Paripex - Indian Journal of Research, 2013: 2
(9): 31-34
Yasodha M & Ravindran G (2015) “Savings and Investment Pattern of Teachers Working in Arts and
Science Colleges in Coimbatore District”: International Journal of Science and Research (IJSR),
2015: 6 (6): 1975-1979

www.ijcrt.org © 2020 IJCRT | Volume 8, Issue 2 February 2020 | ISSN: 2320-2882
IJCRT2002040 International Journal of Creative Research Thoughts (IJCRT) www.ijcrt.org 312
Website reference:
https://www.econlib.org
http://www.nsiindia.gov.in/InternalPage.aspx?Id_Pk=53