Embed Size (px)
Citation preview
IRJC
International Journal of Social Science & Interdisciplinary Research
Vol.1 Issue 8, August 2012, ISSN 2277 3630
ww
w.in
dia
nre
sear
chjo
urn
als.
com
6
1
A STUDY ON SERVICE QUALITY MEASUREMENT AND ITS IMPACT
IN OPTING INSURANCE COMPANIES
DR. D.H. MALINI*
*Assistant Professor,
Department of Management,
Pondicherry University,
P.K. College of Education Campus
Nehru Nagar, Karaikal Campus-609605.
ABSTRACT
Insurance is a policy from a large financial institution that offers a person, company, or other
entity reimbursement or financial protection against possible future losses or damages. The
meaning of insurance is important to understand for anybody that is considering buying an
insurance policy or simply understanding the basics of finance. Insurance is a hedging instrument
used as a precautionary measure against future contingent losses. This instrument is used for
managing the possible risks of the future. Insurance is bought in order to hedge the possible risks
of the future which may or may not take place. This is a mode of financially insuring that if such
an incident happens then the loss does not affect the present well-being of the person or the
property insured.
The purpose of this study is to evaluate customers‘ general expectation and perception of insurers
in terms of Services offered at the insurance service measurement and its impact. Thus, results of
this study underscore the need for insurance providers to gear customer service and quality
improvement efforts towards components of reliability. The study intends to promote a better
theoretical understanding and recognition of the complexities to service quality and its
measurement. Today, insurance companies in India competing each other by providing exclusive
services. But the challenges for insurance sector in India remains the same that is to bring
innovative services to clients while making them realize the value of those services provided.
When clients realize that quality is something that cannot be compromised, an organization has to
survive in the competitive market while managing high value service.
KEYWORDS: Insurance, Service, Broking.
______________________________________________________________________________
INTRODUCTION
The insurance industry faces numbers of challenge and a unique roadblock to build loyal and
quality customer relationships. The biggest challenge in the insurance industry face is meeting
customer expectations for faster, better service in the face of rising loss cost and increasing price
competition. According to Benchmark Portal, customer service operations in the insurance are a
liability to their organizations, operating neither efficiently nor effectively. Bad experience with a
customer service counter employee lead to public terminates their relationship with the company.
IRJC
International Journal of Social Science & Interdisciplinary Research
Vol.1 Issue 8, August 2012, ISSN 2277 3630
ww
w.in
dia
nre
sear
chjo
urn
als.
com
6
2
According to any reports about services, increasing self-service capabilities in the insurance
industry leads to an increase in customer service counter activity. There is a statistical link
between employee behaviour and customer satisfaction. These facts are beginning to resonate
with insurance companies, who are investing in customer relationship management and self-
technologies designed to build customer loyalty and customer centricity.
The term quality is difficult to define impartially. In service there is a humanistic quality
approach, at the one extreme stressing customers, personnel, leadership and culture, whereas at
the other end lies a technical approach concerning operations management, statistics and methods
of measurement. (Gummerson, 1992)
They quality is divided into input and output Lehtinen and Lehtinen (1991). The output consists
of total service offering in terms of quality, and the input includes both tangibles and intangibles
elements. The output in the form of quality is what the customer in fact pays for, which is to a
large extent intangible and may be difficult to quantify (Adam et al., 1995). Service quality is not
the slippery, mystical, or amorphous concept it is often thought to be.
Customers will give an institution high mark for its service when it meets or exceeds their service
desires. The five dimensions of service performance (tangibles, reliability, responsiveness,
assurance and empathy) give direction to the service quality journey. Although these dimensions
will be differently important to various market segments, on an overall basis, they all are
important. As a group, they frame the essence of the service quality mandate to be excellent in
service, seek to be excellent in tangibles, reliability, responsiveness, assurance and empathy
(Berry et al., 1989).
Service quality is generally defined as customer perceived quality which stresses the individual‘s
assessment of the value of the total service offering (Gummesson, 1992). Practically, Gronroos
(1998) described perceived service quality as the difference between expected service quality and
experienced service quality. This has a link to the gap model
(Parasuraman et al., 1985) and other service quality models (e.g. Bitner 1990). On the other hand,
Berry et al (1985) divided service quality into two types: regular services, and handling of
exceptions or problems to ensure that appropriate procedures are taken to deal with inevitable
failures. As regards to service quality, the individual‘s experience of a service forms the basis of
an assessment of its quality. It is great to listen to customers and study their reactions. When
purchasing services, customers‘ attention is often limited to a small number of tangible inputs
(Zeithaml, 1984). Physical environment include buildings, offices and interior design affects
customer beliefs, attitudes and satisfaction Zeithaml and Bitner, 2000), and provides an
opportunity to tell the ‗right‘ story about a given service (Berry et al., 1989). Matters such as how
contact personnel dresses, articulates, writes, designs and presents proposals are likewise not
without meaning (Levitt, 1981). Tangibilising the intangibles is important, because customers do
not usually know what they are getting until they do not get it (Levitt, 1981). As tangible input,
the service personnel represent the service, the organization and the marketers in the customers‘
eyes (Zeithmal and Bitner, 1996). The quality management of personnel includes such things as
motivating, managing information, training, career planning and recruiting and retaining of right
people (Normann, 1991); Zeithaml and Britner, 1996). It is true that service business is
IRJC
International Journal of Social Science & Interdisciplinary Research
Vol.1 Issue 8, August 2012, ISSN 2277 3630
ww
w.in
dia
nre
sear
chjo
urn
als.
com
6
3
personnelintensive, meaning that quality supplied to the customer is essentially a result of the way
personnel perform (Normann, 1991). Schneider (1990) showed that both employees and
customers will experience more positive outcomes when the organization operates with a
customer service orientation and management supports it.
OBJECTIVES
The project was conducted after taking into consideration the changing face of the Insurance
sector. The objective for conducting this project was
To understand the market expectations on Insurance companies.
To learn Insurance and Insurance Broking in India.
To identify the service parameters of Insurance Brokers.
To know the preference of Insurance products in related to clients‘ category wise and
products category wise.
To identify the satisfaction level of clients with regard to claim services of Insurance
Brokers.
NEED OF THE STUDY
In India at present there are 23 general Insurance companies which are registered under IRDA
Regulations. The present market prevails tough competition between these Insurance companies
to increase the sales growth. Insurance companies generate moreover 80% of their sales through
insurance brokers. Therefore, there is a need to study what aspects and norms do an Insurance
broker consider from an Insurance company before suggesting Insurance policies for their clients.
SCOPE OF THE STUDY
The study is aimed to understand and analyze the preference of Regional Insurance Brokers in
selecting an Insurance company for their clients. The study is confined to elicit the opinion of
these groups in Chennai City only.
LIMITATIONS
A real time survey in Chennai city with the total sample size of 32 brokers has been taken but
the study would have been much better if the data was collected throughout India from the
total sample size of 255 Insurance Brokers in India.
Tough to fix appointments with Insurance Brokers because of their tight schedule as many
Insurance policies are renewed at the financial year ending.
Getting accurate responses from the respondents due to their inherent problems is difficult.
They may be partial or refuse to co-operate.
IRJC
International Journal of Social Science & Interdisciplinary Research
Vol.1 Issue 8, August 2012, ISSN 2277 3630
ww
w.in
dia
nre
sear
chjo
urn
als.
com
6
4
RESEARCH METHODOLOGY
RESEARCH DESIGN
The research method adopted for this study is Descriptive. Descriptive research includes surveys
and fact finding of different types of research problems. The objective of the study is to
understand the preference on Insurer among regional brokers and to suggest the Insurance
companies to gain more market share. Quantitative research was employed in the present study.
In the present study the research steps applied were in accordance with scientific research design
Bodgan and Biklen (1982). According to his study the data collected was based on a
predetermined instrument and the objectives developed prior research. The purpose of this
research project is to determine the importance quality of service provided by the insurance
brokers in selecting insurance companies from the customer viewpoints.
SOURCES OF DATA
The data is a collected through primary and secondary data in the field. It examines perception
and expectations in terms of service. The variables under study are neither controlled nor
manipulated.
PRIMARY DATA
Primary data have been collected from the people in two ways:
Personal Interview
Questionnaire Method
SECONDARY DATA
Secondary data have been collected from the previous researchers and studies in the related study
area. In this study several sources of external data, including periodicals and government
publications of economic indicators. The company‘s websites, books, journals and published
reports printed.
SAMPLE SIZE
Sample sizes of 32 respondents were taken to analyze the Insurance sector and to understand the
changing phase of the Insurance companies.
SAMPLING TECHNIQUE USED
Convenient Sampling
STATISTICAL TOOLS
Percentage analysis
IRJC
International Journal of Social Science & Interdisciplinary Research
Vol.1 Issue 8, August 2012, ISSN 2277 3630
ww
w.in
dia
nre
sear
chjo
urn
als.
com
6
5
Chi-square Method
Weighted Average Method
Correlation analysis
Ranking Method
Insurance is a system of spreading the risk of one onto the shoulders of many. While it becomes
somewhat impossible for a man to bear by himself 100% loss to his own property or interest
arising out of an unforeseen contingency, insurance is a method or process which distributes the
burden of the loss on a number of persons within the group formed for this particular purpose.
Basic Human trait is to be averse to the idea of risk taking. In Insurance whether life or non-life, it
provides people with a reasonable degree of security and assurance that they will be protected in
the event of a calamity or failure of any sort. Insurance may be described as a social device to
reduce or eliminate risk of loss to life and property. Under the plan of insurance, a large number
of people associate themselves by sharing risks attached to individuals. The risks, which can be
insured against, include fire, the perils of sea, death and accidents and burglary. Any risk
contingent upon these, may be insured against at a premium commensurate with the risk involved.
Thus collective bearing of risk is insurance.
WHY INSURANCE BROKERS WERE BROUGHT INTO THE INDIAN INSURANCE
Govt. of India decided to embark on economic reforms in the 1990s. The command and control
economy gradually gave way to market economy in sector after sector, including the financial
sector which comprised ―Insurance‖ sector. Various reforms were initiated in the financial sector.
The economy responded positively to the reforms. Competition in the manufacturing sector
geared it up to invest in technology, restructure its operations, reduce cost, achieve improved
productivity, and bring quality of products to international standards. Newspaper Articles started
highlighting the success stories of several enterprises in the Open Market Indian Economy to
demonstrate what could be achieved in a liberalized market economy.
Along with financial sector reforms, there were many reform measures by the Govt. for the
insurance sector. Insurance Sector Reform Measures initiated by the Government were based on
the Report of the Malhotra Committee, which submitted its Report in 1994.
ACCEPTABILITY OF INSURANCE BROKERS IN THE INDIAN MARKET
Brokers as intermediaries are still not wholly acceptable for the corporate or individual clients in
India. Unhealthy competition in the market has also affected the professional image of brokers.
Most of the brokers still do not have professional expertise and their ostrich like attitudes of not
owning up their deficiencies in their mindset and the poor morale of the staff would act as huge
barriers to their perceived strategic strengths at the market place.
IRJC
International Journal of Social Science & Interdisciplinary Research
Vol.1 Issue 8, August 2012, ISSN 2277 3630
ww
w.in
dia
nre
sear
chjo
urn
als.
com
6
6
SWOT ANALYSIS
A scan of the internal and external environment is an important part of the strategic planning
process. Environmental factors internal to the firm usually can be classified as strengths (S) or
weaknesses (W), and those external to the firm can be classified as opportunities (O) or threats
(T). Such an analysis of the strategic environment is referred to as a SWOT analysis.
PEST ANALYSIS
A scan of the external macro-environment in which the firm operates can be expressed in terms of
the following factors:
Political
Economic
Social
Technological
The acronym PEST (or sometimes rearranged as "STEP") is used to describe a framework for the
analysis of these macro environmental factors.
4 I’S OF INSURANCE SERVICE:
The 4 I‟ s refers to the different dimensions/ characteristics of any service. Unlike pure
product, services have its own characteristics and its related problems. So the service provider
needs to deal with these problems accordingly. The service provider has to design different
strategies according the varying feature of the service. These 4 I‟ s not only represent the
characteristics of different services but also the problems and advantages attached to it.
These 4 I‟ s can be broadly classified as:
• Intangibility
• Inconsistency
• Inseparability
• Inventory
DATA ANALYSIS
PREFERENCE ON INSURER AMONG REGIONAL BROKERS
INSURANCE BROKERS
IRJC
International Journal of Social Science & Interdisciplinary Research
Vol.1 Issue 8, August 2012, ISSN 2277 3630
ww
w.in
dia
nre
sear
chjo
urn
als.
com
6
7
The first set of broking licenses were issued in January 2003 and expectations were naturally high
as stakeholders in the industry anticipated a paradigm shift in the way Insurance was being bought
and sold. While analyzing the role of insurance brokers, the following details furnishes the
preference on Insurer among regional Brokers
Indian Broking Industry – Some quick statistics - Growth in numbers
If we look at the statistics pertaining to the growth of insurance brokers in India, we find that as
against forty brokers as on 31st March, 2003 (when the broking industry was born), we now have
255 insurance brokers (as on April 2011).
A real time survey has been taken with the total Sample size of 32 Insurance Brokers in the
Chennai city to analyze the Preference on Insurer among Regional Brokers. Data analysis of my
report is as follows:-
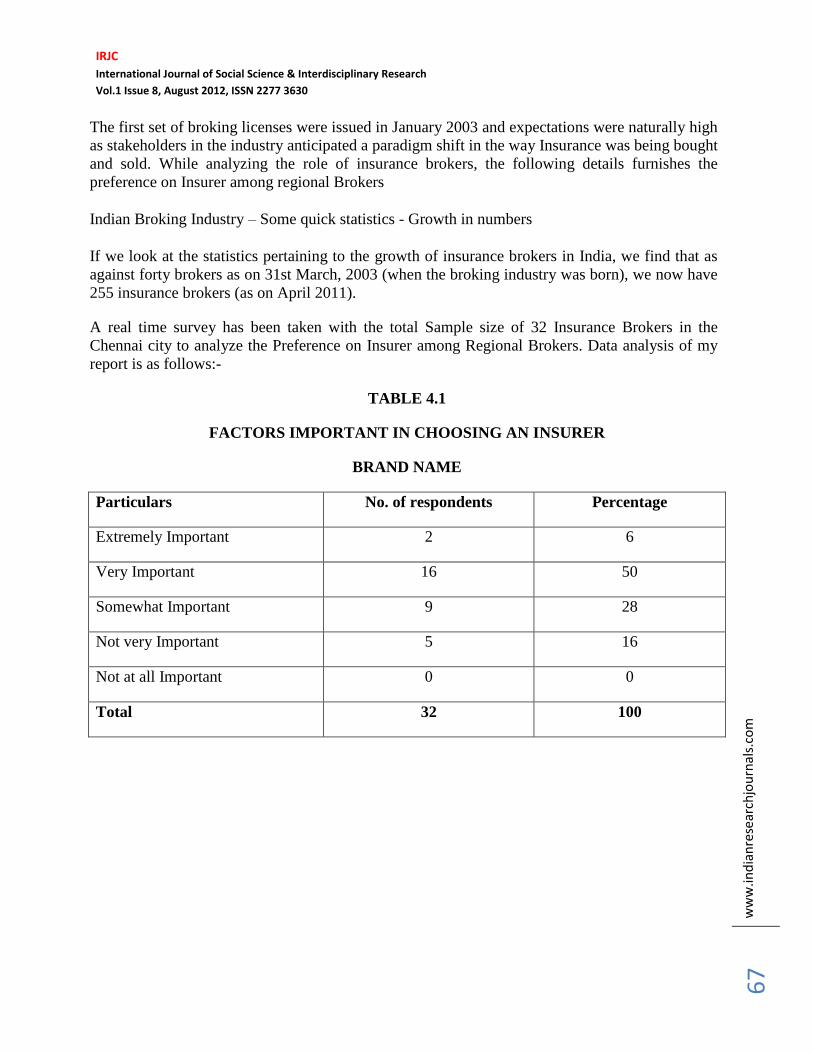
TABLE 4.1
FACTORS IMPORTANT IN CHOOSING AN INSURER
BRAND NAME
Particulars No. of respondents Percentage
Extremely Important 2 6
Very Important 16 50
Somewhat Important 9 28
Not very Important 5 16
Not at all Important 0 0
Total 32 100

IRJC
International Journal of Social Science & Interdisciplinary Research
Vol.1 Issue 8, August 2012, ISSN 2277 3630
ww
w.in
dia
nre
sear
chjo
urn
als.
com
6
8
INFERENCE
From the above table, the majority (50%) of the respondents expressed as the brand of the
Insurer is very important and only 6% tells as its extremely important. From this it is evident that
Brokers are not considering the brand name as most to suggest their clients.
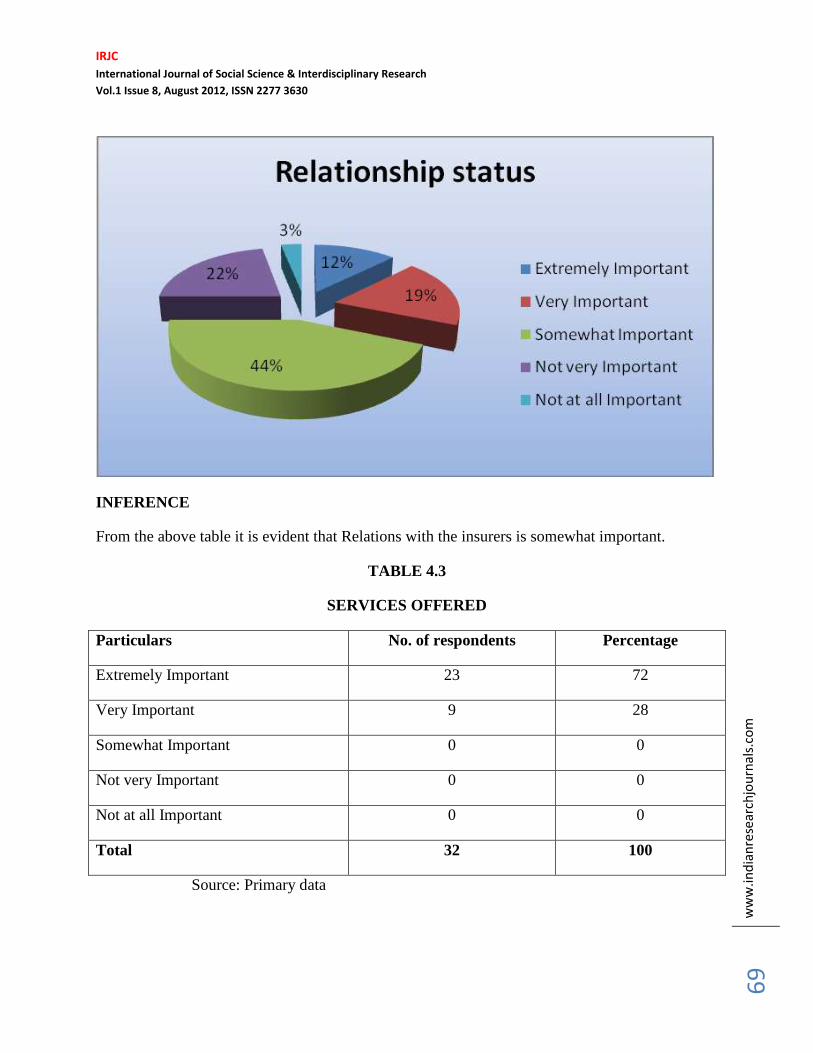
TABLE 4.2
RELATIONSHIP STATUS
Particulars No. of respondents Percentage
Extremely Important 4 13
Very Important 6 19
Somewhat Important 14 44
Not very Important 7 22
Not at all Important 1 3
Total 32 100
Source: Primary Data
IRJC
International Journal of Social Science & Interdisciplinary Research
Vol.1 Issue 8, August 2012, ISSN 2277 3630
ww
w.in
dia
nre
sear
chjo
urn
als.
com
6
9
INFERENCE
From the above table it is evident that Relations with the insurers is somewhat important.
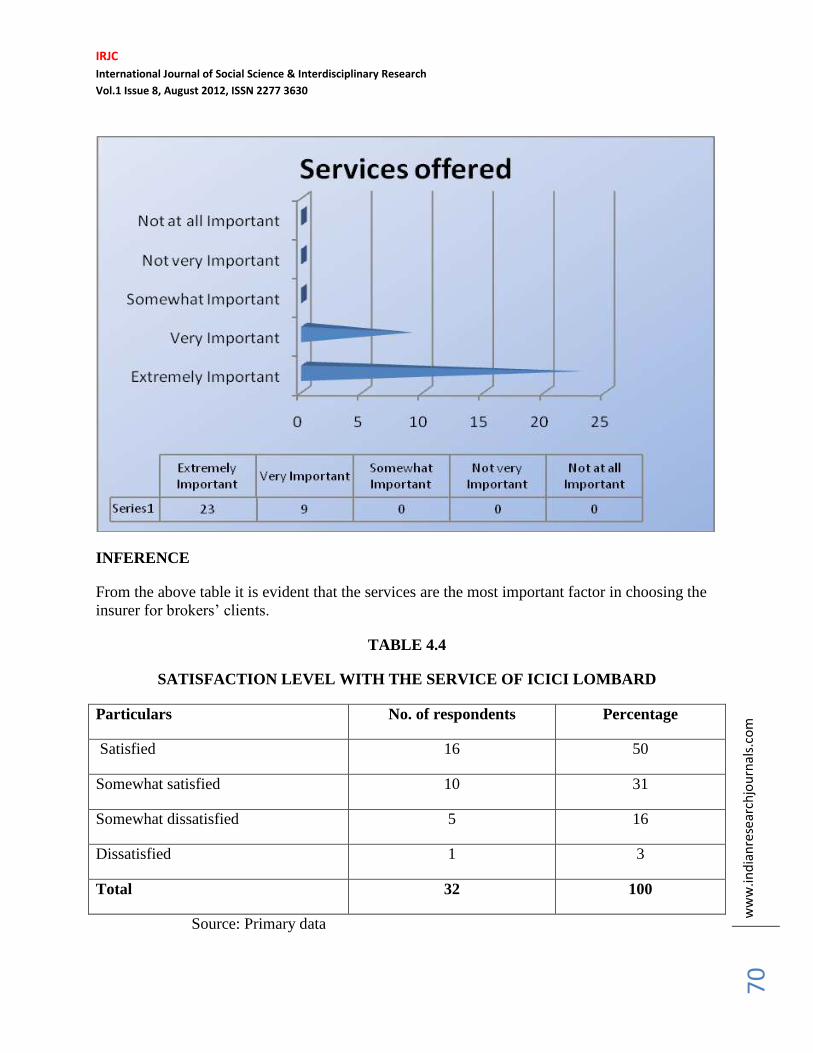
TABLE 4.3
SERVICES OFFERED
Particulars No. of respondents Percentage
Extremely Important 23 72
Very Important 9 28
Somewhat Important 0 0
Not very Important 0 0
Not at all Important 0 0
Total 32 100
Source: Primary data
IRJC
International Journal of Social Science & Interdisciplinary Research
Vol.1 Issue 8, August 2012, ISSN 2277 3630
ww
w.in
dia
nre
sear
chjo
urn
als.
com
7
0
INFERENCE
From the above table it is evident that the services are the most important factor in choosing the
insurer for brokers‘ clients.
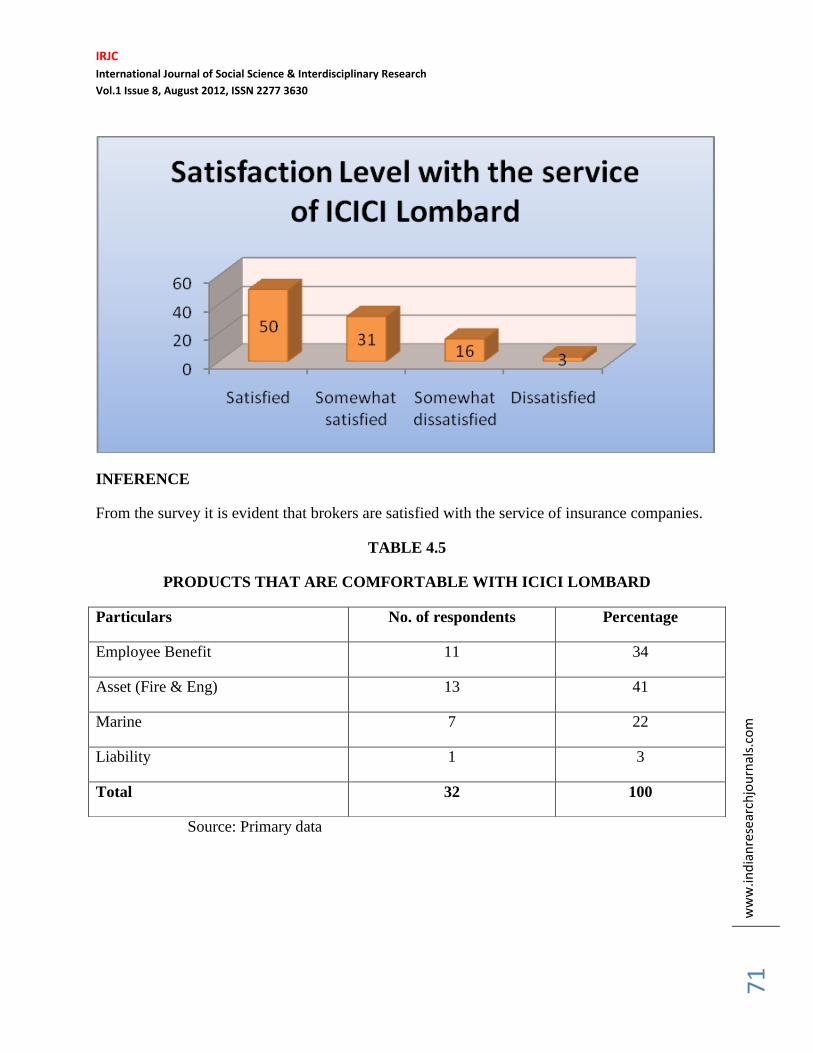
TABLE 4.4
SATISFACTION LEVEL WITH THE SERVICE OF ICICI LOMBARD
Particulars No. of respondents Percentage
Satisfied 16 50
Somewhat satisfied 10 31
Somewhat dissatisfied 5 16
Dissatisfied 1 3
Total 32 100
Source: Primary data
IRJC
International Journal of Social Science & Interdisciplinary Research
Vol.1 Issue 8, August 2012, ISSN 2277 3630
ww
w.in
dia
nre
sear
chjo
urn
als.
com
7
1
INFERENCE
From the survey it is evident that brokers are satisfied with the service of insurance companies.
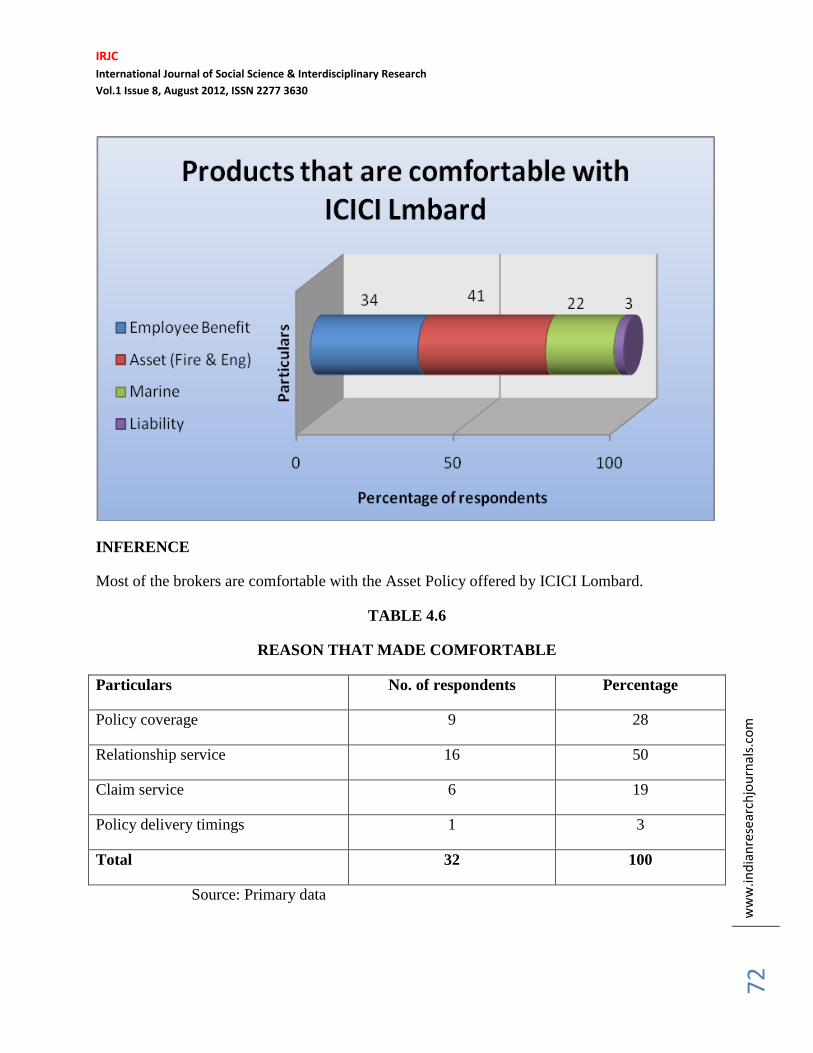
TABLE 4.5
PRODUCTS THAT ARE COMFORTABLE WITH ICICI LOMBARD
Source: Primary data
Particulars No. of respondents Percentage
Employee Benefit 11 34
Asset (Fire & Eng) 13 41
Marine 7 22
Liability 1 3
Total 32 100
IRJC
International Journal of Social Science & Interdisciplinary Research
Vol.1 Issue 8, August 2012, ISSN 2277 3630
ww
w.in
dia
nre
sear
chjo
urn
als.
com
7
2
INFERENCE
Most of the brokers are comfortable with the Asset Policy offered by ICICI Lombard.
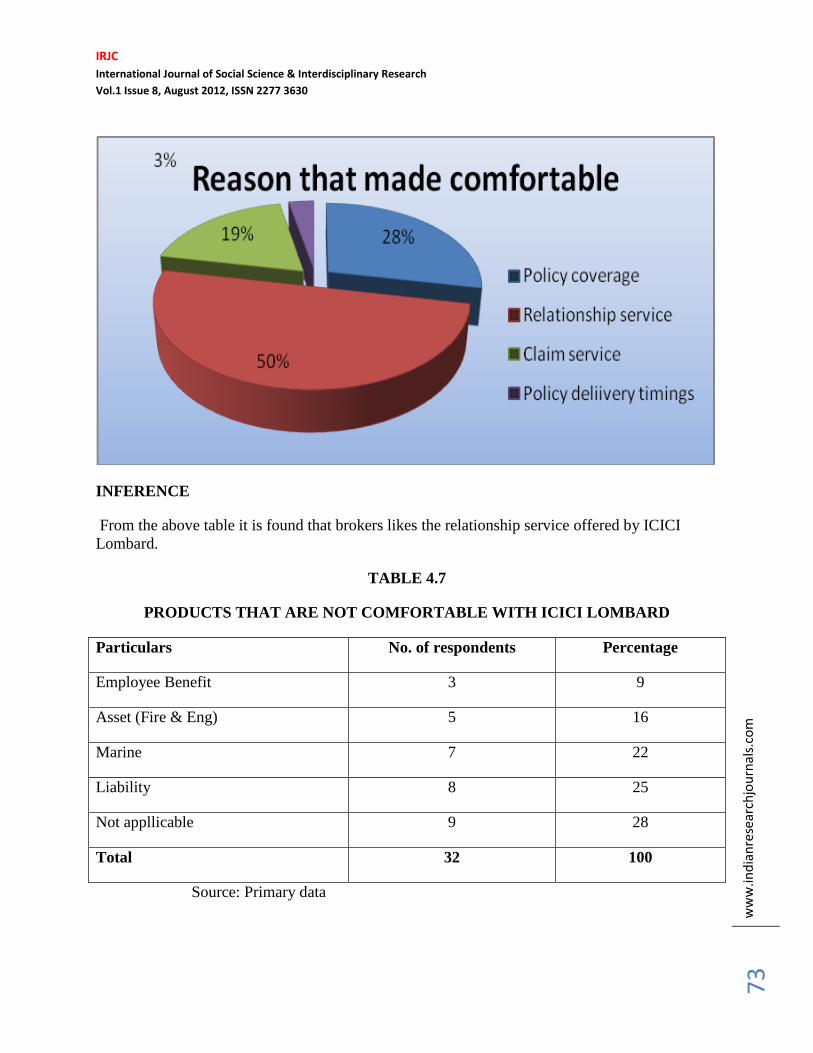
TABLE 4.6
REASON THAT MADE COMFORTABLE
Particulars No. of respondents Percentage
Policy coverage 9 28
Relationship service 16 50
Claim service 6 19
Policy delivery timings 1 3
Total 32 100
Source: Primary data
IRJC
International Journal of Social Science & Interdisciplinary Research
Vol.1 Issue 8, August 2012, ISSN 2277 3630
ww
w.in
dia
nre
sear
chjo
urn
als.
com
7
3
INFERENCE
From the above table it is found that brokers likes the relationship service offered by ICICI
Lombard.
TABLE 4.7
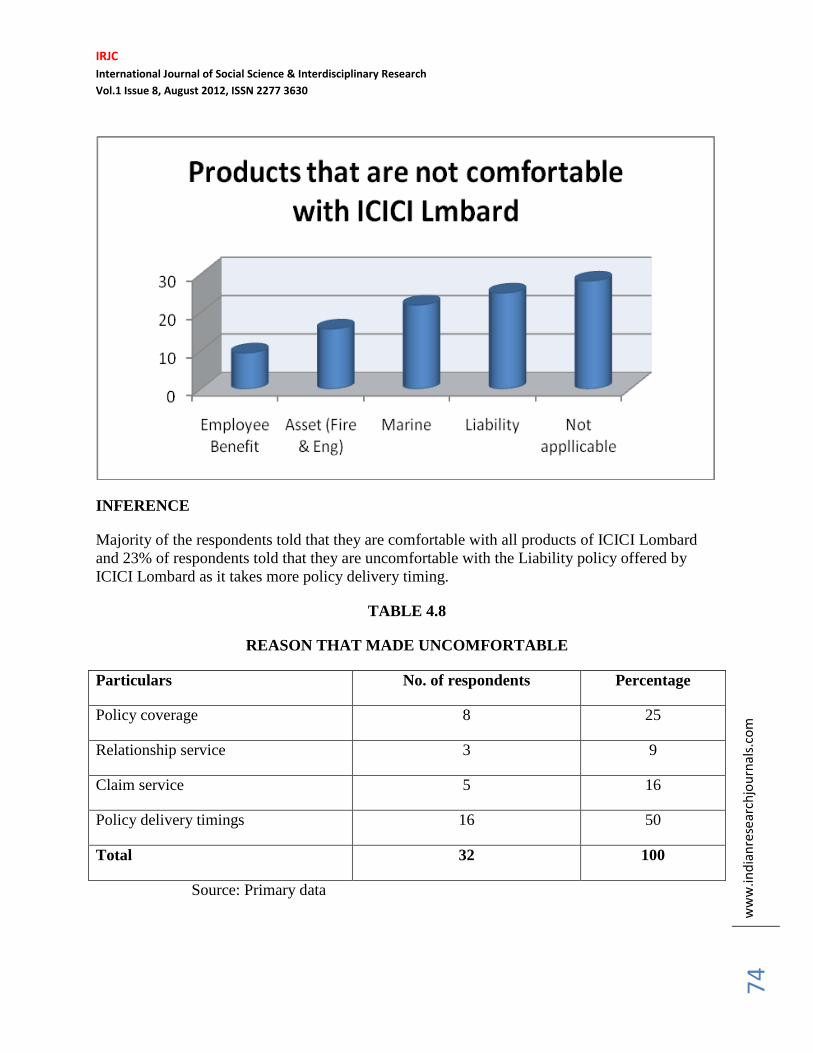
PRODUCTS THAT ARE NOT COMFORTABLE WITH ICICI LOMBARD
Particulars No. of respondents Percentage
Employee Benefit 3 9
Asset (Fire & Eng) 5 16
Marine 7 22
Liability 8 25
Not appllicable 9 28
Total 32 100
Source: Primary data
IRJC
International Journal of Social Science & Interdisciplinary Research
Vol.1 Issue 8, August 2012, ISSN 2277 3630
ww
w.in
dia
nre
sear
chjo
urn
als.
com
7
4
INFERENCE
Majority of the respondents told that they are comfortable with all products of ICICI Lombard
and 23% of respondents told that they are uncomfortable with the Liability policy offered by
ICICI Lombard as it takes more policy delivery timing.
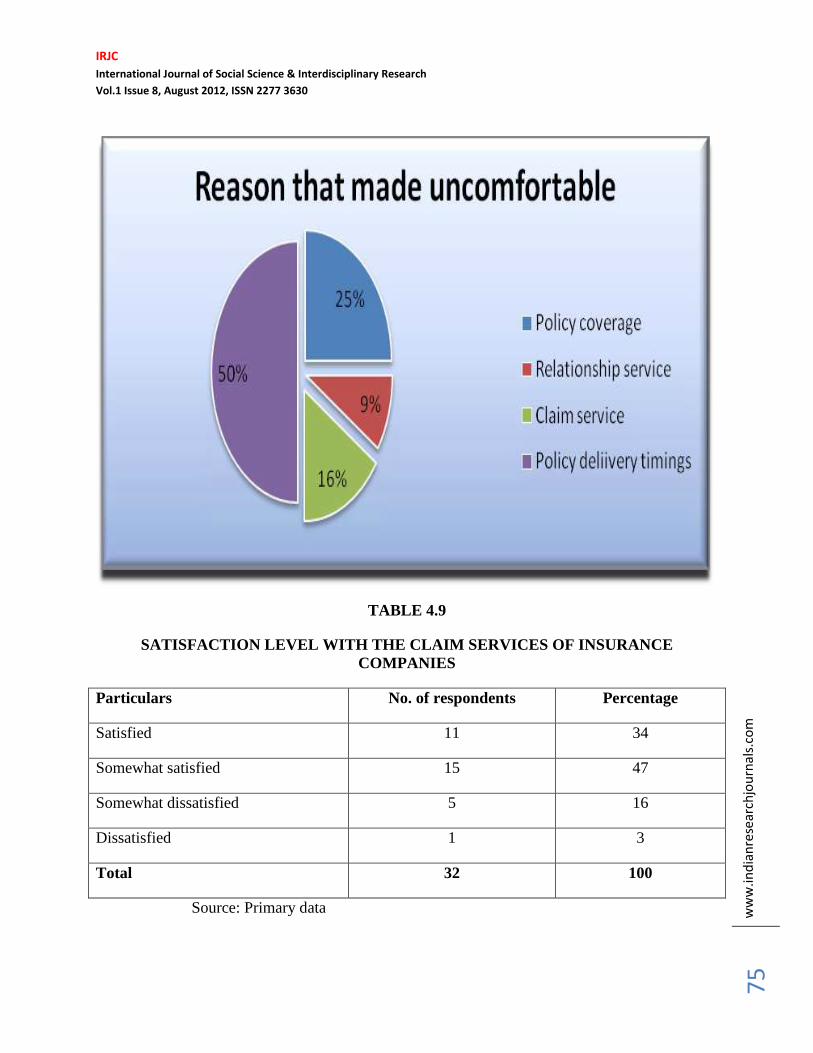
TABLE 4.8
REASON THAT MADE UNCOMFORTABLE
Particulars No. of respondents Percentage
Policy coverage 8 25
Relationship service 3 9
Claim service 5 16
Policy delivery timings 16 50
Total 32 100
Source: Primary data
IRJC
International Journal of Social Science & Interdisciplinary Research
Vol.1 Issue 8, August 2012, ISSN 2277 3630
ww
w.in
dia
nre
sear
chjo
urn
als.
com
7
5
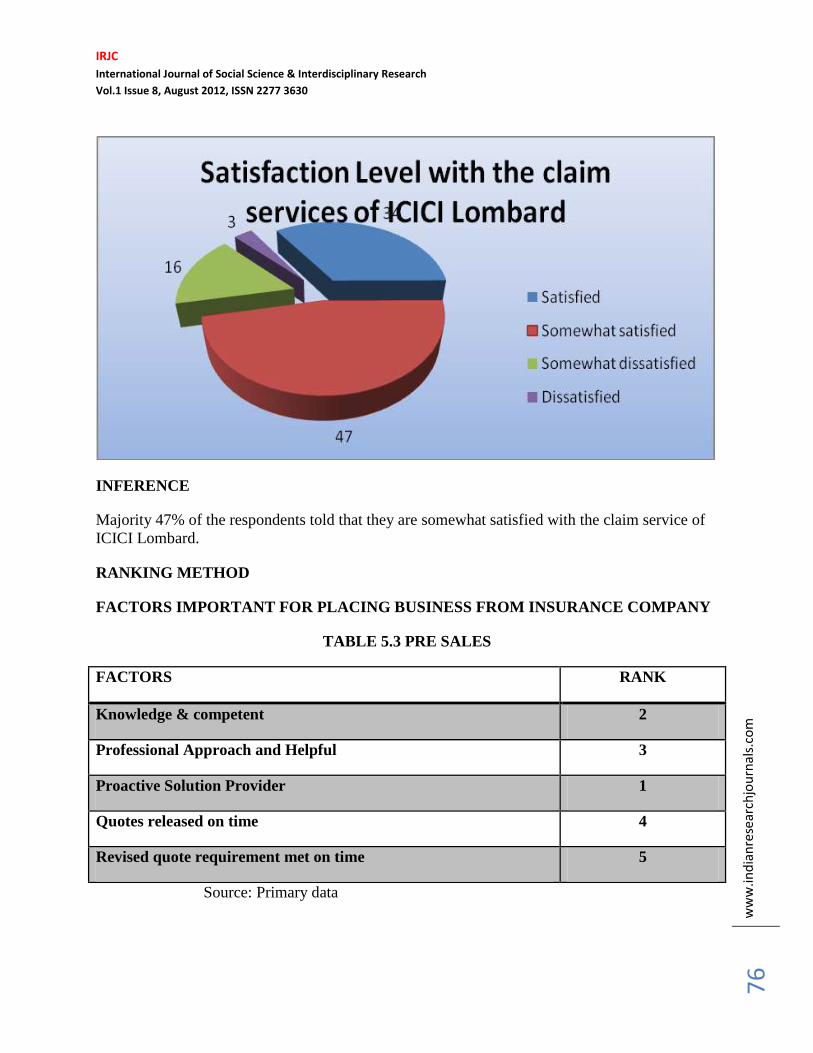
TABLE 4.9
SATISFACTION LEVEL WITH THE CLAIM SERVICES OF INSURANCE
COMPANIES
Particulars No. of respondents Percentage
Satisfied 11 34
Somewhat satisfied 15 47
Somewhat dissatisfied 5 16
Dissatisfied 1 3
Total 32 100
Source: Primary data
IRJC
International Journal of Social Science & Interdisciplinary Research
Vol.1 Issue 8, August 2012, ISSN 2277 3630
ww
w.in
dia
nre
sear
chjo
urn
als.
com
7
6
INFERENCE
Majority 47% of the respondents told that they are somewhat satisfied with the claim service of
ICICI Lombard.
RANKING METHOD
FACTORS IMPORTANT FOR PLACING BUSINESS FROM INSURANCE COMPANY
TABLE 5.3 PRE SALES
FACTORS RANK
Knowledge & competent 2
Professional Approach and Helpful 3
Proactive Solution Provider 1
Quotes released on time 4
Revised quote requirement met on time 5
Source: Primary data
IRJC
International Journal of Social Science & Interdisciplinary Research
Vol.1 Issue 8, August 2012, ISSN 2277 3630
ww
w.in
dia
nre
sear
chjo
urn
als.
com
7
7
INFERNCE
From the analysis it is evident that Proactive solution provider is mostly preferable from
respondents from an insurance company to place their business with them.
TABLE: 5.6 POST SALES
FACTORS RANK
Policy Issued as per TAT(Turnaround time) 2
Policy Issued as per Quote 1
Source: Primary data
INFERENCE
Insurance brokers expect the policy issued as per quote service after sales in majority from an
Insurance company.
CUSTOMER SERVICE
TABLE: 9
FACTORS RANK
Error Free Endorsements at regular intervals 3
Prompt Survey done and Claim settled 1
Cashless arranged 4
Re-imbursement settled on time 5
Query letter sent on time and handled properly 2
Source: Primary data
INFERENCE
From the analysis it is evident that Prompt Survey done and Claim settled is mostly preferable
from respondents from an insurance company to place their business with them.
IRJC
International Journal of Social Science & Interdisciplinary Research
Vol.1 Issue 8, August 2012, ISSN 2277 3630
ww
w.in
dia
nre
sear
chjo
urn
als.
com
7
8
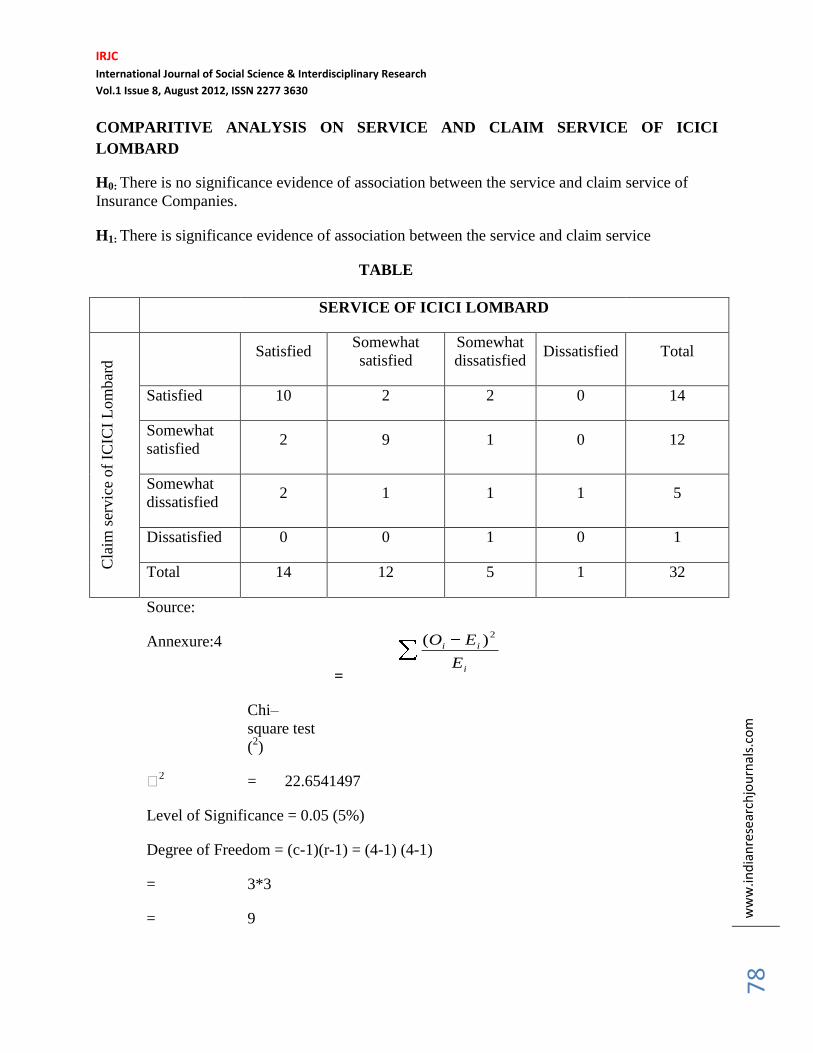
COMPARITIVE ANALYSIS ON SERVICE AND CLAIM SERVICE OF ICICI
LOMBARD
H0: There is no significance evidence of association between the service and claim service of
Insurance Companies.
H1: There is significance evidence of association between the service and claim service
TABLE
SERVICE OF ICICI LOMBARD
Cla
im s
ervic
e of
ICIC
I L
om
bar
d
Satisfied Somewhat
satisfied
Somewhat
dissatisfied Dissatisfied Total
Satisfied 10 2 2 0 14
Somewhat
satisfied 2 9 1 0 12
Somewhat
dissatisfied 2 1 1 1 5
Dissatisfied 0 0 1 0 1
Total 14 12 5 1 32
Source:
Annexure:4
Chi–
square test
(2)
=
2 = 22.6541497
Level of Significance = 0.05 (5%)
Degree of Freedom = (c-1)(r-1) = (4-1) (4-1)
= 3*3
= 9
i
ii
E
EO2
)(
IRJC
International Journal of Social Science & Interdisciplinary Research
Vol.1 Issue 8, August 2012, ISSN 2277 3630
ww
w.in
dia
nre
sear
chjo
urn
als.
com
7
9
Table value @ 5% significance of 2= 16.919
RESULT
Calculated value of 2
> table value of 2 at 5% of significance, so H0 is rejected.
INFERENCE
The calculated value of c2 is greaterthan table value of c2 at 5% of significance. Therefore, H0 is
rejected and H1 is accepted. It means that there is significance evidence of association between
the service and claim service of Insurance companies.
FINDINGS
Professional Approach and Helpful is the most preferable parameter which Insurance
Brokers considers from an Insurance company before sales for placing business apart
from pricing.
Policy issued as per quote ranks first and Policy issued as per Turnaround time ranks
second in expectation of Brokers from the insurance companies whom they have placed
business for their clients. A smooth relationship prevails between Brokers and Insurers if
the policy is issued as per what given in quote.
Prompt survey done and claim settled by the Insurance company plays an important role
to rank Insurance Company the best.
It is not the competitive quote prepared by the Insurer is counted for retaining the Insured
but it‘s the service given by the Insurance company throughout the policy period retains
the customer to the same insurer
In choosing an insurer the brand name of the Insurance Company is not as important
when compared to the relationship service offered by the insurance company.
Majority of the Insurance Brokers are concentrating more on corporate insurance policies
than retail insurance.
Overall relationship between the Insurer and Brokers are good.
Brokers has business placement of 60 - 80% with Public sector Insurance companies for
the financial year 2010-11. Therefore it shows the premium quote of Public sector are
comparatively low when compared with Private sector units.
IRJC
International Journal of Social Science & Interdisciplinary Research
Vol.1 Issue 8, August 2012, ISSN 2277 3630
ww
w.in
dia
nre
sear
chjo
urn
als.
com
8
0
Majority 76% of the respondents are comfortable with Employee benefit products offered
by ICICI Lombard. The reason is they like the policy coverage and relationship service of
the company.
25% of the brokers responded that they are not comfortable with Liability policy of ICICI
Lombard as it takes more turnaround time for the delivery of policy and claim settlement.
It is because ICICI Lombard has tie up with only GIC for its reinsurance.
50% of the respondents are satisfied with the service of ICICI Lombard.
47% of the respondents are somewhat satisfied with the claim service of ICICI Lombard.
SUGGESTIONS
Quote participation should be there between Insurance Company and Insurance brokers.
For better relationship with brokers the Insurance Company should route the policy
documents through brokers.
Interaction after quote is necessary for Insurance Company to get more business through
Brokers.
Frequent change of employees should be made less in Insurance companies as the
brokers are finding difficult to maintain relationship with Insurers during claims period.
Private players should provide more coverage with competitive premium to get more
market share compared with public sector units.
CONCLUSION
Competition will surely cause the market to grow beyond current rates, create a bigger "pie," and
offer additional consumer choices through the introduction of new products, services, and price
options. Yet, at the same time, public and private sector companies will be working together to
ensure healthy growth and development of the sector. Challenges such as developing a common
industry code of conduct, contributing to a common catastrophe reserve fund, and chalking out
agreements between insurers to settle claims to the benefit of the consumer will require
concerted effort from both sectors.
The market is now in an evolving phase where one can expect a lot of actions in coming days.
The current impediments for foreign participation – like 26% equity cap on foreign partner, ill
defined regulatory role of IRDA (Insurance Regulatory development Authority the watchdog of
the industry) in pension business etc.—are expected to be removed in near future. The early-
adopters will then have a clear advantage compared to laggards in gaining the market share and
market leadership. The will need to make sure right now that their entire infrastructure is in place
so that they can reap the benefit of an "unlimited potential."

IRJC
International Journal of Social Science & Interdisciplinary Research
Vol.1 Issue 8, August 2012, ISSN 2277 3630
ww
w.in
dia
nre
sear
chjo
urn
als.
com
8
1
REFERENCES
Grace, Martin and Julie Hotchkiss, ―External Impacts on the Property-Liability Insurance
Cycle‖, Journal of Risk and Insurance 62, 738-754.
Harrington, Scott E., 1988, ―Prices and Profits in The Liability Insurance Market‖, in Robert
Litan and Clifford Winston, eds,. Liability: Perspectives and Policy, Washington, D.C.: The
Brookings Institution.
Froot, Kenneth and Jeremy Stein, 1998, ―Risk Management, Capital Budgeting, and Capital
Structure Policy for Financial Institutions: An Integrated Approach‖, Journal of Financial
Economics 47, 55-82.
Doherty, Neil A. and James Garven. 1995, ―Insurance Cycles: Interest Rates and the Capacity
Constraint Model‖, Journal of Business 68, 383-404.
Myers, Stewart C., and Richard A. Cohn, 1986, ―A Discounted Cash Flow Approach To
Property-Liability Insurance Rate Regulation,‖ in J. David Cummins and Scott E. Harrington ,
eds. Fair Rate Of Return In Property-Liability Insurance. Boston: Kluwer.
Tort Policy Working Group,1986, Report of the Tort Policy Working Group on the Causes,
Extent, and Policy Implications of the Current Crisis in Insurance Availability and Affordability,
Washington, D.C.: U.S. Department Of Justice.
Smith, Michael, 1989, ―Investment Returns and Yields To Holders Of Insurance‖, Journal Of
Business 62:81-98.
Winter, Ralph A., 1991b, Solvency Regulation and the Property-Liability ―Insurance Cycle,‖
Economic Inquiry 29, 458-471.