Embed Size (px)
Citation preview


A STUDY ON STRESS-STRAIN BEHAVIOUR OF
GRANITE AND SANDSTONE USING CLOSED-CIRCUIT
SERVO-CONTROLLED TESTING MACHINE
RINI ASNIDA BT ABDULLAH
A project report submitted in partial fulfillment
of the requirements for the award of the degree of
Master of Engineering (Civil – Geotechnics)
Faculty of Civil Engineering
Universiti Teknologi Malaysia
MAY, 2006


iii
Buat insan tersayang Sharudin Ismail danpenyeri hidup ini Nabil Ikhwan Sharudin.

iv
ACKNOWLEDGEMENT
Praise to Allah who has made it possible for me to complete this dissertation.
I wish to acknowledge my deepest gratitude to my supervisor, En. Mohd. For
bin Mohd. Amin, for the valuable guide, constructive comments and support
throughout the dissertation making.
My gratefulness is also to En. Abdul Samad bin Mohd. Salleh, En Zulkifly
bin Abdul Wahid and all the technicians of Geotechnical and Engineering Geology
Laboratory for their help and assistance during the experimental work.
Last but not least, I would like to express my deepest appreciation to my
husband, En. Sharudin bin Ismail, for his encouragement, blessing and love, which
are forever remembered.

v
ABSTRACT
The objective of this study is to adopt a fundamental approach towards
understanding the behaviour of granite and sandstone under uniaxial compression.
The study is based on the complete stress-strain curve that represents the rock
deformation under loading at a constant strain rate. Indeed, the complete stress-strain
curve covers the behaviour of rock both at pre- and post-peak failure phases. To
obtain the curve, the compression test need to be carried out using closed-circuit
servo-controlled testing machine, or machine of high stiffness. In this study, a series
of unaxial compressive tests on samples of granite and sandstone were undertaken
using 3000 kN Tinius Olsen servo-controlled testing machine. Based on the
complete stress-strain curves obtained, the deformation behaviour for both rock
types are compared. Parameters being compared include peak strength, strain at
failure and deformational behaviour at pre- and post-peak stages. Study on post
failure behaviour of rock is particularly important in designing excavation, where
rock materials may have been highly fractured or display certain degree of failure.

vi
ABSTRAK
Tujuan kajian ini adalah untuk menyediakan asas ke arah pemahaman sifat-
sifat granit dan batu pasir di bawah mampatan satu paksi. Kajian ini adalah
berdasarkan graf tegasan-terikan lengkap yang menjelaskan ubah bentuk batu di
bawah pembebanan pada kadar terikan yang tetap. Sesungguhnya, graf tegasan-
terikan lengkap ini meliputi sifat-sifat batu di bawah fasa pra- dan pasca-kegagalan.
Bagi memperolehi graf tegasan-terikan lengkap ini, ujian mampatan perlu dijalankan
di bawah kadar terikan yang tetap dengan menggunakan mesin ‘closed-circuit servo-
controlled’ atau mesin dengan pengukuhan yang tinggi. Di dalam kajian ini, satu siri
ujian mampatan satu paksi pada sampel-sampel granit dan batu pasir dijalankan
dengan menggunakan mesin ujian ‘servo-controlled’ Tinius Olsen dengan kapasiti
3000 kN. Berdasarkan graf tegasan-terikan lengkap yang diperolehi, sifat-sifat ubah
bentuk pada kedua-dua jenis batu tersebut dikenalpasti dan dibandingkan.
Parameter-parameter tersebut temasuklah kekuatan puncak, terikan pada kegagalan
dan sifat-sifat ubah bentuk pada fasa pra- dan pasca-kegagalan. Kajian pasca
kegagalan pada batu adalah penting di dalam mereka-bentuk kerja-kerja pengorekan,
di mana sifat-sifat batu yang berkemungkinan mempunyai rekahan atau
menunjukkan darjah kegagalan yang tertentu.

vii
TABLE OF CONTENTS
CHAPTER TITLE PAGE
TITLE i
DECLARATION ii
DEDICATION iii
ACKNOWLEDGEMENT iv
ABSTRACT v
ABSTRAK vi
TABLE OF CONTENTS vii
LIST OF FIGURES x
LIST OF TABLES xii
LIST OF APPENDICES xiii
LIST OF SYMBOLS xiv
1 INTRODUCTION
1.1 Introduction. 1
1.2 Research Significant. 2
1.3 Research Objectives. 2
1.4 Research Scope. 3
2 LITERATURE REVIEW
2.1 Introduction. 4
2.2 Igneous Rocks. 5
2.2.1 Texture. 6

viii
2.2.2 Engineering Classification. 7
2.3 Sedimentary Rocks. 8
2.3.1 Texture and Structure. 9
2.3.2 Engineering Classification. 11
2.4 Stress-Strain Curve. 13
2.5 Mode of Failure of Rock Specimen Under
Compression.
19
2.6 Testing Machine. 21
2.6.1 Machine Siffness. 22
2.6.2 Servo-Controlled System. 23
3 RESEARCH METHODOLOGY
3.1 Introduction. 25
3.2 Sample Preparation. 26
3.2.1 Coring. 27
3.2.2 Cutting or Trimming. 28
3.2.3 Lapping. 28
3.2.4 Sample Information. 29
3.3 Testing Equipment. 30
3.3.1 Tinius Olsen Super “L” Hydraulic. 30
3.3.2 Load Cell. 32
3.3.3 Spherical Seated Platen. 33
3.3.4 Displacement Transducer. 34
3.3.5 Data Logger. 34
3.4 Testing Method. 35
3.5 Basic Calculations. 37
4 RESULT AND ANALYSIS
4.1 Introduction. 39
4.2 Comparison of Results between Granite and
Sandstone.
39
4.3 Discussion on Test Result. 43

ix
5 CONCLUSION AND RECOMMENDATIONS
5.1 Introduction. 46
5.2 Conclusion. 46
5.3 Recommendations. 47
REFERENCES 48
APPENDIX A 51
APPENDIX B 57

x
LIST OF FIGURES
FIGURE NO. TITLE PAGE
2.1 Example of rock as engineering structure. 5
2.2 The texture of igneous rocks. 7
2.3 Engineering classification of intact igneous rock. 8
2.4 Types of bedding. 11
2.5 Engineering classification of intact sedimentary rock. 12
2.6 Relationship of complete stress-strain curve on rock
excavation works.
14
2.7 Different shape of stress-strain curve for different
rock properties.
16
2.8 Classification of rock failure behaviour in uniaxial
compression.
16
2.9 Complete stress-strain curve for various types of
rocks.
17
2.10 A description of rock deformation. 19
2.11 Fracture in compression specimens with unlubricated
ends.
21
2.12 Types of failure in a specimen. 21
2.13 Influence of testing machine stiffness on the precise
of the force- displacement curve during plastic
deformation of iron.
23
2.14 Closed-loop control in a servo-controlled testing
machine.
24

xi
3.1 Coring machine. 27
3.2 Rock disc cutter. 28
3.3 Lapping machine. 28
3.4 Granite specimens. 29
3.5 Sandstone specimens. 29
3.6 Checking the condition and surface finish of the
sample.
29
3.7 Measuring the specimen dimension. 29
3.8 Tinius Olsen Super “L” Hydraulic Universal Testing
Machine.
31
3.9 Power pack of Tinius Olsen. 32
3.10 Model 602H hand-held remote control. 32
3.11 Load cell and spherical seated platen. 33
3.12 Transducer. 34
3.13 Data logger. 35
3.14 Common methods of establishing the Young's
modulus.
38
4.1 Complete stress-strain curve for granite. 41
4.2 Complete stress-strain curve for sandstone. 42
4.3 Comparison between complete stress-strain curve for
granite and sandstone.
45
4.4 Mode of failure. 44

xii
LIST OF TABLES
TABLE NO. TITLE PAGE
2.1 The characteristic of granite. 6
2.2 The characteristic of sandstone. 9
2.3 Classification of sedimentary rocks. 10
2.4 Safe bearing pressure based on rock type. 12
2.5 Strength properties of rock. 13
2.6 Rock classification and recognizer. 13
4.1 Summary of results for granite. 40
4.2 Summary of results for sandstone. 40

xiii
LIST OF APPENDICES
APPENDIX TITLE PAGE
A List of the functions keys. 51
B Rock samples information. 57

xiv
LIST OF SYMBOLS
- Compressive stress.
a - Axial strain.
P - Compressive force.
- Initial cross-sectional area.
l - Change in measured axial length.
l - Axial length of specimen prior to loading.
Eav - Average Young’s modulus.
UCS - Uniaxial compressive strength.

CHAPTER I
INTRODUCTION
1.1 Introduction.
The design of excavations in rocks requires knowledge on strength and
deformation characteristics of the rock in immediate vicinity of any excavation face.
The most fundamental approach in understanding the deformation behaviour of
fractured rock is by understanding the complete stress-strain curve of rock sample.
The terms complete stress-strain curve refers to the behaviour of the specimen end
from initial loading, through the linear elastic pre-peak region, through the peak
compressive strength, and into post-peak failure region, and eventually residual
strength.
However, several problems arise in obtaining the complete stress-strain
curve. Since most rocks exhibit brittle behaviour, they fail violently and
uncontrollable when tested on conventional testing machines. The violent collapse
of a compressed specimen is not an intrinsic characteristic but due to the rapid
release of strain energy from the machine components (e.g. loading columns) after
the maximum load bearing capacity of the specimen has been exceeded. Therefore,
the attention must be given to the possibility of reducing energy stored in the loading

2
system, i.e. by increasing the rigidity of the testing frame, and more recently, the use
of the servo-controlled system have been successfully used to determine the
complete stress-strain curve for rock specimens deforming under compression until
reaching the post-failure.
1.2 Research significant.
The complete stress-strain curve reflects the actual deformation behaviour of
rock under compressive loading. It covers the loading history of the rock sample
throughout the phases at pre- and post-peak. Study on the post failure behaviour is
particularly important in designing excavation where rock materials may have been
highly fractured. By understanding of the post failure phase of rock sample, it would
help to reduce any potential hazards and contribute to the economic advantages of
the constructions.
1.3 Research objectives.
The main objectives of this study are:
1. To understand the underlying principles and characteristic of complete
stress-strain curve for the purpose of studying the deformation behaviour of
rock.
2. To undertake laboratory uniaxial compression tests on samples of granite and
sandstone using servo-controlled testing machine and to obtain the complete
stress-strain curve for each rock type.
3
3. To identify the deformation behaviour of granite and sandstone such as the
failure characteristics and other related parameters.
4. To compare the differences between the complete stress-strain curve of
granite and sandstone.
1.4 Research scope.
The scopes of this study will cover the following aspects:
1. The deformation behaviour of rock samples based on complete stress-strain
curves.
2. The rock samples being studied consist of granite and sandstone.
3. Laboratory test conducted is uniaxial compression test under constant strain
rate using servo-controlled testing machine.
4. To compare the differences between the deformation behaviour of granite
and sandstone. Parameters being compared include peak strength, strain at
failure and deformational behaviour at pre- and post-peak.
CHAPTER II
LITERATURE REVIEW
2.1 Introduction.
Rock is not made to specification; in rock engineering, therefore, where the
rock itself is both construction materials (e.g. fill and reclamation materials) or part
of engineering structure (e.g. cut slope, foundation, tunnel, radioactive waste
disposal and etc.), see Figure 2.1. From the Figure 2.1, it shows that rocks contain
fractures. The nature and properties of a rock are determined by the minerals in it
and by the manner in which the minerals are arranged relative to each other (texture)
and the weathering will also affect the engineering properties of a rock. According
to their manner of formation, rocks are of three (3) types:
1. Igneous rock.
2. Sedimentary rock.
3. Metamorphic rock.
The term discontinuity is used in rock engineering for all such types of
fractures to indicate that the rock is not continuous, unlike intact rock. Clearly the
nature, location and orientation of discontinuities profoundly affect most of rock

5
properties (i.e. deformability, strength and permeability). Therefore, their property
has to be established from laboratory or field test.
(a) (b)
Figure 2.1 Example of rock as engineering structure (a) tunnel (b) cut slope.
2.2 Igneous rocks.
Magma is generated by local heating and melting of rocks within the earth’s
crust mostly at depth between 10 to 100 km. Most composition of rock melts at
temperatures of 800 – 1200oC. When the magma cools, it solidifies by crystallizing
into a mosaic of minerals, to form an igneous rock.
The igneous rock can be categorized into two categories namely intrusive
igneous rocks and extrusive igneous rocks. The intrusive igneous rocks are formed
when the magma solidifies below the surface of the earth, they may later be exposed
at the surface when the cover rocks are eroded away. Granite is one of the intrusive
igneous rocks, see Table 2.1, 2.5 and 2.6. Meanwhile, the extrusive igneous rocks
are the rocks that form from the magma which is extruded onto the earth surface to
create a volcano.

6
Table 2.1 The characteristic of granite (after Waltham, 2002).
2.2.1 Texture.
The texture of igneous rocks is variable but usually consists of an
interlocking network of a mineral crystal that grew from the magma during cooling.
Crystal size is one of the major differences between extrusive rocks and intrusive
rocks. Growth of large crystals in a rock takes long period of time in condition of
gradual, undisturbed cooling. The intrusive rocks that formed under these conditions
have a texture called phaneritic, Figure 2.2(a). Phaneritic rocks are composed of an
interlocking network of large crystals that easily visible.If the crystal is too small for
observation by naked eye, the texture is called aphanitic, Figure 2.2(b). These
extremely fined-grained rocks are associated with volcanic processes because of the
relatively rapid cooling that occurs when magma reaches the earth surface during a
volcanic eruption and becomes lava.

7
(b)(a)
Figure 2.2 The texture of igneous rocks; (a) Phaneritic texture(b) Aphanitic texture (after Kehew, 1995).
2.2.2 Engineering classification.
The strength of igneous rocks is high when the rock is composed of dense
network of interlocking crystals. This condition is usually present in the intrusive
rocks. As shown in Figure 2.3, intrusive rocks generally have a high modulus of
elasticity and a medium modulus ratio. The extrusive igneous rocks have a much
wider range in strength and modulus. Lava flow may develop strength and modulus
properties that are similar to the intrusive rocks are usually weaker. The pyroclastic
rocks extend the field of the extrusive rocks into the area of the low strength and
modulus because of their low density and high porosity caused by their formation
from flow processes. Most extrusive rocks, however, fall into the medium modulus
ratio category.

8
Figure 2.3 Engineering classification of intact igneous rock (after Kehew, 1995).
2.3 Sedimentary rocks.
Sediment is largely material derived from the weathering of on the earth’s
surface. All rocks weather on exposure to the air and water, and slowly break down
to form in-situ soils. In most land environments, the soils materials is subsequently
transported away from its sources, and may then be regarded as sediment; this
includes the solid debris particles and also material in solution in water. Natural
transport processes are dominated by water, which can sort and selectively deposits
its sediment load, as stratified layers or beds. Burial of this loose and unconsolidated
sediment, by more layers of material subsequently deposited on top of it, eventually
turns into sedimentary rock, by the various process of lithification. The results of
lithification, notably the increase in strength by the cementation process, where the
filling of the intergranular pore spaces by deposition of a mineral cement brought in

9
by circulating groundwater. Rock strength is largely dependent on the type of
cement, which may be silica (strongest), iron, oxides, calcite or clay (weakest). The
dominant processes associated with formation of sandstone are shown in Table 2.2,
2.5 and 2.6.
Table 2.2 The characteristic of sandstone (after Waltham, 2002).
2.3.1 Texture and structure.
The most important characteristic of a sedimentary rock is its texture, which
refer to the size and arrangement of the particles or grained that make up the rock.
There are only two main types of texture; clastic and nonclastic. Clastic rocks are
composed of aggregates individual mineral or rock fragments. When these
fragments have been eroded, transported and then deposited, the origin of the rock
can be described as detrital (Table 2.3). Individual grains can be seen with the naked
eye in conglomerates, breccias and sandstone, which make up the coarse-grained
clastic rocks.

10
Sedimentary structure set sedimentary rocks apart from other rocks types.
The result of sediment transport and deposition, these structures are critical for
understanding the condition under which the sediments are deposited. The most
sedimentary structure is bedding. Individual layers, or beds, of sediment stacked
upon each other are the most recognizable indication of sedimentary rock. A bed is
a unit that differs in some way from the beds above and below it. Laminae are layers
similar to bedding that are less than 1 cm thick. Bed boundaries may be sharp or
gradational. Bedding is the result of variation in the depositional process. A slight
change in current velocity is all that is necessary to change the size of the material
being transported and deposited. A river may deposit sand or gravel on the beds of
its channel. Later, if that reach of the channel is abandoned in favor of new channel,
beds of silt and clay representing a lower energy environment may be deposited over
coarser sediments.
Differences in the process of sedimentation can lead to different types of
bedding. Three main types include parallel bedding, cross bedding and graded
bedding (Figure 2.4). Parallel bedding can produced by transport of sediment by
current or by deposition in standing bodies of water where sediment particles fall
through a column of water to their resting points on the bottom. Cross bedding is the
result of deposition of sediment that moved in wavelike bed forms near the
sediment-fluid interface. These conditions occur in streams and in wind-blown sand.
Table 2.3 Classification of sedimentary rocks (after Kehew, 1995).
Origin TextureParticle size or
compositionRock name
Detrital Clastic Granule or larger Conglomerate
Sand Sandstone
Silt Siltstone
Clay Mudstone and shale

11
Figure 2.4 Types of bedding; (a) parallel bedding (b) cross bedding (c) graded bedding (after Kehew, 1995).
2.3.2 Engineering classification.
Sedimentary rocks have extremely variable strength and modulus properties
(Figure 2.5). For the clastic rocks, these values depend on the rock characteristics
acquired in the deposional environment, as well as all changes that have affected the
rock in the lithification process. Lithification process, such as compaction and
cementation, usually increase the strength of the rocks. Clastic rocks of medium and
course grain size usually fall into moderate modulus ratio class over wide range of
strength and modulus value.

12
Figure 2.5 Engineering classification of intact sedimentary rock (after Kehew, 1995).
Table 2.4 Safe bearing pressure based on rock type (after Waltham, 2002).
Rock type Unweathered and
massive (MPa)
Heavily fractured or
thinly bedded (MPa)
Strong igneous rock, gneisses 10 6
Strong limestone and sandstone 4 3
Schists and slates 3 2
Strong mudstone and soft
sandstone 2 1
Schale, sound chalk, soft
mudstone 0.75 0.4

13
Table 2.5 Strength properties of rocks (after Waltham, 2002).
Dry density
(t/m3)
Porosity
(%)
Dry UCS
(MPa)
Granite 2.7 1 50 – 350
Basalt 2.9 2 100 – 350
Sandstone – Carboniferous 2.2 12 30 – 100
Sandstone – Jurassic 1.9 25 5 – 40
Table 2.6 Rock classification and recognizer (after Waltham, 2002).
Igneous Sedimentary
Material origin. Crytallized from molten
magma.
Erosional debris on earth
surface.
Environment. Underground; and as
magma flows.
Deposition basins; mainly
sea.
Rock texture. Mosaic of interlocking
crystals.
Mostly granular and
cemented.
Rock structure. Massive (structureless). Layered, bedded, bedding
planes.
Rock strength. Uniform high strength. Variables low; planar
weakness.
Major type. Granite, basalt. Sandstone, limestone.
2.4 Stress-strain curve.
The analysis of stress-strain curve is a fundamental aspect in the field of rock
mechanics. The analysis of stress is a matter of pure static, quite independent of the

14
properties assume for the material, which may be elastic or plastic. Meanwhile the
analysis of strain is a fundamental study of the movement of any material.
Since the most rocks exhibit not the intact rock, but rocks with
discontinuities. So, it is important to study the stress-strain curve beyond the peak
failure as to study the stage of rock with a non-intact rock.
In addition, on the rock excavation project, it is necessary to reach the post-
failure zone in order to carry out excavation. Once the excavation is complete,
however most of the rock surrounding it is in the pre-failure zone see Figure 2.6.
Thus the rock defining the excavation is at the interface between the two major
objectives of rock engineering, i.e. causing failure and avoiding failure respectively.
Figure 2.6 Relationship complete stress-strain curve on rock excavation work (after Hudson, 1989).
The complete stress-strain curve of rock could be divided into pre- and post-
failure regions according to a peak stress. In general, the pre-failure region of rock
shows stability in the mechanical response, which may describe by the classic
strength theories, and the post-failure region of rock shows instability, which is
difficult to be described in the classic strength theories.
For a uniaxial compression test, using the conventional testing machine,
stress-strain curve obtained for different rock properties can be classified into the

15
following categories, see Figure 2.7. Based on the shape of curve, the following
general description can be stated:
1. Type A (omit the straight line), elastic : Shows a linear elastic behaviour
indicating a constant value of modulus elasticity till the point of failure. This
type of curve is exhibited by massive and very hard rock material.
2. Type B (omit the convex towards the strain axis), plastic-elastic : The hard
rock that undergoes some densification during initial loading. It indicates a
stress-strain curve where there is decrease strain in every increment in load.
The value of the modulus of elasticity is the lowest at the start of the loading
but continuously increases.
3. Type C (omit the convex towards the stress axis), elastic-plastic : The hard
rock with mixed composition with weaker component gradually fail. It
shows a relationship where there is pronounced strain with every increment
of load. The value of the modulus elasticity is highest at the early stages of
loading, but continuously decrease.
4. Type D (omit the combination of Type B and Type C), plastic-elastic-plastic
: The rock that experiences densification during initial loading and then
gradually failure of weaker components. This is the most common stress-
strain relationship of rock.
Wawersik and Brace, (1970) made a detailed analysis of the post-failure
behaviour of rock in compression. The post-failure behaviour of the rocks can be
divided into two classes, Figure 2.8.
The Class I behaviour can be described by a stable fracture propagation which
means that when the maximum load bearing capacity of the specimen is exceeded,
still some external work has got to be done for further destruction of the specimen
for lowering its load-bearing capacity. Such rocks retain their strength (partially)
even when their maximum load carrying capacity has been exceeded.

16
In the Class II behaviour, unstable fracture propagation takes place such that
the amount of energy stored in the specimen at that moment when its maximum load
carrying capacity is just exceeded is sufficient to maintain the growth of cracks and
its propagation throughout the specimen. In such cases, fracture propagation can be
arrested only when the strain energy is extracted from the specimen.
The dividing line between the two classes of the rocks is the perpendicular line
ACD that represent the case when the stored energy is just sufficient to produce total
breakdown of the specimen.
Figure 2.7 Different shape of stress-strain curve for different rock properties (after Farmer, 1982).
Figure 2.8 Classification of rock failure behaviour in uniaxial compression (after Wawersik and Brace, 1970).

17
Studies by Brown and Hudson (1971) have shown that the type of behaviour
is dependent upon the texture of the rock. In highly porous, clastic sedimentary
rocks like sandstones and limestones. The fracture process start with collapse of the
porous structure resulting in constant increase in their anisotropy. They have post-
failure behaviour curve of Class I type. Similar behaviour also occurs in some
crystalline rocks, e.g. igneous rock. With ultra-fine grain size the failure is due to
inter- and intra granular sub-axial cracks. The curves obtained are dependent upon
the grain size. With rocks of small grain size, the curve tend to be steep and fall into
the Class II category. In dense ultra-fine grained rocks, e.g. limestone, where the
structural breakdown process is instantaneous, they give rise to the Class II curves.
Figure 2.9 shows complete stress strain curve for various types of rocks (after
Farmer, 1982).
Figure 2.9 Complete stress-strain curve for varioustypes of rocks (after Farmer, 1982).
The description of the mechanics of crack propagation and coalescence to
form the shear plane allows these stages to be extended to give a complete

18
description of rock deformation. This includes five stages, (Figure 2.10) which are
indicated by the letters A to F:
1. Stage I (A) – Closing of pre-existing micro-cracks in the rock at lower stress
level. An initial linearity of stress-strain curve. Strain increases in
decelerating manner. Maximum limit of Stage I is about 35 – 40% of peak
stress.
2. Stage II and III (B and C) –Near linear increase in volume, axial and lateral
strain that is largely recoverable, region of elastic compression. Strain
increases in a constant manner. Stage of stable crack propagation regime.
Maximum limit is about 80% of peak stress.
3. Stage IV (D) – This stage is characterized by a rapid acceleration of
microcracking events and of volume increase. Strain increases in an
accelerating manner, unstable crack propagation regime. Cluster of cracks in
the zones of highest tensile stress and tend to coalesce and start to form
tensile fractures or shear planes.
4. Stage V (E) – This is the stage where the rock has passed the peak stress, but
is still intact, even though the internal structure is highly disrupted. In this
stage the cracks arrays fork and coalesce into macrocracks or fault. In this
description, at peak stress the test specimen start to become weaker with
increasing strain. Thus further strain will be concentrated on weaker
elements of the rocks, which have already been subjected to strain.
5. Stage VI (F) – In this stage the rock has essentially parted to form a series of
block rather than an intact structure. These blocks slide across each other and
the predominant deformation mechanism is friction between the sliding
blocks. Secondary fracture may occur due to differential shearing. The axial
stress or force acting on the specimen tends to fall a constant residual
strength value, equivalent to the frictional resistance of the sliding.

19
Figure 2.10 A description of rock deformation (after Farmer, 1982).
2.5 Mode of failure of rock specimen under compression.
Paul and Gangal (1966) explained that rocks contain a network of randomly
oriented cracks. When specimen is subjected to an increasing uniaxial compressive
stress, 1, a stress 1’ will be reached such that the fractured of cracks lying in the
most unfavourable direction will produce branch cracks which, in turn, may again
branch. This branching effect will finally terminate as these cracks become oriented
in direction of the applied stress. Further fracture can take place only by attacking
cracks which are less vulnerable than those already removed. This can be done by
rising 1 to a higher value, 1’’. All branches cracks so form will propagate a short

20
distance and also aligned themselves with the applied stress. This process will
continue for successive groups of cracks oriented at less unfavourable orientation
until ultimately a sufficiently intermeshed network of cracks has been formed for
macroscopic failure to result.
The cones (conical shape fragment) generally formed in uniaxial
compression are accounted for by assuming that the platens produce a lateral
constrain within the hatched zone as shown in Figure 2.11, and this is lateral stress
inhibits crack growth. Thus initial fracture extension should start near the centre of
the specimen, where the axial stress is greatest and lateral constraint is a minimum.
The area outside the hatch zone should develop an intermesh of branching cracks
oriented mostly in the axial direction, but, because of the inhibiting effect of the
radial constraint, these cracks should not be penetrate the hatch zone but, rather,
contribute to total fracture along lines more or less intersecting the diagonals of the
specimen.
In compression test, the pattern of failure may be either symmetric or
random. Three types of failures are observed in the specimens subjected to
compression tests, where:
1. The first consists of general crumbling by development of multiple cracks
parallel to the direction of applied force at mid-height of the specimen near
the surface and its extension to the ends and into the centre of the specimen;
where the specimen collapses, conical end fragments (free from cracks) are
left, together with the long slivers of the rocks from around the periphery, see
Figure 2.12(a).
2. The second type of failure occurs with the development of one or more major
cracks parallel to the direction of application of force resulting in a series of
column, see Figure 2.12(b). This type has been termed as slabbing.
3. The third type is the shearing of the test specimen along a single oblique
plane.

21
(a) (b)
1
Figure 2.11 Fracture in compression specimens with unlubricated ends; (a) Stress pattern, (b) Conical failure, (after Paul and Gangal, 1966).
(a) (b)
Figure 2.12 Types of failure in a specimen, (after Lama, 1966)
2.6 Testing machine.
Testing machines have become increasingly sophisticated and versatile since
they first introduced in early eighteenth century. Two recent advantages in testing

22
machine technology are of particular importance for laboratory studies of rock
failure; the development of machine with stiff frames and use of feedback control
systems. Such system allow for a testing procedure to be undertaken in a more
representative conditions.
2.6.1 Machine stiffness.
For rock mechanics, conventional machines were specially stiffened in order
to obtain the complete stress-strain curves. Stiffness is the force (P) needed to
produce a unit change in length (dh):
i.e. stiffness = Force / Displacement
= P / dh …….…… (1)
= (Stress x Area) / (Strain x Length)
= EA / h ………….. (2)
A testing machine can be stiffened by, (1) increasing modulus (E) of
materials used, (2) increasing the platen width or area (A) and (3) reducing the
height (h) of the component of the load column.
Spaeth (1935) suggested that when the real behaviour of the material can be
represent by Figure 2.13(a) and the apparent behaviour is represent by Figure
2.13(b). The form of the curve between 1 and 2 is dependent upon the stiffness of
the machine and as the stiffness of the machine increases, the material behaviour
obtained approaches its real behaviour.

23
Figure 2.13 Influence of testing machine stiffness on the precise of force-displacement curve during plastic deformation of iron (after Spaeth, 1935).
2.6.2 Servo-controlled system.
A number of stiff testing machines with servo-controlled systems have been
built and used very successfully. In these machines, the displacement of the platens,
the rate of the displacement of the platens, load or the rate of loading can be
controlled by the feedback control system. The important factor in these machines is
not the stiffness of the loading frame or hydraulic system or etc., but the correct
choice of the feedback signal and the respond time of the closed-loop. The principle
of this closed-loop servo-controlled testing machine is given in Figure 2.14.
A signal from experiment is generated by transducer and electronically
compared with the program instruction. If an error exists (i.e. the transducer
feedback is not at that required value as determined by the program), a servo-valve
in hydraulic system is automatically adjusted until the transducer response coincides
with the program. The success of the program depends on the ability of the servo
system to correct the error rapidly enough to prevent the release of enough energy to
cause disintegration.

24
Testing machine with servo-controlled system also has been developed for
the purpose of constant rate loading. Here, when the strain or displacement is
regarded as control variable, the failure of rock can be controlled, where the strain is
monotonically increased until the post failure region. If, however, the force that
regarded to the control variable in experiment on the mechanical behaviour of
materials, where the rock is tested at constant loading rate, the unstable failure
occurs as the strength failure point is reached.
Figure 2.14 Closed-loop control in a servo-controlled testing machine (after Hudson et al., 1971).

CHAPTER III
RESEARCH METHODOLOGY
3.1 Introduction
The main purpose of this laboratory work is to obtain the complete stress-
strain curve for rock samples under uniaxial compression. The laboratory
investigations are divided into two sections:
1. Rock sample preparation.
2. Testing of the prepared samples.
From the data collected, the deformation behaviour for each rock sample are
obtained and verified and the differences between those results will be compared.
These include the peak strength, strain at failure and failure characteristic at pre- and
post-peak stages.
26
3.2 Sample preparation.
Sample preparation was undertaken according to the ISRM SM (1999), where
the test specimens were prepared according to the following procedures as mentions
follow:
1. Test specimens shall be right circular cylinders having a height-to-diameter
ratio of between 2.0 and 3.0 and a diameter preferably of not less than
approximately 50 mm.
2. The ends of the specimen shall be flat to ±0.01mm and shall not depart from
the perpendicular to the longitudinal axis of the specimen by more than
0.001 rad (about 3.5 mm) or 0.05 in 50 mm.
3. The sides of the specimen shall be smooth and straight to within 0.3 mm
over the full length of the specimen.
4. The use of capping materials or end surface treatments other than machining
is not permitted.
5. The diameter of the test specimen shall be measured to the nearest 0.1 mm
by averaging two diameters measured at right angles to each other close to
the top, the mid-height and the bottom of the specimen. The average
diameter shall be used for calculating the cross-sectional area.
6. The height of the specimen shall be determined to the nearest 1.0 mm.
7. The number of specimens tested under a specified set of conditions should
be sufficient to adequately represent the rock sample, and should be a
function of the intrinsic variability of the rock.
8. A minimum of five specimens per set of testing conditions is recommended.

27
The samples used in the laboratory test are rock blocks that are readily
available in the laboratory. The granite rock blocks were from Gunung Pulai, Johor
and the sandstone were from Kampung Bakong, Pahang.
Five (5) numbers of samples are prepared for each rock type, which is
granite and sandstone. The relevant sample shape and size are obtained through the
process of coring, cutting and lapping by using specific rock sample preparation
equipments.
3.2.1 Coring.
The coring machine with diamond bit cutter (Figure 3.1) was used to obtain
the core samples from the rock blocks. Diameter of the core samples obtained using
this coring machine is about 50 mm.
Figure 3.1 Coring machine.

28
3.2.2 Cutting or trimming.
The samples are then cut into the required height by using the rock disc
cutter (Figure 3.2). Cutting of the core to the specific height (H:D 2:1) is done
carefully so that the end surfaces are perpendicular to the specimen axis.
Figure 3.2 Rock disc cutter.
3.2.3 Lapping.
Lapping is done to ensure the end surfaces are sufficiently planar as required
by ISRM SM (1999), (Figure 3.3).
Figure 3.3 Lapping machine.

29
3.2.4 Sample information.
The samples are first numbered regarding to the rock types, i.e. granite and
sandstone (Figure 3.4 and 3.5). The information regarding to the samples such as
source of samples including location and depth of samples are recorded. Then the
dimension of the samples such as height and diameter are measured as mention by
ISRM SM (1999), (Figure 3.7).
Figure 3.5 Sandstone specimens.Figure 3.4 Granite specimens.
Figure 3.6 Checking the condition and surface finish of the sample.
Figure 3.7 Measuring the specimendimension.

30
3.3 Testing equipment.
The equipment used for the compression include the closed-circuit servo-
controlled testing machine which is Tinius Olsen Super “L” Hydraulic Universal
Testing Machine, load cell model TML to measure the applied load, displacement
transducer (LVDT) model TML 5 mm to measure vertical displacement and data
logger model UCAM-70A for logging of test data.
3.3.1 Tinius Olsen Super “L” Hydraulic Universal Testing Machine.
The Tinius Olsen Super “L” Hydraulic Universal Testing Machine (Figure
3.8) with model 602 (remote display and control system) with the capacity from 150
up to 3000 kN was used to test the samples with compression test. All equipment
used to calibrate the weighing and indicating system Super “L” is traceable to the
National Institute of Standards and Technology (NIST).
The machine consists of three main components namely:
1. Loading frame.
Loading with a servo-controlled system is used to allow the faster response
time. Loading frame consist of loading column, crosshead, piston or
actuator, load cell and platen. The load frame capacity should exceed the
estimate of the strongest specimen to be tested.

31
2. Power-pack.
A closed-loop hydraulic manifold is used to minimize the response time of
hydraulic commands to the loading piston. The hydraulic manifold should
be fitted with accumulators, where the accumulators provide the hydraulic
flow required for fast, short duration, movement of the piston, which is
necessary to control the failure rate of brittle specimens (Figure 3.9).
3. Control panel.
The hand-held control panel has dedicated function keys for operating the
machine (Figure 3.10). The list of the functions keys and their description is
in the Appendix A.
Figure 3.8 Tinius Olsen Super “L” Hydraulic Universal Testing Machine.

32
Figure 3.9 Power pack of Tinius Olsen.
Figure 3.10 Model 602H hand-held remote control (Tinius Olsen)
3.3.2 Load cell.
Load cell model TML with 2000 kN capacity is placed between the sample
and lower platen of the compression machine, see Figure 3.11. Load cell is used to

33
measure the load applied to the sample. For recording purpose, the load cell is
attached to the data logger, which has been calibrated for the respective constant.
It is highly recommended to use load cell that is 50% higher than the
expected failure load of the specimen. This is mainly to optimize the sensitivity of
the load cell.
3.3.3 Spherical seated platen.
A spherical seated platen (Figure 3.11) of the upper loading plate is used to
reduce the effect of the specimen non-parallelism on test result. The specimen, the
platen and the spherical seat must be accurately centered with respect to one another
and to the loading machine. This is to ensure the load is evenly distributed on the
specimen.
Spherical seated platen
Load cell
Figure 3.11 Load cell and spherical seated platen.

34
3.3.4 Displacement Transducer.
The Linear Variable Displacement Transducer (LVDT) model TML 5 mm is
placed at the lower platen, which its holder is attached to the compression machine
(Figure 3.12). This transducer is used to measure the vertical displacement of the
platen, which also corresponds to the displacement of the samples due to the
compressive load. LVDT is attached to the Automated Data Acquisition Unit
(ADU), which has been calibrated for the respective constant.
Figure 3.12 Transducer.
3.3.5 Data logger.
Data logger model UCAM-70A was used for recording the result for the
uniaxial compression test, see Figure 3.13. The printed data were load applied (kN)
and vertical displacement (mm).

35
Figure 3.13 Data logger.
3.4 Testing method
Before test on the actual specimens is undertaken, a number of trial test are
done with different speed settings applied to the trial sample; which is the same rock
type as the actual specimen. The test is undertaken mainly for the following
objectives:
1. To select the suitable load cell and LVDT used.
2. To predict the failure stress (MPa) and strain (%) of specimen.
3. To determine the best speed setting (mm/minute) for testing.
4. To determine the suitable interval time for logging the data.
The test was conducted in constant strain rate with axial strain as the control
variable. Two speed settings namely Speed1 and Speed2 are performed on the
machine as to obtain the post peak stage, where the Speed2 setting will control the
failure rate of the specimen before the peak strength.
The procedures to operate the Tinius Olsen Super “L” Hydraulic Universal
Testing Machine for uniaxial compression test can be described as follows:

36
1. Apply power to test machine and its accessories.
2. Before starting the pump motor, check whether there is sufficient space
between the machine components, crosshead, tooling and etc.
3. The 602 Machine home screen will appear, turn the pump on by pressing the
[PUMP] key , and then pressing the [RETURN] key . The
piston should return to its starting position approximately 12.7 mm above
the bottom and the left side of the bottom status should show the machine in
HOLD mode. All tests should be started from this start position.
4. Press the [MENU] key and select Machine Control to set the closed
position rate control with Speed1 and Speed2
5. Position the lower adjustable crosshead up or down using the motorized
crosshead controls; or . So that the distance between the surface
of the compression platens is slightly greater than the overall height of the
specimen.
6. Place the specimen on lower platen so the specimen is concentric with the
circular grooves in the platen.
7. Apply a small preload to the specimen in force control.
8. This helps `seat' the specimen to the loading platens and the upper loading
platen to the spherically seated platen.
9. Before starting the test, set the machine with zero force and zero position by
pressing the [ZERO FORCE] key and [ZERO POSITION] key
The screen will show zero in force and position.
10. The [TEST/CLEAR] key must be pressed placing the 602 display
into the READY mode.
11. Pressing the [UP] key once will start the test at the Speed1 setting,
and the 602 display will be in TEST mode. If needed, pressing the [UP] key
again will advanced the machine to the Speed2 setting. And pressing
the [DOWN] key will bring back the machine to the Speed1 setting.
11. By pressing the [STOP] key , it will end the test. The 602 display will
then go to HOLD mode and hold that piston position.
12. When ready to return the piston to its starting position the press the
[RETURN] key .
13. The machine should always be left in its Starts Test (Home) Position until
the next test is ready to be started.

37
For specimens that generally exhibit ductile behavior (gradual and passive
failure behavior):
13. Switch the speed setting control mode at an axial strain rate of Speed1 at 0.1
mm/minute until reaching approximately 60% of expected peak force.
14. At 60% of peak force, switch the axial strain rate to Speed2 at 0.08
mm/minute until the post-failure region.
Whereas for the specimens that generally exhibit brittle behavior (a sudden
failure behavior):
15. Switch the speed setting control mode at an axial strain rate of Speed1 at 0.5
mm/minute until reaching approximately 60% of expected peak force.
16. At 60% of peak force, switch the axial strain rate to Speed2 at 0.08
mm/minute until the post-failure region.
3.5 Basic calculations.
The force and the deformation will be obtained from the built-in load cell
information.
The compressive stress, , is calculated as;
= P/A0 …………… (3)
Where, P is the compressive force on the specimen, and A0 is the initial
cross-sectional area, and in this test procedure, compressive stresses and strains are
considered positive.

38
Axial strain, a, is calculated as;
a = l/l0 …………… (4)
Where l is the change in measured axial length (positive for a decrease in
axial length) and l0 the axial length of specimen prior to loading.
The method to establish the Young's modulus is;
Average Young's modulus, Eav, is determined from the average slopes of the
more-or-less straight line portion of the axial stress-axial strain curve (Figure 3.14).
Figure 3.14 Common methods of establishing the Young's modulus (after Fairhurst and Hudson, 1999).

CHAPTER IV
RESULT AND ANALYSIS
4.1 Introduction.
This chapter discusses the analyses of data obtained from the laboratory
investigation. The results are represented in various plots and tables and
subsequently the differences between the properties of granite and sandstone under
uniaxial compression are compared and discussed.
4.2 Comparison of result between granite and sandstone.
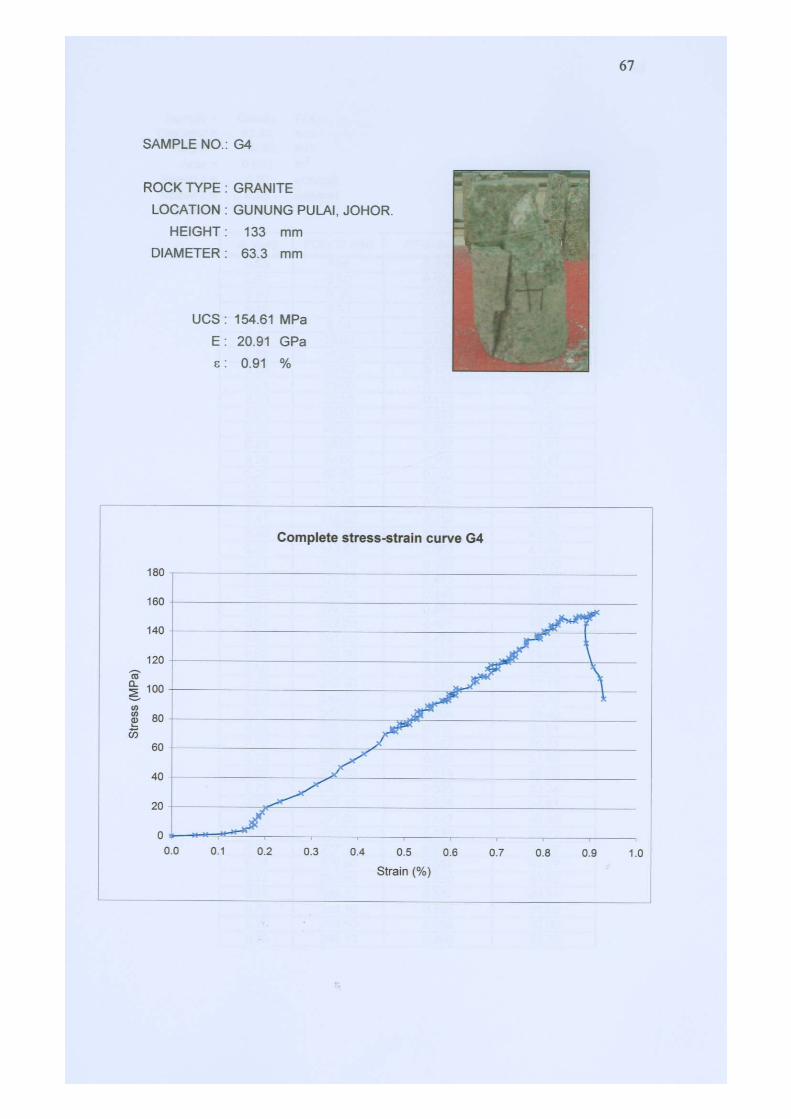
Figure 4.1 and Figure 4.2 show the complete stress-strain curve for granite
and sandstone respectively. The results are summarized in Table 4.1 and Table 4.2
for granite and sandstone respectively.

40
Table 4.1 Summary of results for granite.
Sample Strain at failure
(%)
UCS
(MPa)
Young’s Modulus
(GPa)
G1 0.728 144.77 27.44
G2 0.797 163.80 24.08
G3 0.637 132.28 20.47
G4 0.910 154.61 20.91
G5 0.728 150.18 25.20
Table 4.2 Summary of results for sandstone.
Sample Strain at failure
(%)
UCS
(MPa)
Young’s Modulus
(GPa)
S1 2.030 38.78 4.47
S2 1.530 32.08 3.56
S3 2.246 24.31 1.82
S4 1.412 38.60 5.73
S5 1.736 24.76 3.07
From Table 4.1 and Table 4.2, it shows that sandstone has lower UCS value
compared to granite, with the range of 24 to 38 MPa for sandstone and 132 to 163
MPa for granite. This evident that granite has a higher strength compared to
sandstone. However, the range of strain at failure for sandstone (1.4 to 2.2 %) is
higher than granite (0.6 to 0.9 %). Thus, it gives the lower value of Young’s
modulus for sandstone (1 to 5 GPa) compared to granite (20 to 27 GPa). The
calculated Young’s modulus also reflect on the stiffness of the rock. This implies
that granite has a higher stiffness compared to sandstone, i.e. granite has the
capability of storing a higher strain energy compared to sandstone.
Figure 4.1 shows the complete stress-strain curve for granite. In pre-peak
region, the curves shape is not so obvious but it can be classified as the plastic-
elastic behaviour, where there is some densification during the initial loading, this
may be due to the existing microfracture in the rock itself. Whereas in post-peak
region, the curves tend to be relatively steep and indicates the brittle behaviour of

41
020406080100
120
140
160
180
STRESS (MPa)
0.0
0.1
0.2
0.3
0.4
0.5
0.6
0.7
0.8
0.9
1.0
ST
RA
IN (
%)
G1
G2
G3
G4
G5
Fig
ure
4.1
Com
plet
e st
ress
-str
ain
curv
e fo
r gr
anite
.

42
05
10
15
20
25
30
35
40
45
STRESS (MPa)
0.0
0.5
1.0
1.5
2.0
2.5
3.0
ST
RA
IN (
%)
S1
S2
S3
S4
S5
Fig
ure
4.2
C
om
ple
te s
tress-s
train
curv
e for
sandsto
ne.

43
granite, as it losses its strength in a sudden manner. Therefore granite falls into Class
II behaviour.
Meanwhile, Figure 4.2 shows the complete stress-strain curve for sandstone.
In pre-peak region, the curves display that the sandstone experience the plastic-
elastic-plastic behaviour, where the hard rock undergoes some densification during
the initial loading due to the closing of voids or microcracks and then gradually
failure of weaker component. Whereas in post-peak region, the curves are gradually
fall because of the ductile behaviour of sandstone, and it falls into Class I behaviour.
4.3 Discussion on test result.
Figure 4.3 and Figure 4.4 show the comparison behaviour of complete stress-
strain curve and mode of failure for granite and sandstone respectively.
Figure 4.3 shows that both granite and sandstone have undergone the
complete stress-strain curve (i.e. pre- and post-peak region). This indicates that both
rocks still exhibit some strength even though they have exceeded the peak strength.
The explosive failure is not an intrinsic characteristic of rock but due to the release
of strain energy stored in the loading columns of testing machine. The gradual
failure is achieved by conducting the test using closed-circuit servo-controlled
testing machine. The principle of closed-loop servo-controlled testing machine has
been discussed in Chapter II.
Referring to Figure 4.3, it can be seen that both curves are differ
considerably. In pre-peak region, granite displays the plastic-elastic behaviour, while
sandstone is in plastic-elastic-plastic behaviour. The range of UCS value for granite
is much higher (132 to 163 MPa) compared to sandstone (24 to 38 MPa). However
sandstone does experience a high increase in strain with a slight increase in stress.
This is due to the mechanism of rearrangement of the particle to fill in the void. On

44
the other hand, this condition does not happened to granite because of the
interlocking crystalline texture and massive rock structure. Therefore, it gives
granite high Young’s modulus value which represent high stiffness of rock.
Meanwhile in post-peak region, granite falls into Class II behaviour and
sandstone is in Class I behaviour. The Class I behaviour is a stable fracture
propagation characteristic which means that when the maximum load bearing
capacity of the specimen is exceeded, there is still some external work needs to be
done for further destruction of the specimen. The Class II behaviour is an unstable
fracture propagation takes place such that the amount of energy stored in the
specimen, at the moment when its maximum load carrying capacity is just exceeded,
is sufficient to maintain the growth and propagation of cracks throughout the
specimen.
The Class II also represents the brittle behaviour, this can be seen in the post-
peak curve, where the granite has a steeper curve in post-peak region. Meanwhile for
sandstone, a gradual fall of post-peak curve represents a ductile behaviour. This
condition is due to the frictional strength between the fractured fragments within the
sample. However for granite, most of the blocks are explosive because of the store
energy in the specimen release due to the high stiffness of the rock.
In terms of mode of failure (Figure 4.4), it can be seen that granite exhibits
shear failure whereas sandstone breaks in conical fragmental shape.
(a) (b)
Figure 4.4 Mode of failure (a) Granite (G5) (b) Sandstone (S2).

45
0
20
40
60
80
100
120
140
160
0.0
0.5
1.0
1.5
2.0
Str
ain
(%
)
Stress (MPa)
G5
S2
Fig
ure
4.3
C
om
ple
te s
tress-s
train
curv
e for
gra
nite a
nd s
andsto
ne.
CHAPTER V
CONCLUSION AND RECOMMENDATION
5.1 Introduction.
Two types of rocks namely granite and sandstone have been subjected to
uniaxial compression. It is evident that the used of servo-controlled testing machine
has been successfully used to study the failure behaviour of granite and sandstone.
Based on the data obtained from the previous chapter, the following conclusions
have been highlights with a number of recommendations for further study in this
field.
5.2 Conclusions.
Based on analyses of results, the following conclusion can be derived:

47
1. By using the closed-circuit servo-controlled testing machine, the complete
stress-strain curve for granite and sandstone has been successfully obtained.
2. In pre-peak region, granite displays the plastic-elastic behaviour while
sandstone displays the plastic-elastic-plastic behaviour.
3. Granite shows a higher UCS value (132 to 163 MPa) compared to sandstone
(24 to 38 MPa). The strain at failure for granite is lower (0.6 to 0.9 %) than
sandstone (1.4 to 2.2 %). Granite has higher Young’s modulus value (20 to
27 GPa) compared to sandstone (1 to 5 GPa), thus it represents that granite
has higher stiffness compared to sandstone.
4. Post-peak region for granite falls into Class II behaviour with the steep curve
in post-peak indicates the brittle behaviour of granite, and post-peak region
for sandstone falls into Class I behaviour with the gradual falls in post-peak
indicates the ductile behaviour of sandstone.
5.3 Recommendations for future study.
For further study on this field, some recommendations have been suggested
for instance; to test on the other rock types, such as limestone or basalt, as to study
the failure behaviour of these rocks, where these rocks that are commonly found in
Malaysia. In addition, study the microscopic features to see crack growth in each
stage of complete stress-strain curve. This is done by using microseismic detection.
Other then that, tries to test the samples using the uniaxial tension and study on the
comparison between the behaviour of rock under tension and compression.

48
REFERENCES
Brady, B.T., Duvall, W.I., Horino, F.G., 1973. An experimental determination of the
true uniaxial stress-strain behaviour of brittle rock. Journal of Rock
Mechanics. 5: 107 – 120.
Fairhust, C., Hudson, J.A., 1999. Draft ISRM suggested method for the complete
stress-strain curve for intact rock in uniaxial compression. International
Journal of Rock Mechanics and Mining Science. 36: 279 – 289.
Farmer, I., 1982. Engineering behaviour of rocks. London: Chapman and Hall.
He, C., Okubo, S., Nishimatsu, Y., 1990. A study on the Class II behaviour of rock.
International Journal of Rock Mechanics Mining Science. 23: 261 – 273.
Hudson, J.A., Brown, E.T., Fairhust, C., 1971. Optimizing the control of rock failure
in servo-controlled laboratory test. Journal of Rock Mechanics. 3: 217 – 224.
Hudson, J.A., Crouch, S.L., Fairhust, C., 1972. Soft, stiff and servo-controlled
testing machines: A review with reference to rock failure. Engineering
Geology. 6: 155 – 189.
Hudson, J.A., 1989. Rock mechanics principles in engineering practice. London:
Butterworths.
Kehew, A. E., 1995. Geology for engineers and environmental scientist. New Jersey:
Prentice Hall.

49
Lin, Q.X., Tham, L.G., Yeung, M.R., Lee, P.K.K., 2004. Failure of granite under
constant loading. International Journal of Rock Mechanics and Mining
Science. 41 (3): CD-ROM.
Mc Lean, A.C. and Gribble, C.D., 1984. Geology for civil engineers. London:
George Allen & Unwin (Publisher) Ltd.
Ojubo, S., Fukui, K., 1996. Complete stress-strain curve for various rock types in
uniaxial tension. International Journal of Rock Mechanics and Mining
Science. 33 (6): 549 – 556.
Okubo, S., 1985. Uniaxial compression testing using a linear combination of stress
and strain as the control variable. International Journal of Rock Mechanics
Mining Science. 22 (5): 323 – 330.
Rummel, F., Fairhust, C., 1970. Determination of post-failure behavior of brittle
rocks using a servo-controlled testing machine. Journal of Rock Mechanics.
2: 189 – 204.
Schlangen, E., Van Mier, J.G..M., 1995. Crack propagation in sandstone : combined
experimental and numerical approach. Journal of Rock Mechanics & Rock
Engineering. 28 (2): 93 – 110.
Spaeth. W., 1935. Einflu der Federung der Zerrei maschine auf das Spannungs-
Dehnungs-Scha bild. Arc. Eisenhuttenwessen, 6: 227 – 283.
Tinius Olsen Testing Machine Co., Inc. Tinius Olsen Super “L” Hydraulic
Universal Testing Machine. Horsham (PA): Instruction booklet.
Vutukuri, V.S., Lama, R.D., Saluja, S.S., 1978. Handbook on mechanical properties
of rock ( Vol. I). Clausthal: Trans Tech Publications.

50
Vutukuri, V.S., Lama, R.D., Saluja, S.S., 1978. Handbook on mechanical properties
of rock ( Vol. II). Clausthal: Trans Tech Publications.
Waltham, T., 2002. Foundations of engineering geology. London: Spon Press.
Wawersik, W.R., Brace, W.F., 1970. Post-failure behavior of a granite and diabase.
Journal of Rock Mechanics. 3 (2): 61 – 85.