Embed Size (px)
Citation preview

A STUDY ON THE INVESTOR
PERCEPTION ON KARVY STOCK
BROKING IN COIMBATORE DISTRICT
Dr P Mohanraj1
P Kowsalya2
Abstract
Capital market plays an important role to increase the wealth of the investors as well as
wealth of the organization. Karvy Stock Broking Pvt Ltd is providing a various services in
financial sector. They have nationwide investors and various clients across the nation. Now
they are facing service quality issues in the organization. So this study helps to find out the
service quality issues in the organization.
This study is done with a purpose to find out the investors perception towards service quality
of KSBL. In particular, this research is done for Karvy Stock Broking Pvt Ltd. The major
objective of the study is to find out the service quality Reliability, Tangibles, Assurance,
Responsiveness and Empathy.
From this study most of the factors are there is a significance difference between the factors.
The objective of the study can be based on the demographic factor, customer expertise, and
service quality and customer satisfaction. To ascertain the factors influencing investors
satisfaction towards service quality.
1.1 INTRODUCTION TO THE STUDY
SERVQUAL is a multi-dimensional research instrument, designed to capture consumer
expectations and perceptions of a service along the five dimensions that are believed to
represent service quality.
1 Associate Professor, Department of Management Studies, Nandha arts and Science College, Erode,
India
2 Research scholar, Nandha Arts and Science College, Erode/Assistant Professor, Vivekananda
Institute of Management Studies, Coimbatore
www.zenonpub.com Jan-Mar 2018 ISSN 2455-7331 - Vol III – Issue I
International Journal of Research in Applied Management, Science & Technology

The five SERVQUAL dimensions are:
TANGIBLES-Appearance of physical facilities, equipment, personnel, and
communication materials
RELIABILITY-Ability to perform the promised service dependably and accurately
RESPONSIVENESS-Willingness to help customers and provide prompt service
ASSURANCE-Knowledge and courtesy of employees and their ability to convey trust
and confidence
EMPATHY-Caring, individualized attention the firm provides its customers
1.2 STATEMENT OF THE PROBLEM
Capital market is one of the investment areas for our people. In that market there are many
participants like foreign investors and domestic investors are available whether they have
invested for long term or short term. Based on the services provided by the organization plays
an important role among the participants. Because organization want to increase the wealth of
the participants and they want to provide the proper knowledge about the share market.
Because capital market is not an risk free market like fixed deposit. Participant needs a proper
guidance about the company which is going to invest their earnings.
In this study we can able to identify the investor’s perception towards service quality of
Karvy Stock Broking Pvt Ltd. KSBL has nationwide clients to invest their earnings in money
market. So consider the investors in Coimbatore district to get the proper solution for the
problem effectively.
1.3 OBJECTIVES OF THE STUDY
1. To examine the demographic characteristics of customers and examine the relationship
between demographics, customer expertise, service quality and customer satisfaction.
2. To ascertain factors influencing investors satisfaction towards service quality.
1.4 Scope of the study
The study focus on the service quality of the Karvy Stock Broking Limited. The study is
purely based on the survey conducted Coimbatore district and has focused on the investor’s
perception. The study covers the information about the mind set which may varies from
situation and where the respondents may not be able to give required and accurate
information.
www.zenonpub.com Jan-Mar 2018 ISSN 2455-7331 - Vol III – Issue I
International Journal of Research in Applied Management, Science & Technology

1.5 LIMITATION OF THE STUDY
Due to respondent’s busy schedules, the interest shown by respondents to answer the
questionnaire may be less. This may have resulted in collecting inaccurate
information.
The survey has been conducted only taking 100 respondents as a sample size. The
study area covers only in Coimbatore district.
The selected sample size is small as compare to the total number of investors. Hence
the obtained results may not be accurate as it may not represent the whole population.
The project is open for the further improvement of the work.
2. REVIEW OF LITERATURE
IBERAHIM, H (2016), Customer Satisfaction on Reliability and Responsiveness of
Self Service Technology for Retail Banking Services, Self Service Technology (SST) is
a required feature in retail banking industry. The interface facilitates communication
between human and machine is important in our daily lives as a result of the swift
technology advancement. Automated-Teller Machine(ATM) has been one of the best
options for Self Service Terminal in catering retail banking services. The purpose of this
study is to examine the current level of ATMs service quality at one of the main ATM
service points of a Malaysian bank. The objective of the study is to investigate the
relationship between the reliability and responsiveness of ATM services with customer
satisfaction and verify the determinants for service enhancement. Data was collected
through questionnaire survey of 271respondents and observations at the service point.
Data was analyzed using SPSS. Result of survey suggests the relationships of three out of
four elements of service quality dimensions (consistency, dependability and timeliness)
are important to maximizing customer satisfaction.
DR. ABDEL FATTAH MAHMOUD AL-AZZAM (2015) The Impact of Service
Quality Dimensions on Customer Satisfaction: A Field Study of Arab Bank in Irbid
City, Jordan Service-offering channels in the banking system has emerged on the scene
with a wide variety of forms such as internet banking, automated teller machine (ATM),
telephone banking and banks . Mature competition and global financial systems have
been forced to investigate the significance of customer satisfaction. Therefore, the
research should shed light on the changing status of the banking system and financial
market dynamics. This study has used the model of service quality (Parasuraman et al.,
1988) with five dimensions to evaluate its effect on the customer satisfaction among Arab
www.zenonpub.com Jan-Mar 2018 ISSN 2455-7331 - Vol III – Issue I
International Journal of Research in Applied Management, Science & Technology

bank customers in the city of Irbid. The results indicate that the higher the service quality,
the more the costumer’s satisfaction. The Dimensions of service quality plays an
important role in this equation. These dimensions are tangibility, responsiveness
reliability, empathy, and security. Finally, the findings indicate that these five factors
have positively affected the customer satisfaction. This research also shows that the
service quality is an appropriate tool to measure the quality of service in the banking
sector in the rab bank. Therefore, the banking sector practitioners regard this instrument a
very important tool to evaluate, support, and improve the quality of their services.
MINU.M (2015) A Study on Customer Satisfaction towards the Financial Services
provided by Karvy Stock Broking Limited in Bangalore City This study entitled “A
study on Customer Satisfaction towards the Financial Services Provided by Karvy in
Bangalore City” was conducted for Karvy Stock Broking Limited, Bangalore. The
primary objectives of the study are to find out the satisfaction of the customers towards
various financial services, the study also aims at to find out the awareness, highest
business area, factor influencing, Quality of services, charges levied, customer relation
and facilities. Descriptive research is used in this research. The primary data is collected
from 200 customers of Karvy Stock Broking Limited in Bangalore city using structured
questionnaire method. The existing customers of Karvy Stock Broking Limited were
directly interviewed and their responses were recorded. The sampling technique that was
adopted for the study was judgmental sampling where the data was collected from
existing customer group. The collected data was analyzed using summary (or) descriptive
statistics. Percentage analysis, Chi- square test was the main tools used for the analysis.
The study brought to the surface various insights. More than 4/5th of the customers are
satisfied about the range of services and quality of services provided by Karvy, but effort
should be taken by Karvy to create better awareness about all its services to all customers
and also for the prospectus.
HOSSEIN VAZIFEH DOOST (2014) Relationship of Online Service Quality with
Customer Satisfaction in Internet Banking Case Study: Pasargadae Bank In
providing new services, in addition to correspondence of new services to customer needs,
the means by which these services are brought to the customer is also important. The
growing IT and ICT applications have had far reaching implications for the mode of
operation in all sectors, including banking industry. The Internet has radically changed
the established concepts in Marketing and provision of goods and services as well as the
www.zenonpub.com Jan-Mar 2018 ISSN 2455-7331 - Vol III – Issue I
International Journal of Research in Applied Management, Science & Technology
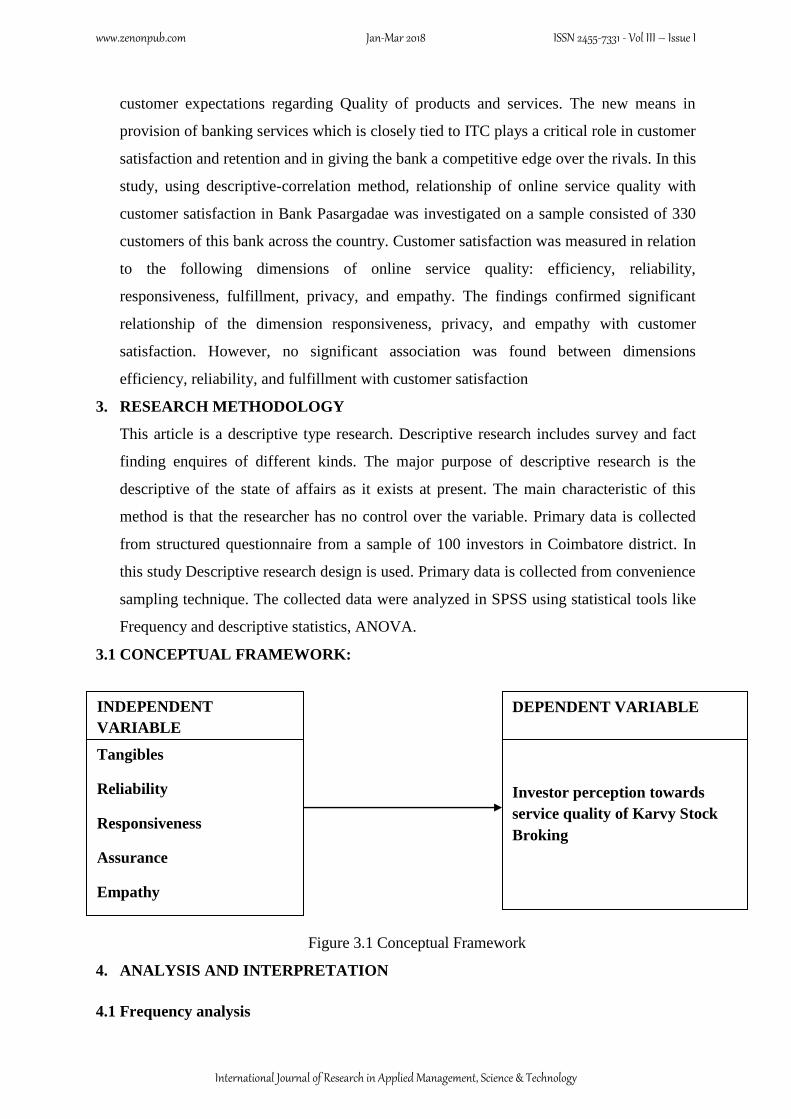
customer expectations regarding Quality of products and services. The new means in
provision of banking services which is closely tied to ITC plays a critical role in customer
satisfaction and retention and in giving the bank a competitive edge over the rivals. In this
study, using descriptive-correlation method, relationship of online service quality with
customer satisfaction in Bank Pasargadae was investigated on a sample consisted of 330
customers of this bank across the country. Customer satisfaction was measured in relation
to the following dimensions of online service quality: efficiency, reliability,
responsiveness, fulfillment, privacy, and empathy. The findings confirmed significant
relationship of the dimension responsiveness, privacy, and empathy with customer
satisfaction. However, no significant association was found between dimensions
efficiency, reliability, and fulfillment with customer satisfaction
3. RESEARCH METHODOLOGY
This article is a descriptive type research. Descriptive research includes survey and fact
finding enquires of different kinds. The major purpose of descriptive research is the
descriptive of the state of affairs as it exists at present. The main characteristic of this
method is that the researcher has no control over the variable. Primary data is collected
from structured questionnaire from a sample of 100 investors in Coimbatore district. In
this study Descriptive research design is used. Primary data is collected from convenience
sampling technique. The collected data were analyzed in SPSS using statistical tools like
Frequency and descriptive statistics, ANOVA.
3.1 CONCEPTUAL FRAMEWORK:
Figure 3.1 Conceptual Framework
4. ANALYSIS AND INTERPRETATION
4.1 Frequency analysis
INDEPENDENT
VARIABLE
Tangibles
Reliability
Responsiveness
Assurance
Empathy
DEPENDENT VARIABLE
Investor perception towards
service quality of Karvy Stock
Broking
www.zenonpub.com Jan-Mar 2018 ISSN 2455-7331 - Vol III – Issue I
International Journal of Research in Applied Management, Science & Technology

Table 4.1.1 Age
Frequency Percent Valid Percent Cumulative
Percent
Valid
21-30 21 21.0 21.0 21.0
31-40 38 38.0 38.0 59.0
41-50 24 24.0 24.0 83.0
51-60 11 11.0 11.0 94.0
60 above 6 6.0 6.0 100.0
Total 100 100.0 100.0
The above table 4.1.1 shows that the respondents age group 38% of the respondents are
between 31-40 years, 24% of the respondents’ are between 41-50 years.
Table 4.1.2 Education Qualification
Frequency Percent Valid Percent Cumulative
Percent
Valid
SSLC 3 3.0 3.0 3.0
HSC 8 8.0 8.0 11.0
DIPLOMA 20 20.0 20.0 31.0
UG 33 33.0 33.0 64.0
PG 33 33.0 33.0 97.0
Others Specify 3 3.0 3.0 100.0
Total 100 100.0 100.0
The above table 4.1.2 shows that the respondents' Educational Qualification. 33.0% of the
respondents' are between UG and PG. 20.0% of the respondents' are Diploma.
Table 4.1.3 Occupation
Frequency Percent Valid Percent Cumulative
Percent
Valid
Self employed 16 16.0 16.0 16.0
Private employee 37 37.0 37.0 53.0
Government employee 24 24.0 24.0 77.0
Business 23 23.0 23.0 100.0
Total 100 100.0 100.0
www.zenonpub.com Jan-Mar 2018 ISSN 2455-7331 - Vol III – Issue I
International Journal of Research in Applied Management, Science & Technology

The above table 4.1.3 shows that the Occupation. 37% of the respondents' are Private
employee. 24% of the respondents' are government employee.
Table 4.2.1 Descriptive Statistics for tangibles
N Minimu
m
Maximu
m
Mean Std.
Deviation
Modern looking
equipment.
100 3.00 5.00 4.5700 .65528
physical facilities 100 1.00 5.00 3.6500 .90314
Employees appearance 100 1.00 5.00 3.9100 1.11096
Research reports
associated with the
service visually appeals
100 2.00 5.00 3.8100 .95023
Valid N (listwise) 100
The above table 4.2.1 shows that the Descriptive Statistics for tangibles. Modern looking
equipment has the highest mean value of 4.5700 and Employees appearance has the mean
value of 3.9100 and Research reports associated with the service visually appeals has the
mean value of 3.8100 and physical facilities has the lowest mean value of 3.6500.
Table 4.2.2 Descriptive Statistics for reliability
N Minimum Maximum Mean Std. Deviation
When Karvy Stock Broking
promise to do something by
a certain time, they do so
100 1.00 5.00 4.4500 .86894
When customers have a
problem, Karvy stock
broking shows interest in
solving it
100 1.00 5.00 3.8100 .89550
When customers complain,
Karvy performs the service
right the first time
100 1.00 5.00 3.8600 1.12833
www.zenonpub.com Jan-Mar 2018 ISSN 2455-7331 - Vol III – Issue I
International Journal of Research in Applied Management, Science & Technology

Karvy stock broking
provides their services at
their promises
100 2.00 5.00 3.6200 .83823
Karvy Stock Broking insists
on error-free records
100 1.00 5.00 3.7400 1.18594
Valid N (listwise) 100
The above table 4.2.2 shows that the Descriptive Statistics for level of reliability. When
Karvy Stock Broking promise to do something by a certain time, they do so has the highest
mean value 4.4500 and When customers complain, Karvy performs the service right the first
time has the mean value of 3.8600 and When customers have a problem, Karvy stock broking
shows interest in solving it has the mean value of 3.8100 and Karvy Stock Broking insists on
error-free records has the mean value of 3.7400 and Karvy stock broking provides their
services at their promises has the lowest mean value of 3.6200.
Table 4.2.3 Descriptive Statistics for responsiveness
N Minimum Maximum Mean Std. Deviation
Employees of Karvy
stock Broking
communicates customers
exactly when services are
performed
100 3.00 5.00 4.5800 .72725
Employees of Karvy
Stock Broking gives
Prompt services to
customers
100 1.00 5.00 3.6700 .85345
Employees of Karvy
Stock Broking are always
willing to help customers.
100 1.00 5.00 3.8500 .95743
www.zenonpub.com Jan-Mar 2018 ISSN 2455-7331 - Vol III – Issue I
International Journal of Research in Applied Management, Science & Technology

Employees of Karvy
stock broking responds to
customers even in peak
hours
100 1.00 5.00 3.6500 .96792
Valid N (listwise) 100
The above table 4.2.3 shows that the Descriptive Statistics for responsiveness. Employees of
Karvy stock Broking communicates customers exactly when services are performed has the
highest mean value 4.5800 and Employees of Karvy Stock Broking are always willing to help
customers has the mean value of 3.8500 and Employees of Karvy Stock Broking gives
Prompt services to customers has the mean value of 3.6700 and Employees of Karvy stock
broking responds to customers even in peak hours has the lowest mean value of 3.6500.
Table 4.2.4 Descriptive Statistics for assurance
N Minimum Maximum Mean Std. Deviation
The behaviour of
employees of Karvy Stock
Broking are always
instills confidence in
customers
100 1.00 5.00 4.3900 .91998
Customers of Karvy Stock
Broking feels safe to do
transactions
100 1.00 5.00 3.7800 .91652
Employees of Karvy stock
Broking consistently
courteous with customers
100 2.00 5.00 3.7000 .91563
Employees of Karvy stock
broking are
knowledgeable and
skilled to answer
customer queries
100 1.00 5.00 3.8300 1.13756
Valid N (list wise) 100
www.zenonpub.com Jan-Mar 2018 ISSN 2455-7331 - Vol III – Issue I
International Journal of Research in Applied Management, Science & Technology

The above table 4.2.4 shows that the Descriptive Statistics for assurance. The behaviour of
employees of Karvy Stock Broking are always instills confidence in customers has the
highest mean value 4.3900 and Employees of Karvy stock broking are knowledgeable and
skilled to answer customer queries has the mean value of 3.8300 and Customers of Karvy
Stock Broking feel safe to do transactions has the mean value of 3.7800 and Employees of
Karvy stock Broking consistently courteous with customers has the lowest mean value of
3.7000.
Table 4.2.5 Descriptive Statistics for empathy
N Minimu
m
Maximu
m
Mean Std.
Deviation
Karvy Stock Broking gives their customers
individual attention.
100 2.00 5.00 4.4900 .83479
Karvy Stock Broking has operating hours
convenient to all their customers
100 1.00 5.00 3.7800 .85965
Karvy Stock Broking employees give
customers personal attention.
100 1.00 5.00 3.5000 .96922
The employees of Karvy Stock Broking
understand the specific needs of their
customers.
100 1.00 5.00 3.8500 1.04809
Valid N (list wise) 100
The above table 4.2.5 shows that the Descriptive Statistics for empathy Karvy Stock Broking
gives their customers individual attention has the highest mean value 4.4900 and The
employees of Karvy Stock Broking understand the specific needs of their customers has the
mean value of 3.8500 and Karvy Stock Broking has operating hours convenient to all their
customers has the mean value of 3.7800 and Karvy Stock Broking employees give customers
personal attention has the lowest mean value of 3.5000.
4.3. ONE-WAY ANOVA analysis
Table 4.3.1 ONE-WAY ANOVA analysis for age and level of satisfaction
Sum of
Squares
df Mean Square F Sig.
Market Updating Call Between
Groups
7.784 4 1.946 1.896 .118
www.zenonpub.com Jan-Mar 2018 ISSN 2455-7331 - Vol III – Issue I
International Journal of Research in Applied Management, Science & Technology

Within Groups 97.526 95 1.027
Total 105.310 99
Call n Trade
Between
Groups
5.532 4 1.383 2.245 .070
Within Groups 58.508 95 .616
Total 64.040 99
Post Trade
Confirmation Call
Between
Groups
9.363 4 2.341 2.123 .084
Within Groups 104.747 95 1.103
Total 114.110 99
Research Call and
Research Reports
Between
Groups
5.262 4 1.316 1.279 .284
Within Groups 97.738 95 1.029
Total 103.000 99
Online Trading
Between
Groups
14.609 4 3.652 3.112 .019
Within Groups 111.501 95 1.174
Total 126.110 99
Karvy App
(Application)
Between
Groups
17.055 4 4.264 3.343 .013
Within Groups 121.185 95 1.276
Total 138.240 99
Null Hypothesis
H0: There is no significance difference between level of satisfaction and age.
Alternative Hypothesis
H1: There is significance difference between level of satisfaction and age.
The above table 4.3.1 shows that the ONE-WAY ANOVA for level of satisfaction and age.
The calculated value of factor online trading value is 0.019 and Karvy app (application) value
is 0.013.There is a significant difference between age and level of satisfaction .So Alternative
hypothesis is accepted.
www.zenonpub.com Jan-Mar 2018 ISSN 2455-7331 - Vol III – Issue I
International Journal of Research in Applied Management, Science & Technology

5. FINDINGS, SUGGESTIONS AND CONCLUSIONS
5.1 FINDINGS
38% of the respondent’s age group is between 31-40 years.
33.0% of the respondents' educational qualification is between UG and PG.
37% of the respondents' occupations are Private employee.
In the Descriptive Statistics for tangibles modern looking equipment has the highest
mean value of 4.5700.
In the Descriptive Statistics for level of reliability when Karvy Stock Broking promise
to do something by a certain time, they do so has the highest mean value 4.4500.
In the Descriptive Statistics for responsiveness employees of Karvy Stock Broking
communicates customers exactly when services are performed has the highest mean
value 4.5800
In the Descriptive Statistics for assurance the behavior of employees of Karvy Stock
Broking are always instills confidence in customers has the highest mean value
4.3900.
In the Descriptive Statistics for empathy Karvy Stock Broking gives their customers
individual attention has the highest mean value 4.4900
There is significance difference between level of satisfaction and age. The calculated
value of factor online trading value is 0.019 and Karvy app(application) value is 0.013
is less than the tabulated value 0.05.
5.2 SUGGESTIONS
From the findings KSBL want to improve their research reports accuracy because
investors are investing huge money based on the research call.
Market updating is another factor strongly influencing the investor for daily trade. So
investors are expecting to update the market regularly.
KSBL want to improve their online trading platform and Karvy Application. Because
investors are facing technology issues like placing wrong order.
Investors are excepting to increase the security for transactions of pay in and pay out.
5.3 CONCLUSIONS
The findings of this research would give a clear idea about the investor’s perception
towards service quality of KSBL. Although the study is descriptive in nature, it gives a
brief idea about the factor influencing the investors and also gives the insights for future
www.zenonpub.com Jan-Mar 2018 ISSN 2455-7331 - Vol III – Issue I
International Journal of Research in Applied Management, Science & Technology

development. Further, Research developed in the study is supported. Therefore the
objective of the study is achieved. From the findings it shows all factors are related with
investor’s perception towards service quality of KSBL. However their significant level
proved that there is significant relationship between all factors and level of satisfaction
towards service quality.
REFERENCES
1. IBERAHIM, H (2016), “Customer Satisfaction on Reliability and Responsiveness of
Self Service Technology for Retail Banking Services” Procedia Economics and
Finance 37, pp. 13 – 20.
2. Minu.M, Hariharan.R, (2015), “A Study on Customer Satisfaction towards the
Financial Services provided by Karvy Stock Broking Limited in Bangalore City”,
International Journal of Engineering Technology, Management and Applied Sciences,
Volume 3, Issue 6, pp.257 - 286.
3. Dr. Abdel Fattah Mahmoud Al-Azzam (2015) The Impact of Service Quality
Dimensions on Customer Satisfaction: A Field Study of Arab Bank in Irbid City,
European Journal of Business and Management, Vol.7, No.15,pp.45-53.
4. Hossein Vazifeh Doost (2014) Relationship of Online Service Quality with Customer
Satisfaction in Internet Banking Case Study: Pasargadae Bank, International Journal
of Economy, Management and Social Sciences, 3(1) January, pp. 130-135
5. Shamim Ahamed, (2011), “Service Quality of Stockbrokers in Bangladesh”, Indian
Journal of Commerce & Management Studies, Internationally Indexed Journal, Vol–II
, Issue -2, pp. 46-56, http://scholarshub.net/ijcms/vol2/issue2/Paper_05.pdf.
6. Lee Yik‐Chee, G.G. Meredith, T. Marchant, (2010) "Singapore stock broking service
quality: fifteen percent gap", Journal of Services Marketing, Vol. 24 Issue: 4, pp.305-
313, https://doi.org/10.1108/08876041011053015.
7. Parasuraman, A., Zeithaml, V.A. and Berry, L.L. (1994), “Reassessment of
expectations as a comparison standard in measuring service quality: Implications for
further research,” Journal of Marketing, Vol. 58, No. 1, pp. 111-124.
8. Lehtinen, U. and Lehtinen, J.R. (1991), “Two approaches to service quality
dimensions”, The Service Industries Journal, Vol. 11, No. 3, pp. 287-303.
9. Babakus E. and Mangold W.G. (1989). Adapting the SERVQUAL Scale to Health
CareEnvironment: An Empirical Assessment. In P. Bloom, B. Weitz, R. Winer,
R.E.Spekman, H.H. Kassarjian, V. Mahajan, D.L. Scammon and M. Leay
www.zenonpub.com Jan-Mar 2018 ISSN 2455-7331 - Vol III – Issue I
International Journal of Research in Applied Management, Science & Technology

(eds.), AMA Summer Educators’ Proceedings: Enhancing Knowledge Development
in Marketing. American Marketing Association, IL, Chicago.
10. Parasuraman, A., Zeithaml, V.A. and Berry, L.L. (1988), “SERVQUAL: A multiple
item scale for measuring consumer perceptions of service quality,” Journal of
Retailing,Vol. 64, No. 1, pp. 12-40.
11. Parasuraman, A., Zeithaml, V.A. and Berry, L.L. (1985), “A conceptual model of
service quality and its implications for future research,” Journal of Marketing,Vol. 49,
No. 4, pp. 41-50.
12. Fischer E. Donald, Jordon J. Ronald, (2006), Security analysis and portfolio
management, Pearson education inc., New Delhi, pp.522-549.
13. C.R.Kothari, Research Methodology, Methods and Techniques, New Age
International (P) Ltd., New Delhi.
14. Kotler Philip (2002), “Principles of Marketing”, Sultan Chand & company limited,
New Delhi.
www.zenonpub.com Jan-Mar 2018 ISSN 2455-7331 - Vol III – Issue I
International Journal of Research in Applied Management, Science & Technology


![RULE THE MARKET - Karvy Onlinecontent.karvyonline.com/contents/kstreetissue011.pdfDisclaimer: Karvy Stock Broking Limited [KSBL] is registered as a research analyst with SEBI (Registration](https://img.pdfslide.net/doc/110x75/5e404854af860e4d7b4ee7ef/rule-the-market-karvy-disclaimer-karvy-stock-broking-limited-ksbl-is-registered.jpg)
![RULE THE MARKET - content.karvyonline.comcontent.karvyonline.com/contents/kstreetissue015.pdf · From The Desk Of Research Head. Disclaimer: Karvy Stock Broking Limited [KSBL] is](https://img.pdfslide.net/doc/110x75/5c5c1eaa09d3f263368ce072/rule-the-market-from-the-desk-of-research-head-disclaimer-karvy-stock-broking.jpg)
![Karvy Stock Broking Ltd.€¦ · Karvy Stock Broking Ltd. J.K. Fenner (India) Limited [Formerly Fenner (India) Limited] ... Company mentioned hereunder or with the Managers to the](https://img.pdfslide.net/doc/110x75/602e2e90ea0f8325f91a318c/karvy-stock-broking-ltd-karvy-stock-broking-ltd-jk-fenner-india-limited-formerly.jpg)


![Kaushal Final Project at KARVY STOK BROKING Ltd[1]](https://img.pdfslide.net/doc/110x75/577d261f1a28ab4e1ea05495/kaushal-final-project-at-karvy-stok-broking-ltd1.jpg)