Embed Size (px)
Citation preview

0
IDENTIFYING COST EFFECTIVE MITIGATION MEASURES TO BRING DOWN CONCENTRATIONS OF
POLLUTANTS THAT ENTER LAKE HAWASSA
A STUDY REPORT
Submitted to: SOS-Sahel - ETHIOPIA
Submitted by: (Research Team)
Dr. Girma Tilahun Yimer, PhD Limnologist – Team Leader Dr. Ermias Deribe Weldemariam, PhD Environmental Chemist & Ecotoxicologist Dr. Solomon Sorsa Sota, PhD Ecotoxicologist Prof. Zinabu Gebremariam Woldesenbet, PhD Freshwater Ecologist
Date: May 2014, Hawassa

1
TABLE OF CONTENTS
I. ACRONYMS ............................................................................................................... 4
II. EXCUTIVE SUMMARY ................................................................................................ 6
III. GENERAL INTRODUCTION ......................................................................................... 7
PART A ............................................................................................................................. 9
GENERAL BACKGROUND ON LAKE HAWASSA AND ASSESSMENT OF ITS PRESENT STATE ... 9
CHAPTER 1 ....................................................................................................................... 9
1. BACKGROUND .......................................................................................................... 9
1.1. General Descriptions of Lake Hawassa ............................................................................................... 9
1.2. Past Records and Possible Changes in the Water Quality of Lake Hawassa ...................................... 13 1.2.1. Ionic composition and salinity ........................................................................................................... 14 1.2.2. Chlorophyll-a and nutrients ............................................................................................................... 14 1.2.3. Toxic substances ................................................................................................................................ 15
1.3. Human Activity as a Cause of Water Quality Changes in Lake Hawassa............................................ 16 1.3.1. Urbanization and industrialization .................................................................................................... 16 1.3.2. Deforestation and agricultural activities ........................................................................................... 17 1.3.3. Possible Long-Term Consequences of the Changes in the Water Quality of Lake Hawassa ............. 18 1.3.4. Impaired water quality ...................................................................................................................... 18 1.3.5. Habitat modification and biodiversity loss ........................................................................................ 18 1.3.6. Health risk .......................................................................................................................................... 19
CHAPTER 2 ..................................................................................................................... 21
2. ASSESSEMENT OF THE PRESENT STATE OF LAKE HAWASSA WITH RESPECT TO POLLUTION..................................................................................................................... 21
2.1. Sources and Routes of Pollutants to the Lake................................................................................... 23 2.1.1. Point sources of pollution .................................................................................................................. 23
2.1.1.1. Hawassa Textile Factory (HTF) ................................................................................................. 24 2.1.1.2. Moha Hawassa Soft Drinks Factory (MHSDF) .......................................................................... 26 2.1.1.3. BGI Hawassa Brewery Factory (BGI-BF) ................................................................................... 27 2.1.1.4. Tabor Ceramics Factory (TCF) ................................................................................................. 27 2.1.1.5. Etab Soap Factory (ETAB-SF) .................................................................................................... 28 2.1.1.6. Hawassa University Referral Hospital (HURH) ......................................................................... 29
2.1.2. Non-point sources of pollution .......................................................................................................... 30 2.1.2.1. Run-off from urban settings ....................................................................................................... 30 2.1.2.2 Runoff from rural areas ................................................................................................................... 32
2.1.3 Pollutants in Lake Hawassa ..................................................................................................................... 33

2
2.1.3.1 Pollutants in the lake water ............................................................................................................ 33 2.1.3.2 Pollutants in the sediment .............................................................................................................. 35 2.1.3.3 Pollutants in fish ............................................................................................................................ 35
2.2. Possible Adverse Effects of Pollution ............................................................................................... 36 2.2.1. Effects of pollution on water quality ................................................................................................. 36 2.2.2. Effects on aquatic life ........................................................................................................................ 37 2.2.3. Effect on domestic and wild life ........................................................................................................ 38 2.2.4. Effects on humans ............................................................................................................................. 39 2.2.4.1. Human health risk ......................................................................................................................... 39 2.2.4.2. Effects on livelihoods .................................................................................................................... 41
PART B ........................................................................................................................... 43
MITIGATION MEASURES AND INTERVENTION STRATEGIES .............................................. 43
CHAPTER 3 ..................................................................................................................... 45
3. MITIGATION MEASURES.......................................................................................... 45
3.1. Possible Mitigation Measures (PMM) at the Point Sources .............................................................. 45 3.1.1. Prevention and control measures ..................................................................................................... 47
3.1.1.1. EIA-Follow up ........................................................................................................................... 47 3.1.1.2. Minimize chemical use ............................................................................................................. 49 3.1.1.3. Minimize solid and liquid wastes ............................................................................................. 49
3.1.2. Remediation measures ...................................................................................................................... 50 3.1.2.1. Physical remediation ................................................................................................................ 50 3.1.2.2. Biological remediation ............................................................................................................. 50
3.2. PMM at the Non-point Sources ........................................................................................................ 51 3.2.1. Integrated solid waste management (ISWM) and reduce, reuse and recycle (3Rs) ......................... 51 3.2.2. Agricultural best management practices (ABMPs) ............................................................................ 52
3.3. PMM at the routes ........................................................................................................................... 53 3.3.1. Wetland vegetation along the catchment ......................................................................................... 53 3.3.2. Construction of filtering racks along drainage Canals ....................................................................... 56 3.3.3. Cover vegetation for reducing flow of storm water .......................................................................... 56 3.3.4. Diverting effluents ............................................................................................................................. 56 3.3.5. Digging ditches .................................................................................................................................. 57
3.4. PMM at the Hot Inlet Spots and Shorelines ...................................................................................... 58 3.4.1. Phytoremediation .............................................................................................................................. 59 3.4.2. Storm water management (SWM) .................................................................................................... 60 3.4.3. Establishment of buffer zone ............................................................................................................ 60
3.5. Recommended Cost Effective Mitigation Measures (RCMM) at the Specific Target Sites ................. 61 3.5.1. RCMM at Specific Point Sources ........................................................................................................ 63
3.5.1.1. Hawassa Textile Factory (HTF) ................................................................................................. 63 3.5.1.2. Moha Hawassa Soft Drinks Factory (MHSDF) and BGI Hawassa Brewery Factory (BGIHBF) ... 65 3.5.1.3. Tabor Ceramics Factory (TCF) .................................................................................................. 66 3.5.1.4. ETAB- Soap Factory (ETAB-SF) .................................................................................................. 67 3.5.1.5. Hawassa University Referral Hospital (HURH) ......................................................................... 67
3.5.2. RCMM at non-point sources .............................................................................................................. 68 3.5.2.1. Households, hotels, health centers and other public service rendering institutions .............. 68

3
3.5.2.2. Agricultural fields ..................................................................................................................... 68 3.5.3. RCMM at specific routes.................................................................................................................... 69
3.5.3.1. Industrial effluent route ........................................................................................................... 69 3.5.3.2. Drainage canal/surface storm .................................................................................................. 70
3.5.4. RCMM at specific inlet spots ............................................................................................................. 71 3.5.4.1. Tikur Wuha Site ........................................................................................................................ 71 3.5.4.2. Amora Gedel Site ..................................................................................................................... 73 3.5.4.3. Referral Hospital Site ............................................................................................................... 73 3.5.4.4. Green Wood – Unique Park Site .............................................................................................. 73
3.5.5. RCMM along the shoreline ................................................................................................................ 74
CHAPTER 4 ..................................................................................................................... 77
4. INTERVENTION STRATEGIES .................................................................................... 77
4.1. Institutional Arrangements .............................................................................................................. 78 4.1.1. Institutional capacities ....................................................................................................................... 78
4.1.1.1. Sectoral environmental units ................................................................................................... 78 4.1.1.2. Integrated waste management system in urban public administration .................................. 79 4.1.1.3. Environmental management system (EMS) in industries ........................................................ 81
4.1.2. Institutional coordination and communication ................................................................................. 81
4.2. Legal Frameworks ............................................................................................................................ 82 4.2.1. Environmental awareness or education program ............................................................................. 82 4.2.2. Legal enforcement/ compliance ........................................................................................................ 84
4.3. Social Arrangements for Pollution Control ....................................................................................... 85 4.3.1. Organizing environmental concern group ......................................................................................... 85 4.3.2. Experience on organizing ECG ........................................................................................................... 86 4.3.3. Roadmap to concise guide /manual for ECG ..................................................................................... 87
4.4. Recommended Intervention Strategies ............................................................................................ 91
REFERENCES ................................................................................................................... 93

4
I. ACRONYMS AMBP Agricultural Management Best Practices
BGI-BF BGI Brewery Factory
BOD Biological Oxygen Demand
CBO Community Based Organization
CEO Chief Executive Officer
COD Chemical Oxygen Demand
DDT Dichlorodiphenyltrichloroethane
EC European Commission
ECG Environmental Concern Group
EEPA Ethiopian Environmental Protection Authority
EIA Environmental Impact Assessment
EMS Environmental Management System
EPA Environmental Protection Authority
ERVL Ethiopian Rift Valley Lakes
ETAB-SF Etab Soap Factory
ETSC Ethiopian Tannery Share Company (Mojo)
FAO Food and Agricultural Organization
HECG Hawassa Environmental Concern Group
HTF Hawassa Textile Factory
HURH Hawassa University Referral Hospital
KTSC Kombolcha Textile Share Company
MHSDF Moha Hawassa Soft Drink Factory
MOH Ministry of Health
MOJ Ministry of Justice
MOWR Ministry of Water Resources
MPI Metal Pollution Index
MPL Maximum Permissible Level
MSLWM Municipal Solid and Liquid Waste Management
NGO Non-Governmental Organization
PMM Possible Mitigation Measures

5
POP Persistent Organic Pollutant
RCMM Recommended Cost Effective Measures
RT Research Team
SNNPRS Southern Nations and Nationality Peoples Regional State
SRP Soluble Reactive Phosphorus
TCF Tabor Ceramics Factory
TDS Total Dissolved Solid
TEA Toronto Environmental Alliance
TS Total Solid
UNEP United Nations Environment Program
USEPA United State Environmental Protection Authority
WHO World Health Organization

6
II. EXCUTIVE SUMMARY Lake Hawassa, being an urban lake, is exposed to increased population pressure, and there are
indications that the lake is going through degradation in its water quality. Such changes, unless
immediate actions are taken, may eventually lead to irreversible ecosystem changes that will
compromise the environmental, economic and cultural importance of the lake. Therefore, the need for
possible management and conservation actions has been staged by: aquatic scientists,
environmentalists, government agencies, NGOs and many other concerned groups. It is out of this
concern for the lake that the SOS-Sahel – Ethiopia took the initiative to answer the urgent call with
respect to the conservation and management of the lake and its valuable resources.
This report is on a study carried out on Lake Hawassa as part of a project that SOS-Sahel - Ethiopia
envisages to undertake on “Enhancing Climate Resilience, Food and Nutrition Security in the Lake
Hawassa ecosystem”. In order to take one of the outputs - “Concentrations of pollutants in Lake
Hawassa contained below the maximum permissible levels (MPL)” into account, a research team
(RT) from the Biology Department of Hawassa University was commissioned to identify cost effective
mitigation measures to bring down concentrations of pollutants that enter Lake Hawassa. This
included: identification of sources of pollutants, their routes and inlets to the lake, assessment of
potential adverse impacts of the pollutants, and identification of mitigation measures at the different
target sites and intervention strategies. This is directly related to the third outcome “secured and
sustainable use of key natural resources”.
The RT generated primary data through a number of field observations, visits to factories and
relevant government offices in Hawassa, and secondary data through library and Internet search.
The information gathered has been analysed and put together in this report that covers:
background information on Lake Hawassa and its present status with respect to pollution;
types, sources and routes of the pollutants and their possible effects on the lake ecosystem;
practical aspects of mitigation measures, and the possible intervention strategies.
The recommended mitigation methods and intervention strategies presented in the report are believed
to be the most cost effective mechanisms for containing the concentrations of pollutants in Lake
Hawassa below the maximum permissible levels in freshwater bodies. Therefore, the RT believes that
the objectives of its assignment have been accomplished.

7
III. GENERAL INTRODUCTION The Ethiopian rift valley lakes (ERVL) are a chain of very productive lakes that contain
edible fish, and support a variety of aquatic and terrestrial wildlife. The lakes play a very
important role in tourism, biodiversity conservation and in ameliorating the effects of drought
and protein shortage of the population (Wood and Talling, 1988). Lake Hawassa is one of
these ERVL which has a significant environmental, economic and cultural importance to the
region. The lake has been used for commercial fisheries, irrigation, and recreation and for
some domestic purposes (Zinabu Gebremariam, 2002; 2003a; 2003b). In spite of its
importance to the livelihood of the population, there are indications that Lake Hawassa is
going through changes that, unless immediate actions are taken, may lead to irreversible
degradation in its water quality and fisheries (Zinabu Gebremariam & Elias Dadebo, 1989;
Zinabu Gebremariam, 2002a; 2003b). Lake Hawassa, being an urban lake, is exposed to
increased population pressure; therefore it is probably one of the most polluted of the ERVL.
This calls for immediate management and conservation actions to protect the lake ecosystem.
The major short-fall in the conservation and management of Lake Hawassa, and the ERVL at
large, had been lack of scientific information on the lake (Zinabu Gebremariam & Elias
Dadebo, 1989; Zinabu Gebremariam, 2002, 2003a). However, in the last two decades several
studies have been conducted on Lake Hawassa by a number of Doctoral and Masters Students
and other researchers working on the limnology, fisheries, ecotoxicology, and other aspects
of the lake. In spite of such encouraging developments with respect to research on this lake,
we see very little effort being made with respect to the conservation and management of the
lake and its valuable resources. The present initiative by SOS- Sahel is therefore a very
timely initiative to protect the lake from further degradation.
This study is part of the project on ‘Enhancing Climate Resilience, Food and Nutrition
Security in the Lake Hawassa ecosystem’. It is directly related to the third outcome “secured
and sustainable use of key natural resources” and output 10 “concentrations of pollutants in
Lake Hawassa contained below the maximum permissible levels (MPL)”.
The general objectives of our assignment are to identify cost effective mitigation measures to
bring down concentrations of pollutants that enter Lake Hawassa and the possible
mechanisms to reduce the inflow of wastes to the lake.
8
The specific objectives include:
identification of sources of pollutants, their routes and inlets to the lake;
assessment of potential adverse impacts of the pollutants;
identification of mitigation measures at the different target sites and intervention
strategies.
In order to accomplish this task the Research Team (RT) generated secondary data through
library and Internet search, made a number of field observations through survey, and visited
factories and relevant government offices in Hawassa. The outcomes of the different sites
visited and the observations made have been used as additional source (to the secondary data)
of information for the analyses of the results of this study.
This report has been organized in two parts comprising of two chapters each. In the first two
chapters, background information on Lake Hawassa and its present status with respect to
pollution is presented setting the contextual scene for types, sources and routes of the
pollutants and possible effects on the lake ecosystem. The two chapters of the second part of
the report deal with the practical aspects of mitigation measures and the possible intervention
strategies. The report culminates with recommendations that have emanated from the study.

9
PART A
GENERAL BACKGROUND ON LAKE HAWASSA AND ASSESSMENT OF ITS PRESENT STATE
CHAPTER 1
1. BACKGROUND In this section of the report, information from past and present studies is put together to shade
light on the present status of Lake Hawassa and the future trends of its water quality. Data
from recent studies (mostly from our own work) have been used to evaluate the main causes
of unfavourable changes in the lake. The section is presented in such a way that it can be
used as a prologue that will lead to the analyses in the subsequent sections.
1.1. General Descriptions of Lake Hawassa
Lake Hawassa is located in the main Ethiopian rift-valley at Latitude / Longitude: 6° 58' –
7° 8' N / 38° 22’ - 38° 27' E. (Alemayehu Esiayas, et al. 2011)1. The lake is the smallest of
the chain of rift valley lakes in southern Ethiopia (Fig. 1). In terms of its surface area, it had
been mostly reported to be 88 - 90 km2 (Elizabeth Kebede, 1994; Ayenew et al. 2007; – cited
in Mulugeta Dadi, 2013). Ashenafi Madebo & De Smedt (2007) and Mulugeta Dadi (2013)
have recently reported that the lake has a surface area of 95 and 96 km2, respectively –
findings that would await confirmation by other studies. The catchment of Lake Hawassa is
located at Latitude/Longitude 6º 45’ to 7º 15' N / 38º 15' to 38º 45' E (Mulugeta Dadi, 2013).
According to Ashenafi Madebo & De Smedt (2007) and Mulugeta Dadi (2013), the total
drainage area of the lake, including the lake, has been reported to be 1371.6 and 1436.5 km2,
respectively.
The lake has a maximum depth of about 22m2 and a mean depth of 11m (Wood & Talling,
1988, Elizabeth Kebede et al., 1994). The major morphometric and physical features of Lake
Hawassa are given in Table 1).
1 The location of the lake has been variably shown in different sources including Google Earth. We have chosen to use this information partly because it indicates the ranges of the Latitude/Longitude. 2 Maximum depths of 21 and 23m have been reported by different workers.

10
A
D
B
C
Main Ethiopian Rift Valley Basin (MER)
Lake Hawassa Catchment (Clipped SPOT5 image)3D view of Lake Hawassa
Surface area=96 km2
52,000 km2
Figure 1. Maps of Lake Hawassa at different scales [Source: Mulugeta Dadi (2013)]

11
Table 1. The major morphometric and physical features of Lake Hawassa. Where references are not cited, data are from Elizabeth Kebede (1994).
Altitude (m.a.s.l.)
Surface area (km2)
Max. depth (m)
Mean depth (m)
Catchment (km2)
Volume (km3)
1680 90 23 10.7 1250 1.34c
95a 23.4 b 13.3 b 1436.5 b 1.36 e
96b 22c,d
a Ashenafi Madebo & De Smedt (2007); b Mulugeta Dadi (2013); c Wood & Talling (1988); d Grove et al. (1975), eAyenew et al. (2007) – cited in Mulugeta Dadi (2013)
Lake Hawassa is a terminal lake completely enclosed by faulting with no visible surface
outflow from the lake. It is fed by Tikur Wuha River which drains a swampy wetland -
Shallo (locally known as Cheffe – the transliteration of which is swamp). Although Lake
Hawassa has no surface outlet, it is relatively dilute (Von Dam & Edmond, 1984) with a
conductivity of about 780 - 965 uS cm-1 (Zinabu Gebremariam, et al. 2003). Like most
African and Ethiopian rift-valley lakes, the dominant ions in this lake are sodium and
bicarbonate (Elizabeth Kebede, et al. 1994, Zinabu Gebremariam et al., 2002, Zinabu
Gebremariam, 2003, and references cited therein).
Levels of plant nutrients like phosphate, silica and the various forms of inorganic nitrogen
(nitrite, nitrate and ammonia) are within world ranges and show large seasonal variations
(Zinabu Gebremariam & Taylor, 1989; Elizabeth Kebede et al. 1994, Zinabu Gebremariam et
al. 2002; Girma Tilahun, 2006). Some chemical and biological features of Lake Hawassa are
given in Table 2.
The phytoplankton biomass and productivity of this lake is dominated by small blue green
algae (cyanobacteria) and large Botryococcus (Elizabeth Kebede, 1987; Taylor and Zinabu
Gebremariam, 1989; Girma Tilahun, 2006). The rate of primary production in the lake has
been studied by various workers (Demeke Kifle, 1985; Zinabu Gebremariam, 1988; Girma
Tilahun, 2006; Girma Tilahun and Ahlgren, 2010) and is reported to show a wide seasonal
variability. Zinabu Gebremariam (1988) reported 131 – 371, and 211 – 511 mg C/m2/hr. of
net and gross photosynthesis, respectively. Girma Tilahun (2006) reported net photosynthesis
of 123 - 437 mg C/m2/hr. and 1.33 – 4.72 g C/m2/day. The bacterioplankton density of the
lake fluctuates between 3.88 - 8.33 million per millilitre of water (Zinabu Gebremariam,

12
1988; Zinabu Gebremariam and Taylor, 1989; 1990). The zooplankton fauna of Lake
Hawassa is a mixture of several species of crustaceans dominated by cyclopods (Seyoum
Mengistou, 1989; Seyoum Mengistou et al. 1991). All planktonic variables of Lake Hawassa
show distinct seasonal variations mostly dictated by the rains and events of mixing of the lake
(Elizabeth Kebede, 1987; Zinabu Gebremariam, 1988; Zinabu Gebremariam and Taylor,
1989; Seyoum Mengistou, 1989; Girma Tilahun, 2006). The littoral area of Lake Hawassa
consists of large weed beds (emergent and submergent macrophytes) and a diverse
invertebrate benthic community (Tilahun Kibret, 1985; Tilahun Kibret and Harrison, 1989;
Tudorancea and Zullini 1989). The wildlife includes waterfowls, Nile monitor lizard
(Varanus niloticus), otter (Lutra lutra), and hippopotamus (Hippopotamus amphibious), etc.
(Tilahun Kibret, 1985). Most of the flora and fauna, except the fish, have not been
adequately studied but the wealth of the biodiversity of the lake is remarkable.
Table 2. Some chemical and biological features of Lake Hawassa. The values in parentheses ( ) and
square brackets [ ] indicate sample sizes and ranges, respectively. Data are from
Zinabu Gebremariam et al. (2002b) and Zinabu Gebremariam (2003a)
Electrical conductivity (µS = µmho) 846 (22) [780 – 965]
Salinity (mg/L) 736 (4) [700 – 850]
Sum of cations (meq/L) 8.8 (5) [7.56 – 9.97]
Sum of anions (meq/L) 8.8 (5) [8.4 – 9.4]
pH 8.8 (22) [8.3 – 9.1]
NO3 · N (nitrate-nitrogen, µg/L) 13.95 (26) [0 – 58.3]
NH4+. N (ammonia-nitrogen, µg/L) 104.35 (26) [0 – 1328]
SRP (soluble reactive phosphorus, µg/L) 16.9 (22) [0 – 59]
SiO2 (silicate, mg/L) 38.6 (19 - 65)
Chlorophyll-a (µg/L) 23.4 (26) [8.3 – 34]
13
Lake Hawassa supports at least six species of fish: the Nile tilapia (Oreochromis niloticus),
the African sharp-tooth catfish (Clarias gariepinus), the African big barb (Barbus
intermedius), the small barb (Barbus paludinosus), the cyprinid minnow (Garra
quadrimaculata), and the cyprinodont minnow (Aplocheilichthyes antinorii) (Zerihun Desta
et al., 2006 and references cited therein). The Nile tilapia Oreochromis niloticus accounts for
nearly 90% of the total landing, while the African sharptooth catfish Clarias gariepinus, and
African big barb Barbus intermedius contribute only 7 and 3%, respectively, of the total
commercial catch (Elias Dadebo 2000, and references cited therein). The other three small
fish species, the small barb Barbus paludinosus, the cyprinid minnow Garra quadrimaculata,
and the cyprinodont minnow Aplocheilichthyes antinorii have not been directly utilized by
the local fishery, but have a vital ecological role as fish prey by some of the larger fish
species (Demeke Admassu and Elias Dadebo, 1997).
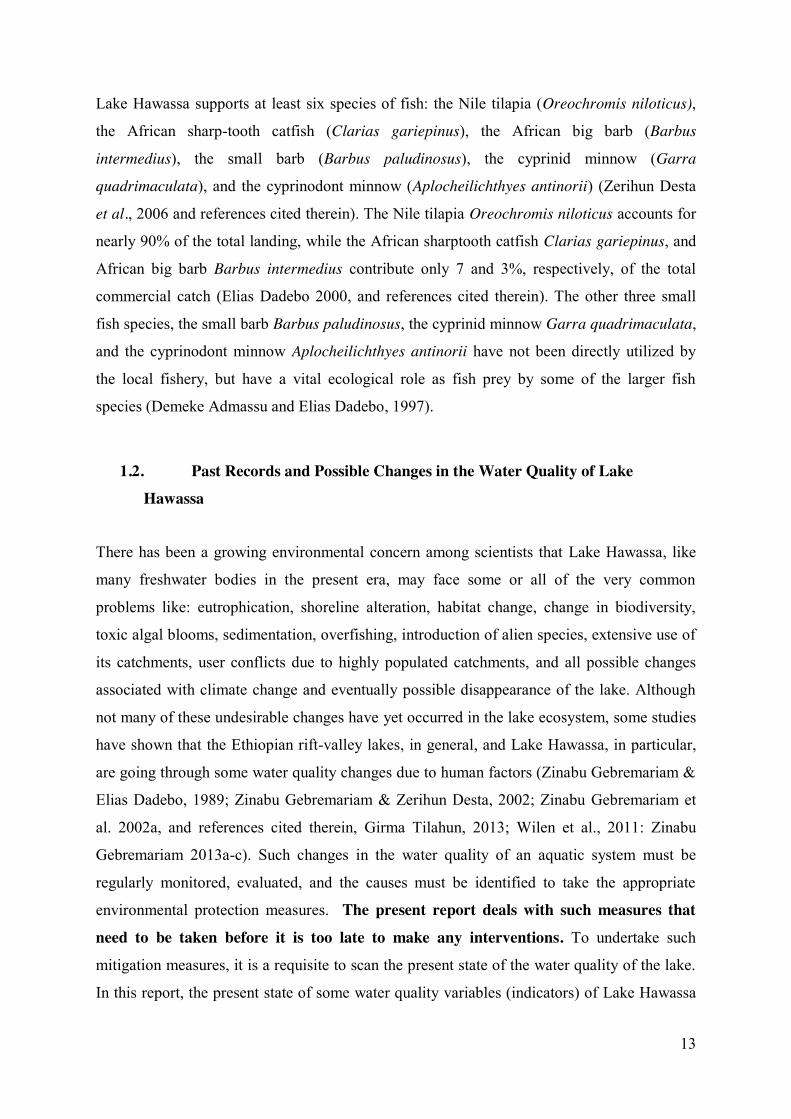
1.2. Past Records and Possible Changes in the Water Quality of Lake Hawassa
There has been a growing environmental concern among scientists that Lake Hawassa, like
many freshwater bodies in the present era, may face some or all of the very common
problems like: eutrophication, shoreline alteration, habitat change, change in biodiversity,
toxic algal blooms, sedimentation, overfishing, introduction of alien species, extensive use of
its catchments, user conflicts due to highly populated catchments, and all possible changes
associated with climate change and eventually possible disappearance of the lake. Although
not many of these undesirable changes have yet occurred in the lake ecosystem, some studies
have shown that the Ethiopian rift-valley lakes, in general, and Lake Hawassa, in particular,
are going through some water quality changes due to human factors (Zinabu Gebremariam &
Elias Dadebo, 1989; Zinabu Gebremariam & Zerihun Desta, 2002; Zinabu Gebremariam et
al. 2002a, and references cited therein, Girma Tilahun, 2013; Wilen et al., 2011: Zinabu
Gebremariam 2013a-c). Such changes in the water quality of an aquatic system must be
regularly monitored, evaluated, and the causes must be identified to take the appropriate
environmental protection measures. The present report deals with such measures that need to be taken before it is too late to make any interventions. To undertake such
mitigation measures, it is a requisite to scan the present state of the water quality of the lake.
In this report, the present state of some water quality variables (indicators) of Lake Hawassa
14
will be evaluated in light of past records. Possible causes for the changes that have taken
place will be discussed in the subsequent sections in order to lay the foundation for the
mitigation measures proposed in the document.
1.2.1. Ionic composition and salinity A study on the long-term changes in seven Ethiopian rift-valley lakes (Zinabu Gebremariam
et al., 2002b) has shown that the chemical concentrations of Lake Hawassa has decreased and
the lake has become more dilute over the last 40 years. This study also revealed that, unlike
the rest of the ERVL, (with the exception of Lake Langano) the salinity (and its correlates -
conductivity, alkalinity and sodium concentrations) of the lake has decreased since the early
1960’s. It is possible that the lake could have been saline at one point in time and then
changes associated to water level may have diluted the lake. This suggests that the water
level and the chemical concentrations of the lake may have fluctuated over the years.
Although ions are variously concentrated or diluted depending on a number of biological and
abiotic processes, a combination of natural factors like subterranean seepage-out of solutes,
augmented by seepage-in of more dilute underground water, inflowing dilute surface waters,
and precipitation of some minerals (Wood & Talling, 1988), may have played a role in
counteracting the effects of evapo-transpiration in Lake Hawassa - making it less saline than
it was in the past. Given the results from the most recent hydrological studies (Mulugeta
Dadi, 2013) it is very likely that inflowing surface waters and seepage-in of underground
water may have contributed to the changes in the salinity of the lake water.
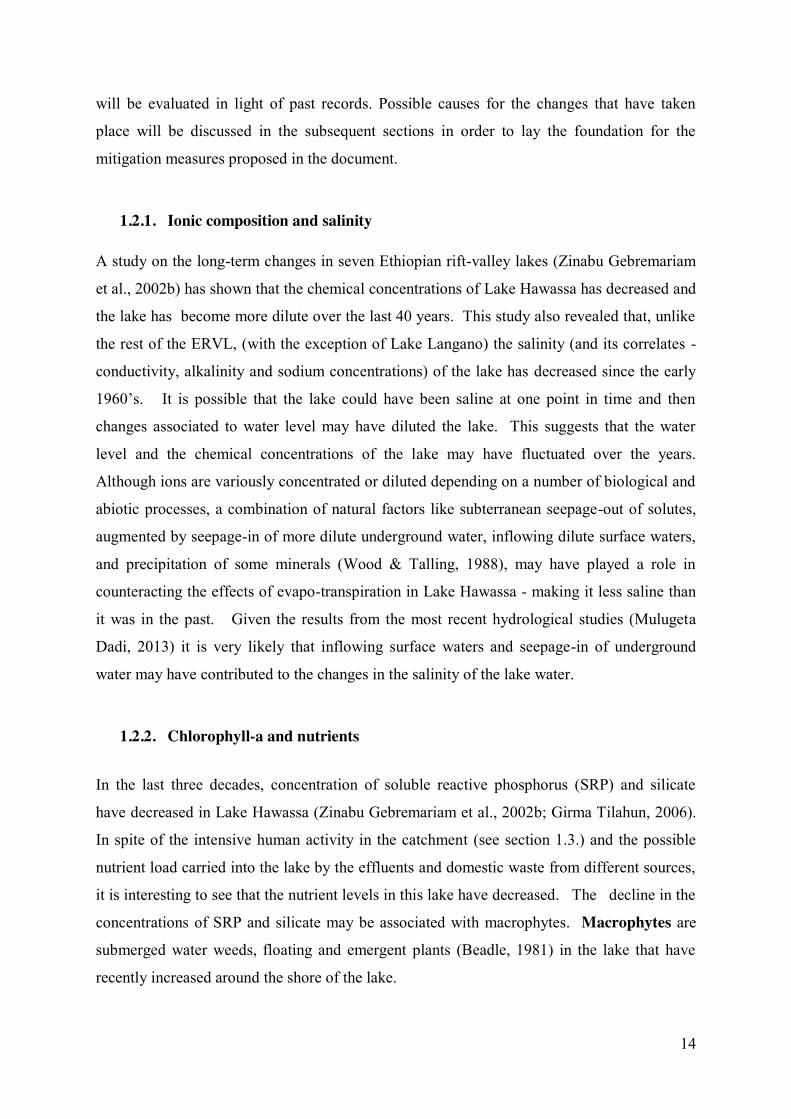
1.2.2. Chlorophyll-a and nutrients
In the last three decades, concentration of soluble reactive phosphorus (SRP) and silicate
have decreased in Lake Hawassa (Zinabu Gebremariam et al., 2002b; Girma Tilahun, 2006).
In spite of the intensive human activity in the catchment (see section 1.3.) and the possible
nutrient load carried into the lake by the effluents and domestic waste from different sources,
it is interesting to see that the nutrient levels in this lake have decreased. The decline in the
concentrations of SRP and silicate may be associated with macrophytes. Macrophytes are
submerged water weeds, floating and emergent plants (Beadle, 1981) in the lake that have
recently increased around the shore of the lake.
15
Chlorophyll-a levels measured during 1990–2000 in Lake Hawassa (Zinabu Gebremariam et
al., 2002) were much lower than the values recorded during the 1960s and 80s. These values
have further decreased in the 2005/2006 seasonal study of Girma Tilahun (2006). The
decrease in the chlorophyll concentrations may be attributed to the decline in the fisheries of
the lake, and the increase in the transparency of the lake may have resulted from the decline
in the concentration of the chlorophyll-a.
Treating the changes that may have taken place in the concentrations of chlorophyll-a,
phosphate and silicate in Lake Hawassa may shade a picture on whether or not there is a sign
of the widely assumed eutrophication in the lake. Eutrophication is a process where increased
growth of certain phytoplankton (algae) takes place in a lake due to high levels of nutrients
deposited into it. Such events occur especially when a lake is subjected to increased
depositions of nutrients due to human activities. However, the low chlorophyll-
concentrations, in conjunction with results from SRP and silicate analyses, suggest that there
is no sign of algal eutrophication in Lake Hawassa as yet. However, all the possible driving
forces that lead to eutrophication are at work in and around the lake – suggesting that
preventive measures have to be taken immediately to protect the lake from such
environmental problems.
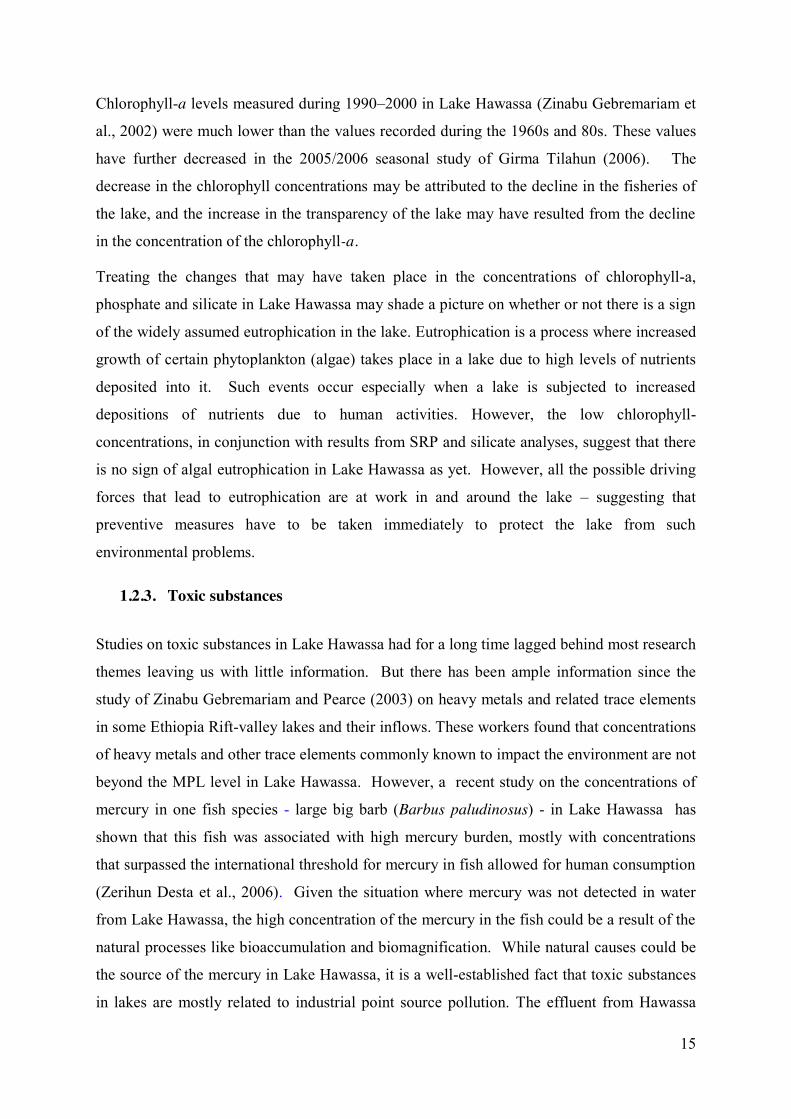
1.2.3. Toxic substances
Studies on toxic substances in Lake Hawassa had for a long time lagged behind most research
themes leaving us with little information. But there has been ample information since the
study of Zinabu Gebremariam and Pearce (2003) on heavy metals and related trace elements
in some Ethiopia Rift-valley lakes and their inflows. These workers found that concentrations
of heavy metals and other trace elements commonly known to impact the environment are not
beyond the MPL level in Lake Hawassa. However, a recent study on the concentrations of
mercury in one fish species - large big barb (Barbus paludinosus) - in Lake Hawassa has
shown that this fish was associated with high mercury burden, mostly with concentrations
that surpassed the international threshold for mercury in fish allowed for human consumption
(Zerihun Desta et al., 2006). Given the situation where mercury was not detected in water
from Lake Hawassa, the high concentration of the mercury in the fish could be a result of the
natural processes like bioaccumulation and biomagnification. While natural causes could be
the source of the mercury in Lake Hawassa, it is a well-established fact that toxic substances
in lakes are mostly related to industrial point source pollution. The effluent from Hawassa

16
textile factory (HTF) was reported to have contained high concentrations of heavy metals
commonly known to be very toxic including: mercury, arsenic, cadmium, copper, and
chromium (Zinabu Gebremariam & Zerihun Desta 2002). Most of the levels of these heavy
metals in the treated effluent from the factory were much higher than the international
average values for freshwaters. Solomon Aragie (2013) reported relatively high concentrations
of Hg (0.12 μg/L) in effluent from Hawassa referral hospital. Higher mercury in water samples
taken from Tikur Wuha, Amoara Gedel, Referral Hospital and Lokae compared with
reference sites have been reported by Girma Tilahun and Tigist Ashagre (2011). It has
therefore been concluded that anthropogenic causes (point & non-point sources) could be the
sources of the mercury that was detected in the fish of Lake Hawassa (see Chapter 2).
Therefore, there is an indication that the effect of chemicals from the various sources but
most probably from the point sources is already at work. This issue is discussed in detail
under Chapter 2 of this report.
1.3. Human Activity as a Cause of Water Quality Changes in Lake Hawassa Water quality changes in lakes are mostly caused by different kinds of human activities, and
the changes in Lake Hawassa that we have presented so far and those in Chapter 2 of this
report may be due to pressures from a variety of interlinked human activities. The most
critical impacts of human activities that have possibly caused and/or will continue to cause
degradation of the water quality of Lake Hawassa are very briefly described hereunder.
1.3.1. Urbanization and industrialization
It has been recognized that urbanization and industrialization in close proximity to the
Ethiopian rift-valley has exerted the greatest human impacts on water quality and quantity
(Zinabu Gebremariam & Elias Dadebo, 1989; Zinabu Gebremariam, 2002a, 2003a). Lake
Hawassa is found adjacent to one of the fastest growing cities in Ethiopia (Hawassa), and the
growing human population and intensive economic activities of the city have raised serious
environmental concerns with respect to the water quality of the lake (Zinabu Gebremariam &
Elias Dadebo, 1989; Zinabu Gebremariam, 2002, 2013a)
The high population growth in Hawassa coupled with the unprecedented increase in industrial
activities has led to human impacts like uncontrolled discharge of industrial and domestic
waste into the lake. This is the most serious effect on water quality related to urbanization -
17
its use for waste disposal. Garbage containing plastic bags and disposable bottles, mostly
brought into the lake by the furious flood after the heavy rains, is among the emerging
environmental problems of Lake Hawassa. All these situations may be considered as latent
threats to future environmental problems in the lake and hence call immediate actions.
1.3.2. Deforestation and agricultural activities
Intensive agricultural and deforestation activities in the catchments are serious environmental
problems in most Ethiopian rift-valley lakes (Zinabu Gebremariam and Elias Dadebo, 1989;
Zinabu Gebremariam, et. al. 2002; Zinabu Gebremariam 2002a, 2003a). Human settlement
and urbanization in the drainage basin of Lake Hawassa is concentrated mostly in the Eastern
part of the catchment with the rest of it left to various agricultural activities. We have been
able to verify that in the part of the catchment where there is agricultural activity; there is
very little plant cover because of the increased tilling of the land and overgrazing of the
vegetation. Therefore, the soil is exposed to erosion. This has been the trend for many years
and will probably continue the same way. Such land use and degradation of catchments will
certainly lead to increased input of sediment (sediment inundation) and nutrients which will
eventually cause eutrophication of the lake.
One other aspect of increased agricultural activity in catchments of water bodies is chemical
pollution from fertilizers and pesticides. The fertilizers and pesticide in the soil may reach the
lake and eventually reach out the aquatic life including fish. The pioneering studies on
persistent organic pollutants (POPs) in some ERVL including Lake Hawassa (Ermias
Deribe et al., 2011, 2013a, b and Ermias Deribe, 2012) have shown that
Dichlorodiphenyltrichloroethanes (DDTs), endosulfans, PCBs, chlordane, and chlorpyrifos
were all POPs detected in fish from Lakes Koka, Ziway and Hawassa, and DDT was the
predominant contaminant detected. Although the sum of DDTs found were lower than those
found in most studies carried out in other African lakes, the presence of DDT in all muscle
tissue samples collected from all fish species in the lakes indicates the magnitude of the
incidence. While repeated studies have not been carried out with respect to POPs in Lake
Hawassa, the results so far indicate that the ultimate impacts of such chemicals on the lake
cannot be undermined.

18
1.3.3. Possible Long-Term Consequences of the Changes in the Water Quality of Lake Hawassa
From the sequence of events described in the preceding sections, one can deduce that the
recent changes in water quality of Lake Hawassa are decrease in the salinity, decline in the
nutrient and chlorophyll-a concentrations of the water, and higher level of toxic substances in
fish. Moreover, domestic waste and industrial effluents associated with urbanization and
industrialization seem to be the most notable threats to the water quality in Lake Hawassa.
From the outset, none of these events may seem to be alarming. However, a closer look at
the events sends a signal of warning. In the following section we will make an assessment of
the future trends in the water quality of Lake Hawassa from the perspective of the events
described in the foregoing sections.
1.3.4. Impaired water quality Although the present quality of the water of Lake Hawassa is not yet impaired and it is
suitable for both domestic purposes and irrigation (Zinabu Gebremariam, 2002a, 2003a), the
future trends may not continue to be as optimistic as they are now. The effluents from the
factories/industries and domestic/municipal wastes from the city pose a big threat to the lake.
Such industrial effluents and domestic sewage will contribute large quantities of nutrients and
toxic substances that have a number of adverse effects on the lake and the biota. The
immediate response of the lake to the added nutrients will be increase in biomass of plankton
- the major symptom of eutrophication, which will lead to reduced water clarity and oxygen
levels. These natural processes will in turn bring about taste and odour problems of the water
and loss of fisheries. Lake Hawassa, which at the moment is the main recreation centre of the
public, will not be an attraction thereafter. Therefore, the environmental, economic and
cultural impacts of such changes will be very damaging.
1.3.5. Habitat modification and biodiversity loss
The decrease in the salinity of Lake Hawassa over the last three decades may be considered
less evil (with respect to water quality) than a possible increase as in the other Ethiopian rift-
valley lakes (Elizabeth Kebede et al, 1994, Zinabu Gebremariam, 2002b; 2003b; Zinabu

19
Gebremariam, et al., 2002 b). However, this scenario may be rather unpleasant if the decline
in the salinity of Lake Hawassa is due to macrophytes which can contribute to the decline in
the salinity of the lake through direct uptake of ions (Talling, 1992). If this mechanism is the
cause for the decrease in the salinity of the lake, it will probably continue for ever as the
shores of Lake Hawassa are being invaded by macrophytes at an alarming speed (personal
observation of the authors). Such situations will lead to a significant habitat modification that
will affect the biodiversity of the lake.
The decrease in the concentrations of chlorophyll-a, phosphate and silicate in Lake Hawassa
may also be considered as healthy, because it rules out eutrophication. However, if the
decline in the chlorophyll-a is due to a decline in the fisheries of the lake, and if the decreases
in the concentrations of SRP and silicate are associated with macrophytes (see above), the
causes for the changes in these variables may not be optimistic. Such changes may lead to
changes in phytoplankton species composition. Moreover, the decline in nutrient
concentrations may limit algal production, ultimately affecting the fisheries production of the
lake. Because the most consumed fish in Lake Hawassa, the Nile tilapia, gains its nutrition
directly from the phytoplankton as an adult and relies on the littoral food-web in its juvenile
stages, the decline in phytoplankton biomass, although good news with respect to water
quality, is bad news with respect to the fisheries.
1.3.6. Health risk3 The public health hazard of the toxic substances (particularly the heavy metals) in the effluent
from Hawassa textile factory (HTF) has not been established but its impact cannot be
discounted. The study on the mercury concentration in large big barb (Barbus paludinosus)
showed that its concentrations tended to increase with fish size which many people prefer to
eat (Zerihun Desta, 2007). At the same time, large big barb is the least preferred fish by the
public and hence not sold out but ends up being regularly consumed by the fishermen and
their family members who probably cannot afford to buy other kind of food as alternate
animal protein source. Regular consumption of fish with such large concentration of mercury
is undoubtedly a serious public health issue. The human health risk assessment was
determined in a study by Ermias Deribe (2012) and Ermias Deribe et al., (2014) where
consumption of a certain amount of fish from the ERVL including Lake Hawassa, could pose 3 This is discussed in more detail in Chapter 2 of this report.

20
a threat to health because of POPs and mercury present in the fish. According to this study,
children and pregnant women of the local community, especially the subsistence fishermen
and their families are the most vulnerable population sub-group.
Other issues related to water quality like pathogenic organisms have not been studied in Lake
Hawassa. However, for a lake that, in one way or another, is linked to various sources of
domestic sewage, hospital effluent, etc., problems related to water quality will continue to be
concealed public health problems until identified and the proper measures are taken. This
should be of a very serious importance to the neighbouring villages as the water from the lake
is consumed by the people and their domestic animals (see chapter 2 of this report for further
treatment of this issue).
In a nut-shell, if the present trend of human impacts, especially those related to the industrial
effluents and domestic sewage as well as the agricultural activities and deforestation in the
catchment continue unabated, the lake will unquestionably go through eutrohpication that
will eventually lead to irreversible pollution and permanent loss of suitable habitats and the
biodiversity. Therefore, the possibility that the lake may disappear in the long term – due to
the possible chains of events portrayed above - will not be too imaginary.
Given all the facts brought about in this introductory section, it is very clear that the present
initiative by SOS-S and hence the work of this RT is an issue that should have come at the
forefront quite a long time ago. Very unfortunately, in Ethiopia, much attention has focused
on losses of terrestrial systems, particularly the forests and soils, and the situation in
freshwaters has tended to receive less attention. As portrayed in our discussion of the matter
in this report, it is increasingly evident that this pending crisis is now setting the agenda
regarding actions that need to be seriously considered.

21
CHAPTER 2
2. ASSESSEMENT OF THE PRESENT STATE OF LAKE HAWASSA WITH RESPECT TO POLLUTION
From the account given in the foregoing Chapter, there is enough reason to believe that Lake
Hawassa is under increasing threat of pollution mainly due to anthropogenic activities in the
catchment. A number of studies have shown that the major pollutants that reach the lake
include: heavy metals, nutrients, organic materials and agrochemicals of different types. It is
well documented that some of these pollutants reach the lake at a level higher than local and
international standard limits and they can pose a real threat to water quality and consequently
to living organisms in and around the lake. The most critical impact that is already observed
and felt is industrial pollution. People in the neighbourhoods of factories complain about
water quality problems, human and domestic animal health issues, loss setback in agricultural
production, etc. due to the discharge of effluent from various sources to the environment.
All the circumstances mentioned and those elaborated in Chapter 1 of this report point to the
fact that Lake Hawassa (and its environ) is under intense pressure of pollution, and thus
mitigation measures have to be taken to alleviate the problem.
In this section of the report, available information from past and current studies is put
together to show the types, potential sources and effects of pollutants, and their routes and
inlet spots into the lake. See the Lake Hawassa Pollution Network in Figure 2.1.

22
Root cause
Entry Frontline
Route/pathway
Pollutants/contaminants
Critical Source
Hot Inlet spots
AGRICULTURE
Agro-chemicals
INDUSTRY URBAN/CITY AGRICULTURE
Farms HTF,MHSDF,BGIBF,TCF,
ETABSP
Shoreline farms
House holds, Hotels, Garages,… HURH
Nutrients, toxic substances,
organic wastes
Nutrients, toxic substances, organic wastes , pathogens
Agro –chemicals
RunoffBoga &
Boeitcha streams, TW River
Drainage canal, surface storms
Diffused surface
flow
Northern Shoreline Eastern Shoreline Southern Shoreline
Tikur Wuha, Wondo Tika, etcAmora Gedel, Referral
Hospital, etc . Loke, BeteMengist, etc
Lake Hawassa
Fig. 2. 1. Lake Hawassa Pollution Network

23
2.1. Sources and Routes of Pollutants to the Lake
It has been identified and reported by several researchers that Lake Hawassa and its wetland
system including the Tikur Wuha River and Shallo swamp have been exposed to toxic
substances due to anthropogenic activities in the watershed resulting in point and non-point
source pollution (Zinabu Gebremariam and Zerihun Desta, 2002; Zerihun Desta, 2003;
Zinabu Gebremariam and Pearce, 2003; Behailu Berehanu, et al. 2010; Yared Beyene et.al.,
2013). According to different studies (Zinabu Gebremariam, 2002, 2003; Zerihun Desta
2003, and references cited there-in) the main causes of the pollution in Lake Hawassa were
identified to be human activities associated, particularly, with poor agricultural practices;
clearing of forest cover; use of fertilizers, herbicides and pesticides; rapid and unplanned
urbanization; domestic waste and industrial effluent from within the watershed, etc.. It is
important to identify the sources and routes of pollutants as a first step to mitigation measures
and this section of the report presents the point and non-point sources of pollution to Lake
Hawassa and the types of pollutants.
2.1.1. Point sources of pollution
The effects of industrial activities on the environment at large and aquatic systems in
particular are becoming evident especially in water bodies in close proximity to the major
cities of the country (Zinabu Gebremariam and Elias Dadebo, 1989; Zinabu Gebremariam
and Zerihun Desta, 2002; Zinabu Gebremariam 2002a; 2003a). Hawassa city and its
flourishing industrial zone are located very close to the Lake Hawassa. Previous studies and
our current observations show that there are altogether six point sources - five factories and a
referral hospital.
The factories that have been identified as point sources are: Moha Hawassa Soft Drinks
Factory (MHSD), BGI Hawassa Brewery Factory (BGI-HBF), Hawassa Textile Factory
(HTF), Tabor Ceramics (TCF), and Etab Soap Factory (Etab-SF). The Hawassa University
Referral Hospital (HURH) that is located at a very close proximity (about 350 m) to the lake
has been considered as one of the point sources of pollution. While the effluents from the
industrial zone end up in Boga and Boeitch streams that flow into the Tikur Wuha River (the
only visible inflow into the lake), the HURH discharges its effluent directly into Lake
Hawassa.
A brief description of each of these sources is presented hereunder.

24
2.1.1.1. Hawassa Textile Factory (HTF)
Hawassa textile factory (HTF), located at the Eastern edge of Hawassa town, was established
in 1989. The factory uses large amounts of ground water mainly as a solvent for processing
chemicals and a washing-rinsing medium. According to Zerihun Desta (1997) the factory
discharges about 1200 m3 of liquid waste every day at a flow rate of 13.9 l/s. Effluent from
HTF is the most studied industrial effluent in the city, and the effluents were analysed by
different researchers at different occasions.
Previous studies (Zinabu Gebremariam and Zerihun Desta, 2002; Zerihun Desta, 2003;
Zinabu Gebremariam and Pearce, 2003; Birenesh Abay, 2007; Behailu Berehanu, et al.,
2010) indicated that waste water from the factory is treated, both chemically and biologically,
before the effluent is discharged into the surrounding. The chemical treatment takes place
within the compound of the factory and involves the use of sulphuric acid to neutralize the
wastewater which has a very high pH. However, an investigation by Lijalem Hailu (2011)
and our recent visit to the factory have revealed that the chemical treatment plant is non-
functional. The biological treatment takes place in oxidation ponds located about 2 km away
from the factory and it is very close to the neighbouring rural community.
Our recent observation of the factory’s discharge route confirmed that the raw waste water
from the production process is released into four treatment oxidation ponds and then the
“treated” effluent is discharged through underground concrete tube into an open ditch.
Another separate discharge, considered to be from washing and sewage system of the factory,
joins the effluent from the ponds at the open ditch and all of the waste streams ahead to Tikur
Wuha River through Boeitcha stream. Previously, it was reported (Zerihun Desta, 1997;
Birenesh Abay, 2007) that the factory effluent is discharged into the nearby Shallo swamp/
wetland. However, the present observation on the route of the discharge revealed that the
effluent intercepts the wetland only at the edge and joins Boeitcha stream flowing through a
ditch towards Tikur Wuha River that ends up in Lake Hawassa.
There is no regular environmental audit system and no legal body has ever monitored the
factory for the type of effluent discharged, manner of disposal or compliance to
environmental laws and principles of the EEPA.
Effluent from textile factories is known to contain complex mixtures of chemicals that vary in
composition from factory to factory as well as on a temporal basis at individual factory based
on material used in wet processing (Wynne et al. 2001). Studies on HTF by several

25
researchers (Zinabu Gebremariam and Zerihun Desta, 2002; Zinabu Gebremariam and
Pearce, 2003; Birenesh Abay, 2007; Yadessa Chibsa, 2011) have clearly shown the presence
of toxic substance in the effluent that is discharged from the treatment plants (both chemical
and biological treatment ponds). Accordingly, effluent discharged from the factory after
treatment contains high concentrations of organic and inorganic chemicals and it is loaded
with different toxic substances, some of which are much higher than the MPL. This suggests
that the waste treatment methods used by the factory are inefficient. Therefore, the effluent
from the factory that contains pollutants reaches the nearby water bodies (Boeitcha stream,
Tikur Wuha and then Lake Hawassa) and the immediate environment. This could pose a
serious threat to the biota and disrupt the ecological integrity of the environment to which
they are linked.
Brinesh Abay (2007) and more recently Yadessa Chibsa (2011) studied the phsico-chemical
parameters and heavy metal concentrations of the effluent flowing down the water course
(Boeitcha stream) to Tikur Wuha River at different points. The concentrations of some of the
physico-chemical parameters reported by Yadessa Chibsa (2011), such as pH, phosphate,
total dissolved solid (TDS) and electrical conductivity in the effluent were much higher than
in the raw wastewater and above the provisional waste discharge limit set by the EEPA
(2003) and WHO (2002). Although the measured pollution parameters downstream along
Tikur Wuha River were highly reduced compared to the raw wastewater, concentrations of
most of the pollutants entering the lake were still higher to meet the provisional discharge
limits set by the EEPA (EEPA, 2003).
Yadessa Chibssa (2011) determined the concentrations of some heavy metals in different
aquatic media along the waste stream and found that the concentrations followed in
descending order in: sediments > macrophytes > wastewater. It is possible that the
concentrations of the chemicals may be much higher in the sediments than the wastewater
itself due to the accumulation effect, and hence creating an extended effect on the water body
and the biota.
Birnesh Abay (2007) and Yadessa Chibssa (2011) reported four heavy metals (namely Cu,
Mn, Zn & Cr) in treated effluent and two more (Hg and As) were reported previously by
Zinabu G/Mariam and Pearce (2003) and recently by Behailu Berehanu, et al (2010).
According to Yadessa (2011), the heavy metals concentration in wastewater samples was
found in the order of Cu>Mn>Zn>Cr. The concentrations of heavy metals in sediment and in
macrophytes also followed almost the same order, i.e. Mn > Zn > Cu> Cr.
26
Given that trace metals are not usually eliminated from aquatic systems by any known means
(Forstner and Wittmann, 1983 cited in Zinabu Gebremariam and Pearce, 2003), it is evident
that the lake is facing a very serious threat of heavy metal contamination. Therefore, the
effluent from HTF can be considered as the major gateway of toxic substances and nutrients
into Lake Hawassa.
In a nut-shell, even though the concentrations of most of the heavy metals detected in
wastewater from HTF were low and within acceptable ranges of the provisional discharge
limits of industrial waste (EEPA, 2003), their accumulation over time should be emphasized
as potential threat to the ecological integrity of the environment.
2.1.1.2. Moha Hawassa Soft Drinks Factory (MHSDF)
This factory was established in 2007. The RT has confirmed that the raw wastewater from the
factory is treated chemically, mainly by neutralization processes, using acids in a treatment
plant located within its premises. The chemically treated effluent from the factory goes
through underground tunnel (for only some distance from the factory) then flows through an
open ditch around a residential area of a nearby rural community. According to our
observation, the effluent from the factory is channelled through PVC pipes buried under the
earth and is released into an open concrete ditch. There are two ponds right where the effluent
is released into the open ditch from the PVC pipes. The ponds were presumably constructed
to serve as storage ponds. But they were too small to hold the large volume of the effluent
even for a few hours (according to local informants) and are not used at the moment. Instead,
an alternative open ditch that leads into the open has been constructed. The effluent is finally
collected through a metal pipe and discharged into the open at the edge of the Shallo swamp.
The effluent then eventually reaches a stream (named as “Boga” by the local people) flowing
down and joins another stream named as “Boietcha” that flows in to Tikur Wuha river. The
rate of effluent discharge from this factory is not yet determined by the factory, but according
to Behailu Berehanu et.al. (2010) it was estimated to be 3 litres per second (l/s). It has been
observed by the RT that as the effluent from MHSDF runs through the ditch, the people in the
neighbourhood use it for irrigation and for other domestic purposes. We have been able to
learn that no environmental protection institution monitors the factory.
27
Behailu Berehanu et.al. (2010) studied the composition of the effluent from this factory and
detected some nutrients, organic materials and heavy metals. However, this has not been
confirmed by other studies and it is very difficult to be certain at this moment.
2.1.1.3. BGI Hawassa Brewery Factory (BGI-BF)
Like other sectors of industries, breweries in Ethiopia have also got attention in terms of their
pollution contribution to the environment (Yared Shumate, 2008).Brewery plants have been
known to cause pollution by discharging effluent into receiving stream, ground water and soil
(Olajumoke , et.al., 2010). It has been estimated that approximately 3 to 10 litres of
wastewaters are generated per litre of beer produced in breweries (Kenatu Angassa, 2011)
The BGI Hawassa brewery factory started production in 2010. It is a relatively recently
constructed factory, and is located at the Eastern part of Hawassa city in the industrial zone
between Moha soft drink factory and Hawassa textile factory. The Factory uses modernized
technology for treatment of the ground water used for production and waste water. The
treatment system includes chemical treatment using neutralization method and biological
treatment using oxidation ponds in the compound of the factory. The treated effluent from the
factory joins the waste stream from Moha soft drink factory at an open ditch of Boga stream
and then flow to Tikur Wuha and finally Lake Hawassa.
Because it is recently operational factory, the chemical composition of the effluent
discharged has not been studied. Although we do not have data on the chemical composition,
it will not be out of place to mention the possible composition from other studies.
According to Fillaudeau (2006), the physical parameters of brewery wastewater include
colour, door, temperature, turbidity. Brewery plants produce large quantities of highly
polluting wastewater rich in organic substances. Generally, the wastewater is the combined
effluent comprising discharges from various sources of unit operation in the plant and is
usually characterized by wide variation both in the discharge volume and the strength of
pollutants such as biological oxygen demand (BOD)5, carbon oxygen demand (COD) , total
solid (TS) and pH. Considering the continuous variation in the discharge of wastewaters
(both in quantity and quality) due to the nature of the factory’s operation, a brewery effluent
can generally be characterized as medium to high strength waste.
2.1.1.4. Tabor Ceramics Factory (TCF)
Tabor ceramics factory was established in 1996. According to the information available, the
liquid wastewater from the factory is collected in a kind of storage pond located inside the

28
compound of the factory for long periods of time. According to the people living in the area,
the effluent from the factory is discharged directly into Lake Hawassa through storm drainage
lines along Shashamanne-Hawassa road side near the Tikur Wuha bridge. Behailu Berehanu,
et al (2010) indicated that the effluent was monitored once or twice by EEPA. However, the
factory has no regular environmental audit system and no legal documented reports
concerning compliance to environmental laws and principles of EEPA.
Behailu Berehanu et.al. (2010) reported higher levels of nutrients (especially S2, SO4 and
PO4) and heavy metals such as Zn and Hg exceeding MPLs of industrial waste. Massive
growth of plants in the biological lagoon in the ceramic factory compound may be associated
with high nutrients concentration in the effluent. Therefore, the presence of high nutrient load
and toxic metals like Hg in the effluent could affect the aquatic life as the effluent is directly
discharged into the lake.
2.1.1.5. Etab Soap Factory (ETAB-SF)
Etab soap factory, located near HTF, is founded in 2005. According to the factory officials,
the factory is not discharging the waste out into the environment. The overall liquid waste
generated by the factory is collected in the septic tank and when filled disposed by city
municipality liquid waste disposal transport service. The by-product of the raw material is
used as source of energy for the boiler. Therefore, there is no way the factory effluent reaches
the lake and thus not potential source of pollution to the lake.
The only effluent analysis result of the soap factory was that of Behailu et.al. (2010). For
analysis, the sample was taken from the storage container of effluent and it is very difficult to
confirm the credibility and reliability of the data. However, among the measured parameters,
the effluent contained higher concentrations of nutrients (NO3 and PO4), SO4 and Pb that is
above the general limit (EPA, 2003). The concentration of SO4, NO3 and PO4 were about
twenty, sixty seven and fifteen times, respectively, the general limit. Currently the factory is
not discharging the liquid waste to the environment and thus not directly contributing to the
pollution of the lake in particular and the surrounding in general.

29
Figure 2.2. Route of effluents from factories into the Lake Hawassa
2.1.1.6. Hawassa University Referral Hospital (HURH)
The HURH, located at south-eastern edge of Hawassa city, started operation in 2006. The
hospital and the waste stabilization/ oxidation ponds, which treat the wastewater of the
hospital, are constructed in close proximity to Lake Hawassa, about 200 m to north of the
hospital and about 150 m from Hawassa Lake.
The wastewater generated from the hospital (including that from students’ dormitory, toilets,
laboratories and cafeterias) flow directly to the ponds for treatment and finally the treated
effluent is directly discharged into the Lake. According to Simachew Dires (2008), the
estimated volume of wastewater that enters in to the ponds from the hospital was about 47 m3
per day and the effluent is released at flow rate of 2 l/s (or 172.8 m3 per day) from the
treatment ponds.
Studies (Dana et al., 2005; Rezaee et al., 2005) indicated that hospitals discharge contains
considerable amounts of chemicals and microbial agents in their wastewaters. Even though
the hospital uses treatment ponds, the study results of Simache Dires (2008) and Hunachew
Beyene and Getachew Redaie (2011) clearly showed inefficiency of the hospital treatment
system and it is highly likely that some of the pollutants would reach the lake.
Concerning physico-chemical characteristic, Simachew Dires (2008) reported mean dissolved
oxygen (DO) concentration of the treated wastewater far less than the value recommended for
Moha Soft Drink Factory
Tikur Wuha River Boga
Stream
Boietcha Stream
Ceramics Factory
BGI Brewery Factory
Hawassa Textile Factory
Lake Hawassa

30
fish to respire and perform metabolic activities. Both Simache Dires (2008) and Hunachew
Beyene and Getachew Redaie (2011) reported the effluent BOD, COD and total suspended
solid (TSS) concentrations higher than that set by the U.S. federal standards (USEPA, 2001)
for effluent quality discharged in to the lake and the European Commission or EC) for
Environmental Protection minimum effluent standards.
Concerning heavy metals, the concentration of the Cu, Ni and Zn in the treated effluent of the
hospital reported by Simache Dires (2008) was below the standard limits (USEPA, 2001).
But Cd, Pb and Ag were not detected in the effluent. However, according to Hunachew
Beyene and Getachew Redaie (2011), the concentration of Ni and Zn in the effluent was
higher than the values recommended by Food and Agriculture organization (FAO) for
agriculture reuse (Pescod, 1992).
Simache Dires (2008) reported a microbial contamination due to faecal coliforms in the
treated hospital effluent that exceeded standard levels of 1000 cfu/100 ml. Therefore, the
effluent of the hospital discharged in to Lake Hawassa may have a probability to contain
photogenic and drug resistant microorganisms. Thus, the chance of multi drug resistant
bacteria to leave the treatment plant is also high (Hunachew Beyene and Getachew Redaie, 2011). In summary, the available information mentioned above indicates that due to
inefficient treatment of the waste water from the hospital, the lake receives considerable
amount of pollutants including nutrients, heavy metals and pathogenic bacteria, the values of
most exceeding the standard limits.
2.1.2. Non-point sources of pollution
Very little research work has been done to assess the non-point source pollutants in Lake
Hawassa watershed; even though report of Demelash Amare (2008) indicated they often are
the major contributors to onsite degradation of agricultural lands and offsite pollution of Lake
Hawassa. In addition, there is little information on sources, impacts and possible management
options of non-point source pollution. A brief description of each of the run-off from urban
settings (mainly from Hawassa city and Tikur Wuha town) and rural areas (agricultural
fields) in the catchment are presented hereunder.
2.1.2.1. Run-off from urban settings
Hawassa city can be considered as one of the rapidly growing cities in Ethiopia. The growth
of the city across different economic sectors, the noticeable migration from rural areas in the

31
region and the increased number of higher learning institutions (both private and government)
in the city has made Hawassa a major population center. As a result of this, the city has
undergone a substantial physical expansion and urbanization is visible with enormous urban
sprawls in almost every corners of the city in general (i.e. especially in the South and South
East part of the city).
With the expansion of urban infrastructures, the urbanization process resulted in major
changes in the natural conditions of the Hawassa city watershed. With construction of
residential and other buildings to accommodate the increasing population (both private and
governmental), road rehabilitation and upgrading works, etc.; the main features of the natural
areas are modified in Hawassa. Generally the urbanization process influences the natural
surface detention, the infiltration characteristics and the drainage pattern formed by the
natural flow paths.
Lake Hawassa is located at 1680m above sea level (a.s.l.) while the city of Hawassa is
located at 1685m a.s.l. and the caldera rim rises to 2700m a.s.l (Behailu Berehanu, et al,
2010). Therefore, the surface and subsurface drainage from the immediate watershed,
including Hawassa city, is towards the lake and hence, the lake is the main destination for any
type of pollutants generated from anthropogenic activities in the city and its surroundings. The same is true for Tikur Wuha town located at Northern part of the lake near Tikur Wuha
River.
The runoff containing pollutants from the city, particularly at the eastern and south-eastern
shoreline of the lake, channelled through ditches into the lake at different points (in the
vicinity of Greenwood and unique Parks, Amoragedel, Referral hospital; etc.). Similarly, the
runoff from Tikur Wuha town is channelled into Tikur Wuha River near the bridge through
two big constructed and directed ditches. Therefore, the runoff from these areas is expected to
contain different kinds of pollutants that would eventually reach the lake.
Even though, runoff in the water shade of Lake Hawassa has not been studied, it is useful to
see the potential pollutants in the urban runoff from other studies. According to Tenagne
Addisu (2009), trace metals, suspended solids, nutrients, pesticides, petroleum products, and
pathogenic bacteria (faecal coliform) are generally found in higher concentrations in
urbanized and urbanizing areas than in natural systems, due to increased numbers of people,
vehicles, roads, and building materials introduced into the landscape. These constituents that
storm water runoff carries through drainage canals is found to be a major source of pollution

32
to surface water quality and groundwater resources. Though the actual composition of
wastewater may differ from community to community, as described by Hussain, et.al (2002),
all municipal wastewater contains organic matter; nutrients (Nitrogen, Phosphorus, and
Potassium); inorganic matter (dissolved minerals); toxic chemicals and Pathogens. Therefore,
runoffs entering the lake from Hawassa city and Tikur Wuha town are anticipated to contain
some of these pollutants.
2.1.2.2 Runoff from rural areas
Intensive agricultural and deforestation activities in the catchments are serious environmental
problems in most Ethiopian rift-valley lakes (Zinabu Gebremariam and Elias Dadebo, 1989;
Zinabu Gebremariam 2002). Human settlement and urbanization in the drainage basin of
Lake Hawassa is concentrated mostly in the eastern part of the catchment with the rest of it
left to various agricultural activities.
Our visit to the catchment area of Lake Hawassa revealed that agricultural production is a
major activity of local farmers residing at the northern, western and southern part of the
catchment. Also there are state and private farms at the northern catchment area and these
include Wondotika state farm, the seed multiplication plots of the seed corporation, the
ELFORA farm, the G-farm located near ELFORA, etc. Furthermore, the RT observed
intensive shoreline agriculture at south and south-eastern part of the lake. According to
Susanne (1995), however, agriculture is generally regarded as one of the largest contributor
of pollutants of all the categories and the pollutants are usually discharged as a component of
natural runoff into surface waters and the underlying groundwater.
Through current observation, we have been able to verify that in the part of the catchment
where there is agricultural activity; there is very little plant cover because of the increased
tilling of the land and overgrazing of the vegetation. Therefore, the soil is exposed to erosion.
This has been the trend for many years and will probably continue the same way. Such land
use and degradation of catchments will certainly lead to runoff with increased input of
sediment (sediment inundation) and nutrients which will eventually cause eutrophication of
the lake.
In this regard, the only available study on Lake Hawassa catchment is that of Demelash
Amare (2008) carried out to identify primary sources of the non-point pollution in the
watershed and assessed the relative contribution of each source. Results of the researcher

33
indicated the presence of strong association of land use/land cover, run-off water yield, non-
point sources and pollutants. The major pollutants identified were sediment/siltation and
nutrient loading.
One other aspect of increased agricultural activity in catchments of water bodies is chemical
pollution from agro-chemicals (fertilizers and pesticides). We have no information on how
much agro-chemicals are being used in the catchments of Lake Hawassa. However, we are
sure that the state and private farms, and south-eastern shoreline vegetable farms, even some
local farmers, etc., which are in the catchment of the lake may use some kind of agro-
chemicals that end up in the lake.
One of the indications that the lake is polluted with Persistent Organic pollutants (POPs) of
pesticide origin is the findings of a more recent study by Yared Beyene et.al. (2013). these
researchers detected organochlorine pesticide (predominantly DDTs) in the muscle and liver
of fish in Lake Hawassa. Therefore, the runoff from those agricultural fields in the catchment
area is expected to carry the pollutants into the lake through storm water ditches or water
courses.
2.1.3 Pollutants in Lake Hawassa
As described in the above sections, Lake Hawassa receives wastewater containing complex
mixture of pollutants from factories, referral hospital, storm water (urban run-off) from
Hawassa city as well as Tikur Wuha town and from agricultural fields. Usually, the level of
pollutants in the aquatic environment is determined by measuring the concentration in water,
sediment and living organisms. In this section attempts will be made to present the pollutants
in different media of the lake (water, sediment and fish) giving special attention to
concentrations of toxic substances (heavy metals) and nutrients.
2.1.3.1 Pollutants in the lake water
A study on the long-term changes of Lake Hawassa (Zinabu Gebremariam et al., 2002) has
shown that the chemical concentrations of the lake have decreased and it has become more
dilute over the last 40 years. This study also revealed that, unlike the rest of the ERVL (with
the exception of Lake Langano) the salinity (and its correlates -conductivity, alkalinity and
sodium concentrations) of the lake has decreased since the early 1960s. Behailu Berehanu,

34
et.al. (2010) also reported the absence of appreciable variation in EC in the Lake water over
the years except for the change from 1961 to 1964. Zinabu Gebremariam et al., 2002)
reasoned out the possibility that the lake could have been saline at one point in time and then
changes associated to water level may have diluted the lake, and they suggested that the water
level and the chemical concentrations of the lake may have fluctuated over the years.
However, a more recent study (Behailu Berehanu, et.al., 2010) indicated that pH showed
little variation within four decade; the concentration of nutrients (NO3-, NH4
+ and PO43-) were
slightly increasing over the years; and sodium concentration is by far greater than other metal
ions in the Lake. Alemayehu (2008) described that the dominance of Na could be due to
weathering of acidic rocks. During our visit to southern shoreline of the lake, the RT
observed extensive stone mining sites, a short distance from the shoreline. Therefore,
weathering of rocks as result of mining activity and entering into the lake in the run-off from
these sites may be responsible for increased Na.
More recently, Andualem Gezahagn (2013) investigated water of the lake for a total of eight
heavy metals (Cu, Zn, Mn, Cr, Ni, Cd, Co and Pb) and only three were detected (namely Cu,
Cr and Ni). A similar result was reported by Simachew Dires (2008) but, Mesfin Mengesha
(2009) reported additional four heavy metals, Hg, As, Pb and Se.
According to Andualem Gezahagn (2013), concentration of heavy metals detected in the
water of the lake generally followed the order of Ni > Cr > Cu. The concentration of Ni and Cr
determined in the water (Andualem Gezahagn, 2013) were greater than the standard of WHO
(1993) and USEPA (2006). But, the recorded concentration of Cu is far below the standards
(WHO, 1993 and USEPA, 2006).
Zenebe Yirga (2011) and Andualem Gezahagn (2013) investigated the concentration of
heavy metals in water of Lake Hawassa sampled from different sites (Tikur Wuha, Dorie
Bafana and Hospital) selected based on potential sources of pollution. The Tikur Wuha site
contained significantly higher concentration of Cr and Ni compared to the other sampling
sites. Furthermore, the Metal Pollution Index (MPI) values calculated were highest for Tikur
Wuha (0.088) followed by Dore Baffena (0.075) and Hospital sites (0.071). This result
revealed that Tikur Wuha site had highest metal pollution (Andualem Gezahagn, 2013).
The three heavy metals (Cu, Cr and Ni) were also detected in samples taken from hospital
site (Andualem Gezahagn, 2013). Simachew Dires (2008) detected three additional heavy
35
metals (Cd, Pb, and Zn) at the same site with Zn concentration being the highest and only Cd
exceeded the standard limit (0.01 mg/L) set for lake water (EC, 1998 and USEPA, 2002).
2.1.3.2 Pollutants in the sediment
The only available information about sediment constituent of Lake Hawassa is that of Girma
Tilahun and Tigist Amare (2011). They assess the potential accumulation of heavy metals in
the sediment and detected a total of five (namely, Hg, Cr, Zn, Cd and Pb). The average
concentration of each of the detected heavy metals was higher than that of the reference site,
indicating potential accumulation in the sediment. Among the metals, Zn concentration was
the highest. The concentration in the sediment followed the order of Zn > Cr > Pb > Hg > Cd.
2.1.3.3 Pollutants in fish
Fish occupies the highest trophic level in aquatic systems. According to Zhou et al. (2008),
fish attracted a lot of attention as bio-indicators for monitoring aquatic pollution, due to their
relatively large body size, long life cycle, position in the aquatic food chain and their use for
human consumption. Furthermore, Ahmed and Shubami-Othman, (2010) pointed out that fish
is a good bio-indicator of water quality because it has a potential to accumulate heavy metals
and other organic pollutants of water. Moreover, Pourang et al., (2005) reasoned out that
exposure of fish to elevated metal levels in an aquatic environment may cause them to take
up metals from their direct environment.
It is well known that fish in polluted water could accumulate heavy metals in their organs
(e.g. liver, muscle, gills, etc.) and muscle is considered in the discussion below from
consumers’ safety point of view because it is the principal edible fish section and can directly
affect human health.
Lake Hawassa supports at least six fish species (Elias Dadebo, 2000 and Zerihun Desta,
2003), three of which are commercially important (the Nile tilapia or Oreochromis niloticus;
the African sharptooth catfish or Clarias gariepinus; and African big barb or Labeobarbus
intermedius); the other three species, although not directly utilized by the fisheries, have an
important ecological significance.
Different researchers (Abayneh Ataro et al., 2003; Zerihun Desta, 2007; Asrat Fekadu, 2013;
and Andualem Gezahagn (2013) have reported the presence of various metals in organs

36
(muscle, liver, gills, etc) common fish species in Lake Hawassa. But the reliability of these
data needs to be verified by further studies. Previous studies (Abyneh Ataro, et.al., 2003 and
Zerihun Desta, 2007) revealed the presence of less number of heavy metals in muscle of
only two species (O. Niloticus and C. gariepinus), most of which were below the limit. The
detection of large number of heavy metals with majority of them higher than the limit in
recent studies (Zenebe Yirgu, 2011; Asrat Fekadu 2013 and Andualem Gezahagn, 2013) is
an indication of increased pollution danger of Lake Hawassa if and only if confirmed by
further studies. This also has implications in terms of consumers safety point of view;
survival of the fish and other aquatic life; and biodiversity of aquatic life.
2.2. Possible Adverse Effects of Pollution
As described in section 2.1 above, Lake Hawassa is under a serious pollution threat due to
anthropogenic activities from the Hawassa city and its surroundings. Although the effects of
pollution on Lake Hawassa are not noticeable at the moment, the long term effects are
inevitable unless mitigation measures are taken as early as possible.
There is no comprehensive study conducted in Hawassa to see the overall picture of
environmental impact caused by all kinds of pollution in general and the effluents discharged
from factories into the immediate vicinity of Lake Hawassa that eventually reach the lake.
We present here the potential effects of pollution on Lake Hawassa based on available
information.
2.2.1. Effects of pollution on water quality
The quality of water is central to all of the roles that water plays in our lives and good water
quality is fundamental to the network of life and livelihood that water supports.
Water from the Boga and Boeitcha streams, near the residential area of rural community and
water of the Tikur Wuha River; have been used by the people for different purposes for a
long period of time. However, the waste water discharged from the factories into the stream
has radically altered the physical, biological and chemical quality of the stream water and its
receiver, the Tikur Wuha River.
According to the residents in the area, since the establishment of HTF, the waste water
released and mixed with the streams is turbid and this gave a bad appearance and foul odour.
Due to the altered physico-chemical parameters and high concentrations of some heavy

37
metals in the waste water, the water quality of Boga and Boeitcha streams and Tikur Wuha
River are poor and not safe for human and animal consumption. People in the area use the
effluent for irrigation and, according to Michel et.al. (2007), the use of wastewater for
irrigation also leads to risk of ground water pollution through leaching and sorption of heavy
metals.
Polluted water that cannot be used (for drinking, bathing, industry, or agriculture, etc)
effectively reduces the amount of water available in a given area. Therefore, the water quality
of the streams and the river has been severely affected since the establishment of HTF. Thus,
people in the area are in short supply of safe water primarily because of industrial pollution.
Although eutrophication in Lake Hawassa has not yet observed and not a problem now, with
continuous input of the pollutants, particularly with loading of nutrients and organic matter,
eutrophication may be a challenge in the future.
Even though, Lake Hawassa receives different kinds of pollutants from different sources,
including the factories, studies showed that its water quality has not been severely affected
and seriously disturbed in the past years apparently due to dilution of the pollutants.
Therefore, the present quality of the water of Lake Hawassa is suitable for both domestic
purposes and irrigation (Zinabu Gebremariam 2003). However, the future trends of the lake
may not continue to be as optimistic as they are now, as pollutants loading to the lake have
still continued with no pollution mitigation measures.
2.2.2. Effects on aquatic life
Anthropogenic source of pollution, such as industrial discharges and urban run-off containing
domestic wastes and agricultural storm run-off have adverse effects on Lake Biota, in
particular when it contains pollutants and released into the system in partially treated or
untreated form. The threats imposed on aquatic life can be direct, affecting survival, growth
and reproduction of the organisms and/or indirect by making them unusable to humans.
Results of early experimental studies on aquatic biota (Zinabu Gebremariam and Zerihun
Desta, 2002) has shown that the effluent from HTF kills fish of different species (probably
due to the toxicity from the heavy metals in the effluent). Similarly, a recent toxicity study on
fish revealed that effluent from HTF caused highest mortality on fry of Nile tilapia, followed
by effluents from ceramics and soft drink factories (Behailu Berehanu, et.al. 2010). A more
recent study by Kssaye Balkew (2013) also confirmed the toxicity of the HTF effluent to Nile

38
tilapia. The findings of these studies strongly suggest that the effluent from factories is
potentially hazardous to the survival of fish. Therefore, the adverse effects of the effluent,
from HTF and other factories in the area, on the biota of the lake are the ultimate
environmental concern.
Experimental studies (Zinabu Gebremariam and Zerihun Desta, 2002; and Behailu Berehanu
Berehanu et.al, 2010) to investigate the effect of effluents from factories on aquatic plants
(algae) revealed highest rate of algal growth compared to the control group at low
concentrations of effluent. According to Behailu Berehanu et.al. (2010), high concentrations
of plant nutrients (particularly phosphate and nitrate) present in the effluents of factories
might be responsible for the observed excessive algal growth. This boost of algal
(phytoplankton) growth is an indication of the likely-hood of eutrophication in the lake.
On the other hand, Behailu Berehanu et.al. (2010) demonstrated reduction in the rate of algal
growth with increasing concentration of the effluent and this may be explained by the toxic
effects of the effluent when the concentration reaches a considerable level.
Several studies (Zenebe Yirgu, 2011; Asrat Fekadu, 2013 and Andualem Gezahagn, 2013)
demonstrated accumulation of different heavy metals in organs (muscle, liver, gill, etc) of
commonly edible species of fish (O. Niloticus, C.gariepinus and L.intermedius) in Lake
Hawassa. This is an indication that heavy metals are accumulating in aquatic biota. With
continuous input of pollutants into the lake, the level of heavy metal concentration is
expected to rise to levels that would affect the physiology of aquatic organisms that may lead
to reduction in the fitness of the natural population. As described by Farkas et al. (2002), the
progressive and irreversible accumulation of heavy metals in the various organs of aquatic
life in Lake Hawassa would ultimately leads to metal-related problems in the long run
because of their toxicity, thereby endangering the aquatic biota including fish.
2.2.3. Effect on domestic and wild life
According to Kumar et al. (2006), aquatic macrophytes can accumulate large amounts of
heavy metals in their tissues from polluted water. Birenesh Abay (2009) and Yadessa Chibsa
(2011) reported that macrophytes are growing along the waste stream discharge way of
factories and analysis showed that they accumulated heavy metals in concentrations more
than that in effluent. Observations revealed that domestic animals graze macrophytes and
other species of grasses grown near the wastewater discharge point and also drink out of the

39
effluent. Therefore, the heavy metals in aquatic macrophytes can be transferred through food
chain and bioaccumulation in livestock. Thus, this is a potential of health risk to livestock
grazing these macrophytes and drinking the effluent.
Wild animals, particularly birds, are observed feeding and swimming in treatment ponds of
the HTF and in the discharged waste, and also there are reports of other wild animals such as
hyena drinking out of the effluent. Although the effect of effluent from the factories to the
immediate surrounding has not been investigated, the birds and other wild animals in contact
with effluent (feeding and drinking) also may be in danger of harmful effects.
Yadessa Chibsa (2011) surveyed households in the industrial neighbourhood to find out if
there is any health problem of livestock. According to the result, the most serious health
problems encountered by livestock were decrease in productivity, abortion, sickness and
weight loss, and even death. This is indicative of the effect of industrial pollution on domestic
animals.
2.2.4. Effects on humans
As described in the previous sections, the factories located at the eastern edge of Hawassa
city discharge untreated or partially treated effluent into the immediate surroundings of the
rural residential areas. Observations made by Birenesh Abay (2007), Yadessa Chibsa (2011)
and currently by RT revealed that due to scarcity of tap water or other safe fresh water
sources, people in the area have no alternative but to use contaminated waste water from the
factories for different purposes. They use it for bathing, washing clothes, irrigation, etc. This
suggests that people in the area are directly or indirectly exposed to pollutants in the effluent,
which some of them may be at toxic levels. Exposure of the people in the area to pollutants in
the effluent may involve direct contact, consuming contaminated agricultural products (crops,
vegetables, fruits, etc), and livestock (milk, meat, etc), as well as fish in polluted water. These
exposures may have effects on human health and livelihood.
2.2.4.1. Human health risk
A range of pollutants in the environment are known to have direct and indirect impacts on
human health, including inorganic and organic contaminants. Among the pollutants, extended

40
exposure or exposure to high concentrations of metals can have serious consequences for
humans as these metals tend to bioaccumulate in tissues (UNEP GEMS 2007).
Some heavy metals detected in water of Lake Hawassa tend to accumulate in the tissues of
important fish species. Therefore, in the long run, humans regularly consuming these fish can
receive high concentration of the toxic metals exceeding the maximum permissible (MPL)
level in the diets, depending on the amount consumed.
The human health risk assessment was determined in a study by Ermias Deribe (2012) where
consumption of a certain amount of fish from ERVLs including Lake Hawassa, could pose a
threat to health because of POPs and mercury present in fish. According to this study,
children and pregnant women of the local community, especially the subsistence fishermen
and their families are the most vulnerable population sub-group. Thus, the people in the area
are at risk of health problems related to environmental pollution.
The effluent from the factories is also used for irrigation to produce crops, vegetables and
fruits and the effluent has been reported to contain toxic heavy metals that contaminate soil.
According to Dudka and Chlopecka (1990), plants are known to accumulate heavy metals in
their edible portion as a result of cropping on contaminates fields. Moreover, there are reports
that consumption of metal contaminated crops may lead to many kinds of diseases in humans
(Oluwatosin et.al., 2005; Zheng et.al., 2007; Bosso and Enzweiler, 2008; Fu et al., 2008; Lim
et al., 2008; Agbenin et al., 2009). For example, high prevalence of upper gastrointestinal
tract cancer in Turkey has been linked to heavy metal pollution of soil, fruits and vegetable
(Turkdogan et.al. 2003). Therefore, introducing heavy metals into the food chain through
waste water irrigation may have potential health risk for producers and consumers in and
around Hawassa city.
Although there is very little information about the magnitude of human health impact due to
effluent pollution in Lake Hawassa, a survey conducted by Yadessa Chibsa (2011) showed
that people living in neighbourhoods of factories encountered different health problems as a
result of direct or indirect exposure to the effluent. The health problems reported includes
skin allergy, breathing problem, vomiting, loss of appetite, fatigue, headache and diarrhoea.
Some of these symptoms are typical to heavy metal toxicity to humans reported by several
researchers (Jordao et al., 2002; ATSDR, 2004 and 2008; Rai & Tripathi, 2009; Rehman and
Sohail Anjum, 2010).

41
As clearly indicated in the previous sections, effluents from factories and Hawassa referral
hospital, urban and agricultural storm run-off that enter Lake Hawassa contain pathogenic
organisms originating from human and animal wastes. These can contaminate Boga and
Boeitcha streams; Tikur Wuha River and finally Lake Hawassa and highly affect quality of
the waters. Because of the absence of adequate tap water in the area, many people in and
around Hawassa city use these contaminated streams, river and lake waters. It is obvious that
using this water contaminated with pathogenic organisms would have likelihood to cause
water-borne diseases. Although this has not been studied, it should be very seriously
considered as the water from streams, the river and Lake Hawassa is consumed by the people
and their domestic animals.
2.2.4.2. Effects on livelihoods
Clean water and healthy freshwater ecosystems provide the basic goods and services upon
which many livelihoods depend, including irrigation water, fertile floodplains for agriculture
and grazing, and habitat for fish that may be eaten or sold. According to Husain, et al.
(2010), industrial wastewater and the resulting environmental pollution deteriorates the
quality of water, soil, crop and environment. And polluted water can reduce or eliminate the
viability of many livelihoods (Palaniappan, et al. 2010).
Farmers at the shoreline use Lake Hawassa and those near the factories use effluent in
irrigation agriculture. Using water of Lake Hawassa for irrigation may not be of great
concern as most of the pollutants detected were below the standard limit of irrigation
agriculture. But using effluent is a big concern because it contains several kinds of pollutants,
especially, heavy metals, some of which are above discharge limits.
Soil and water pollutants that adversely affect agriculture include sediment, out of place
nutrients, inorganic minerals, organic wastes, infectious agents, industrial and agricultural
chemicals, etc. Most of these pollutants were present in effluents from the factories.
According to Reddy and Behera (2006), contamination of soils from polluted irrigation water
is responsible for loss of cultivable land. And water and soil pollution affects the economic
productivity of agriculture by destroying crops, reducing food crop quality, and/ or
diminishing yields. A good example to show how much industries effluent irrigation affects
agricultural yield and livelihood is the yield loss projected by Kurnia et al. (2000) in India.

42
According to this researcher, after 20 years of textile industrial effluent contamination, the
average rice yield will be decreased by about 80% due to pollutions.
A survey by Yadessa Chibsa (2011) indicated that those people who used factories effluent
for irrigation reported reduced fruits and vegetable productivity, changes in their color and
burning of their leaves. This suggests that farmers that use effluent in agricultural production
may loss yield and this would greatly affect their livelihood.
As describe in the section related to the effect of pollution on domestic animals above,
livestock were forced to depend on polluted drinking water due to inadequate supplies of safe
water to the people around the industrial area in Hawassa city. According to Yadessa Chibsa
(2011) drinking this effluent from the factories caused sickened livestock resulting in loss of
reproductive capacity and production of poorer quality milk and even it may result death.
There are people who depend on products of their livestock for income and the industrial
pollution could greatly affect livelihood of the people in the area.
Commercially important and edible fish species of Lake Hawassa were exposed to pollutants
and some of them accumulated heavy metals in their muscle in higher concentration than the
water. Some of these heavy metals are known to be toxic to fish and can affect their survival
and reproduction.
Water pollution and associated accumulation in the organs of fish can cause a decrease in fish
production either by reducing or eliminating fish populations or by making fish unsafe or
undesirable for consumption. On top of the existing overfishing and faulty fishing observed
in Lake Hawassa, continued pollution of the lake would be a major threat to fishery in the
future. If mitigation measures are not taken, this would clearly affect the livelihood of
fishermen that depend on it.

43
PART B
MITIGATION MEASURES AND INTERVENTION STRATEGIES
As clearly portrayed in Part A of this report, Lake Hawassa has become one of the most
vulnerable Ethiopian rift valley lakes to pollution and other ecological degradation processes
that arise from intensive anthropogenic activities in the catchment area (refer to Part A of this
report for details). In this part of a study report, cost effective mitigation measures and
intervention strategies to bring down concentrations of pollutants that enter Lake Hawassa are
proposed. The proposed mitigation measures and intervention strategies are believed to
reduce adverse impacts of industrial and medical wastes from point sources as well as
municipal and agricultural wastes from non-point sources reaching the lake.
Before embarking on to the details of the mitigation measures and intervention strategies, it is
appropriate to present a brief overview of the processes we went through in identifying the
RCMM and RCIS. Figure 3.1. illustrates these processes that consist of a series of actions or
step-wise undertakings.

44
Fig 3.1. A flow chart of processes involved in the Cost Effective Mitigation Measures and Intervention Strategies recommended in this study report.
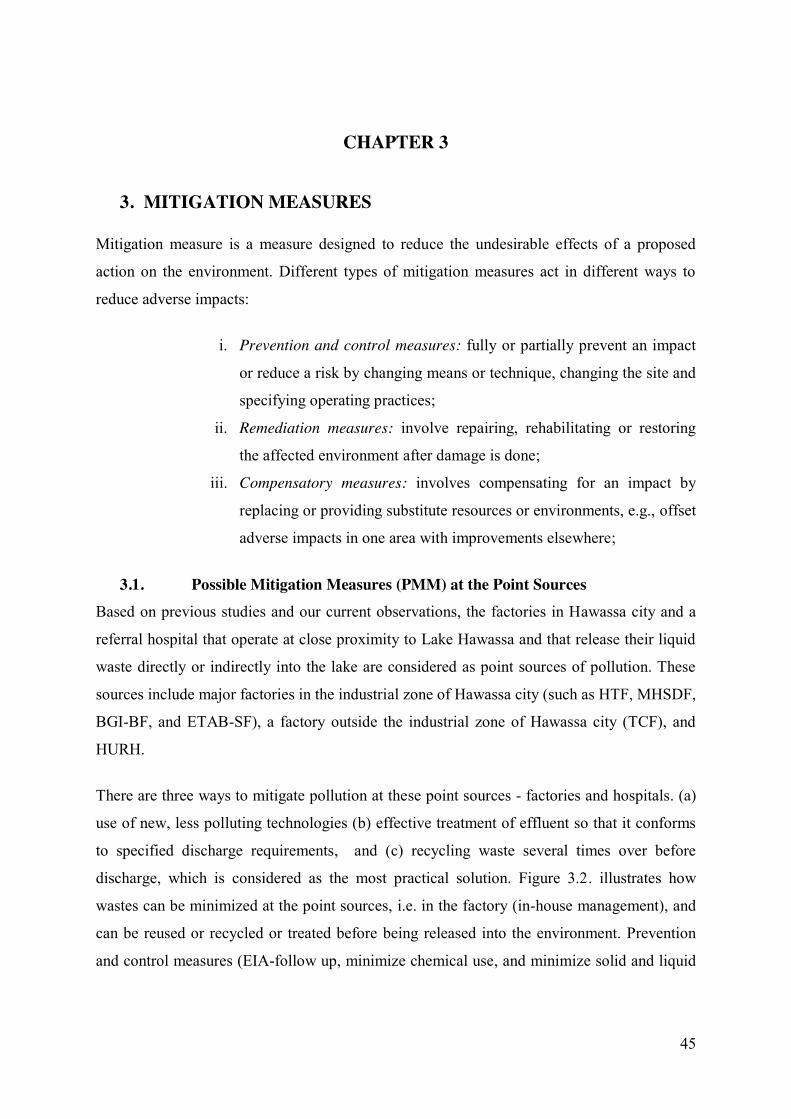
45
CHAPTER 3
3. MITIGATION MEASURES Mitigation measure is a measure designed to reduce the undesirable effects of a proposed
action on the environment. Different types of mitigation measures act in different ways to
reduce adverse impacts:
i. Prevention and control measures: fully or partially prevent an impact
or reduce a risk by changing means or technique, changing the site and
specifying operating practices;
ii. Remediation measures: involve repairing, rehabilitating or restoring
the affected environment after damage is done;
iii. Compensatory measures: involves compensating for an impact by
replacing or providing substitute resources or environments, e.g., offset
adverse impacts in one area with improvements elsewhere;
3.1. Possible Mitigation Measures (PMM) at the Point Sources Based on previous studies and our current observations, the factories in Hawassa city and a
referral hospital that operate at close proximity to Lake Hawassa and that release their liquid
waste directly or indirectly into the lake are considered as point sources of pollution. These
sources include major factories in the industrial zone of Hawassa city (such as HTF, MHSDF,
BGI-BF, and ETAB-SF), a factory outside the industrial zone of Hawassa city (TCF), and
HURH.
There are three ways to mitigate pollution at these point sources - factories and hospitals. (a)
use of new, less polluting technologies (b) effective treatment of effluent so that it conforms
to specified discharge requirements, and (c) recycling waste several times over before
discharge, which is considered as the most practical solution. Figure 3.2. illustrates how
wastes can be minimized at the point sources, i.e. in the factory (in-house management), and
can be reused or recycled or treated before being released into the environment. Prevention
and control measures (EIA-follow up, minimize chemical use, and minimize solid and liquid
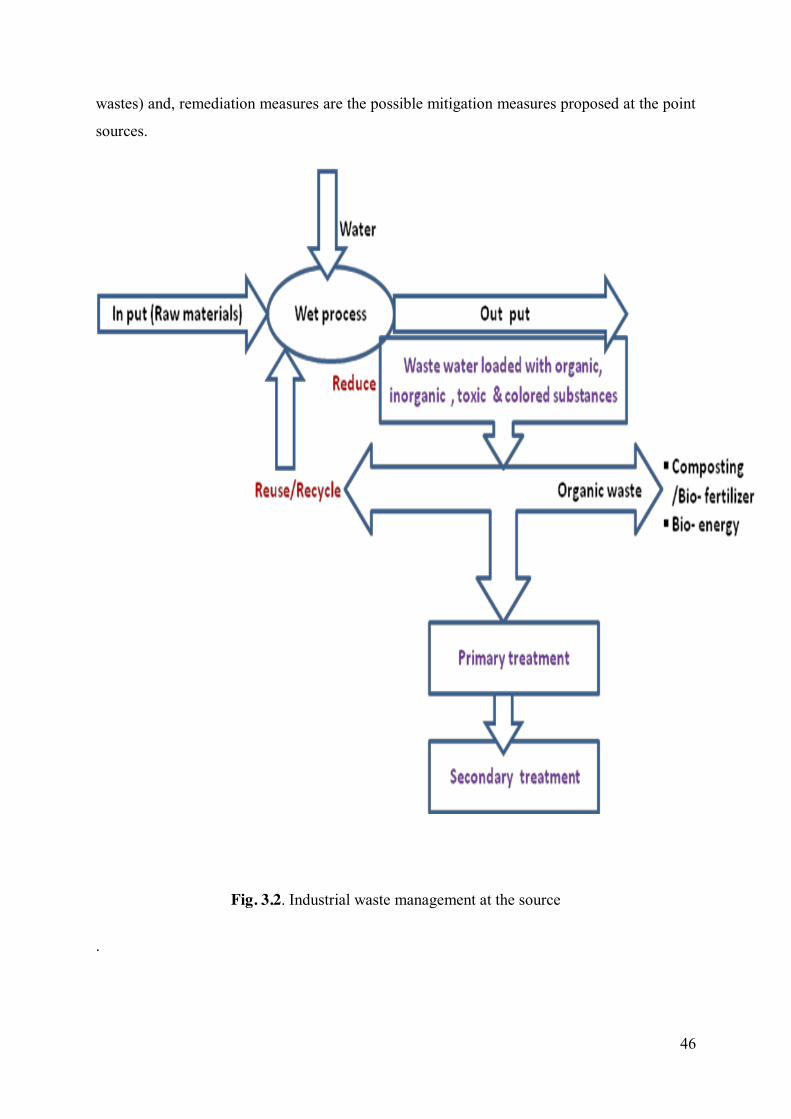
46
wastes) and, remediation measures are the possible mitigation measures proposed at the point
sources.
Fig. 3.2. Industrial waste management at the source
.

47
3.1.1. Prevention and control measures
3.1.1.1. EIA-Follow up Environmental impact assessment (EIA) is assessment of the beneficial and adverse changes
in environmental resources or values resulting from a proposed project. Essential elements of
EIA include: identification of possible positive or negative impacts of the project,
quantifying impacts with respect to common base, and preparation of mitigation plan to offset
the negative impacts. EIA generates huge benefits in selection of project location, process,
design, development actions, and decision-making. The outcome of EIA (EIA report) acts as
a "reference" guide to the implementation, for use of mitigation strategies and monitoring
schemes. It may form a basis for management plan to assist project implementation and
environmental management practice.
Considering this, the government of Ethiopia promulgated EIA Proclamation No. 299/2002
in December 2002. The primary objectives of this proclamation were to make EIA mandatory
for defined categories of activities undertaken either by the public or private sector. Despite
the presence of this proclamation, the RT has been able to learn that some of the factories in
Hawassa were allowed to establish and function in areas that were not designated as
“Industrial Zone” e.g. TCF. Therefore, they lack the proper infrastructure to handle their
waste products. The sewage infrastructure in the industry zone has not also been expanded or
improved for decades. There is no enforcement of the existing environmental regulations
regarding use of chemicals and their disposal. Absence of monitoring practices and lack of
proper knowledge has led to the use of inappropriate or old technologies to the detriment of
the environment. There is a lack of monitoring and enforcement of the existing environmental
regulations and legislations, and, in most cases, lack of resources and good will on the part of
the policy implementers to mitigate the environmental problems. The RT has been able to
learn that there is no regular monitoring of the factories by environmental protection
institutions. Therefore, EIA follow-up is one of the mitigation measures proposed for the
factories currently working, and these include monitoring, evaluation, management, and
communication. We provide hereunder a brief description on each of them:
i) Monitoring: is one the steps in EIA follow-up and it involves comparing data that has been
collected in the assessment if the project in the point source is working in compliance with

48
environmental standards and the guidelines set as well as the predictions and expectations
outlined prior to the commencement of the project. These include:
National/local standards and regulations for the discharge of industrial wastewater to
sewers and streams and rivers
National water quality standards and controls
Workplace health and safety regulations
Regulations on the storage, handling, use, and disposal of toxic chemicals
Monitoring and systematic gathering of information on pollutant levels in the effluent
released to the environment, and pollution prevention practices in the factories are essential
components of any pollution control system. Although pertinent regional and federal
government agencies (like the EPAs,) have already been established, they lack the
experience of monitoring and reinforcement of environmental laws and regulations. There
are no sufficient technical and manpower resources to maintain effective monitoring and
pollution-control. Considering the fact that governments are the major sources of funding for
most activities, the participation of government agencies is essential in the successful
execution of any scheme of environmental monitoring. Thus, the first step in any such
program is to establish and/or strengthen the relevant agency to carry out these activities.
ii) Evaluation: involves assessment of the findings based on the information from the
monitoring step in relation to standards, pre-project predictions and expectations. It often
includes scientific and technical procedures.
iii) Management: involves responding to the issues which may arise from the monitoring
and evaluation processes. All EIA reports should include an impact management plan and
this may include environmental management within the factories and/or outside in the
environmental components. The role of management is undertaken by the parties including
the proponent and the regulator.
iv) Communication: Experience of EIA, globally, has shown that stakeholder involvement
and, increasingly, participation is an important contributor to the overall utility of EIA reports
in decision-making.

49
3.1.1.2. Minimize chemical use Minimizing chemical use is one of the key control and prevention methods to mitigate
adverse environmental effects in factories. Minimizing chemical use can be achieved by:
Following certain standard processing methods that increase the efficient use of
Chemicals (e.g. higher bath temperatures, good measuring equipment, etc.).
Improving chemical application techniques like spot apply solvents instead of pouring -
this helps to avoid spills and stops excessive chemical use
Using correct measurements to reduce waste or spoilage
Using less dangerous or hazardous chemicals
Replacing potentially carcinogenic chemical inks with vegetable based inks
Using lower-foaming detergents or solvents with less isopropyl alcohol to reduce
pollution by reuse certain chemicals
Investigating which chemicals can be reused or recycled: caustic soda, for example,
can be recaptured from the mercerizing process (an intermediate step in textile
refinishing) through evaporation, and
Having good storage and handling to reduce waste and spills (e.g. sturdy and easily
secured containers.
3.1.1.3. Minimize solid and liquid wastes Likewise, minimizing solid and liquid wastes is a prevention and control measure that helps
to fully or partially prevent an impact/reduce a risk. The following list of prevention and
control measures can also help, in one way or another, to minimize solid and liquid waste:.
Operate the project in the point source within its design capacity
Primary and secondary treatment of waste waters: primary treatment is physical and
chemical process that often precedes secondary, or biological, waste water treatment
processes
Separate liquid from solid waste
Screen liquids to remove coarse solids
Drain liquid wastes into a settling tank
Air dry sludge and dispose as solid waste
Separate and sell uncontaminated wastes to farmers as fertilizer
Avoid dumping solid waste
50
Use a proper landfill or bury it in a pit (away from water sources)
Collect, dry and dispose of as solid waste
However, implementation of this mitigation method depends on the willingness of the
company and the enforcement of the environmental safety regulations treated under Chapter
4 of this report.
3.1.2. Remediation measures Environmental remediation would be one of the recommended mitigation measures at the
point sources identified in this study. It is an environmental clean-up practice with the aim of
recovering (“healing” so to say) the contaminated site in the point sources into acceptable
conditions. In a more broad sense any type of recovery of the contaminated site is considered
as a remediation. To remediate the contaminated site in the point sources, one or more of the
following physical, chemical and/or biological remediation techniques can be considered.
3.1.2.1. Physical remediation On-site containment and reconstruction of the treatment facilities (biological
lagoons/oxidation ponds located outside the factory compound and the treatment ponds
located inside the factory compound) may be among the physical remediation measures that
need to be considered here. These may involve the construction of a complete isolation of the
hazards materials that can be achieved by covering/capping, inserting low permeability and
concrete wall, and solidification of wastes in the contaminated sites. This is widely applicable
for contaminated sites with high level heavy metal wastes (Wright and Welbourn, 2002).
Reconstruction of the site is also an alternative physical remediation measure that overlaps
with on-site containment. It involves physical and biological construction that includes
physical diversion of flow of surface or ground water, installation of barriers, placement of
impermeable clay cover to shade surface water and prevent its infiltration through the soil.
Such engineering constructions of course perturb the ecosystem and need to be carried out
with caution (Wright and Welbourn, 2002).
3.1.2.2. Biological remediation An alternative or a complementary method to the above physical remediation is using natural
processes called biological remediation (bioremediation and phytoremediation).
Bioremediation is a process of degradation of contaminants using microorganisms.
Microorganisms bring degradation of organic matter either through oxidation or reduction

51
processes. Microorganisms can naturally bring degradation but such a natural process is
unexpectedly slow in many cases. Therefore, the remediation process is facilitated by
creating favorable conditions to the organisms. According to (Rockne and Reddy, 2003),
bioremediation of contaminated sites can be achieved by:
(i) Complete oxidation of organic contaminants into carbon dioxide and water,
(ii) Biotransformation of organic chemicals into smaller less toxic metabolites, or
(iii) Reduction of halogenated compounds like PCBs using an electron donor
The success of bioremediation in the field relies mainly on the presence of adequate
microorganisms, the physical access of the contaminants to the microorganisms and supply of
electron donor/acceptor. Adequate microorganism flora can be achieved either by stimulating
indigenous microorganisms in the site by the process called biostimulation or by adding an
enriched culture of microorganisms by the process called bioaugmentation. The physical
access of the contaminants can be achieved by chemical or physical treatment of the
contaminants through the process of diffusion, desorption and /or dissolution (Frazar, 2000).
3.2. PMM at the Non-point Sources Unlike pollution from industrial and sewage treatment plants, non-point source pollution
comes from many diffused sources. Non-point source pollution is caused by rainfall moving
over and through the ground. As the runoff moves, it picks up and carries away natural and
human made pollutants, finally disposing them into the lake. Run-off from urban settings,
mainly from Hawassa city and Tikur Wuha town, and rural areas (agricultural fields) in the
catchment are the main non-point sources that bring pollutants to the lake.
The RT has identified Integrated solid waste management (ISWM) and reduce, reuse and
recycle (3Rs), and Agricultural best management practices (ABMPs) as the possible
mitigation measures at the non-point sources.
3.2.1. Integrated solid waste management (ISWM) and reduce, reuse and recycle (3Rs)
Integrated Solid Waste Management (ISWM) and Reduce, Reuse and Recycle (also known as the
3Rs) are a comprehensive waste prevention, recycling, composting, and disposal approaches that
manage solid waste in ways that most effectively protect human health and the environment. This

52
method involves evaluating local needs and conditions, and then selecting and combining the
most appropriate waste management activities for those conditions. As a consequence of
conventional waste management practices, many cities in developing countries are facing
environmental and health risks as well as losing economic opportunities in terms of the resource
value of the waste.
ISWM and 3Rs have been given highest priority on waste prevention, waste reduction, and waste
recycling instead of just trying to cope with ever-increasing amounts of waste through treatment
and disposal. Therefore, a paradigm shift from conventional waste management practices to
ISWM and 3Rs is essential for a city like Hawassa in order to effectively manage the waste
stream.
City Mayors and administrators should try to encourage a fundamental change in mindsets and
attitudes of the public toward waste. Public information and campaigns need to encourage urban
populations to help reduce the waste stream and to turn what used to be considered as “waste”
into “resources” i.e. resources can be recovered from waste if they are separated at the source,
and are treated properly. This paves the way towards “Zero” disposal of solid waste
management integrated with production of transformed resources (see Chapter 4, Section 4.2.1.2.
of this report).
3.2.2. Agricultural best management practices (ABMPs) Agricultural BMPs are procedures and practices designed to reduce the level of pollutants in
runoff from farming activities to an environmentally acceptable level, while simultaneously
maintaining an economically viable farming operation for the grower. Indigenous farmers
have traditionally used and still use an array of traditional slope, water, soil, pest, and
vegetation management techniques, including composting, crop rotation, polycultures,
agroforestry, and watershed management systems. Some of these practices can be selected
and used to reduce pollution that reaches Lake Hawassa from agricultural fields. Source
controls are often the most effective ABMPs for reducing some types of pollution. Examples
of source controls include the following:
• Reducing or eliminating the introduction of pollutants to a land area. An example is
minimizing the application rates for chemical pesticides, herbicides, and fertilizers.
53
• Preventing potential pollutants from leaving a site during land-disturbing activities.
Examples include conservation tillage and limited land clearing.
• Preventing interaction between precipitation and a potential pollutant. An example is
timing chemical applications according to weather forecasts or seasonal weather patterns.
• Protecting riparian habitat and other sensitive areas. Examples include protection of
shorelines and highly erosive slopes.
• Protecting natural hydrology. An example is proper water management (USEPA, 1993).
These mitigation measures could be grouped as non-structural or structural practices. The
nonstructural BMPs are modifications in agricultural practices that do not require some type
of construction. They focus on source reduction (pollution prevention) and programs and
procedures for controlling agricultural nonpoint source pollution. These may include
educating at various levels; water management practices; proper land use; erosion and
sediment control; etc.
Structural BMPs are practices related to something constructed or built. There are a variety of
structural BMPs and most require some level of routine maintenance to continue working
effectively. The physical structures are primarily concerned with changing slope
characteristics to reduce the amount and velocity of runoff. Slope management, based on a
combination of simple and inexpensive cropping practices, can be highly effective in
maintaining or improving crop productivity with minimal erosion risk (Manrique, 1993).
Physical structures are also used to trap sediment and pollutants before they enter surface
waters.
3.3. PMM at the routes A route is a river/stream or drainage canal/surface storm by which the effluents from point
and non-point sources reach the hot inlet spots that ends up in the lake. Wetland vegetation
along the catchment of the river/stream, constructing filtering racks (municipal waste trash
trap) with different mesh size along municipal drainage canals, cover vegetation for reducing
flow of storm water, diverting effluents and digging ditches can be the PMM at the routes.
3.3.1. Wetland vegetation along the catchment Wetland vegetation using, for instance vetiver system along the catchment of the
river/stream, would be a possible measure to mitigate downstream pollution in Lake
Hawassa. The system is based on the unique plant vetiver, Chrysopogon zizanioides. The

54
hedge is a dense barrier above and below ground, the plant is sturdy and stiff and the root is
deep and strong (Fig. 3.3.)
Fig. 3.3. The vetiver system (Adapted from "http://www.vetiver.org/")
The Vetiver grass has special characteristics that are tolerant to extreme environmental
conditions, suitable for bio-filter and wastewater treatment, and tolerant to pollutants
(agrochemicals and heavy metals) (Table 3.1).

55
Table 3.1: Special characteristics of the plant - vetiver (Adapted from
"http://www.vetiver.org/")
Special characteristics Descriptions Tolerate extreme and
wide range of
conditions
Grows under extreme and wide range of conditions
Long living perennial grass
Air temperatures: -15 º C to >55º C
Soil pH from <3 to >10
Annual Rainfall <300 mm to > 5,000 mm. Tolerant to
extreme drought
Tolerates at high levels all heavy metals
Saline tolerant (salinity threshold ECse = 8 dSm-1)
Fire tolerant
Tolerant to long and total submergence in water
Resistant to most pests and diseases
Powerful (average 75 MPa) root strength and deep root
system
Noncompetitive and noninvasive. According to the
PIER level of invasiveness criteria, non-fertile vetiver
cultivars are rated - 8. (An acceptable level for plant
importation)
Suitable for Bio-filter Strips Stiff and erect stems which can withstand fast
flow.
Forming a thick living barrier which slows and spreads
runoff and traps both fine and coarse sediment.
Deep root system binding the soil against erosion.
Highly tolerant to adverse growing conditions such as
acidity, alkalinity, salinity, drought, water logging and
extreme temperature.
Highly tolerant to pollutants, agrochemicals and heavy
56
metals by the most strict countries is +1)
Suitable for
wastewater treatment
Very high capacity for N and P uptake under Dry-land,
Wetland or Hydroponics conditions
Very fast growth with very high water consumption
under wet conditions
Biomass up to 132t/ha
Tolerant high levels of herbicides and pesticides
Highly tolerant to heavy metal toxicities
A hospital sewage farm on Lake Awassa
This sewage effluent is being discharged into the Lake.
The effluent needs further treatment, a Vetiver wetland
would be a low cost and effective solution.
3.3.2. Construction of filtering racks along drainage Canals Drainage canals collect trash and silt that build up and finally reach to treatment ponds or
open shoreline. Constructing filtering racks (municipal waste trash trap) with appropriate
distance along the drainage canal holds trash/solid wastes and help to retain the trash and silt
before reaching the hot inlet spots. This decreases the burden on storm water treatment ponds
under construction along lake shoreline. The trash trapped along the drainage canal can be
easily removed before reaching the hot inlet spots
3.3.3. Cover vegetation for reducing flow of storm water Absence of cover vegetation in open spaces and areas reserved for park will increase the flow
of storm water loaded with waste and silt. Therefore, cities should be green with public open
spaces covered by dense grass. This will trap sediments and increase filtration of toxic
substances on the route before reaching the storm treatment ponds and inlet spots.
3.3.4. Diverting effluents The effluents from the factories (particularly those from HTF, MHSDF and BGIBF) that
enter the streams (especially into Boeitcha, Daka, etc.,) that flow adjacent to the Shallo

57
wetland need to be thwarted from entering the streams that end up in the lake. Diverting the
effluents into the wetland so that they do not reach the routes (the streams) and/or into a
series of storage/stabilization/oxidation ponds within the wetland can be an alternative or
complementary mitigation measure. A kind of a simple Waste Stabilization Pond (WSP) a
modified version of oxidation ponds/lagoons in which stabilization occurs through sunlight, air and
microorganisms can be constructed as depicted in Figure 3.4. Given that the Shallo wetland is not
being used for any agricultural purposes it can provide a long detention time for sedimentation and
biological treatment.
Fig. 3.4. A modified version of oxidation pond that can be constructed in Shallo Wetland . Source: http://www.oilgae.com/ref/glos/waste_stabilization_pond.html
3.3.5. Digging ditches During one of its field visits, the RT, was able to observe that the local farmers (adjacent to
the point where the effluent from MHSDF is released into the streams) have dug a series of
rows of ditches to slowdown and restrain the backflow of the effluent from the stream during
the rainy seasons. Such ditches that serve the same purpose can be constructed in a modified
form down the Boeitcha stream. The ditches resemble the “ridge-tie- method” used to arrest
water along the hill side. A rectangular ditch at certain distance along water course,
besides reducing the speed, temporarily holds/stores the waste water as it flows downstream.
This will allow the soil to filter the waste water. The dense herbs grown around such ditches
will also help in bio-filtering the wastewater. This can be duplicated and scaled-up as one
mitigation method.

58
3.4. PMM at the Hot Inlet Spots and Shorelines Inlet spots are effluent entry points to the lake from point and non-point sources via the
routes. Although, effluent enters Lake Hawassa through different entry points (Tikur Wuha,
Amora Gedel, Hawassa University Referral Hospital (HURH), Loke-Bete mangiest, Green
wood, Oasis, Unique park etc…), the three most important hot inlet spots identified by the
RT are Tikur Wuha, Amora Gedel, and HURH.
It will not be out of place to indicate here why the later three spots are considered as the most
important hot inlet spots. Tikur Wuha receives the effluent from the factories and the Shallo
wetland. Moreover, there is an increasing trend in settlement around the shore, shoreline
agriculture by the local community, private horticultural farm in the immediate vicinity of the
river, grazing, etc. Amora Gedel is the major entry point for municipal waste and surface
storm water from the city. The inlet spots at the Hawassa University Referral Hospital
receive medical wastes from the hospital and municipal waste from the city that enters the
south eastern side of the lake. Major emphasis should therefore be given to these three hot
inlet spots and some recommendations should be suggested for the others.
The interrelationship between a lake and its shoreline is also of a paramount importance since
shoreline zone is the last line of defense against challenges that may otherwise threaten the
health of the lake. Development within the catchment, particularly along the immediate
shoreline of the lake increases the amount of pollutants that reach the lake. A lot of activities
are taking place along the shoreline of Lake Hawassa. The presence of hotels, villages,
recreation centers, and hospital are some of the development activities that have taken place
adjacent to the nearby shoreline. Medical wastes from the hospital and municipal wastes
from the hotels and the households pose danger to the lake ecosystem. Shoreline farms are
also the main agricultural activities that may release agrochemicals sequestrated in the soil
and reach the lake through runoff. On-site observation of the shoreline revealed that there are
mining activities at the SW part of lake that may aggravate the siltation problem.
In summary, waste water loaded with pollutants reach Lake Hawassa along the shore facing
Hawassa City. Industrial wastes enter the lake through Tikur Wuha, and Municipal/Urban
wastes via drainage channels. Surface storm enters at different entry points ( Green Wood,
Unique park, Amora Gedel), Hospital waste at the HURU, and Agro- Chemicals from the
shore line agriculture extending from Loke up to Bete Mangiest. Phytoremediation and

59
establishment of buffer zone (i.e. a strip of natural vegetation along shoreline/restoration and
enhancement of the associated wetland) as well as storm waste management (SWM) pond
can be the PMM at the hot inlet spots and the shoreline.
3.4.1. Phytoremediation Some plants like vetiver (see section 3.3.1. above) have a remarkable ability to tolerate
exposure and accumulation of high dose (x200 the normal dose) of contaminants and such
plants are referred to as hyper accumulators. Phytoremediation is thus an in situ treatment of
contaminated sites using various plant species (Anderson et al., 1993 ; Pulford and Watson,
2003). Other types of plants that appear promising for this form of remediation include the
mustard plant, alpine pennycress, broccoli and cabbage (Arthur and Coats, 1998). However,
we do not recommend the use to these edible plant species for phytoremediation due to the
possible accumulation of toxic substances in the plants that can, intentionally or accidentally,
be consumed by humans and/or domestic animals.
Plants achieve the recovery of contaminated site by effectively reducing the bioavailability of
the harmful contaminants through the following processes:
1. Phytotransformation: the transformation of organic contaminants into less
toxic, less mobile or more stable form (Frazar, 2000),
2. Phytodegradation: the metabolization of the organic contaminant by the plant
enzymes or by microbial assisted degradation (Burken and Schnoor, 1996 )
3. Phytovolatilization: the volatilization of organic contaminants as they pass
through the plant leaves (Brusseau et al., 1997 )
4. Phytostabilization: the stabilization and reduction of the mobility and the
migration of contaminants through the soil by absorbing and binding leachable
constituents to the plant structure (Salt et al., 1998 )
The process of phytoremediation is affected by various factors like chemical and physical
properties of the contaminants (Briggs et al., 1982) and other environmental factors like soil
matrix, chemical speciation and climate. Although phytoremediation is an emerging
technology that promises effective and inexpensive cleanup of certain contaminated sites, it
has the following limitations:

60
It is limited to Shallo soils: the depth of the treatment zone is determined by the plant
root depth in the soil
It can transfer contamination across media, e.g., from soil to air.
Contaminants may enter the food chain through grazing / browsing animals
3.4.2. Storm water management (SWM)
Storm water is of concern for three main reasons: its large volume and short timing of
flooding, its huge potential to carry contaminants, and the misconception that people
assume that water dilutes the pollutants and hence use storm water to dispose domestic
wastes - this is the extension of the old unwarranted thinking that “dilution is the solution to
pollution”. Thus, storm water management (SWM) should consider technical, institutional
and social aspects including:
control of flooding and erosion
control of hazardous materials to prevent release of pollutants into the environment
(source control)
construction of storm water retention or detention ponds as a treatment system so
contaminants are removed before they pollute water bodies
planning in advance to create solutions before problems become too great
Educating the community to change the mind set on how improper waste disposal
can affect water quality and what the public can do about SWM.
3.4.3. Establishment of buffer zone As discussed in 3.4.1. above, it is possible to restore and enhance the associated wetland and
then ecological functions of the lake shore by restoring the shoreline with native plants.
Moreover, such a buffer zone can play a key role in limiting negative potential impacts from
developed shore land activities that leads the pollution of the lake from medical, municipal
and agricultural waste by filtering and retaining the wastes. The vegetation buffer zone in
general helps also to prevent the siltation problem by retaining the sediments.
The primary purposes of vegetation buffer zones are therefore to:
Remove nutrients from fertilizers, septic systems and storm water runoff. Vegetation
reduces runoff by increasing storm water infiltration into soil. Less runoff means

61
fewer nutrients and other pollutants entering the water. Needless to mention that
excess nutrients are the primary cause of algal blooms and increased aquatic plant
growth.
Intercept and remove sediments in runoff
Stabilize soils with plant root systems
Reduce shoreline erosion due to wave action
Purify water with aquatic vegetation
Improve wildlife and fish habitat by providing food, shelter, and shade
In addition, a native plant buffer zone can create a more aesthetically pleasing shoreline for
human.
Creating effective buffer zone requires understanding of local circumstances. Although the
delineation of any width of the buffer zone has benefits, the delineation of buffer zone needs
to follow a certain standard criteria. A different line of trees, shrubs and grasses from
native/indigenous plants may create a multiple layers-just like in nature. What should we
plant? We may need to look around at natural areas to see what plants are growing there and
consult professionals. Buffer vegetation also should reflect local needs and conditions.
All the possible mitigation measures to reduce adverse impacts of Industrial and Medical
Wastes from point sources and municipal and agricultural wastes from non-point sources on
the lake are summarized in Table 3.2.
3.5. Recommended Cost Effective Mitigation Measures (RCMM) at the Specific Target Sites
It is not practical to mitigate every impact at a given time in order to address the pollution
challenges faced by the lake and to effectively manage the lake resources within the
catchment area. For mitigation to be effective, it must be:
Realistic - achievable within time, resources and capabilities.
Targeted - correspond to impacts
Considering early - preventive mitigation is usually the cheapest and most effective
especially when built-in at the design stage

62
Adequately Funded - over the life of the activity; if funding/budget for mitigation
measures are not programmed at the design stage, they are almost always inadequate
Therefore, there is a need of prioritizing the urgent impact at the target sites that can be
mitigated at a given time and with the resources available. Recommendation of cost effective
mitigation measures requires detailed cost benefit analysis; however such approach demands
time and other resources. The RT has considered the following key points in line with the
aforementioned criteria while selecting mitigation measures as cost effective:
i. Mitigation measures recommended by the RT are preventive and control actions -
which are generally considered as cost effective;
ii. Integrated and joint efforts among concerned environmental bodies ( NGO, GO
and the public at large) will minimize cost by reducing duplication of efforts and
insure synergistic benefits;
iii. Priority has been given to the critical sources that cause serious impact on the
environment and human health. Such impacts are either irreversible or very costly to
reverse.
Accordingly, the effluent from the factories released to the nearby stream (“Boeitcha”
Stream) that reaches Tikur Wuha river and ends up in the lake should come at the forefront
of the mitigation actions. By the same token, the HURH that operates at close proximity to
Lake Hawassa and releases liquid waste, that may cause serious impacts, directly into the
lake needs to be mitigated urgently.
While addressing the pollution challenges faced from the discharges of the industries and the
referral hospital, the RT also realizes that development within the catchment, particularly
along the immediate shoreline of the lake increases the amount of pollutants that reach the
lake. Hence the RT has prioritized and recommended the following cost effective mitigation
measures at the:
Point sources - factories and hospitals
Routes - the “Boeitcha” stream
Hot inlet spots - Tikur Wuha River and the HURH
Shorelines around the lake
63
In the following sections (3.5.1. to 3.5.5) the Recommended Cost-effective Mitigation
Measures (RCMM) are described based on the rationale described under 3.5. above.
Needless to point out again, that there is no single promising mitigation technique and hence
each approach mentioned hereafter is not mutually exclusive from the others. Some
combinations of these approaches are commonly used and have synergistic and/or additive
effects.
3.5.1. RCMM at Specific Point Sources
3.5.1.1. Hawassa Textile Factory (HTF) The Hawassa textile factory, like other textile industries utilizes large amount of water and
produces proportional amount of wastewater from different steps in the dyeing and finishing
processes. Wastewater from printing and dyeing units is often rich in color containing
residues of reactive dyes and chemicals, and hence requires proper treatment before being
released into the environment. Cotton provides an ecologically friendly textile, but more than
50% of its production volume is dyed with reactive dyes. Unfortunately, dyes are unfavorable
from an ecological point of view, because the effluents generated are heavily colored, contain
high concentrations of salts, and exhibit high biological oxygen demand/chemical oxygen
demand (BOD/COD) values. In dyeing textiles, there is a need of following strict ecological
standards throughout processing from raw material selection to the final product.
Previous studies on HTF (Zinabu Gebremariam and Zerihun Desta, 2002; Zerihun Desta,
2003; Zinabu Gebremariam and Pearce, 2003; Birenesh Abay, 2007; Behailu Berehanu, et al,
2010) indicate that waste water from the factory is treated both chemically (using sulphuric
acid to neutralization in the system located within the compound of the factory) and
biologically in a lagoons/oxidation ponds (located outside the factory compound) before the
effluent is discharged into the surrounding. However, an investigation by Lijalem (2011) and
our current visit to the factory revealed that the chemical treatment plant is non-functional.
The study by Zinabu Gebremariam and Zerihun Desta (2002) has clearly shown that the
biological treatment method is inefficient in that it does not remove the chemicals but rather
concentrates the content of the “treated” effluent before it is discharged. According to their
findings the concentrations of about 70% of the elements in the “treated effluent” were up to
10 to 100 times higher than in the raw effluent. In general, the effluent released from HTF
after treatment and reaching Tikur Wuha River contains large nutrient load and heavy metals
that can bring about harmful environmental impacts on the lake (see Sections 1.2.3. and
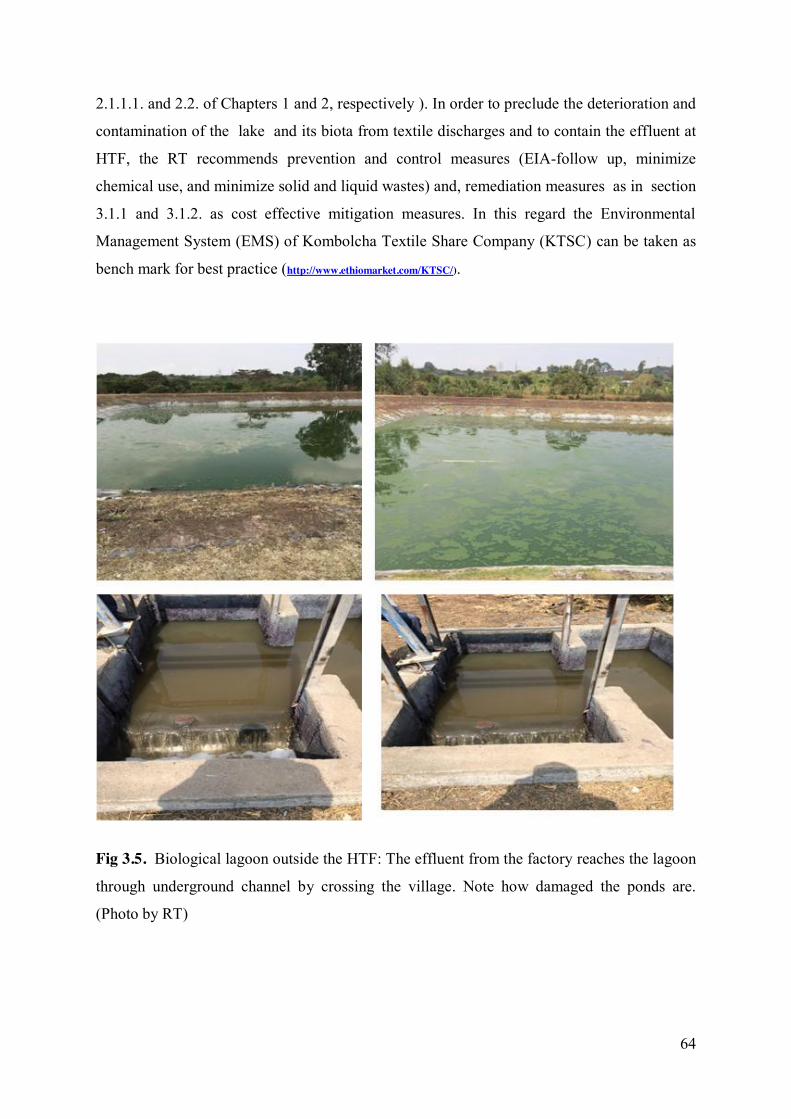
64
2.1.1.1. and 2.2. of Chapters 1 and 2, respectively ). In order to preclude the deterioration and
contamination of the lake and its biota from textile discharges and to contain the effluent at
HTF, the RT recommends prevention and control measures (EIA-follow up, minimize
chemical use, and minimize solid and liquid wastes) and, remediation measures as in section
3.1.1 and 3.1.2. as cost effective mitigation measures. In this regard the Environmental
Management System (EMS) of Kombolcha Textile Share Company (KTSC) can be taken as
bench mark for best practice (http://www.ethiomarket.com/KTSC/).
Fig 3.5. Biological lagoon outside the HTF: The effluent from the factory reaches the lagoon
through underground channel by crossing the village. Note how damaged the ponds are.
(Photo by RT)

65
3.5.1.2. Moha Hawassa Soft Drinks Factory (MHSDF) and BGI Hawassa Brewery Factory (BGIHBF)
As it has been described in Chapter 2, the MHSDF has no biological treatment system. The
chemically treated effluent from the factory goes through underground tunnel (for only some
distance from the factory) then flows through an open ditch around a residential area of a
nearby rural community. According to our observations, the effluent from the factory is
channeled through PVC pipes buried under the earth and is released into an open concrete
ditch (see Fig. 3.1). There are two ponds right where the effluent is released into the open
ditch from the PVC pipes. The ponds were presumably constructed to serve as storage ponds.
But they were too small to hold the large volume of the effluent even for a few hours
(according to local informants) and are not used at the moment. Instead, an alternative a
concrete ditch that leads into the open has been constructed
As described in, Chapter 2, the effluent from BGI is released into the wetland through an
open muddy channel (see Fig. 3.1). The effluent, in a large volume, flows fast with a lot of
pressure, indicating that the slope has been properly drained to allow all the effluent to end up
in the wetland. The effluent from BGI joins/mixes with the one from Moha and flows down
to the Boeitch stream along the edge of the wetland and everything ends up in the River Tikur
Wuha, and then eventually into lake. The RT recommends prevention and control measures
(EIA-follow up, minimize chemical use and minimize solid and liquid wastes) and,
remediation measures as in section 3.1.1 and 3.1.2. as cost effective mitigation measures at
MHSDF and BGIHBF.

66
Fig.3.1. Concrete ditch (A) that takes the effluent from MHSDF into an open ditch that is
directly discharged at the edge of the wetland (B) and flows down to the Boga stream. The
effluent from BGIH-BF that flows to the edge of the wetland (C) confluents with the one
from Moha and flows down to the Boeitch stream along the edge of the wetland (D). (Photo
RT)
3.5.1.3. Tabor Ceramics Factory (TCF) The factory is not located in the industrial zone designated by the city administration and
according to the neighboring community, the effluent from TCF is discharged in a park
(forested area) right at the North Eastern side of the lake (along the Shashamenne-Hawassa
road side) that ends up to the lake. Behailu Berehanu, et al. (2010) indicated that the effluent

67
was monitored once or twice by EEPA. However, the factory has no regular environmental
audit system and no officially documented reports concerning compliance to environmental
laws and principles of EEPA.
The RT recommends prevention and control measures (EIA-follow up, minimize chemical
use and minimize solid and liquid wastes) and, remediation measures as in section 3.1.1 and
3.1.2. as cost effective mitigation measures at TCF.
3.5.1.4. ETAB- Soap Factory (ETAB-SF) The overall liquid waste generated by the factory is collected in the septic tank and disposed
by the city municipality services. The byproducts from the factory after the production
process are re-used as source of energy for the boiler. The RT recommends prevention and
control measures (EIA-follow up, minimize chemical use and minimize solid and liquid
wastes) as in section 3.1.2. as cost effective mitigation measures at ETAB-SF.
3.5.1.5. Hawassa University Referral Hospital (HURH) The effluent from HURH is carried to the oxidation pond right at the edge of the lake and part
of the effluent escapes into the lake during the rainy season. Although the HURH has a set of
oxidation ponds, they are not properly functioning and studies have shown that the treatment
is inefficient. It requires renovation and strict follow- up to ensure that the pond is performing
the intended purpose. Furthermore, modification of design of the ponds to produce treated
effluents suitable for disposal into the environment is required (Simachew Direse, 2008).
The RT recommends prevention and control measures (EIA-follow up, minimize chemical
use and minimize solid and liquid wastes) and, remediation measures as indicated in 3.1.1
and 3.1.2. as cost effective mitigation measures at HURH.

68
Fig. 3.2. Hawassa University Hospital and its Oxidation ponds (Photo by RT). Note that the
Hospital and the ponds are at very close proximity to the lake.
3.5.2. RCMM at non-point sources
3.5.2.1. Households, hotels, health centers and other public service rendering institutions
In many cases, municipal wastes are not well managed in Hawassa, as the city municipality
cannot cope with the accelerated pace of waste production. Waste collection systems are
inefficient and waste is often disposed of through uncontrolled landfilling and is processed
through unsafe and informal recycling. Municipal wastes from urban settings are therefore, one
of the non-point sources of pollution. The RT recommends Integrated Solid Waste Management
(ISWM) and Reduce, Reuse and Recycle (3Rs) as in section 3.2.1. as cost effective mitigation
measures at the house-holds and public service rendering institutions.
3.5.2.2. Agricultural fields
Agricultural fields are also one of the main non-point sources that may release agrochemicals
(pesticides and fertilizers) sequestrated in the soil and reach the lake by runoff. Some banned
pesticides grouped under persistent organic pollutants (POPs) are also used in the area
(Ermias Deribe, 2013b). The RT recommends ABMPs as in section 3.2.2. as cost effective
mitigation measures at agricultural fields.

69
3.5.3. RCMM at specific routes
3.5.3.1. Industrial effluent route Our observations on the route of the discharge from the HTF, MHSDF, and BGI-BF revealed
that “Boeitcha” stream (Cheffe Kotti Jebessa) is the main course for downstream pollution of
the lake. It has for long been taken for granted that effluents from the factories are finally
discharged into the open wetland. Therefore, it was anticipated that the effluent would have
been naturally purified by the time it reaches Tikur Wuha River. Our present observations
and the information from the community have unequivocally shown that the effluent from the
factories intercepts the wetland only at the edge and joins the stream flowing through
“Boeitcha” stream towards Tikur Wuha River that ends up in Lake Hawassa. The gravity of
the pollution problem is therefore much higher than it could have been if the effluent had
been discharged into the wetland. “Boeitcha” stream is therefore the main route that needs
mitigation measures. The RT recommends wetland vegetation using vetiver system as cost
effective mitigation measures as in section 3.3.1. along the catchment of “Boeitcha” stream,
diverting the effluents as in section 3.3.4 and digging ditch as in section 3.3.5.

70
Fig 3.3. “Boeitcha’’ stream: The main course to Tikur Wuha River and the main route for
downstream pollution of Lake Hawassa (Photo by RT)
3.5.3.2. Drainage canal/surface storm The drainage canals and the storm water directed to Lake Hawassa pile up trash materials on
the lake shore. This will impair the function of treatment ponds constructed by the Hawassa
Municipality and eventually will have a negative impact on the lake ecosystem. The RT

71
recommends construction of filtering racks (see Fig.3.4.) and cover vegetation for reducing
flow of storm water as indicated in 3.3.2 and 3.3.3 cost effective mitigation measure.
Fig. 3.4. Filtering racks (municipal waste trash trap) constructed along the drainage canal
holds trash/solid wastes and helps to retain the trash and silt before reaching the hot inlet
spots which also decreases the burden on storm water treatment ponds under construction
along the lake shoreline by Hawassa Municipality (Photo by RT)
3.5.4. RCMM at specific inlet spots
3.5.4.1. Tikur Wuha Site A study conducted by Zinabu Gebremariam and Pearce (2003) revealed that the Tikur Wuha
River, which is a receiver of the effluent from point sources (factories) and that flows into
Lake Hawassa, contains toxic metals like Cu, Cr, Ni, Pb, Cd, and Zn among others.
Therefore, the high concentrations of Cu, Cr and Ni detected in the lake and the metals in
Tikur Wuha were assumed to be due to downstream pollution from point sources. Moreover,

72
Tikur Wuha and the associated wetland have suffered from degradation due to adverse
human activities. The macrophyte vegetation has been greatly reduced. As a result, the
capacity of the wetland to hold back storm water, remove pollutants and slow down erosive
forces has reduced through time. Restoration of the wetland to its approximate status prior to
degradation is critical. Enhancement of the wetland by introducing non- invasive or non-
competitive grass species to increase its function of sediment trapping and bio- filtering toxic
substances should be undertaken. In this regard the RT recommends biological remediation -
specifically phytoremediation as in 3.4.1. using the plant - Chysopogon zizanioides - Vetiver
Grass as a bio filter along the Tikur Wuha River and restoration and enhancement of the
associated wetland by establishing a buffer zone: a strip of natural vegetation as in 3.4.3.
Fig. 3.5. Tikur Wuha River: Influent from the ‘’Boeitcha’’ stream and municipal waste from
both sides of the road are drained into Tikur Wuha River and end-up at Lake Hawassa (Photo
by RT).

73
3.5.4.2. Amora Gedel Site Amora Gedel is an important inlet and hot spot for urban waste. It receives waste water
loaded with toxic substances and pathogens through drainage canals and surface storm water.
Storm water treatment or sedimentation pond is on construction by the Hawassa city
administration just near the shore at the Amora Gedel (“fish market”). The effectiveness of
the pond will largely depend on measures that should be taken at the source and the route. In
this regard the RT recommends: storm water management (SWM) as indicated in 3.4.2.,
biological remediation - specifically phytoremediation as in 3.4.1. using the plant -
Chysopogon zizanioides - Vetiver Grass as a bio filter around Amora Gedel, and establishing
a buffer zone as indicated in 3.4.3.
3.5.4.3. Referral Hospital Site The Referral Hospital site is located very near to the HURH, a potential source of medical
wastes including toxic substances and pathogens. The site is both source and hot inlet spot
that poses a threat to Lake Hawassa. Moreover, this the site receives storm water loaded with
urban waste and silt entering the South Western side of the lake. Therefore, considering
these problems, the RT recommends SWM, construction of wetlands (with dense Vetiver)
and establishment of buffer zone as indicated in, 3.2.1, 3.3.1 and 3.4.3, respectively. The
Research Team has also observed that shore line agriculture is practiced in the narrow strip of
land that occurs between the oxidation pond and the macrophyte at the littoral zone of Lake
Hawassa. It is this narrow strip of land that should be used for constructing wetland.
3.5.4.4. Green Wood – Unique Park Site This is an inlet for storm water coming from North Western side of the Hawassa city. The
storm water is intercepted by the dyke constructed on the Eastern shoreline of Lake Hawassa.
It has formed artificial wetland consisting of a band of dense macrophyte belt that reduces
storm water, trap sediment and solid wastes. This vegetation has to be protected and
established as biological mitigation measure.
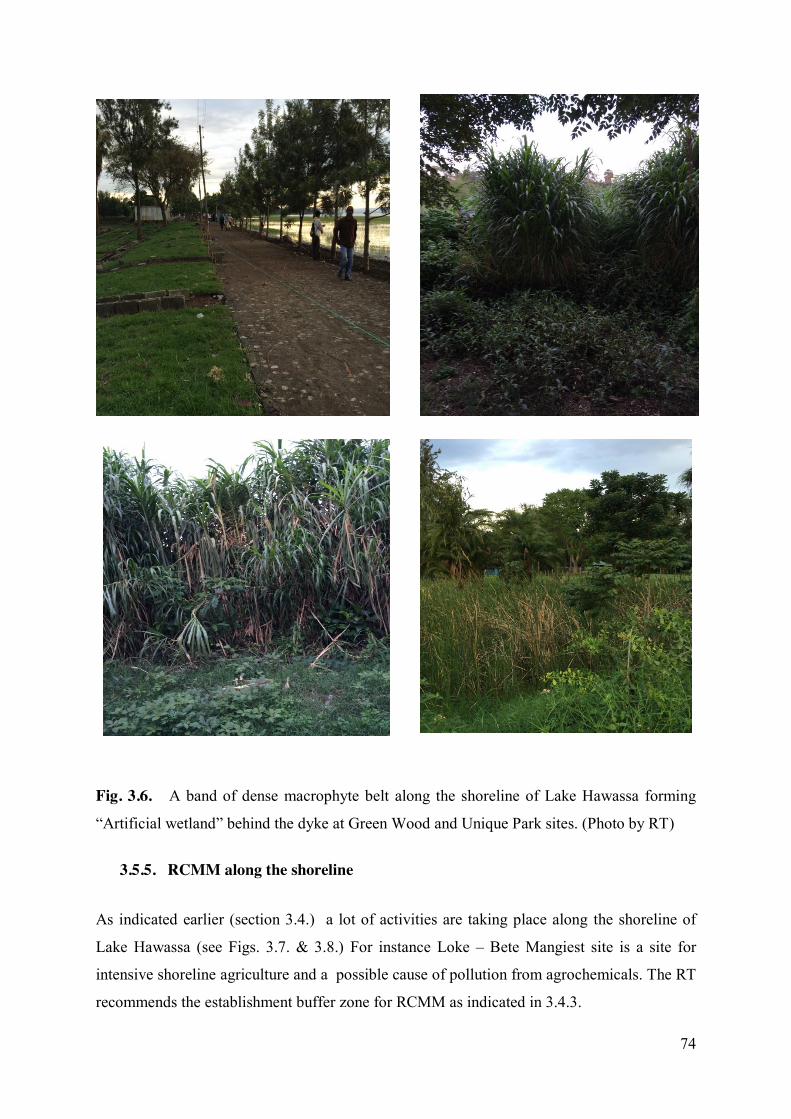
74
Fig. 3.6. A band of dense macrophyte belt along the shoreline of Lake Hawassa forming
“Artificial wetland” behind the dyke at Green Wood and Unique Park sites. (Photo by RT)
3.5.5. RCMM along the shoreline
As indicated earlier (section 3.4.) a lot of activities are taking place along the shoreline of
Lake Hawassa (see Figs. 3.7. & 3.8.) For instance Loke – Bete Mangiest site is a site for
intensive shoreline agriculture and a possible cause of pollution from agrochemicals. The RT
recommends the establishment buffer zone for RCMM as indicated in 3.4.3.
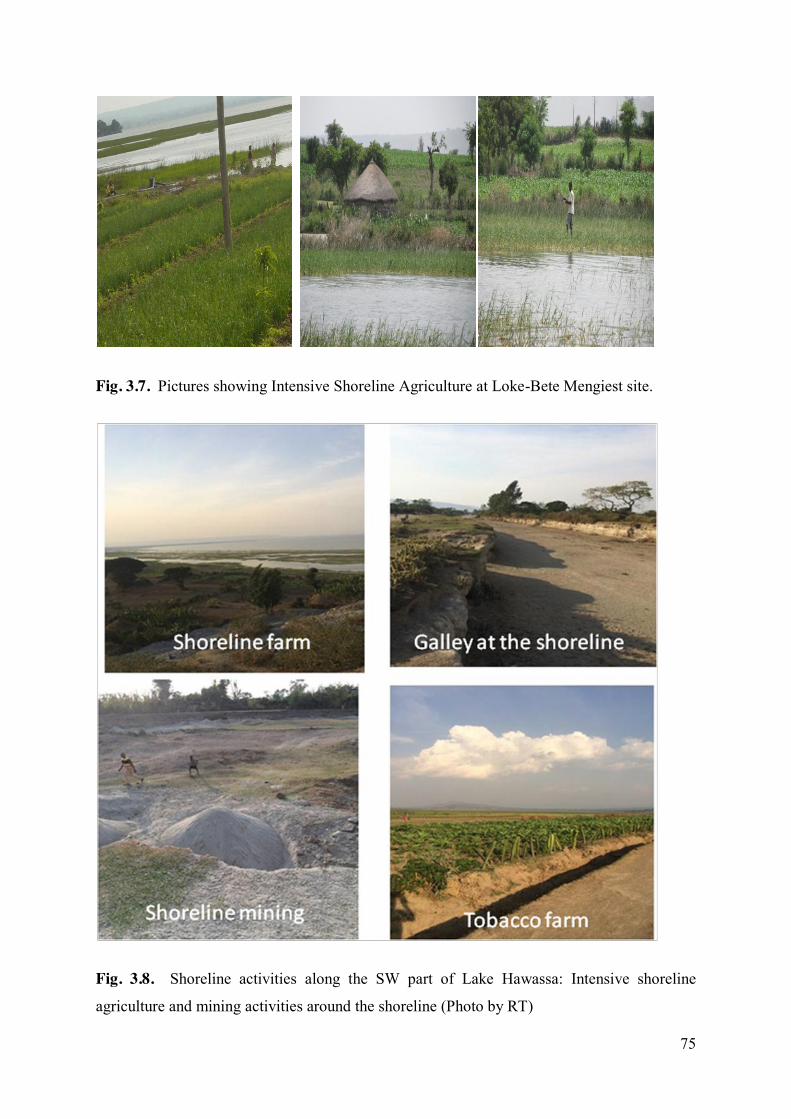
75
Fig. 3.7. Pictures showing Intensive Shoreline Agriculture at Loke-Bete Mengiest site.
Fig. 3.8. Shoreline activities along the SW part of Lake Hawassa: Intensive shoreline
agriculture and mining activities around the shoreline (Photo by RT)

76
The RT proposes establishment of buffer zone as in section 3.4.3. along shoreline of the lake.
In this regard, the buffer zone proclamation by the Hawassa City Council (in process) and its
implementation is a long lasting solution to reduce the concentration of toxic substances
entering Lake Hawassa.
Finally, several mitigation measures to reduce the concentration and inflow of pollutants
reaching Lake Hawassa have been identified in this study. The recommended cost effective
mitigation measures at the different target sites of the lake are summarized in Table 3.3.
Table 3.3. Summary of recommended cost effective mitigation measures at the different
target sites
Main site Specific target sites RCMM
1 Point sources HTF,MHSDF, BGIHBF,
and TCF
1. EIA-follow up
2. Minimize chemical use
3. minimize liquid and solid wastes and
4. contained the effluent in the long run
ETAB-SF 1. EIA-follow up
2. Minimize chemical use
3. minimize liquid and solid wastes
HURH and the Oxidation
pond at Hawassa
University Main Campus
1. Regular monitoring
2. minimize liquid and solid wastes and
3. contained the waste in the oxidation
pond in the long run
2 Non-point
sources
State farm and Shoreline
farms
a buffer zone with a strip of natural
vegetation along shoreline
Municipal (households,
hotels, garages
a buffer zone with a strip of natural
vegetation along shoreline
3 Routes
“Boeitcha” stream vetiver wetland along the catchment of
the stream
4 Hot inlet Spots Tikur Wuha R Phytoremediation
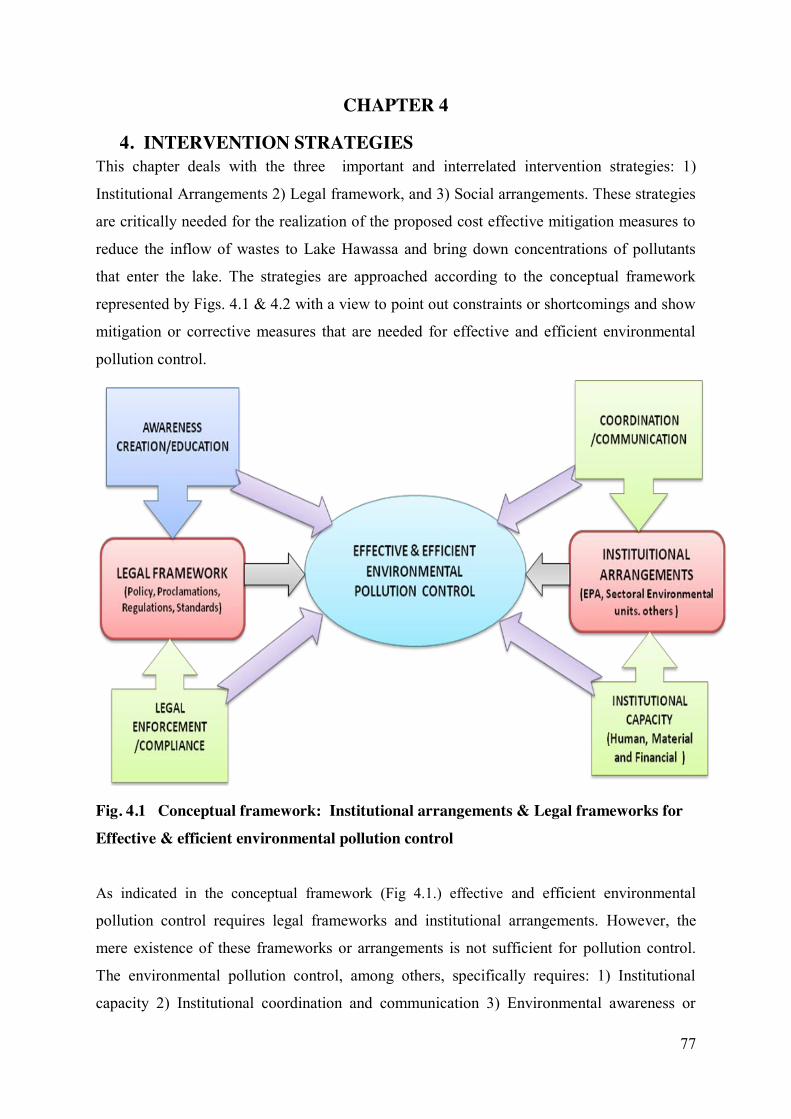
77
CHAPTER 4
4. INTERVENTION STRATEGIES This chapter deals with the three important and interrelated intervention strategies: 1)
Institutional Arrangements 2) Legal framework, and 3) Social arrangements. These strategies
are critically needed for the realization of the proposed cost effective mitigation measures to
reduce the inflow of wastes to Lake Hawassa and bring down concentrations of pollutants
that enter the lake. The strategies are approached according to the conceptual framework
represented by Figs. 4.1 & 4.2 with a view to point out constraints or shortcomings and show
mitigation or corrective measures that are needed for effective and efficient environmental
pollution control.
Fig. 4.1 Conceptual framework: Institutional arrangements & Legal frameworks for Effective & efficient environmental pollution control
As indicated in the conceptual framework (Fig 4.1.) effective and efficient environmental
pollution control requires legal frameworks and institutional arrangements. However, the
mere existence of these frameworks or arrangements is not sufficient for pollution control.
The environmental pollution control, among others, specifically requires: 1) Institutional
capacity 2) Institutional coordination and communication 3) Environmental awareness or

78
Education program, and 4) Legal Enforcement/ Compliance. These essential components are
briefly assessed under institutional arrangements and legal frameworks.
4.1. Institutional Arrangements The Environmental institutions or environmental organs of focus for this study include, the
environmental protection agency of SNNPRS and its sectoral environmental units as well as
the Hawassa city council with respect to their responsibilities and activities in protecting
Lake Hawassa from anthropogenic sources of pollution. Their efficiency and effectiveness
has been assessed in terms of institutional capacity, and coordination and communication
capabilities.
4.1.1. Institutional capacities The pollution threat on Lake Hawassa is huge, multifaceted and complex (see chapters I & II
of this report) that requires multidisciplinary and integrated approaches to bring about
meaningful interventions. This in turn demands strong institutional capacity with adequate
number of qualified staff with proper professional mix, as well equitable financial and
material support. In this respect, the Regional Environmental Protection Agency (REPA) that
should play the leading and regulatory role in the control of environmental pollution suffers
from all the aforementioned constraints. These limitations do not allow the agency to
establish, coordinate and follow up the environmental units or waste management systems as
expected in the Federal Environmental Pollution Control Proclamation and the Prevention
and Control Regulations of the Industrial Pollution.
The agency, the environmental units, and the waste management systems in place as per the
proclamations and regulations are briefly evaluated hereunder.
4.1.1.1. Sectoral environmental units Article 14 of the Federal Proclamation No. 292/2002 requires of all government organs to
establish environmental units to coordinate and follow-up sectoral activities to prevent
pollution and comply with environmental laws. However, sectoral environmental units are
either absent or weak in their capacity of implementing environmental laws. The support and
follow-up of these sectoral units by the environmental protection agency is not to the level
indicated in the proclamations and regulations. It is essential that the regional
environmental protection agency and the sectoral environmental units create a common forum for integrated action and effective implementation of pollution control

79
proclamations and regulation. These sectoral environmental units that should come to a
common forum to control pollution are those under the regional bureau of Agriculture &
Rural Development, Bureau of Water Resource, and Bureau of Health.
4.1.1.2. Integrated waste management system in urban public administration Management of municipal waste is key to pollution control. It is so important that the
environmental agency of the SNNPRS should closely work with Hawassa city council and
municipality to ensure the collection, transportation and, as appropriate, the recycling ,
treatment or safe disposal of solid waste and discharge of waste water towards Lake
Hawassa. The establishment of Environmental protection unit under the city council is an
exemplary measure for effective and efficient environmental pollution control and systematic
approach to mobilize the community (public) at large using sub- cities and kebeles as grass
root partners. However, the city council has to exert strong efforts to implement integrated
waste management in proportion to the expansion of the city and huge amount of waste
generated from different sources. It has to work towards “Zero” waste disposal strategy by
introducing Bioprocess or converter technology where a by-product or organic waste of one
system can be used as input for another system with the release of Biofertilizer and
Bioenergy (Fig.4.2.)

80
Fig. 4.2. Proposed Strategy towards Zero waste disposal

81
The zero waste disposal strategy is a necessity rather than a choice because environmental
pressures and costs in incineration or land filling makes removal or disposal a difficult task
in rapidly growing and urbanized cities like Hawassa. Moreover, using waste not only
reduces cost but generates income and creates job opportunity.
4.1.1.3. Environmental management system (EMS) in industries Article 9 of the National regulation No. 159/2008 for prevention of industrial pollution
demands that every factory in compliance with the regulation should prepare and implement
its own internal environmental monitoring system. Moreover, every existing factory should
undertake environmental audit, and prepare and implement an environmental management
plan. Such a plan is crucial as it is in–house pollution management system to minimize the
release of pollutants or hazardous wastes to the environment. In this regard, the experience of
Ethiopian Tannery Share Company – ETSC (Mojo) can be taken as a lesson for all
factories in Hawassa (http://www.pittards.com/news-page/34/Ethiopia).
4.1.2. Institutional coordination and communication
The Ethiopian Environmental Protection Authority (EEPA) is a leading and regulatory organ
for environmental pollution control. In addition to EEPA, relevant sectoral institutions such
as ministry of water resources (MOWR), Ministry of Health (MOH), Ministry of Justice
(MOJ), and Urban administrations (City council, Sub-cities and Kebeles) are directly and
indirectly involved in the implementation of proclamations and regulations of environmental
protection and pollution control. Institutional coordination and collaboration between EPA
and the aforementioned sectoral units as well as inter – sectoral linkages and partnership are
vital for efficient and effective pollution control. The coordination and linkage among these
institutions play key role for integrated action, reducing cost, eliminating risk of gaps and
duplication of efforts. Collaboration and partnership pave the way to build comparative
advantages of each partner and ensure synergistic benefits to be achieved more than any of
the actors working alone. The collaboration and partnership should involve stakeholders
including NGOs, CBOs, Civic Societies and concerned groups working on environmental
protection. This helps to synchronize and consolidate capacity, and permit direct and active
participation of the public at large. The stronger the coordination, communication and
partnership, the greater is the effectiveness of compliance with and enforcement of the
pollution control system. However, all these essential elements are not developed and

82
structured in the way they can foster effective implementation of the pollution control legislation.
Thus it is so important that, the regional environmental protection agency should give priority and
work hard to create a joint forum of the sectoral environmental units. The agency has to establish
strong functional linkage and interactive regular communication among the environmental units
working for the same goal. The Regional Environmental protection agency should also initiate
the establishment of a consortium of NGOs, CBOs and Civic societies working on environmental
protection and pollution control.
4.2. Legal Frameworks The Ethiopian government has produced environmental policy and declared different
proclamations that adequately state the power, duties and responsibilities of regulatory
institutions for environmental pollution control. Regulations and penalties with regard to
pollution discharge of hazardous wastes and toxic substance to air, soil and water as well as
environmental protection and environmental impact assessment are clearly indicated in the
proclamations. The major declarations that exist include:
The 1997 Environmental policy
Water Resource Management Proclamation (Proclamation No. 197/2000)
Public Health Proclamation (Proclamation No.200/2000)
The Environnemental Protection Organes Establishment Proclamation (proclamation
No. 295/2002)
The Environnemental Pollution Control Proclamation (Proclamation No. 300/2002)
Solid waste management proclamation (Proclamation No. 513/2007)
Industrial Pollution Regulation ( Regulation No. 300/2002)
The Environnemental Impact Assessment Proclamation (Proclamation No. 299/2002).
Although the aforementioned proclamations are declared and instituted, their implementation
suffers from two directions: Lack of public awareness and little or no enforcement /compliance.
In the following section, we will briefly discuss these two constraints and the intervention
measures required for efficient and effective pollution control.
4.2.1. Environmental awareness or education program
In addition to institutional capacity and coordination, it is essential that all stakeholders
involved in environmental protection and pollution control activities acquire full and

83
equal understanding of the Ethiopian environmental policy proclamations and regulations
declared for the control of pollution and discharge of hazardous wastes. There is still a
lot of misunderstanding at different levels with regard to environmental issues. For
instance, there is a lack of awareness and widespread misconceptions about EIA in
Ethiopia; some even consider EIA as an obstacle to development activities. Moreover,
there is little or no public awareness & participation in EIA processes.
Besides inadequate guidelines, people seldom receive enough information regarding the
guidelines that have been developed for implementation. There is no sufficient
information flowing within, between and among government and non-government
organizations working on environment. Therefore, there is a pressing need for the
establishment of environmental information system and data base as well as
dissemination mechanisms to the public at large. This in turn demands creating
environmental awareness and education program with multi-media approach and various
tools of communication as illustrated in Fig. 4.3. The Environmental awareness and
education program should be continuous and needs to adequately involve the different
environmental actors. It should promote the empowerment of the community to assist the
development of knowledge, skills, values and commitment necessary for successful
integrated pollution and waste management. The following figure summarizes the
different tools or channels for creating awareness and provides specific examples on how
to reach decision makers and the public at large.

84
Fig. 4.3. Communication tools for creating awareness among policy makers and the public at
large.
4.2.2. Legal enforcement/ compliance Proclamations and regulations of environmental protection and pollution control clearly state
that discharging pollutants or hazardous material to the environment is a punishable criminal
act. If the polluter happens to be a juridical person, the liability further escalates. Likewise,
when there is a reason to believe that the continuation of the operation of a particular factory
may entail serious pollution, the environmental protection organs can take strong measures
that include closing down or transfer of a factory to another site. The licensing sectoral
governmental bureaus can also suspend or cancel licenses. However, let alone to take such
strong legal measures, less severe actions that can serve as warning signals to the offender
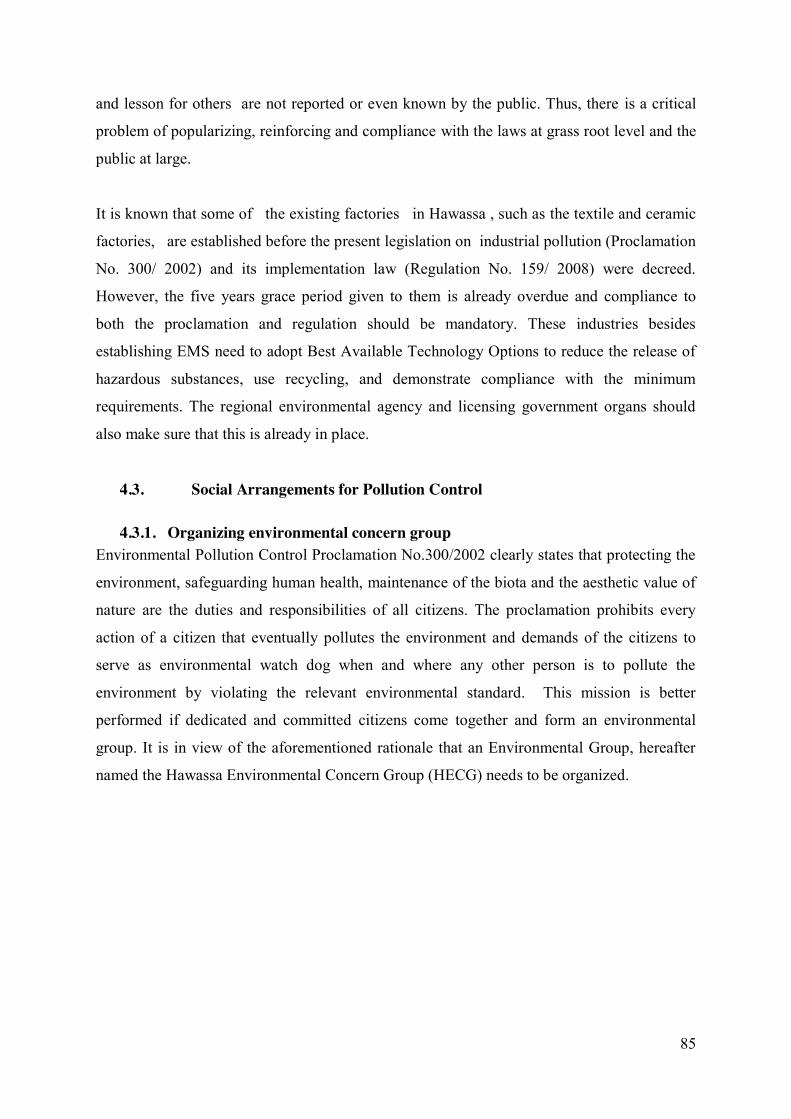
85
and lesson for others are not reported or even known by the public. Thus, there is a critical
problem of popularizing, reinforcing and compliance with the laws at grass root level and the
public at large.
It is known that some of the existing factories in Hawassa , such as the textile and ceramic
factories, are established before the present legislation on industrial pollution (Proclamation
No. 300/ 2002) and its implementation law (Regulation No. 159/ 2008) were decreed.
However, the five years grace period given to them is already overdue and compliance to
both the proclamation and regulation should be mandatory. These industries besides
establishing EMS need to adopt Best Available Technology Options to reduce the release of
hazardous substances, use recycling, and demonstrate compliance with the minimum
requirements. The regional environmental agency and licensing government organs should
also make sure that this is already in place.
4.3. Social Arrangements for Pollution Control
4.3.1. Organizing environmental concern group Environmental Pollution Control Proclamation No.300/2002 clearly states that protecting the
environment, safeguarding human health, maintenance of the biota and the aesthetic value of
nature are the duties and responsibilities of all citizens. The proclamation prohibits every
action of a citizen that eventually pollutes the environment and demands of the citizens to
serve as environmental watch dog when and where any other person is to pollute the
environment by violating the relevant environmental standard. This mission is better
performed if dedicated and committed citizens come together and form an environmental
group. It is in view of the aforementioned rationale that an Environmental Group, hereafter
named the Hawassa Environmental Concern Group (HECG) needs to be organized.

86
Fig. 4.4. Conceptual Framework towards organizing Environmental Concern Group (ECG)
As shown in Fig. 4.4., the establishment of ECG requires consolidating international and
national/local experience. The ECG also needs a guide/manual that shows the structure,
composition, duties and responsibilities as well as activities, communication link and
lobbying strategy to involve decision/policy makers and the public at large. Such integrated,
multidisciplinary and participatory approach that involves different stakeholders and the
community at the grass root level will ensure environmental protection and pollution control
on a sustainable basis.
4.3.2. Experience on organizing ECG
4.3.2.1 International experience: Toronto environmental alliance (TEA)
The Toronto Environmental Alliance (TEA) is a “not- for – profit” organization that
advocates on behalf of all Torontonians for a green, healthy and equitable Toronto city. The
alliance has a history of more than 25 years with a membership base of over 37,000
volunteers. TEA gets unrestricted public donation from members and supporters that allow it
to promote a greener Toronto, spend time talking to city administrators, lobby policy makers
and engage residents in public policy debate and the implementation of pollution prevention
and waste management.

87
4.3.2.2 National /local experience : Forum for Environment (FfE)
The Forum for Environment is a platform for communication among people concerned with
the Ethiopian environment. It was established in June 1997 by a small group of people
committed to the preservation and betterment of the environment. The Forum for
Environment is open to anyone involved in environment-related activities in Ethiopia.
Adherents come from government departments, university departments, research community,
community-based organizations, non-governmental organisations, the media, the donor
community, international agencies and the business sector, without distinction of occupation
or nationality.
The Forum for Environment is committed to:
organize public meetings to publicize and discuss issues of environmental concern;
publish a magazine, written primarily in Amharic, designed to discuss and reflect on
environmental issues in Ethiopia and to be distributed throughout the country;
carry out speaking engagements on environment at different institutions and
organizations;
facilitate access to advisory services on the environment;
create an information center;
act as a liaison bureau for funding projects that focus on improving or protecting the
environment.
4.3.3. Roadmap to concise guide /manual for ECG 4.3.3.1. Frame work and content
In this section of the report the Research Team intends to provide only a skeleton of the
will be guide/manual as the development of the guide itself is beyond the scope of our
assignment. Such an undertaking requires the proper professional mix and adequate
time of its own. In light of this understanding the general framework/structure/ and
content of the concise guide is outlined as follows:
A) Preface – This is the preamble /prologue which shortly states the rational and
significance of handling environmental issues by environmental concerned group
/activists with particular emphasis on its neutrality to politics.
B) Nomenclature : Name , Logo
C) Mission and core values of the ECG
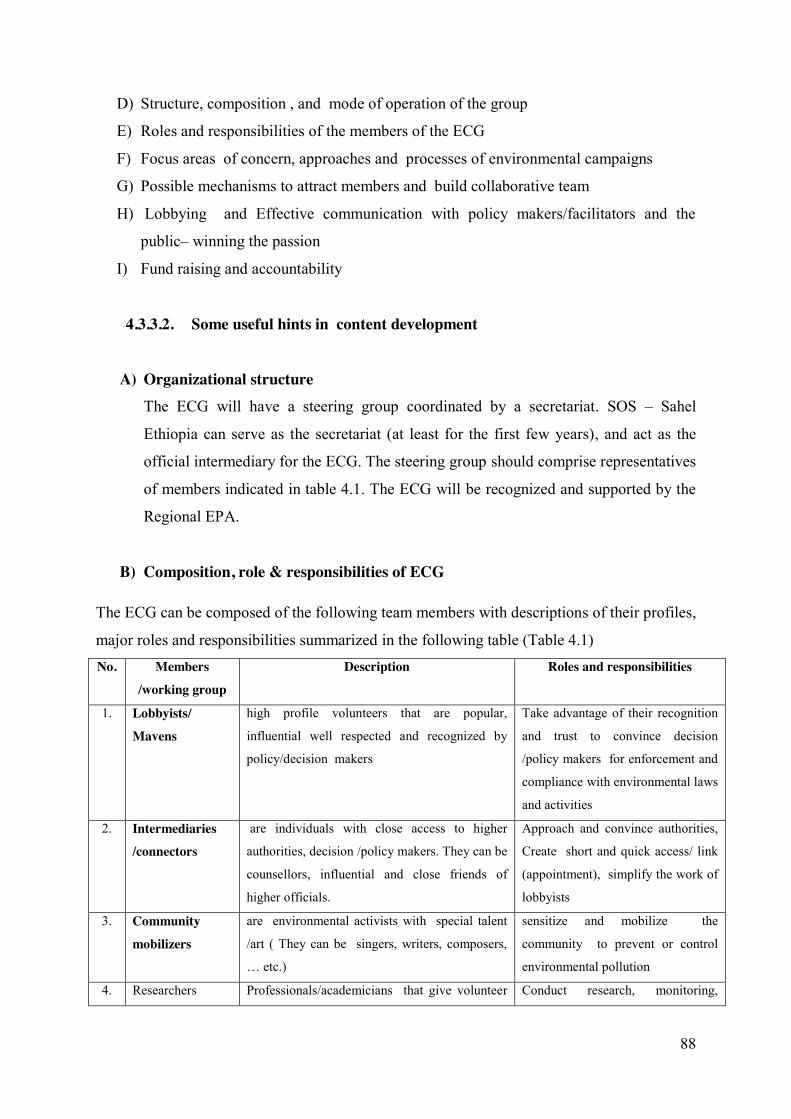
88
D) Structure, composition , and mode of operation of the group
E) Roles and responsibilities of the members of the ECG
F) Focus areas of concern, approaches and processes of environmental campaigns
G) Possible mechanisms to attract members and build collaborative team
H) Lobbying and Effective communication with policy makers/facilitators and the
public– winning the passion
I) Fund raising and accountability
4.3.3.2. Some useful hints in content development
A) Organizational structure The ECG will have a steering group coordinated by a secretariat. SOS – Sahel
Ethiopia can serve as the secretariat (at least for the first few years), and act as the
official intermediary for the ECG. The steering group should comprise representatives
of members indicated in table 4.1. The ECG will be recognized and supported by the
Regional EPA.
B) Composition, role & responsibilities of ECG
The ECG can be composed of the following team members with descriptions of their profiles,
major roles and responsibilities summarized in the following table (Table 4.1) No. Members
/working group
Description Roles and responsibilities
1. Lobbyists/
Mavens
high profile volunteers that are popular,
influential well respected and recognized by
policy/decision makers
Take advantage of their recognition
and trust to convince decision
/policy makers for enforcement and
compliance with environmental laws
and activities
2. Intermediaries /connectors
are individuals with close access to higher
authorities, decision /policy makers. They can be
counsellors, influential and close friends of
higher officials.
Approach and convince authorities,
Create short and quick access/ link
(appointment), simplify the work of
lobbyists
3. Community
mobilizers
are environmental activists with special talent
/art ( They can be singers, writers, composers,
… etc.)
sensitize and mobilize the
community to prevent or control
environmental pollution
4. Researchers Professionals/academicians that give volunteer Conduct research, monitoring,

89
/Educators service in their area of expertise assessment, development of
materials and training
5. GOs & NGOs Regional Environmental Protection Agency,
Environmental units of sectoral institutions
Hawassa City Municipality and Environmental
protection agency, Donor community and NGOs
working to protect Lake Hawassa
Popularize and reinforce
proclamations and regulations on
pollution; mobilize and involve to
the community in the design and
implementation of environmental
project.
C) Mission and activities of the ECG
The Hawassa Environmental Concern Group (HECG) as an alliance of volunteers or friends
of Lake Hawassa will have the following vision.
Mission: Sustain a healthy environment by circumventing the threat of pollution on the ecological integrity of Lake Hawassa and the associated risk to the livelihood of the community. HECG promotes pollution prevention and works with concerned individuals, community
groups, professionals, researchers, and other workers and encourages the participation of the
public at large on environmental issues. The group focuses on the following five areas (but
not limited to them) where it can take research, education and/ or actions or mitigation
measures:
Public awareness/Education and community participation for integrated pollution and waste
management.
Enforcement and compliance to environmental laws, regulations and guidelines
Promotion of cleaner Technology, recycling or recovery /reuse of waste.
Source – based control of generation and discharge of waste
Management of waste receiving environment (Impact management)
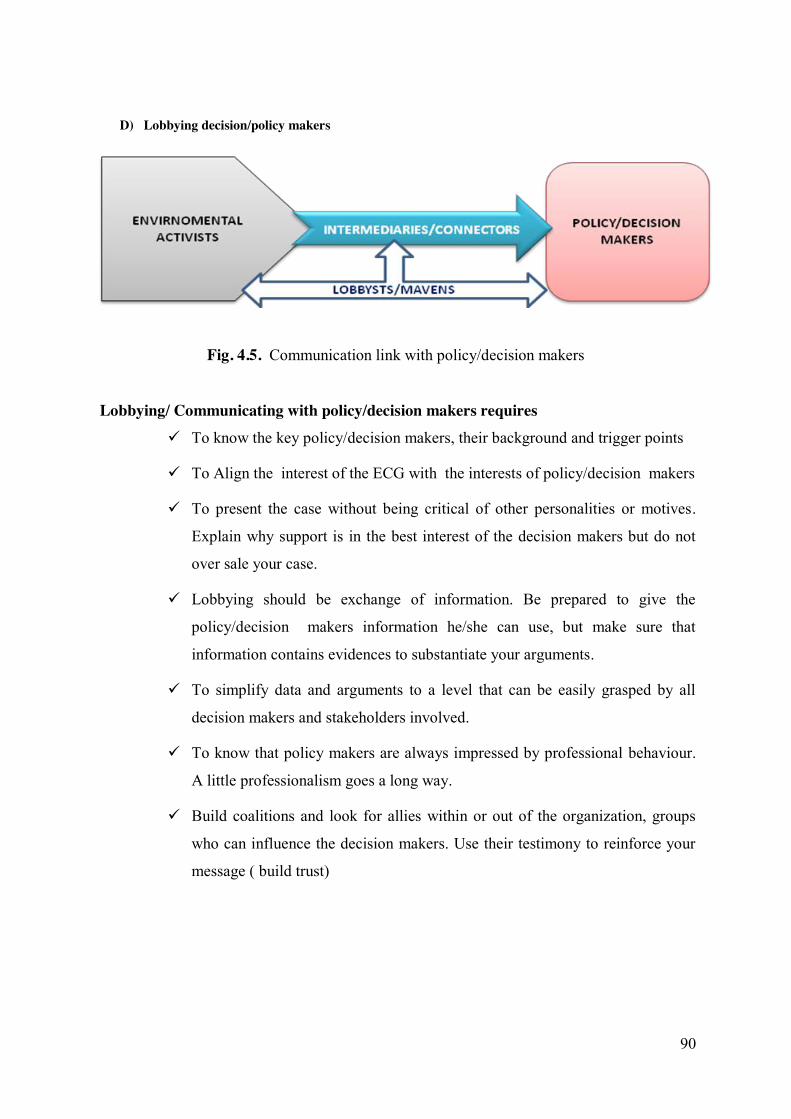
90
D) Lobbying decision/policy makers
Fig. 4.5. Communication link with policy/decision makers
Lobbying/ Communicating with policy/decision makers requires
To know the key policy/decision makers, their background and trigger points
To Align the interest of the ECG with the interests of policy/decision makers
To present the case without being critical of other personalities or motives.
Explain why support is in the best interest of the decision makers but do not
over sale your case.
Lobbying should be exchange of information. Be prepared to give the
policy/decision makers information he/she can use, but make sure that
information contains evidences to substantiate your arguments.
To simplify data and arguments to a level that can be easily grasped by all
decision makers and stakeholders involved.
To know that policy makers are always impressed by professional behaviour.
A little professionalism goes a long way.
Build coalitions and look for allies within or out of the organization, groups
who can influence the decision makers. Use their testimony to reinforce your
message ( build trust)

91
4.3.3.3. Where to start
Given that the culture of neutral activism is not developed in the Ethiopian taste, it is very
important to find a very appropriate point of departure in establishing the ECG - lest it be
hijacked by unintended groups. The RT believes that the following process can be a very
ideal departure point:
I. Plan a workshop where the findings of this study can be presented to all stakeholders,
including high level representatives from government offices, the CEOs of the
factories, NGOs, influential personalities, the academia, the media, etc.
II. Present the existing scenario with respect to pollution in Lake Hawassa
III. Show the clear picture of the danger ahead and the possible intervention mechanisms
IV. Establish the importance of participation of the public in the intervention and the need
for organized move – hence the ECG
V. Show how a starter of such an organized group can be initiated with few members – a
starter ECG
VI. Obtain the support of the government representatives and the CEOs of factories (the
CEOs can be motivated to collaborate in further studies which will make information
on pollutants available to build a data base).
VII. Some members of the ECG can join the team that will prepare the guide/manual,
structure of the ECG, etc.,
4.4. Recommended Intervention Strategies After critical assessment of the institutional arrangement, legal framework and social
arrangements at regional level that are critical for the protection of Lake Hawassa from
pollution, the RT recommends the following intervention strategies:
The threat of pollution on Lake Hawassa is huge, multifaceted and complex. The
pollution control requires a multidisciplinary and integrated approach. In this regard
the Regional Environmental Protection Agency should have strong institutional
capacity, i.e., adequate number of qualified staff with proper professional mix, as
well as equitable financial and material support, if it is to play its leading and
regulatory role as expected in the proclamation and regulation for the prevention and
control of environmental pollution.

92
Effective and efficient implementation of the Proclamations and Regulations for the
prevention and control of pollution cannot be granted by the Regional EPA alone.
The agency should give priority and work hard to create a joint forum or venture with
sectoral environmental units. It has to establish strong functional linkage and
interactive regular communication among the environmental units working for the same
goal.
The relevant sectoral institutions such as ministry of water resources (MOWR),
Ministry of Health (MOH), Ministry of Justice (MOJ), and Urban administrations
(city council, sub-cities and kebeles) are working in an isolated manner at the
moment. They should collaborate and work together to build comparative
advantages for each partner and ensure synergistic benefits to be achieved more than
any of the actors working alone.
The Regional EPA should also initiate the establishment of a consortium of NGOs,
CBOs and Civic societies working on environmental protection and pollution control.
This not only avoids duplication of efforts but solves the human, material resources, and
financial deficit of the agency.
Several proclamations of pollution control are declared and instituted both at federal and
regional level. However, their implementation suffers from lack of public awareness and
little or no enforcement/compliance. There must be strong and continuous
environmental awareness and education program to adequately involve the different
environmental actors and promote the empowerment of the community to participate in
prevention and control of pollution.
Prevention and control of environmental pollution, safeguarding human health,
maintenance of the biota and the aesthetic value of nature are the duties and
responsibilities of all citizens. This mission is better performed if dedicated and
committed citizens come together and form an environmental group. It is in view of
this rationale that an Environmental Group, named the Hawassa Environmental
Concern Group (HECG) needs to be organized

93
References Abayneh Ataro, Taddese Wondimu & Chandravanshi, B.S.,. (2003). Trace metals in selected
fish species from Lake Hawassa and Ziway, Ethiopia. Eth. Journal of Science, 26(2):
103-114 Agbenin, J.O. Danko, M and Welp, M.G. (2009). Soil and vegetable compositional
relationships of eight potentially toxic metals in urban garden fields from northern
Nigeria. Journal of Science of Food and Agriculture 89:49-54. Agency for Toxic Substances and Disease Registry (ATSDR). (2004). Toxicological profile
for Cobalt Atlanta, GS, US. Department of Health and Human Services, public health
services.
Agency for Toxic Substances and Disease Registry (ATSDR). (2008). Public Health
Statement for Cadmium. http://www. atsdr.cdc.gov/PHS/PHS.asp?id
=46&tid=15#bookmark05.
Ahmed,A.K. & Shubaimi-Othman, .(2010). Heavy metal Concentration in Sediments and
Fishes from Lake Chini, Pahang,Malaysia. Asia network for scientific information.
1727-3048: 93-100 Alemayehu Esayas Masresha, Skipperud L, Rosseland B.O., Zinabu Gebremariam, Meland
S., Teien H.C., Salbu, B. (2011). Speciation of selected trace elements in three
Ethiopian Rift Valley Lakes (Koka, Ziway, and Awassa) and their major inflows.
Science of the Total Environment, 409 (19): 3955-70. Alemayehu, T. (2008) . Environmental resources and recent impacts in the Hawassa
collapsed caldera, Main Ethiopian Rift. Quaternary International 189:152-162 Anderson, T.A., Guthrie, E.A., Walton, B.T. (1993 ) Bioremediation Environ. Sci. Technol.
27, 2630-2636.
Andualem Gezahagn. (2013). Bioconcentration of Selected Heavy Metals in the Two African
Big Barb Morphotypes, Labeobarbus intermedius (Rüppell, 1836) (Pisces: Cyprinidae),
in Lake Hawassa, Ethiopia. Msc thesis, School of graduste studies, Hawassa,
University, Hawassa.
Arthur, E.L., Coats, J.R. (1998). Phytoremediation. In Pesticide Remediation in Soil and
Water. Kearney, P.C. and T. Roberts, Eds. Wiley. New York.

94
Ashenafi Madebo and De Smedt, F. (2007). Estimation of Long Term Average Spatial
Water Balance of Lake Awassa watershed using WetSpass, GIS-based hydrological
model. (Project Document).
Asrat Fekadu. (2013). Nutritional status and hevy metals level in commercially imported fish
of lake Hawassa, Ethiopia. Msc thesis, School of graduate studies, University, Hawassa.
Ayenew T, Becht R., Lieshout A., Gebreegziabher Y, Legesse D, and Onyando J. (2007)
Hydrodynamics of topographically closed lakes in the Ethio-Kenyan Rift: the case of
lakes Awassa and Naivasha. Journal of Spatial Hydrology 7 (1). Beadle, L.C. (1981). The Inland Waters of Tropical Africa (2nd Edition), Longman, London,
475 pp.
Behailu Berehanu, Bekele Lemma, Yosef T-Giorgis, et.al. (2010). Environmental impact
assessment and policy on lake Hawassa, SNNPR, Unpublished report, Hawassa,
Ethiopia. Benavides L., (1992). Expert Group meeting on Local Cottage Industries of Hazardous
Wastes from Small-scale and Cottage Industries, an Overview. The World Bank, 1818
H St, N. W. Washington, DC 20433, U.S.A.
Biney C, Amuzu AT, Calamari D, Kaba N, Mbome IL, Naeve H, Ochumba PB, Osibanjo O,
Radegonde V, and Saad M A.,(1994). Review of heavy metals in the African aquatic
environment. Ecotoxicology and environmental safety, 28:134-59. Birenesh Abay (2007). Assessment of downstream pollution Profiles of Hawassa Textile
Factory Effluent along Tikur Wuha River using Physico-chemical and Macro-
invertebrate Indicators. M.Sc. thesis, School of Graduate Studies, Addis Ababa
University.
Bosso, S.T. and Enzweiler, J. (2008). Bioaccessible lead in soils, slag, and mine waste s from
an abandoned mining district in Brazil. Environmental Geochemistry and Health 30:
219-229. doi:10.1007/s10653-007-9110-4 Briggs, G.G., Bromilow, R.H., Evans, A.A. (1982). Relationship between lipophilicity and
root uptake and translocation of non-ionized chemicals by barley. Pestic. Sci. 13 495–
504. Brusseau, M.L., Wang, X.J., Wang, W.-Z. (1997). Simultaneous elution of heavy metals and
organic compounds from soil by cyclodextrin. Environ. Sci. Technol., 31, 087-1092.
Burken, J.G., Schnoor, J.L. (1996 ) Phytoremediation: plant uptake of atrazine and role of
root exudates. J. Environ. Eng. 1222 958-963.

95
Dana S., Monica P., Daniela C., Andrel A.C., Ludovic H. (2005). Environmental risk of
hospital wastewater. CEJOEM;11(4);281-287 Demeke Admassu and Elias Dadebo (1997). Diet composition, weight-length relationship
and conditions factor of Barbus species Ruppell, 1836 ( Pisces: Cyprinidae) in Lake
Awassa, Ethiopia. SINET: Ethiop. J. Sci. 20: 83 – 96. Demeke Kifle, 1985. Variation in phytoplankton primary production in relation to light and
nutrients in Lake Awassa. M.Sc. Thesis, Addis Ababa University, Addis Ababa,
Ethiopia, 116 pp.
Demelash Amare (2008). Assessment of non-point source pollution In lake awassa watershed
using the annualized agricultural non-point source (annagnps) model, Msc thesis in
environmental engineering, Addis Ababa University.
Dudka, S. and Chlopecka, A. (1990). Speciation mobility and photoavailability of trace
metals in sewage sludge amended soil. IUNG. Pulawy, Poland, R (270). Pp42.
Elias Dadebo (2000). Reproductive biology and feeding habits of the Catfish Clarias
gariepinus (Burchell) (Pisces: Clariidae) in Lake Awassa, Ethiopia. SINET: Ethiop. J.
Sci. 23(2):231–246. Elizabeth Kebede (1987). A seasonal study on the species composition and phytoplankton
biomass in Lake Awassa, Ethiopia. M.Sc. Thesis, Addis Ababa University, Addis
Ababa, Ethiopia, 70 pp.
Elizabeth Kebede, & Amha Belay (1994). Species composition and phytoplankton biomass
in a tropical African lake (Lake Awassa, Ethiopia). Hydrobiologia 288: 13–32. Elizabeth Kebede, Zinabu Gebremariam & Ahlgren, I (1994). The Ethiopian Rift-Valley
Lakes: Chemical Characteristics of a salinity-alkalinity series, Hydrobiologia, 288: 1-
12. Ermias Deribe (2012). Bioaccumulation and human health risk assessment of selected
persistent organic pollutants and mercury in fish species from the Ethiopian Rift
Valley Lakes (Koka, Ziway and Awassa). The Norwegian University of Life
Sciences, UMB, Norway.
Ermias Deribe, Alemayehu Esiayas., Gade, P.A, Siri, B., Rosseland, B.O., Borgstrøm, R.,
Dadebo, E., Eklo, Zinabu, GM, O.M., Skipperud, L., Salbu, B. (2014). Bioaccumulation of Mercury in Fish Species from the Ethiopian Rift Valley Lakes.
International Journal of Environmental Protection. 4 (1), 15-22. http://www.ij-ep.org/paperInfo.aspx?PaperID=15228
96
Ermias Deribe, E., Rosseland, B.O., Borgstrøm, R., Salbu, B., Zinabu Gebremariam., Elias
Dadebo., Skipperud, L., and Eklo, O.M. (2013a). Biomagnification of DDT and its
metabolites in four fish species of a tropical lake. Ecotoxicology and Environmental
Safety, 95, 10–18. Ermias Deribe, Rosseland, B.O., Borgstrøm, R., Salbu, B., Gebremariam, Z., Dadebo, E.,
Norli, H.R., Eklo, O.M. (2011). Bioaccumulation of persistent organic pollutants
(POPs) in fish species from Lake Koka, Ethiopia: The influence of lipid content and
trophic position. Science of the Total Environment, 410, 136–145. Ermias Deribe, Rosseland, B.O., Borgstrøm, R., Zinabu, GM., Dadebo, E., Skipperud,L.,
Salbu, B., Eklo, O.M (2013b). Level of orgnochlorine pesticides in fish species from
Lake Hawassa in the Ethiopian rift-valley (2009 – 2010) and implications in dietary
exposure. Paper presented at the conference on Pesticides Behaviour in Soils,
Water and Air, 2-4 September 2013 at York, U.K . Ethiopian Environmental Protection Authority (2003). Provisional Standards for Industrial
Pollution Control in Ethiopia. Prepared under the ecologically sustainable industrial
development (ESID) project – US/ETH/99/068/Ehiopia, EPA/UNIDO, Addis Ababa.
Farkas, A., Salánki, J., and Spacziár, A., (2002). Relation between growth and heavy metal
concentration in organs of bream Abramis brama L. populating Lake Balaton. Archives
of Environmental Contamination and Toxicology, 43: 236-243. Fillaudeau, L. (2006). Water, wastewater and waste management in brewing industries,
Journal of Cleaner Production 14. Forstner, U., and Wittman, G.T.W., (1981). Metal pollution in the aquatic environment.
Berlin, Heidelberg, Germany: Springer-Verlag.72: 486-8.
Frazar, C. (2000) The Bioremediation and Phytoremediation of Pesticide-contaminated
SitesNational Network of Environmental Studies (NNEMS) Fellow Compiled June -
August
Fu, G., Zhou, Q., Liu, J., Liu, W., Wang, T., et.al. (2008). High levels of heavy metals in rice
(Oryza sativa L.) from a typical E-waste recycling area in southern China and its
potential risk to human health, Chemosphere 71:1269-1275.
Girma Tilahun & Ahlgren,G. (2010). Seasonal variations in phytoplankton biomass and
primary production in the Ethiopian Rift Valley lakes Ziway, Awassa and chamo –
The basis for fish production . Limnologica . Vol.40. pp. 330 – 342.
Girma Tilahun (2006). Temporal Dynamics of the Species Composition , Abundance and
Size – fractionated Biomass and Primary Production of Phytoplankton in Lakes

97
Ziway, Awassa and Chamo (Ethiopia). PhD. Dissertation , Department of Biology ,
Addis Ababa University, Ethiopia
Girma Tilahun (2013). Waste management in Hawassa city: Anthropogenic threat on Lake
Hawassa. Proceedings of the Fifth Annual Conference of Ethiopian Fisheries and
Aquatic Sciences Association (EFASA). Pp 128 – 146.
Girma Tilahun and Tigist Ashagre (2011). Heavy metal accumulation by aquatic
macrophytes from lake Hawassa, Ethiopia: Phytoremediation for water quality
improvement. A paper presented on international conference on ecosystem conservation
and sustainable development, Ambo University Feb. 2011.
Grove, A.T., Alayne Street, F. and Goudie, A.S. (1975). Former lake levels and climatic
change in the Rift Valley of southern Ethiopia. Geograph. J., 141: 177 – 202. Hossain, Uddin, Molla. 2010. Impact of Industrial Effluents Discharges on Degradation of
Natural Resources and Threat to Food Security The Agriculturists 8(2): 80-87 (2010). http://libcat.aau.edu.et/cgi-bin/koha/opac-detail.pl?biblionumber=171021
Hunachew Beyene and Getachew Redaie, (2011). Assessment of waste stabilization ponds
for the treatment of Hospital Wastewater: The Case of Hawassa University Referral
Hospital, World Appl. Sci. J. 15 (1): 142-150. Hussain I.; L. Raschid; M. A. Hanjra; F. Marikar; W. van der Hoek. (2002). Wastewater use
in agriculture: Review of impacts and methodological issues in valuing impacts. (With
an extended list of bibliographical references). Working Paper 37. Colombo, Sri Lanka:
International Water Management Institute.
Jordao, C., Pereira, M., & Pereira, J. (2002). Metal contamination of river waters and
sediments from effluents of kaolin processing in Brazil. Water, Air, & Soil Pollution,
140 (1)119-138. Kassaye Balkew (2013). Toxicity evaluation of waste treatment plant of textile effluent using
fish: Nile tilapia, Oreochromis niloticus, International journal of Aquaculture 3 (10):
42-48. Kenatu Angassa . (2011). Evaluation of the Performance of Constructed Wetland System for
the Treatment of Brewery Wastewater, Msc thesis, Addis Ababa university.
Kumar, N.; Soni, H. and Kumar, R. N. (2006). Biomonitoring of selected freshwater
macrophytes to assess Lake trace element contamination: a case study of Nal Sarovar
Bird Sanctuary, Gujarat, India. J. Limnol., 65(1): 9-16. Kurnia, U., Sutono, S., Markus Anda, Sulaeman, Kurniawansyah, A. M. and Tala'ohu S.H.
(2000). Pengkajian baku mutu tanah pada lahan pertaniah. Laporan Akhir Kerjasama

98
Penelitian Bapedal-Puslitbangtanak, Indonesia. Web address:
http://www.agnet.org/library/eb/521/ dated 09 Feb. 2011.
Lijalem Hailu (2011). The Production processes and the environmental measures within
Hawassa Textile Factory: A revisit after 15 years. Msc thesis, School of graduste
studies, University, Hawassa.
Lim, C.H., Lee, J.S., Chon, H.T. and Sager, M. (2008). Heavy metal contamination and risk
assessment in the vicinity of the abandoned Songcheon Au-AG mine in Korea. Journal
of Geochemical Exploration 96: 223-230. Mesfin Mengesha, (2009). Heavy metal pollution in the rift valley lakes of Hawassa and
Koka. M.Sc. Thesis, University of Bremen, Germany.
Michel, K., Roose, M. Ludwig, B., et.al., (2007). Comparison of different approaches for
modeling heavy metal transport in acid soils. Geoderma 140: 207-214. Mulugeta Dadi (2013). The impact of sedimentation and climate variability on the
hydrological status of Lake Hawassa, South Ethiopia. PhD. Thesis, University of Bonn,
Bonn, 151. pp.
Olajumoke, A., Oluwatosin, A., Olumuyiwa, O., Abimbola, F. (2010). Impact assesment of
brewery effluent on water quality in Majawe, Ibadan, southwestern Nigeria.
Researcher 2(5): 21-28. Oluwatosin, G.A., Jaiyeoba, O.M., Banjoko, V.A., Aikore, O.D., and Akinbola, G.E. (2005).
Heavy metals in urban vally bottom soil in south-western Nigeria. Discovery and
innovation 17: 85-93. Palaniappan, M., Gleick, P.H., Allen, L., Cohen, M.J., Christian-Smith, J. and Smith, C.
(2010). Clearing the Waters: A focus on water quality solutions. UNEP, Pacific
Institute, UNON, Publishing Services Section, Nairobi, Kenya.
Pescod, M.B. (1992). Wastewater treatment and use in agriculture-FAO irrigation and
drainage paper 47. Food and Agriculture Organization of the United Nations, Rome
Poggio. L., Vrscaj. B, Rainer. S, Erwin. H., & Ajmone. F., (2009). Metals pollution and
human bioaccessibility of topsoils in Grugliasco (Italy). Environmental pollution,
157: 680-689 Pourang, N., Tanabe, S., Rezvani, S., and Dennis, J.H., (2005). Trace elements accumulation
in edible tissues of five Sturgeon species from the Caspian Sea. Environmental
Monitoring and assessment, 100: 89-108. Pulford, I.D., Watson, C. (2003) Phytoremediation of heavy metal-contaminated land by
trees-a review. Environment International 29.

99
Rai, P. K., & Tripathi, B. (2009). Comparative assessment of Azolla pinnata and Vallisneria
spiralis in Hg removal from GB Pant Sagar of Singrauli Industrial region, India.
Environmental Monitoring and Assessment, 148 (1): 75-84. Reddy, V.R. and Behera, B. (2006). Impact of water pollution on rural communities: An
economic analysis. Ecological Economics, 58: 520–537. Rehman, A., & Sohail Anjum, M. (2010). Cadmium Uptake by Yeast, Candida tropicalis,
Isolated from Industrial Effluents and Its Potential Use in Wastewater Clean-Up
Operations. Water, Air, & Soil Pollution, 205 (1): 149-159. Rezaee. A, Ansari M., Khavanin A., Sabzali A., and Aryan M.M. (2005). Hospital
Wastewater Treatment Using an Integrated Anaerobic Aerobic Fixed Film Bioreactor.
American Journal of Environmental Sciences, 1 (4); 259-263. Riviere J-L. (1998) Évaluation du risque écologique des sols pollués. Association
RE.C.O.R.D., Lavoisier Tec&Doc, Paris, pp 230. Rockne, K.J., Reddy, K.R. (2003) Bioremediation of contaminated sites. University of
Illinois at Chicago Department of Civil and Materials Engineering 842 West Taylor
Street Chicago, Illinois 60607, USA.
Salt, D.E., Smith, R.D., Raskin, I. (1998 ) Phytoremediation. Annu. Rev. Plant Physiol.
Plant Mol. Biol. 49, 643-668. Seyoum Mengistou (1989). Species composition, dynamics and production of the dominant
crustacean zooplankton in Lake Awassa, Ethiopia, PhD. Thesis, University of Waterloo,
Waterloo, 228. Pp.
Seyoum Mengistou et al. 1991. Biomass and Production of the major dominant crustacean
zooplankton in a tropical Rift Valley lake, Awassa, Ethiopia. J. Plankt. Res., 13: 831 –
851. Simachew Dires, (2008). Characterization of wastewater composition from hospital effluent
and evaluation of the treatment performance of the five series of oxidation ponds in
Hawassa Referral Hospital, Msc thesis, University of Addis Abeba.
Solomon Aragie (2013). Human Health Risk Assessment of Exposure to Trace Elements in
the ERVR by using Biomarkers. PhD Thesis, Department of Biology, Addis Ababa
University, Addis Ababa, Ethiopia, 151pp.
Susanne M. S.(1995). Overcoming Agricultural Pollution of Water: The Challenge of
Integrating Agricultural and Environmental policies in the European Union. World
Bank Technical Paper Number 269. Washington, D.C.: The World Bank.

100
Talling, J.F., 1992. Environmental regulation in African shallow lakes and wetlands. Rev. Hdrobiol. Trop. 25: 87–144.
Tenagne Addisu. 2009. The impact of urban storm water runoff and domestic waste effluent
on water quality of lake Tana and local groundwater near the city of Bahir Dar,
Ethiopia, Faculty of the Graduate School of Cornell University.
Tilahun Kibret (1985). The benthos study of Lake Awassa. M.Sc. Thesis, Addis Ababa
University, Addis Ababa, Ethiopia, 216 pp.
Tilahun Kibret and Harrison, A. D. (1989). The bentic and wood-bed fauna of Lake Awassa
(Rift Valley, Ethiopia). Hydrobiologia, 64: 59 – 95. Torke K. (1994). Best Management Practices for Hospitals and Medical Facilities. Palo Alto
Regional Water Quality Control Plant (http://www.p2pays,org ref/5co4,pdf) Tudorancea, C. and Zullini, A. (1989). Associations and distribution of benthic nematodes in
the Ethiopian Rift Valley lakes. Hydrobiologia, 179: 81 – 96. Turkdogan, M. K.; Kilicel, F.; Kara, K.; Tuncer I., and Uygan, I.,(2003). Heavy metal
Contamination of vegetables and fruits in the endemic upper gastrointestinal system.
J.Envi.Tox. Pharm. 13 (3): 175. United Nations Environment Programme Global Environment Monitoring System
(GEMS)/Water Programme (UNEP GEMS/Water). (2007). Water Quality Outlook.
Retrieved March 2, 2014, from http://esa.un.org/iys/docs/san_ lib_docs/water
_quality_outlook.pdf.
USEPA (2001). Integrated Risk Information System (IRIS). National Center for
Environmental Assessment, Office of Research and Development, Washington DC,
USA.
USEPA (2002) .Facultative Lagoons. Wastewater Technology Fact Sheet, EPA 832-F-02-
014.
USEPA, (2006). National Recommended Water Quality Criteria Correction Office of water,
EPA 822-2-99-001 Von Dam, K.L., and Edmond, J.M. (1984). Reverse weathering in the closed-basin lakes of
the Ethiopian Rift. Amer. J. Sci., 284: 835 – 862. WHO (2002). Environment Protection Act. Standards for effluent discharge regulations,
General Notice No.44. Geneva, Switzerland.
WHO, (1993). Guideline for drinking water quality. Recommendation. Vol-1, 2nd ed, Geneva.

101
Willén,E. , Ahlgren, G., Girma Tilahun, Spoof, L., Neffling, M.R., and Meriluoto, J.
(2011). Cyanotoxin production in seven Ethiopian Rift Valley lakes. Inland Waters
1, pp. 81-91. Wood, R.B. and Talling, J.F. (1988). Chemical and algal relationships in a salinity series of
Ethiopian inland waters. Hydrobiologia, 158: 29 - 67. Wright, D.A., Welbourn, P. (2002) Environmental Toxicology (Cambridge Environmental
Chemistry Series).
Wynne, G.; Maharaj, D. and Buckley, C. (2001). Cleaner Production in the Textile Industry
Lessons from the Danish Experience, School of Chemical Engineering, University of
Natal, Durban, South Africa, 3 pp
Yadessa Chibsa. (2011) . Assessment of Health and Environmental impact of effluent from
Hawassa Textile Factory on the immediate vicinity, M.Sc. thesis, School of Graduate
Studies, Hawassa University.
Yared Beyene, Yoshinori I.., Shouta M.M. Nakayama A., Aksorn S., Kensuke Watanabe, and
Mayumi I.. (2013). Organochlorine pesticides and heavy metals in fish from Lake
Awassa, Ethiopia: Insights from stable isotope analysis. Chemosphere 91:857–863. Yared Shumate (2008). Biological Nutrient Removal from Brewery Wastewater using a
Laboratory Scale Anaerobic/Anoxic/Aerobic Bioprocess. Msc thesis in Environmental
science. Addis Ababa University.
Zenebe Yirgu,(2011). Accumulation of Certain Heavy Metals in Nile Tilapia (oreochromis
niloticus) Fish Species Relative to Heavy Metal Concentrations in the Water of Lake
Hawassa. Msc thesis, University of Addis Abeba.
Zerihun Desta, (2003). Challenges and opportunities of Ethiopian wetlands: the case of Lake
Hawassa and its Feeders. Pages 67-75 In Abebe Y. and Geheb,K. ed. IUCN-EARO,
Addis Ababa, Ethiopia.
Zerihun Desta, (2007). Food web structure and mercury transfer pattern in the fish
community of Lake Hawassa, Ethiopia. Ph.D. Thesis, Department of Ecology and
Natural Resources Management, Norwegian University of Life Sciences, As, Norway.
Zerihun Desta, Borgstrom, R., Rosseland, B.O., Zinabu Gebremariam (2006). Major
difference in mercury concentrations of the African big barb, Barbus intermedius (R)
due to shifts in trophic position. Ecology of Freshwater Fish. 15: 532 – 543. Zerihun Desta, Borgstrøm, R., Zinabu Gebremariam, and Rosseland, B.O. (2008). Habitat use
and trophic position determine mercury concentration in the straight fin barb Barbus

102
paludinosus, a small fish species in Lake Awassa, Ethiopia. Journal of Fish Biology,
73, 477 – 498. Zheng, N., Wang, Q.C., and Zheng, D.M. 2007. Health risk of Hg, Pb, Cd, Zn, and Cu to the
inhibitants around Huludao Zinc Plant in China via consumption of vegetables. Science
of the toatal Environment 383: 81-89. Zhou, Q., Zhang, J., Fu, J., Shi, J., Jiang, G. (2008). Biomonitoring: An appealing tool for
assessment of metal pollution in the aquatic ecosystem. Analytica Chimica Acta
606:135–150. Zinabu Gebremariam (1988). Dynamics of Heterotrophic Bacterioplankton in an Ethiopian
Rift-Valley Lake (Awassa). PhD Thesis, University of Waterloo, Waterloo, Ontario,
Canada, 180 pp.
Zinabu Gebremariam (2002a). The Ethiopian Rift Valley Lakes: Major Threats and Strategies
for Conservation: In: Tudorancea, C. and Taylor, W. D. (eds.) - Ethiopian rift valley
lakes. Backhuys publishers, Leiden, 289 pp.
Zinabu Gebremariam (2002b). The Effects of Wet and Dry Seasons on Concentrations of
Solutes and Phytoplankton Biomass in Seven Ethiopian Rift-Valley Lakes.
Limnologica, 32: 169 – 179. Zinabu Gebremariam (2003a). Human Interactions and Water Quality in the Horn of Africa.
In:. T.L. Crisman, L.J. Chapman, C.A. Chapman, and L.S. Kaufman (editors). Aquatic
Conservation and Management in Africa. University Press of Florida, Gainesville.
Zinabu Gebremariam (2003b). The water chemistry of the Ethiopian rift - valley lakes and
their influent rivers: Assessment of suitability for irrigation. Ethiopian Journal of
Natural Resources, 5(1): 125 - 142. Zinabu Gebremariam and Elias Dadebo. (1989). Water resources and fisheries management
in the Ethiopian rift-valley lakes. SINET: Ethiop. J. Sci. 12(2): 95-109. Zinabu Gebremariam and Pearce N. J. G., (2003). Concentrations of heavy metals and
related trace elements in some Ethiopian rift valley lakes and their inflows.
Hydrobiologia, 492:171-178. Zinabu Gebremariam and Taylor, W.D. (1989). Seasonality and spatial variation in
abundance biomass and activity of heterotrophic bacterioplankton in relation to some
biotic and abiotic variables in an Ethiopian rift-valley lake (Awassa). Freshwater
Biology, 22: 355-368.

103
Zinabu Gebremariam and Taylor, W.D. (1990). Heterotrophic bacterial production and
mortality rates in an Ethiopian rift-valley lake (Awassa). Freshwater Biology, 22:
369-381. Zinabu Gebremariam and Zerihun Desta (2002). The Chemical Composition of the Effluent
from Awassa Textile Factory and its effects on Aquatic Biota. SINET: An Ethiop. J
SCI., 17(2): 107-123. Zinabu Gebremariam, Elizabeth Kebede, and Zerihun Desta (2002). Long-term changes in
the Chemical and Biological Features of Seven Ethiopian Rift Valley Lakes.
Hydrobiologia, 477: 81 – 91.