Embed Size (px)
Citation preview
A study to investigate whether speed and road conditions have an effect on the physiological stability of sick and preterm
babies undergoing inter-hospital transfer by ambulance
Viviane Hall
DProf
University of Salford
School of Nursing, Midwifery, Social Work & Social Sciences
2017

i
CONTENTS
Page
Chapter 1: Introduction 1
Chapter 2: Literature Review 19
Chapter 3: Networks and Populations 44
Chapter 4: Study Design 52
Chapter 5: Findings 71
Chapter 6: Discussion 143
Chapter 7: Conclusions 153
References 158
Appendix 1: Search Results and Combinations of Databases 173
Appendix 2: Transfer Documents 175
Appendix 3: Data Logger 178
Appendix 4: Patient Information Sheet 180
Appendix 5: Consent Form 182
Appendix 6: REC Approval Letters 183
Appendix 7: Normal Neonatal Values 185
ii
LIST OF TABLES
Page
Table 1: UK summary data of neonatal transfers 2012-2015 6
Table 2: PICO framework 19
Table 3: Identified synonyms 20
Table 4: List of studies 24
Table 5: Data characteristics 73
Table 6: Mean values and standard deviation (in parentheses) for measured variables for the motorway/dual carriage way sections of the journey
80
Table 7: Mean values and standard deviation (in parentheses) for measured variables for the non-motorway sections of the journey
81
iii
LIST OF FIGURES
Page
Figure 1 Custom-built neonatal intensive care transport trolley 4
Figure 2 Categorisation of neonatal units 15
Figure 3 Outcome of the search in PRISMA format 22
Figure 4 North West Operational Delivery Network 50
Figure 5 Diagrammatic view of the axis in relation to the baby’s movement 55
Figure 6 Phillips Intellivue MP30 Monitor 61
Figure 7 Position of transport incubator in ambulance and location of DL1 data logging device.
64
Figure 8 GPS antenna into the ambulance cockpit 64
Figure 9 Example of movement data 75
Figure 10 Mean values of all the cases for heart rate and saturations 76
Figure 11 Systolic and mean blood pressure 78
Figure 12 Overall mean and SD for speed and across the three g force axis 79
Figure 13 Analysis of movement data in longitudinal, lateral and vertical forces according to road types
82
Figure 14 Journey route taken by the ambulance. 84
Figure 15 Physiological recordings of heart rate and saturations 86
Figure 16 Box and whisker box plot demonstrating heart rate variability against road types
88
Figure 17 Movement data including speed, longitudinal, lateral and vector g forces
89
Figure 18 Route from Barrow in Furness to Burnley 91
Figure 19 Physiological parameters recordings of heart rate, SpO2 and blood pressure
93
Figure 20 Blood pressure against different road types 94
Figure 21 Overview of the vital signs 94
Figure 22 Movement data including speed, longitudinal, lateral and vector g forces
96
iv
Figure 23 Journey from St Marys Hospital Manchester to Alder Hey Children’s Hospital in Liverpool
97
Figure 24 Physiological variables of heart rate and SpO2 99
Figure 25 Movement data including speed, longitudinal, lateral and vector g forces
101
Figure 26 Box and whisker plots showing the variability of heart rate and SpO2 against the road types
102
Figure 27 Journey route between Wigan and Bolton 103
Figure 28 Physiological recordings of heart rate, SpO2 and blood pressure 105
Figure 29 Movement data including speed, longitudinal, lateral and vector g forces
106
Figure 30 The route from North Manchester General Hospital to St Mary’s Hospital Manchester
107
Figure 31 Physiological parameters of heart rate, blood pressure and SpO2 108
Figure 32 Overview of vital signs 109
Figure 33 Movement data including speed, longitudinal, lateral and vector g forces
111
Figure 34 Physiological data of heart rate, SpO2 and blood pressure 114
Figure 35 Box plots showing physiological variability of heart rate, blood pressure and SpO2 against road types
115
Figure 36 Journey from Blackpool to Preston 117
Figure 37 Movement data including speed, longitudinal, lateral and vector g forces
118
Figure 38 Physiological recordings of heart rate and SpO2 120
Figure 39 Blood pressure 121
Figure 40 Box and whisker plots showing variability between heart rate, blood pressure and SpO2 against road types
122
Figure 41 Journey route from Blackpool to Preston 123
Figure 42 Physiological data of heart rate, blood pressure and SpO2 125
Figure 43 Movement data including speed, longitudinal, lateral and vector g forces
126
Figure 44 Physiological data of heart rate, blood pressure and SpO2 against road types
127
v
Figure 45 Journey route from Wythenshawe to NICU at St Marys Manchester
128
Figure 46 Heart rate 129
Figure 47 Blood pressure 130
Figure 48 Oxygen saturation 130
Figure 49 Journey from Wigan to Manchester 132
Figure 50 Physiological parameters of heart rate and SpO2 133
Figure 51 Non-invasive blood pressure readings 134
Figure 52 Heart rate and SpO2 variability plotted against road types 136
Figure 53 Route from Wigan to Bolton 137
Figure 54 Movement data including speed, longitudinal, lateral and vector g forces
138
Figure 55 Neonatal intensive care transfer trolley 149
Figure 56 Dimensions of the neonatal trolley with the lock and load device 149
Figure 57 Location of the trolley in the ambulance 150

vi
ABBREVIATIONS
ANNP Advanced Neonatal Nurse Practitioner
ANOVA Analysis of variance
BAPM British Association of Perinatal Medicine
BMJ British Medical Journal
BP Blood Pressure
bpm Beats per minute
CASP Critical Appraisal Skills Programme
CESDI Confidential Enquiry into Stillbirths and Deaths in Infancy
CLD Chronic Lung Disease
CO2 Carbon Dioxide
DH Department of Health
DL1 Data Logging Device
ECG Electrocardiogram
ECHO Echocardiogram
ECMO Extra Corporeal Membrane Oxygenation
EDD Estimated Date of Delivery
g g Force
GMNeTS Greater Manchester Neonatal Transport Service
GPS Global Positioning System
HIE Hypoxic Ischemic Encephalopathy
HR Heart Rate
HRV Heart Rate Variability
HTB Head to Back
HTF Head to Front
ICU Intensive Care Unit
IET Institute of Engineering and Technology

vii
INO Inhaled Nitric Oxide
ISO International Standards Organisation
IUGR Intrauterine Growth Restriction
IVH Intraventricular Haemorrhage
LAN Local Area Network
LNU Local Neonatal Units
MAP Mean Arterial Pressure
mmHg Millimetres of Mercury
MPH Miles Per Hour
MRI Magnetic Resonance Imaging
NAO National Audit Office
NHS National Health Service
NICE National Institute for Health & Clinical Excellence
NICU Neonatal Intensive Care Unit
NIRS Near-Infrared Range Spectroscopy
NMC Nursing and Midwifery Council
NNNAP National Neonatal Audit Programme
NNU Neonatal Unit
NPSA National Patient Safety Agency
NSF National Service Framework
NTG Neonatal Transport Group
NTNTS North Trent Neonatal Service
NWAS North West Ambulance service
NWNODU North West Neonatal Operation Delivery Network
ODN Operational Delivery Network
PC Personal Computer
PDA Patent Ductus Arteriosis
PIPP Premature Infant Pain Profile

viii
PPHN Persistent Pulmonary Hypertension of the Newborn
RCOG Royal College of Obstetricians and Gynaecologists
RCT Randomised Controlled Trial
RMS Root Mean Squared
rpm Respirations per minute
rSO₂ Regional Saturation of Oxygen
SCU Special Care Unit
SD Standard Deviation
SIMV Synchronised Intermittent Mandatory Ventilation
SpO₂ Saturation of Peripheral Capillary Oxygen
TINA Transport of Neonates in Ambulances (Study)
TOBY Total Body Hypothermia
TRIPS Transport Risk Index of Physiologic Stability
VLBW Very Low Birth Weight
ix
ABSTRACT A study to investigate whether speed and road conditions have an effect on the
physiological stability of sick and preterm babies undergoing inter-hospital
transfer by ambulance
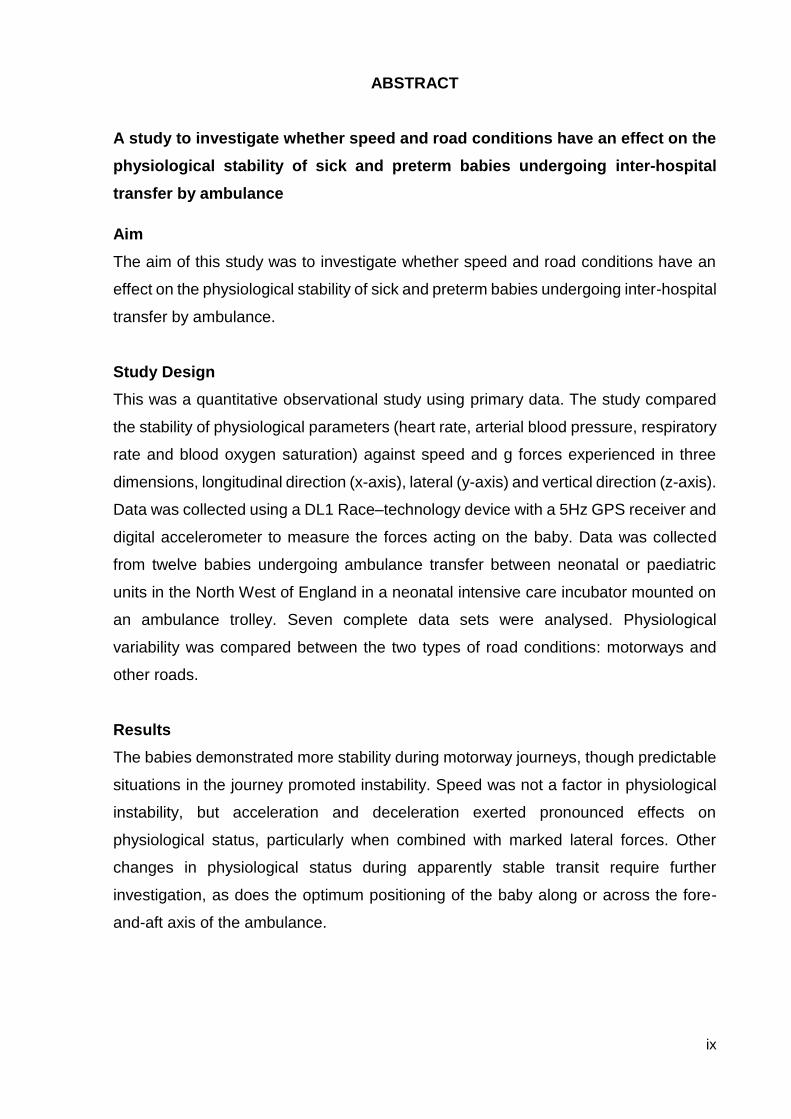
Aim
The aim of this study was to investigate whether speed and road conditions have an
effect on the physiological stability of sick and preterm babies undergoing inter-hospital
transfer by ambulance.
Study Design
This was a quantitative observational study using primary data. The study compared
the stability of physiological parameters (heart rate, arterial blood pressure, respiratory
rate and blood oxygen saturation) against speed and g forces experienced in three
dimensions, longitudinal direction (x-axis), lateral (y-axis) and vertical direction (z-axis).
Data was collected using a DL1 Race–technology device with a 5Hz GPS receiver and
digital accelerometer to measure the forces acting on the baby. Data was collected
from twelve babies undergoing ambulance transfer between neonatal or paediatric
units in the North West of England in a neonatal intensive care incubator mounted on
an ambulance trolley. Seven complete data sets were analysed. Physiological
variability was compared between the two types of road conditions: motorways and
other roads.
Results
The babies demonstrated more stability during motorway journeys, though predictable
situations in the journey promoted instability. Speed was not a factor in physiological
instability, but acceleration and deceleration exerted pronounced effects on
physiological status, particularly when combined with marked lateral forces. Other
changes in physiological status during apparently stable transit require further
investigation, as does the optimum positioning of the baby along or across the fore-
and-aft axis of the ambulance.

ii
This was the first study to investigate real-time physiological effects on live neonates
during required transfer journeys including measurements in three axes throughout the
episode while exerting no research effect on the babies.
1
CHAPTER 1: INTRODUCTION This chapter lays out the problem that is addressed by this thesis, explains in depth
how and why the transport service has developed and changed, examines the
government policies that have driven these changes, and details how these changes
impact on the day to day care of the babies who are exposed to an episode of neonatal
transfer. It begins with a statement of the personal engagement of the researcher with
the topic.
THE STIMULUS FOR THE STUDY
As a senior neonatal nurse with over 25 year’s clinical experience, my area special
interest is in neonatal transport. I am currently the Lead Nurse for the transport service
in Greater Manchester which is one of three transport teams that provide a transport
service across the North West of England. I have been involved only with ambulance
transfers, although other teams use air transport. The provision of neonatal care has
changed during my career, and cutting edge treatments and therapies are now
available only at specialist centres. The change in neonatal networks aims for mothers
whose babies require these specialist services to deliver their baby in centres that
provide such care.
However, having witnessed and experienced some of the changes that have occurred
in neonatal care and treatments over the last two decades it was clear to me that this
aim is not always achieved, and babies born in local hospitals still require transfer to
obtain specialist care. I have a commitment to ensure that the neonates who access
the service are provided with evidence-based care and support that optimises their
survival and potential development. The services are essential to the smooth running
of the neonatal network and are pivotal to ensure patient flow through the neonatal
units. The transfer process should be part of the intensive care journey that protects
and promotes optimal long-term development and outcomes not one that contributes
to morbidity or mortality.
My neonatal career spans over 28 years, with the majority of my experience gained
from working in a busy tertiary centre. I worked on the neonatal unit undertaking
transfers in an ad hoc fashion until government directives forced a new approach of
specialist teams being responsible for the organisation and undertaking of transfers. I
2
was instrumental in setting up and leading the dedicated team that now operates
across the North West region.
Neonatology is an evolving specialism and whilst most practice is evidence-based,
experience also directs practice before the evidence becomes available. As an
experienced nurse and ANNP I sometimes found myself being sure that something
was not right with a baby – on the unit or increasingly in the transfer ambulance -
without being able to identify what the problem was. There was suspicion, an intuition
or a gut feeling that a particular neonate was struggling, deteriorating or becoming
unstable but without any significant changes in the measured variable, and I was
unable to establish why. During transport some neonates proved to be stable (though
a stark awakening about this later in the thesis) while others were not but it was difficult
to establish what was the destabilising factor for each individual neonate.
Shortly after commencing a long transfer of a particularly small but well neonate it was
clear that the neonate was becoming increasingly unstable for no apparent reason. I
suspected from my previous experience that the neonate was experiencing transfer of
internal body fluids connected with the movement of the ambulance. The neonate was
lying in the traditional head to front of ambulance, so, pursuing an informal hypothesis
that this impact would be reduced if the shift of body fluids were to be across the body
rather than longitudinally, I turned the baby to lie horizontally/sideways across the
incubator. The neonate very quickly stabilised and the journey was completed without
further incident. This was a key moment in my career when a seed was planted that
led to this investigation.
In the twenty four months April 2013 to March 2015, 700 sick or premature babies in
Greater Manchester needed a transfer by ambulance whilst receiving intensive care
(GMNeTS 2015). Many of these infants were unstable or critically ill and needed careful
stabilisation prior to transfer to prevent deterioration during the journey. At present,
however, there is little published data regarding the physiological consequences of
vibration, motion and gravity (g) forces during transport in the neonate. In order to
further explore the effects of transfer on the neonate I undertook this study as part of
a DProf to provide more insight into how the neonate is affected by these forces and
how it may be possible to reduce these effects.
3
THE PROBLEM
Some 86,287 babies were admitted to neonatal units in England and Wales during the
calendar year of 1 January to 31 December 2014 for some form of care which equates
to approximately one in eight babies born. This number continues to rise year on year
with an increase of 13,878 between 2011 and 2014 (National Neonatal Audit
Programme (NNNAP) 2015). There are many reasons why babies are admitted to
neonatal units including prematurity, infection, breathing problems, cardiac and genetic
conditions. Between 1995 and 2006 survival shortly after birth of very premature
babies has increased from 40% in 1995 to 53% in 2006, but the proportion of survivors
leaving hospital with major health problems is unchanged (Costello et al 2012). Follow
up studies at 11 years of age show some of these health problems and disabilities
continue to have a significant effect on the developing child with serious learning
disabilities and the requirement for special needs support (Johnson et al 2009). The
condition of the sick or preterm baby at admission dictates what care the baby will
receive. Currently, neonatal care within the National Health Service (NHS) is divided
into three different categories.
Special Care
Babies who require special care that cannot be given on the postnatal ward by the
mother may need to have their breathing and heart rate monitored, have extra help
feeding, or require antibiotic treatment for infection.
High Dependency Care
This is the next level of care for babies who may require continuous monitoring and
observation, babies who are particularly small (weighing less than 1,000g) and those
who need more invasive help with their breathing.
Intensive Care
This level of care is similar to adult intensive care and is required for the sickest and
seriously ill neonates. It involves highly specialised treatments usually including some
form of respiratory support or ventilation to keep the babies alive. It is not unusual for
a baby to receive all three levels of care during the stay on a neonatal unit, moving
between the levels in no specific order before being ready for discharge home.
4
Unfortunately, many premature, small or sick babies are born in local maternity units
that are unable to offer the specialist care that is required. When this occurs the babies
require urgent transfer to a specialist neonatal intensive care unit. Inter-hospital
neonatal transport is the practice of transporting patients from outlying neonatal units
to remote specialist units. The infants may be full term or premature of normal or lower
birth weight, at varying stages of maturity states, and with complex physiological
complications. Historically, the main clinical indications for inter-hospital transport were
complications arising from prematurity (Medical Devices Agency 1995), however due
to advances in both maternal and neonatal care 60% of all admissions to all neonatal
units are now for term babies (Health and Social Care Information Centre (HSCIC)
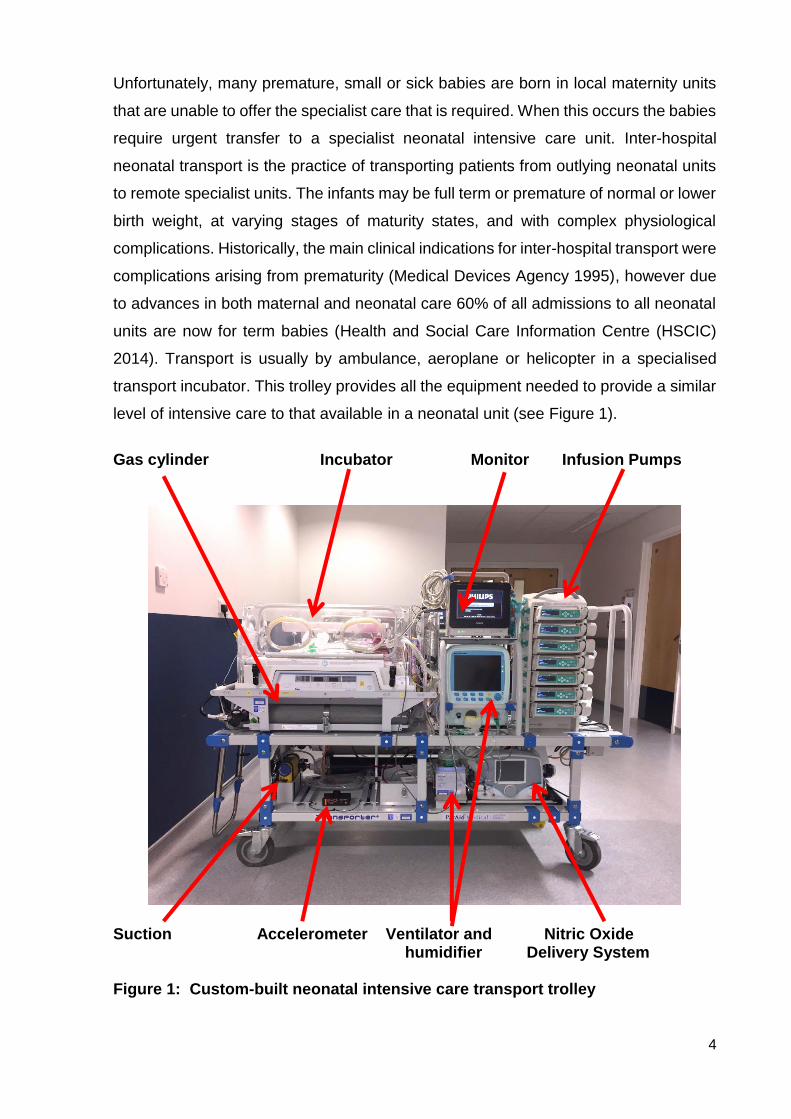
2014). Transport is usually by ambulance, aeroplane or helicopter in a specialised
transport incubator. This trolley provides all the equipment needed to provide a similar
level of intensive care to that available in a neonatal unit (see Figure 1).
Gas cylinder Incubator Monitor Infusion Pumps
Suction Accelerometer Ventilator and Nitric Oxide humidifier Delivery System Figure 1: Custom-built neonatal intensive care transport trolley

5
The transport team makes a two-way return journey, usually travelling first to the site
from which the baby is to be retrieved, then to the destination hospital, and finally back
to base. Occasionally the start of the journey coincides with the team base, but the
two-way trip is still involved. The baby is accompanied in the ambulance by at least
two staff from the neonatal team. This would normally be a senior neonatal doctor and
a nurse from the unit, or, increasingly commonly, an ANNP and another nurse. While
both members of the ambulance crew sit in the cab. The nurses are in the saloon part
of the vehicle monitoring and providing care for the baby. In effect, they implement a
neonatal intensive care facility during the transfer, shouldering the entire burden of
decision-making and intervention between hospitals.
During this study, the researcher undertook data collection while also undertaking the
role of senior NICU staff member with responsibility for leading and undertaking
treatment and care interventions. This was a demanding scenario, particularly while
attending to the baby, associated medical equipment (including arterial line and
observations), observing physiological measurement equipment, checking the working
of the data-logger, noting road conditions, communicating with the ambulance staff
regarding vehicle speed, and maintaining the schedule of all of these simultaneously.
Although neonatal transfer is a crucial part of neonatal care it is not without risk to the
baby, and there have been documented road traffic accidents involving babies in
ambulances (Madar & Milligan 1994). Other risk factors involve the physical effects
that transfer may have on the baby. The International Standards Organisation (1978)
has shown that vibrations have adverse effects in adults on cardiorespiratory function,
the peripheral and central nervous systems, electroencephalographic activity, body
temperature, metabolic and endocrine function, and the gastrointestinal system. Sick
or preterm infants are not as well-equipped as adults to adapt to the instability of the
extrauterine environment. In neonatal units they show increased sensitivity to
environmental stresses such as noise and vibration which can affect the heart rate and
blood pressure (D’Apolito 1991, Morris et al 2000, Wachman & Lahav 2011).
Fluctuations in blood pressure are known to be one of the mechanisms of
intraventricular haemorrhage in premature infants, which, in turn, may worsen the
baby's chance of survival or contribute to long term neurodevelopmental problems
(MacNab et al 1995, Towers et al 2000).
6
Approximately 300 sick or premature babies per year in Greater Manchester need a
transfer by ambulance whilst receiving intensive care (Greater Manchester Neonatal
Transfer Service (GMNeTS) 2014). Many of these infants are unstable or critically ill
and need careful stabilisation prior to transfer to prevent deterioration during the
journey. At present, however, there is little published data regarding the physiological
consequences for the neonate of vibration, motion and acceleration (g) forces during
transport.
As maternity and neonatal services continue to undergo a process of reform and
reorganisation, the numbers of seriously ill neonates requiring transfer is predicted to
grow (National Quality Board 2010). This prediction is evidenced in the data that is
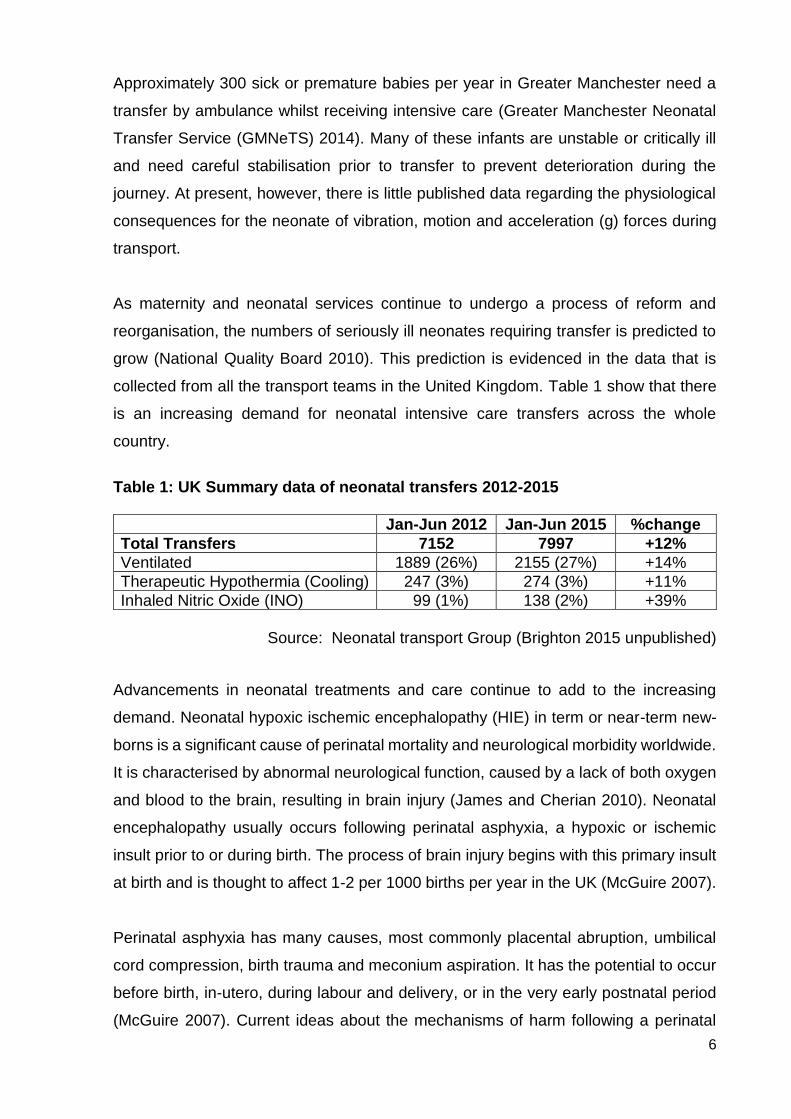
collected from all the transport teams in the United Kingdom. Table 1 show that there
is an increasing demand for neonatal intensive care transfers across the whole
country.
Table 1: UK Summary data of neonatal transfers 2012-2015
Jan-Jun 2012 Jan-Jun 2015 %change
Total Transfers 7152 7997 +12%
Ventilated 1889 (26%) 2155 (27%) +14%
Therapeutic Hypothermia (Cooling) 247 (3%) 274 (3%) +11%
Inhaled Nitric Oxide (INO) 99 (1%) 138 (2%) +39%
Source: Neonatal transport Group (Brighton 2015 unpublished)
Advancements in neonatal treatments and care continue to add to the increasing
demand. Neonatal hypoxic ischemic encephalopathy (HIE) in term or near-term new-
borns is a significant cause of perinatal mortality and neurological morbidity worldwide.
It is characterised by abnormal neurological function, caused by a lack of both oxygen
and blood to the brain, resulting in brain injury (James and Cherian 2010). Neonatal
encephalopathy usually occurs following perinatal asphyxia, a hypoxic or ischemic
insult prior to or during birth. The process of brain injury begins with this primary insult
at birth and is thought to affect 1-2 per 1000 births per year in the UK (McGuire 2007).
Perinatal asphyxia has many causes, most commonly placental abruption, umbilical
cord compression, birth trauma and meconium aspiration. It has the potential to occur
before birth, in-utero, during labour and delivery, or in the very early postnatal period
(McGuire 2007). Current ideas about the mechanisms of harm following a perinatal
7
asphyxia event suggest that a two-stage process takes place, leading to cellular death
and neurological harm. The first stage is brain cell death at the time of the insult as
oxygen and glucose is depleted. The second stage occurs some 6-15 hours later as
the brain reperfuses causing a chain of chemical reactions resulting in further brain cell
damage and death. It is known that hyperthermia intensifies the effect of ischemia on
the brain, and one study showed that in some cases it increases the risk of death or
disability for each centigrade increase in the core temperature (Laptook et al 2008).
This is impossible to prevent in-utero due to the heat from the mother and the placenta,
however a reduction in brain temperature for around six hours after the insult using
therapeutic hypothermia has been demonstrated to have neuro-protective effects,
limiting the damage caused by the secondary reperfusion injury (Azzopardi 2009).
Traditionally, infants suffering from HIE were offered supportive intensive care and
anticonvulsants to manage any seizure activity. However, following the publication of
animal studies which showed that immediate cooling following a hypoxic ischemic
insult may have neuro-protective effects (Thoresen et al 1995, Edwards et al 1995),
trials into the safety of providing therapeutic hypothermia in neonates commenced.
The TOBY (Total Body Hypothermia Trial) study was a randomised controlled trial
designed to determine if whole-body cooling was safe, improved survival and reduced
the risk of neurological impairment. The results showed that infants who were cooled
had an increased rate of survival with fewer neurological problems and improved
neurodevelopmental outcomes (Azzopardi, 2009). The trial commenced in 2002 and
any infant recruited that was born outside a trial centre required a transfer for treatment
and participation in the trial.
Since the publication of the TOBY study and other trial results the National Institute for
Health and Clinical Excellence (NICE) issued guidance in the United Kingdom stating
that all infants receiving cooling treatment require care in a tertiary centre due to their
often complex medical needs (NICE 2010a). This has increased the numbers of
transfers by 25-30 per year for the Greater Manchester area alone.
POLICY PERSPECTIVE: GOVERNMENT INFLUENCES
In the United Kingdom, neonatal services have developed largely in response to local
needs. Historically, most district general hospitals offered some level of specialist
neonatal care, but there was considerable variation in the quality of neonatal intensive
care being undertaken. In 1999, the first document introducing the concept of major

8
reorganisation of midwifery, neonatal and paediatric services was published
(Department of Health (DH) 1999).This document was entitled “Making a Difference”
and outlined the Government’s strategic programme of measures to improve the
National Health Service across all areas by recognising the value and contribution of
nurses, midwives and health visitors. The plan was to maximise the contribution that
these workers could make to patient care by strengthening education, training and
leadership. Improving safety, increasing recruitment and fundamentally changing the
career opportunities for experienced senior staff was the springboard for major change
in staff members’ roles and positions.
By 2001 the Government’s strategic plan was released in more detail and included
changes that were specific to neonatal care provision. The DH commissioned a review
of neonatal services in England, and the subsequent report published in 2003 by the
Department of Health Expert Working Group (DH 2003a) described the current
neonatal intensive care services as being fragmented, non-regionalised and of
insufficient capacity. A key recommendation of the review was to reorganise neonatal
care into managed clinical networks (MCN) in order to make the best use of available
resources, with agreed national standards of care and increased funding. One of the
drivers for this reorganisation was the publication of data in the Neonatal Intensive
Care Review: Strategy for Improvement (DH 2003b) indicating that gestation-specific
survival was better in many other European counties than in the United Kingdom
(Zeitlin et al 2010). A managed clinical network was defined by Barker and Lorimer
(2000) as
“A linked group of health professionals and organisations from primary, secondary and tertiary care working in a coordinated way that is not constrained by boundaries to ensure equitable provision of high quality, clinically effective services” (p1152)
The aims of the managed clinical networks for neonatal intensive care were to improve
and standardise the service provided for babies and their families locally. At the time,
large numbers of babies were being cared for in neonatal units out of their own region
due to insufficient local capacity. This was demonstrated by the large numbers of
unplanned transfers of mothers and babies being prevented from accessing care at
their local maternity/neonatal unit. (Parmanum et al 2000). In response to the
Government’s recommendations and to try to gain an insight into transport activity in
the North West area a North Western Neonatal Transport Survey (Dady et al 2000
9
unpublished) was undertaken. I was part of the team that undertook this survey which
was pivotal in shaping how a future service would be organised. It encompassed the
Government’s directive of utilising and empowering the existing workforce including at
that time a vision of a service that would be ANNP-led. The survey provided the first
collated statistics on how transport was organised, who was being transferred, where
they were being transferred to, why they were being transferred and how many
neonates were being transferred miles away from home in order to receive the care
they needed. This survey provided the springboard for change that was required to
achieve the Government’s directives. A specific aim of a successful network was that
95% of the network’s activity should be provided within the network, ensuring that care
is provided as close as possible to the families’ home.
The three categories of neonatal care have traditionally been provided by three levels
of neonatal units. Level three units should have the capability of providing the whole
range of neonatal care required. Level two units could also provide all categories of
neonatal care including ventilation but were supposed to refer sicker babies and more
complex cases to the Level three units. These units were also sometimes known as
high dependency units (HDU). The level one unit or special care baby units (SCBU)
were usually smaller units which offered less intensive “special care” only and would
be responsible only for the stabilisation of a sick baby before seeking transfer to the
local level three unit. It was recommended that each managed clinical network in
neonatology should contain at least one level three unit which was responsible for
providing neonatal intensive care. The neonatal intensive care unit was also to be
responsible for providing perinatal services. This would include high-risk obstetrics and
feto-maternal medicine, and should also have access to a full range of paediatric
subspecialties including surgery and cardiology. The network would also have a
number of level two high dependency units capable of providing short-term intensive
care, and level one special care units responsible for providing less intensive support.
The documents all stated that in order for successful implementation of the managed
clinical networks dedicated full time transport services were essential which would
operate in each individual network.
By 2005 a further two documents had been published giving additional guidance
concerning the national reorganisation and provision of services: Change for Children:
Every Child Matters (DH 2004a) and National Service Framework (NSF) for Children,

10
Young People and Maternity Services (DH 2004b). The Children Act (2004) was also
introduced. The first of these was a programme aimed at transforming existing
children’s services. It was grounded on five principles that were deemed to be the most
important to children and young people: be happy, stay safe, enjoy and achieve, make
a positive contribution and achieve economic well-being. It was published following a
consultation period during which Lord Laming’s report (2003) of the death of Victoria
Climbié was also published. The Children Act (2004) provided the legal background
required to ensure that the changes recommended regarding children’s services would
be implemented. The NSF (DH 2004b) was a 10 year strategy that was intended to
address child poverty and to improve the health of children with input from before birth
and during the early years. It was a major part of the change for children programme.
The NSF marked a fundamental culture shift within the NHS, with services being
delivered around the needs of children and their families rather than around the
preferences of organisations or professionals.
Major structural change: Making it Better
In Greater Manchester a discussion document was produced by The Scrutiny
Committee (2006) Making it Better for Children, Young People, Parents and Babies in
Greater Manchester, East Cheshire, High Peak and Rossendale: This programme of
change was to become known as “Making it Better”. This document was the start of a
discussion and engagement period inviting views on initial proposals to rationalise
hospital provision for children in Greater Manchester. The aim was to give everybody,
including local people and healthcare staff, the opportunity to comment on the
proposals and to help to plan safe, comprehensive and modern local services for the
future. The area under review consisted of 17 primary care trusts, and 13 hospital sites
which included two specialist children’s hospitals. Thirteen hospitals provided
maternity care, with two recognised specialist neonatal intensive care units and one
midwifery-led unit. One of the specialist neonatal units was already at the centre of a
major new building development which included a new children’s hospital. The two
specialist children’s hospitals were to relocate to the new site by April 2009.
At the time of the review, most local hospitals provided varying amounts of intensive
care for the babies. Some provided significant amounts, but other provided very little.
The proposal was to identify the managed clinical network and then to have three
specialist neonatal units as the “hub”. The specialist neonatal units would each have a

11
similar number of medical cots, located in three geographically separated hospital sites
and would provide all of the network’s neonatal intensive care. Other units would
provide short term intensive care, high dependency and special care.
The reorganisation of the new network was proposed to meet the government
directives of providing a service that delivers high quality care with more choice,
convenience and equitability. The benefits included providing care closer to home and
improving quality of care by concentrating services in areas staffed by the specialist
clinicians who would be able to maintain expertise by developing and enhancing their
skills. By concentrating services, staffing levels should improve and the hospitals
should be able to meet the requirement of the European Working Time Directive (DH
2004c) that was to come into force in 2009 that all doctors should work no more than
48 hours per week. Moreover, by developing more midwifery-led units, women would
be offered more choice in where to deliver their baby. It was recognised, however, that,
depending on where the individuals lived within the network and the proposed location
changes to the provision of services, the changes would not benefit everybody
(including, sometimes, the health care providers). Some people would have to travel
further, and some staff would have to move to another base as their current location
would close or change its service provision. Moreover, there was an undeniable
underlying driver to reduce costs (for example, by closing outlying children’s wards that
would be mostly empty during the warmer 2/3 of the year, with only winter pressures
prompting greater bed-occupancy).
In accordance with the government directive that each network should have its own
centralised transport service or at least a shared team between adjacent networks,
dedicated neonatal transport services began to be developed nationally. Historically,
neonatal transport services had been operated on an “ad hoc” basis from the larger
neonatal units within the regions and would transfer only into their own unit. Two or
three teams could be operating in a single region. These teams were staffed initially
by a doctor and a nurse, and the team members were sourced from the unit’s rotas on
the day. This meant that the team had to leave their workload to their colleagues to
cover whilst they went to collect the sick infant from the region and brought it back into
the unit. This system had inherent problems linked to suitability of staff to form the
team, lack of familiarity with the transport equipment, staff shortages, and
unmanageable workloads (Moore et al 2005, Fenton 2009).
12
Following a road traffic accident in the Northern Region involving an ambulance
returning to Newcastle with a baby receiving intensive care (Madar & Milligan 1994),
the Medical Devices Agency (1995) carried out a review of neonatal and paediatric
intensive care transfers in the United Kingdom and produced what became known as
the Transport of Neonates in Ambulances (TINA) Report (Medical Devices Agency
1995). One of the main recommendations of this report was that only members of staff
who are suitably trained and who receive frequent exposure to the transport
environment should undertake neonatal transfers. This report has been one of the
most influential factors in the subsequent development and delivery of neonatal
transport services in the UK.
To add to this evidence, an advanced neonatal nurse practitioner (ANNP) and his
medical colleagues were undertaking research and publishing the first findings from a
study comparing the effectiveness of ANNP-led neonatal transfers compared to
medical-led transfers (Leslie and Stephenson 1994, 1997, 2003). The authors found
that the two groups were comparable in outcomes, including length of time taken to
complete transfers and procedures undertaken whilst stabilising neonates prior to the
transfer. This evidence that ANNPs could undertake the transport role independently
of medical support was a major step forward in the ability to provide a more
comprehensive service. This work provided the initial standards on which neonatal
transport teams across England were based. By 2005, the network associated with
this study had a dedicated, full time neonatal transport service. This service also
incorporated a cot bureau ensuring that women and babies were allocated a bed or
cot at the most appropriate unit as close as possible to their home.
As Greater Manchester was in the process of reorganising its women’s and children’s
services according to the governments directives surrounding Networks the
Department of Health was also reviewing nationally the provision of neonatal services.
The subsequent findings, recommendations and measures of the review (National
Audit Office 2007) were fundamental to how the future of neonatal services were to
be developed and managed in an attempt to bring some transparency, equality and
audit ability to the current service provision. Services in Greater Manchester had to be
re-examined and reorganised to ensure that they could meet the recommendations
outlined in the report.

13
The Tool Kit for High-Quality Neonatal Services
In 2007, the National Audit Office undertook a review of network arrangements and
produced a report that highlighted the persistence of regional and local variations in
the services that were being offered. Caring for vulnerable babies: the reorganisation
of neonatal services in England (NAO 2007) acknowledged that the reorganisation of
neonatal services with the implementation of managed clinical networks had helped to
improve the care for premature and low birth weight babies. However it acknowledged
that there were still improvements to be made, there still remained a shortage of cots
at the right level of care, there were still nursing staff shortages and there was a
national lack of specialist 24-hour transport provision. All bar one network provided
some form of specialised transport service 24 hours per day seven days per week, but
most teams were made up of staff from the neonatal unit who had to leave the unit to
accompany the baby on the transfer. Three quarters of the units reported that
difficulties and delays in transferring babies compromised their overall care. In
response to these findings the government commissioned a Neonatal Taskforce was
which was drawn from experts who were responsible for delivering neonatal services
across England. This group also had representation from BLISS (the special care baby
charity), and parents.
The task force had four sub-groups which focused on the following areas:
Workforce;
Transport and transfer;
Commissioning neonatal care and data collection;
Neonatal surgery.
Following on from this work, the task force produced a “Toolkit for High-Quality
Neonatal Services” which was to guide the development of the neonatal networks
across the United Kingdom (DH 2009). The aim of the toolkit was “to support the
delivery of equitable, high quality specialist neonatal services in England” (p11, DH
2009) in order to achieve the vision that all premature and sick newborn babies and
their families receive the highest quality care designed to produce the best long-term
outcomes. The toolkit was a comprehensive document and was intended to give some
support and guidance to achieve the changes required to improve care and quality. It
was composed of four main elements: a commissioning framework, eight principles for
high quality neonatal services, appendices/resources and a CD which contained
14
examples of tools such as patient pathways, service specification and nursing
workforce calculator.
Eight principles were identified:
1. Organisation of neonatal services
2. Staffing
3. Care of the baby and the family experience
4. Transfers
5. Professional competence, education and training
6. Surgical services
7. Clinical governance; and
8. Data requirements.
These principles covered the major areas of activity within neonatal care pathways,
were based when possible on evidence or consensus of opinion, and were to be used
as measurable indicators in benchmarking. Within the appendices the standards were
explained in more detail and were referenced to best practice in order to achieve
consistency and measurable practice across England. In order to achieve more
consistency, the Toolkit also changed the way that neonatal units labelled themselves
and what care they could deliver. As described earlier in this chapter, prior to the Toolkit
neonatal units were identified by what level of care they provided ie a Level 3 unit
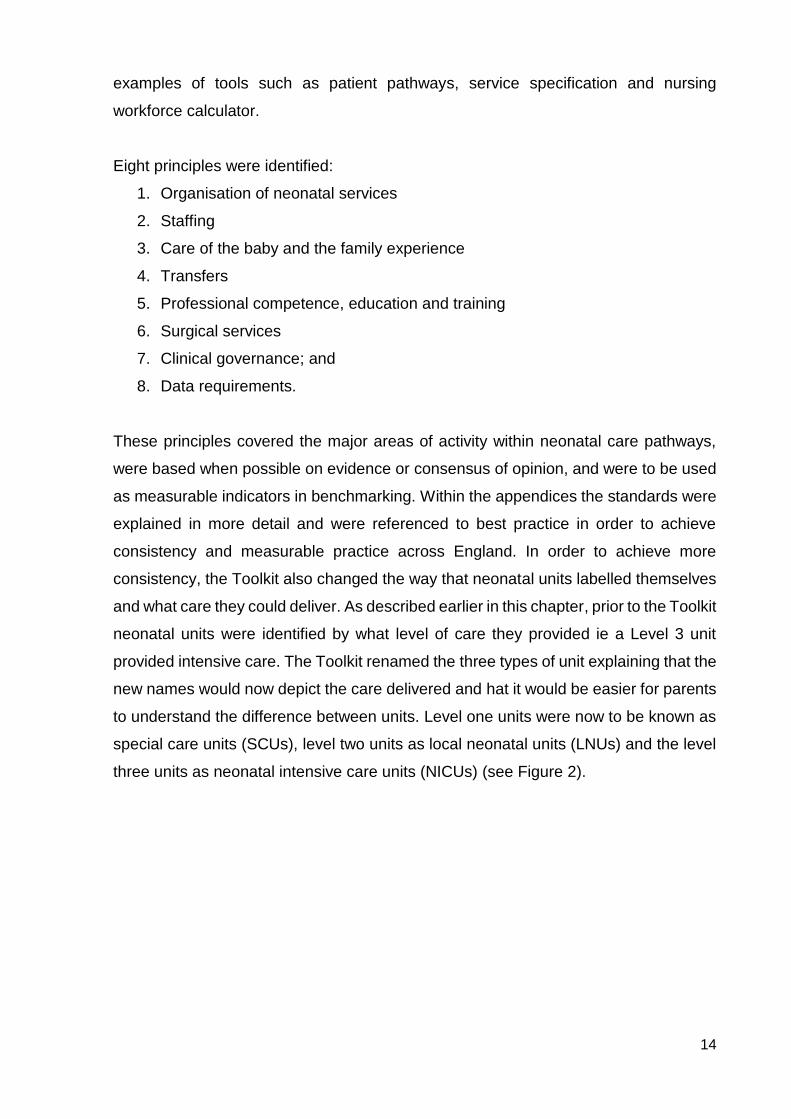
provided intensive care. The Toolkit renamed the three types of unit explaining that the
new names would now depict the care delivered and hat it would be easier for parents
to understand the difference between units. Level one units were now to be known as
special care units (SCUs), level two units as local neonatal units (LNUs) and the level
three units as neonatal intensive care units (NICUs) (see Figure 2).
15
Types of neonatal units
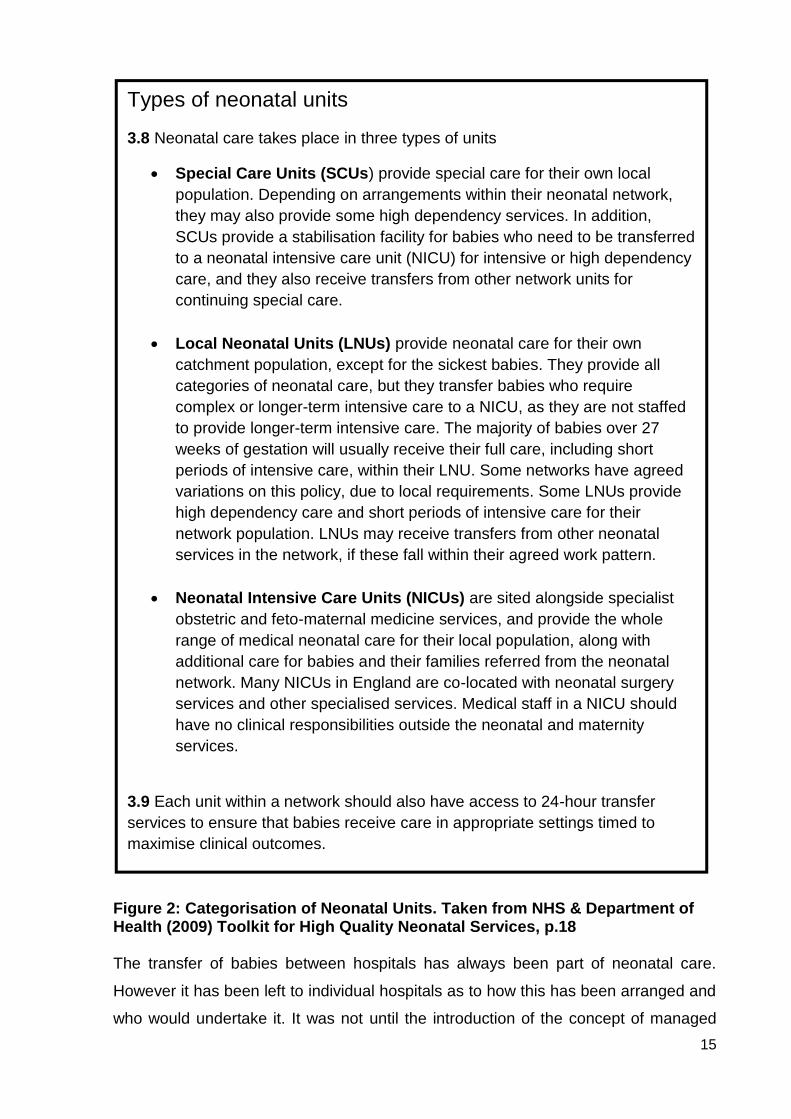
3.8 Neonatal care takes place in three types of units
Special Care Units (SCUs) provide special care for their own local
population. Depending on arrangements within their neonatal network,
they may also provide some high dependency services. In addition,
SCUs provide a stabilisation facility for babies who need to be transferred
to a neonatal intensive care unit (NICU) for intensive or high dependency
care, and they also receive transfers from other network units for
continuing special care.
Local Neonatal Units (LNUs) provide neonatal care for their own
catchment population, except for the sickest babies. They provide all
categories of neonatal care, but they transfer babies who require
complex or longer-term intensive care to a NICU, as they are not staffed
to provide longer-term intensive care. The majority of babies over 27
weeks of gestation will usually receive their full care, including short
periods of intensive care, within their LNU. Some networks have agreed
variations on this policy, due to local requirements. Some LNUs provide
high dependency care and short periods of intensive care for their
network population. LNUs may receive transfers from other neonatal
services in the network, if these fall within their agreed work pattern.
Neonatal Intensive Care Units (NICUs) are sited alongside specialist
obstetric and feto-maternal medicine services, and provide the whole
range of medical neonatal care for their local population, along with
additional care for babies and their families referred from the neonatal
network. Many NICUs in England are co-located with neonatal surgery
services and other specialised services. Medical staff in a NICU should
have no clinical responsibilities outside the neonatal and maternity
services.
3.9 Each unit within a network should also have access to 24-hour transfer
services to ensure that babies receive care in appropriate settings timed to
maximise clinical outcomes.
Figure 2: Categorisation of Neonatal Units. Taken from NHS & Department of Health (2009) Toolkit for High Quality Neonatal Services, p.18 The transfer of babies between hospitals has always been part of neonatal care.
However it has been left to individual hospitals as to how this has been arranged and
who would undertake it. It was not until the introduction of the concept of managed

16
clinical networks (DH 2003) that it was identified as being as important as the rest of
the care that the baby received and fundamental to the efficient flow of babies through
the network neonatal units. The Toolkit’s 4th standard and accompanying appendix J
reinforce the importance of transfers and set out a clear vision as to what is expected
when providing this service including staffing, training, equipment, governance, and
ambulance provision and specification (DH 2009). Prior to the Toolkit, transport
services across the United Kingdom had developed at varying rates and used different
models, often adapted to meet local demands. To meet the standards regarding
neonatal transfer was going to be challenging for most neonatal units. For some it
would be impossible, and for others it was at least going to take significant time and
funding to achieve a service that would resemble what the Toolkit dictated.
National Institute for Health and Clinical Excellence (NICE)
In 2010, the National Institute for Health and Clinical Excellence centre for clinical
practice produced the QS4 quality standard for specialist neonatal care (NICE 2010b).
The standard was to give clinicians, managers and parents a description of what high
quality specialist neonatal care should look like. The Topic Expert Group decided on
nine statements to be included in the final standard. The standard was based on the
Toolkit (DH 2009), British Association of Perinatal Medicine standards for hospitals
providing neonatal intensive and high dependency care (BAPM 2010), and standards
for maternity care produced by the Royal College of Obstetricians and Gynaecologists
(RCOG 2008). Each quality statement is accompanied by a quality measure which
aims to improve the structure, process and health outcomes of specialist neonatal care
and is cross-referenced where appropriate to the Toolkit. Neonatal transfer services
are identified as a priority in providing specialist neonatal care, and are identified in the
NICE document in statement four.
NEONATAL TRANSFERS
Inter-hospital neonatal transport occurs when patients in neonatal units are transported
to other neonatal or paediatric units for on-going intensive care, surgery, or diagnostic
procedures. Neonates range from full-term to premature infants with varying weights
and maturity states and often complex physiological complications. The service also
includes recovering neonates requiring transfer back to their local unit. In order for
robust data to be collected nationally, the Neonatal Transport Group (NTG) in

17
conjunction with the British Association of Perinatal Medicine (BAPM) have
categorised into four categories the reasons for neonates to be moved.
UPLIFT: Transfer for care that the referring centre does not normally offer.
RESOURSES/CAPACITY: Capacity (lack of cot spaces), inadequate staffing.
REPATRIATION: Transfer to a unit closer to home, step down care.
OUT-PATIENTS: Includes appointments for echocardiogram (ECHO), retinopathy of
prematurity (ROP), and magnetic resonance imaging (MRI).
The neonates are usually transported by ambulance, aeroplane or helicopter in a
specialised transport incubator or pod mounted on a trolley. Air transport has been
recommended as the mode of transfer if the journey is considered to be a long distance
exceeding 2-4 hours travelling time (Mir 1997). However, air transfer comes with its
own specific set of restrictions and constraints. Equipment has to be certified for air
transport, neonates’ clinical condition may have to be managed differently, and staff
has to receive specialist training especially if the transfer requires traveling over an
expanse of water. Currently, there are only three teams across the United Kingdom
which offers air transfer, and in recent years there has been a renewed interest in
promoting this form of transfer with the introduction of charity-supported funding with
specialised providers. A report for NHS England presented two years of data from
01/04/2013 to 31/03/2015 in which 93 neonatal air transfers were reported, with an
unmet need estimated at 279 transfers (Hancock 2016). The report acknowledged that
there was only one team in England reporting significant activity and highlights
problems with referral, funding and staffing of these specialised teams. In Greater
Manchester all the transfers are conducted using road ambulances with the specialised
incubator trolley which offers all the equipment needed to provide a similar level of
intensive care to that available on a neonatal unit (see Figure 1, p3).
This chapter provides an overview of the relevant information relating to neonatal
transfers especially those particularly sick or extremely preterm babies. It has also
provided the reasons why this project is relevant within the context of the changing
provision of neonatal care in the United Kingdom. The aim of this study is to provide
further data to demonstrate the levels of vibration and g forces to which babies are
exposed to during transfer and how this affects their physiological stability. Chapter
two contains a literature review that was undertaken to determine the current level of

18
evidence available on the physiological effects of neonates undergoing transfer and
any methods available to minimise adverse effects. Chapter three provides more in-
depth background regarding the political strategies resulting in significant changes in
the provision of neonatal care across the United Kingdom which have in turn impacted
on changing populations and transport trends. The study design is presented in
Chapter four. Chapter five is a presentation of the results and findings. Chapter six
provides a discussion of the findings and limitations of the research study, while
Chapter seven offers the conclusions and recommendations for practice and further
research.

19
CHAPTER 2: LITERATURE REVIEW
INTRODUCTION
Evidence-based practice has been recognised as an essential element of healthcare.
It is the application of research-based information that is used to make decisions about
patient treatment and care (Cullum et al 2013). A comprehensive literature review
focuses on examining and analysing valid evidence that can then be used to
understand the development of practice and to provide a knowledge base for applying
change to practice. The intention in this study was to identify and appraise existing
evidence, to discover research strategies that had been successful or problematic, and
to ensure that the perceived gap in knowledge was real.
SEARCH STRATEGY
The first stage of the review process is to formulate a question (Hastings and Fisher
2014). The question to be researched was as follows:
Do speed and road conditions have an effect on the physiological stability of
sick and preterm babies undergoing inter-hospital transfer by ambulance?
A review question must be focused clearly in order for it to be answerable. Several
frameworks and models are available to be used to structure review questions and to
guide search terminology in order to achieve the best results. Different frameworks
address quantitative and qualitative research questions. PICO is a recognised
framework that is used in nursing and healthcare which is suitable for application to
intervention studies (Bettany-Saltikov 2012, Hastings and Fisher 2014). Table 2
demonstrates how the question fits into the appropriate sections of the framework.
Table 2: PICO Framework
P Population, Patient, Problem Sick and preterm babies
I Intervention Transfer by ambulance, speed, road conditions
C Comparison No transfer
O Outcome Physiological stability
20
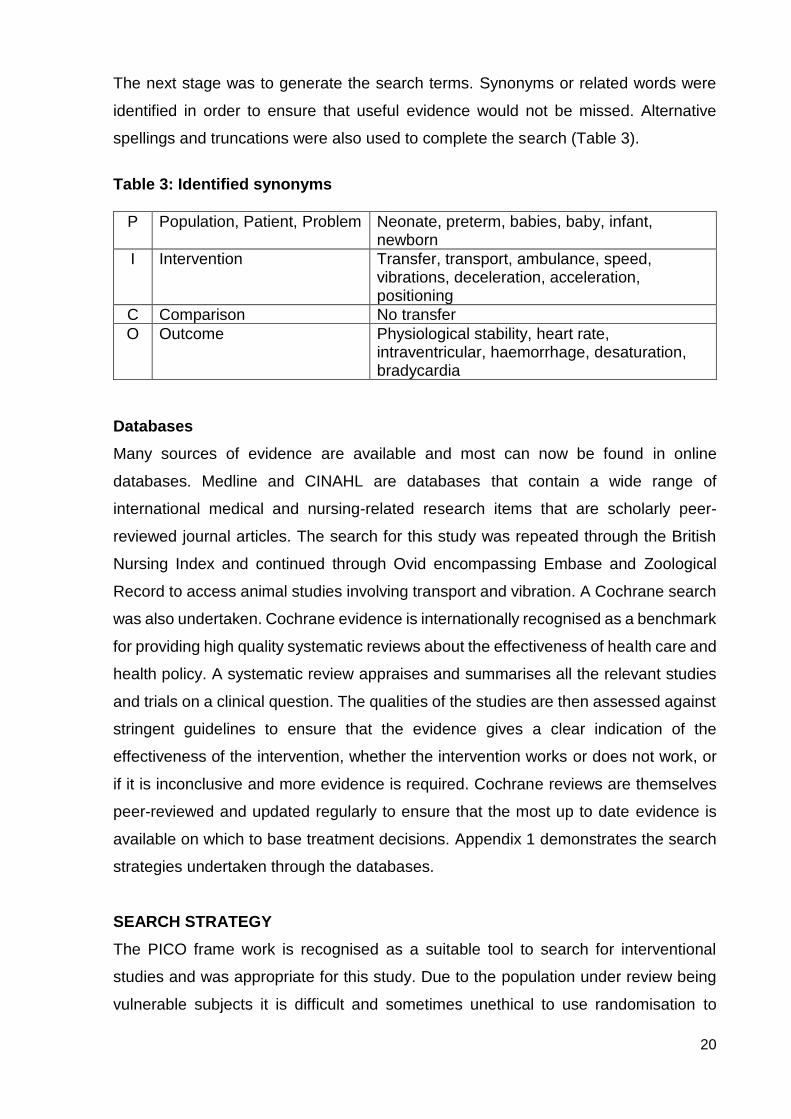
The next stage was to generate the search terms. Synonyms or related words were
identified in order to ensure that useful evidence would not be missed. Alternative
spellings and truncations were also used to complete the search (Table 3).
Table 3: Identified synonyms
P Population, Patient, Problem Neonate, preterm, babies, baby, infant, newborn
I Intervention Transfer, transport, ambulance, speed, vibrations, deceleration, acceleration, positioning
C Comparison No transfer
O Outcome Physiological stability, heart rate, intraventricular, haemorrhage, desaturation, bradycardia
Databases
Many sources of evidence are available and most can now be found in online
databases. Medline and CINAHL are databases that contain a wide range of
international medical and nursing-related research items that are scholarly peer-
reviewed journal articles. The search for this study was repeated through the British
Nursing Index and continued through Ovid encompassing Embase and Zoological
Record to access animal studies involving transport and vibration. A Cochrane search
was also undertaken. Cochrane evidence is internationally recognised as a benchmark
for providing high quality systematic reviews about the effectiveness of health care and
health policy. A systematic review appraises and summarises all the relevant studies
and trials on a clinical question. The qualities of the studies are then assessed against
stringent guidelines to ensure that the evidence gives a clear indication of the
effectiveness of the intervention, whether the intervention works or does not work, or
if it is inconclusive and more evidence is required. Cochrane reviews are themselves
peer-reviewed and updated regularly to ensure that the most up to date evidence is
available on which to base treatment decisions. Appendix 1 demonstrates the search
strategies undertaken through the databases.
SEARCH STRATEGY
The PICO frame work is recognised as a suitable tool to search for interventional
studies and was appropriate for this study. Due to the population under review being
vulnerable subjects it is difficult and sometimes unethical to use randomisation to
21
control and intervention groups, and this was evident in the limited numbers of studies
identified using this research method.
The Cochrane Library did not produce a result. This confirms that at present there is
no recognised experimental evidence on which to base current practice. Primary
studies are lacking and those that are available are no longer relevant due to the many
changes that have occurred in neonatal treatments, equipment, ambulances and
survival rates. There were also no randomised controlled trails (RCTs) identified during
the search process. The importance of RCTs is explained in more detail later when
discussing the quality of the available evidence.
Inclusion and exclusion criteria
The initial search was limited to 1990-2011 in order to focus on recent evidence, but
this had to be widened as results were minimal. The search was widened by increasing
the time frame from 1960 and including animal studies. Four studies were identified
with this extended search but they were descriptive pieces that gave very little
information about research methods and were not relevant to the type of care and
treatment that is recognised as routine neonatal care today. However, an early study
by Shenai et al (1981) was identified that was cited in several other articles as being
one of the first to investigate vibration forces within the transport incubator. Because
the research question was so narrow in focus the key articles that were identified were
replicated across many of the databases. Redefining the search terms and strategy
further did not generate additional findings.
A manual search of relevant journals such as the Archives of Diseases in Childhood:
Fetal and Neonatal editions, the British Medical Journal (BMJ) and the Infant journal
produced a further 2 related articles.
On later revision, the search was limited to 2011-2016. Items which were not either
systematic reviews or reports of research studies were excluded since research
evidence was sought. This search produced a further two discussion articles relating
to neonatal transport and two further research articles (Figure 3). Only English
language works were included since there was no facility for translation. Studies
referring specifically to transport via air were excluded as that evidence could not be

22
applied to ambulance journeys. In total 19 studies met the criteria and were selected
for the literature review.
Figure 3: Outcome of the search in PRISMA format
Although qualitative studies can add great value to understanding more about the
subject under review they were not included within this study as the focus was on
gaining a greater understanding of measurable values rather than gaining an insight
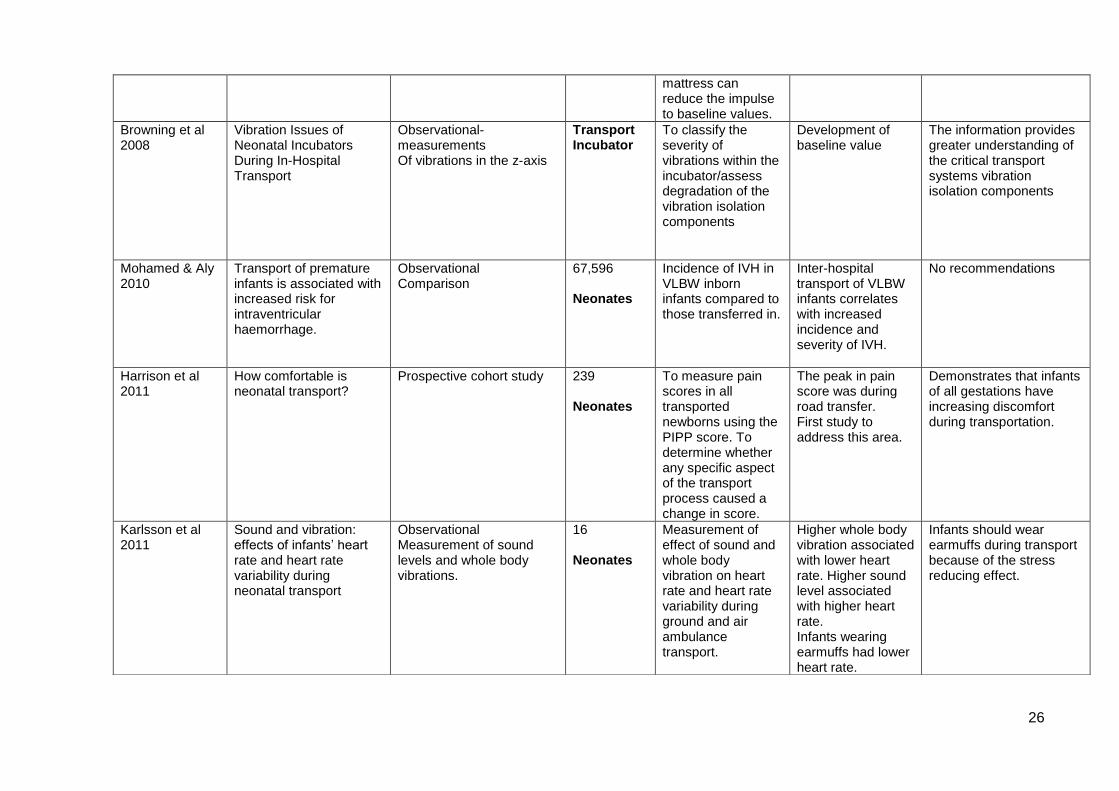
into individuals’ perceptions of why changes may occur. The studies that were selected
for the literature review are presented in Table 4.
Although the focus of this study was neonates, and that was the focus of the literature
review, one study was included that was undertaken with adults (Green et al 2006).
This study was included as it investigated the negative impact exerted by movement
in vehicles on well adults (in relation to their cardiovascular and respiratory status)
when undergoing a “blue-light” transfer. The adult subjects could regulate consciously
some of the physiological changes that occurred but still demonstrated increased
breathing rate and changes in respiratory compensation. The impact of road
conditions, increasing speed, and the challenges of engineering suitable suspension
41 reports included in the
review
31 reports included from
database searches
12 reports identified from
initial seach
5 reports identified from updated search
2 reports included from manual
search
2 reports identified from manual search
Removal of replicated items
Review abstracts to eliminate items
8
14
0

23
systems that reduce motion sickness were all included in the study. These are issues
that also relate directly to the transport of vulnerable neonates.
In addition, the study sought feedback from the patient about the experience of
transfer. Clearly, neonates cannot offer such feedback, so it was useful to learn what
adults had experienced. Since the adults’ discomfort and reactions were pronounced
and negative, an even greater effect could be expected with neonates who are far
more susceptible to changes in fluid shift between body compartments and already
suffer easily fluctuating blood pressure.
The findings highlighted the lack of current evidence and the need for further studies
to investigate whether sick or vulnerable subjects such as the elderly or those with
cardiovascular disorders would be further compromised. This study can also be
interpreted to highlight the unseen forces to which all accompanying staff and parents
are potentially exposed when travelling in the ambulance. Although Green et al study
reported that there appeared to be no long-lasting effects, their well subjects were
exposed to only a single five minute transfer from which they took five minutes to
recover. All neonatal transfers are significantly longer than this so both babies and staff
are exposed to considerably more noxious stimuli.
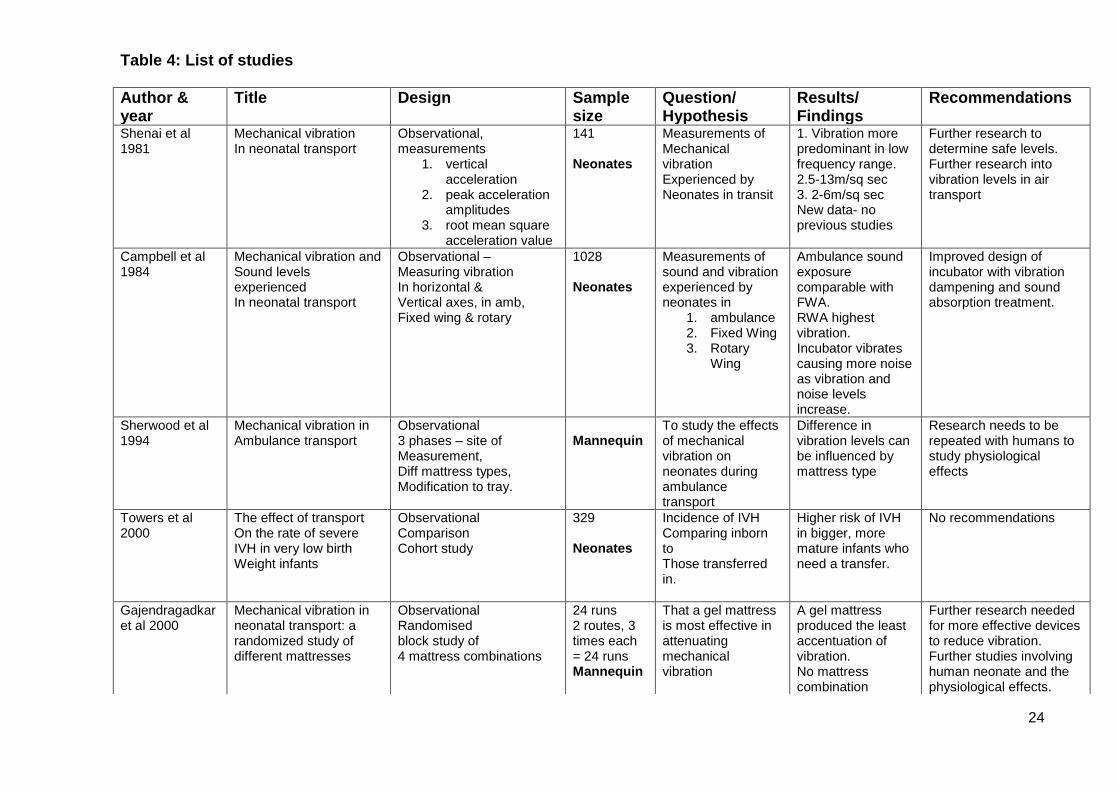
24
Table 4: List of studies
Author & year
Title Design Sample size
Question/ Hypothesis
Results/ Findings
Recommendations
Shenai et al 1981
Mechanical vibration In neonatal transport
Observational, measurements
1. vertical acceleration
2. peak acceleration amplitudes
3. root mean square acceleration value
141 Neonates
Measurements of Mechanical vibration Experienced by Neonates in transit
1. Vibration more predominant in low frequency range. 2.5-13m/sq sec 3. 2-6m/sq sec New data- no previous studies
Further research to determine safe levels. Further research into vibration levels in air transport
Campbell et al 1984
Mechanical vibration and Sound levels experienced In neonatal transport
Observational – Measuring vibration In horizontal & Vertical axes, in amb, Fixed wing & rotary
1028 Neonates
Measurements of sound and vibration experienced by neonates in
1. ambulance 2. Fixed Wing 3. Rotary
Wing
Ambulance sound exposure comparable with FWA. RWA highest vibration. Incubator vibrates causing more noise as vibration and noise levels increase.
Improved design of incubator with vibration dampening and sound absorption treatment.
Sherwood et al 1994
Mechanical vibration in Ambulance transport
Observational 3 phases – site of Measurement, Diff mattress types, Modification to tray.
Mannequin
To study the effects of mechanical vibration on neonates during ambulance transport
Difference in vibration levels can be influenced by mattress type
Research needs to be repeated with humans to study physiological effects
Towers et al 2000
The effect of transport On the rate of severe IVH in very low birth Weight infants
Observational Comparison Cohort study
329 Neonates
Incidence of IVH Comparing inborn to Those transferred in.
Higher risk of IVH in bigger, more mature infants who need a transfer.
No recommendations
Gajendragadkar et al 2000
Mechanical vibration in neonatal transport: a randomized study of different mattresses
Observational Randomised block study of 4 mattress combinations
24 runs 2 routes, 3 times each = 24 runs Mannequin
That a gel mattress is most effective in attenuating mechanical vibration
A gel mattress produced the least accentuation of vibration. No mattress combination
Further research needed for more effective devices to reduce vibration. Further studies involving human neonate and the physiological effects.

25
actually attenuated the vibration
Need to include additional measurements of horizontal/lateral direction
Shoo et al 2001
Transport risk index of physiologic stability: A practical system for assessing infant transport care.
Prospective cohort study of data
1723 Neonates
To develop and validate a practical, physiology-based system for assessment of infant transport care. TRIPS
Validated the TRIPS assessment
TRIPS is validated for infant transport assessment.
Broughton et al 2004
The Mortality Index for Neonatal Transportation Score: a new mortality prediction model for retrieved neonates
Data collection Comparison/ Cohorts
2504 Neonates
To develop a new mortality prediction score for the retrieved neonatal population based on data collected at the first call
Generated an easy to use mortality prediction score for retrieved neonates.
Score could be used to facilitate more effective triage/to send appropriate transport team
Green et al 2006
Tachypnoea and hypocapnia are induced by “buffeting” in vehicles
Observational Comparison
10 Adults
Measurements induced using an off-road simulator.
Found increase in heart rate and blood pressure and significant hypocapnia due to tacypnea.
Further field studies in patients at risk to establish impact of buffeting in different types of vehicle.
Bouchut et al 2008
Physical stressors during neonatal transport: Helicopter compared to ground
Observational Comparison
15 ground transfers, 5 helicopter transfers Neonates
To compare whole body vibrations in ground transfers and helicopter transfers.
Incubator whole-body dynamic exposure was higher but more stable in helicopter transports compared to transfer by ground ambulances.
Further studies into pathophysiological impact of transport of newborn babies to determine impact of difference between ambulance and helicopter.
Shah et al 2008
Quantification of impulse experienced by neonates during inter- and intra- hospital transport measured by biophysical accelerometry
Observational Comparisons of mattresses in x, y and z axis
Interhospital (20) intrahospital (5) Mannequin
To quantify the magnitude of the impulse experienced by neonates during intra / inter hospital transport, determine whether specialised
Use of the air foam mattress decreased impulse to the mannequins head compared to the standard mattress in all the study designs.
Further studies to determine what impulse values are acceptable, if such values are dimension specific and if transport produces a stress response
26
mattress can reduce the impulse to baseline values.
Browning et al 2008
Vibration Issues of Neonatal Incubators During In-Hospital Transport
Observational-measurements Of vibrations in the z-axis
Transport Incubator
To classify the severity of vibrations within the incubator/assess degradation of the vibration isolation components
Development of baseline value
The information provides greater understanding of the critical transport systems vibration isolation components
Mohamed & Aly 2010
Transport of premature infants is associated with increased risk for intraventricular haemorrhage.
Observational Comparison
67,596 Neonates
Incidence of IVH in VLBW inborn infants compared to those transferred in.
Inter-hospital transport of VLBW infants correlates with increased incidence and severity of IVH.
No recommendations
Harrison et al 2011
How comfortable is neonatal transport?
Prospective cohort study 239 Neonates
To measure pain scores in all transported newborns using the PIPP score. To determine whether any specific aspect of the transport process caused a change in score.
The peak in pain score was during road transfer. First study to address this area.
Demonstrates that infants of all gestations have increasing discomfort during transportation.
Karlsson et al 2011
Sound and vibration: effects of infants’ heart rate and heart rate variability during neonatal transport
Observational Measurement of sound levels and whole body vibrations.
16 Neonates
Measurement of effect of sound and whole body vibration on heart rate and heart rate variability during ground and air ambulance transport.
Higher whole body vibration associated with lower heart rate. Higher sound level associated with higher heart rate. Infants wearing earmuffs had lower heart rate.
Infants should wear earmuffs during transport because of the stress reducing effect.

27
Snedec et al 2013
Heart rate variability of transported critically ill neonates
Prospective observational study
58 Neonates
Measurement of effect of heart rate variability in relation to transported neonates and their recovery.
The neonates who had a higher heart rate variability but did not differ with TRIPS score than those with lower heartrate variability is associated with a faster and significant decrease in HR after transport and a shorter duration of mechanical ventilation and ICU treatment
The length of the journey can have a detrimental effect on the recovery time of some neonates so must be considered.
Vivalda & Garassino 2015
Study of the effects of transport modalities on short-term outcomes in premature infants
Retrospective cohort study comparing transport modalities and adverse effects.
66 Neonates
Evaluate the occurrence of adverse effects on clinical outcomes and on short-term events, in high premature infants transported in “cross” mode (perpendicular to the travel direction) compared with a population of infants transported in the traditional position (long axis parallel to the travel direction).
A lower mortality in cross transported infants.
As travel direction in neonates may be important a prospective comparative study is recommended.
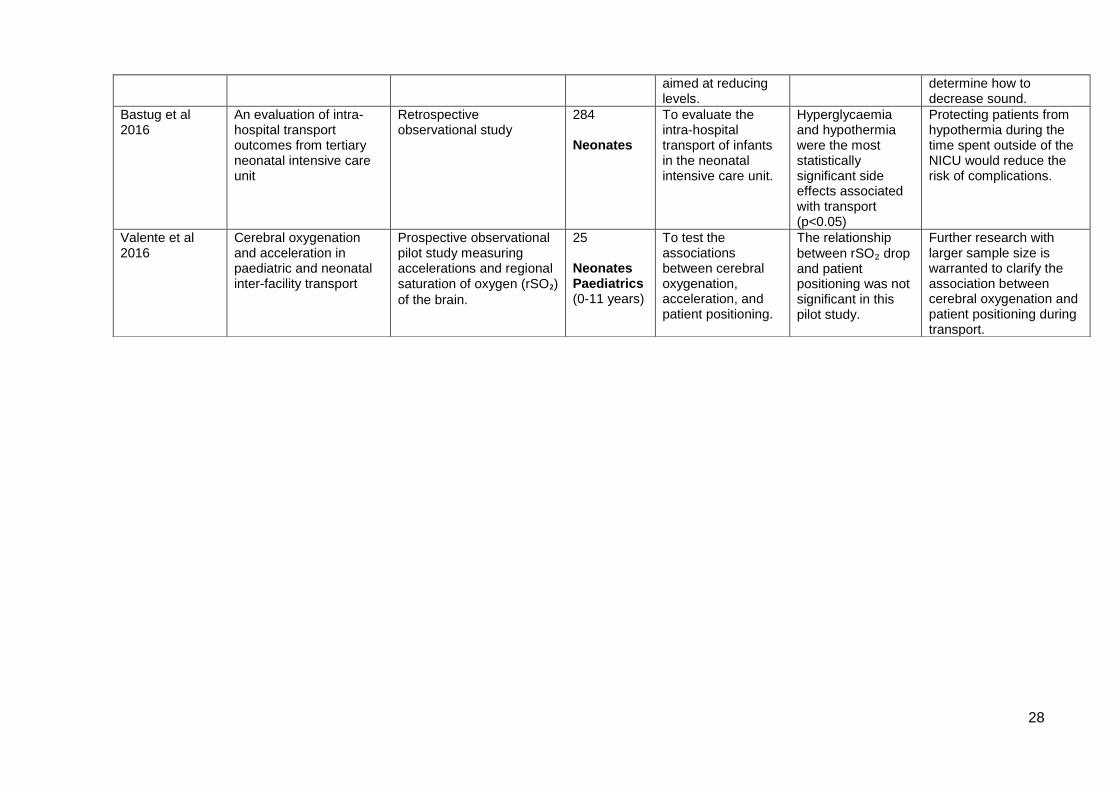
Prehn et al 2015
Decreasing sound and vibration during ground transport of infants with very low birth weight
Prospective observational study measuring sound and vibrations.
Mannequin Levels of sound and vibration during ground transport of a very low birth weight infant and compare following modifications to the transport incubator
Vibrations were reduced using the gel mattress in combination with an air chambered mattress. Sound levels were not decreased.
Transport teams can reduce levels of vibration through modifying mattresses. Further research is needed in order to reduce vibrations for different weight infants and to
28
aimed at reducing levels.
determine how to decrease sound.
Bastug et al 2016
An evaluation of intra-hospital transport outcomes from tertiary neonatal intensive care unit
Retrospective observational study
284 Neonates
To evaluate the intra-hospital transport of infants in the neonatal intensive care unit.
Hyperglycaemia and hypothermia were the most statistically significant side effects associated with transport (p<0.05)
Protecting patients from hypothermia during the time spent outside of the NICU would reduce the risk of complications.
Valente et al 2016
Cerebral oxygenation and acceleration in paediatric and neonatal inter-facility transport
Prospective observational pilot study measuring accelerations and regional saturation of oxygen (rSO₂) of the brain.
25 Neonates Paediatrics (0-11 years)
To test the associations between cerebral oxygenation, acceleration, and patient positioning.
The relationship
between rSO₂ drop and patient positioning was not significant in this pilot study.
Further research with larger sample size is warranted to clarify the association between cerebral oxygenation and patient positioning during transport.

29
The quality of the evidence
The evidence found from the search must be assessed to ensure that it is appropriate,
robust and of sufficient quality to aid further research and development, and,
particularly, if changes to practice are to be effected. A judgement needs to be made
on the strength of the evidence for informed decisions about treatment and care
options. The studies were reviewed using the tools produced by the Critical Appraisal
Skills Programme (CASP 2013). CASP approaches research in 3 steps: Is the study
valid? What are the results? Are the results useful? If the appraiser decides prima facie
that the evidence is valid and important the programme provides checklists to
undertake critical reviews of various research designs including randomised controlled
trials, quantitative studies, case control, and cohort studies. These checklists are
specific to the study design and offer tips to help the appraiser come to a valid
conclusion regarding the quality of the study.
The review for this study revealed a dearth of empirical studies, and no randomised
controlled trials. There is a hierarchy of evidence that places experimental research,
particularly randomised controlled trials, as the ‘gold standard’ source of evidence
(Parahoo 2007). This type of research design is identified by randomly assigning
participants to two groups; one group being the intervention group and the other being
the control group. This design is so strong because, if conducted rigorously, it
increases the likelihood that any effect observed is due only to the intervention.
However, as the population in this research topic is especially vulnerable it would be
very difficult from an ethical perspective to randomise babies to different interventions
one of which may cause more harm or one that may prevent harm from occurring.
Even small changes in treatment regimes can exert significant physiological impact on
sick or preterm babies, and withholding normal treatment may even be fatal. It is
because of such ethical challenges that most research on sick or preterm babies is not
undertaken using randomised controlled trial designs. All sixteen studies used some
form of observational research design with only one including a form of randomisation
(Gajendragadkar et al 2000). Observational studies are recognised as being
concerned with prospective or retrospective review of the effect of defined stimuli on a
particular sample; the researcher passively observing the activity or phenomena
without deliberately manipulating the stimuli in the form of an intervention (Parahoo
2007).
30
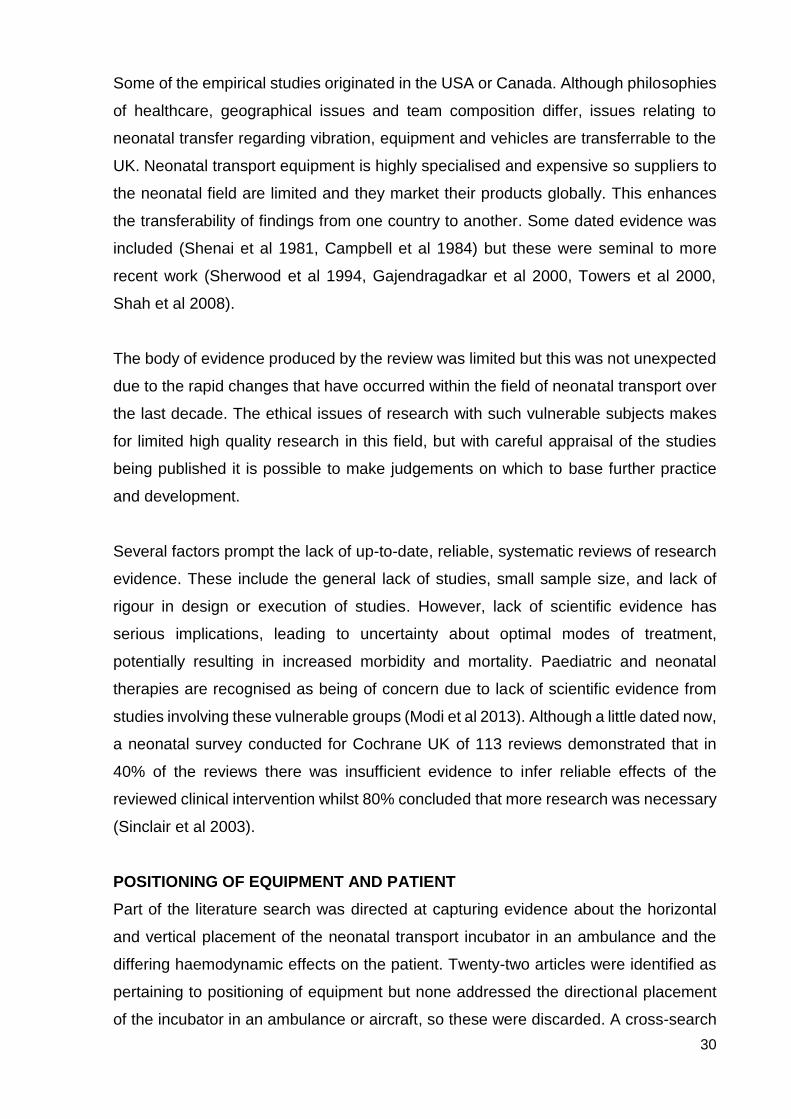
Some of the empirical studies originated in the USA or Canada. Although philosophies
of healthcare, geographical issues and team composition differ, issues relating to
neonatal transfer regarding vibration, equipment and vehicles are transferrable to the
UK. Neonatal transport equipment is highly specialised and expensive so suppliers to
the neonatal field are limited and they market their products globally. This enhances
the transferability of findings from one country to another. Some dated evidence was
included (Shenai et al 1981, Campbell et al 1984) but these were seminal to more
recent work (Sherwood et al 1994, Gajendragadkar et al 2000, Towers et al 2000,
Shah et al 2008).
The body of evidence produced by the review was limited but this was not unexpected
due to the rapid changes that have occurred within the field of neonatal transport over
the last decade. The ethical issues of research with such vulnerable subjects makes
for limited high quality research in this field, but with careful appraisal of the studies
being published it is possible to make judgements on which to base further practice
and development.
Several factors prompt the lack of up-to-date, reliable, systematic reviews of research
evidence. These include the general lack of studies, small sample size, and lack of
rigour in design or execution of studies. However, lack of scientific evidence has
serious implications, leading to uncertainty about optimal modes of treatment,
potentially resulting in increased morbidity and mortality. Paediatric and neonatal
therapies are recognised as being of concern due to lack of scientific evidence from
studies involving these vulnerable groups (Modi et al 2013). Although a little dated now,
a neonatal survey conducted for Cochrane UK of 113 reviews demonstrated that in
40% of the reviews there was insufficient evidence to infer reliable effects of the
reviewed clinical intervention whilst 80% concluded that more research was necessary
(Sinclair et al 2003).
POSITIONING OF EQUIPMENT AND PATIENT
Part of the literature search was directed at capturing evidence about the horizontal
and vertical placement of the neonatal transport incubator in an ambulance and the
differing haemodynamic effects on the patient. Twenty-two articles were identified as
pertaining to positioning of equipment but none addressed the directional placement
of the incubator in an ambulance or aircraft, so these were discarded. A cross-search
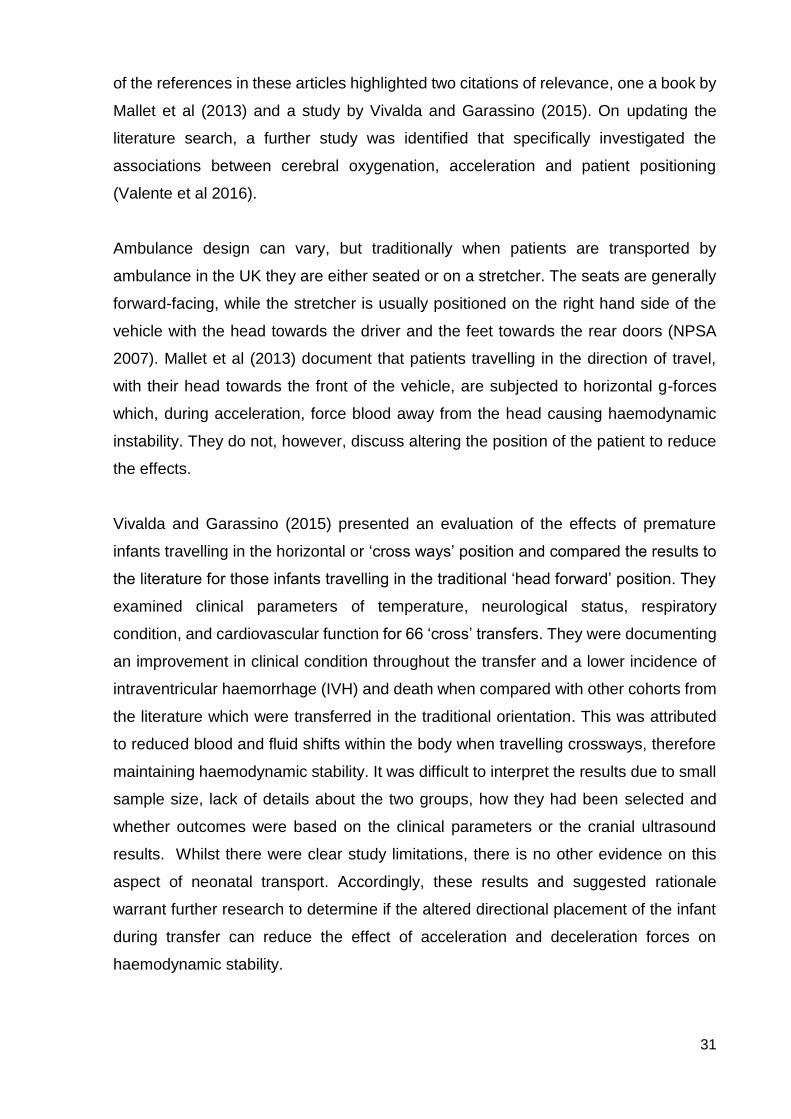
31
of the references in these articles highlighted two citations of relevance, one a book by
Mallet et al (2013) and a study by Vivalda and Garassino (2015). On updating the
literature search, a further study was identified that specifically investigated the
associations between cerebral oxygenation, acceleration and patient positioning
(Valente et al 2016).
Ambulance design can vary, but traditionally when patients are transported by
ambulance in the UK they are either seated or on a stretcher. The seats are generally
forward-facing, while the stretcher is usually positioned on the right hand side of the
vehicle with the head towards the driver and the feet towards the rear doors (NPSA
2007). Mallet et al (2013) document that patients travelling in the direction of travel,
with their head towards the front of the vehicle, are subjected to horizontal g-forces
which, during acceleration, force blood away from the head causing haemodynamic
instability. They do not, however, discuss altering the position of the patient to reduce
the effects.
Vivalda and Garassino (2015) presented an evaluation of the effects of premature
infants travelling in the horizontal or ‘cross ways’ position and compared the results to
the literature for those infants travelling in the traditional ‘head forward’ position. They
examined clinical parameters of temperature, neurological status, respiratory
condition, and cardiovascular function for 66 ‘cross’ transfers. They were documenting
an improvement in clinical condition throughout the transfer and a lower incidence of
intraventricular haemorrhage (IVH) and death when compared with other cohorts from
the literature which were transferred in the traditional orientation. This was attributed
to reduced blood and fluid shifts within the body when travelling crossways, therefore
maintaining haemodynamic stability. It was difficult to interpret the results due to small
sample size, lack of details about the two groups, how they had been selected and
whether outcomes were based on the clinical parameters or the cranial ultrasound
results. Whilst there were clear study limitations, there is no other evidence on this
aspect of neonatal transport. Accordingly, these results and suggested rationale
warrant further research to determine if the altered directional placement of the infant
during transfer can reduce the effect of acceleration and deceleration forces on
haemodynamic stability.
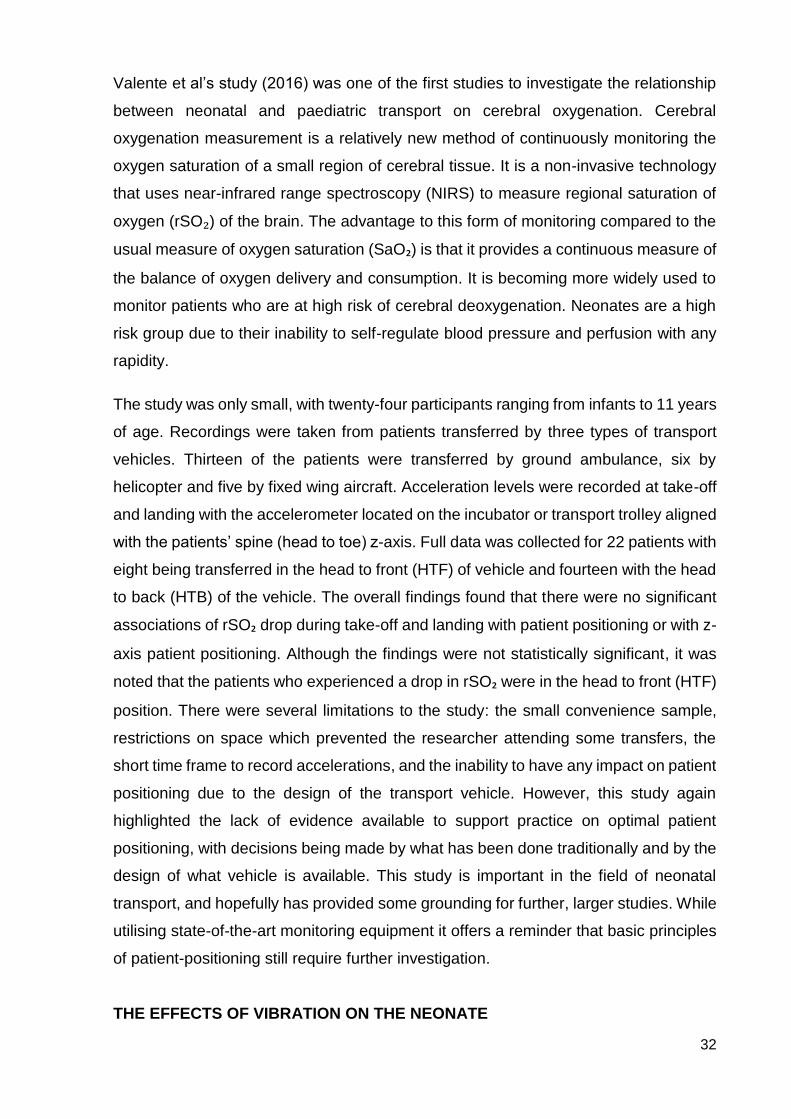
32
Valente et al’s study (2016) was one of the first studies to investigate the relationship
between neonatal and paediatric transport on cerebral oxygenation. Cerebral
oxygenation measurement is a relatively new method of continuously monitoring the
oxygen saturation of a small region of cerebral tissue. It is a non-invasive technology
that uses near-infrared range spectroscopy (NIRS) to measure regional saturation of
oxygen (rSO₂) of the brain. The advantage to this form of monitoring compared to the
usual measure of oxygen saturation (SaO₂) is that it provides a continuous measure of
the balance of oxygen delivery and consumption. It is becoming more widely used to
monitor patients who are at high risk of cerebral deoxygenation. Neonates are a high
risk group due to their inability to self-regulate blood pressure and perfusion with any
rapidity.
The study was only small, with twenty-four participants ranging from infants to 11 years
of age. Recordings were taken from patients transferred by three types of transport
vehicles. Thirteen of the patients were transferred by ground ambulance, six by
helicopter and five by fixed wing aircraft. Acceleration levels were recorded at take-off
and landing with the accelerometer located on the incubator or transport trolley aligned
with the patients’ spine (head to toe) z-axis. Full data was collected for 22 patients with
eight being transferred in the head to front (HTF) of vehicle and fourteen with the head
to back (HTB) of the vehicle. The overall findings found that there were no significant
associations of rSO₂ drop during take-off and landing with patient positioning or with z-
axis patient positioning. Although the findings were not statistically significant, it was
noted that the patients who experienced a drop in rSO₂ were in the head to front (HTF)
position. There were several limitations to the study: the small convenience sample,
restrictions on space which prevented the researcher attending some transfers, the
short time frame to record accelerations, and the inability to have any impact on patient
positioning due to the design of the transport vehicle. However, this study again
highlighted the lack of evidence available to support practice on optimal patient
positioning, with decisions being made by what has been done traditionally and by the
design of what vehicle is available. This study is important in the field of neonatal
transport, and hopefully has provided some grounding for further, larger studies. While
utilising state-of-the-art monitoring equipment it offers a reminder that basic principles
of patient-positioning still require further investigation.
THE EFFECTS OF VIBRATION ON THE NEONATE
33
Adult human studies have shown vibration to impact adversely on cardiorespiratory
function, central nervous system integrity, body temperature stability, and risk of
premature birth in transported pregnant women (Seidel & Heide 1986). Shenai et al
(1981) and Campbell et al (1984) undertook primary studies investigating the level of
vibration that neonates were exposed to during transport between hospitals. Shenai et
al (1981) measured the vibration produced by vertical acceleration of the infant and
recorded the time spent by neonates in transit. All transfers were land-based. The
study by Campbell et al (1984) was similar in observational design but included
transfers completed by ambulance, fixed-wing and rotary-wing aircraft. Sound levels
were recorded during the journeys. Both studies compared findings with the
recommended levels for adults set by the International Organisation for
Standardization (1978). In both studies the results demonstrated excessive vibration
levels. However, the researchers could only infer that these levels were potentially
harmful to neonates. The authors of both studies recommended further research into
improving transport incubator design, incorporating buffering and sound absorption
measures, and to determine safe levels for neonates. Unfortunately, none of these
recommendations have been put into place, and the current transport incubator design
remains unchanged from when these studies were undertaken. Neither study provided
clear details on the research methods. The results were descriptive, and none of the
data was subjected to statistical testing. However, this was acceptable at the time of
publication, and these studies provided preliminary data for future research.
Different mattresses
Three studies investigated the effects of vibration on the neonate using different
mattresses in the transport incubator (Sherwood et al 1994, Gajendragadkar et al
2000, Shah et al 2008). The studies were conducted using neonatal resuscitation
mannequins. They involved taking vibration measurements from the mannequins lying
on various combinations of mattresses during transport. It is not stated in the articles
why mannequins rather than neonates were used, but it appears that the
measurements were recorded from transfers that were undertaken to replicate
previous transfers. Conducting the research with mannequins would enable the
researchers to control the time and place and frequency of transfers being undertaken
and produce more data over a shorter period of time. All of the studies stated the
limitations of using mannequins rather than live neonates as discussed later.
34
The Sherwood et al study (1994) was conducted in three phases. The first phase
consisted of measuring the acceleration forces from different points on the transport
trolley and from a point attached to the mannequin’s forehead whilst resting on a
standard foam mattress. Phase two involved measuring the acceleration levels from
the probe attached to the mannequin’s forehead whilst using different mattresses: a
standard foam mattress, an air-filled mattress, and a gel-filled mattress. The
measurements were then recorded from two predetermined routes: route one a five
minutes city route at 25 miles per hour, and route two a highway route at 55 miles per
hour. Measurements were recorded every minute. Phase three involved
measurements being taken before and after modifications were made to the incubator
tray in which the mattress was contained. The modifications took the form of extra foam
inserts in the tray between the mattress and the tray base. Route one and then route
two were completed 8 times with the modified and unmodified tray. The modified tray
was then left in place and Route one and Route two repeated a further eight times but
with the measurements being taken from the probe attached to the mannequins
forehead.
The study by Gajendragadkar et al (2000) was similar in design to that by Sherwood
et al in 1994. This study tested the hypothesis that using the gel mattress alone or in
combination with the foam mattress would attenuate the vibration to which the neonate
was exposed during ambulance transfer. Four mattress combinations were tested: no
mattress, a foam mattress, a gel mattress and a gel mattress on top of a foam mattress.
Each mattress combination was then tested in triplicate over two routes. One route
was through a city at approximately 30 miles per hour and the second was a highway
route travelling at approximately 60 miles per hour. Mechanical vibration was recorded
from two points, one from a sensor on the base of the trolley and the second from a
probe attached to the mannequins forehead.
In 2008 Shah et al published one of the first studies to be based on a physics model
but continued with the theme of investigating the vibrations experienced by the neonate
in transport situations and how these vibrations could be reduced or minimised. Similar
to the previous two studies, the team used a mannequin in place of a live neonate.
Five trials were recorded from the hospital delivery room to the neonatal unit, and ten
round-trip journeys involving transport in an ambulance. The ambulance journeys used
a transport incubator containing a standard mattress or an air foam mattress. The trials
35
from the delivery room to the neonatal unit used the same transport incubator but with
four different mattress configurations; a standard mattress, a gel pillow, air foam
mattress and an air-foam mattress with a gel pillow. During the journeys the
measurements were taken from three planes. The x (horizontal), y (lateral), and z
(vertical) planes were recorded using a computerised accelerometer which was
attached to the mannequin. The results were calculated to produce a measure of
impulse (acceleration per unit of time) which gives a total impulse for each trial.
Sherwood et al (1994) found that a gel-filled mattress decreased the mechanical
vibrations being transferred to the mannequin, findings which were replicated by
Gajendragadkar et al (2000). However the main difference between these two earlier
studies was that Gajendragadkar et al found that vibration was most pronounced at
low speeds when the gel mattress was not being used, but vibration was not
significantly reduced by any of the mattress combinations. The lower the weight of the
mannequin also resulted in less efficiency of the gel mattress in attenuating vibration.
Shah et al’s (2008) more physics-based results demonstrated that the mannequin
transported between the delivery room and the neonatal unit on the air-foam mattress
experienced less impulse in the x (front-to-back) and z (up-and-down) planes
compared to the standard mattress. In the ambulance journeys all three experimental
designs decreased the overall impulse when compared to the standard mattress but
there was no statistically significant difference in the x, y and z dimensions. It is difficult
to account for these differences but it may be due to an improvement in transport
equipment, different ambulance design, or the materials used for the mattresses, all of
which could be different among the three studies. Calibration of measurement tools
and control settings together with blinding of staff to the combination of the mattresses
used in each transfer enhanced rigour in the three studies.
Although the studies provided new data regarding the suitability of mattresses and their
contribution to reducing vibration, the studies had several limitations. Notably, live
neonates and mannequins do not respond in the same way due to compliant and non-
compliant body tissues such as water content and bone mass. Spontaneous
movements would exert an impact on measurements, and vibration measurements
would differ accordingly. Moreover, all the mannequins used in these three studies
were more demonstrative of term infants than of preterm infants who are at more risk
of instability as increasing body weight decreases the impact of vibration experienced.
36
Other limitations include the difference in age and models of ambulance and isolette
(incubator for premature infants) used between the studies which can have an impact
on the individual study findings.
In contrast to the earlier studies, the results from these three studies were subjected
to rigorous statistical analysis. Both descriptive and interval data was collected. The
interval data was subjected to parametric testing using the one way analysis of
variance (ANOVA) test, the t-test and Tukey’s HSD test. Assuming that the data was
normally distributed, these appeared to be the appropriate tests for the data that was
presented. Probability in Shah et al (2008) was set at p<0.01. Although the mean
findings indicated that there had been a reduction in vibration at the mannequins’ head,
the study found no statistical difference between the mattresses. The small sample
size of ten road trips in comparison to five internal transfers may have contributed to
this finding as smaller studies will often report non-significance even when there are
important real effects which a larger study would have detected – a type II error
(Banerjee et al 2009).
A prospective observational study carried out by Prehn et al (2015) used aspects of
the previous three studies. Modifications were made to the transport incubator and
mattress to measure the effectiveness in reducing sound and vibrations during ground
transport and the study was conducted over three phases. For all phases the same
transport incubator and vehicle was used, with a model the size of a 30 weeks
gestation infant. Acceleration, vibration and acoustic data were collected. In each test
the vehicle was driven on an airport runway where it was accelerated to 50mph with
maintenance of speed for 30 seconds before slowing to a stop, in all cases an acoustic
cover was used over the incubator. In phase one tests an unmodified, typically used
foam mattress was used, with and without an acoustic cover. Phase two tested ten
combinations of different mattresses in order to find the most effective combinations,
which was then used for all further testing. Phase three determined the most effective
vibration reduction methods, which was combined with the most effective mattress
combination identified in phase two. The results of phase two demonstrated that a gel
mattress placed on top of an air mattress, whilst not significantly different to other
combinations, showed improved results. When combined with vibration reduced
methods in phase three, vibrations were not significantly reduced, nor were sound
levels reduced when the incubator cover was used. Although data supportive of the
37
other studies were produced, there were significant limitations to the study. When
testing on an airport runway normal road travel is not reproduced, excluding the use of
blue lights and sirens and the effect on sound and vibration levels. Moreover, the use
of a mannequin does not take into consideration the effects of vibration and noise on
an infant’s haemodynamic stability and nor does it identify an effective way to
significantly reduce vibrations and sound experienced by an infant during a road
transfer.
Physical effects on the neonate
Towers et al (2000) was the first study to explore the relationship if any, that transport
might have physically on the neonate. The researchers used a cohort study with a
comparison group to investigate the incidence of IVH occurring in neonates who had
undergone a transfer compared to those neonates who had been born in the level 3
unit. All live born neonates with birth weights ranging from 500g to 1200g and 24 weeks
gestation or greater were included. A range of antenatal and post-natal data was
collected. The neonates were transferred from 11 level 1 neonatal units but all ongoing
neonatal care for both groups was in the same unit so neonatal management was
controlled. The data was collected over three years and six months which resulted in
a large sample of 329 neonates. If an intervention is subtle or its effects harder to
detect a large sample is recommended (Button et al 2013, Clegg 2009).
Mohammed and Aly’s study (2010) built on this earlier work and generated a large
sample of 67,596 neonates. Their inclusion criteria included all neonates who had a
birth weight of <1500g and those who were transferred within 48 hours of birth.
Neonates with known congenital abnormalities, congenital heart disease or
chromosomal abnormalities were excluded as these can increase the risk of IVH
occurring (Sheth 1998). The data was collected from national datasets that recorded
all hospital inpatient admissions from over 1000 across the USA. It was not stated from
which level of unit the neonates were being transferred. As with any cohort design, it
was not always possible to assign the differences between the two groups to the
intervention under investigation as the groups might have been different before the
intervention (Crombie 1997).
The exact pathogenesis of IVH is not clearly understood but is recognised as probably
being multifactorial, with both obstetric and neonatal care influencing its incidence.
38
Studies comparing outcomes based on non-controlled variables may, therefore, be
flawed. Although the authors state that they used a cohort design, it may have been
more appropriate to use an observational research design as the variables between
the two groups were numerous, and it would be impossible to ascertain that the
intervention (the episode of transport) was solely responsible for the increased
incidence of IVH in that group. Nevertheless, Mohammed and Aly (2010) made the
claim that there is an increased risk of IVH with transport. This was a major flaw in both
these studies and seriously undermines the validity of the results. However, the results
demonstrated that those extremely premature infants born in level one neonatal unit
rather than in the level 3 unit had a higher risk of IVH, and this bears further exploration.
It is accepted that the risk of IVH is associated with physiological instability. The
observational study undertaken by Bastug and colleagues (2016) collected data from
284 babies transported to the neonatal unit. Transfer into the unit was documented as
being primarily for echocardiograph and radiology investigations. The babies were then
categorised into 3 groups based on weight. The place of transport was recorded as an
indication of how long the transfer had been. The results which were determined from
pre- and post-transfer levels revealed that there was a statistically significant
difference in blood sugar levels and body temperature before and after transport
(p<0.05). However, unlike other studies including Snedec et al (2013) and Karlsson et
al (2011) no significant differences were found in heart rate before and after transfer.
Although the design of the study appeared to be weak with little detail offered, it has to
be acknowledged that this was a notable sample size and produced some results
which are worthy of note and should be pursued further. As would be expected, the
complication rate was higher in this study for the babies with low weights.
Work by Bouchut et al (2008) in France compared helicopter transfers to transfers by
ground ambulance. Similar to the study reported in this thesis, they investigated five
dynamic whole-body exposure indicators which included rate of turn, ascent or
descent, horizontal speed and rate of acceleration and deceleration, vibrations and
noise. How they collected the data was difficult to assess as little detail was provided.
The study stated that 27 physical parameters were measured and analysed during the
two types of transfers, but again there was very little detail to identify the individual
parameters and what analysis was undertaken The data consisted of ten hours of
ground ambulance (fifteen transfers) compared with two hours of helicopter transfer
39
(five transfers). It was demonstrated that a ground ambulance has many more dynamic
effects in terms of braking, shock and impulsive noise than a helicopter, with one
impulsive event per two minutes in the ambulance versus one impulsive event per
eleven minutes in the helicopter. The main result demonstrated that incubator whole-
body dynamic exposure was higher but much more stable in helicopter transports
compared with transfer by ground ambulances.
A similar study in Sweden by Karlsson et al (2011) also compared ground ambulance
transfers with helicopter transfers and collected data on 16 transport episodes. The
neonates who were transferred were transported in a standard neonatal transport
incubator, lying on a foam mattress and restrained in a “nest” against the mattress.
The mean gestation age of the neonates was 33 weeks with a mean weight of 2.507kg
and a mean age of 17 days. The mean length of the transfer was two hours and 30
minutes. Karlsson et al (2011) investigated the effects of sound and vibration on the
infants’ heart rate and heart rate variability. The recognised TRIPS Transport Risk
Index of Physiologic Stability tool (Lee et al 2001) was used to assess the status of the
infant before and after the transport episode. TRIPS consists of four clinical variables,
temperature, blood pressure, respiratory distress and response to noxious stimuli.
Critically ill infants were defined as having a TRIPS score of 20 or higher, while more
stable infants were defined as having a TRIPS score of 10 or lower. Whole body
vibration was measured in accordance with the ISO Standard in three planes (x, y and
z). The 16 transported neonates underwent both air and ground transfer in the same
episode, homogenising the transport experience but not accounting for specificity of
transport mode effect since some effects last longer than others. Effects caused by
ground transport could persist into the flight period and vice versa.
The results were similar to Bouchut et al’s (2008) work, finding that sound and whole-
body vibration during both forms of transport exceeds the recommended level for
adults. A lower heart rate was associated with higher whole body vibration. However,
the study demonstrated that it was the higher sound level rather than the vibration that
that seemed to contribute to the infant becoming more stressed. The sound level
peaked at 100dBA during one of the ambulance journeys, but the average sound level
was higher during flight transfers than any other part of the transport episode.
The study by Snedec et al (2013) also investigated the effects of heart rate variability
(HRV) on neonates who had undergone a transfer. Observations were recorded
40
before, during and after transfer. Neonates were then categorised into two groups; low-
HRV and high-HRV. The two groups were then scored using the TRIPS tool as used
by Karlsson et al (2011) to determine illness severity. The results showed that those
neonates who exhibited more variability at a higher level but who returned quickly to
the baseline following the transfer were associated with a shorter time requiring
ventilation and ultimately a shorter ICU stay. This study provides a different perspective
on the neonatal transport experience and acknowledges that it is a stressful episode.
The focus on how the neonate recovers from the stress rather than on which aspect
causes the stress has been the approach of similar studies.
These studies could prove to be influential in how neonatal transfer progresses in the
United Kingdom. Due to geographical and network changes some transfer teams are
beginning to develop an air transfer service, and preliminary work has already been
undertaken on the specific problems that come with this mode of transport (Skeoch et
al 2005, Sittig et al 2011). However, further investigation needs to be undertaken to
determine if short, stable transfer but with more extreme exposure to physical stressors
is comparable to a longer journey time with less exposure to extreme physical
stressors.
Discomfort and stress
Physiological stress in neonates is poorly understood. It is known that neonates can
produce cortisol, a hormone that is produced by the adrenal glands in times of stress.
Increased levels of cortisol can cause increase in blood pressure and heart rate, but
at present although studies refer to stress there appear to be no studies that have
measured neonatal cortisol levels. Infants admitted to NICU are particularly susceptible
to many illnesses that can cause short- or long-term complications. Noise has been
known to affect infants adversely in NICUs and can cause problems with normal growth
and development of premature infants, interfere with normal sleep patterns, result in
cochlear damage and cause physiological changes in stability of heart rate and blood
pressure (Saunders 1995, Committee on Environmental Health 1997, Morris et al
2000, Surenthiran et al 2003, Wachman & Lahav 2011).
MacNab et al’s (1995) early work on vibration and noise suggested that care needs to
be taken not to exceed the International Electrotechnical Commission (IEC) standard
recommendation for maximum sound levels (<60dBA) inside the transport incubator.
41
Studies conducted in the neonatal unit environment have indicated that a higher heart
rate is a marker of pain or stress in neonates when exposed to sound stimuli
(Salavitabar et al 2010). The work by Karlsson et al (2011) demonstrated that high
mean sound levels exceeding 60dBA were present during most of the transport
episode and the higher the sound levels the higher the neonates’ heart rate. The
research continues to show that sound levels greatly exceed the maximum
recommended level when undertaking neonatal transfer, and although the effects on
transporting infants have become more recognised, it is still difficult to establish exactly
which part of the transport episode has the potential to cause the most stress and
discomfort.
A study undertaken using an off road simulator investigated the physiological effects
that adults suffered in response to a simulated “blue light” emergency ambulance
journey (Green et al 2006). Ten healthy volunteers were recruited with data collected
from nine as one subject did not tolerate the Pneumotach face mask. Heart rate, blood
pressure, respiratory rate and end tidal carbon dioxide were all measured in three five-
minute episodes. The first episode was recorded with the subjects at rest; the second
was during the five minute simulated ride, and the final recordings were taken
immediately post motion. The results taken from the nine subjects showed that the
motion had a marked effect on the frequency of respiration and minute volume which
in turn led to hypocapnia. Cardiovascular effects were less pronounced than ventilator
changes. The increased time for the subjects to recover was a surprising finding but is
in keeping with the duration of depression in end tidal carbon dioxide observed after
voluntary hyperventilation.
The study concluded that it was difficult to assess accurately the full implications of the
effects of motion or buffeting but all the subjects showed some effects which may
suggest that in an already sick, physiologically compromised patient undergoing an
emergency blue light transfer it may contribute to deterioration in their condition. The
researchers acknowledged the need for further studies in this area and raised the issue
that the type of vehicle being used for the transfer may also be a contributory factor to
the amount of distress experienced. This study was limited by the subjects all being
healthy adults who were studied whilst in an upright, restrained, seated position, and
who were aware of what was about to happen. Patients undergoing emergency
transfer are often in a horizontal position on a stretcher and unable to respond in
42
advance to the predicted movements of the ambulance. It would add to the evidence
to repeat this study with the volunteers in the horizontal position and then to compare
the findings.
Harrison and McKechnie (2011) conducted a prospective cohort study over a six
months period to try to identify infant discomfort during road transport and any pattern
to the types of pain and discomfort experienced. The Premature Infant Pain Profile
(PIPP) was used to measure stress and discomfort. PIPP is a well-validated tool for
assessing acute pain objectively (Stevens et al 1996) and comprises physiological and
behavioural parameters resulting in a total score of zero to a maximum of 18. The
physiological parameters include the heart rate and oxygen saturation, with the
behavioural state being assessed by scoring facial expression such as eye squeeze,
brow bulge and nasolabial furrow. The scores are weighted according to gestational
age. The physiological and behavioural parameters were recorded prior to any
handling at the start of the transfer to give a baseline reading. The infants were then
rescored at four event points through the transfer: event 1 - after moving into the
transport incubator, event 2 - halfway through the predicted length of the road transfer,
event 3 - after transferring from the transport incubator at the receiving hospital, and
event 4 - settled at receiving unit. The scores were then compared to the baseline PIPP
score prior to any handling.
During the six month study period there were 239 transport episodes but only 140
(59%) had complete data which allowed them to be included in the study. Of the 140
with complete data 24 were ventilated and sedated with morphine. The remaining
babies had no pain relief. The same pattern of PIPP score was seen in all babies
regardless of the gestation or sedation. The PIPP scores all peaked during the road
transport and demonstrated a significant change from the baseline observations. This
was consistent across all gestational age groups. The babies who were receiving
sedation for ventilation showed the same pattern although the differences were not as
marked.
CONCLUSION
From the literature reviewed it is evident that there are gaps in knowledge around
appropriate equipment, positioning of both the transport trolley and the neonate, and
understanding of how neonates are affected by exposure to vibration and g forces
43
when undergoing ambulance transfer. Existing empirical data is now outdated. A
commentary by Watts et al (2008) from the North Trent Neonatal Service (NTNTS)
discussed implementing developmental care interventions during the transport
episode. Positioning, containment and strategies to reduce the effects of vibration were
described. The literature, however, shows that the nature of mattresses is not such an
important factor, and it was noise that made the greatest difference in those studies on
which NTNTS planned to base its service. This highlights the inadequate state of
current knowledge and the lack of sound evidence on which to base practice. More
neonates are surviving premature birth but the consequence of serious health
problems such as respiratory complications, lung disease and long-term neurological
damage remains unchanged (Costello et al 2012). With major changes to ambulance
vehicles, improved transport incubator design, the availability of new mattresses and
positioning aids, it is timely to investigate the impact on neonates undergoing transfer
by ambulance in order not only to improve survival but also to ensure optimal outcomes
for them.
44
CHAPTER THREE: NETWORKS and POPULATIONS
The introduction of neonatal networks and the on-going revision of modes of service
provision is a major factor in the quality of service and perhaps in outcomes for
neonates undergoing transfer between hospitals. The issue of networks and
reorganisation is addressed separately here.
Wood et al designed a study to describe survival and health problems for all babies
born before 26 completed weeks of pregnancy in the United Kingdom and the Republic
of Ireland (Wood et al 2005). This study was to be known as the EPICure study and
was a prospective observational study of all births from 20 to 25 weeks gestation that
occurred between March 1st 1995 and December 31st 1995. This study was the largest
population-based study of infants of very low gestation to have been reported.
Previously reported studies were based on birth weights which included appropriately
grown babies but also small for gestational age babies. The main results recorded
40004 births with 811 being admitted for intensive care. Overall survival was 39%
(n=314). Survival was calculated at 28 days after birth, at the estimated date of delivery
(EDD), and at discharge from hospital. Of the 39% who were discharged from hospital
62% had one or more major morbidity. This study also identified that 12% of the
EPICure cohort were transferred between neonatal units in the first 24 hours after birth
with the results showing a strong association with significant cranial ultrasound
abnormalities in those transferred. This study was completed prior to centralisation of
services and one of the results was that survival was not increased in those centres
with higher numbers of extremely premature births and admissions. This finding,
however, was explained by the fact that no single institution had a wealth of
experience, emphasising the need for centralisation of services which would increase
experience in looking after this extremely vulnerable group, and, perhaps, improve
survival while decreasing morbidity.
The introduction, organisation and management of neonatal services within England
was seen as a way to maximise access and capacity of neonatal intensive care units
in order to provide high quality neonatal care to the most vulnerable group of babies
thus improving survival and maximising long-term outcomes (DH 2003a, DH 2003b,
DH 2004b, CESDI 2003). The recommendations made from the Confidential Enquiry
into Stillbirths and Sudden Deaths in Infancy Project 27/28 (CESDI 2003) that the
45
provision of high quality specialist neonatal care and the survival of babies admitted to
neonatal units had to improve was the major driving force for the subsequent
reorganisation of neonatal care across England. The subsequent literature supports
the efficacy of this approach (Kirrane 2010, Lasswell et al 2010, Gale et al 2012, March
of Dimes 2012, Seaton et al 2013).
Network Implications
Evidence of the need for the changes recommended by CESDI to improve care was
provided by Barker & Lorimer 2000, Chien et al 2001, Cifuentes et al 2002, and Kollee
et al 1992. Although these studies considered other specialities such as cardiology,
the emerging evidence suggested that centralisation of speciality services was
associated with better outcomes thus providing a greater driving force to reconfigure
neonatal services.
The national neonatal services reconfiguration was completed by the time of this study
in 2014 and they had been organised into 23 neonatal networks responsible for
providing care for the most vulnerable of patient groups: sick and preterm newborn
babies. The reformation in Greater Manchester was complete by 2012. Thirteen
hospitals previously provided obstetric and neonatal care, but these were reduced to
eight units: five local units providing high dependency and short-term intensive care,
and three newborn intensive care units providing intensive, high-dependency and
special care. Individual units had undergone massive changes with some units closing,
including on which had previous been an intensive care unit. Two units had undergone
uplift in care provision from providing high-dependency with some intensive care to
becoming one of the three hub units responsible for providing all intensive care. There
had been reorganisation of staffing levels and movement of highly-skilled obstetricians,
neonatologists, nurses and midwives across the network. Some units had also
undergone major structural changes or even provision of new buildings to
accommodate the demands and requirements imposed by government directives.
Evidence of Impact
Evidence is emerging of the impact and outcomes in relation to the Department of
Health’s recommendations for the reorganisation of neonatal care. Gale et al (2012)
undertook a retrospective observational comparison of outcomes before and after the
implementation of managed clinical networks in England. This was achieved by
46
comparing data that was reported by the CESDI Project 27/28 from 294 maternity and
neonatal units in England, Wales, and Northern Ireland from 1st September 1998 to
31st August 2000 (identified as Epoch one), compared to 146 neonatal units in England
contributing data to the National Neonatal Research Database at the Neonatal Data
Analysis Unit from 1st January 2009 to 31st December 2010 (identified as Epoch two).
The study aimed to test four key objectives. These were that following the
implementation of the networks in England, there has been:
1. An increase in the proportion of babies born at 27-28 weeks gestation at a
hospital providing the highest specialist neonatal intensive care activity
2. A decrease in the proportion transferred within the first 24 hours after birth
3. An increase in the proportion transferred between 24 hours and 28 days
afterbirth
4. A reduction in the proportion of babies in twin or higher order sets who are
separated by transfer.
Several limitations attached to the study regarding the data under investigation. Taking
into consideration the differences in how data was collected between the two epochs,
similar clinical characteristics were observed in the two cohorts to lessen the potential
for confounding factors to be responsible for the findings. The results showed that there
was an increase in babies born at 27-28 weeks gestation being delivered in hospitals
providing the highest volume of neonatal intensive care (from 18% to 49%), and there
was an increase in the numbers of babies being transferred between 24 hours and 28
days after birth (from 18% to 22%). There was no significant change in the numbers of
babies from multiple births being separated by transfer. These were positive results.
However, there had been an increase from 7% to 12% in the babies born at 27-28
weeks gestation who required an acute transfer to another hospital in the first 24 hours
of life. The reasons for the acute transfers were not documented so it is difficult to
interpret if these babies were not born in the appropriate hospital because of inability
to arrange maternal transfer due to maternal health reasons or precipitate delivery, or
if they were being transferred for other reasons such as un-diagnosed surgical or
cardiac complications.
Although the findings demonstrated that the survival rate was significantly higher in
epoch two compared with epoch one, it also highlighted that not even half of the babies
47
born between 27-28 weeks gestation were being delivered in a centre providing the
highest level of intensive care activity. This is in direct contrast to the overriding
principle of the Department of Health’s reorganisation of neonatal services to provide
initial care for preterm or babies with complex needs in highly specialised centres in
order to improve survival and long-term outcomes (DH 2003). A meta-analysis
undertaken in the USA by Lasswell et al (2010) also confirms that babies with a very
low birth weight or who are born significantly pre-term outside a unit which specialises
in this type of intensive care are associated with significantly increased likelihood of
neonatal or pre-discharge death.
As the clinical networks have developed it has become evident that the initial aim of
offering families and their babies an appropriate level of specialist care at centres as
close to home as possible is not being met for every family. Gale et al’s (2012) work
was one of the first to investigate the impact of reorganisation of neonatal specialist
care services in England. The study replicated some of the original work of the CESDI
27/28 study by comparing the outcomes of two cohorts, before and after the
establishment of the managed clinical neonatal networks. Although the national
reconfiguration is now complete, the evidence is that many of the specialist intensive
care units are unable to meet local and network demand, resulting in babies being born
out of the specialist centres and then requiring transfer in the hours or days follows
delivery often to centres that are offering an equivalent or lesser degree of expertise
(Cusack et al 2007, Storey 2010, Gale et al 2012).
Further work has continued to explore perinatal outcomes focusing on the place of
birth for preterm babies (Marlow et al 2014, Watson et al 2014). Marlow et al found that
regardless of the espoused national policy, only slightly more than half of births
between 22 and 26 weeks of gestation were in a maternity service with a level 3
neonatal unit. Survival was significantly enhanced following birth in level 3 services,
particularly those with high activity, and, furthermore, this was not at the cost of
increased neonatal morbidity. The significant potential impact of the strategy was clear,
yet implementation was lagging.
Another recommendation that came from the CESDI Project (2003) was the
importance of collecting high quality data. It was acknowledged that there was a lack
of national data on the outcomes of neonatal specialist care. With a shifting population

48
of neonates moving in and out of different neonatal units in different NHS trusts all
providing different levels of care, it was difficult to capture accurate survival data.
Current CESDI Project data was limited to survival up to 28 days and did not categorise
individual patients with hospital level of care provided.
Fenton (2012), a leading neonatologist in the UK, questioned what the networks
achieved ultimately, and highlighted that the populations served by individual units
were not comparable within the networks. This was demonstrated by perinatal and
neonatal mortality rates differing widely across networks. Certain maternal socio-
demographic characteristics, as well as earlier gestational age and lower birth weight,
have been shown to be associated significantly with neonatal death (Singh and Kogan
2007). In developing countries a different profile is shown – with such
sociodemographic factors exerting little impact compared to birth interval (Berhan and
Berhan 2014). This is clearly a case of progress changing problems as well as reducing
them.
There is an increasing trend towards later motherhood, and women aged 40 years and
older have the highest rate of stillbirth. Being a younger or an older mother significantly
influences perinatal and neonatal outcomes. The Confidential Enquiry into Maternal
and Child Health (2009) highlighted that increased body mass index is linked to an
increased risk of stillbirth and neonatal death, and there is a 3.5-fold increase in
admission rate to neonatal units of babies born to mothers who have a body mass
index >30kg/m². Multiple pregnancies, maternal ethnicity and social deprivation are
other factors that are also associated with adverse neonatal outcomes.
Fenton (2012) welcomed the aim of networks delivering and continuously improving a
high-quality, equitable service that can be accessed by all, but he cautioned that what
was effective for one network might not be suitable for a neighbouring network. In order
for accurate audit and benchmarking to be undertaken between networks a different
approach may be needed where individual units are compared against similar units
which serve similar populations but which may be actually located in different networks
around the UK. It is clear that questions still remain as to whether the reorganisation
will be able to accommodate the growing numbers of babies requiring specialist
services, or whether the inherent problem of inadequate provision nationally of

49
neonatal intensive care places will continue. Regardless, further reorganisation and
evolution of neonatal services seems likely at the time of producing this report.
Transport Services
With the national restructuring of specialist neonatal services there had been the
recognition that neonatal transfer services are fundamental to the efficient use of
limited resources and the functioning of the networks. Sick infants that are not born in
a neonatal intensive care unit need urgent transfer to the nearest available NICU, and
recovering infants need to be moved back to their local unit in order to release the
intensive care availability thus maintaining optimal capacity throughout the network.
The earliest government directives regarding network organisation and reconfiguration
documented the need for specialist transport services within each network, or at least
shared teams working across networks. The transfer principle in the Toolkit and the
quality statement regarding transfers in the NICE document both state that a 24 hour,
7 day week service is the ultimate aim.
Operational Delivery Networks
Following the establishment of managed clinical networks operational delivery
networks (ODNs) were introduced in April 2013. ODNs were established across
England and were part of an NHS England plan to sustain and develop the existing
clinical networks (NHS England 2012). The first ODNs were developed from
established managed networks with national coverage and included neonatal critical
care. The aim was for ODNs to focus on coordinating patient pathways between
providers to ensure access to specialist resources and expertise. ODNs are led by
clinical need agreed by providers and specialist commissioners. Within the report
regarding specialist commissioning for 2016/2017, neonatal services and transport
within the North West are specifically highlighted to be reviewed in relation to demand,
capacity and configuration (NHS England 2015). The North West ODN is one of the
biggest in the country and covers Lancashire and South Cumbria Neonatal Network,
Cheshire and Merseyside Neonatal Network and the Greater Manchester Neonatal
Network (see Figure 4). Prior to the introduction of the ODN each of the individual
neonatal networks operated independently and had clear geographical borders and
patient pathways. The introduction of the overarching ODN across all these networks
caused anxiety and concern. From a Greater Manchester view this reorganisation
followed on from the Making it Better reconfiguration of women and children’s services

50
as discussed previously, and it was perceived that there would be a disruption to the
service that had spent many years in the planning and subsequent implementation at
both a local and a strategic level. In the three years that have followed the introduction
of the ODN the three neonatal networks have, on the whole, continued to function as
previously with their own patient flows and pathways. At a strategic level, however,
there has been much more collaboration and interworking which has been a positive
outcome and promotes a feeling of participation and ownership with the planning of
future developments of neonatal services.
Figure 4: North West Operational Delivery Network Neonatal transport is included in the management of neonatal critical care, but
following the development and implementation of managed clinical networks with
independent transport services it attracts its own specialist funding separate to that for
the neonatal units. One of the first of the North West ODN’s work streams was to review
neonatal transport provision. A transport review was undertaken by the ODN with the
aim of maintaining a robust and sustainable neonatal transport system for neonates
Neonatal Intensive Care Units
Local Neonatal Units
Special Care Baby Units
Children’s Hospitals (neonatal surgical care only)
51
who require access to services within the North West Neonatal Operation Delivery
Network (NWNODN) geographical catchment.
Currently within the North West there are three transport teams, one in each network.
Two of these teams provide 24 hour cover, with the team in Lancashire and South
Cumbria covering weekdays with nights and weekends covered by the Greater
Manchester team. The Cheshire and Merseyside team also covers North Wales in its
catchment area. Following two years of consultation, negotiation and planning the
NWNODN presented to the NHS England specialised commissioners the preferred
option of a team operating from a single base with a single point of contact, and unified
cot bureau, and unified management structure. This proposal was endorsed in
September 2015.The base has yet to be decided as has which trust is to host the new
service, and no dedicated ambulance provision has been included in the proposal. This
major change has caused staff to become unsettled with the prospect of having to
move to a base that could potentially involve much longer commuting for some staff.
Neonatal transport is already provided by a small team of highly trained staff who have
specific skills, and this proposed change has impacted on all the current teams
resulting in major staff shortages which have at times exerted negative effects on
service provision.
With a transformation in network and changes in team provision the transport service
within the North West region is going to undergo significant reorganisation. The ethos
of neonatal transport, however, has to remain the same as that of the aims of the ODN:
improved access to and egress from services at the right time, improved operating
consistency, improved outcomes and increased productivity.
52
CHAPTER 4: STUDY DESIGN
INTRODUCTION
In this chapter, the approach to the study is detailed, including sample and recruitment,
data collection, means of data analysis, and ethical issues. The limitations imposed by
the design are also considered.
OVERVIEW OF STUDY DESIGN
This was a quantitative observational study with no additional intervention or extra
patient monitoring undertaken for research purposes. Observational studies draw a
conclusion about the effect of an intervention or exposure on subjects that are
observed in their natural setting. This study design is used when there is no other way
of studying a number of research questions (Jepsen et al 2004) but negativity is their
lower validity when compared to a randomised control trial (RCT). There is no
randomisation to groups and the intervention is not manipulated in any way. Data from
observational studies can be divided into two types. Primary data is collected by the
investigator for the specific study whilst secondary data may involve data that has been
collected for another purpose but is then used by the investigator to answer their own
research question. There are various advantages and disadvantages of using primary
or secondary data but most relate to time and resources. This study is based on
primary data as there was no other substantive data to use. When it is not ethical to
assign neonates to an unnecessary exposure within a study, observational design
allows the subject to be studied in the naturally occurring environment.
The double-blind randomised control trial (RCT) is considered the gold standard of
research as the high degree of control minimises the risk of bias (Attia 2005).
However, descriptive designs or non-experimental studies are used when it is not
possible to conduct randomised trials to assess the relationship between exposure and
outcomes. It would not be possible to use a randomised study design for this study
because if a baby requires a transfer it has to be transferred. Some comparison can
be made between transferred and non-transferred babies relating to outcomes but this
would not capture the real time differences in physiological parameters experienced
during the transfer episode. The overall aim of descriptive research is to ‘discover new
meaning, describe what exists, determine the frequency with which something occurs
and categorise new information’ (Burns and Grove 2006:24). This approach is

53
recognised as being used to form the first stages of more complex designs especially
when there is limited knowledge on the subject (Carter and Porter 2000). The proposed
study design was based around these influencing factors. Other observational study
designs were considered such as cohort, case controlled or cross sectional studies.
Cohort studies or case controlled studies could examine the outcomes of neonates
involved in transfers compared to those who did not undergo a transfer, however it
would be difficult to follow these subjects up in the long term due to time and cost
factors and even more difficult to attribute any differences in outcomes to the actual
transfer due to the numerous variables, including confounding variables. Cross-
sectional studies measure exposure and outcome at the same time in a sample of the
population. These studies do not address whether exposure preceded outcome,
because both are measured simultaneously, thus cause and effect cannot be
determined.
Bias is any systemic error that leads to a deviation from the true result and can affect
any part of a study from the planning to publication (Polit et al 2001). Observational
studies are recognised as having potential problems of researcher bias in that the
researcher can sometimes interpret what they see as being what they want to see and
not actually the reality (Parahoo 2014). Such bias was reduced in this study by
electronic recording of the observations. Because of the characteristics of the subjects
in this study the Hawthorne effect (Clifford 1997) - or problems associated with the
observer’s presence and knowledge of being observed - could not exert any impact on
the validity and reliability of the data collected. The babies under study had no
conscious awareness to change their behaviour or be aware of the observer, and the
observer could not influence the measurements as they were all monitored and
recorded electronically and automatically.
The observational study design can be limited in that the findings may reflect only a
unique population and therefore cannot be generalised to others. Observational
studies are evaluated in terms of internal and external validity. Internal validity is
assessed by the strength of was it the intervention that caused a difference and not
something else, with external validity being strengthened by being able to conclude
that the results would be replicated in another study with the same population and the
same intervention. Inferences from observational studies are considered externally
valid and may be generalised especially if the study involves unique participants or
54
settings which can be applicable to other populations and conditions (Carlson and
Morrison 2009). External validity was also strengthened by the sample included in this
study being representative of the diverse population of neonates who require transfer
in any neonatal transport service. The aim of the study was to add to the evidence
about a clinical phenomenon that is currently lacking in research findings to support
evidenced-based practice. The outcomes of the study have already been discussed
within the United Kingdom speciality neonatal transport groups (through presentation
at conferences), and the possibility of setting up multi-centre trials in the future with
larger samples is being considered.
This study used primary data as there was no existing comparable data. The patients
were stabilised and transferred into the transport incubator in the standard way and
attached to the routine monitoring equipment to measure vital signs (heart rate, blood
pressure, respiratory rate and blood saturation levels).These measurements were
displayed and stored on the standard multi-parameter monitor (Philips Medical,
Intellivue MP30) and downloaded to a laptop computer using dedicated software
(Trendface Solo). Ideally, continuous data would have been synchronised for both
speed and g forces and vital signs perhaps coupled with continuous video recording
all through the same interface, but this facility was not available.
In the early stages of the study, the available equipment which was being used to
record the movement data (the data logger) was too basic to use effectively. Due to its
design it was very difficult to know whether or not the data-logger was on, off or
recording. Partially blank recordings, absence of recordings, or unusable data resulted.
This was not known until after the transfer, and the loss of data and potential cases
caused considerable frustration. This frustration was particularly difficult when the
opportunity arose to transfer preterm twins from Barrow to Burnley (Case 2). The first
twin was transferred overnight with the 2nd twin being transferred by the team arriving
on the following shift. This journey is one of the longer journeys and had the potential
to provide lots of data which could then also be analysed against each twin as well as
the rest of the study subjects. Both twins were stabilised and had stable uneventful
transfers. Unfortunately, due to the problems explained above, there was no data
recorded for twin 1. In order to address this hindrance the supplier was contacted who
generously updated the device with a superior model which captured exactly the same
data while also providing a visual display to indicate that recording was taking place.

55
Direction of travel
x
y
z
This adaptation resolved a lot of stress for the accompanying staff who were becoming
more anxious about the equipment with each transfer.
g Forces
A g force is described as “being a force acting on the body as a result of acceleration
or gravity” (Collins English Dictionary 2012). The study compared the stability of
physiological measurements to the speed and g forces experienced in 3 dimensions
during the ambulance journey: longitudinal direction (x-axis) lateral direction (y-axis),
and vertical direction (z-axis) (Figure 5).
x axis Longitudinal Forwards and backwards y axis Lateral Side to side, left to right z axis Vertical Up and down
Figure: 5 Diagrammatic views of the axes in relation to the baby’s movement.
AIM
The study aim was to provide information about the stability of vital signs
measurements (such as oxygen saturation, heart rate and blood pressure) of babies
receiving intensive care whilst being transferred by ambulance.
RESEARCH QUESTION
Do speed and road conditions have an effect on the physiological stability of sick and
preterm babies undergoing inter-hospital transfer by ambulance?
The research question focused on speed and road conditions because of the different
journeys to which the babies are exposed. Some journeys were conducted solely on
56
inner-city and country roads which involve slower speeds and more acceleration,
braking and cornering. Other journeys comprise mainly of motorways which involve
smoother surfaces, greater speeds, but fewer changes of lateral direction. Since the
research question involved several variables this raised further sub-questions to be
addressed to establish any connections between certain variables. The sub-questions
that were raised by investigating the overriding research question were as follows.
i. Does the baby’s gestation have any impact on physiological stability?
ii. Is it the speed, acceleration or deceleration (x axis) that has the greatest
consequence on physiological instability?
iii. Do the road conditions, roundabouts and cornering (y axis) or road surface,
bumps, potholes, or vibrations (z axis) have any impact on physiological
stability?
iv. Does the distance covered have any effect on the overall results?
v. Does the model of ambulance used (z axis) have any influence on physiological
stability?
vi. Is any single physiological parameter affected more than any other?
vii. Does the disease or treatment have an impact on how the neonate tolerates the
transfer process?
SAMPLE
Parahoo (2014) explains that the purpose of sampling is to collect valid and reliable
data from a subset of the population that would be representative of the whole
population and generalisable to other similar populations and settings. In order for this
to be achieved the sample is dependent on at least four factors: the size and
characteristics of the sample, the method of sampling, and the setting where the study
was carried out.
In quantitative research it is advised that the researcher uses the largest sample
possible so as to be more representative of the population under study (Polit, Beck &
Hungler 2001), though engaging more subjects than is necessary may be thought to
be unethical, and it can lead to the Type I error of falsely identifying significant results
(Akobeng 2016). To calculate sample size and consequently the power of the study it
is necessary to identify the key outcome variables being measured and this is achieved
57
by obtaining as much information as possible from previous studies (Proctor & Allen
2006). As this was an observational study with no historical data, it was not possible
to perform a power calculation. In this research study it was possible to recruit only a
limited sample due to the time frame and the number of eligible transport cases during
the study period. Smaller samples are acceptable in quantitative work when there is
little research on the topic available and the first studies are viewed as preliminary or
pilot studies for more substantive trials for which a power calculation can be undertaken
to guide the required sample size (Greenhalgh 2006). The aim was to recruit 40-50
cases during the study period, but only 12 cases could be included with full data from
invasive monitoring. Of these, only seven had complete datasets from both
physiological and movement data. Additional cases which were excluded from this
doctoral report will be analysed and reported separately.
Inclusion and Exclusion Criteria
Eligible research subjects were identified from referrals made to the Greater
Manchester Neonatal Transport Service (GMNeTS). At the time of the study about 250
acute transfers per year were undertaken by GMNeTS. As the study did not introduce
any additional intervention into the neonate’s medical or nursing management, not all
of the neonates undergoing an intensive care transfer fulfilled the inclusion criteria. In
particular, arterial access for invasive blood pressure monitoring was not available in
many cases, and this was essential for the study.
Inclusion Criteria
1. Baby requires urgent intensive care inter-hospital transfer.
2. Baby has an arterial line in situ (thus allowing invasive BP monitoring).
3. Transfer is undertaken by the Greater Manchester Neonatal Transport Service.
4. Transfer is undertaken in a North West Ambulance Service vehicle.
Exclusion Criteria
1. No invasive blood pressure monitoring is possible during transfer.
2. Unsuitable weather conditions to allow use of GPS speed sensor.
3. Retrospective parental consent not confirmed. Advice from the research ethics
committee was that it would not be appropriate at the point of transfer to ask
parents to consider the study and to give consent since the anticipation and
experience of the episode could be a stressful. Consent was gained
58
retrospectively once the neonate had been transferred. Although data was
collected during the transfer it was not analysed until the parents gave consent
in the days following transfer.
4. Any parents whose baby died shortly after the transfer were not approached for
inclusion in the study.
The time before, during and after the transfer of an extremely sick neonate is one of
the most stressful events for new parents. It is a time when much new and confusing
information is given in a very short space of time. To ask for consent for enrolment into
a study at this time would be insensitive, would not be ethical and would not be in
keeping with good practice. During the study period there were several cases of
particularly sick neonates in which a decision had to be made as to whether the transfer
was in the neonate’s best interest or if indeed the neonate would survive the transfer.
In one these cases I decided that I would not initiate the data collection. However, after
explaining the seriousness of their baby’s condition to the parents I was asked by the
father about the extra laptop and its purpose. I explained very briefly about the study,
that it would be normal practice to collect the data and ask for consent in the days
following the transfer, but due to the critical situation that this baby presented I felt that
it may be inappropriate to contact them later. The father very calmly said he understood
that his baby may not survive but he wanted me to collect the data and use it in the
study if it would help with the transport of other babies. This baby survived the transfer
but died shortly afterwards. I did not make further contact, and I excluded the baby
from the study.
Recruitment
The sample was drawn using a non-probability purposive approach. In this approach
the researcher chooses deliberately who to enter into the study. This method of
sampling is used in order to ensure that those selected can provide the necessary data
on the issues being researched (Parahoo 2014). The main advantage of this approach
is that the subjects provide rich data, but, as Proctor & Allen (2006) warn, care has to
be taken as the sample is not representative of the whole population under study, it
may be subject to bias, and it may prove difficult to generalise the study findings. In
this study, clinical cases rather than individual consenting patients were the focus of
selection.

59
This investigation used a novel design which led to several problems being
encountered with recruitment. These problems were managed throughout the study
and are discussed in more detail within the limitations section. Recruitment of cases
was dependent upon the number of transfers being undertaken by GMNeTS during
this time which could not be predicted. The only infants to be excluded from the trial
were those without invasive blood pressure monitoring, in the form of an arterial line.
Arterial lines are placed peripherally or via the umbilical vessels to allow accurate
monitoring of blood pressure. Invasive monitoring is constant and more sensitive to
small changes, important in VLBW infants and when administering inotropic drugs.
Other advantages of arterial lines are easy access for blood sampling and exchange
transfusion. Peripheral cuff readings are also used routinely in neonatal units but are
said to provide an underestimate of the true value (Lalan & Bloey 2014). However,
arterial lines require careful siting and monitoring, and they have potentially harmful
side effects which can lead to embolism and even limb amputation (Goenka et al
2012). It is common neonatal practice to insert umbilical lines when stabilising and
treating sick new-born neonates as often, due to the size of the baby and poor clinical
condition, it can be particularly difficult to site peripheral intravenous lines. Older
neonates will usually have peripheral intravenous and arterial lines due to the inability
to access the umbilical vessels as the cord dries and atrophies.
During this study if the neonates were not invasively monitored due to this not being
clinically indicated or placement being unachievable before transfer they were not
eligible for inclusion in the study. Unfortunately, during the study time the majority of
neonates transferred by the team were not invasively monitored, for reasons including
inability to gain access to insert an arterial line, age of the neonate, and failure of
arterial lines prior to the transfer episode. When preparing the sick neonate for a
transfer the aim is to stabilise the clinical condition as quickly as possible and in a way
that does not cause further deterioration. Such vulnerable patients are often clinging
to life and do not tolerate excessive or repeated handling. Transport staff often talk
about the “window of opportunity” which equates to making a decision as to when to
start the transfer before the neonate actually becomes too unwell to tolerate the
journey. Unfortunately, the process of transfer involves the neonate being moved
between incubators and this is often a time when the neonate will demonstrate their
60
instability by deteriorating again, requiring re-stabilisation once again in the transport
incubator. If arterial access is lost during this process a decision has to be made
quickly, weighing up the risks and benefits of re-siting the line. Re-siting will involve
handling the infant, and if umbilical access is secured the infant will require further
investigation as placement has to be confirmed by X-ray. This cannot be done once in
the transport incubator and so departure is further delayed. To show a comparison of
arterial blood pressure monitoring and cuff blood pressure monitoring one case (case
11) has been included with cuff measurements. Lack of arterial access resulted in the
loss to the study of a large number of cases.
DATA COLLECTION
Prior to departure (See data collection sheets - appendix 2.
Demographic and clinical data is routinely recorded for clinical purposes by the
transport staff prior to departure from the referring hospital. The ventilatory, respiratory
and cardiovascular parameters were recorded once the neonate was stabilised in the
transport incubator, immediately before leaving the referring unit, to be loaded into the
ambulance. Loading and securing the transport trolley into the ambulance can be a
time of high activity and stress for the transport team. Depending on the ambulance
design the trolley has to be either winched or loaded onto a hydraulic platform and then
guided into place ensuring that it locates securely into the floor-mounted locking
device. The gas supply hoses are then connected to the air and oxygen cylinders
located on board the ambulance and the electrical supply reconnected. All of this has
to be done as smoothly as possible whilst maintaining clinical stability in order not to
cause discomfort, trauma or deterioration to the neonate. Not until the incubator was
prepared for transfer was the study equipment then set up and attached to the transport
equipment. As the team members were also the researchers it was important that the
departure was not delayed by the setting up of the study equipment.
Data collection during transfer
To coincide with the movement and physiological data, a written record of each transfer
was recorded. The ambulance journey was broken down into two sections: “motorway”
and “other roads”. The purpose of this was to record road conditions and driving
behaviour, aiming to create a more complete picture of the conditions of each transfer.
The road conditions were recorded using a numerical system 1=Motorway, 2=Dual
Carriageway, 3=Country Lane, 4=Road with speed bumps. Speed was recorded in a
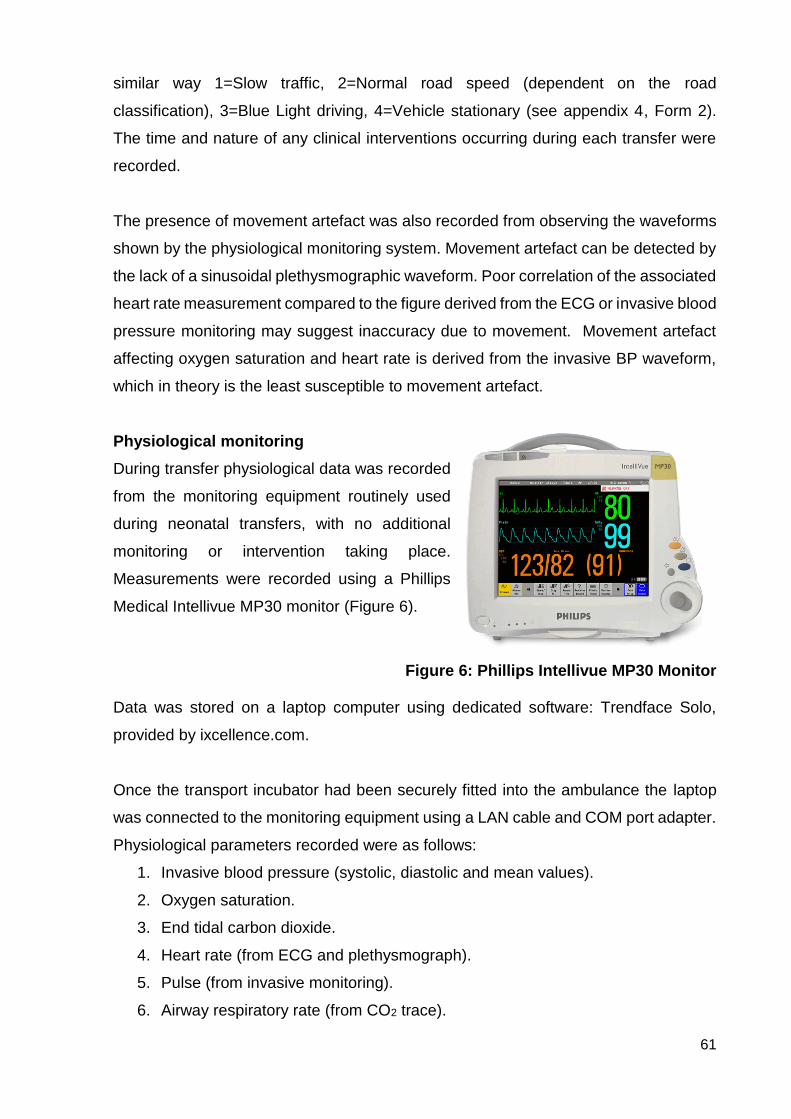
61
similar way 1=Slow traffic, 2=Normal road speed (dependent on the road
classification), 3=Blue Light driving, 4=Vehicle stationary (see appendix 4, Form 2).
The time and nature of any clinical interventions occurring during each transfer were
recorded.
The presence of movement artefact was also recorded from observing the waveforms
shown by the physiological monitoring system. Movement artefact can be detected by
the lack of a sinusoidal plethysmographic waveform. Poor correlation of the associated
heart rate measurement compared to the figure derived from the ECG or invasive blood
pressure monitoring may suggest inaccuracy due to movement. Movement artefact
affecting oxygen saturation and heart rate is derived from the invasive BP waveform,
which in theory is the least susceptible to movement artefact.
Physiological monitoring
During transfer physiological data was recorded
from the monitoring equipment routinely used
during neonatal transfers, with no additional
monitoring or intervention taking place.
Measurements were recorded using a Phillips
Medical Intellivue MP30 monitor (Figure 6).
Figure 6: Phillips Intellivue MP30 Monitor Data was stored on a laptop computer using dedicated software: Trendface Solo,
provided by ixcellence.com.
Once the transport incubator had been securely fitted into the ambulance the laptop
was connected to the monitoring equipment using a LAN cable and COM port adapter.
Physiological parameters recorded were as follows:
1. Invasive blood pressure (systolic, diastolic and mean values).
2. Oxygen saturation.
3. End tidal carbon dioxide.
4. Heart rate (from ECG and plethysmograph).
5. Pulse (from invasive monitoring).
6. Airway respiratory rate (from CO2 trace).
62
7. Respiratory rate (from the ECG trace).
As long as departure was not delayed it was recommended that two minutes of
baseline data was recorded prior to departure of the ambulance, to be used as control
data for each individual case. During transit, physiological data was continuously
recorded at intervals of one second. This was downloaded automatically from the
patient monitor from the time when the ambulance departed from the referring hospital
to the time the ambulance arrived at the receiving hospital.
Accelerometer/Movement Data
To record movement data a DL1 data-logging device was used (appendix 3). More
information can be found at www.Race-technology.com. This device uses a 5Hz GPS
receiver and digital accelerometers to measure speed and tri-dimensional
acceleration. Data is recorded to a compact flash disk memory. Movement variables
that were recorded were as follows:
1. Acceleration (longitudinal, lateral, vertical and vector).
2. Speed
3. Distance
4. GPS (longitudinal, latitudinal and accuracy).
The accelerometer was fitted securely to the head end of the ITU-6 stretcher, using
Velcro strips (Figure 7). Due to the size of the instrument and the need for secure
placement, it was not appropriate to fit the device directly to the neonate as discussed
earlier in the literature review (Vivalda and Garassino 2015). In all vehicles in the
current NWAS fleet and the GMNeTS dedicated vehicle the ITU-6 stretcher is placed
longitudinally in the ambulance saloon, with the neonate travelling head-first.
The GPS antenna was fixed to the dashboard of the ambulance by means of a Velcro
strip and connected to the data logger via a 5 metre cable (Figure 8). The device was
powered via a 12V adapter plugged into the saloon of the ambulance.
Installation of the accelerometer and physiological monitoring software occurred
concurrently to the preparation by the transport team for departure. On departure, data
collection was synchronised with the laptop clock as the index since the monitor clocks
were found to be unreliable and subsequently terminated on arrival at the receiving

63
unit. Throughout the journey all movement data was logged continuously to the
removable flash disk drive.
Data collection on arrival at the destination hospital
Ventilatory, respiratory and cardiovascular parameters were recorded once the
neonate had been transferred into the receiving unit’s incubator and stabilised. In
addition, any clinical interventions made during the transfer were recorded. All of the
data was recorded onto the laptop PC using the transport reference number as the
unique identifier with no other patient details identifiable. No measurement of long-term
outcome was recorded during this study.
Alternative Data
Other studies have investigated stress on the neonate during the transport episode by
using recognised tools such as TRIPS (Karlsson et al 2011, Snedec et al 2013) and
PIPP (Harrison and McKechnie (2011). It was decided that these tools would not be
used in this study due to the researcher-practitioner fulfilling both roles of lead clinician
and data collector. It would have not been possible in these circumstances to collect
additional data with any degree of accuracy or according to the planned timetable.
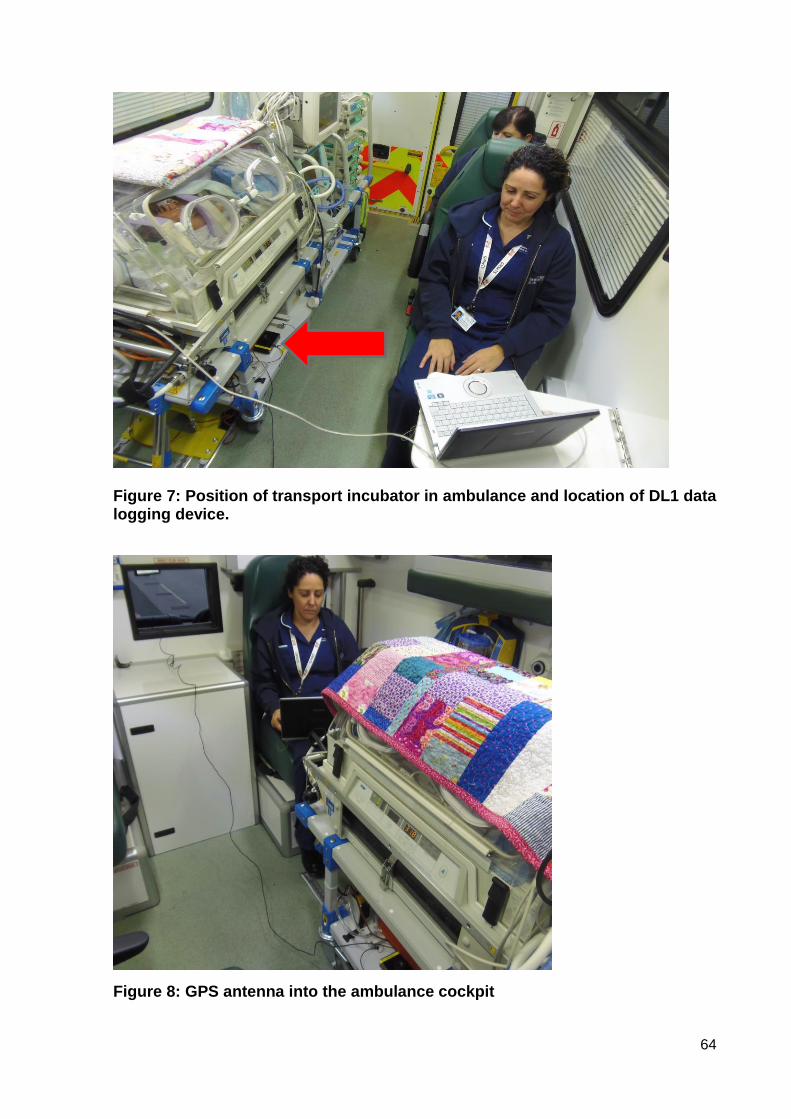
64
Figure 7: Position of transport incubator in ambulance and location of DL1 data logging device.
Figure 8: GPS antenna into the ambulance cockpit
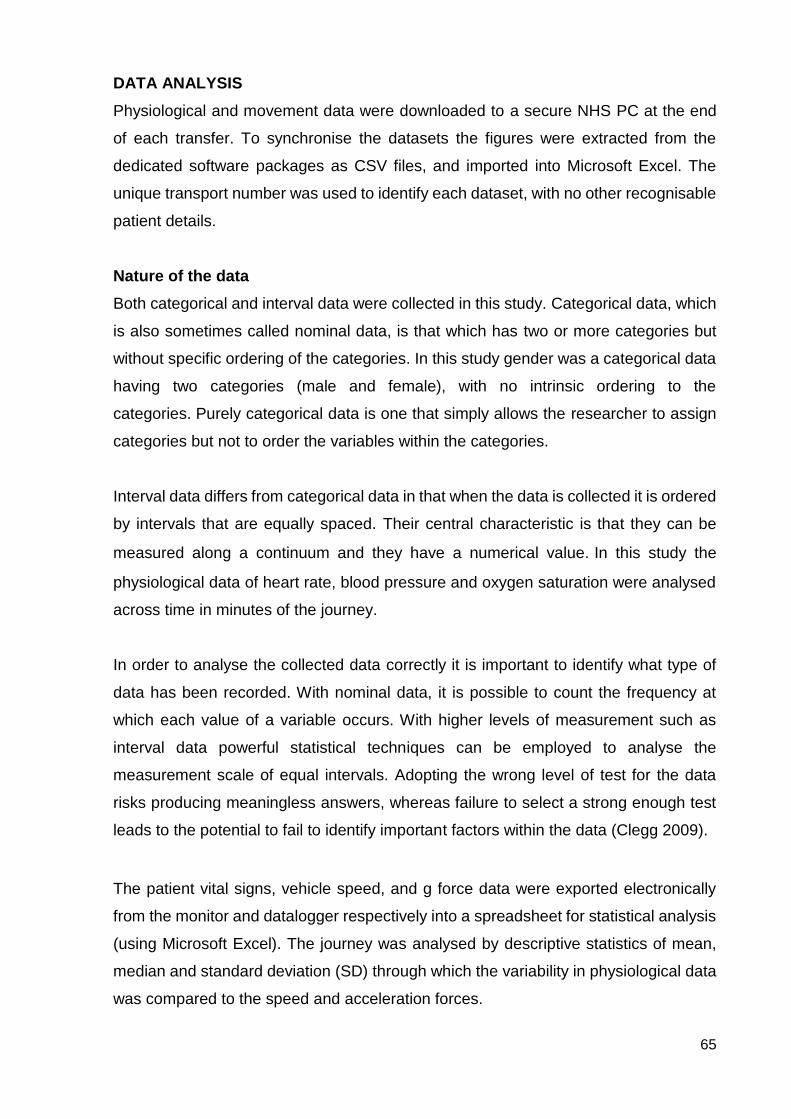
65
DATA ANALYSIS
Physiological and movement data were downloaded to a secure NHS PC at the end
of each transfer. To synchronise the datasets the figures were extracted from the
dedicated software packages as CSV files, and imported into Microsoft Excel. The
unique transport number was used to identify each dataset, with no other recognisable
patient details.
Nature of the data
Both categorical and interval data were collected in this study. Categorical data, which
is also sometimes called nominal data, is that which has two or more categories but
without specific ordering of the categories. In this study gender was a categorical data
having two categories (male and female), with no intrinsic ordering to the
categories. Purely categorical data is one that simply allows the researcher to assign
categories but not to order the variables within the categories.
Interval data differs from categorical data in that when the data is collected it is ordered
by intervals that are equally spaced. Their central characteristic is that they can be
measured along a continuum and they have a numerical value. In this study the
physiological data of heart rate, blood pressure and oxygen saturation were analysed
across time in minutes of the journey.
In order to analyse the collected data correctly it is important to identify what type of
data has been recorded. With nominal data, it is possible to count the frequency at
which each value of a variable occurs. With higher levels of measurement such as
interval data powerful statistical techniques can be employed to analyse the
measurement scale of equal intervals. Adopting the wrong level of test for the data
risks producing meaningless answers, whereas failure to select a strong enough test
leads to the potential to fail to identify important factors within the data (Clegg 2009).
The patient vital signs, vehicle speed, and g force data were exported electronically
from the monitor and datalogger respectively into a spreadsheet for statistical analysis
(using Microsoft Excel). The journey was analysed by descriptive statistics of mean,
median and standard deviation (SD) through which the variability in physiological data
was compared to the speed and acceleration forces.

66
The continuous data was analysed case by case by synchronising the physiological
data with the ambulance speed and g force data. For each vector of acceleration,
average, standard deviation, root mean squared (RMS) and peak values were
calculated. Peak values show the maximum amplitude of acceleration, indicating
intermittent thrusts. RMS gives the average intensity of acceleration over the time
block. The RMS is also known as the quadratic mean and is especially useful when
the function alternates between positive and negative values such as in the g force
measurements.
The longitudinal acceleration value was recorded in units of g. A positive value
indicated that the vehicle was accelerating forwards and a negative value indicated
that the vehicle was slowing down. The lateral acceleration value showed how much
cornering force the vehicle was generating, negative values for turning left and positive
values for turning right. A variety of methods including maps, charts, graphs, and box
and whisker plots were used to present the data.
ETHICAL ISSUES
A risk-benefit analysis approach may be adopted when children are involved in any
research (Long & Johnson 2007), and formal approval has to be gained from a
research ethics committee prior to the study. The main risks in this study were physical
harm, perceived coercion and breach of confidentiality.
Physical Harm
By entering the study the neonate is not be exposed to any further risk of harm than
the existing risk that any neonate is exposed to when undergoing an intensive care
transfer. In this case, there was no change to the medical treatment of care of the baby.
The only additional measure was that of recording g forces in the ambulance, and this
had no effect directly or indirectly on the baby’s care. The transfer was undertaken by
experienced transport staff that had undergone specialised training in order to
minimise any potential risks. The risks of physical harm incurred by the study were,
therefore negligible.
Perceived coercion
The ethical model of consent is protected by the law and is a fundamental part of good
practice (DH 2001). Those giving consent on behalf of an infant must have the capacity

67
to consent to the intervention, act voluntarily and be fully informed (HM Government
2015a). Implementation must be in accordance with the welfare principle: that the
child’s welfare or best interests are paramount (The Children Act 2004, Nuffield Council
on Bioethics 2007).
Consent may be given by those with parental responsibility for their child to be entered
into a clinical trial where the evidence is that the trial therapy may be at least as
beneficial as the standard therapy (DH 2009). All mothers and most fathers have
parental responsibility which involves providing a home and ensuring that they
maintain and protect the child. These responsibilities also involve making decisions
about the child’s medical treatment should any be required and whether or not to allow
them to become participants in research studies (HM Government UK 2015b).
As good clinical practice it is recommended that there must be no pressure to
participate in research and an ‘opt-out’ should be available without future care being
compromised (Manning 2000, Allmark & Mason 2006). While parents are in the
vulnerable position of having a critically ill baby they may be particularly susceptible to
perceive pressure to participate. Because of the stressful circumstances surrounding
neonatal transfer the research ethics committees stipulated that retrospective consent
was to be gained for participation in this study.
The nature of the study and of the passive participation in it were made clear through
a printed information sheet and a verbal explanation which was given to the parents in
the days following the transfer (Appendix 4). The researcher was able to answer
questions or clarify issues which remained unclear and the parents were given time to
consider their response. In reality, no parent declined consent once asked, though the
deterioration of some babies by the time of seeking consent led to the researcher
deciding not to pursue some cases. If the parents were willing to participate, the printed
consent form was then completed and signed (Appendix 5). If a family were still unable
to decide then the patient would not have been recruited. Following informal discussion
with the Chair of a research ethics committee it was agreed that any parents of a baby
who died following the transfer would not be contacted for consent and would not be
asked to participate in the study. This data would be destroyed.
Breach of confidentiality
68
Whenever personal data is collected and stored there is the possibility of breach of
confidentiality. This was minimised by the use of the transport number as a unique
identifier rather than the baby’s name; by the use of encrypted datasticks; and by
secure storage of data with access restricted to the researcher and supervisor.
Anonymised data was presented to the statistician. If parents were to change their
mind later about the use of their baby’s data in the study it would have been removed
and destroyed.
All personal data (which identifies participants in case of the need for institutional
review or complaint) will be stored for a period of five years in accordance with NHS
guidelines for non-intervention studies and then destroyed. Study data (anonymised
data of physiological responses and g forces) will be stored and made available for
further research according to the university data management policy and NHS
guidelines.
Formal Review
Formal approval was secured from the local NHS Research Ethics Committee
(13/NW/0623) and from the University of Salford Research Ethics Panel (HSCR13/29)
(Appendix 6). Nurses and midwives are also accountable by their own professional
code which is in place to protect the public (NMC 2008).
LIMITATIONS
Study Design
Some of the well-recognised limitations of observational studies involving researcher
bias and effect were avoided in this study by planning for the recordings to be made
electronically, together with the inability of the patients to change their behaviour in
response to the presence of a researcher (Jepsen et al 2004). Unfortunately due to
difficulties in recruiting the study aim of a sample size consisting of 40-50 cases was
not achieved and the subsequent small sample size was the main limitation of this
study.
Lack of arterial access
As stated earlier, in order to be eligible for inclusion the baby needed an arterial line in
situ prior to transfer. However, arterial lines can be difficult to insert, particularly in very
small preterm babies. They can have potentially catastrophic side effects (and so
69
insertion is not considered lightly by clinicians. Moreover, they can also be difficult to
secure, and dislodgement is not uncommon. On arrival at the referring hospital some
babies who might have been eligible for inclusion into the study with indwelling arterial
lines had to have the lines removed for various reasons. These reasons included
incorrect positioning (on examination by the transport team); evidence of poor
circulation to limb or limbs - which resulted in the line being removed immediately;
failure of blood pressure recording from an otherwise apparently viable line; accidental
removal of the line during the process of preparation for transport inability to sample
blood from the line; and inability to insert a line in the absence of existing provision.
In order to increase recruitment it may have helped to use non-invasive cuff blood
pressure measurements but that would have altered the study design and the analysis
of the results. A recording with an electronic blood pressure monitor via a cuff is
unavoidably inaccurate, and far less frequent recording would have been made. Each
recording would, potentially, have disturbed the baby and affected other parameters.
Furthermore, there are additional risks of haematoma, skin avulsion, compartmental
syndrome, ischaemia, and neuropathy of the affected limb from repeated use of this
technique in infants (Stebor 2005). Routine observation of the site is required, thus
disturbing the baby even more.
Clinical Prioritisation
Some eligible cases were lost to the study due to the researcher having dual
responsibilities within the transport team as a researcher and as the lead clinician..
With very sick unstable babies the priority had to be to the welfare of the baby and the
family. In some of the very stressful situations it was not appropriate to spend time
initiating the research equipment. When possible, an extra member of staff
accompanied the team to ensure that the researcher was available to focus on the
research role and therefore minimise the potential loss of suitable cases. There was
the risk that this situation would introduce selection bias, particularly if the most
intensely sick babies were excluded in this way. However, review of the sample
provided reassurance that this had not been the case. Nevertheless, the possibility
added to the learning for further studies.
Equipment Issues
70
Other limitations that were recognised during the course of the study which impacted
on recruitment involved the equipment that was used. Only a single monitor and only
a single laptop were compatible with the Trendface software. Therefore, if the bespoke
intensive care trolley (with this equipment) was being used for another (non-eligible)
baby on another transfer it was not possible to use the equipment on a different trolley
in a suitable case for the study. This led to the loss of further cases from the study. The
study had to end before optimal recruitment due to an essential upgrade of the
neonatal monitor which made it incompatible with the laptop software. While
stimulating further frustration for the researcher, in the time frame of this doctoral work
these problems could not be overcome and had to be accepted. With more time and
working with the manufactures of the study equipment, IT specialist input and
reconfiguration of the other transport monitors, it may be possible to address some of
these issues, and this will be pursued beyond the requirements of the doctorate. There
is clearly a resource issue for further studies.

71
CHAPTER 5: FINDINGS
INTRODUCTION
Data was collected from a total of 26 transfers. Two transfers were not included in the
results as the neonates died shortly after the transfer. A further 12 data sets were
unable to be included due to problems with data capture being saved in unrecognised
format. Data collection was difficult initially due to IT complications and with staff lack
of familiarity with the study equipment. The remaining 12 sets of data were used for
analysis. The reasons for transfer included prematurity, cardiac abnormalities,
persistent pulmonary hypotension of the newborn, bowel obstruction requiring
immediate surgery, and hypoxic encephalopathy requiring therapeutic hypothermia
(cooling). Ten of the transfers were conducted on the first day of life. Gestation ranged
from 23+6 weeks to 41 weeks of pregnancy, with the age range of 1 to 42 days. The
sample included 5 female babies and 7 male babies. Within these twelve cases there
were two which included only physiological data and one that contained only
movement data. It was decided to include these incomplete sets as some limited
information could be drawn through the analysis. The characteristics of all the cases
analysed are presented in Table 5. The results are presented as overall findings and
then case by case in more detail, concluding with a summary.
Two sets of data were collected. These were categorised into movement data and
physiological data. The two data sets were collected and analysed independently of
each other but then compared to identify if there was any correlation between events.
Decisions about How to Present the Data
Although a mass of data had been collected, for reasons already explained, much of it
was not in a usable format, and further work would be required with equipment
manufacturers, health statisticians and engineers before more complex analysis could
be undertaken. A pragmatic decision was needed on what should be presented in the
doctoral report, and what would need to be retained for later analysis as part of the
post-doctoral work. A compromise position was reached in which the limited number
of cases with full (and accessible) datasets (n=7) for both physiological and movement
data would be presented using descriptive statistics and wider consideration of route
and road conditions. It was concluded that stronger statistical analysis, including
correlation and comparison between factors (such as term and preterm babies) would
72
need to wait until the remaining data could be accessed with more confidence of
validity and rigour.
The seven cases were reviewed, the data checked and cleaned, and particularly
manual work done to harmonise the datasets. For example, data that had been
recorded in millisecond intervals was converted to minute intervals to enable
harmonisation with other data that was available only in comparable time periods.
Much unnecessary data was discarded (for the purpose of the current analysis) – data
which was unavoidably recorded by default by the available equipment.
Movement data
The movement data related to the speed and g forces in the longitudinal (x-axis), lateral
(y-axis) and vector (z-axis), and it was analysed numerically and graphically. Two types
of journeys were identified. All journeys started with urban roads which were referred
to as “other roads” which were characterised by slower and more variable speeds.
Some of the journeys then had a motorway section referred to as “motorway” which
showed higher and less variable speeds (see example in Figure 9). All the speed data
is presented with the g force data. The speed graph is presented at the top labelled
with the motorway section so identification can be made across all the axes.
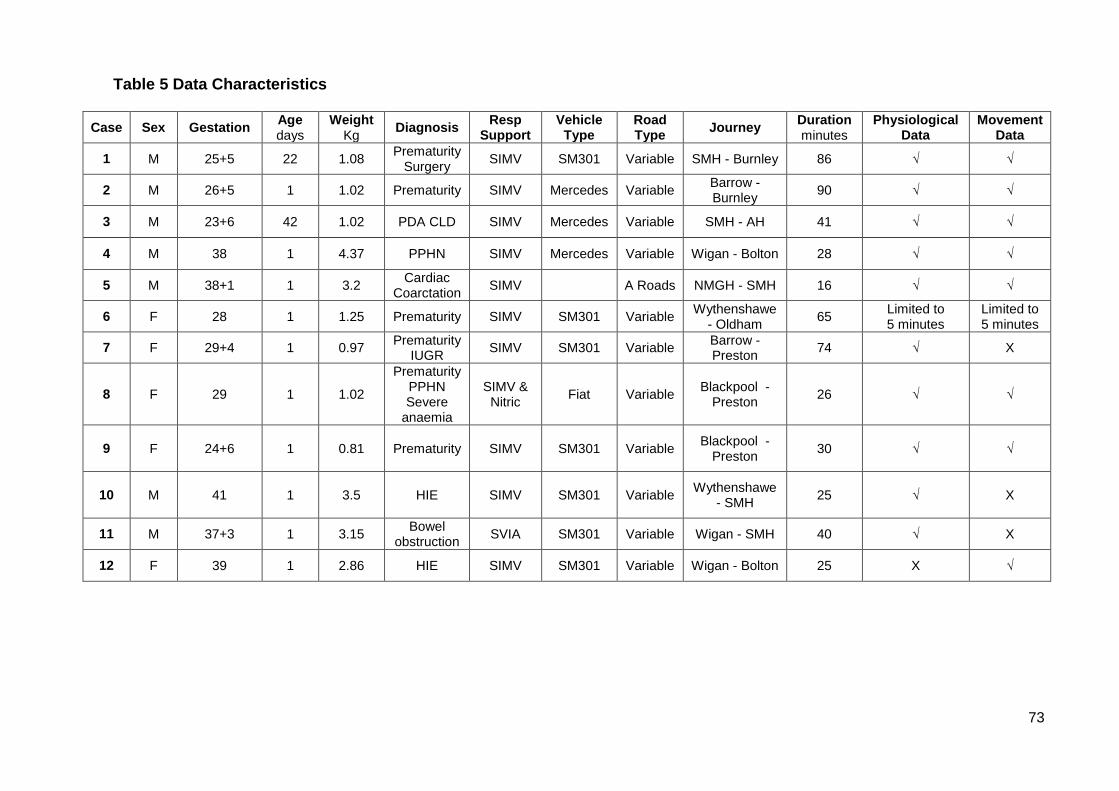
73
Table 5 Data Characteristics
Case Sex Gestation Age days
Weight Kg
Diagnosis Resp
Support Vehicle
Type Road Type
Journey Duration minutes
Physiological Data
Movement Data
1 M 25+5 22 1.08 Prematurity
Surgery SIMV SM301 Variable SMH - Burnley 86 √ √
2 M 26+5 1 1.02 Prematurity SIMV Mercedes Variable Barrow - Burnley
90 √ √
3 M 23+6 42 1.02 PDA CLD SIMV Mercedes Variable SMH - AH 41 √ √
4 M 38 1 4.37 PPHN SIMV Mercedes Variable Wigan - Bolton 28 √ √
5 M 38+1 1 3.2 Cardiac
Coarctation SIMV A Roads NMGH - SMH 16 √ √
6 F 28 1 1.25 Prematurity SIMV SM301 Variable Wythenshawe
- Oldham 65
Limited to 5 minutes
Limited to 5 minutes
7 F 29+4 1 0.97 Prematurity
IUGR SIMV SM301 Variable
Barrow - Preston
74 √ X
8 F 29 1 1.02
Prematurity PPHN Severe
anaemia
SIMV & Nitric
Fiat Variable Blackpool -
Preston
26
√ √
9 F 24+6 1 0.81 Prematurity SIMV SM301 Variable Blackpool -
Preston
30
√ √
10 M 41 1 3.5 HIE SIMV SM301 Variable Wythenshawe
- SMH
25
√ X
11 M 37+3 1 3.15 Bowel
obstruction SVIA SM301 Variable Wigan - SMH 40 √ X
12 F 39 1 2.86 HIE SIMV SM301 Variable Wigan - Bolton 25 X √

The movement data was analysed numerically using descriptive statistics and
measures of central tendency: minimum; mean; maximum; quartile 1, 2 and 3; and
standard deviation (SD).
Physiological data analysis
The physiological data was analysed numerically and graphically. Eleven of the twelve
cases were analysed for the physiological data as one case failed to record. Due to
differing diagnoses, different physiological parameters were recorded which led to
inconsistencies between the cases.

75
Figure 9: Example of movement data
0
20
40
60
80
100
0 20 40 60 80 100 120
Speed [mph]Motorway sectionOther Roads Other Roads
-0.4
-0.3
-0.2
-0.1
0
0.1
0.2
0.3
0 20 40 60 80 100 120
Long accel [g]
-0.3
-0.2
-0.1
0
0.1
0.2
0.3
0 20 40 60 80 100 120
Lat accel [g]
0
0.1
0.2
0.3
0.4
0 20 40 60 80 100 120
Vector accel [g]
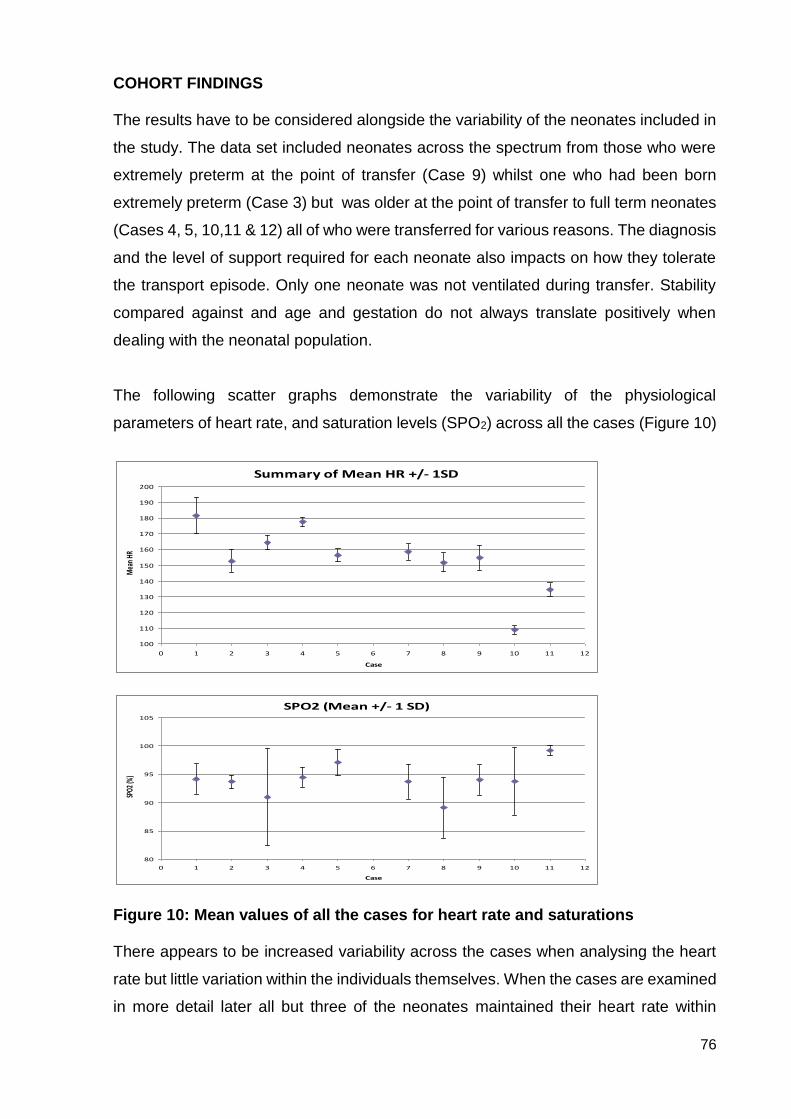
76
COHORT FINDINGS The results have to be considered alongside the variability of the neonates included in
the study. The data set included neonates across the spectrum from those who were
extremely preterm at the point of transfer (Case 9) whilst one who had been born
extremely preterm (Case 3) but was older at the point of transfer to full term neonates
(Cases 4, 5, 10,11 & 12) all of who were transferred for various reasons. The diagnosis
and the level of support required for each neonate also impacts on how they tolerate
the transport episode. Only one neonate was not ventilated during transfer. Stability
compared against and age and gestation do not always translate positively when
dealing with the neonatal population.
The following scatter graphs demonstrate the variability of the physiological
parameters of heart rate, and saturation levels (SPO2) across all the cases (Figure 10)
Figure 10: Mean values of all the cases for heart rate and saturations There appears to be increased variability across the cases when analysing the heart
rate but little variation within the individuals themselves. When the cases are examined
in more detail later all but three of the neonates maintained their heart rate within
Summary of Mean HR +/- 1SD
100
110
120
130
140
150
160
170
180
190
200
0 1 2 3 4 5 6 7 8 9 10 11 12
Case
Mea
n HR
SPO2 (Mean +/- 1 SD)
80
85
90
95
100
105
0 1 2 3 4 5 6 7 8 9 10 11 12
Case
SPO2
(%)
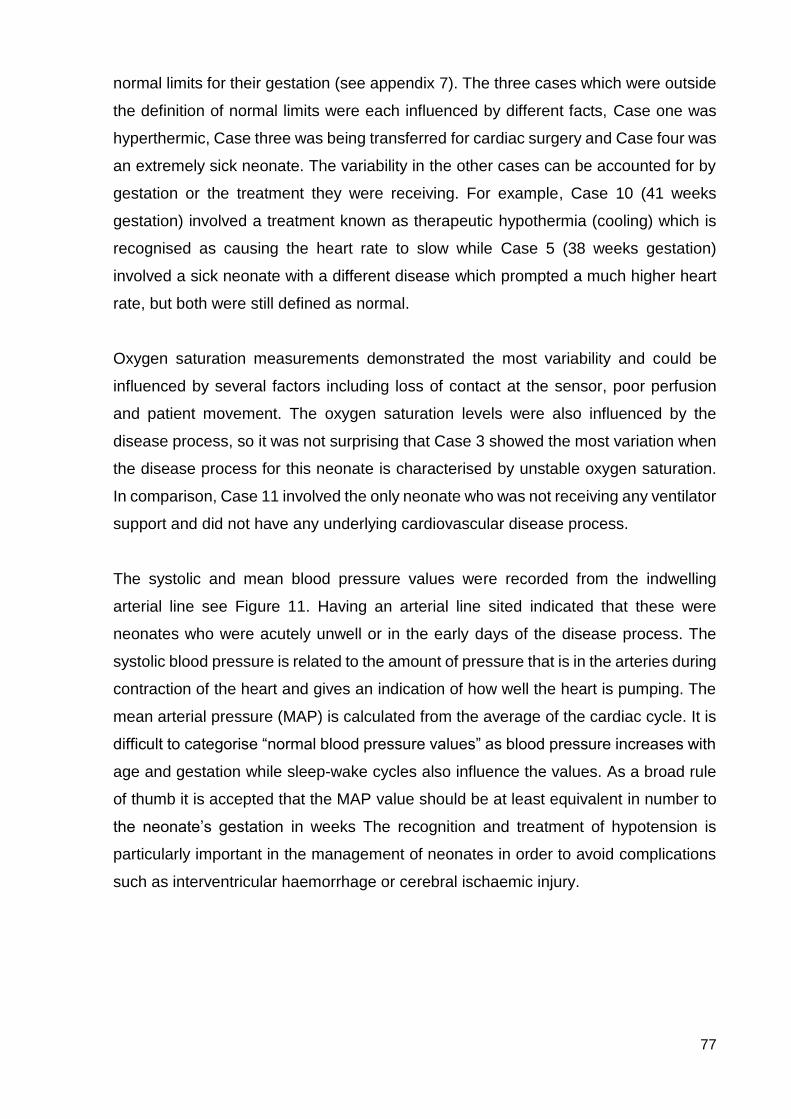
77
normal limits for their gestation (see appendix 7). The three cases which were outside
the definition of normal limits were each influenced by different facts, Case one was
hyperthermic, Case three was being transferred for cardiac surgery and Case four was
an extremely sick neonate. The variability in the other cases can be accounted for by
gestation or the treatment they were receiving. For example, Case 10 (41 weeks
gestation) involved a treatment known as therapeutic hypothermia (cooling) which is
recognised as causing the heart rate to slow while Case 5 (38 weeks gestation)
involved a sick neonate with a different disease which prompted a much higher heart
rate, but both were still defined as normal.
Oxygen saturation measurements demonstrated the most variability and could be
influenced by several factors including loss of contact at the sensor, poor perfusion
and patient movement. The oxygen saturation levels were also influenced by the
disease process, so it was not surprising that Case 3 showed the most variation when
the disease process for this neonate is characterised by unstable oxygen saturation.
In comparison, Case 11 involved the only neonate who was not receiving any ventilator
support and did not have any underlying cardiovascular disease process.
The systolic and mean blood pressure values were recorded from the indwelling
arterial line see Figure 11. Having an arterial line sited indicated that these were
neonates who were acutely unwell or in the early days of the disease process. The
systolic blood pressure is related to the amount of pressure that is in the arteries during
contraction of the heart and gives an indication of how well the heart is pumping. The
mean arterial pressure (MAP) is calculated from the average of the cardiac cycle. It is
difficult to categorise “normal blood pressure values” as blood pressure increases with
age and gestation while sleep-wake cycles also influence the values. As a broad rule
of thumb it is accepted that the MAP value should be at least equivalent in number to
the neonate’s gestation in weeks The recognition and treatment of hypotension is
particularly important in the management of neonates in order to avoid complications
such as interventricular haemorrhage or cerebral ischaemic injury.
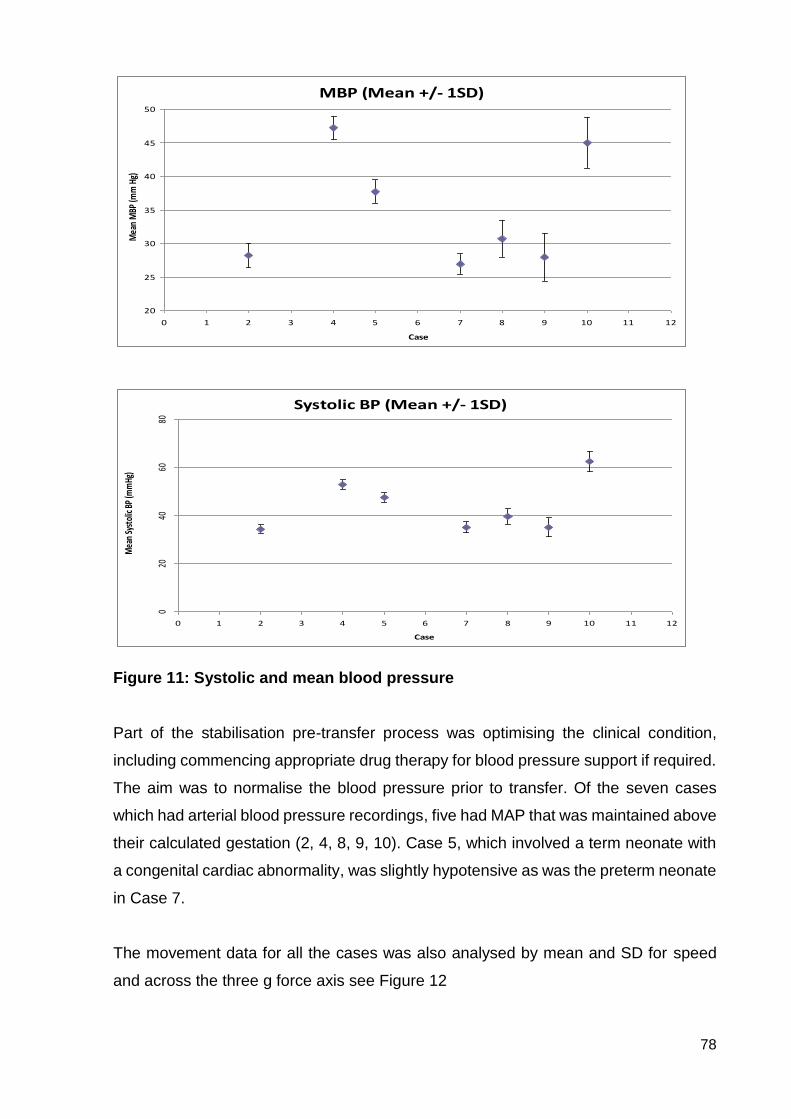
78
Figure 11: Systolic and mean blood pressure Part of the stabilisation pre-transfer process was optimising the clinical condition,
including commencing appropriate drug therapy for blood pressure support if required.
The aim was to normalise the blood pressure prior to transfer. Of the seven cases
which had arterial blood pressure recordings, five had MAP that was maintained above
their calculated gestation (2, 4, 8, 9, 10). Case 5, which involved a term neonate with
a congenital cardiac abnormality, was slightly hypotensive as was the preterm neonate
in Case 7.
The movement data for all the cases was also analysed by mean and SD for speed
and across the three g force axis see Figure 12
MBP (Mean +/- 1SD)
20
25
30
35
40
45
50
0 1 2 3 4 5 6 7 8 9 10 11 12
Case
Mea
n M
BP (m
m H
g)
Systolic BP (Mean +/- 1SD)
020
4060
80
0 1 2 3 4 5 6 7 8 9 10 11 12
Case
Mea
n Sy
stol
ic BP
(mm
Hg)
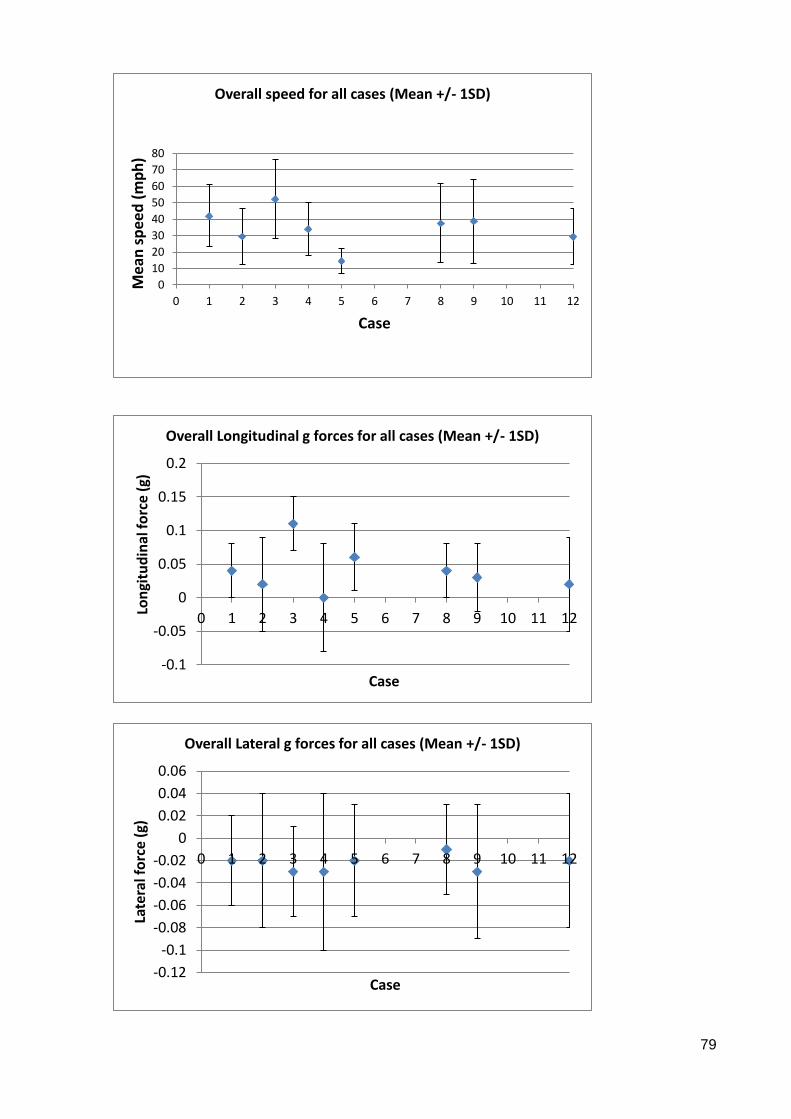
79
0
10
20
30
40
50
60
70
80
0 1 2 3 4 5 6 7 8 9 10 11 12
Me
an s
pe
ed
(m
ph
)
Case
Overall speed for all cases (Mean +/- 1SD)
-0.1
-0.05
0
0.05
0.1
0.15
0.2
0 1 2 3 4 5 6 7 8 9 10 11 12
Lon
gitu
din
al f
orc
e (
g)
Case
Overall Longitudinal g forces for all cases (Mean +/- 1SD)
-0.12
-0.1
-0.08
-0.06
-0.04
-0.02
0
0.02
0.04
0.06
0 1 2 3 4 5 6 7 8 9 10 11 12
Late
ral f
orc
e (
g)
Case
Overall Lateral g forces for all cases (Mean +/- 1SD)
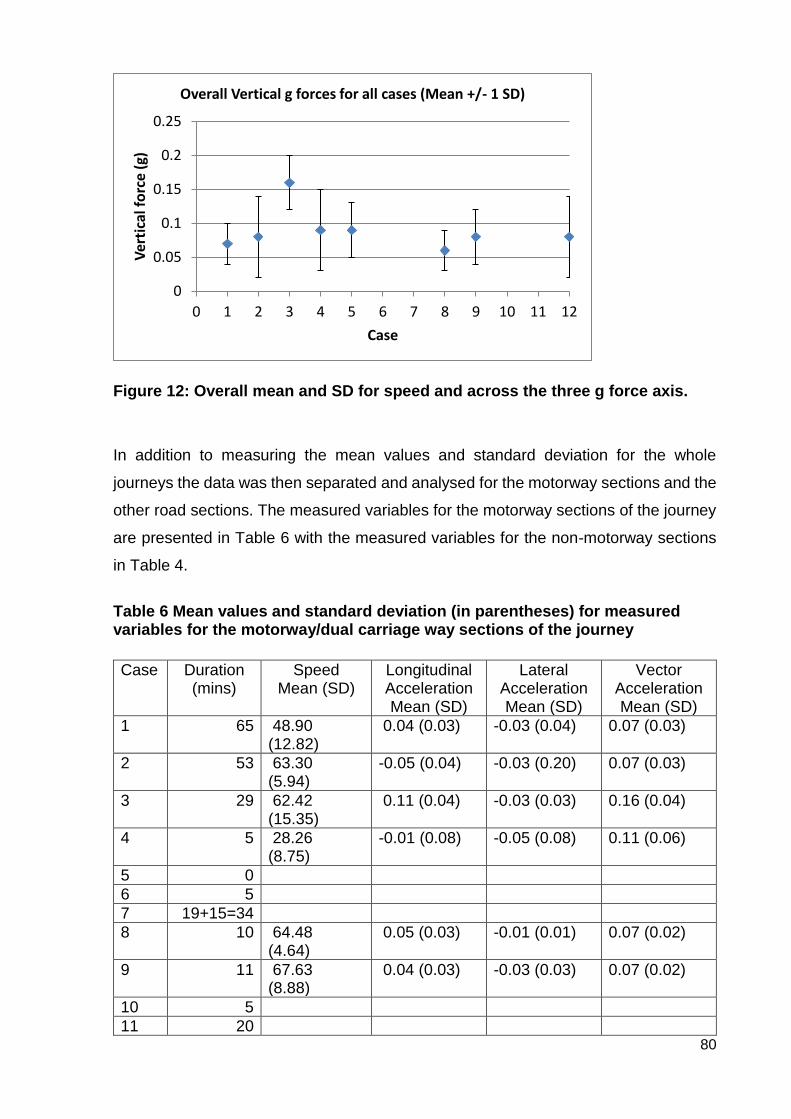
80
Figure 12: Overall mean and SD for speed and across the three g force axis.
In addition to measuring the mean values and standard deviation for the whole
journeys the data was then separated and analysed for the motorway sections and the
other road sections. The measured variables for the motorway sections of the journey
are presented in Table 6 with the measured variables for the non-motorway sections
in Table 4.
Table 6 Mean values and standard deviation (in parentheses) for measured variables for the motorway/dual carriage way sections of the journey
Case Duration
(mins) Speed
Mean (SD) Longitudinal Acceleration Mean (SD)
Lateral Acceleration Mean (SD)
Vector Acceleration Mean (SD)
1 65 48.90 (12.82)
0.04 (0.03) -0.03 (0.04) 0.07 (0.03)
2 53 63.30 (5.94)
-0.05 (0.04) -0.03 (0.20) 0.07 (0.03)
3 29 62.42 (15.35)
0.11 (0.04) -0.03 (0.03) 0.16 (0.04)
4 5 28.26 (8.75)
-0.01 (0.08) -0.05 (0.08) 0.11 (0.06)
5 0
6 5
7 19+15=34
8 10 64.48 (4.64)
0.05 (0.03) -0.01 (0.01) 0.07 (0.02)
9 11 67.63 (8.88)
0.04 (0.03) -0.03 (0.03) 0.07 (0.02)
10 5
11 20
0
0.05
0.1
0.15
0.2
0.25
0 1 2 3 4 5 6 7 8 9 10 11 12
Ver
tica
l fo
rce
(g)
Case
Overall Vertical g forces for all cases (Mean +/- 1 SD)
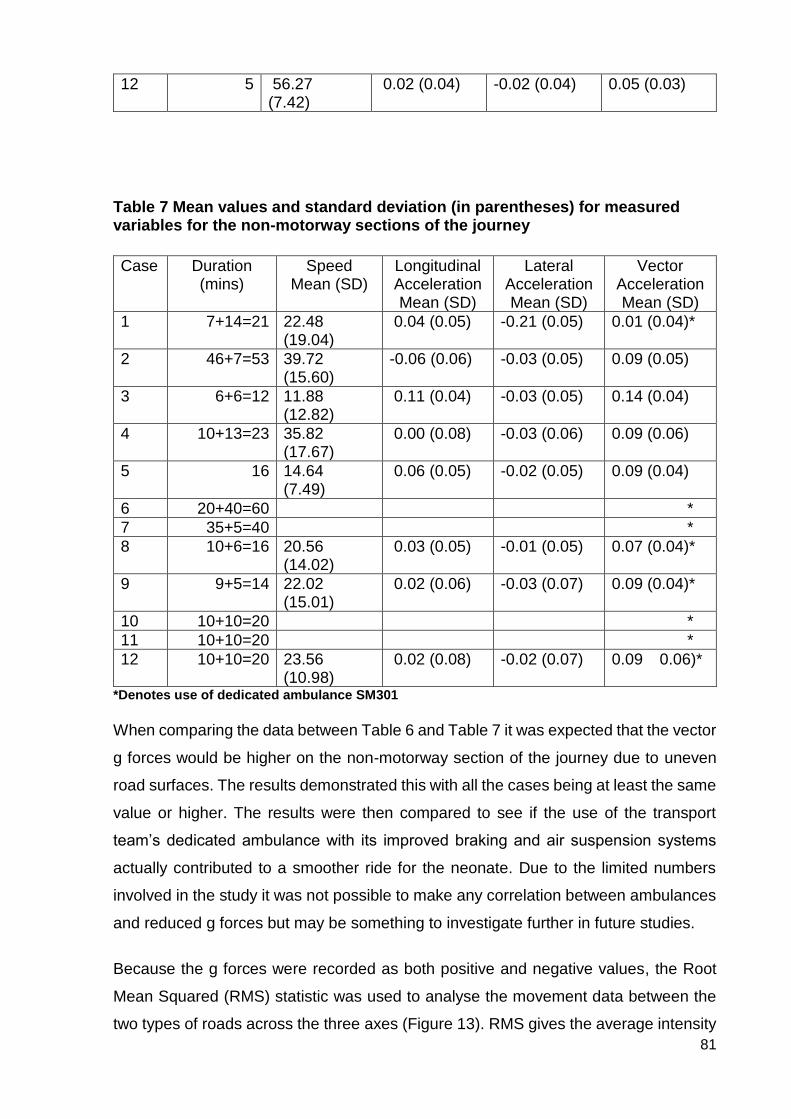
81
12 5 56.27 (7.42)
0.02 (0.04) -0.02 (0.04) 0.05 (0.03)
Table 7 Mean values and standard deviation (in parentheses) for measured variables for the non-motorway sections of the journey
Case Duration
(mins) Speed
Mean (SD) Longitudinal Acceleration Mean (SD)
Lateral Acceleration Mean (SD)
Vector Acceleration Mean (SD)
1 7+14=21 22.48 (19.04)
0.04 (0.05) -0.21 (0.05) 0.01 (0.04)*
2 46+7=53 39.72 (15.60)
-0.06 (0.06) -0.03 (0.05) 0.09 (0.05)
3 6+6=12 11.88 (12.82)
0.11 (0.04) -0.03 (0.05) 0.14 (0.04)
4 10+13=23 35.82 (17.67)
0.00 (0.08) -0.03 (0.06) 0.09 (0.06)
5 16 14.64 (7.49)
0.06 (0.05) -0.02 (0.05) 0.09 (0.04)
6 20+40=60 *
7 35+5=40 *
8 10+6=16 20.56 (14.02)
0.03 (0.05) -0.01 (0.05) 0.07 (0.04)*
9 9+5=14 22.02 (15.01)
0.02 (0.06) -0.03 (0.07) 0.09 (0.04)*
10 10+10=20 *
11 10+10=20 *
12 10+10=20 23.56 (10.98)
0.02 (0.08) -0.02 (0.07) 0.09 0.06)*
*Denotes use of dedicated ambulance SM301
When comparing the data between Table 6 and Table 7 it was expected that the vector
g forces would be higher on the non-motorway section of the journey due to uneven
road surfaces. The results demonstrated this with all the cases being at least the same
value or higher. The results were then compared to see if the use of the transport
team’s dedicated ambulance with its improved braking and air suspension systems
actually contributed to a smoother ride for the neonate. Due to the limited numbers
involved in the study it was not possible to make any correlation between ambulances
and reduced g forces but may be something to investigate further in future studies.
Because the g forces were recorded as both positive and negative values, the Root
Mean Squared (RMS) statistic was used to analyse the movement data between the
two types of roads across the three axes (Figure 13). RMS gives the average intensity
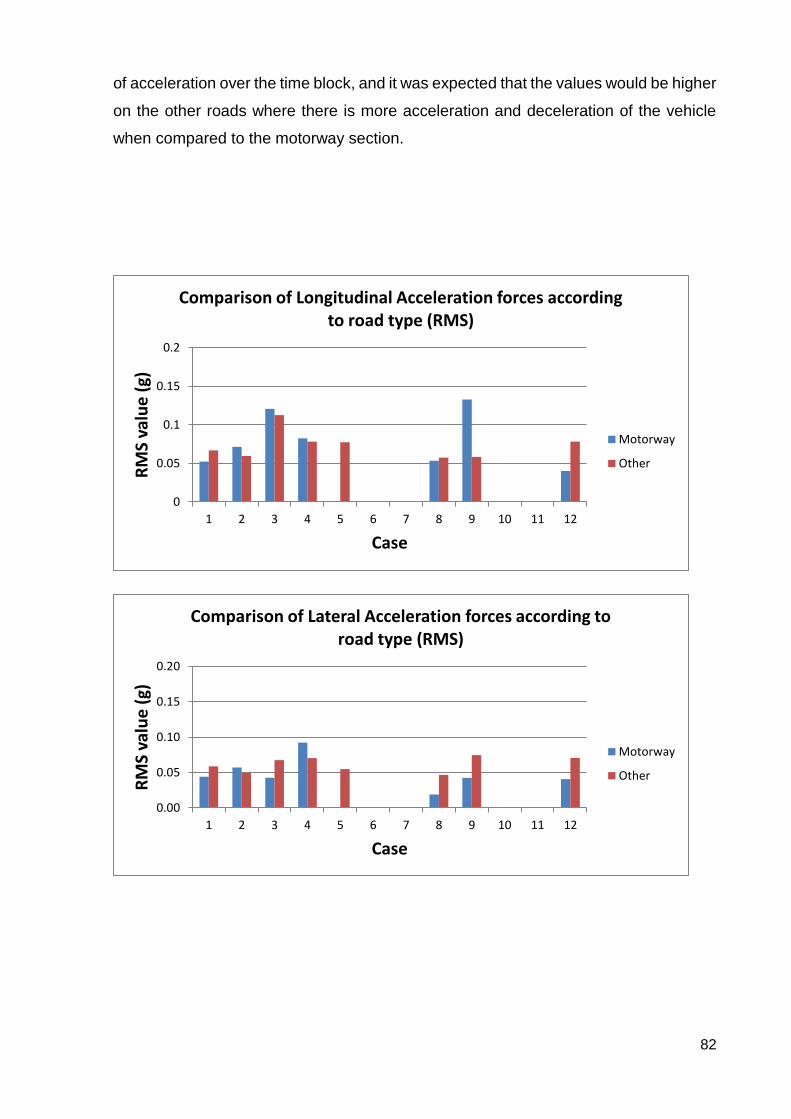
82
of acceleration over the time block, and it was expected that the values would be higher
on the other roads where there is more acceleration and deceleration of the vehicle
when compared to the motorway section.
0
0.05
0.1
0.15
0.2
1 2 3 4 5 6 7 8 9 10 11 12
RM
S va
lue
(g)
Case
Comparison of Longitudinal Acceleration forces according to road type (RMS)
Motorway
Other
0.00
0.05
0.10
0.15
0.20
1 2 3 4 5 6 7 8 9 10 11 12
RM
S va
lue
(g)
Case
Comparison of Lateral Acceleration forces according to road type (RMS)
Motorway
Other

83
Figure 13: Analysis of movement data in longitudinal, lateral and vertical forces according to road types The data showed that it was not only on the “other roads” where significant forces were
being generated. Case 3, particularly, demonstrated higher g forces in both the vertical
and longitudinal axis on the motorway. Cases 8 and 9 were exactly the same journey,
and although the data was similar across the vertical and lateral axis, the longitudinal
data was notably different. When considering the average speed for both these
journeys in Tables 6 and 7 there was no significant difference. It is difficult to say what
made the difference between these two journeys. It may have been driver style with
more aggressive acceleration onto the motorway and sharper braking leaving the
motorway, but the two journeys also used different ambulances: Case 8 completed in
a NWAS Fiat, and Case 9 in the dedicated SM301 vehicle.
0.00
0.05
0.10
0.15
0.20
1 2 3 4 5 6 7 8 9 10 11 12
RM
S va
lue
(g)
Case
Comparison of Vertical Acceleration forces according to road type (RMS)
Motorway
Other
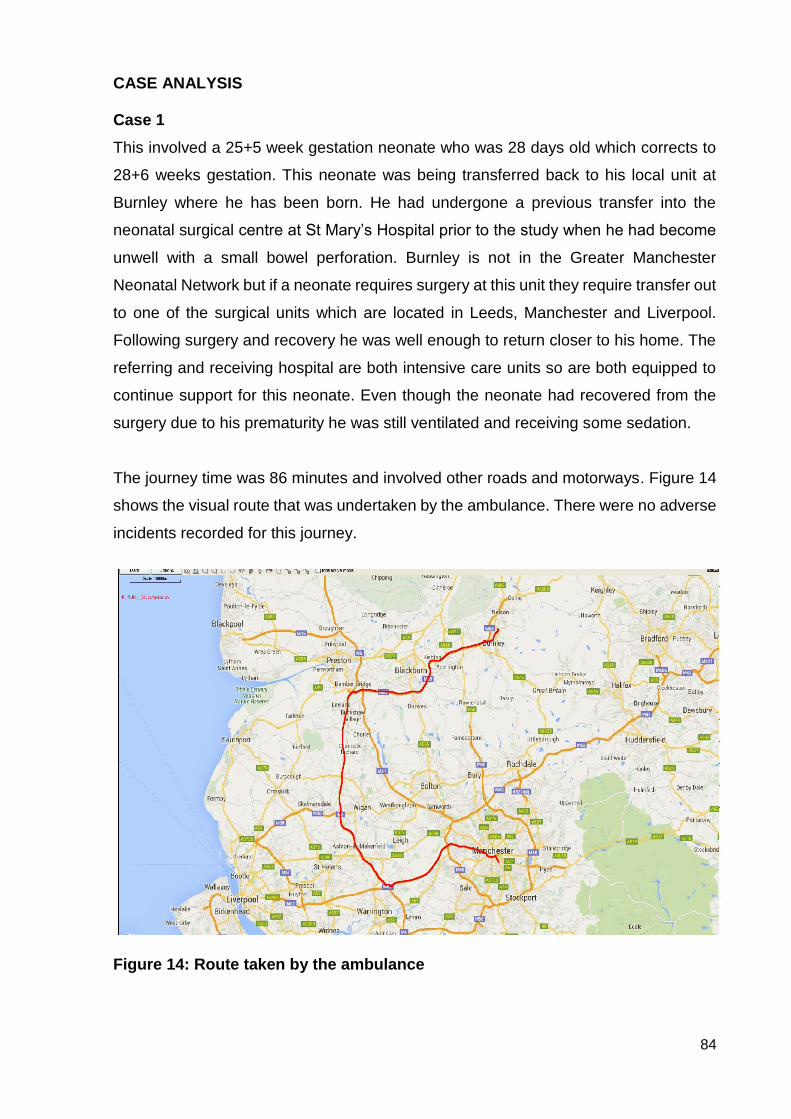
84
CASE ANALYSIS Case 1
This involved a 25+5 week gestation neonate who was 28 days old which corrects to
28+6 weeks gestation. This neonate was being transferred back to his local unit at
Burnley where he has been born. He had undergone a previous transfer into the
neonatal surgical centre at St Mary’s Hospital prior to the study when he had become
unwell with a small bowel perforation. Burnley is not in the Greater Manchester
Neonatal Network but if a neonate requires surgery at this unit they require transfer out
to one of the surgical units which are located in Leeds, Manchester and Liverpool.
Following surgery and recovery he was well enough to return closer to his home. The
referring and receiving hospital are both intensive care units so are both equipped to
continue support for this neonate. Even though the neonate had recovered from the
surgery due to his prematurity he was still ventilated and receiving some sedation.
The journey time was 86 minutes and involved other roads and motorways. Figure 14
shows the visual route that was undertaken by the ambulance. There were no adverse
incidents recorded for this journey.
Figure 14: Route taken by the ambulance
85
Figure 15 shows the speed during the transfer and demonstrates the acceleration and
deceleration as the ambulance joins and then leaves the motorway and at various
points throughout the journey. There are various routes from St Mary’s hospital to the
neonatal unit at Burnley Hospital but the team do not have any input into which route
should be taken This route is not one normally used and appears to be a circuitous
longer route, it may have been dictated by traffic conditions or road closures but
nothing was documented to explain it. The graph demonstrates a sudden deceleration
midpoint through the motorway section. Unfortunately there is no accompanying note
to explain this deceleration but on the route taken there are several junctions and
roundabouts where the speed of the ambulance can be affected.
The speed data was analysed to compare the speeds between the two types of road.
The average speed of the ambulance travelling on the other roads at the beginning
and end of the journey was 16.5 miles per hour. The motorway section of the journey
was completed at an average of 50.8 miles per hour with a maximum speed of
68.49mph.
As explained above, this neonate was a slightly older, clinically stable neonate who
was recovering from surgery several weeks earlier. He was ventilated but was
recovering, and was approaching extubation onto a less intensive form of respiratory
support. He was transferred while being ventilated with the plan to extubate at the
receiving unit. Due to his improving condition his blood pressure was not monitored
invasively and he did not have an arterial line sited. His heart rate, blood pressure and
oxygen saturation were all recorded throughout the journey as can be seen in Figure
15.

86
Figure 15: Physiological recordings of heart rate and oxygen saturation
Although there was no invasive monitoring of blood pressure in this case and the
neonate was considered to be clinically stable which is reinforced by a mean saturation
of 94.2% (normal range 87-100%) and a mean respiratory rate of 47 respirations per
minute (rpm) (normal range 20-90rpm) (see appendix 7 for normal values). In relation
to the points of acceleration and deceleration including the sudden deceleration during
the motorway section there was no apparent impact on the physiological variables
being monitored. On first analysis of the data it was identified that the heart rate of this
neonate significantly increased over the course of the journey with an associated rise
in oxygen saturation from 90% to 100%. It is interesting to note that the heart rate
increased significantly from the beginning of the journey when it was 153 beats per
minute (bpm) to 201 bpm (normal range 90-200 bpm) on completion of the journey. It
was suggested that this might be a stress response to the length of the journey. On
further in-depth analysis it was recognised that this neonate’s temperature had in fact
increased by 1ºC over the course of the journey, and it was more likely that the heart
150160170180190200
0 10 20 30 40 50 60 70 80 90 100He
art
Rat
e (
bp
m)
Duration (Mins)
HR
80
85
90
95
100
0 10 20 30 40 50 60 70 80 90 100
Satu
rati
on
(%
)
Duration (Mins)
SpO2

87
rate increased in response to an increasing temperature: a normal physiological
response.
This neonate was described as being stable in relation to physiological aspects and
underwent a transfer that did not change this stability. By using box and whisker plots
it was possible to see if this translated when the recordings were plotted against the
road types (Figure 16). The box plot for the heart rate variability overall shows the
distribution of values across the whole journey and confirms that there was a general
increase in the values. The box plot for the other roads shows a wider variability but
this can be explained by the values being significantly lower at the start of the journey
on the other roads and at a maximum at the end of the journey which again was
completed on other roads. This could be misleading if interpreted as the road
conditions being the variable that was impacting on the values.
The box plot representing the oxygen saturation plotted against the road types were a
more accurate interpretation of the neonates’ clinical condition during the journey.
There was little variance between the three boxes and the median remained the same
across all three boxes.
As well as speed, movement data also involved the recording of longitudinal, lateral
and vector acceleration forces (Figure 17).The longitudinal acceleration value was
recorded in units of g. A positive value indicated that the vehicle was accelerating
forwards and a negative value indicated that the vehicle was slowing down. The lateral
acceleration value showed how much cornering force the vehicle was generating,
negative values for turning left and positive values for turning right. The vector forces
indicated the up and down movement that was experienced during the journey.
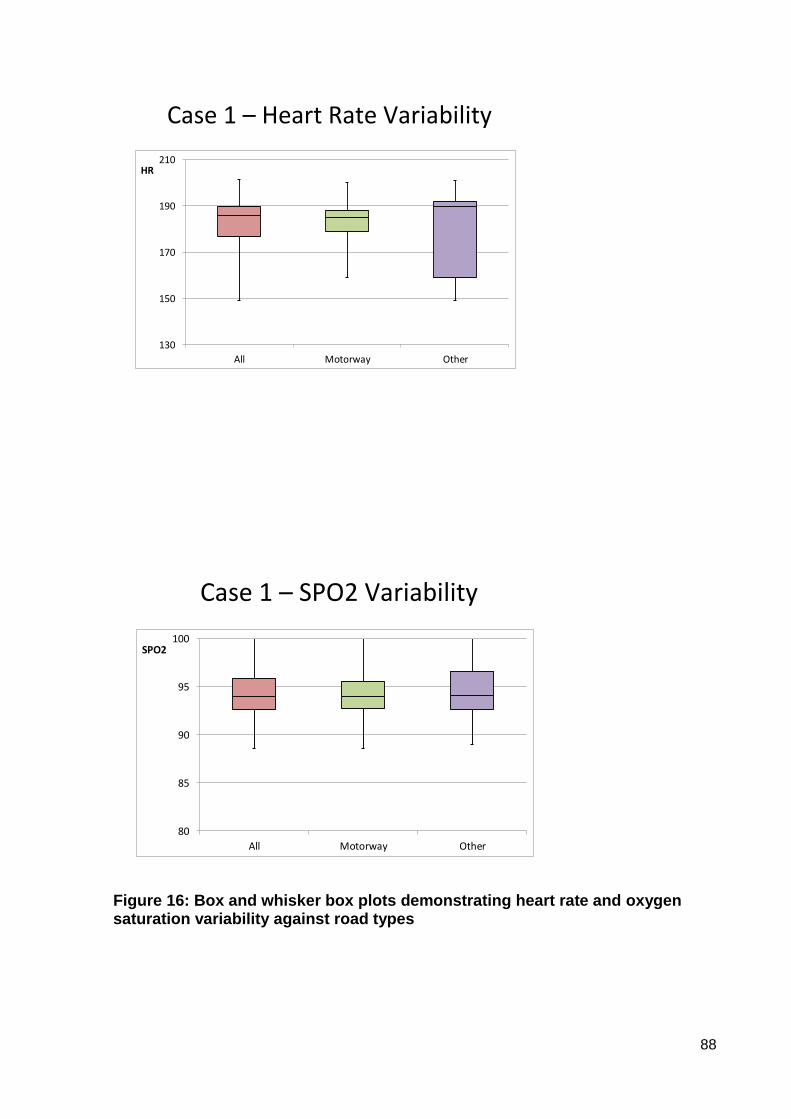
88
Case 1 – Heart Rate Variability
130
150
170
190
210
All Motorway Other
HR
Case 1 – SPO2 Variability
80
85
90
95
100
All Motorway Other
SPO2
Figure 16: Box and whisker box plots demonstrating heart rate and oxygen saturation variability against road types

89
Figure 17: Movement data including speed, longitudinal, lateral and vector g forces
0.00
20.00
40.00
60.00
80.00
0 10 20 30 40 50 60 70 80 90 100
Speed [mph]Motorway Section
-0.3
-0.2
-0.1
0
0.1
0.2
0.3
0.4
0 10 20 30 40 50 60 70 80 90 100
Long accel [g]
-0.30
-0.20
-0.10
0.00
0.10
0.20
0.30
0 10 20 30 40 50 60 70 80 90 100
Lat accel [g]
0.00
0.10
0.20
0.30
0.40
0 10 20 30 40 50 60 70 80 90 100
Vector accel [g]

90
From the movement data it is possible to see that there were less acceleration forces
during the motorway section of the journey. There was more variation in all the axes
at the beginning and end of the journey where there was more cornering, acceleration
and deceleration. In all the axes it is possible to identify where there was a sudden
deceleration at 58 minutes. Even though there was a significant difference in the
speeds that the ambulance used according to the different roads there did not appear
to be an identifiable alteration along the time scale in any particular parameter that
could be correlated directly to the acceleration, deceleration or speed of the
ambulance.
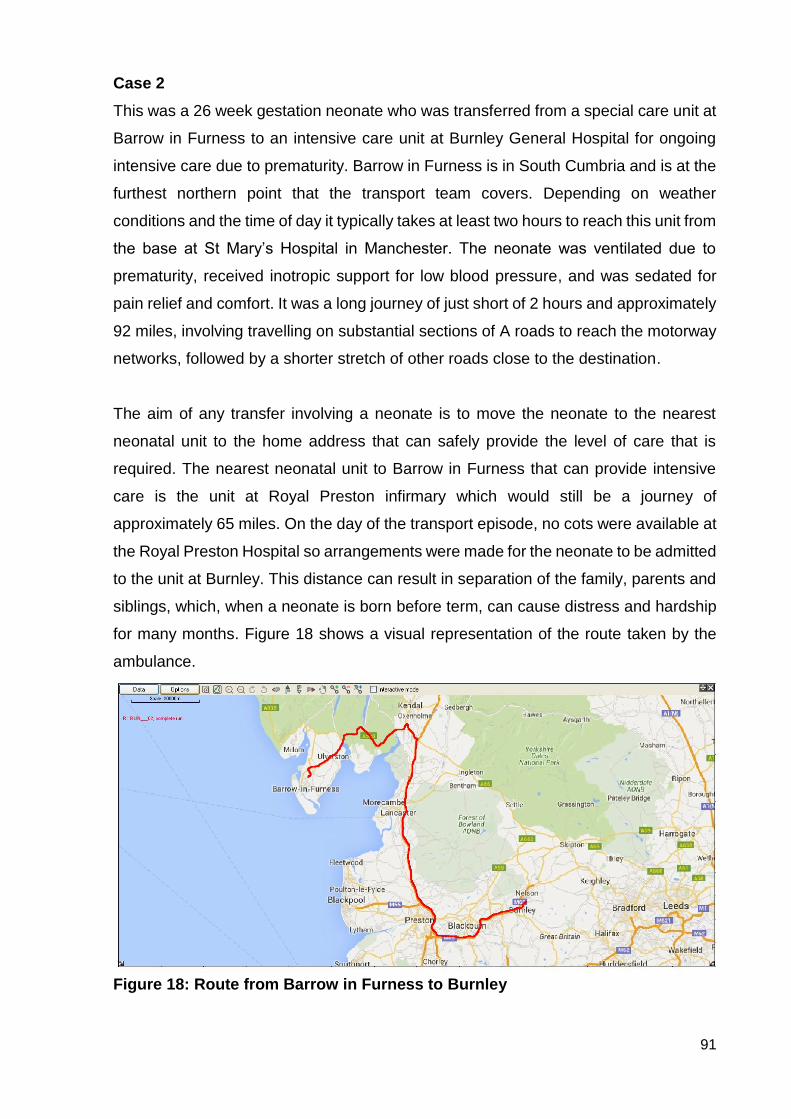
91
Case 2
This was a 26 week gestation neonate who was transferred from a special care unit at
Barrow in Furness to an intensive care unit at Burnley General Hospital for ongoing
intensive care due to prematurity. Barrow in Furness is in South Cumbria and is at the
furthest northern point that the transport team covers. Depending on weather
conditions and the time of day it typically takes at least two hours to reach this unit from
the base at St Mary’s Hospital in Manchester. The neonate was ventilated due to
prematurity, received inotropic support for low blood pressure, and was sedated for
pain relief and comfort. It was a long journey of just short of 2 hours and approximately
92 miles, involving travelling on substantial sections of A roads to reach the motorway
networks, followed by a shorter stretch of other roads close to the destination.
The aim of any transfer involving a neonate is to move the neonate to the nearest
neonatal unit to the home address that can safely provide the level of care that is
required. The nearest neonatal unit to Barrow in Furness that can provide intensive
care is the unit at Royal Preston infirmary which would still be a journey of
approximately 65 miles. On the day of the transport episode, no cots were available at
the Royal Preston Hospital so arrangements were made for the neonate to be admitted
to the unit at Burnley. This distance can result in separation of the family, parents and
siblings, which, when a neonate is born before term, can cause distress and hardship
for many months. Figure 18 shows a visual representation of the route taken by the
ambulance.
Figure 18: Route from Barrow in Furness to Burnley
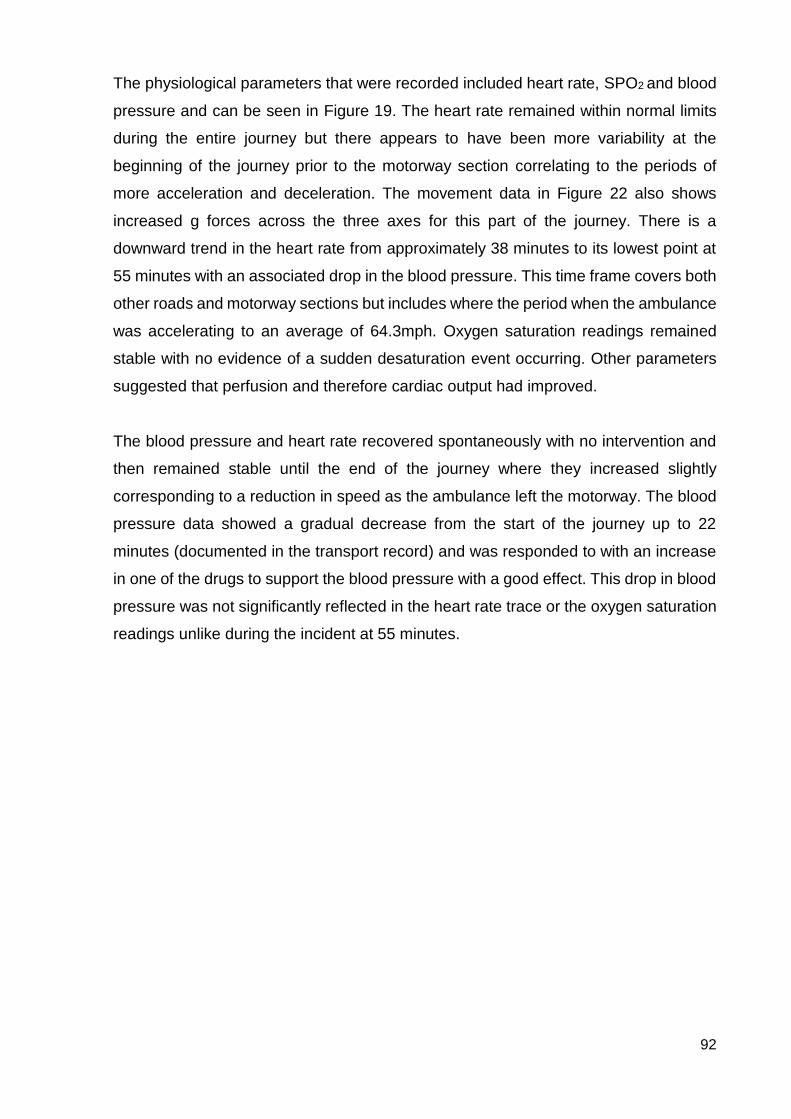
92
The physiological parameters that were recorded included heart rate, SPO2 and blood
pressure and can be seen in Figure 19. The heart rate remained within normal limits
during the entire journey but there appears to have been more variability at the
beginning of the journey prior to the motorway section correlating to the periods of
more acceleration and deceleration. The movement data in Figure 22 also shows
increased g forces across the three axes for this part of the journey. There is a
downward trend in the heart rate from approximately 38 minutes to its lowest point at
55 minutes with an associated drop in the blood pressure. This time frame covers both
other roads and motorway sections but includes where the period when the ambulance
was accelerating to an average of 64.3mph. Oxygen saturation readings remained
stable with no evidence of a sudden desaturation event occurring. Other parameters
suggested that perfusion and therefore cardiac output had improved.
The blood pressure and heart rate recovered spontaneously with no intervention and
then remained stable until the end of the journey where they increased slightly
corresponding to a reduction in speed as the ambulance left the motorway. The blood
pressure data showed a gradual decrease from the start of the journey up to 22
minutes (documented in the transport record) and was responded to with an increase
in one of the drugs to support the blood pressure with a good effect. This drop in blood
pressure was not significantly reflected in the heart rate trace or the oxygen saturation
readings unlike during the incident at 55 minutes.
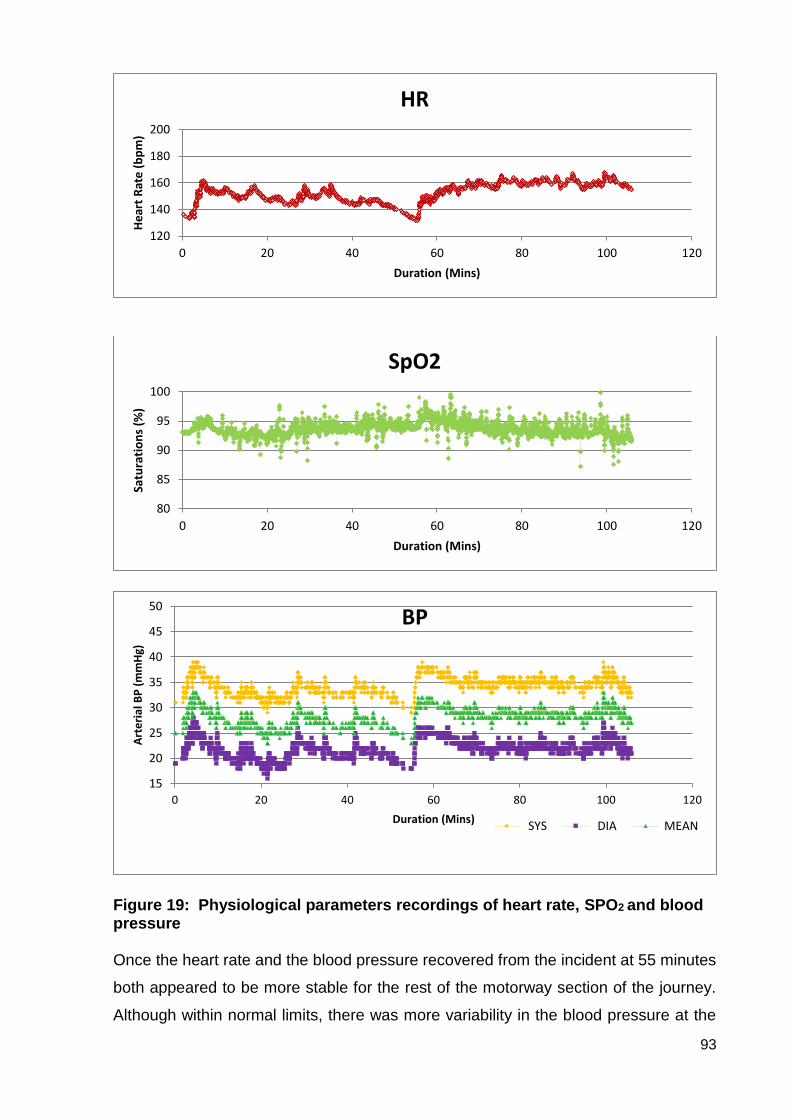
93
Figure 19: Physiological parameters recordings of heart rate, SPO2 and blood pressure
Once the heart rate and the blood pressure recovered from the incident at 55 minutes
both appeared to be more stable for the rest of the motorway section of the journey.
Although within normal limits, there was more variability in the blood pressure at the
120
140
160
180
200
0 20 40 60 80 100 120
He
art
Rat
e (b
pm
)
Duration (Mins)
HR
80
85
90
95
100
0 20 40 60 80 100 120
Satu
rati
on
s (%
)
Duration (Mins)
SpO2
15
20
25
30
35
40
45
50
0 20 40 60 80 100 120
Art
eria
l BP
(m
mH
g)
Duration (Mins)
BP
SYS DIA MEAN
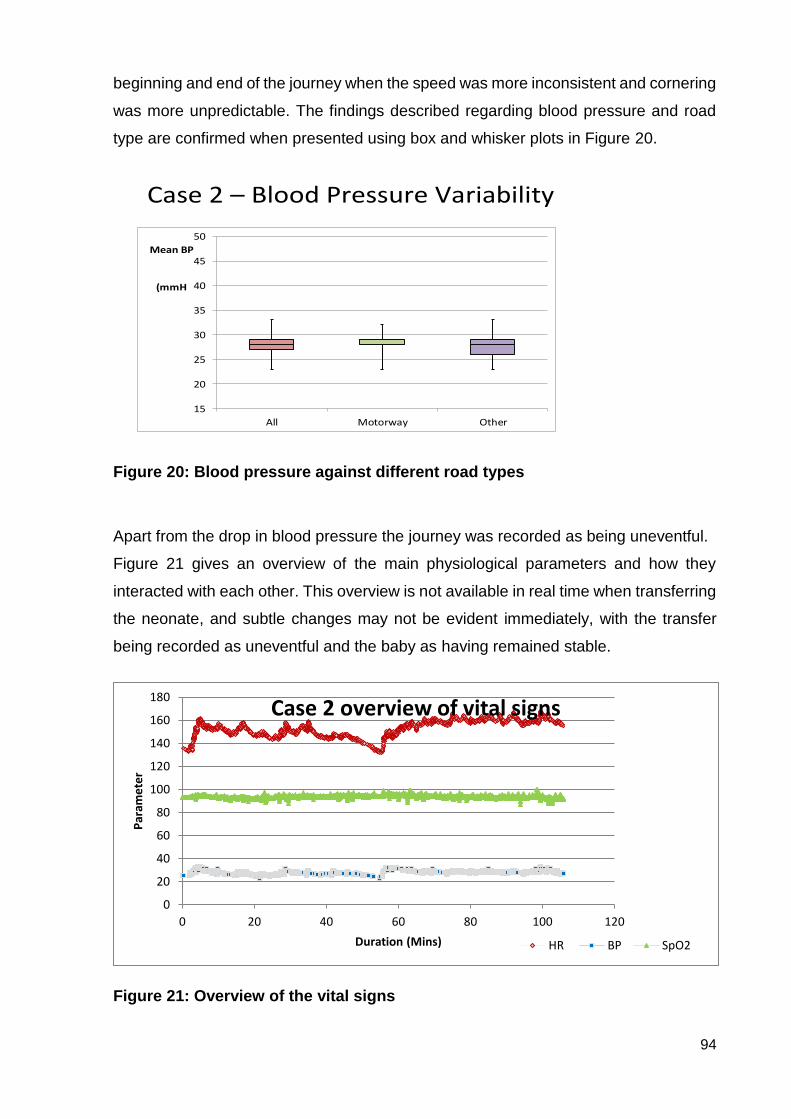
94
beginning and end of the journey when the speed was more inconsistent and cornering
was more unpredictable. The findings described regarding blood pressure and road
type are confirmed when presented using box and whisker plots in Figure 20.
Case 2 – Blood Pressure Variability
15
20
25
30
35
40
45
50
All Motorway Other
Mean BP
(mmH
Figure 20: Blood pressure against different road types
Apart from the drop in blood pressure the journey was recorded as being uneventful.
Figure 21 gives an overview of the main physiological parameters and how they
interacted with each other. This overview is not available in real time when transferring
the neonate, and subtle changes may not be evident immediately, with the transfer
being recorded as uneventful and the baby as having remained stable.
Figure 21: Overview of the vital signs
0
20
40
60
80
100
120
140
160
180
0 20 40 60 80 100 120
Par
ame
ter
Duration (Mins)
Case 2 overview of vital signs
HR BP SpO2
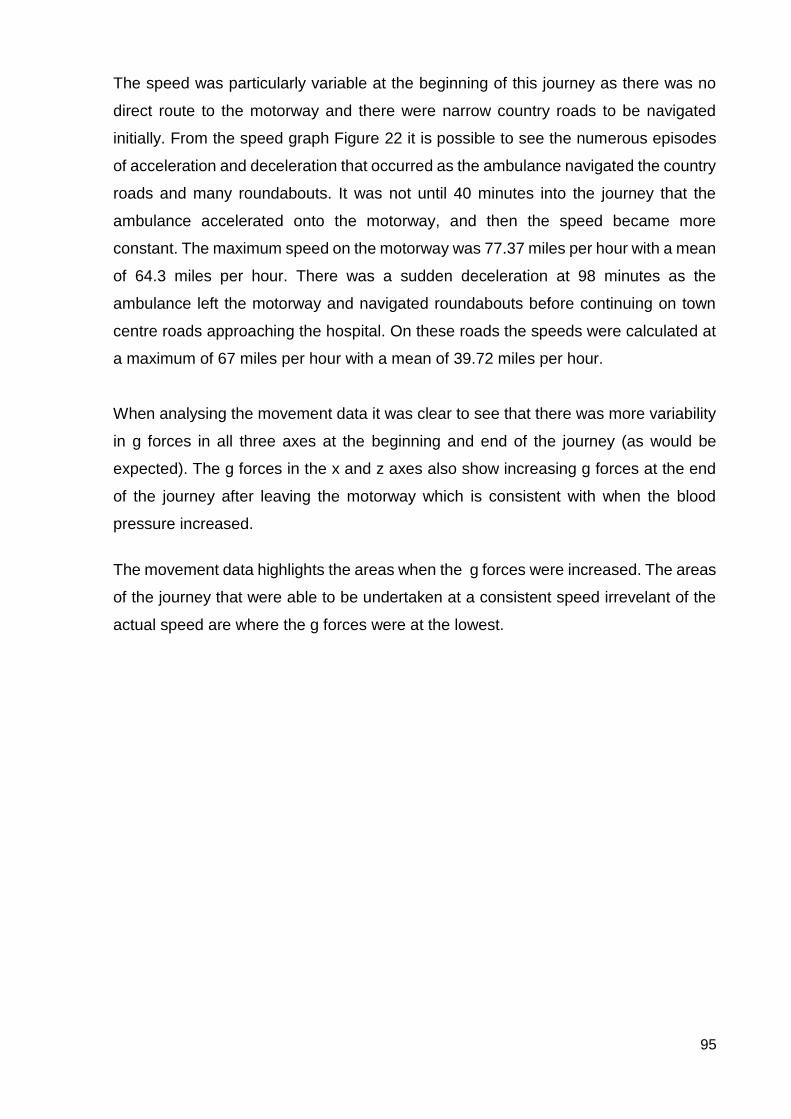
95
The speed was particularly variable at the beginning of this journey as there was no
direct route to the motorway and there were narrow country roads to be navigated
initially. From the speed graph Figure 22 it is possible to see the numerous episodes
of acceleration and deceleration that occurred as the ambulance navigated the country
roads and many roundabouts. It was not until 40 minutes into the journey that the
ambulance accelerated onto the motorway, and then the speed became more
constant. The maximum speed on the motorway was 77.37 miles per hour with a mean
of 64.3 miles per hour. There was a sudden deceleration at 98 minutes as the
ambulance left the motorway and navigated roundabouts before continuing on town
centre roads approaching the hospital. On these roads the speeds were calculated at
a maximum of 67 miles per hour with a mean of 39.72 miles per hour.
When analysing the movement data it was clear to see that there was more variability
in g forces in all three axes at the beginning and end of the journey (as would be
expected). The g forces in the x and z axes also show increasing g forces at the end
of the journey after leaving the motorway which is consistent with when the blood
pressure increased.
The movement data highlights the areas when the g forces were increased. The areas
of the journey that were able to be undertaken at a consistent speed irrevelant of the
actual speed are where the g forces were at the lowest.

96
Figure 22: Movement data: speed, longitudinal, lateral and vector g forces
0
20
40
60
80
100
0 20 40 60 80 100 120
Speed [mph]Motorway section
-0.4
-0.3
-0.2
-0.1
0
0.1
0.2
0.3
0 20 40 60 80 100 120
Long accel [g]
-0.3
-0.2
-0.1
0
0.1
0.2
0.3
0 20 40 60 80 100 120
Lat accel [g]
0
0.1
0.2
0.3
0.4
0 20 40 60 80 100 120
Vector accel [g]
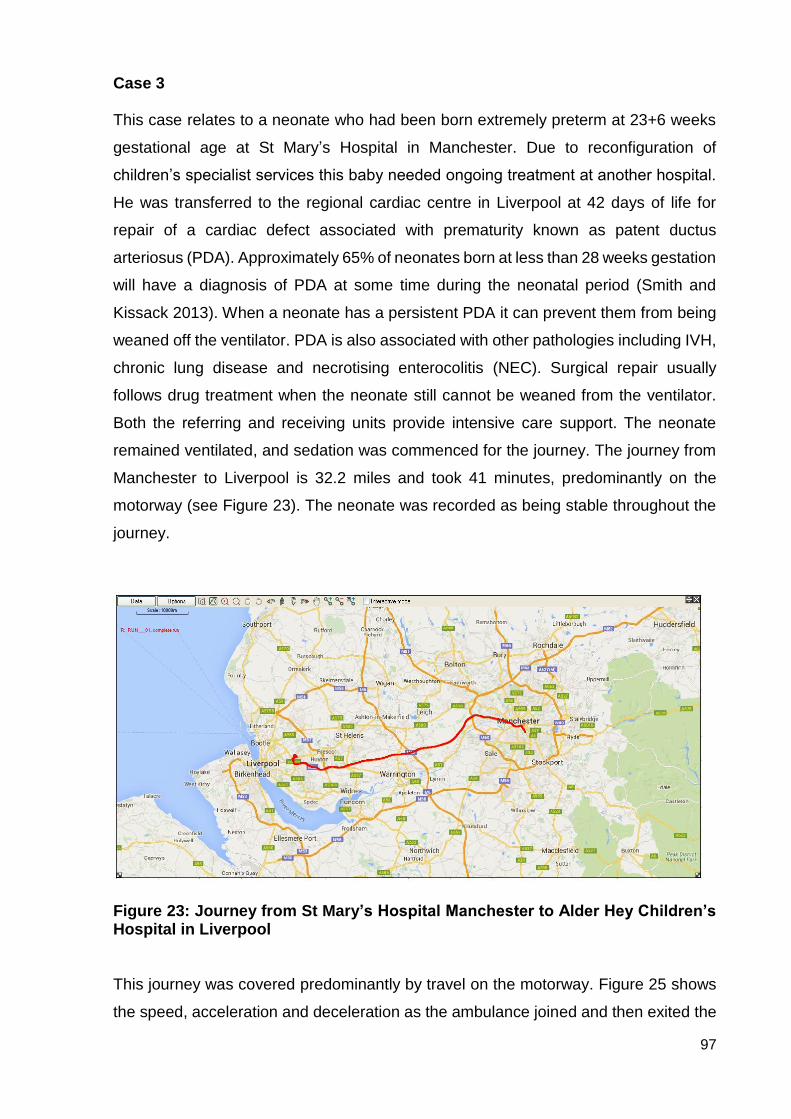
97
Case 3 This case relates to a neonate who had been born extremely preterm at 23+6 weeks
gestational age at St Mary’s Hospital in Manchester. Due to reconfiguration of
children’s specialist services this baby needed ongoing treatment at another hospital.
He was transferred to the regional cardiac centre in Liverpool at 42 days of life for
repair of a cardiac defect associated with prematurity known as patent ductus
arteriosus (PDA). Approximately 65% of neonates born at less than 28 weeks gestation
will have a diagnosis of PDA at some time during the neonatal period (Smith and
Kissack 2013). When a neonate has a persistent PDA it can prevent them from being
weaned off the ventilator. PDA is also associated with other pathologies including IVH,
chronic lung disease and necrotising enterocolitis (NEC). Surgical repair usually
follows drug treatment when the neonate still cannot be weaned from the ventilator.
Both the referring and receiving units provide intensive care support. The neonate
remained ventilated, and sedation was commenced for the journey. The journey from
Manchester to Liverpool is 32.2 miles and took 41 minutes, predominantly on the
motorway (see Figure 23). The neonate was recorded as being stable throughout the
journey.
Figure 23: Journey from St Mary’s Hospital Manchester to Alder Hey Children’s Hospital in Liverpool
This journey was covered predominantly by travel on the motorway. Figure 25 shows
the speed, acceleration and deceleration as the ambulance joined and then exited the
98
motorway. The average speed of the motorway journey was 62.42 miles per hour, with
a non-motorway average speed of 11.88 miles per hour.
Physiological parameters of heart rate and oxygen saturation were recorded during the
journey (Figure 24). No arterial blood pressure monitoring was possible due to the
neonate’s clinical condition not warranting such invasive monitoring. It is not unusual
for slightly older, stable neonates not to have as much invasive monitoring if not
required in order to reduce the associated risks which can include thrombolisation of
arteries and limb loss. Although the neonate was described as being stable during the
journey, the continuous monitoring of the heart rate and oxygen saturation showed a
very brief bradycardia (drop in heart rate) at 29 minutes with an associated significant
desaturation starting at 29 minutes and taking until 31 minutes to recover. This
variation in oxygen saturation is common in neonates with a PDA. It is associated with
abnormal blood flow across the heart, with oxygenated blood flowing back into the
lungs. PDA does not, however, normally involve episodes of bradycardia, and it was
probably the profound hypoxia from the desaturation that provoked the bradycardia in
this case.
There appeared to be another profound desaturation event occurring just as the
journey ended and the recording was stopped. Without more detail prior to the journey
it is difficult to assess if these desaturation events were more profound than would
normally occur in the stable environment of the neonatal unit, or if they were
exacerbated due to potential fluid shifts (that have been documented previously)
associated with acceleration and deceleration forces.
When analysing the movement data for this journey it was noted that the baseline for
the longitudinal and vector acceleration forces is slightly off the zero baselines (Figure
25). There was no manual means of calibrating the system, but it may be that the
accelerometer had not been positioned correctly. Unfortunately, this was not identified
during the study period but would need to be investigated further for future studies.
From the readings obtained it would appear that the longitudinal and vector g forces
were consistent throughout the journey regardless of the road type. However, the
lateral g forces showed a correlation with a reduction in g forces generally with the
more constant speed and absence of sharp cornering experienced during the
motorway section of the journey. This journey was completed in the same type of
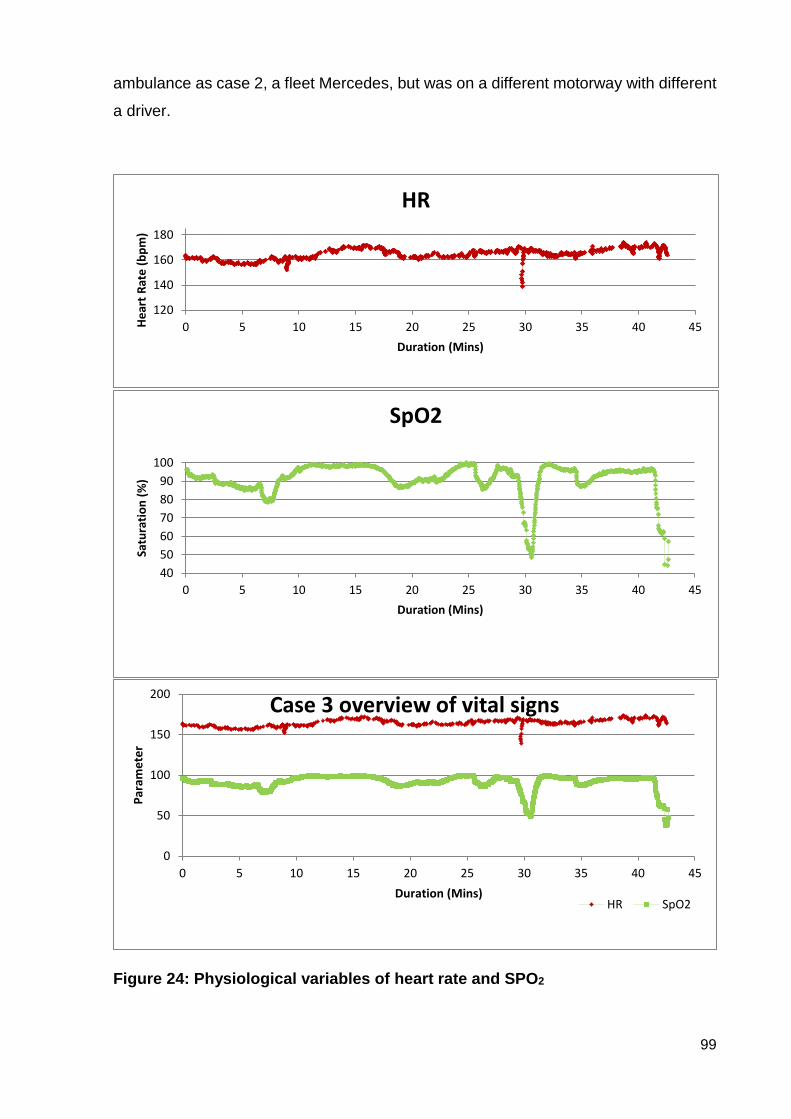
99
ambulance as case 2, a fleet Mercedes, but was on a different motorway with different
a driver.
Figure 24: Physiological variables of heart rate and SPO2
120
140
160
180
0 5 10 15 20 25 30 35 40 45He
art
Rat
e (b
pm
)
Duration (Mins)
HR
40
50
60
70
80
90
100
0 5 10 15 20 25 30 35 40 45
Satu
rati
on
(%
)
Duration (Mins)
SpO2
0
50
100
150
200
0 5 10 15 20 25 30 35 40 45
Par
ame
ter
Duration (Mins)
Case 3 overview of vital signs
HR SpO2

100
When comparing the physiological data with the movement data especially in relation
to the desaturation and bradycardia at 29 minutes there is no significant change in the
g forces in any of the axes or any sudden change in speed that may have influenced
this event. The conclusion is that this was probably a patient-issue due to “shunting”
(abnormal passage of blood between heart chambers) rather than a transport-induced
event. There is also no added documentation to explain any other external reason for
this event.
Even though it may be difficult to correlate the movement data with the physiological
data it is possible to examine the physiological variability overall with the different types
of roads. The box plots below (Figure 26) demonstrate the variability of the heart rate
and oxygen saturation, in the motorway sections and the other roads, and then
collectively.
The heart rate showed little variability across both road types, whereas the oxygen
saturation showed more variation across the motorway section than the other roads.
These findings are slightly different to those in cases 1 and 2 in which there appeared
to be more physiological stability in the motorway section. However, this neonate’s
diagnosis needs to be considered in relation to these results because even though
considered to be clinically stable he was subjected to particularly variable oxygen
saturation compared to a typical neonate of the same gestation without a PDA.

101
Figure 25: Movement data: speed, longitudinal, lateral and vector g forces
-20
0
20
40
60
80
100
0 5 10 15 20 25 30 35 40 45
Speed (mph)Motorway section
-0.2
-0.1
0
0.1
0.2
0.3
0.4
0 5 10 15 20 25 30 35 40 45
Long accel [g]
-0.2
-0.1
0
0.1
0.2
0.3
0 5 10 15 20 25 30 35 40 45
Lat accel [g]
0
0.1
0.2
0.3
0.4
0 5 10 15 20 25 30 35 40 45
Vector accel [g]
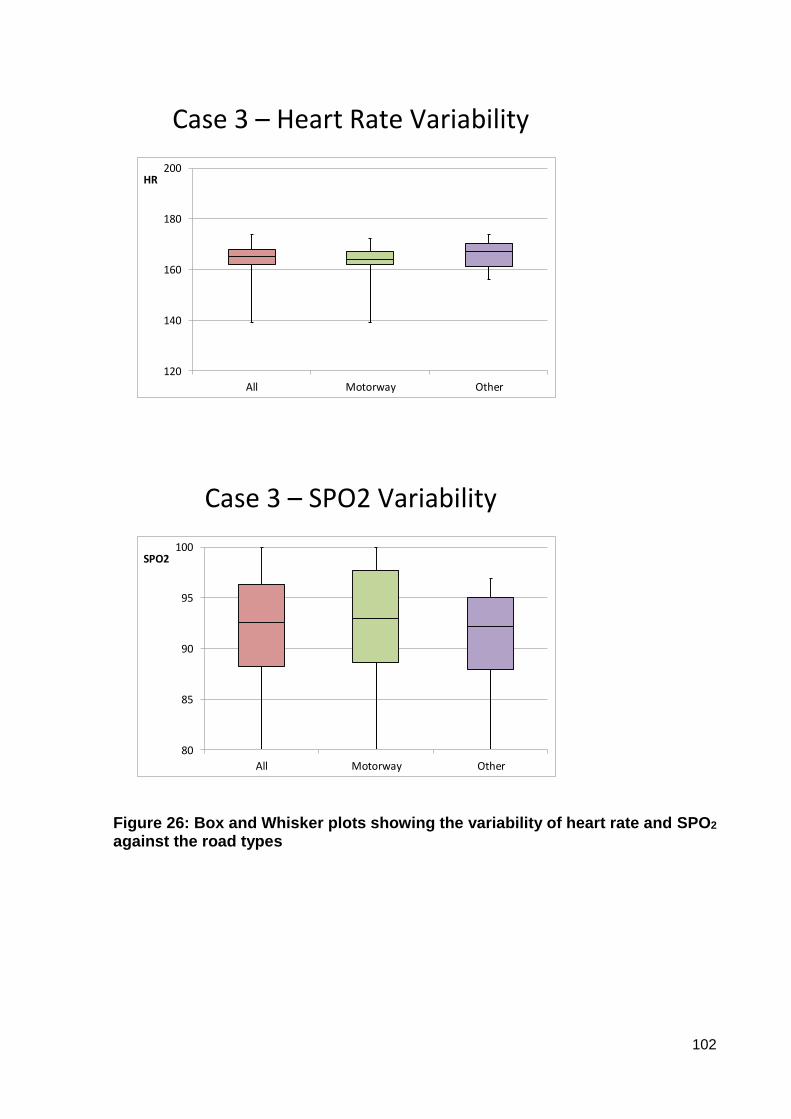
102
Case 3 – Heart Rate Variability
120
140
160
180
200
All Motorway Other
HR
Case 3 – SPO2 Variability
80
85
90
95
100
All Motorway Other
SPO2
Figure 26: Box and Whisker plots showing the variability of heart rate and SPO2
against the road types
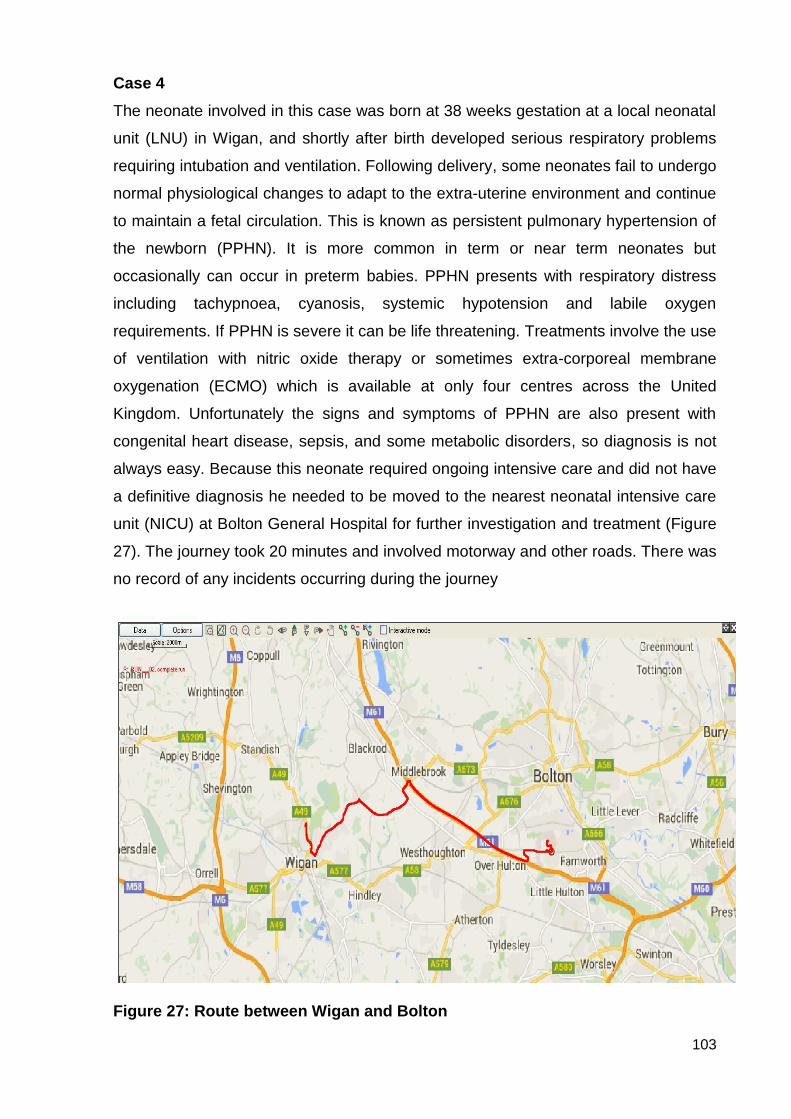
103
Case 4
The neonate involved in this case was born at 38 weeks gestation at a local neonatal
unit (LNU) in Wigan, and shortly after birth developed serious respiratory problems
requiring intubation and ventilation. Following delivery, some neonates fail to undergo
normal physiological changes to adapt to the extra-uterine environment and continue
to maintain a fetal circulation. This is known as persistent pulmonary hypertension of
the newborn (PPHN). It is more common in term or near term neonates but
occasionally can occur in preterm babies. PPHN presents with respiratory distress
including tachypnoea, cyanosis, systemic hypotension and labile oxygen
requirements. If PPHN is severe it can be life threatening. Treatments involve the use
of ventilation with nitric oxide therapy or sometimes extra-corporeal membrane
oxygenation (ECMO) which is available at only four centres across the United
Kingdom. Unfortunately the signs and symptoms of PPHN are also present with
congenital heart disease, sepsis, and some metabolic disorders, so diagnosis is not
always easy. Because this neonate required ongoing intensive care and did not have
a definitive diagnosis he needed to be moved to the nearest neonatal intensive care
unit (NICU) at Bolton General Hospital for further investigation and treatment (Figure
27). The journey took 20 minutes and involved motorway and other roads. There was
no record of any incidents occurring during the journey
Figure 27: Route between Wigan and Bolton
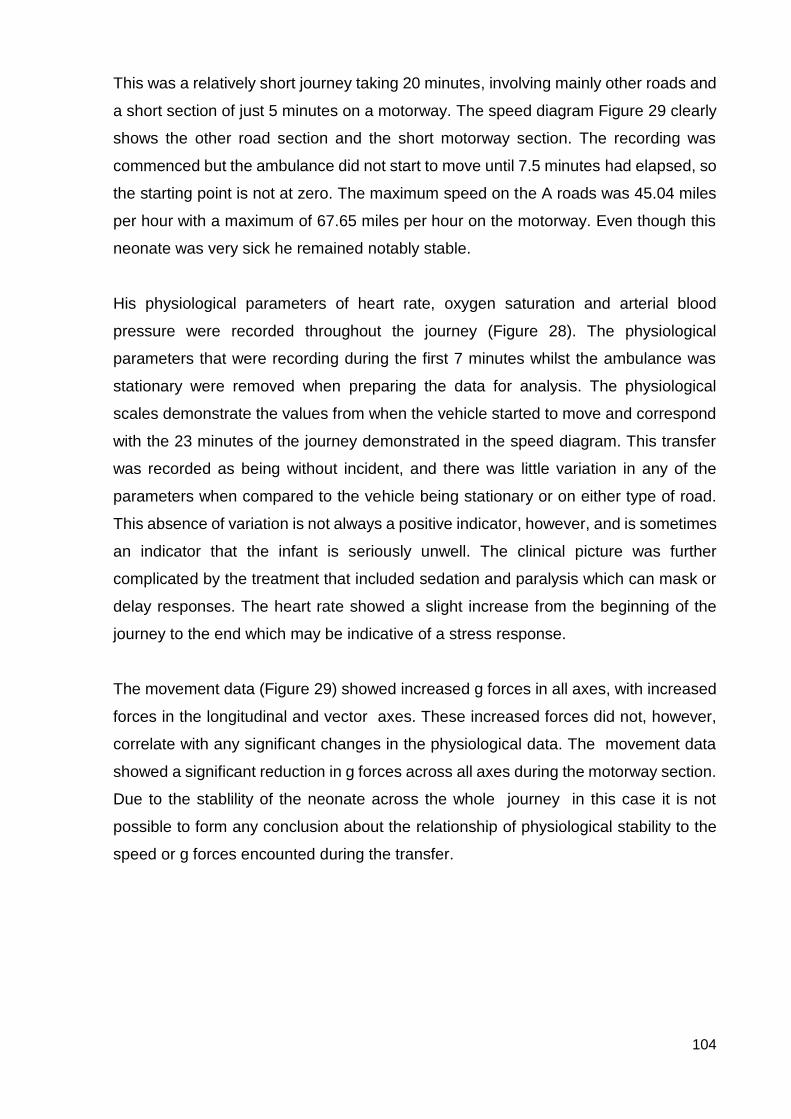
104
This was a relatively short journey taking 20 minutes, involving mainly other roads and
a short section of just 5 minutes on a motorway. The speed diagram Figure 29 clearly
shows the other road section and the short motorway section. The recording was
commenced but the ambulance did not start to move until 7.5 minutes had elapsed, so
the starting point is not at zero. The maximum speed on the A roads was 45.04 miles
per hour with a maximum of 67.65 miles per hour on the motorway. Even though this
neonate was very sick he remained notably stable.
His physiological parameters of heart rate, oxygen saturation and arterial blood
pressure were recorded throughout the journey (Figure 28). The physiological
parameters that were recording during the first 7 minutes whilst the ambulance was
stationary were removed when preparing the data for analysis. The physiological
scales demonstrate the values from when the vehicle started to move and correspond
with the 23 minutes of the journey demonstrated in the speed diagram. This transfer
was recorded as being without incident, and there was little variation in any of the
parameters when compared to the vehicle being stationary or on either type of road.
This absence of variation is not always a positive indicator, however, and is sometimes
an indicator that the infant is seriously unwell. The clinical picture was further
complicated by the treatment that included sedation and paralysis which can mask or
delay responses. The heart rate showed a slight increase from the beginning of the
journey to the end which may be indicative of a stress response.
The movement data (Figure 29) showed increased g forces in all axes, with increased
forces in the longitudinal and vector axes. These increased forces did not, however,
correlate with any significant changes in the physiological data. The movement data
showed a significant reduction in g forces across all axes during the motorway section.
Due to the stablility of the neonate across the whole journey in this case it is not
possible to form any conclusion about the relationship of physiological stability to the
speed or g forces encounted during the transfer.
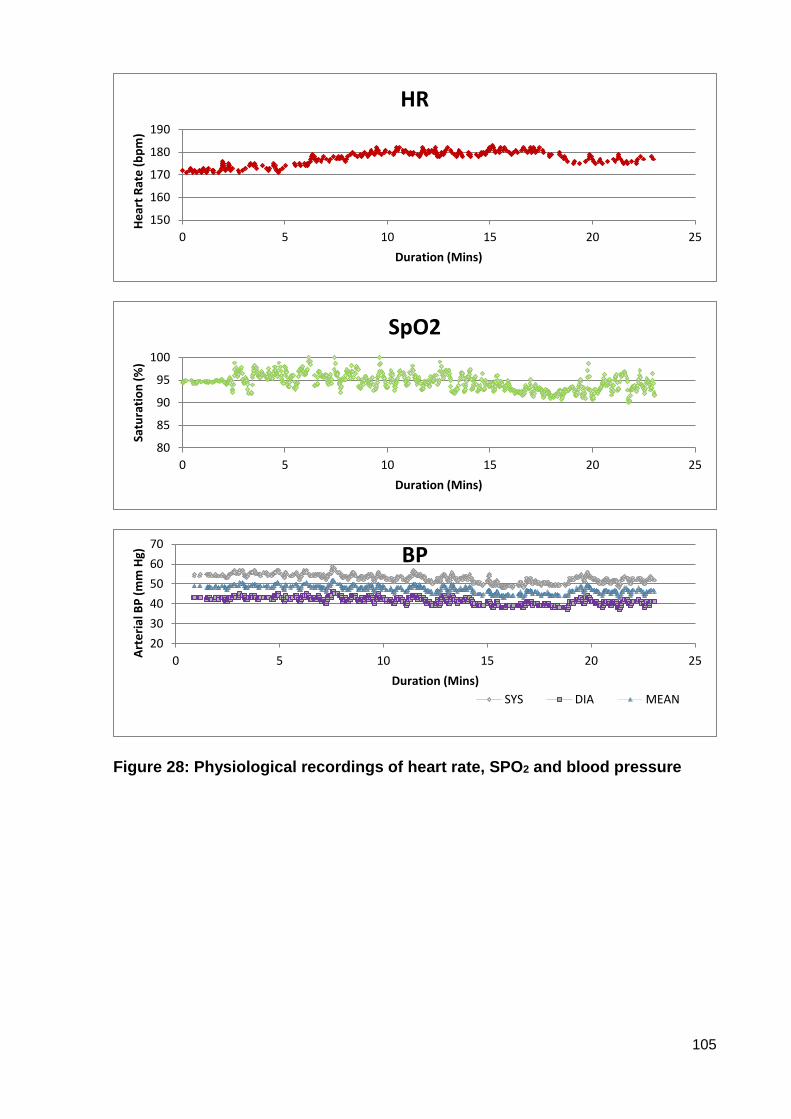
105
Figure 28: Physiological recordings of heart rate, SPO2 and blood pressure
150
160
170
180
190
0 5 10 15 20 25
He
art
Rat
e (
bp
m)
Duration (Mins)
HR
80
85
90
95
100
0 5 10 15 20 25
Satu
rati
on
(%
)
Duration (Mins)
SpO2
20
30
40
50
60
70
0 5 10 15 20 25
Art
eri
al B
P (
mm
Hg)
Duration (Mins)
BP
SYS DIA MEAN

106
Figure 29: Movement data: speed, longitudinal, lateral and vector g forces
0.00
20.00
40.00
60.00
80.00
0.00 5.00 10.00 15.00 20.00 25.00 30.00
Speed [Mph]
-0.40
-0.30
-0.20
-0.10
0.00
0.10
0.20
0.30
0.40
0.00 5.00 10.00 15.00 20.00 25.00 30.00
Long accel [g]
-0.3
-0.2
-0.1
0
0.1
0.2
0.3
0 5 10 15 20 25 30
Lat accel [g]
0.00
0.10
0.20
0.30
0.40
0.00 5.00 10.00 15.00 20.00 25.00 30.00
Vector accel [g]
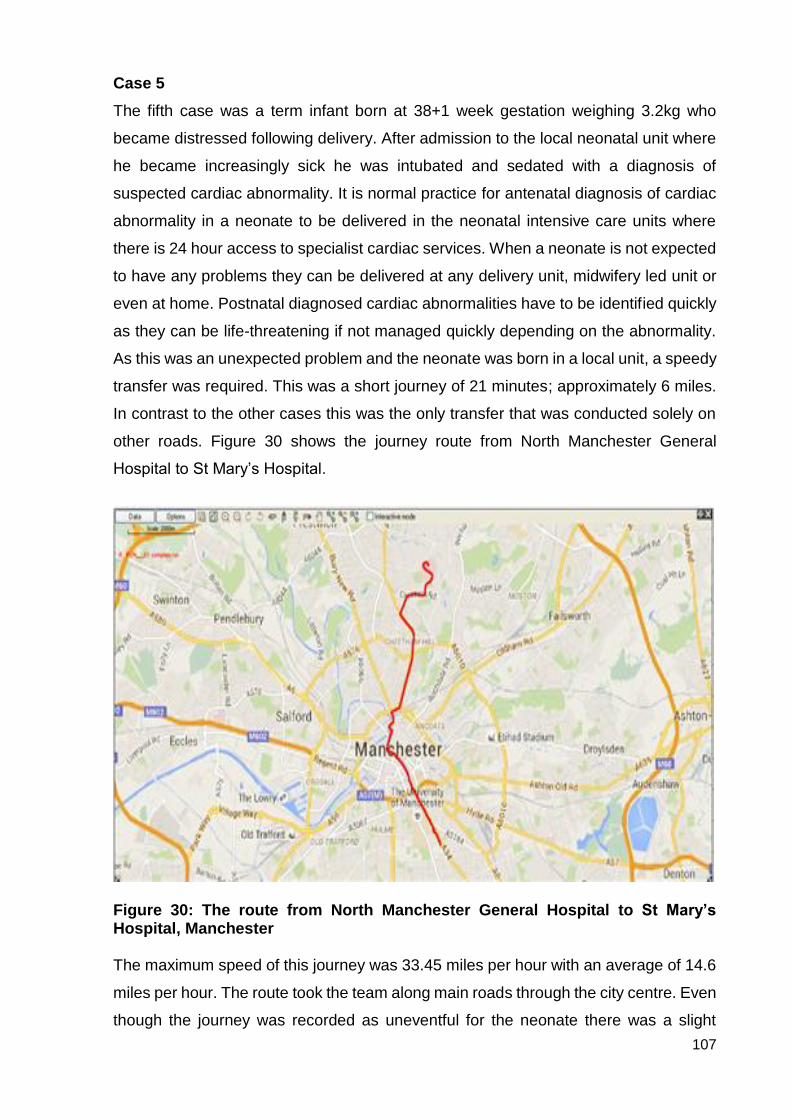
107
Case 5
The fifth case was a term infant born at 38+1 week gestation weighing 3.2kg who
became distressed following delivery. After admission to the local neonatal unit where
he became increasingly sick he was intubated and sedated with a diagnosis of
suspected cardiac abnormality. It is normal practice for antenatal diagnosis of cardiac
abnormality in a neonate to be delivered in the neonatal intensive care units where
there is 24 hour access to specialist cardiac services. When a neonate is not expected
to have any problems they can be delivered at any delivery unit, midwifery led unit or
even at home. Postnatal diagnosed cardiac abnormalities have to be identified quickly
as they can be life-threatening if not managed quickly depending on the abnormality.
As this was an unexpected problem and the neonate was born in a local unit, a speedy
transfer was required. This was a short journey of 21 minutes; approximately 6 miles.
In contrast to the other cases this was the only transfer that was conducted solely on
other roads. Figure 30 shows the journey route from North Manchester General
Hospital to St Mary’s Hospital.
Figure 30: The route from North Manchester General Hospital to St Mary’s Hospital, Manchester
The maximum speed of this journey was 33.45 miles per hour with an average of 14.6
miles per hour. The route took the team along main roads through the city centre. Even
though the journey was recorded as uneventful for the neonate there was a slight

108
incident 15 minutes into the journey when the ambulance and another vehicle clipped
wing mirrors. The incident occurred on the road in the city centre when the speed was
8 miles per hour. The team reported that they did not feel any impact from the collision.
Figure 33 demonstrates the speed of the journey and clearly exhibits the greater
variability of lower road speeds with multiple episodes of acceleration and deceleration.
As this was a sick neonate all physiological parameters were recorded (Figure 31).
Due to a technical hitch there was loss of recording between 1 and 3 minutes.
Figure 31: Physiological parameters of heart rate, blood pressure and SPO2 When observing the individual parameters of heart rate, blood pressure and oxygen
saturation levels there appeared to be an extensive variability in the heart rate and
140
150
160
170
0 5 10 15 20 25 30
Hea
rt R
ate
(b
pm
)
Duration (Mins)
HR
20
30
40
50
60
0 5 10 15 20 25 30
Art
eri
al B
P (
mm
Hg)
Duration (Mins)
BP
ABP - SYS ABP - DIA
80859095
100
0 5 10 15 20 25 30Satu
rati
on
(%
)
Duration (Mins)
SpO2
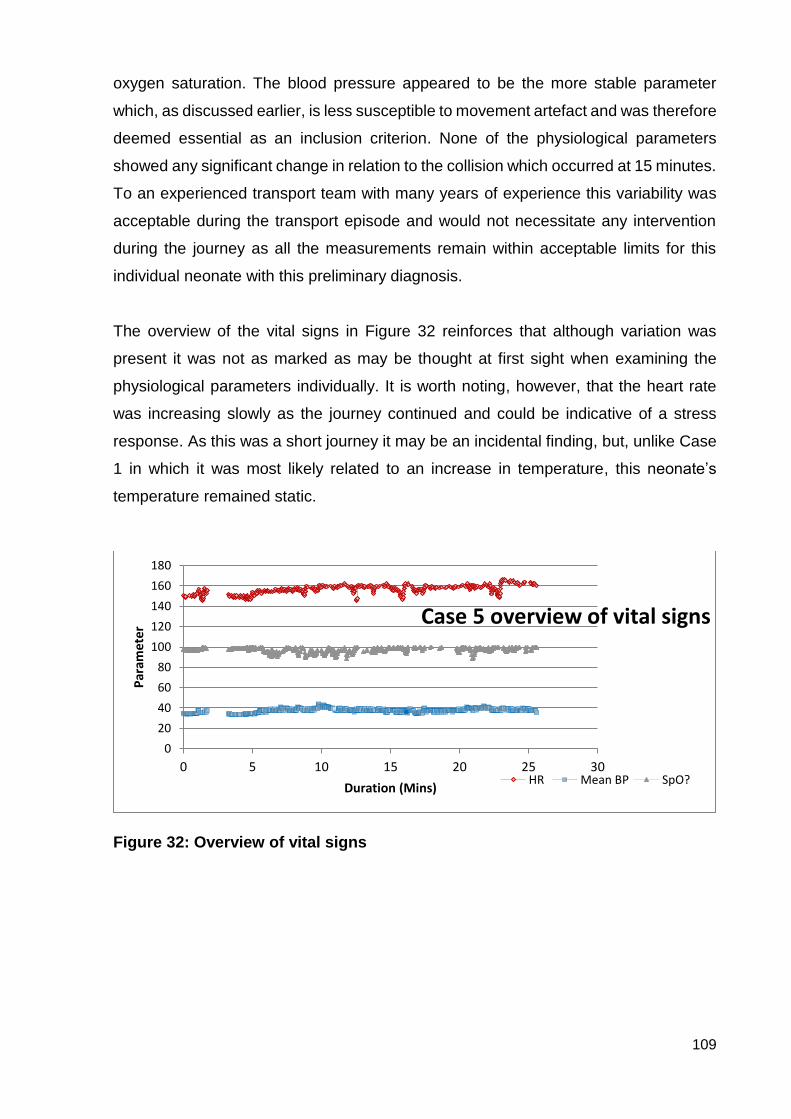
109
oxygen saturation. The blood pressure appeared to be the more stable parameter
which, as discussed earlier, is less susceptible to movement artefact and was therefore
deemed essential as an inclusion criterion. None of the physiological parameters
showed any significant change in relation to the collision which occurred at 15 minutes.
To an experienced transport team with many years of experience this variability was
acceptable during the transport episode and would not necessitate any intervention
during the journey as all the measurements remain within acceptable limits for this
individual neonate with this preliminary diagnosis.
The overview of the vital signs in Figure 32 reinforces that although variation was
present it was not as marked as may be thought at first sight when examining the
physiological parameters individually. It is worth noting, however, that the heart rate
was increasing slowly as the journey continued and could be indicative of a stress
response. As this was a short journey it may be an incidental finding, but, unlike Case
1 in which it was most likely related to an increase in temperature, this neonate’s
temperature remained static.
Figure 32: Overview of vital signs
0
20
40
60
80
100
120
140
160
180
0 5 10 15 20 25 30
Par
amet
er
Duration (Mins)
Case 5 overview of vital signs
HR Mean BP SpO?
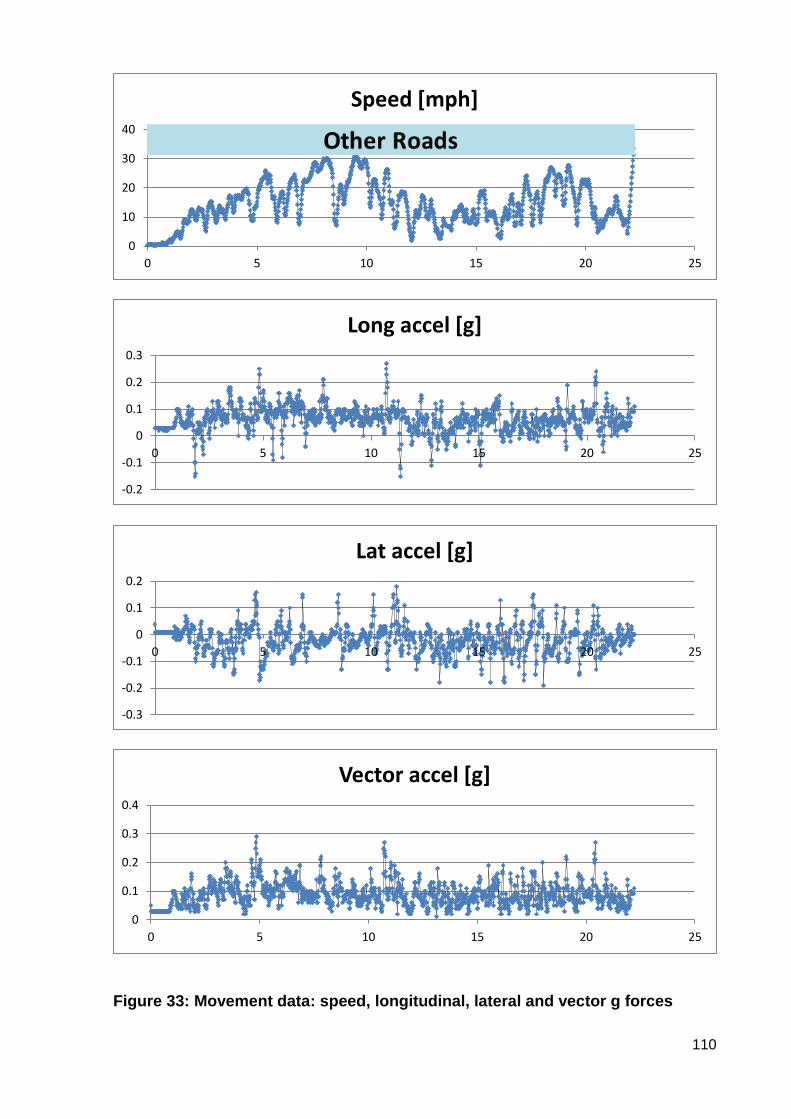
110
Figure 33: Movement data: speed, longitudinal, lateral and vector g forces
0
10
20
30
40
0 5 10 15 20 25
Speed [mph]
-0.2
-0.1
0
0.1
0.2
0.3
0 5 10 15 20 25
Long accel [g]
-0.3
-0.2
-0.1
0
0.1
0.2
0 5 10 15 20 25
Lat accel [g]
0
0.1
0.2
0.3
0.4
0 5 10 15 20 25
Vector accel [g]

111
When examining the movement data (Figure 33) all three axes show marked, constant
variation throughout the journey which is consistent in the beginning and end of
journeys in those cases involving motorway sections. The first three minutes of this
journey involved going over speed bumps at the exit of the referring hospital which
may account for some of the variation at the beginning of the traces; however this is
not particularly significant when compared to the rest of traces. “Poor road surface with
numerous potholes” was recorded in the study notes which, again, may account for
the more pronounced variations in all axes. At the 15 minute minor collision which
resulted with a broken wing mirror there is no significant increase or decrease in the g
forces to suggest the impact had any added effect on the neonate.

112
Case 6
This case was omitted from the analysis as due to a technical fault only five minutes
of physiological and movement data was collected.
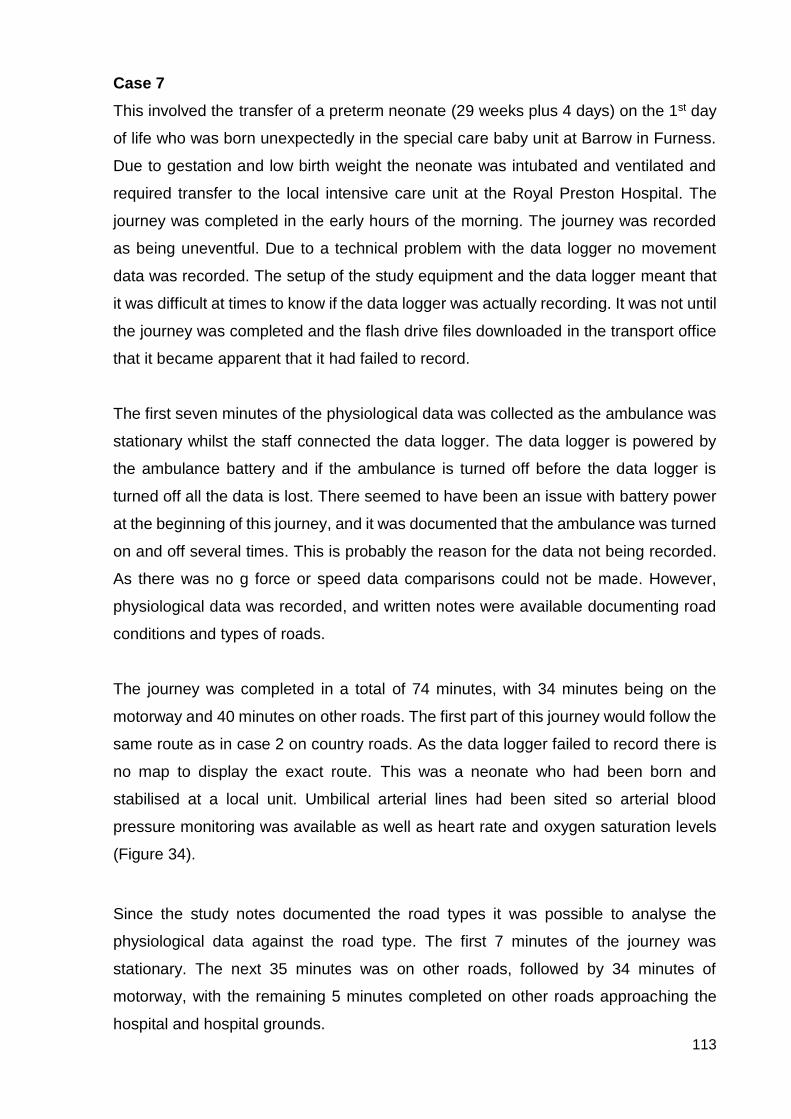
113
Case 7
This involved the transfer of a preterm neonate (29 weeks plus 4 days) on the 1st day
of life who was born unexpectedly in the special care baby unit at Barrow in Furness.
Due to gestation and low birth weight the neonate was intubated and ventilated and
required transfer to the local intensive care unit at the Royal Preston Hospital. The
journey was completed in the early hours of the morning. The journey was recorded
as being uneventful. Due to a technical problem with the data logger no movement
data was recorded. The setup of the study equipment and the data logger meant that
it was difficult at times to know if the data logger was actually recording. It was not until
the journey was completed and the flash drive files downloaded in the transport office
that it became apparent that it had failed to record.
The first seven minutes of the physiological data was collected as the ambulance was
stationary whilst the staff connected the data logger. The data logger is powered by
the ambulance battery and if the ambulance is turned off before the data logger is
turned off all the data is lost. There seemed to have been an issue with battery power
at the beginning of this journey, and it was documented that the ambulance was turned
on and off several times. This is probably the reason for the data not being recorded.
As there was no g force or speed data comparisons could not be made. However,
physiological data was recorded, and written notes were available documenting road
conditions and types of roads.
The journey was completed in a total of 74 minutes, with 34 minutes being on the
motorway and 40 minutes on other roads. The first part of this journey would follow the
same route as in case 2 on country roads. As the data logger failed to record there is
no map to display the exact route. This was a neonate who had been born and
stabilised at a local unit. Umbilical arterial lines had been sited so arterial blood
pressure monitoring was available as well as heart rate and oxygen saturation levels
(Figure 34).
Since the study notes documented the road types it was possible to analyse the
physiological data against the road type. The first 7 minutes of the journey was
stationary. The next 35 minutes was on other roads, followed by 34 minutes of
motorway, with the remaining 5 minutes completed on other roads approaching the
hospital and hospital grounds.
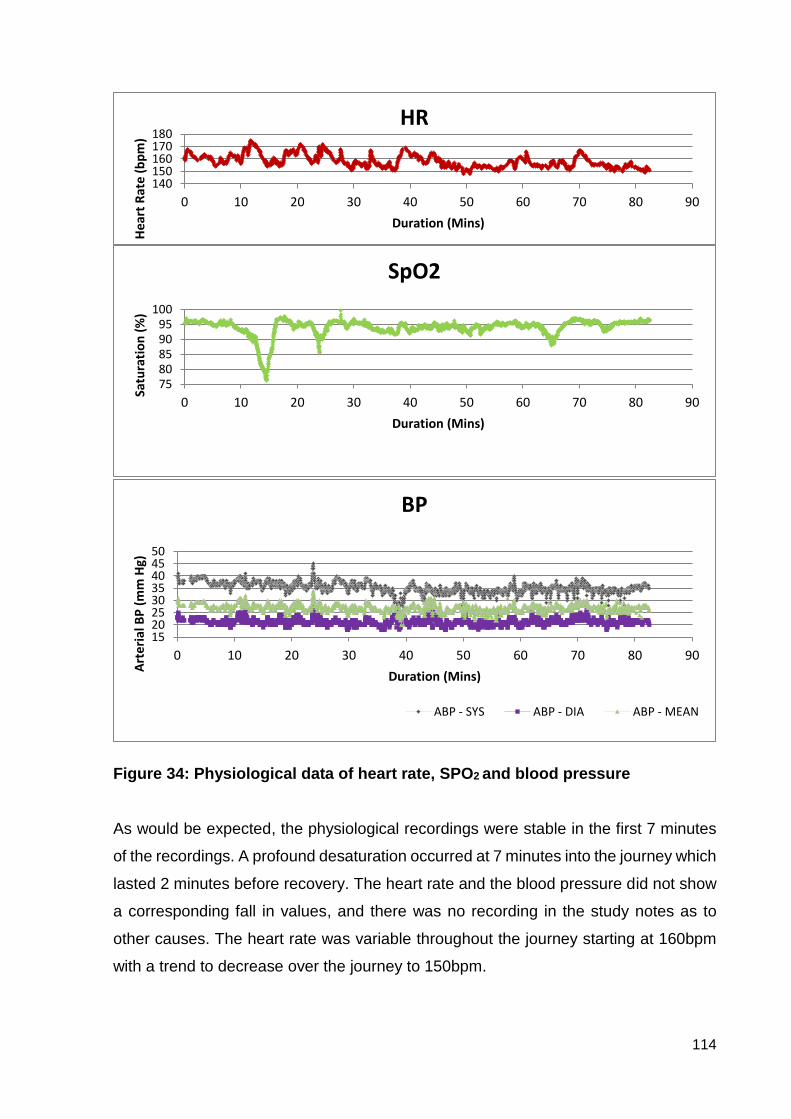
114
Figure 34: Physiological data of heart rate, SPO2 and blood pressure As would be expected, the physiological recordings were stable in the first 7 minutes
of the recordings. A profound desaturation occurred at 7 minutes into the journey which
lasted 2 minutes before recovery. The heart rate and the blood pressure did not show
a corresponding fall in values, and there was no recording in the study notes as to
other causes. The heart rate was variable throughout the journey starting at 160bpm
with a trend to decrease over the journey to 150bpm.
140150160170180
0 10 20 30 40 50 60 70 80 90
He
art
Rat
e (
bp
m)
Duration (Mins)
HR
7580859095
100
0 10 20 30 40 50 60 70 80 90
Satu
rati
on
(%
)
Duration (Mins)
SpO2
1520253035404550
0 10 20 30 40 50 60 70 80 90
Art
eri
al B
P (
mm
Hg)
Duration (Mins)
BP
ABP - SYS ABP - DIA ABP - MEAN
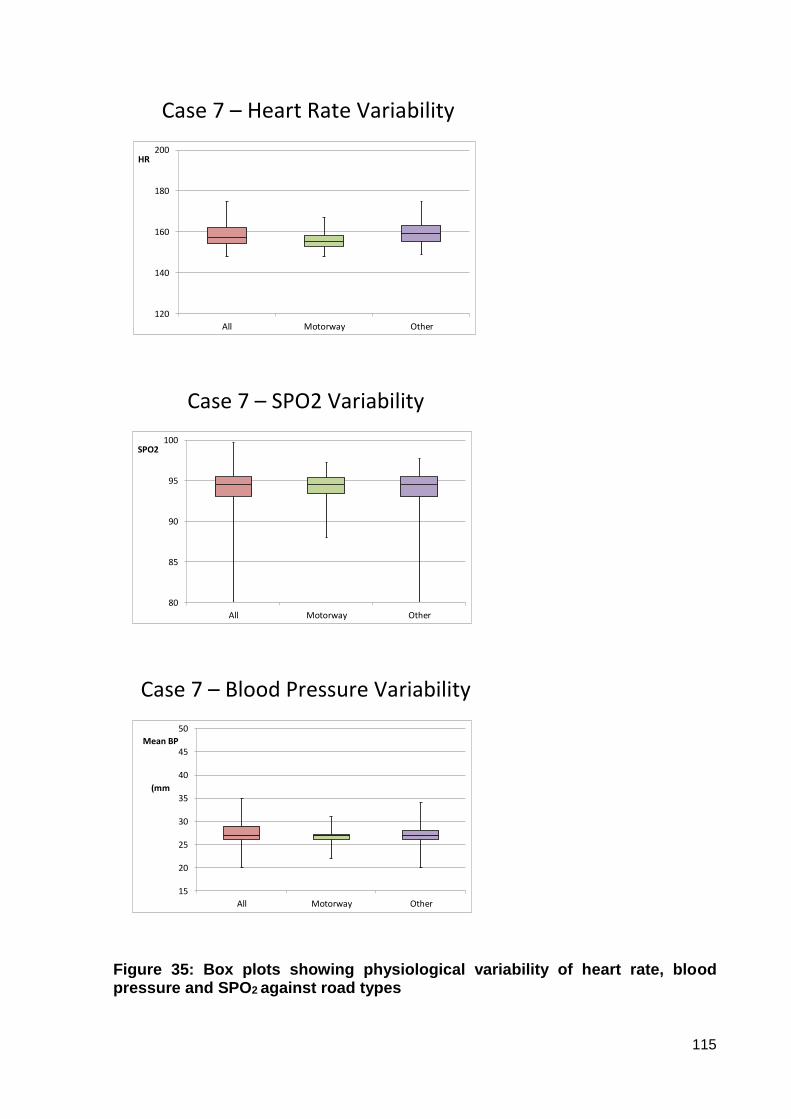
115
Case 7 – Heart Rate Variability
120
140
160
180
200
All Motorway Other
HR
Case 7 – SPO2 Variability
80
85
90
95
100
All Motorway Other
SPO2
Case 7 – Blood Pressure Variability
15
20
25
30
35
40
45
50
All Motorway Other
Mean BP
(mm
Figure 35: Box plots showing physiological variability of heart rate, blood pressure and SPO2 against road types

116
When the physiological data was box plotted against the road types it confirmed that
the variability of the heart rate, the oxygen saturation, and the blood pressure were all
less on the motorway than that on the other roads: a similar outcome to the other cases
that involved both road types (Figure 35).

117
Case 8
A preterm neonate was born in local neonatal unit in Blackpool at 29 weeks gestation.
The baby had severe breathing problems that required ventilation with nitric oxide.
Inhaled nitric oxide (INO) is a selective pulmonary vasodilator which has a micro-
selective effect which improves ventilation-perfusion matching. It has been shown to
reduce the incidence of death, can reduce oxygen requirements, reduce ventilation
settings resulting in reduced secondary lung injury, and current evidence suggests that
there is no neuro-developmental disadvantage for survivors with INO (Peliowski 2012,
Kumar 2013). The neonate also required intravenous drug support for low blood
pressure and was severely anaemic, requiring blood transfusions prior to transfer. The
neonate required transfer to the nearest neonatal intensive care unit, which was at
Preston, for on-going treatment and management of these problems. The journey took
24 minutes and involved 9 minutes travel on the motorway and 16 minutes on other
roads (Figure 36).
Figure 36: Journey from Blackpool to Preston
When examining the movement data for this journey it was clearly identifiable where
the motorway section of the journey began and ended (Figure 37), with a much more
stable speed during this period. The average speed on the motorway was calculated
at 64.48 miles per hour, with a maximum of 69.56 miles per hour. During the beginning
and end of the journey, in keeping with other cases where there were both types of
roads, the speed was much more erratic, with an average speed of 20.56 miles per
hour and a maximum of 57.60 miles per hour.
118
Figure 37: Movement data: speed, longitudinal, lateral and vector g forces
The same pattern of decreased variability was also demonstrated clearly in all three
axes of g at higher speed with more consistent conditions and no sudden acceleration
or deceleration (Figure 37).
0
20
40
60
80
0 5 10 15 20 25 30
Speed [mph]
-0.4
-0.2
0
0.2
0.4
0 5 10 15 20 25 30
Long accel [g]
-0.2
-0.1
0
0.1
0.2
0 5 10 15 20 25 30
Lat accel [g]
0
0.1
0.2
0.3
0 5 10 15 20 25 30
Vector accel [g]
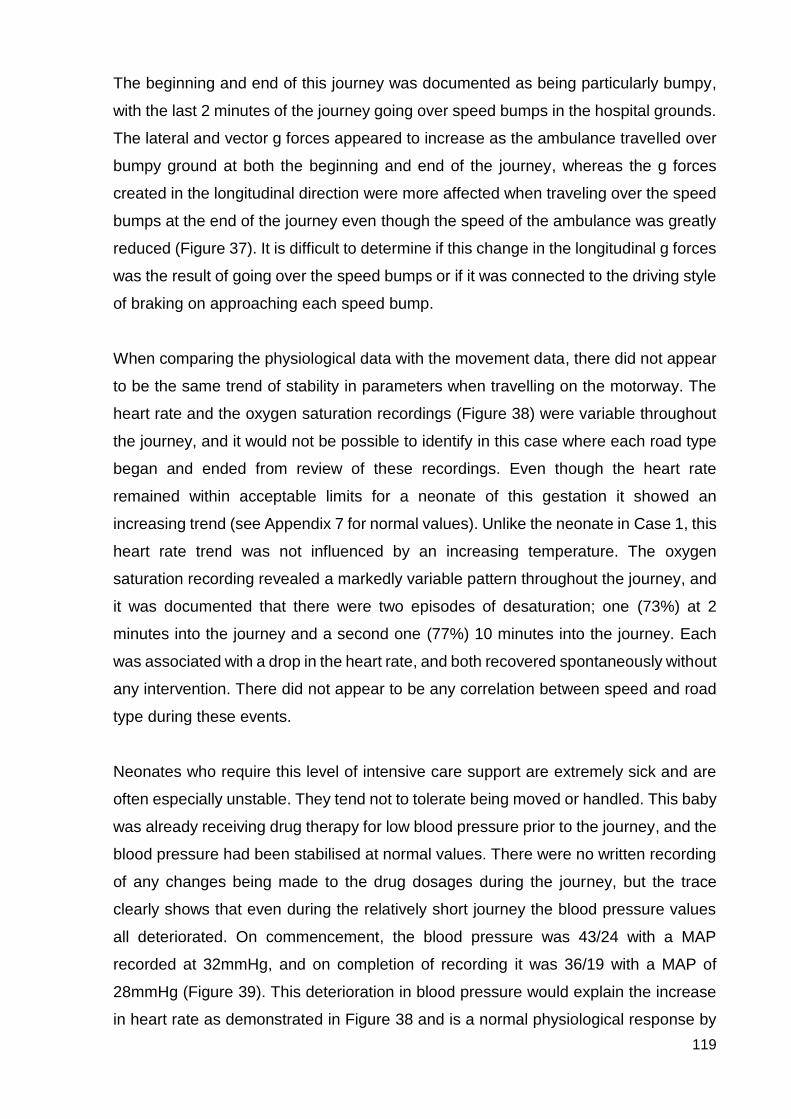
119
The beginning and end of this journey was documented as being particularly bumpy,
with the last 2 minutes of the journey going over speed bumps in the hospital grounds.
The lateral and vector g forces appeared to increase as the ambulance travelled over
bumpy ground at both the beginning and end of the journey, whereas the g forces
created in the longitudinal direction were more affected when traveling over the speed
bumps at the end of the journey even though the speed of the ambulance was greatly
reduced (Figure 37). It is difficult to determine if this change in the longitudinal g forces
was the result of going over the speed bumps or if it was connected to the driving style
of braking on approaching each speed bump.
When comparing the physiological data with the movement data, there did not appear
to be the same trend of stability in parameters when travelling on the motorway. The
heart rate and the oxygen saturation recordings (Figure 38) were variable throughout
the journey, and it would not be possible to identify in this case where each road type
began and ended from review of these recordings. Even though the heart rate
remained within acceptable limits for a neonate of this gestation it showed an
increasing trend (see Appendix 7 for normal values). Unlike the neonate in Case 1, this
heart rate trend was not influenced by an increasing temperature. The oxygen
saturation recording revealed a markedly variable pattern throughout the journey, and
it was documented that there were two episodes of desaturation; one (73%) at 2
minutes into the journey and a second one (77%) 10 minutes into the journey. Each
was associated with a drop in the heart rate, and both recovered spontaneously without
any intervention. There did not appear to be any correlation between speed and road
type during these events.
Neonates who require this level of intensive care support are extremely sick and are
often especially unstable. They tend not to tolerate being moved or handled. This baby
was already receiving drug therapy for low blood pressure prior to the journey, and the
blood pressure had been stabilised at normal values. There were no written recording
of any changes being made to the drug dosages during the journey, but the trace
clearly shows that even during the relatively short journey the blood pressure values
all deteriorated. On commencement, the blood pressure was 43/24 with a MAP
recorded at 32mmHg, and on completion of recording it was 36/19 with a MAP of
28mmHg (Figure 39). This deterioration in blood pressure would explain the increase
in heart rate as demonstrated in Figure 38 and is a normal physiological response by
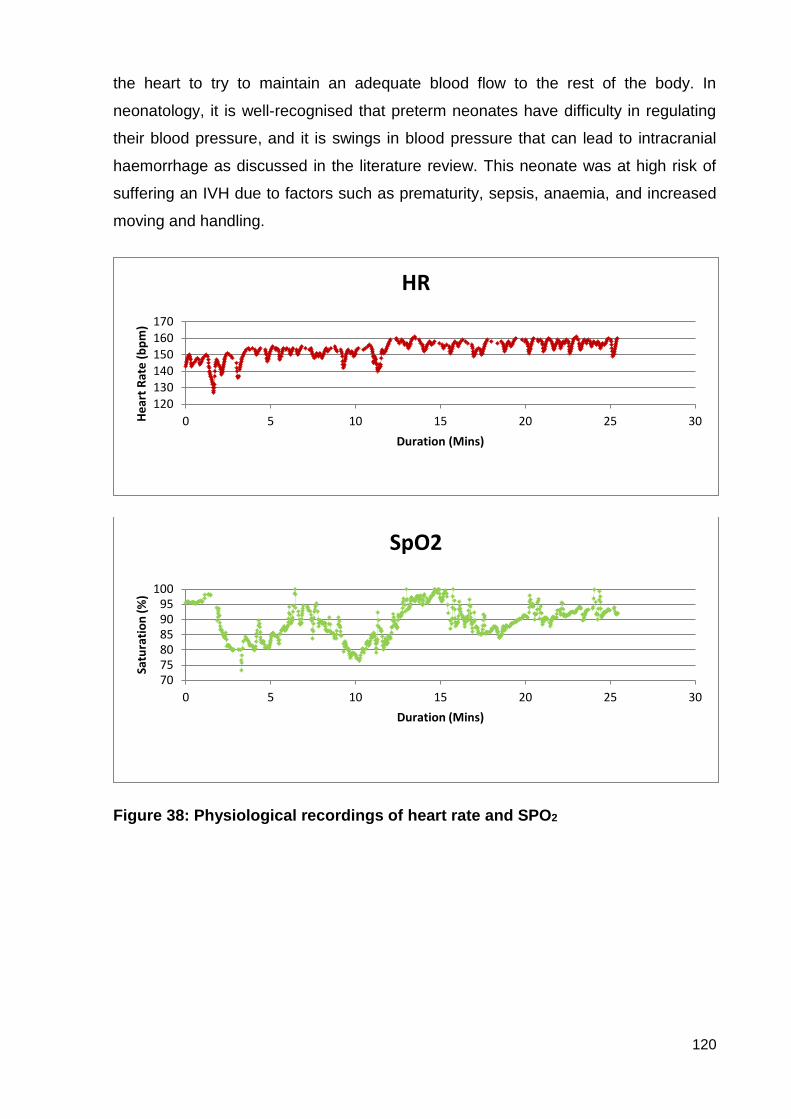
120
the heart to try to maintain an adequate blood flow to the rest of the body. In
neonatology, it is well-recognised that preterm neonates have difficulty in regulating
their blood pressure, and it is swings in blood pressure that can lead to intracranial
haemorrhage as discussed in the literature review. This neonate was at high risk of
suffering an IVH due to factors such as prematurity, sepsis, anaemia, and increased
moving and handling.
Figure 38: Physiological recordings of heart rate and SPO2
120130140150160170
0 5 10 15 20 25 30He
art
Rat
e (
bp
m)
Duration (Mins)
HR
707580859095
100
0 5 10 15 20 25 30
Satu
rati
on
(%
)
Duration (Mins)
SpO2
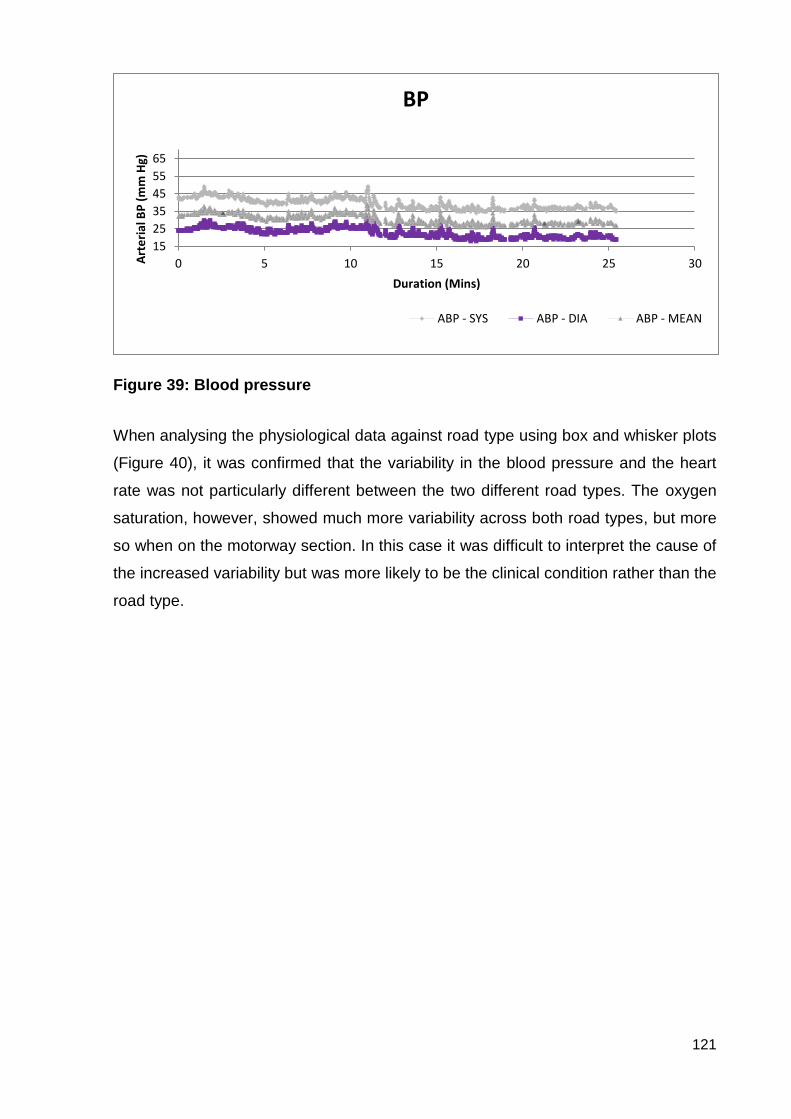
121
Figure 39: Blood pressure
When analysing the physiological data against road type using box and whisker plots
(Figure 40), it was confirmed that the variability in the blood pressure and the heart
rate was not particularly different between the two different road types. The oxygen
saturation, however, showed much more variability across both road types, but more
so when on the motorway section. In this case it was difficult to interpret the cause of
the increased variability but was more likely to be the clinical condition rather than the
road type.
15
25
35
45
55
65
0 5 10 15 20 25 30Art
eri
al B
P (
mm
Hg)
Duration (Mins)
BP
ABP - SYS ABP - DIA ABP - MEAN
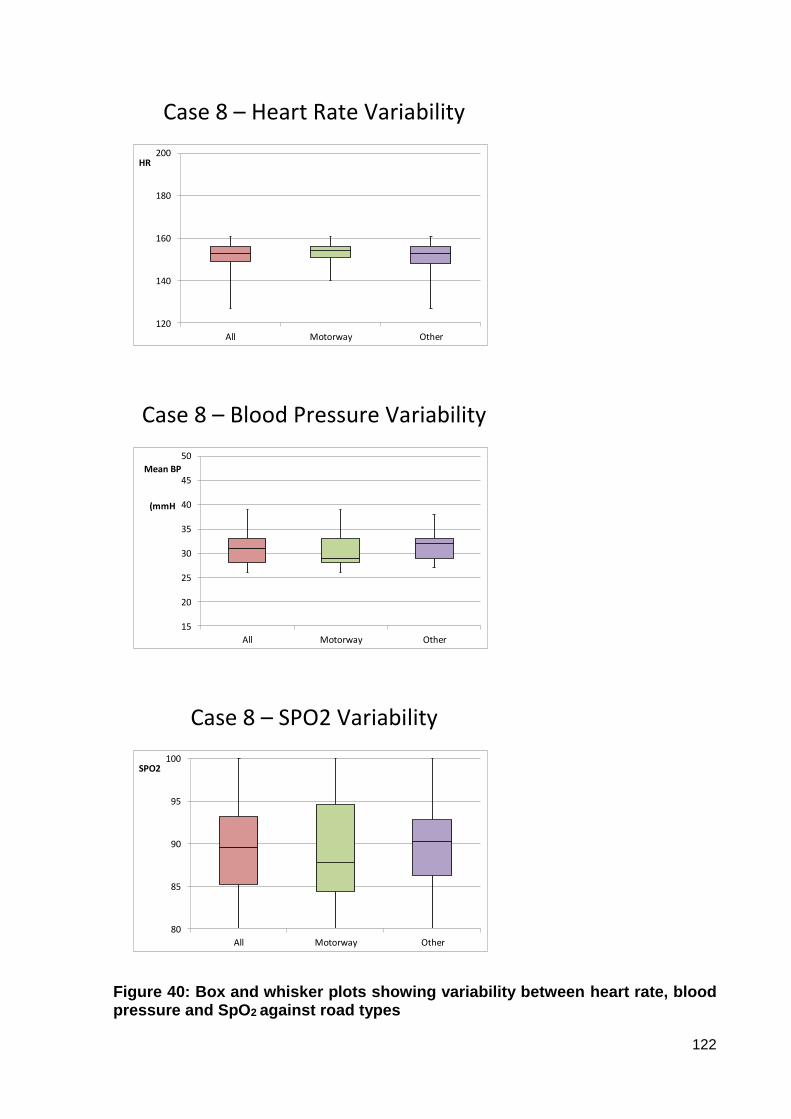
122
Case 8 – Heart Rate Variability
120
140
160
180
200
All Motorway Other
HR
Case 8 – Blood Pressure Variability
15
20
25
30
35
40
45
50
All Motorway Other
Mean BP
(mmH
Case 8 – SPO2 Variability
80
85
90
95
100
All Motorway Other
SPO2
Figure 40: Box and whisker plots showing variability between heart rate, blood pressure and SpO2 against road types
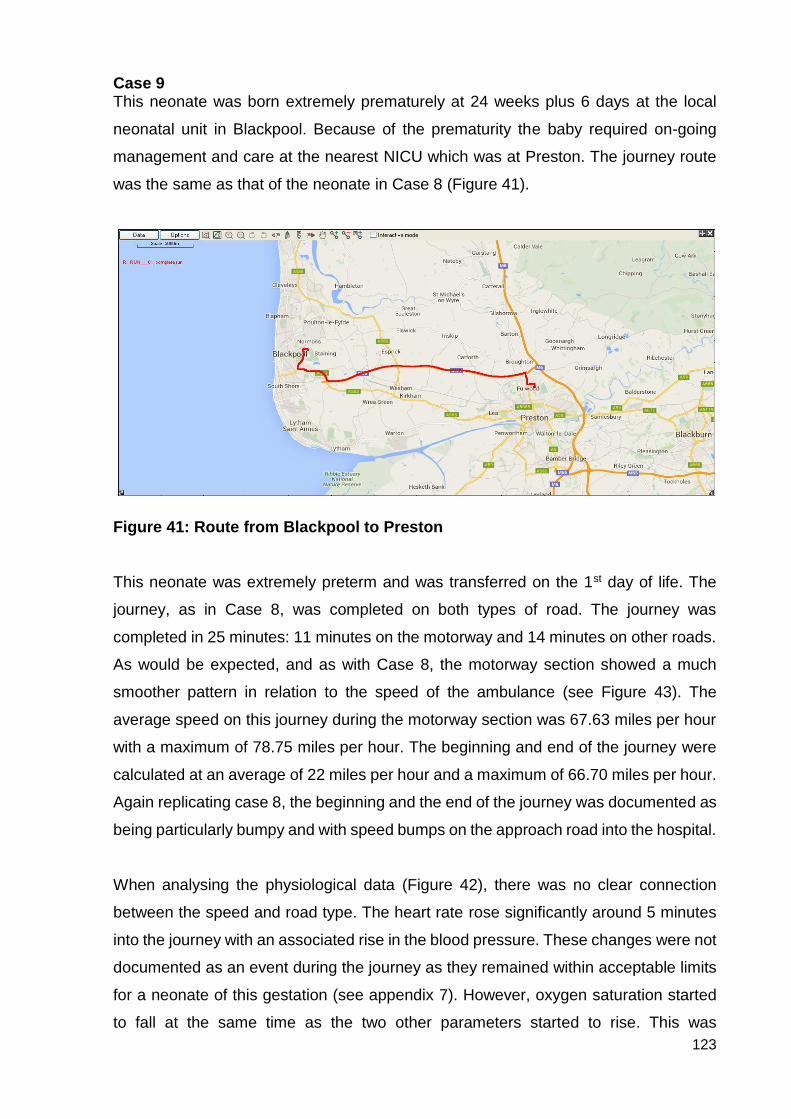
123
Case 9 This neonate was born extremely prematurely at 24 weeks plus 6 days at the local
neonatal unit in Blackpool. Because of the prematurity the baby required on-going
management and care at the nearest NICU which was at Preston. The journey route
was the same as that of the neonate in Case 8 (Figure 41).
Figure 41: Route from Blackpool to Preston
This neonate was extremely preterm and was transferred on the 1st day of life. The
journey, as in Case 8, was completed on both types of road. The journey was
completed in 25 minutes: 11 minutes on the motorway and 14 minutes on other roads.
As would be expected, and as with Case 8, the motorway section showed a much
smoother pattern in relation to the speed of the ambulance (see Figure 43). The
average speed on this journey during the motorway section was 67.63 miles per hour
with a maximum of 78.75 miles per hour. The beginning and end of the journey were
calculated at an average of 22 miles per hour and a maximum of 66.70 miles per hour.
Again replicating case 8, the beginning and the end of the journey was documented as
being particularly bumpy and with speed bumps on the approach road into the hospital.
When analysing the physiological data (Figure 42), there was no clear connection
between the speed and road type. The heart rate rose significantly around 5 minutes
into the journey with an associated rise in the blood pressure. These changes were not
documented as an event during the journey as they remained within acceptable limits
for a neonate of this gestation (see appendix 7). However, oxygen saturation started
to fall at the same time as the two other parameters started to rise. This was

124
documented, but no cause was identified, and there was no change to treatment. The
oxygen saturation recovered over the next 2-3 minutes and then remained around
95%. The heart rate peaked at 169bpm and then slowly over the course of the journey
returned to 158bpm, with the blood pressure following a similar course. These more
subtle physiological changes, however, appeared to correlate with the more variable
speeds that are experienced at the beginning of the journey and started to stabilise
once on the motorway with a more constant speed.
Neonates can demonstrate stress responses in various ways including tachycardia,
desaturation, hypotension or hypertension, increased oxygen requirements and
temperature instability. This neonate, although classed as stable because there were
no significant events, demonstrated recognised stress responses during this journey.
Although the neonate in case 8 was deemed to be more unstable than the one in this
case, these more subtle signs of intolerance or stress can also be seen with a very
gradual increase in heart rate and a gradual decline in blood pressure.
As this was the same journey that was completed in case 8 it is not surprising that the
movement data shows very similar patterns (Figure 43). The g forces in this case were
increased across all axes. This may have been due to driver style, slightly increased
average road speeds, or the ambulance type.
The neonate in case 9 was transferred in the bespoke transport ambulance which is
used solely for the transportation of sick neonates. This ambulance is based on a
Mercedes chassis and is fitted with a Telma (TELMA USA) friction-free braking system
that regulates and smooths braking. It also has air suspension in order to give patients
and staff a smoother, safer journey. The neonate in case 8 was transferred in a Fiat
ambulance which is a general fleet vehicle. Fiat ambulances, which are a square
design, have been reported to be subject to more rocking movement in the cabin
leading to increased motion sickness amongst staff and patients.
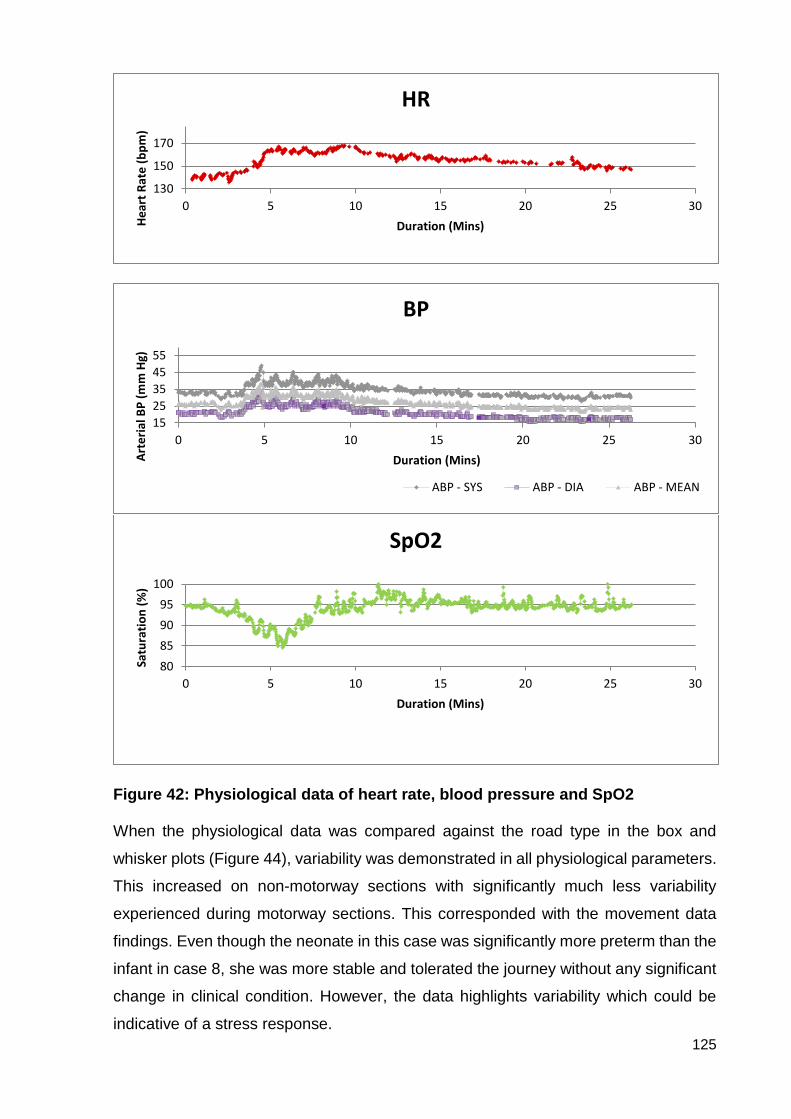
125
Figure 42: Physiological data of heart rate, blood pressure and SpO2
When the physiological data was compared against the road type in the box and
whisker plots (Figure 44), variability was demonstrated in all physiological parameters.
This increased on non-motorway sections with significantly much less variability
experienced during motorway sections. This corresponded with the movement data
findings. Even though the neonate in this case was significantly more preterm than the
infant in case 8, she was more stable and tolerated the journey without any significant
change in clinical condition. However, the data highlights variability which could be
indicative of a stress response.
130
150
170
0 5 10 15 20 25 30
He
art
Rat
e (
bp
m)
Duration (Mins)
HR
15
25
35
45
55
0 5 10 15 20 25 30
Art
eri
al B
P (
mm
Hg)
Duration (Mins)
BP
ABP - SYS ABP - DIA ABP - MEAN
80
85
90
95
100
0 5 10 15 20 25 30
Satu
rati
on
(%
)
Duration (Mins)
SpO2

126
Figure 43: Movement data: speed, longitudinal, lateral and vector g forces
0
20
40
60
80
100
0 5 10 15 20 25 30
Speed [mph]
-0.3
-0.2
-0.1
0
0.1
0.2
0.3
0 5 10 15 20 25 30
Long accel [g]
-0.3
-0.2
-0.1
0
0.1
0.2
0.3
0 5 10 15 20 25 30
Lat accel [g]
0
0.1
0.2
0.3
0 5 10 15 20 25 30
Vector accel [g]
Motorway section
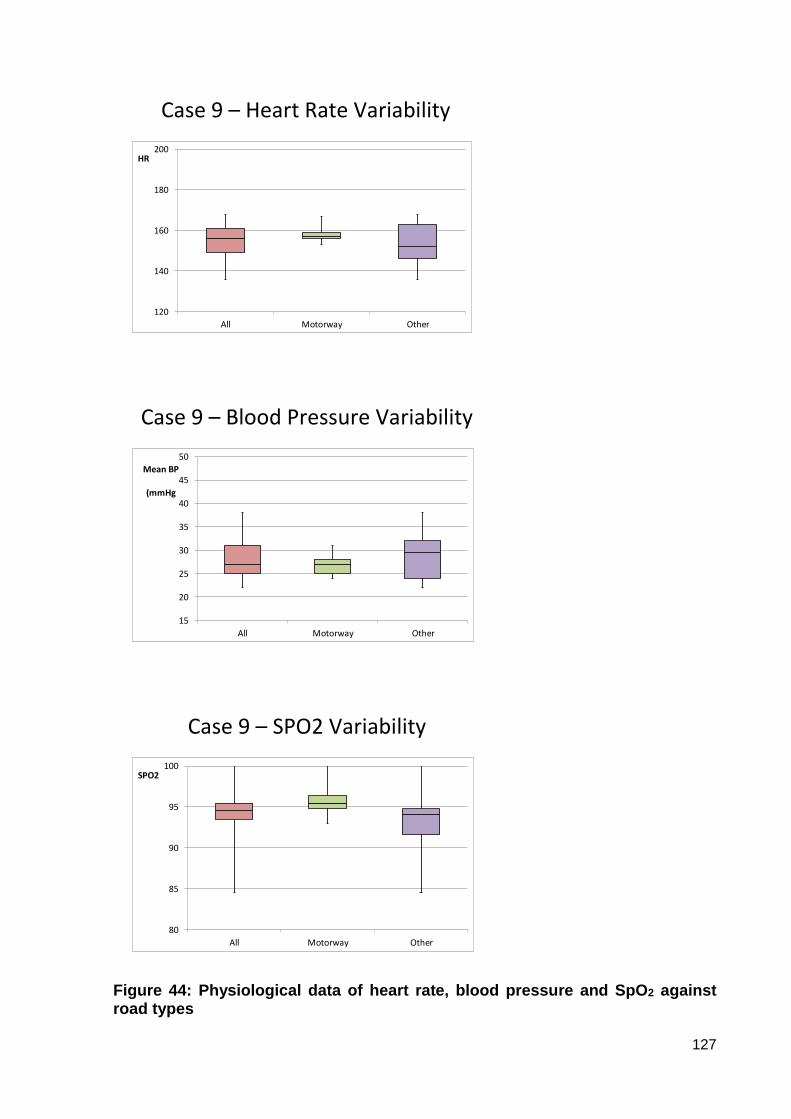
127
Case 9 – Heart Rate Variability
120
140
160
180
200
All Motorway Other
HR
Case 9 – Blood Pressure Variability
15
20
25
30
35
40
45
50
All Motorway Other
Mean BP
(mmHg
Case 9 – SPO2 Variability
80
85
90
95
100
All Motorway Other
SPO2
Figure 44: Physiological data of heart rate, blood pressure and SpO2 against road types
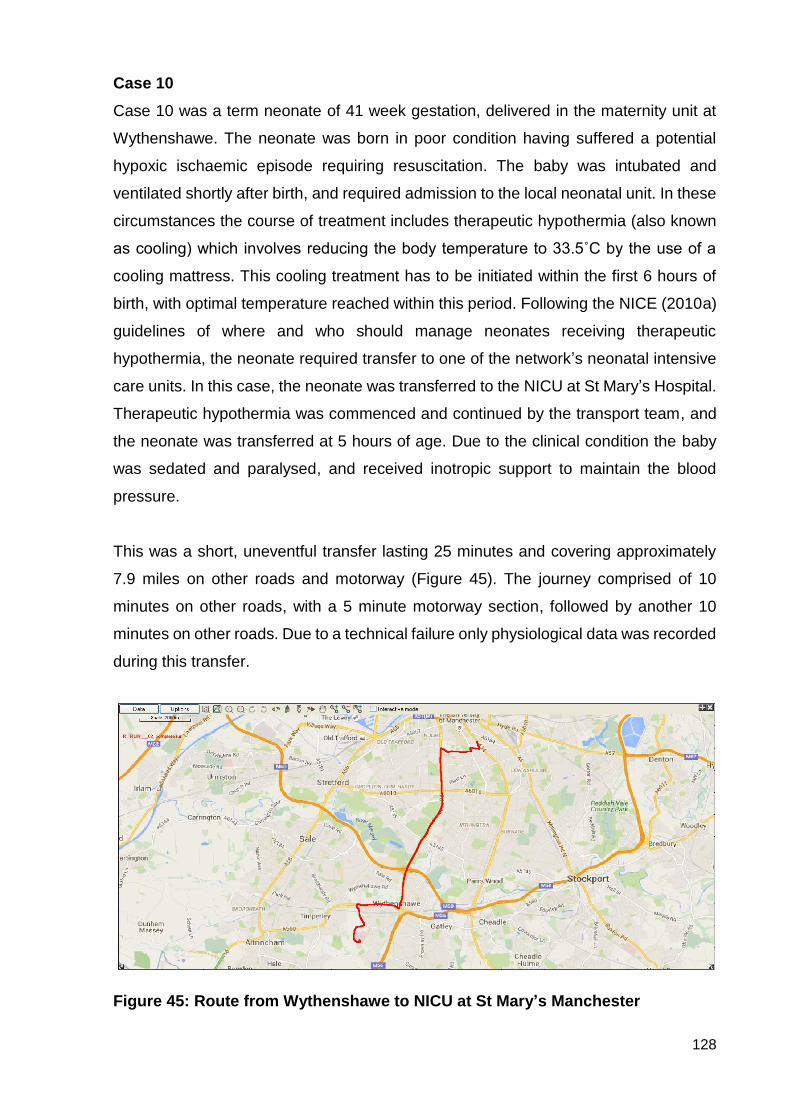
128
Case 10
Case 10 was a term neonate of 41 week gestation, delivered in the maternity unit at
Wythenshawe. The neonate was born in poor condition having suffered a potential
hypoxic ischaemic episode requiring resuscitation. The baby was intubated and
ventilated shortly after birth, and required admission to the local neonatal unit. In these
circumstances the course of treatment includes therapeutic hypothermia (also known
as cooling) which involves reducing the body temperature to 33.5˚C by the use of a
cooling mattress. This cooling treatment has to be initiated within the first 6 hours of
birth, with optimal temperature reached within this period. Following the NICE (2010a)
guidelines of where and who should manage neonates receiving therapeutic
hypothermia, the neonate required transfer to one of the network’s neonatal intensive
care units. In this case, the neonate was transferred to the NICU at St Mary’s Hospital.
Therapeutic hypothermia was commenced and continued by the transport team, and
the neonate was transferred at 5 hours of age. Due to the clinical condition the baby
was sedated and paralysed, and received inotropic support to maintain the blood
pressure.
This was a short, uneventful transfer lasting 25 minutes and covering approximately
7.9 miles on other roads and motorway (Figure 45). The journey comprised of 10
minutes on other roads, with a 5 minute motorway section, followed by another 10
minutes on other roads. Due to a technical failure only physiological data was recorded
during this transfer.
Figure 45: Route from Wythenshawe to NICU at St Mary’s Manchester
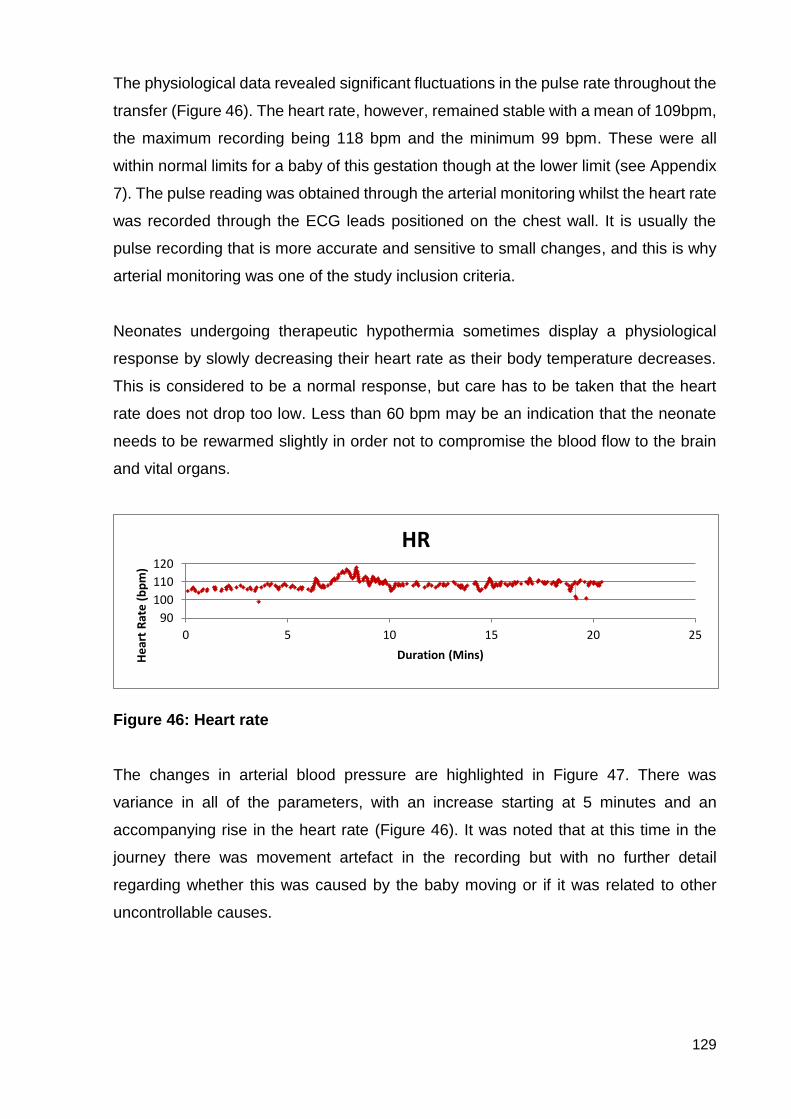
129
The physiological data revealed significant fluctuations in the pulse rate throughout the
transfer (Figure 46). The heart rate, however, remained stable with a mean of 109bpm,
the maximum recording being 118 bpm and the minimum 99 bpm. These were all
within normal limits for a baby of this gestation though at the lower limit (see Appendix
7). The pulse reading was obtained through the arterial monitoring whilst the heart rate
was recorded through the ECG leads positioned on the chest wall. It is usually the
pulse recording that is more accurate and sensitive to small changes, and this is why
arterial monitoring was one of the study inclusion criteria.
Neonates undergoing therapeutic hypothermia sometimes display a physiological
response by slowly decreasing their heart rate as their body temperature decreases.
This is considered to be a normal response, but care has to be taken that the heart
rate does not drop too low. Less than 60 bpm may be an indication that the neonate
needs to be rewarmed slightly in order not to compromise the blood flow to the brain
and vital organs.
Figure 46: Heart rate The changes in arterial blood pressure are highlighted in Figure 47. There was
variance in all of the parameters, with an increase starting at 5 minutes and an
accompanying rise in the heart rate (Figure 46). It was noted that at this time in the
journey there was movement artefact in the recording but with no further detail
regarding whether this was caused by the baby moving or if it was related to other
uncontrollable causes.
90
100
110
120
0 5 10 15 20 25
He
art
Rat
e (b
pm
)
Duration (Mins)
HR
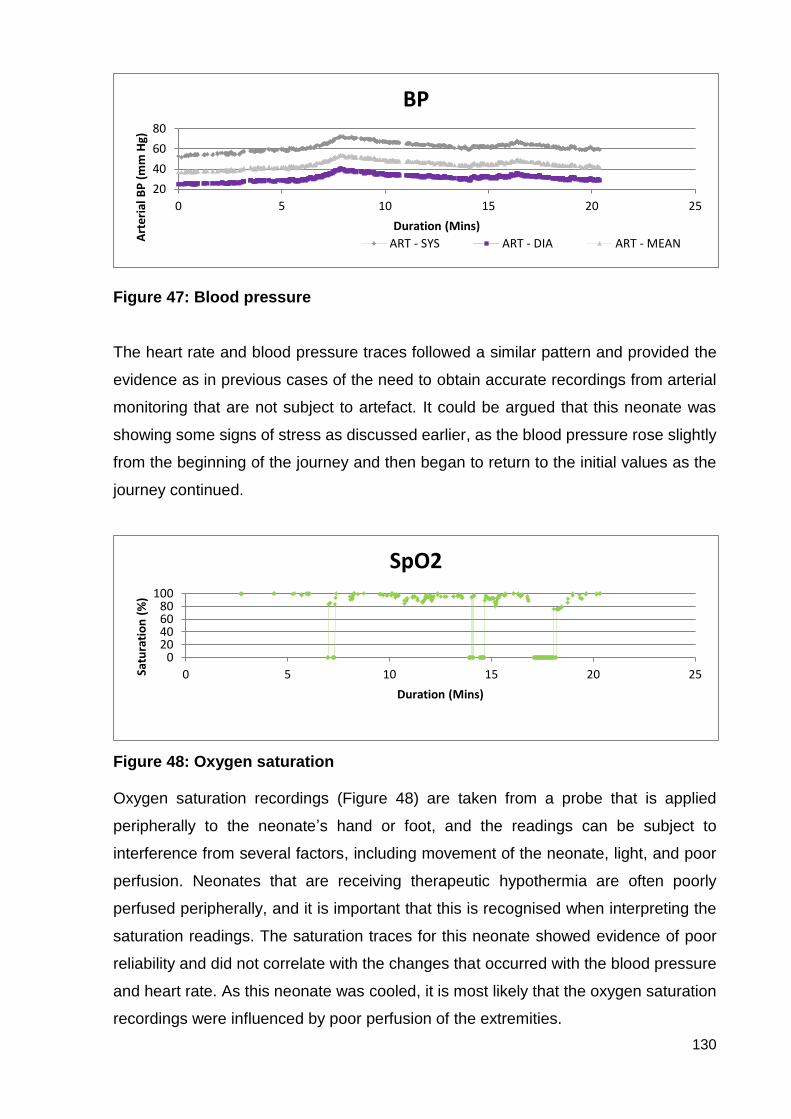
130
Figure 47: Blood pressure The heart rate and blood pressure traces followed a similar pattern and provided the
evidence as in previous cases of the need to obtain accurate recordings from arterial
monitoring that are not subject to artefact. It could be argued that this neonate was
showing some signs of stress as discussed earlier, as the blood pressure rose slightly
from the beginning of the journey and then began to return to the initial values as the
journey continued.
Figure 48: Oxygen saturation Oxygen saturation recordings (Figure 48) are taken from a probe that is applied
peripherally to the neonate’s hand or foot, and the readings can be subject to
interference from several factors, including movement of the neonate, light, and poor
perfusion. Neonates that are receiving therapeutic hypothermia are often poorly
perfused peripherally, and it is important that this is recognised when interpreting the
saturation readings. The saturation traces for this neonate showed evidence of poor
reliability and did not correlate with the changes that occurred with the blood pressure
and heart rate. As this neonate was cooled, it is most likely that the oxygen saturation
recordings were influenced by poor perfusion of the extremities.
20
40
60
80
0 5 10 15 20 25
Art
eria
l BP
(m
m H
g)
Duration (Mins)
BP
ART - SYS ART - DIA ART - MEAN
020406080
100
0 5 10 15 20 25Satu
rati
on
(%
)
Duration (Mins)
SpO2

131
This case highlights the diversity and complexity of the subjects included in the study
and the limitations that this may place on the findings.

132
Case 11
This case was a transfer of a term 1 day old baby who had been born uneventfully at
the local maternity unit in Wigan. At approximately 12 hours of age he had presented
with symptoms of a small bowel obstruction and required a surgical review at the
nearest neonatal surgical unit which was at St Mary’s neonatal unit in Manchester.
Some surgical problems can be diagnosed in the ante-natal period and arrangements
are then made for the mother to deliver at a maternity unit which is attached to the
surgical unit. However, some neonates are born with an unexpected surgical problem
which then presents acutely in the first few hours following birth. Although this neonate
was stable from a cardiorespiratory system, it was important that he was moved quickly
as there was the potential to develop into a life-threatening condition that can result in
death or catastrophic loss of bowel. When referred this neonate was self-ventilating in
air and was clinically stable.
The journey took approximately 40 minutes and involved both motorway (20 minutes)
and other roads (20 minutes). The journey was recorded as being uneventful (Figure
49).
Figure 49: Route from Wigan to Manchester No movement data was collected for this transfer by the data logger, but from the
written documentation it was possible to identify the motorway and other roads
sections of the journey. This case was included to highlight the type of data that can
be recorded using non-invasive equipment and how helpful this may be when
examining how the neonate may tolerate the transfer journey.
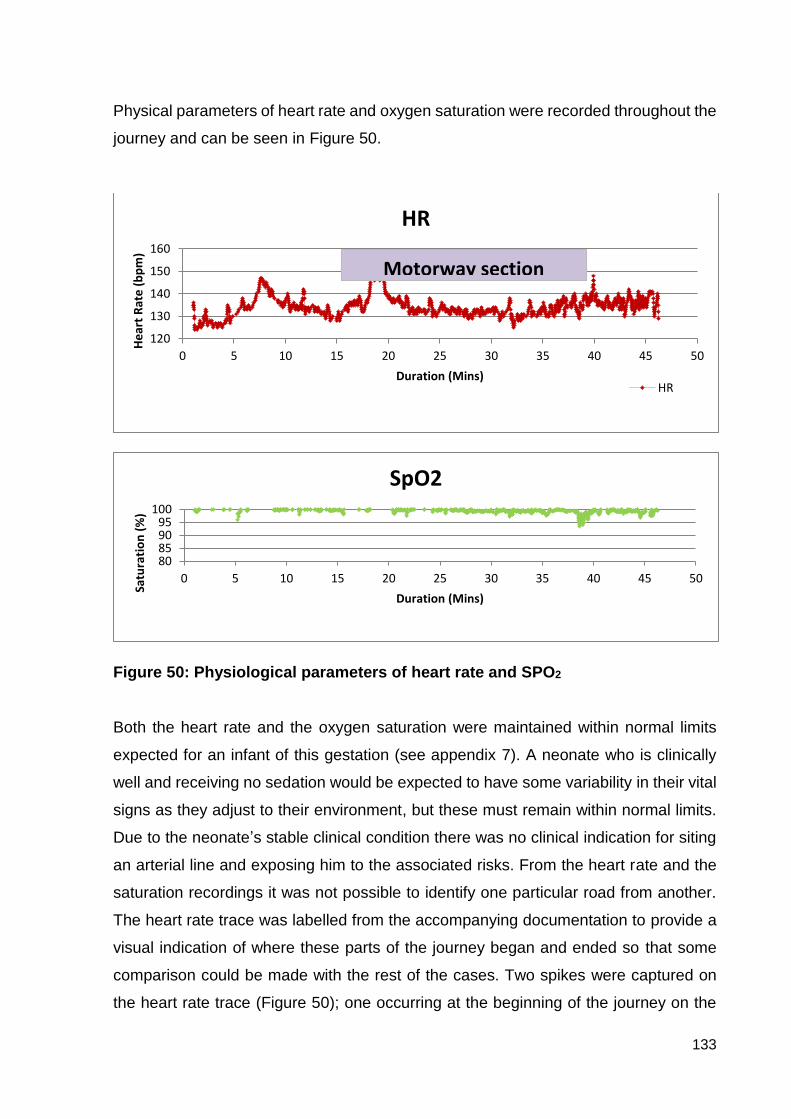
133
Physical parameters of heart rate and oxygen saturation were recorded throughout the
journey and can be seen in Figure 50.
Figure 50: Physiological parameters of heart rate and SPO2
Both the heart rate and the oxygen saturation were maintained within normal limits
expected for an infant of this gestation (see appendix 7). A neonate who is clinically
well and receiving no sedation would be expected to have some variability in their vital
signs as they adjust to their environment, but these must remain within normal limits.
Due to the neonate’s stable clinical condition there was no clinical indication for siting
an arterial line and exposing him to the associated risks. From the heart rate and the
saturation recordings it was not possible to identify one particular road from another.
The heart rate trace was labelled from the accompanying documentation to provide a
visual indication of where these parts of the journey began and ended so that some
comparison could be made with the rest of the cases. Two spikes were captured on
the heart rate trace (Figure 50); one occurring at the beginning of the journey on the
120
130
140
150
160
0 5 10 15 20 25 30 35 40 45 50
He
art
Rat
e (
bp
m)
Duration (Mins)
HR
HR
80859095
100
0 5 10 15 20 25 30 35 40 45 50
Satu
rati
on
(%
)
Duration (Mins)
SpO2
Motorway section
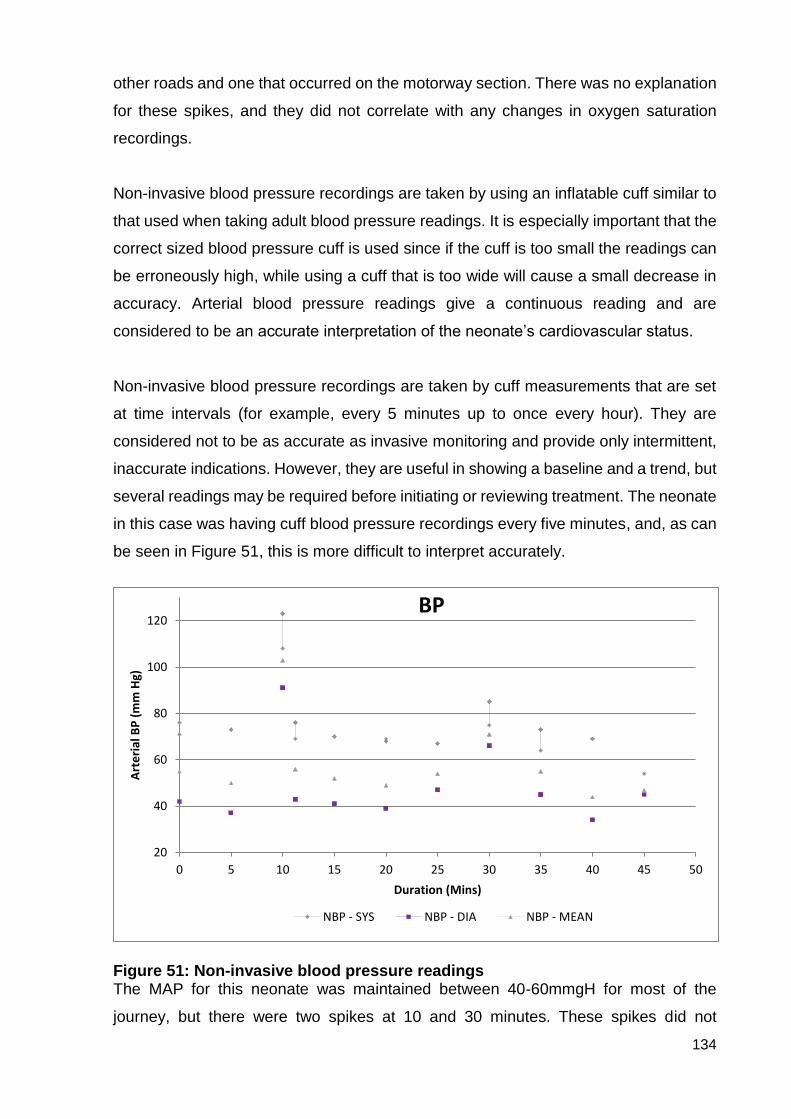
134
other roads and one that occurred on the motorway section. There was no explanation
for these spikes, and they did not correlate with any changes in oxygen saturation
recordings.
Non-invasive blood pressure recordings are taken by using an inflatable cuff similar to
that used when taking adult blood pressure readings. It is especially important that the
correct sized blood pressure cuff is used since if the cuff is too small the readings can
be erroneously high, while using a cuff that is too wide will cause a small decrease in
accuracy. Arterial blood pressure readings give a continuous reading and are
considered to be an accurate interpretation of the neonate’s cardiovascular status.
Non-invasive blood pressure recordings are taken by cuff measurements that are set
at time intervals (for example, every 5 minutes up to once every hour). They are
considered not to be as accurate as invasive monitoring and provide only intermittent,
inaccurate indications. However, they are useful in showing a baseline and a trend, but
several readings may be required before initiating or reviewing treatment. The neonate
in this case was having cuff blood pressure recordings every five minutes, and, as can
be seen in Figure 51, this is more difficult to interpret accurately.
Figure 51: Non-invasive blood pressure readings The MAP for this neonate was maintained between 40-60mmgH for most of the
journey, but there were two spikes at 10 and 30 minutes. These spikes did not
20
40
60
80
100
120
0 5 10 15 20 25 30 35 40 45 50
Art
eri
al B
P (
mm
Hg)
Duration (Mins)
BP
NBP - SYS NBP - DIA NBP - MEAN
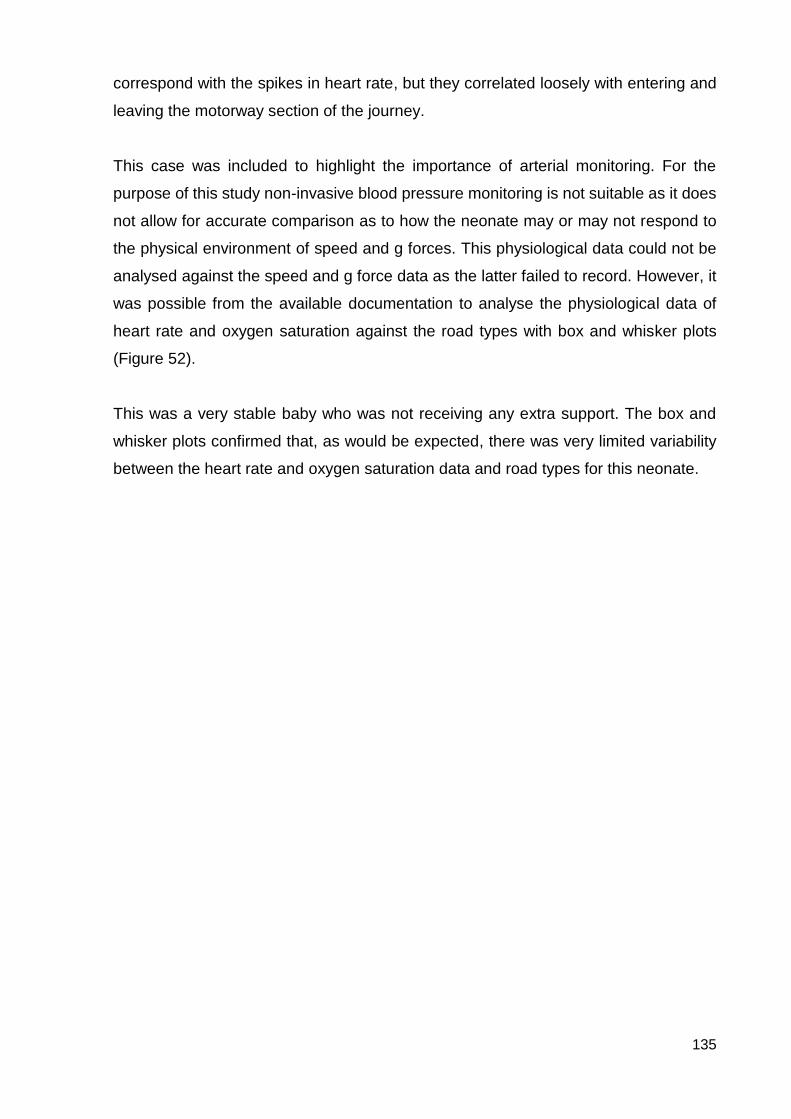
135
correspond with the spikes in heart rate, but they correlated loosely with entering and
leaving the motorway section of the journey.
This case was included to highlight the importance of arterial monitoring. For the
purpose of this study non-invasive blood pressure monitoring is not suitable as it does
not allow for accurate comparison as to how the neonate may or may not respond to
the physical environment of speed and g forces. This physiological data could not be
analysed against the speed and g force data as the latter failed to record. However, it
was possible from the available documentation to analyse the physiological data of
heart rate and oxygen saturation against the road types with box and whisker plots
(Figure 52).
This was a very stable baby who was not receiving any extra support. The box and
whisker plots confirmed that, as would be expected, there was very limited variability
between the heart rate and oxygen saturation data and road types for this neonate.
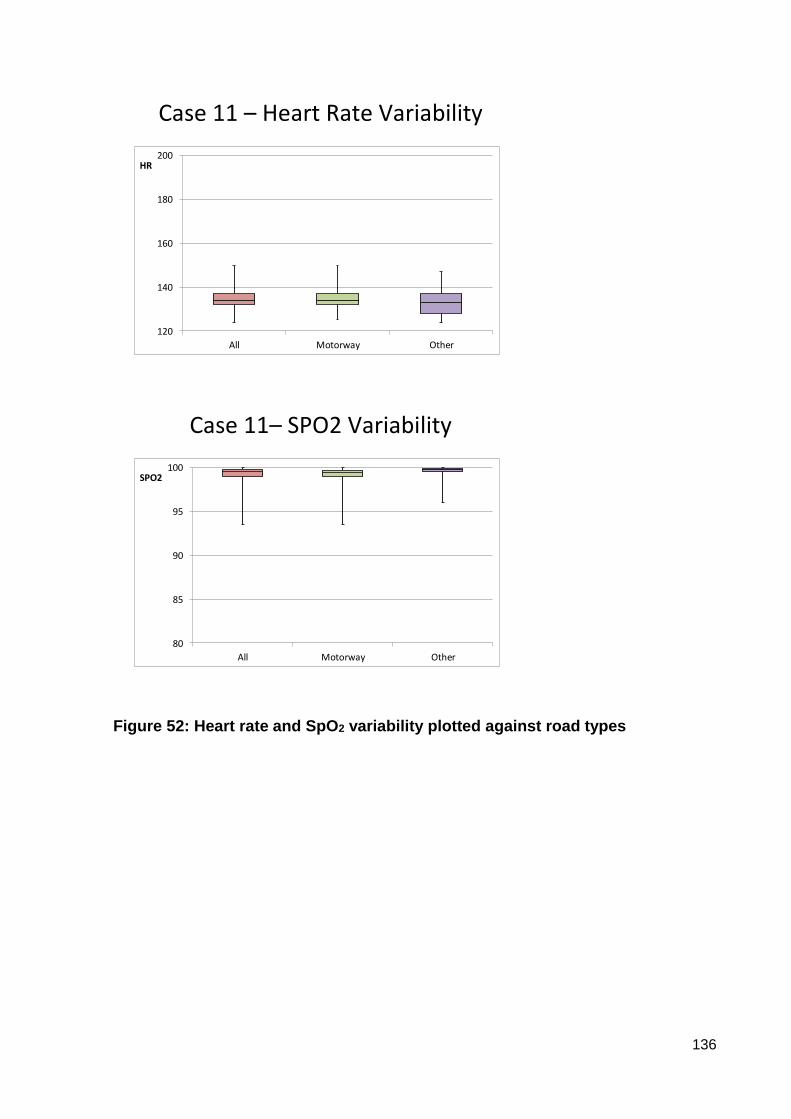
136
Case 11 – Heart Rate Variability
120
140
160
180
200
All Motorway Other
HR
Case 11– SPO2 Variability
80
85
90
95
100
All Motorway Other
SPO2
Figure 52: Heart rate and SpO2 variability plotted against road types
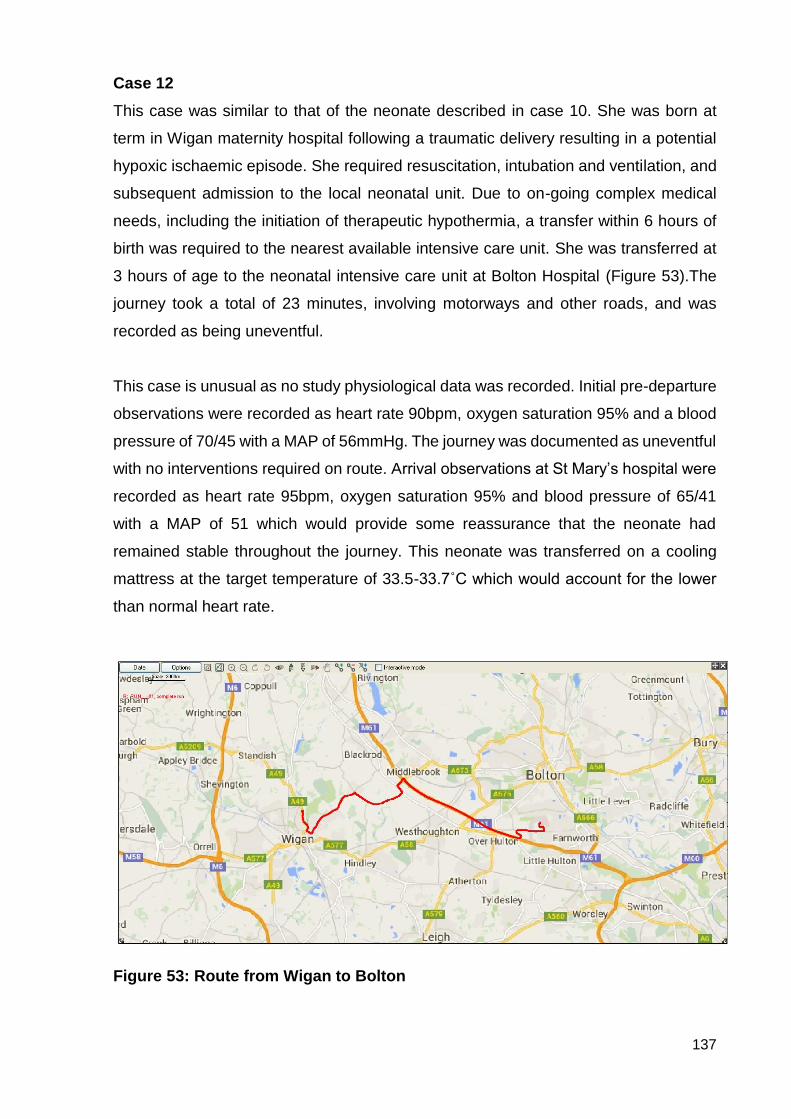
137
Case 12
This case was similar to that of the neonate described in case 10. She was born at
term in Wigan maternity hospital following a traumatic delivery resulting in a potential
hypoxic ischaemic episode. She required resuscitation, intubation and ventilation, and
subsequent admission to the local neonatal unit. Due to on-going complex medical
needs, including the initiation of therapeutic hypothermia, a transfer within 6 hours of
birth was required to the nearest available intensive care unit. She was transferred at
3 hours of age to the neonatal intensive care unit at Bolton Hospital (Figure 53).The
journey took a total of 23 minutes, involving motorways and other roads, and was
recorded as being uneventful.
This case is unusual as no study physiological data was recorded. Initial pre-departure
observations were recorded as heart rate 90bpm, oxygen saturation 95% and a blood
pressure of 70/45 with a MAP of 56mmHg. The journey was documented as uneventful
with no interventions required on route. Arrival observations at St Mary’s hospital were
recorded as heart rate 95bpm, oxygen saturation 95% and blood pressure of 65/41
with a MAP of 51 which would provide some reassurance that the neonate had
remained stable throughout the journey. This neonate was transferred on a cooling
mattress at the target temperature of 33.5-33.7˚C which would account for the lower
than normal heart rate.
Figure 53: Route from Wigan to Bolton
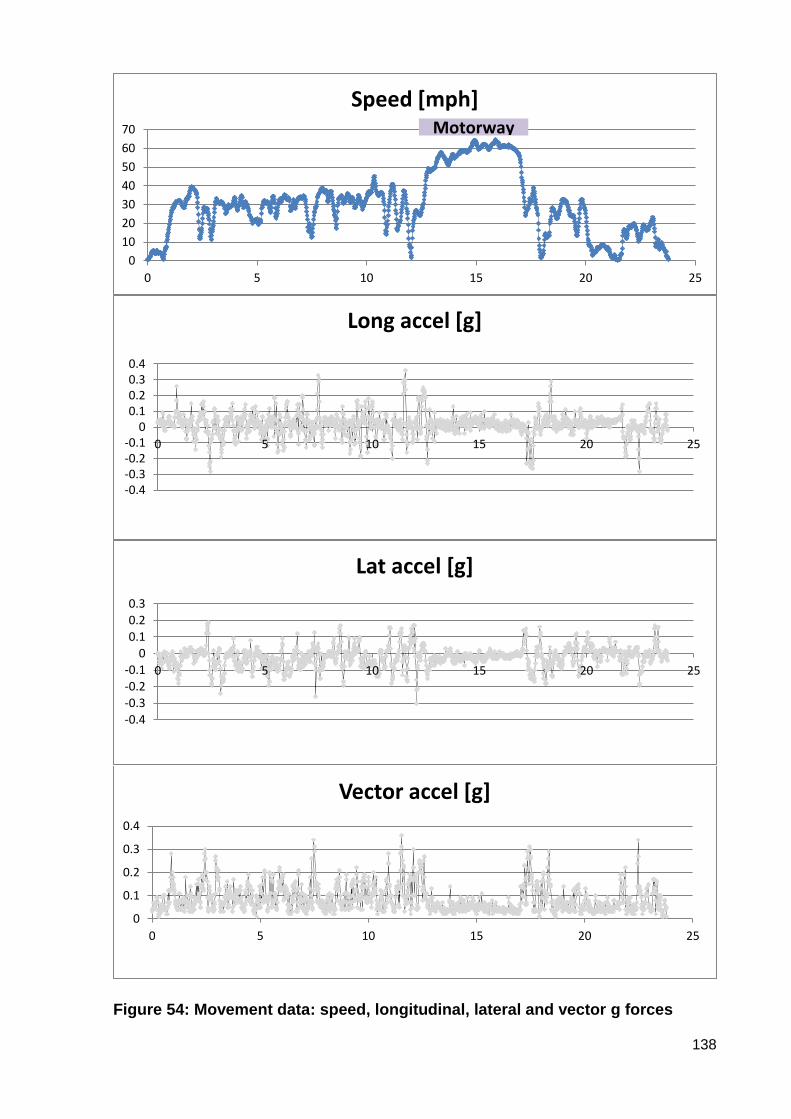
138
Figure 54: Movement data: speed, longitudinal, lateral and vector g forces
0
10
20
30
40
50
60
70
0 5 10 15 20 25
Speed [mph]Motorway
-0.4-0.3-0.2-0.1
00.10.20.30.4
0 5 10 15 20 25
Long accel [g]
-0.4
-0.3
-0.2-0.1
0
0.10.20.3
0 5 10 15 20 25
Lat accel [g]
0
0.1
0.2
0.3
0.4
0 5 10 15 20 25
Vector accel [g]

139
This journey is the same as that in case 4 with only 2 minutes difference in the length
of the journey. All the movement data was collected (see Figure 54), and when
compared to case 4 the pattern was similar, with the motorway section easily identified
regarding increasing speed, and reduced g forces in all axes. The journey in case 4
was undertaken in a fleet Mercedes, while the journey in this case was completed in
the transport team’s bespoke ambulance. When reviewing the g forces across all the
axes in more detail very little difference was found in the g forces generated despite
superior air suspension and braking systems in the bespoke ambulance.
140
SUMMARY OF FINDINGS
This study aimed to answer the question of “do speed and road conditions have an
effect on the stability of sick and preterm babies undergoing inter-hospital transfer by
ambulance?” With due regard to the restrictions imposed by the limits of incomplete,
incompatible datasets and the consequent basing of findings for this thesis on analysis
of complete datasets from seven cases, at this point a number of tentative outcomes
can be reported. These require confirmation, and this may be possible with deeper,
more complex analysis of the remaining large amount of data as a post-doctoral effort.
Support from the equipment manufacturers will be required to harness the currently
inaccessible data and to harmonise the conflicting physiological and environmental
datasets.
i. Does the baby’s gestation have any impact on the physiological stability?
The neonates overall stability could be influenced by the gestation with the extreme
preterm being more susceptible to swings in heart rate and blood pressure. Within this
study, however, the most preterm neonate (Case 4) was transferred at 42 days of age
and was more unstable due to his disease pathology rather than because of his
gestation. Case 9 involved the baby who was transferred at the earliest gestation on
the first day of life, but this was not the most unstable neonate in the study.
ii. Is it the speed, acceleration or deceleration (x axis), that has the greatest
consequence on physiological instability?
The strongest finding of this study related to speed. From the neonates included in this
study it was not the actual speed of mph that could be correlated with any physiological
instability. It was discovered that constant speed was the factor most concerned with
stability. Even those neonates that exhibited signs of stress at the beginning of the
journey started to stabilise when speed became a constant (Cases 9 and 10).
Acceleration and deceleration appeared to have some impact on some of the
neonates, but from the limited numbers it was not possible to state a definitive finding.
iii. Do the road conditions, roundabouts and cornering (y axis) or road
surface, bumps, pot holes, vibrations (z axis) have any impact on the
physiological stability?
141
Road conditions that involved smoother surfaces and prevented changes in speed due
to acceleration and deceleration were positively associated with the neonate’s stability.
However, finer aspects of this require further consideration. Additional analysis of more
cases may allow distinction between the effects of lateral forces (cornering and
roundabouts) and vertical forces (vibration, speed bumps).
iv. Does the difference covered have any effect on the overall results?
In this study there was no correlation with the distance of the journey and instability in
physiological variables. The heart rate trend increases in some patients (Cases
2,5,9,10) however it is not dependent on gestation or length of journey.
v. Does the model of ambulance used (z axis) have any influence on
physiological stability?
There were three different models of ambulance used in this study. The dedicated
vehicle SM301 was used in 7 of the journeys with the Mercedes being used in 3
journeys and no data about vehicle type in one case. There was no correlation
between cases that showed a positive outcome for one vehicle rather than another.
vi. Is one physiological sign affected more than any other?
Saturations readings are more susceptible to artefact interference in the transport
setting than some of the other physiological parameters so it is advised that they are
not used in isolation. However the saturations are one of the first parameters to signify
a change in clinical condition. Heart rate and arterial blood pressure give a more
reliable indication when used in conjunction with other parameters and are less inclined
to be affected by artefacts in the transport setting. There was no clear indication that
motorway travel, length of journey or increased speeds affects arterial blood pressure
recordings.
vii. Does the disease or treatment have an impact on how the neonate
tolerates the transfer process?
The disease process appears to exert an impact on how the neonate tolerates the
transfer process. Any disease process that impacts on the cardio vascular system has
the potential to worsen during the transport episode (Cases 3 and 8). In the selected
cases in this study, stability was found not to be related to size or gestation. Some of
the sicker neonates were bigger term infants. More cases would be needed to establish

142
these distinctions with confidence. Treatment options such as sedation and paralysis
also impact on how the neonate reacts to the environment and can mask or delay
responses, giving the impression that they are clinically stable. This aspect of hidden
instability requires further investigation.
Conclusion
The findings confirmed that some neonates in this study were negatively affected
clinically by the transport experience. Although limited in number of cases, the sample
was diverse in relation to gestation, age, underlying pathology and clinical diagnosis
which empowered the findings to challenge previous beliefs that it was only the
smallest most fragile neonates that were the most susceptible to transport stresses.
Neonates previously thought to have tolerated a transport without any effect have been
shown to display more subtle changes related to stress responses that are not initially
obvious. Some of the neonates were affected more by transport than others due to the
many confounding variables involved, but this study has indicated which variables
might be controlled in order to limit destabilisation. The study provided new knowledge
about the impact of speed on individual neonates, highlighting that speed of itself may
not be the destabilising factor. The study has raised further questions regarding the
positioning of the equipment and the neonate, ambulance type, and advantages of
dedicated drivers. It has been difficult previously to predict which neonates are more
likely to suffer adverse reactions, but this study has added to the limited knowledge
base linking disease pathology with increased risk of instability or deterioration in the
transport setting. These findings will be discussed in more detail in Chapter 6.
143
CHAPTER 6: DISCUSSION
LEARNING ABOUT STUDY DESIGN
A robust method for recording physiological parameters during a road ambulance
transfer has been established using the Trendface Solo software. This method allowed
specific parameters to be recorded which could if required be different from the
constant monitoring displayed throughout the transfer. It is hoped that this will be of
use for routine data collection and future research projects. There is no published
literature to show the effect of speed and acceleration during transfer on neonatal
physiology, stability or long-term outcome. Karlsson et al (2011) investigated the effect
of sound and vibration on heart rate during air and ground transfer and concluded that
it was the sound that had a greater influence however sound levels were not recorded
in this study.
This study is one of the first that has demonstrated the reliability of using available
software to collect additional or patient specific robust physiological data that can be
replicated in future studies.
REVISIONING STABILITY
Determining an appropriate parameter to represent physiological stability requires
further study with a larger cohort, but in this study arterial blood pressure recording
was not subject to artefacts and correlated well with changes displayed in the oxygen
saturation levels and fluctuations in heart rate. It was noted that there was a large
degree of variability in physiological parameters depending upon the gestational age,
weight and clinical condition of the infant. Some interesting trends in the physiological
data were noted which, when they are subtle and remain within normal parameters,
may not be noticed during the transfer. When these recordings are plotted
retrospectively, however, a neonate who was previously classed as being stable with
no significant physiological changes may actually be seen to have been displaying a
reaction to the transfer experience. It is recognised that there were many variables
affecting the neonates involved in this study, and it may be wise when repeating the
study to amend the inclusion criteria to narrow the variables. This may be achieved by
limiting the gestation range or the range of diagnoses. It may be useful in future studies
to have a baseline recording before undertaking the transfer, as some degree of
variability will be a natural condition for most neonates - increasingly so for the sicker
144
or more immature babies. This variability could then be assessed by statistical
analysis.
This study was the first to address the issue of identifying which recorded physiological
variable responds most accurately to the changes that are occurring in the transport
setting. This knowledge will support clinical decision-making when faced with an
extremely sick neonate who requires a transfer.
THE CHALLENGE AND VALUE OF 3-AXIS MEASUREMENT
Previous published studies have not demonstrated a method for collecting forces in all
three axes against speed. By using the DL1 data logging device from Race Technology
a reliable method for collecting movement data has been established, and, once initial
training issues were resolved, this worked very well. However, improvements can be
made to this. The aim was to create a precise picture of the multidirectional forces
experienced by the neonate during road transfer synchronised with the physiological
parameter recordings. This aim was achieved and it was possible to establish some
relationship with speed, road conditions and physiological parameters, however it was
not possible to achieve this to a sufficient level of accuracy to enable precise statistical
correlations between g forces and stability. Ideally, the monitoring device should be
attached to or in close proximity to the patient. Due to safety issues and the size and
weight of the DL1 device, it had to be secured to the base section of the transport
incubator.
There are factors to consider, such as the mattress beneath the neonate, as these
have been shown to ameliorate vibrational forces experienced. The use of different
mattresses to reduce vibrations to the neonate have been the focus of several studies
(Sherwood et al 1994, Gajendragadkar et al 2000, Shah et al 2008 and Prehn et al
2015). All of these studies used mannequins to test different mattresses over a typical
transport route and found that a gel-based mattress was the most effective at reducing
vibration forces to the mannequin.
Other studies used incubator trolley modifications to achieve the same result
(Campbell et al 1984 and Browning et al 2008). When designing this study the
recommendations from these previous studies were considered and it was decided not
to make any modifications to the current equipment available. This study did not aim
145
to measure high-frequency vibrations but more the gross “jolting” movements that are
sometimes experienced. To reduce some of the extraneous variables introduced by
equipment all the neonates included in this study were transported using the same
transport trolley with the same standard mattress. With the limitations on equipment,
study personnel and the ethical issues to consider for this patient group, the study
design that was adopted was appropriate for this research project.
This is the first study that has used the real time experience with live neonates
measuring all three axes against speed for the whole of the journey episode.
ROUTE, ROAD SPEED, AND PLANNING AHEAD
The overall objective was to combine the physiological and movement data sets to
produce a quantitative analysis of the effect of road speed and g-forces on the
physiological condition of the neonate. A sound approach and study design were
developed which can be used in a larger project to produce meaningful results. New
findings include that it is not the actual speed (mph) that impacts on physiological
changes or g forces. Out of the eight cases which had movement data, the seven that
all included motorway sections demonstrated that it was a constant speed and type of
road that reduced the g forces across all the axes. The transport team involved in this
study did not have any dedicated drivers, so the ambulance drivers decided which
route was to be taken for each journey. This route could be decided by using the
satellite navigation system or by personal knowledge or preference. The findings from
this study add evidence to the argument that specialised transport teams should have
dedicated drivers so that optimal routes can be planned in advance with the input of
the whole team. It may be that the journey that should be planned perhaps uses a
longer route in actual miles covered but one that utilises motorways and dual
carriageways more that decreases the amount of acceleration and deceleration and
consequently the g forces.
The lack of deterioration observed in the cases in this study may be related to transfer
being undertaken by a dedicated transport team of highly trained, experienced nurses
and doctors who were exposed on an almost daily base to the challenges of neonatal
transport. The team in this study had a single dedicated vehicle but is one of the few
teams across the United Kingdom that do not have dedicated ambulance drivers.
Although seven of the neonates were transferred in the dedicated vehicle, the study
146
did not take into account the driving styles of the accompanying drivers. The current
drivers were all paramedics or technicians employed by the local ambulance service
who had “blue light” driving training. They were allocated to the dedicated vehicle as
and when a transfer was required so there was no control over the selection of the
driver, whether newly qualified technician or very experienced paramedic.
This is the first study to have demonstrated that it is constant speed that provides the
most stable environment for the transported neonate. Understanding the relationship
between the variables of the journey and clinical stability has contributed to the
evidence base for transport personnel.
STRESS
Continuous monitoring of the neonates ensures that attending staff are alerted quickly
to any deterioration that may be occurring. In this study, no episodes of clinical
deterioration that required any interventions during the transport event were
documented for any of the neonates. However, some of the neonates exhibited subtle
stress signs such as raised heart rate and variable oxygen saturation that indicated
that they were affected by the journey. Stress in the neonate in intensive care units
has long been recognised and is often associated with increased noise levels.
Developmental care, including noise reduction strategies, have been implemented to
minimise physiological disturbances and to promote optimal long-term development. A
transport episode is recognised as being a stressful, noisy event for the neonate, but
this has been regarded as being unavoidable in order to receive optimal, sometimes
lifesaving, treatment elsewhere.
There is little published evidence regarding stress specifically in the transport
environment, but Shoo et al (2001) were one of the first to publish a tool to assess
physiological stability in infants undergoing transfer. This was based more on
identifying responses rather than preventing effects. Harrison and colleagues in 2011
advanced this further by implementing developmental care within the transport setting
and developed a pain score to try to identify which part of the transfer was most
disruptive to the neonate. The results were that even with developmental care
neonates of all gestations experienced increasing discomfort during transport. These
results were replicated in this study, with neonates who were considered to be stable
showing subtle changes in physiological stability including increased heart rate,
147
increased blood pressure and temperature instability. A change in practice may be
indicated from these findings to reconfigure the monitors that record the vital signs to
allow a trend analysis to be displayed which may facilitate earlier recognition of stress
responses that the neonate is experiencing.
RETHINKING THE POSITIONING OF THE INFANT
The position of the neonate when being transferred is dictated by practice and
circumstance rather than by evidence. During transport in a standard road ambulance
the patient is supine and normally lying facing away from the direction of travel (head
toward the front of the vehicle). The patient will therefore be subjected primarily to
horizontal g-forces acting along the longitudinal axis. Acceleration will tend to force
blood away from the head, towards the feet and extremities, resulting in reduced
venous return, reduced cardiac output and hypotension (Hurd & Jernigan 2002,
Woodward et al 2007). Deceleration will have the opposite effect, forcing blood towards
the head, leading to increased venous return; increased cerebral blood volume and
potentially increased intracranial pressure (Martin 2006). Patients transferred by air will
be subjected to both horizontal and vertical axis g-forces. In addition to the gross
haemodynamic disturbances described above, acceleration and deceleration forces
can result in the movement of fluid from the intravascular to the interstitial
compartments. These fluid shifts may be significant in the critically ill patient with, for
example, systemic inflammatory response syndrome and capillary leak. This can result
in intravascular volume depletion and hypotension, with interstitial fluid accumulation,
for example in the peripheral tissues (tissue oedema) and lungs (pulmonary oedema)
(Martin 2006).
During the study, the babies were transported using the custom built neonatal intensive
care trolley (Figure 13). Although custom built by ParAid® Medical the equipment sits
on a trolley that is compatible with the Ferno® Lock and Load device that is used by
the North West Ambulance Service (NWAS) to secure all their trolleys As NWAS is the
current supplier of ambulances to undertake all neonatal transfers across the North
West it was imperative that they were involved in the planning and design of the current
neonatal trolley to ensure that it conforms to the recognised British Standards relating
to the transportation of incubators (BSEN 13976-2:2011).The Lock and Load device is
secured in all Northwest ambulances to accommodate trolleys that conform to the
following specifications: height 922mm, width 596mm, length 1907mm (Figure 14).
148
Due to ambulance build and loading specifications the trolleys have to be mounted on
the right hand side of the vehicle where modifications have been made to
accommodate the extra weight (see Figure 15). Care had to be taken in the design
build that when using NWAS fleet the equipment on top of the trolley would fit within
the equipment layout of the standard ambulance.
The neonates in this study were all transferred in the traditional way and it was not
within the remit of the study to investigate the incidence of IVH. Clearly, at present the
positioning of the neonate is not optimal and may even be detrimental. This study has
provided some evidence that the manufacture of bespoke neonatal vehicles or trolleys
may be required. A revised design may be required so that the neonate is positioned
within the incubator in a lateral position so that the acceleration forces occur across
the body thus having less of a physiological effect with blood pooling or
increasing/decreasing cerebral oxygenation.
As an interim measure, it may be that with some modification to the equipment
currently available this study could be repeated with the smaller neonates being nursed
in a lateral position within the incubator (that is, with the incubator in its normal position
and orientation but the baby lying across the incubator). Further research about
positioning combined with that carried out by Valente et al (2016) investigating cerebral
oxygenation during transport may add to the body of evidence that practice needs to
change to protect the most vulnerable of patients.
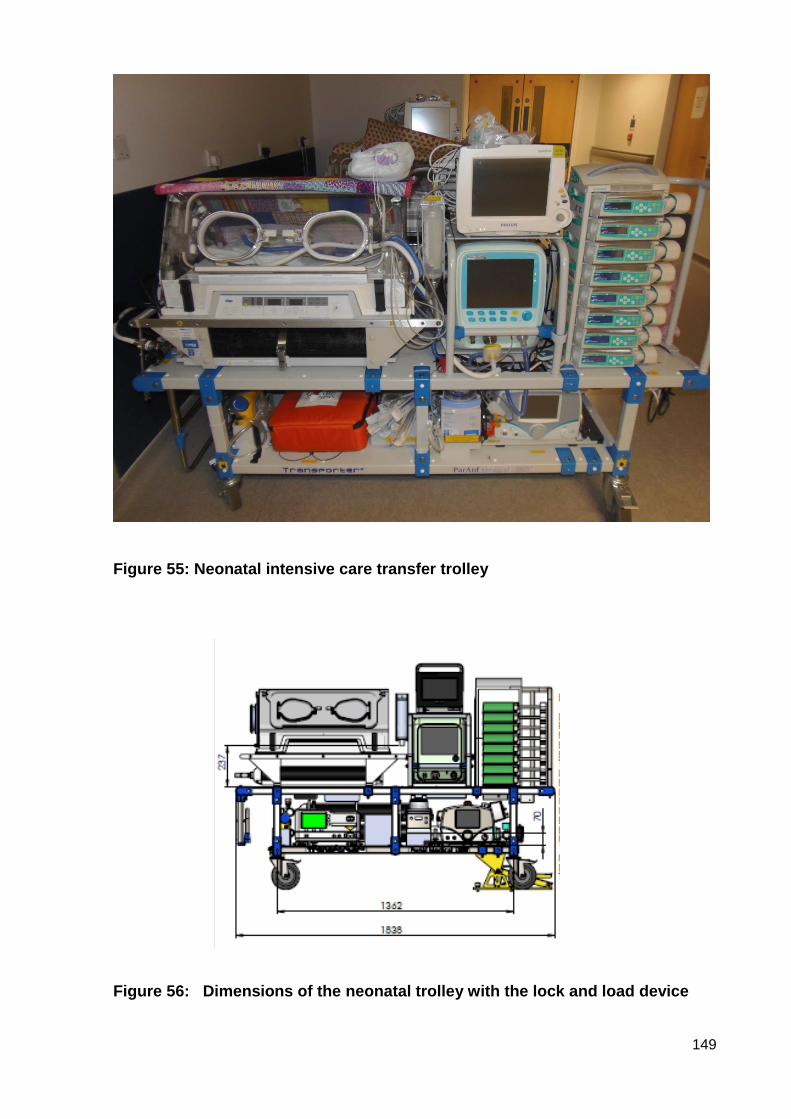
149
Figure 55: Neonatal intensive care transfer trolley
Figure 56: Dimensions of the neonatal trolley with the lock and load device
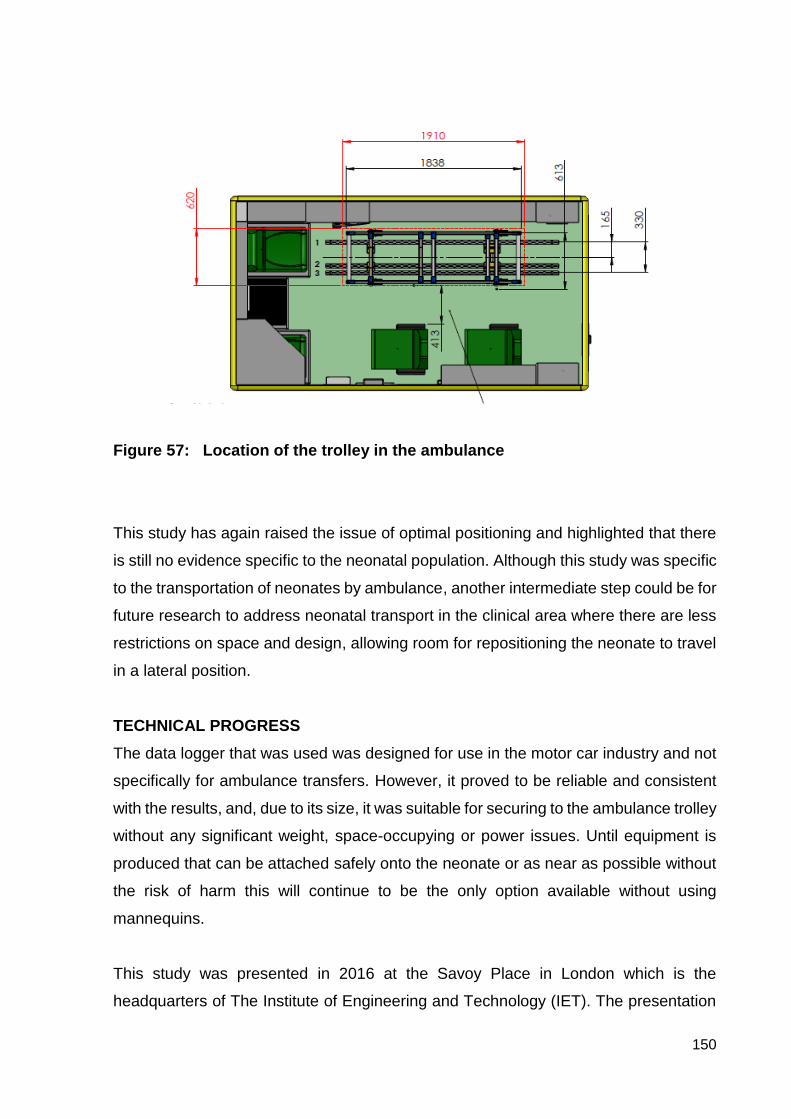
150
Figure 57: Location of the trolley in the ambulance
This study has again raised the issue of optimal positioning and highlighted that there
is still no evidence specific to the neonatal population. Although this study was specific
to the transportation of neonates by ambulance, another intermediate step could be for
future research to address neonatal transport in the clinical area where there are less
restrictions on space and design, allowing room for repositioning the neonate to travel
in a lateral position.
TECHNICAL PROGRESS
The data logger that was used was designed for use in the motor car industry and not
specifically for ambulance transfers. However, it proved to be reliable and consistent
with the results, and, due to its size, it was suitable for securing to the ambulance trolley
without any significant weight, space-occupying or power issues. Until equipment is
produced that can be attached safely onto the neonate or as near as possible without
the risk of harm this will continue to be the only option available without using
mannequins.
This study was presented in 2016 at the Savoy Place in London which is the
headquarters of The Institute of Engineering and Technology (IET). The presentation
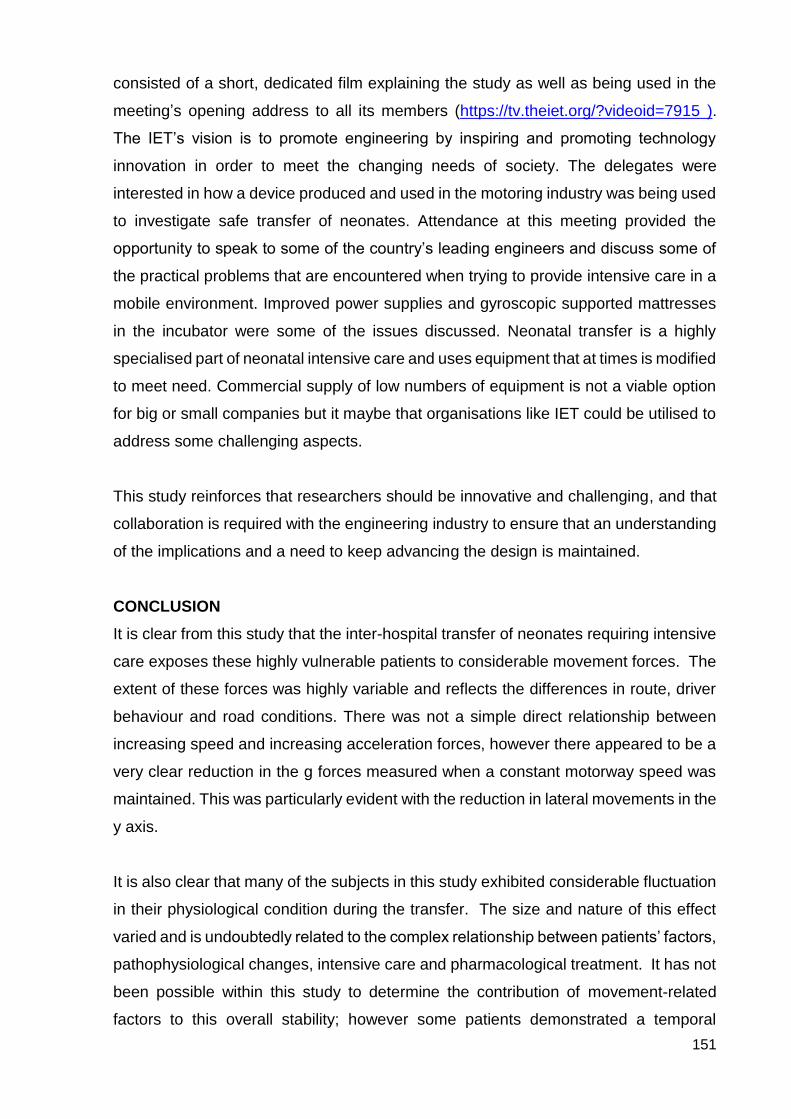
151
consisted of a short, dedicated film explaining the study as well as being used in the
meeting’s opening address to all its members (https://tv.theiet.org/?videoid=7915 ).
The IET’s vision is to promote engineering by inspiring and promoting technology
innovation in order to meet the changing needs of society. The delegates were
interested in how a device produced and used in the motoring industry was being used
to investigate safe transfer of neonates. Attendance at this meeting provided the
opportunity to speak to some of the country’s leading engineers and discuss some of
the practical problems that are encountered when trying to provide intensive care in a
mobile environment. Improved power supplies and gyroscopic supported mattresses
in the incubator were some of the issues discussed. Neonatal transfer is a highly
specialised part of neonatal intensive care and uses equipment that at times is modified
to meet need. Commercial supply of low numbers of equipment is not a viable option
for big or small companies but it maybe that organisations like IET could be utilised to
address some challenging aspects.
This study reinforces that researchers should be innovative and challenging, and that
collaboration is required with the engineering industry to ensure that an understanding
of the implications and a need to keep advancing the design is maintained.
CONCLUSION
It is clear from this study that the inter-hospital transfer of neonates requiring intensive
care exposes these highly vulnerable patients to considerable movement forces. The
extent of these forces was highly variable and reflects the differences in route, driver
behaviour and road conditions. There was not a simple direct relationship between
increasing speed and increasing acceleration forces, however there appeared to be a
very clear reduction in the g forces measured when a constant motorway speed was
maintained. This was particularly evident with the reduction in lateral movements in the
y axis.
It is also clear that many of the subjects in this study exhibited considerable fluctuation
in their physiological condition during the transfer. The size and nature of this effect
varied and is undoubtedly related to the complex relationship between patients’ factors,
pathophysiological changes, intensive care and pharmacological treatment. It has not
been possible within this study to determine the contribution of movement-related
factors to this overall stability; however some patients demonstrated a temporal

152
relationship between periods of constant motorway speeds with improvement in their
stability.
This study has allowed the research techniques to be refined and has provided the
background data to support a larger prospective study and to develop a further line of
investigation including comparing motorway versus non-motorway routes. It has
identified that collaborative working can result in innovative approaches to data
collection in order to achieve research aims.
153
CHAPTER 7: CONCLUSIONS
With the landscape of national neonatal and maternal reconfiguration continuing to
evolve, neonatal transfer will continue to be part of the experience that some sick or
preterm neonates will have to undergo. There is limited evidence surrounding the
effects of noise and vibration on the long term outcome of those undergoing transfer,
but increased risk of IVH has been suggested. When moving a neonate for whatever
reason the aim is to continue intensive care and maintain or improve the clinical
condition. To maintain clinical stability is of the upmost importance as it is the labile
swings in blood pressure that can cause IVH which can lead to increased neonatal
morbidity with problems such as cerebral palsy, learning difficulties, deafness,
blindness and sometimes death.
Neonatal transport practice is often dictated by the research that promotes change on
the neonatal units. As neonatal transport has become increasingly recognised as a
sub-speciality the pace of specific research has been lacking. This study has added
current evidence to the national and international research base. New knowledge has
emerged from this study that has challenged existing beliefs of what caused
destabilisation whilst being transferred, and this is knowledge that will provide evidence
for future commissioning of services to ensure equitable safe transfers for all those that
require it.
The study was especially important for the following reasons.
1) This was the first study in the world to observe the physiological effects
of transport on a live neonate.
This is important because historical studies have used mannequins which, although
they can represent the physical size and weight of a neonate, do not respond in a
physiological manner. Even the most modern of mannequins are rigid rubber and
plastic imitations that are at all times immobile with no spontaneous movements and
with fixed tone. Moreover, they are not susceptible to fluid shifts in body compartments.
They are not comparable with a real life baby who moves spontaneously, and whose
tone is related to development, disease processes and drug actions.
154
2) This study is the first of its kind to use the true transport experience with
live neonates whose care and treatment is not influenced by the research
design.
This is ground-breaking research as due to ethical issues in this vulnerable group it is
not possible to conduct RCTs or experimental studies that expose neonates to
interventions that are not necessary. Rather than driving on artificial routes on an
airfield, or the use of equipment which itself exerts an effect on the baby’s physiology,
this study was based on normal journeys and designed to overcome the problems of
researcher effect. The study design confirmed that invasive arterial blood pressure
monitoring during normal journeys gives the most accurate prediction of stability and
should be a high priority in the pre-stabilisation of any sick neonate who has to undergo
a transfer.
3) This study has provided for the first time real-time responses for a whole
journey experience for a wide range of neonates.
This innovative insight into the experience for the neonate has enabled observation of
how the additional stresses of the transport experience can manifest itself across a
wide range of patients from the extremely preterm to the sickest of term neonates. The
study has highlighted that even “well” neonates display subtle signs of stress, and
transport staff need to remain vigilant in observing minor changes in physical
parameters.
4) This is the first study that has used the real time experience with live
neonates measuring all three axes against speed for the whole of the
journey episode.
This study has found that constant speed is a stabilising factor during the transport
journey. This is new knowledge and challenges the long held perception that it is high
speed itself that contributes to the neonate’s deterioration. This new knowledge is
vitally important in initiating change to planning transfers in order to minimise adverse
effects which can lead to lifelong disabilities for some neonates.
5) This study is one of the first to demonstrate the reliability of using
available software and equipment to collect additional, robust patient-
specific physiological data.

155
The implications are that this study design can be replicated in future studies
worldwide. Advances in technologies are allowing research to be conducted in areas
that were once thought impossible. I did this study with equipment that was light weight
portable and compatible with the current transport medical equipment that we were
using.
MESSAGES FOR CLINICAL PRACTICE
The outcomes of this study offer insights into aspects of neonatal transfer that would
bear further review. The following insights were developed from the study
Journey routes could be planned to ensure that constant speeds are maintained
and harmful g forces are reduced. In the location of this study, a wide catchment
area, individual drivers selected the route or followed satellite navigation
suggestions. Understanding the impact of various g forces on babies at key points
during the observed journeys suggests that choke points can be predicted and
approached in a manner to reduce the impact on the baby. A compilation of
recommended routes could be constructed, together with annotations of critical
points and required action.
The adequacy of monitoring of apparently well neonates was brought into question.
The stable yet abnormal physiological recording observed in such cases indicated
hidden stress responses. The transport team would do well to be aware of such
phenomena and consequently responsive to these subtle signs of stress. More
research is needed to clarify this phenomenon further.
The problems associated with lack of (or failure of) invasive arterial blood pressure
monitoring were highlighted in the study. It would be advantageous to the baby if
all staff involved in preparation for or conduct of neonatal transport appreciated the
vital importance of achieving maintaining this arterial access in sick neonates
before the journey commences.
Current restraints to the positioning of the neonate in the ambulance seem likely to
have been partly responsible for the negative impacts observed in the babies. The
fore-and-aft arrangement is prejudicial to physiological resilience to unavoidable g
forces particularly in the x-axis. Lateral positioning of the infant would be beneficial
156
in reducing the effect of acceleration and deceleration (the greatest and most
frequent forces identified in this study) on fluid shift to and from the brain would be
minimised. This could be achieved either by a redesigned trolley (though this has
major implications for whole ambulance design), or by providing for a swivel and
lock mechanism to turn the incubator through 90 degrees on the existing trolley
once secured in the ambulance.
MESSAGES FOR POLICY
Commissioning for neonatal transport services is variable across the country, with the
team in Manchester being one of only three that do not have dedicated drivers. It also
has only one dedicated ambulance. Data from the National Transport Group already
feeds into reports on nationally agreed standards regarding response and stabilisation
times and outcome measures. Teams that do not have dedicated ambulances and
drivers are persistently unable to meet the standards. This study highlights the
difficulties of managing the transport experience to achieve the best possible outcomes
when the ambulance personnel are not integrated into the team. Ensuring equity and
equality for this vulnerable group depends upon commissioning teams being informed
of best practice to guide decision-making. The outcomes from this study should add to
the evidence-base for this.
MESSAGES FOR FUTURE RESEARCH
This was a small study with limited resources and a small sample. Replication on a
national scale by all the transport teams from the United Kingdom would provide a
study that would increase the reliability and validity of the results. The increasing
organisation and standardisation in practices and equipment being brought about by
the National Transport Group in neonatal transport across the United Kingdom may
reduce some of the confounding variables that would otherwise be inevitable when
using a multi-site design.
Further research in neonatal transport is required to explore further the difference in
physiological responses between motorway and non-motorway journeys. A larger
sample would allow for valid statistical correlation between (for example) speed and
lateral forces during cornering.
157
More data is needed to explore in detail the differences in stress responses during
transport between term and preterm neonates.
Oxygenation levels in the neonatal brain (measured by near infra-red monitoring)
during transport require deeper examination to establish the influence of speed,
acceleration, deceleration, disease and treatment processes.
Once alternative provision is made possible, further research is needed to investigate
the optimal transport position when transferring neonates in ambulance, and perhaps
also within hospitals.

158
REFERENCES
Akobeng AK (2016) Understanding type I and type II errors, statistical power and
sample size. Acta Paediatrica 105: 605–609. doi:10.1111/apa.13384
Allmark P, Mason S (2006) Improving the quality of consent to randomised controlled
trials by using continuous consent and clinician training in the consent process. Journal
of Medical Ethics 32:439-443.
Attia A (2005) Bias in RCTs: confounders, selection bias and allocation concealment.
Middle East Fertility Society Journal. 10(3) 258-261.
Azzopardi D, Strohm B, Edwards AD, Dyet L, Halliday LH, Juszczak E, Kapellou O,
Levene M, Marlow N, Porter E, Thoresen M, Whitelaw A, Brocklehurst P (2009)
Moderate hypothermia to treat perinatal asphyxial encephalopathy. New England
Journal of Medicine 361: 1349-1358.
Banerjee A, Chitnis UB, Jadhav SL, Bhawalkar JS, Chaudhury S. (2009)
Hypothesis testing, type I and type II errors. Industrial Psychiatry Journal, 18(2):127
131
British Association of Perinatal Medicine (2010) Service standards for hospitals
providing neonatal care. 3rd Edition. London: BAPM.
Barker CD, Lorimer AR (2000) Cardiology: the development of a managed clinical
network. British Medical Journal 321: 1152-1153.
Bastug O, Gunes T, Korkmaz L, Elmali F, Kucuk F, Ozturk MA, Kurtoqlus S (2016) An
evaluation of intra-hospital transport outcomes from tertiary neonatal intensive care
unit. The Journal of Maternal-Fetal & Neonatal Medicine. 29(12) 11993-1998.
Berhan Y, Berhan A (2014) A meta-analysis of socio-demographic factors for perinatal
mortality in developing countries: a subgroup analysis of the national surveys and small
scale studies. Ethiopian Journal of Health Sciences. 24(0 Suppl): 41-54.

159
Bettany-Saltikov J (2012) How to do a systematic literature review in nursing: a step-
by-step guide. Maidenhead: McGraw-Hill/Open University Press.
Bouchut JC, Lancker EV, Chritin V, Gueugniaud PY (2011) Physical stressors during
neonatal transport: helicopter compared with ground ambulance. Air Medical Journal
30 (3) 134-139.
Broughton SJ, Berry A, Jacobe S, Cheeseman P, Tarnow-Mordi WO, Greenough A
(2004) The mortality index for neonatal transportation score: a new mortality prediction
model for retrieved neonates. Pediatrics 114(4) e424-428.
Browning J, Walding D, Klasen J, David Y (2008) Vibration issues of neonatal
incubators during in-hospital transport. Journal of Clinical Engineering 33(2) 74-77. doi:
10.1097/01.JCE.0000305869.41200.be
Burns N, Grove S (2006) Understanding nursing research: developing an evidence-
based practice. 4th edn. Elsevier Saunders, Edinburgh.
Button KS, Ioannidis JPA, Mokrysz C, Nosek BA, Flint B, Robinson ESJ, Munafò MR
(2013) Power failure: why small sample size undermines the reliability of neuroscience.
Nature Reviews Neuroscience 14: 365-376. doi:10.1038/nrn3475
British Standards Institute (2011) BSEN13976-2:2011 Rescue systems -
transportation of incubators. System requirements. London: BSI Standards
Publication.
Campbell A, Lightstone AD, Smith JM, Kirpalani H, Perlman M (1984) Mechanical
vibration and sound levels experienced in neonatal transport. American Journal of
Diseases in Childhood 138: 967-970.
Carlson MDA, Morrison RS. (2009) Study design, precision, and validity in
observational studies. Journal of Palliative Medicine, Vol 12 (1) 77-82

160
Carter DE, Porter S (2000) Validity and reliability. In Cormack D (ed.) The Research
Process in Nursing. 4th edition. Oxford, Blackwell Science. 29-42.
Chien LY, Whyte R, Aziz K, Thiessen P, Matthew D, Lee SK (2001) Improved outcome
of preterm infants when delivered in tertiary care centres. Obstetrics & Gynaecology
98: 247-252.
Cifuenetes J, Bronstein J, Phibbs CS, Phibbs RH, Schmitt SK, Carlo WA (2002)
Mortality in low birthweight infants according to level of neonatal care at hospital of
birth. Paediatrics 109:745-51.
Clegg F (2009) Simple statistics. A course book for the social sciences. Cambridge:
Cambridge University Press.
Clifford C (1997) Nursing and health care research: a skills- based introduction (2nd
ed). London: Prentice Hall.
Collins English Dictionary (2012) Complete and & Unabridged 2012 Digital Edition.
Confidential Enquiry into Maternal and Child Health (2009) Perinatal mortality 2007:
United Kingdom. London: CEMACH.
Confidential Enquiry into Stillbirths and Deaths in Infancy (2003) CESDI Project 27/28
An enquiry into the quality of care and its effects on the survival of infants born at 27-
28 weeks. Norwich: The Stationery Office.
Costello KL, Hennessy EM, Haider S ,Stacey F, Marlow N, Draper ES (2012) Short-
term outcomes after extreme preterm birth in England: comparison of two birth cohorts
in 1995 and 2006 (the EPICure studies). BMJ 345: e7976.
Critical Appraisal Skills Programme (2013) CASP checklists. Oxford: CASP.
http://www.casp-uk.net/#!casp-tools-checklists/c18f8
Crombie IK (1997) The pocket guide to critical appraisal. a handbook for health care
professionals. London: BMJ Publishing Group.

161
Cullum N, Ciliska D, Haynes RB, Marks S (2013) Evidence-based nursing: an
introduction. Oxford: Wiley-Blackwell.
Cusack J, Field D, Manktelow B (2007) Impact of service changes on neonatal transfer
patterns over 10 years. Archives of Diseases in Childhood Fetal and Neonatal Edition
92: F181-F184.
Dady I, Sutton N, Hall V, Byrne S, Jackson C, Sands J (2000) North Western Regional
Transport Survey. Unpublished report. North Western Perinatal Survey Unit, St Mary’s
Hospital, Manchester.
D’Apolito K (1991) What is an organised infant? Neonatal Network 10(1) 23-29.
Department of Health (1999) Making a difference. London: The Stationery Office.
Department of Health (2001) Seeking consent: working with children. London: DH.
http://www.dh.gov.uk/consent (Accessed 1st March 2001).
Department of Health (2003a) Neonatal intensive care services: report of the
Department of Health expert working group. London: DH.
Department of Health (2003b) Neonatal intensive care review: Strategy for
improvement. London: DH.
Department of Health (2004a) Change for children - Every child matters. London: DH.
Department of Health (2004b) National service framework for children, young people
and maternity services. London: DH.
Department of Health (2004c) Modernising medical careers: The next steps. London:
DH.
Department of Health (2009) Toolkit for high-quality neonatal services. London: DH.
162
Edwards AD, Yue X, Squier MV, Thoresen M, Cady EB, Penrice J, Cooper CE, Wyatt
JS, Reynolds EO, Mehmet HM (1995) Specific inhibition of apoptosis after cerebral
hypoxia-ischaemia by moderate post-insult hypothermia. Biochemical and Biophysical
Research Communications 217(3) 1193-1199.
Fenton A (2009) History and challenges of neonatal emergency transport services,
Neonatal Emergencies. A practical guide for resuscitation, transport and critical care
of the newborn infants. Cambridge University Press.
Fenton A (2012) What have the networks ever done for us? A paediatric view. The
Obstetrician and Gynaecologist 14(1) 55-57 DOI: 10.1111/j.1744-4667.2011.00075.x
Gajendragadkar G, Boyd JA, Potter DW, Mellen BG, Hahn GD, Shenai JP (2000)
Mechanical vibration in neonatal transport: a randomised study of different mattresses.
Journal of Perinatology 5:307-310.
Gale C, Santhakumaran S, Nagarajan S, Statnijov Y, Modi N (2012) Impact of
managed clinical networks on NHS specialist neonatal services in England: population
based study. BMJ 344(2105) 1-15.
GMNeTS (2014) Greater Manchester Neonatal Transport Service - Annual Report
2013-2014. Unpublished.
Goenka A, Bhoola R, McKerrow N (2012) Neonatal blood gas sampling methods,
South African Journal of Child Health 6(1) 3-9.
Greater Manchester Neonatal Network (2015) Greater Manchester Neonatal Network
biannual report April 2012-March 2015. Greater Manchester, East Cheshire and High
Peak Children, Young People and Families’ Network. Unpublished.
Green DA, Bray A, Golding JF, Bronstein AM, Gresty MA (2006) Tachypnea and
hypocapnia are induced by ‘buffeting’ in vehicles. Clinical Autonomic Research. 16:
281-285.
163
Greenhalgh T (2006) How to read a paper: The basics of evidence based medicine.
(3rd Ed). BMJ Books. London: Blackwell Publishing.
Harrison C, McKechine L (2011) How comfortable is neonatal transport? Acta
Paediatrica 101(2) 143-7. doi: 10.1111/j.1651-2227.2011.02467.x.
Hastings C, Fisher CA (2014) Searching for proof: creating and using an actionable
PICO question. Nursing Management 45(8) 9-12.
HM Government UK (2015a) Working together to safeguard children: A guide to inter-
agency working to safeguard and promote the welfare of children.
https://www.gov.uk/government/uploads/system/uploads/attachment_data/file/41959
5/Working_Together_to_Safeguard_Children.pdf Accessed 28th January 2016.
HM Government UK (2015b) Parental rights and responsibilities.
https://www.gov.uk/parental-rights-responsibilities/what-is-parental-responsibility
Accessed 28th January 2016
Health & Social Care Information Centre (2014) NHS Outcomes Framework (pg 34).
London: DH. http://www.hscic.gov.uk/catalogue/PUB13635/nhs-out-fram-ind-feb-
14.pdf (Accessed 05th December 2015).
Hurd WW, Jernigan JG (2003) Aeromedical evacuation: management of acute and
stabilised patients. New York: Springer
International Standards Organisation (1978) International Standards (2nd ed). Geneva:
Organisation for Standardization.
James A, Cherian S (2010) Pathophysiology of perinatal hypoxia-ischaemia.
Paediatrics and Child Health 20(8) 351-355.
Jepson P, Johnson SP, Gillman MW, SØrensen HT. (2004) Interpretation of
observational studies. Heart 90:956-960 www.heartjnl.com (Accessed 05th December
2016)
164
Johnson S, Hennessy EM, Smith R, Trikic R, Wolke D, Marlow N (2009) Academic
attainment and special educational needs in extremely preterm children at 11 years of
age: the EPICure study. Archives of Disease in Childhood. Fetal and Neonatal Edition
94(4) F283–F239.
Karlsson B-M, Lindkvist M, Lindkvist M, Karlsson M, Lundstrom R, Hakansson S,
Wiklund U, van den Berg J (2011) Sound and vibration: effect on infants’ heart rate
and heart rate variability during neonatal transport. Acta Paediatrica 101(2) 148-54.
doi: 10.1111/j.1651-2227.2011.02472.x.
Kirrane H (2010) The chance of a lifetime? Bliss Baby Report. London: Bliss.
Kollee LA, Brand R, Schreuder AM, Ens-Dokkum MH, Veen S, Verloove-Vanhorick SP
(1992) Five year outcome of preterm and very low birth weight infants: a comparison
between maternal and neonatal transport. Obstetrics and Gynaecology 80: 635-638.
Kumar P (2013) Use of inhaled nitric oxide in preterm infants. Paediatrics 113-164.
Lalan S, Bloey D (2014) Comparison between oscillometric and intra-arterial blood
pressure measurements in ill preterm and full-term neonates. Journal of the American
Society of Hypertension 8(1) 36-44.
Laptook A, Tyson J, Shankaran S, McDonald S, Ehrenkranz R, Fanaroff A, Donovam
E, Goldberg R, O’Shea TM, Higgins RD, Poole EK (2008) Elevated temperature after
hypoxic-ischemic encephalopathy: risk factor for adverse outcomes. Pediatrics 122(3)
491-499.
Lord Laming (2003) The Victoria Climbié Inquiry.
https://www.gov.uk/government/uploads/system/uploads/attachment_data/file/27318
3/5730.pdf (Accessed 05th December 2015).
Lasswell SM, Barfield WD, Rochat R, Backmon L (2010) Perinatal regionalization for
very low-birth-weight and very preterm infants: A meta-analysis. JAMA 304(9) 992-
1000. doi: 10.1001/jama.2010.1226.

165
Lee SK, Zupancic JAF, Pendray M, Thiessen P, Schmidt B, Whyte R, Shorten D,
Stewart S (2001) Transport risk index of physiologic stability: A practical system for
assessing infant transport care. The Journal of Pediatrics. 139(2) 220-226.
Leslie A, Stevenson TJ (1994) Audit of neonatal intensive care transport. Archives of
Disease in Childhood Fetal and Neonatal Edition 71: F61-F66.
Leslie A, Stevenson TJ (1997) Audit of neonatal intensive care transport - closing the
loop. Acta Paediatrica 86: 1253-1256.
Leslie A, Stevenson TJ (2003) Neonatal transfers by advanced neonatal nurse
practitioners and paediatric registrars. Archives of Disease in Childhood Fetal and
Neonatal Edition 88: F509-F512.
Long T, Johnson M (2006) Research ethics in the real world: issues and solutions for
health and social care. Edinburgh: Churchill Livingstone, Elsevier.
MacNab A, Chen Y, Gagnon F, Bora B, Laszio C (1995) Vibration and noise in
paediatric emergency transport vehicles: A potential cause of morbidity? Aviation
Space and Environmental Medicine 66(3) 212-219.
Madar RJ, Milligan DWA (1994) Neonatal transport: Safety and security. Archives of
Disease in Childhood Fetal and Neonatal Edition 71: F147-F148.
Mallett J, Albarran JW, Richardson A (2013) Critical care manual of clinical procedures
and competencies. West Sussex: John Wiley and Sons, Ltd.
Manning DJ (2000) Presumed consent in emergency neonatal research. Journal of
Medical Ethics 26: 246-249.
March of Dimes (2012) Peristats. www.marchofdimes.com/peristats (accessed 08th
March 2013).
166
Marlow N, Bennet C, Draper ES, Hennessy EM, Morgan AS, Costeloe KL (2014)
Perinatal outcomes for extremely preterm babies in relation to place of birth in England:
the EPICure 2 study. Archives of Disease in Childhood Fetal Neonatal Edition 99:
F181-F188. doi:10.1136/archdischild-2013-305555
Martin T (2006) Aeromedical transportation: a clinical guide. Aldershot: Ashgate.
McGuire W (2007) ‘Perinatal asphyxia’, British Medical Journal Clinical Evidence
https://www.ncbi.nlm.nih.gov/pmc/articles/PMC2943784/ (Accessed 14th October
2016).
Medical Devices Agency (1995) Transport of neonates in ambulances: Guidance of
the TINA Project UK. London: DH.
Mir NA (1997) Manual of neonatal transfer. E Petch Printers, Manchester.
Mohamed MA, Aly H (2010) Transport of premature infants is associated with
increased risk for intraventricular haemorrhage. Archives of Disease in Childhood.
Fetal and Neonatal Edition. 95(6) F403-F407.
Modi N, Clark H, Wolfe I, Costello A, Budge H (2013) A healthy nation: strengthening
child health research in the UK. Lancet 381: 73-87.
Moore R, Brake S, Spencer SA (2005) Newborn networks: The golden age for
neonatology or just another expensive re-organisation? Infant 1(5) 149-153.
http://www.infantgrapevine.co.uk/pdf/inf_005_tga.pdf (Accessed 16th February 2017).
Morris BH, Philbin MK, Bose C (2000) Physiological effects of sound on the newborn.
Journal of Perinatology 20(8 Pt 2) S55-S60.
National Audit Office (2007) Caring for vulnerable babies: the reorganisation of
neonatal services in England. London: The Stationery Office.
National Quality Board (2010) System alignment in specialist neonatal care: final
report. London: DH.
167
http://webarchive.nationalarchives.gov.uk/20130107105354/http:/www.dh.gov.uk/pro
d_consum_dh/groups/dh_digitalassets/@dh/@en/@ps/documents/digitalasset/dh_11
2157.pdf (Accessed 16th February 2017).
Royal College of Paediatrics and Child Health (2015) National Neonatal Audit
Programme Annual Report 2014. London: RCPCH.
http://www.rcpch.ac.uk/system/files/protected/page/NNAP%20report%20updated%2
004.11.15WEB.pdf (Accessed 05th December 2015).
National Institute for Health and Care Excellence (2010a) Therapeutic hypothermia
with intracorporeal temperature monitoring for hypoxic perinatal brain injury.
Manchester: NICE.
https://www.nice.org.uk/guidance/ipg347/resources/therapeutic-hypothermia-with-
intracorporeal-temperature-monitoring-for-hypoxic-perinatal-brain-injury-
1899867578267077 (Accessed 16th February 2017).
National Institute for Health and Care Excellence (2010b) Neonatal specialist care.
Quality Standard 4. Manchester: NICE.
Neonatal Transport Group (2015) United Kingdom Summary Data. Unpublished
internal document. Neonatal Transport Group
NHS England (2012) Developing operational delivery networks: the way forward.
London: NHS England.
https://www.england.nhs.uk/wp-content/uploads/2012/12/develop-odns.pdf
(Accessed 16 February 2017).
NHS England (2015) Improving value for patients from specialised care.
Commissioning intentions 2016/2017 for prescribed specialised services. London:
NHS England.
https://www.england.nhs.uk/commissioning/wpcontent/uploads/sites/12/2015/09/com
ms-intents-16-17.pdf (Accessed 20th December 2015).
National Patient Safety Agency (2007) Design for patient safety: future ambulances.
London: NPSA.
168
Nuffield Council (2007) Critical care decisions in fetal and neonatal medicine: ethical
issues on bioethics. London: Nuffield. http//:www.nuffieldbioethics.org (Accessed 05th
March 2010).
Parahoo K (2014) Nursing research: principles, process and issues (3rd ed).
Basingstoke: Palgrave MacMillan.
Parmanum J, Field D, Rennie J, Steer P (2000) National census of availability of
neonatal intensive care. British Medical Journal 321: 727-29.
Peliowski A (2012) Inhaled nitric oxide in newborns. Paediatrics and Child Health 17(2)
95-97.
Polit D, Beck C, Hungler D (2001) Essentials of nursing research: methods, appraisal
and utilization (5th Ed). Philadelphia: Lippincott.
Prehn J, McEwen I, Jeffries L, Jones M, Daniels T, Goshorn E, Marx C (2015)
Decreasing sound and vibration during ground transport of infants with very low birth
weight. Journal of Perinatology 35(2) 110-4.
Proctor S, Allen T (2006) Sampling in Gerrish K, Lacey A (Eds) The research process
in nursing (5th Ed). London: Blackwell Publishing pp173-187.
Royal College of Obstetricians and Gynaecologists (2008) Providing quality care for
women. A framework for maternity service standards. London: Royal College of
Obstetricians and Gynaecologists.
Salavitabar A, Haidet KK, Adkins CS, Susman EJ, Palmer C, Storm H (2010) Preterm
infants’ sympathetic arousal and associated behavioural responses to sound stimuli in
the neonatal care unit. Advanced Neonatal Care 10: 158-166.
Saunders AN (1995) Incubator noise: a method to decrease decibels. Pediatric
Nursing 21(3) 165-8.
169
Seaton SE, King S, Manktelow BN, Draper ES, Field DJ (2013) Babies born at the
threshold of viability: changes in survival and workload over 20 years. Archives of
Disease in Childhood: Fetal and Neonatal Edition 98: F15-F20.
Seidel H, Heide R (1986) Long term effects of whole body vibration: a critical survey
of the literature. Archives of Occupation Environmental Health 58: 1-26.
Shah S, Rothberger A, Caprio M, Mally P, Hendricks- Munoz K (2008) Quantification
of impulse experienced by neonates during inter- and intra-hospital transport
measured by biophysical accelerometery. Journal of Perinatal Medicine 36: 87-92.
Shenai J, Johnson G, Varney R (1981) Mechanical vibration in neonatal transport.
Paediatrics 68: 55-574.
Sherwood H, Donze A, Giebe J (1994) Mechanical vibration in ambulance transport.
Journal of Obstetrics and Gynecologic Neonatal Nursing 23(6) 457-63.
Sheth RD (1998) Trends in incidence and severity of intraventricular hemorrhage.
Journal of Child Neurology 13: 261-264.
Sinclair J, Haughton D, Braken M, Horber J, Soll R (2003) Cochrane Neonatal
systematic reviews: a survey of the evidence of neonatal therapies. Clinics in
Perinatology 30: 298.
Singh GK, Kogan MD (2007) Persistent socioeconomic disparities in infant, neonatal,
and post natal mortality rates in the United States, 1969-2001. Pediatrics 119(4) 928-
939.
Sittig SE, Nesbitt JC, Krageschmidt DA, Sobczak SC, Johnson RV (2011) Noise levels
in a neonatal transport incubator in medically configured aircraft. International Journal
of Pediatric Otorhinolaryngology 75(1) 74-6.
Skeoch CH, Jackson L, Wilson AM, Booth P (2005) Fit to fly: practical challenges in
neonatal transfers by air. Archives of Disease in Childhood, Fetal and Neonatal Edition
90: F456-F460.
170
Smith CL, Kissack CM (2013) Patent ductus arteriosus:time to grasp the nettle.
Archives of Disease in Childhood: Fetal and Neonatal Edition 98(3) F269-F271.
Snedec N, Simoncic M, Klemenc M, Ihan A, Vidmar I, Grosek S (2013) Heart rate
variability of transported critically ill neonates. European Journal of Paediatrics,
172(12) 1565-1571.
Stebor A (2005) Basic principles of noninvasive blood pressure measurement in
infants. Advances in Neonatal Care 5(5): 252-261.
Stevens B, Johnston C, Petryshen P, Taddio A (1996) Premature Infant Pain Profile:
development and initial validation. Clinical Journal of Pain 12: 13-22.
Storey I (2010) Perinatal and neonatal mortality in the advent of the neonatal network.
British Journal of Hospital Medicine 17(4) 190-194.
Surenthiran SS, Wilbraham K, May J, Chant T, Emmerson AJ, Newton VE (2003)
Noise levels within the ear and post-nasal space in neonates in intensive care.
Archives of Disease in Childhood, Fetal and Neonatal Edition 88(4) F315-F318.
The Children Act 2004
http://www.opsi.gov.uk/act/acts2004ukpga_20040031_en_1 (Accessed 20th March
2010).
TELMAR USA http://www.telmausa.com/ (Accessed 1st November 2016).
Thoresen M, Penrice J, Lorek A, Cady, EB, Wylezinska M, Kirkbride V, Cooper CE,
Brown GC, Edwards AD, Wyatt JS (1995) Mild hypothermia after severe transient
hypoxia-ischemia ameliorates delayed cerebral energy failure in the newborn piglet.
Pediatric Research 37(5) 667-670.
The Scrutiny Committee (2006) Making it Better for Children, Young People, Parents
and Babies in Greater Manchester, East Cheshire, High Peak and Rossendale:
171
Consultation Document, Response of the Making it Better Joint Health Scrutiny
Committee
Towers CV, Bonebrake R, Padilla G, Rumney P (2000) The effect of transport on the
rate of severe interventricular hemorrhage in very low birth weight infants. Obstetrics
and Gynecology 95: 291-295.
Valente ME, Sherif JA, Azen CG, Pham MS, Lowe CG (2016) Cerebral oxygenation
and acceleration in pediatric and neonatal interfacility transport. Air Medical Journal
35(3) 156-160.
Vivalda M, Garassino L (2015) Study of the effects of transport modalities on short-
term outcomes in premature infants. Presented at the Transport of High Risk Neonates
conference in Genova 23rd-25th January 2015.
Wachman EM, Lahav A (2011) The effects of noise on preterm infants in the NICU.
Archives of Disease in Childhood. Fetal and Neonatal Edition 96(4) F305-F309.
Watson SI, Arulampalam W, Petrou S, Marlow N, Morgan AS, Draper ES,
Santhakumaran, Modi N (2014) The effects of designation and volume of neonatal care
on mortality and morbidity outcomes of very preterm infants in England: retrospective
population-based cohort study. BMJ Open 4:e004856.
http://bmjopen.bmj.com/content/bmjopen/4/7/e004856.full.pdf
Watts C, Teim E, Metherall J, Lightfoot E (2008) Neonatal transport – the comfort zone.
Infant 4(1) 27-30.
Wood NS, Costeloe K, Gibson AT, Hennessay EM, Marlow N, Wilkinson AR (2005)
The EPICCure study: associations and antecedents of neurological and developmental
disability at 30 months of age following extremely preterm birth. Archives of Disease in
Childhood: Fetal and Neonatal Edition 90: F134-F140.
Woodward GA, Insoft RM, Kleinman ME (2007) American Academy of Paediatrics
section on transport medicine. Guidelines for air and ground transport of neonatal and
paediatric patients. 3rd Ed. Elk Grove, IL: American Academy of Paediatrics.

172
Zeitlin J, Ancel PY, Delmas D, Breart G, Papiernik E (2010) Changes in care and
outcomes of very preterm babies in the Parisian region between 1998 and 2003.
Archives of Disease in Children: Fetal and Neonatal Edition 95: F188-F193.
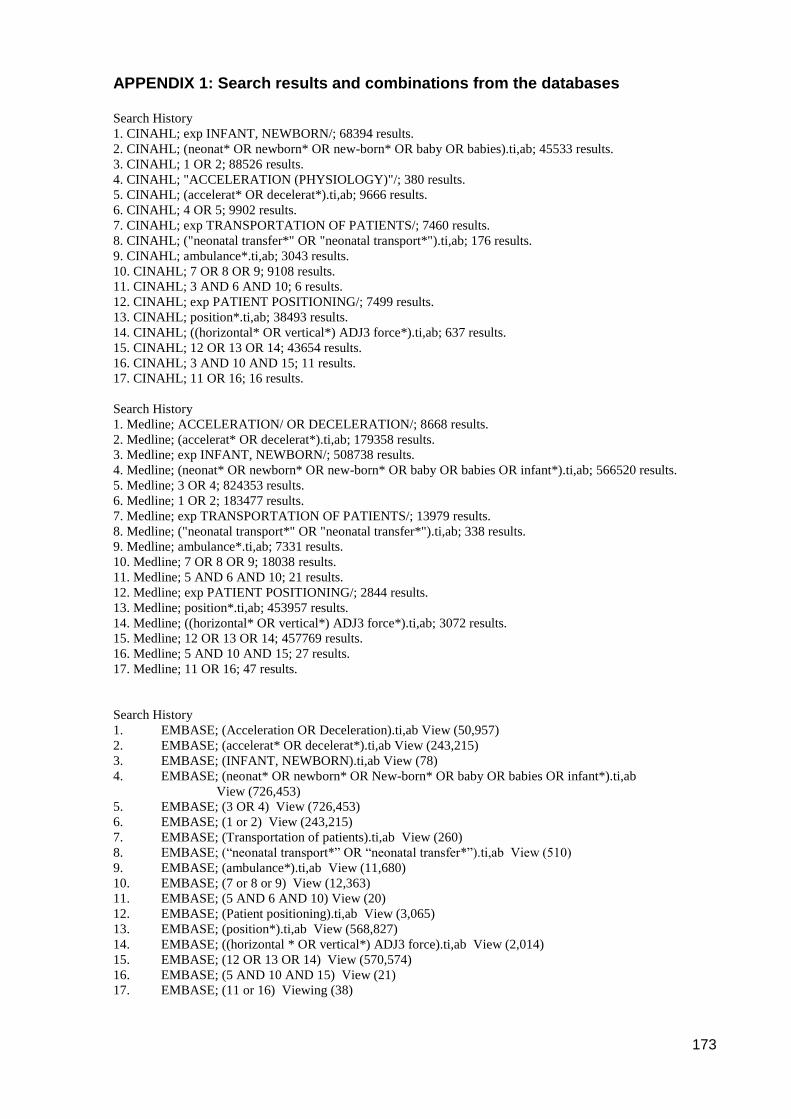
173
APPENDIX 1: Search results and combinations from the databases Search History
1. CINAHL; exp INFANT, NEWBORN/; 68394 results.
2. CINAHL; (neonat* OR newborn* OR new-born* OR baby OR babies).ti,ab; 45533 results.
3. CINAHL; 1 OR 2; 88526 results.
4. CINAHL; "ACCELERATION (PHYSIOLOGY)"/; 380 results.
5. CINAHL; (accelerat* OR decelerat*).ti,ab; 9666 results.
6. CINAHL; 4 OR 5; 9902 results.
7. CINAHL; exp TRANSPORTATION OF PATIENTS/; 7460 results.
8. CINAHL; ("neonatal transfer*" OR "neonatal transport*").ti,ab; 176 results.
9. CINAHL; ambulance*.ti,ab; 3043 results.
10. CINAHL; 7 OR 8 OR 9; 9108 results.
11. CINAHL; 3 AND 6 AND 10; 6 results.
12. CINAHL; exp PATIENT POSITIONING/; 7499 results.
13. CINAHL; position*.ti,ab; 38493 results.
14. CINAHL; ((horizontal* OR vertical*) ADJ3 force*).ti,ab; 637 results.
15. CINAHL; 12 OR 13 OR 14; 43654 results.
16. CINAHL; 3 AND 10 AND 15; 11 results.
17. CINAHL; 11 OR 16; 16 results.
Search History
1. Medline; ACCELERATION/ OR DECELERATION/; 8668 results.
2. Medline; (accelerat* OR decelerat*).ti,ab; 179358 results.
3. Medline; exp INFANT, NEWBORN/; 508738 results.
4. Medline; (neonat* OR newborn* OR new-born* OR baby OR babies OR infant*).ti,ab; 566520 results.
5. Medline; 3 OR 4; 824353 results.
6. Medline; 1 OR 2; 183477 results.
7. Medline; exp TRANSPORTATION OF PATIENTS/; 13979 results.
8. Medline; ("neonatal transport*" OR "neonatal transfer*").ti,ab; 338 results.
9. Medline; ambulance*.ti,ab; 7331 results.
10. Medline; 7 OR 8 OR 9; 18038 results.
11. Medline; 5 AND 6 AND 10; 21 results.
12. Medline; exp PATIENT POSITIONING/; 2844 results.
13. Medline; position*.ti,ab; 453957 results.
14. Medline; ((horizontal* OR vertical*) ADJ3 force*).ti,ab; 3072 results.
15. Medline; 12 OR 13 OR 14; 457769 results.
16. Medline; 5 AND 10 AND 15; 27 results.
17. Medline; 11 OR 16; 47 results.
Search History
1. EMBASE; (Acceleration OR Deceleration).ti,ab View (50,957)
2. EMBASE; (accelerat* OR decelerat*).ti,ab View (243,215)
3. EMBASE; (INFANT, NEWBORN).ti,ab View (78)
4. EMBASE; (neonat* OR newborn* OR New-born* OR baby OR babies OR infant*).ti,ab
View (726,453)
5. EMBASE; (3 OR 4) View (726,453)
6. EMBASE; (1 or 2) View (243,215)
7. EMBASE; (Transportation of patients).ti,ab View (260)
8. EMBASE; (“neonatal transport*” OR “neonatal transfer*”).ti,ab View (510)
9. EMBASE; (ambulance*).ti,ab View (11,680)
10. EMBASE; (7 or 8 or 9) View (12,363)
11. EMBASE; (5 AND 6 AND 10) View (20)
12. EMBASE; (Patient positioning).ti,ab View (3,065)
13. EMBASE; (position*).ti,ab View (568,827)
14. EMBASE; ((horizontal * OR vertical*) ADJ3 force).ti,ab View (2,014)
15. EMBASE; (12 OR 13 OR 14) View (570,574)
16. EMBASE; (5 AND 10 AND 15) View (21)
17. EMBASE; (11 or 16) Viewing (38)

174
Search History
Current search strategy: Vibration/Acceleration BNI
1. BNI; (Infant AND Newborn).ti,ab 248
2. BNI; (neontat*OR newborn* OR new-born* OR baby OR Babies).ti,ab 5,194
3. BNI; (1 AND 2) 248
4. BNI; (Acceleration physiology).ti,ab
5. BNI; (accelerat* OR decelerat*).ti,ab 424
6.
7. BNI; (TRANSPORTATION OF PATIENTS).ti,ab 56
8. BNI; (Neonatal transfer OR neonatal transport).ti,ab 108
9. BNI; (4 OR 5) 424
10. BNI; (ambulance).ti,ab 345
11. BNI; (7 OR 8 OR 10) 500
12. BNI; (3 OR 9) 672
13. BNI; (3 OR 9 OR 10) 1,016
14. BNI; (Patient positioning).ti.ab 202
15. BNI; (position*).ti,ab 3,579
16. BNI; ((horizontal* OR vertical*) ADJ3 force).ti,ab
17. BNI; (14 or 15 or 16) 3,579
18. BNI; (3 or 11 or 17) 4,303
19. BNI; (13 or 17) 4,567
20. BNI; (11 AND 12 AND 17 AND 18 AND 19) Viewing (4)

175
APPENDIX 2: Transfer Documents
FORM 1
Road speed and physiological stability of neonates undergoing
intensive care inter-hospital transfer by ambulance.
DATA COLLECTION SHEET
PATIENT DETAILS: Study reference number ______________________________ Date / time of birth ___________________________________ Gestation at birth ____________completed weeks Postnatal age ______days Current weight _________g Clinical Diagnoses_______________________________________________ ______________________________________________________________ ______________________________________________________________ TRANSFER SUMMARY: Date ______________ Time ______________ Referring hospital _______________________________________________ Receiving hospital _______________________________________________ Reason for referral ______________________________________________ Model of ambulance______________________________________________ Incubator base type__________________________________________ GMNETS staff present ___________________________________________

176
FORM 2
RECORD OF EXTERNAL EVENTS DURING TRANSFER
Timings: Times to be recorded from the computer clock: Start time of data collection:__________________________ Time vehicle starts moving:__________________________ Time vehicle stops moving (i.e. arrival at receiving Unit): _______________________ Time data collection stops:__________________________
(Data collection must stop before the vehicle ignition is turned off i.e. stop data collect as soon as you pull up outside unit).
Data Collection During Transfer: Fill in table using abbreviations below.
Time (mins)
Road conditions
Speed BP
Good wave form? (tick)
SpO2
Good wave form? (tick)
RR
Good wave form? (tick)
0
5
10
15
20
25
30
35
40
45
50
55
60
65
70
75
80
85
90
95
100
105
110
115
120

177
Table of abbreviations:
Road Condition
Motorway Dual Carriageway
Country Lane Road with speed bumps
Abbreviation 1 2 3 4
Speed Slow traffic Normal Road speed
Blue Lights Vehicle stationary
Abbreviation 1 2 3 4
Record of Interventions During Transfer: Please document below, any intervention (i.e. ETT suction) required to the patient during transfer along with the time:
Time Intervention required

178
Appendix 3: Data Logger
DL1 MK3 Description
What does the DL1 MK3 do? The DL1 can store data from a number of sources including its built in high accuracy GPS and accelerometers, wheel speeds, shaft speeds, engine speeds, temperatures, pressures, lap times, sector times etc. The DL1 comes packaged with the excellent Race Technology data analysis package for Windows. The software allows super accurate track mapping, user defined channels, powerful graphing and allows direct comparison of up to 10 data sets (races) simultaneously with almost unlimited laps. The DL1 MK3 can optionally feature 4 output channels (Low side output drivers and 4 extra analogue inputs enhancement), which can be used to control external systems based on the data received. The output channels are designed to supply a logic level signal which can be used to activate a relay, to turn on/off a system. This control can be based on simple or complex equations, for example turn on a fan if temperature is high and speed is low. Greater control than simply on/off is offered with the PWN output option. Why use GPS? One of the key features of the DL1 is its built in high accuracy GPS system - this gives the DL1 advantages over other data loggers in 2 key areas - greatly improved track maps and far more accurate speed measurement. Track Mapping. Conventional data loggers require a "closed circuit" to enable them to calculate the track map; the shape of the track is estimated from a combination of the lateral acceleration and speed. This works adequately in some situations but it becomes increasingly inaccurate for long tracks and impossible for open circuits, motorbikes or boats. In contrast, the GPS will produce high accuracy track maps in almost any situation. Speed Measurement. While speed is probably the most important parameter that anyone wants to measure using the data logging system, it is also the most inaccurate in a "conventional" system. The normal way to measure speed is to simply attach a pickup to a wheel to detect how fast it is rotating - but the rolling circumference of a tyre changes by 4% just with wear and temperature. Even worse, the error increases significantly under race conditions where the tyre is under load - typically the tyre slips by up to 20% under hard braking going into a corner. Measuring speed using GPS is now common practice in high-end systems - under typical conditions speed error is well under 1%! Features of the DL1MK3 data logger The DL1MK3 is an all-new, 3rd generation, data logger system from Race Technology. Whilst the DL1 builds on the strengths of our highly successful DL90 system, it is a brand new design in almost every respect. Some of the most noteworthy features include:
The new GPS unit is based on our own high accuracy GPS3 technology and calculates position and speed 5 times every second or 20 times every second with the optional 20 Hz GPS.
Built in 3-axis accelerometer with 2g full scale (optional 6g full scale).
Logging to SD card flash memory. Flash memory is robust, economical and offers fast download times and huge (up to 32GB cards compatible) capacity which is ideal for data logging products
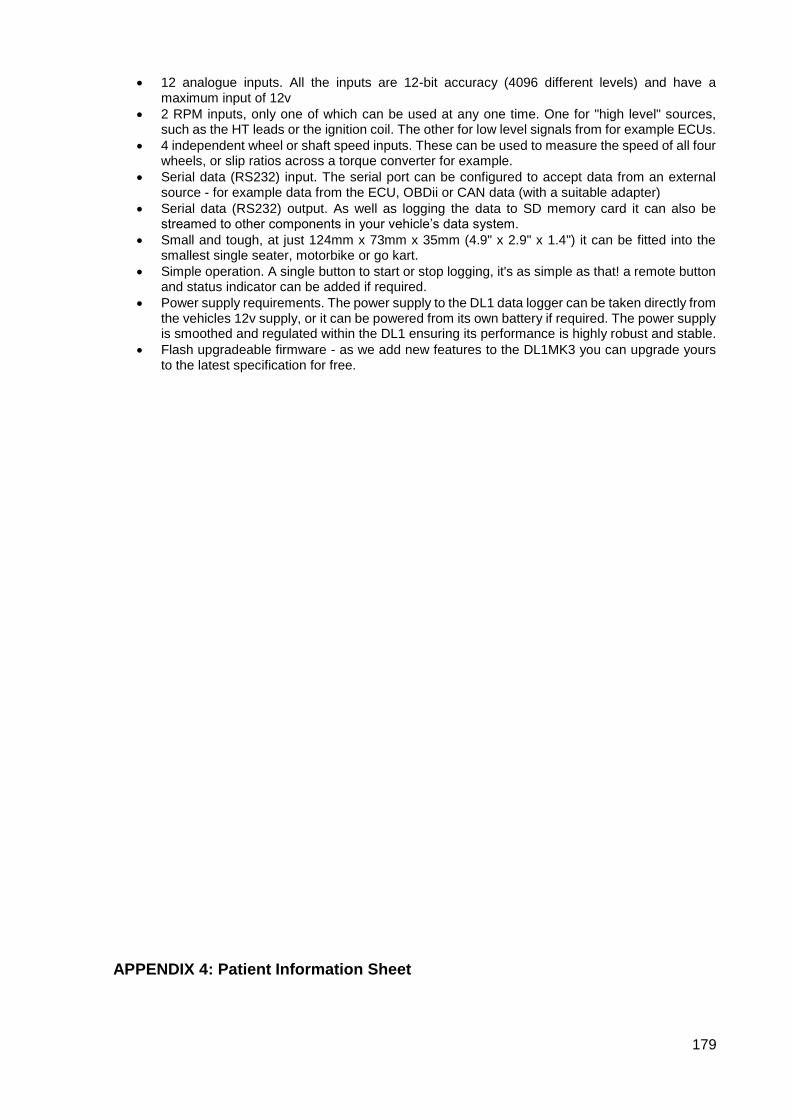
179
12 analogue inputs. All the inputs are 12-bit accuracy (4096 different levels) and have a maximum input of 12v
2 RPM inputs, only one of which can be used at any one time. One for "high level" sources, such as the HT leads or the ignition coil. The other for low level signals from for example ECUs.
4 independent wheel or shaft speed inputs. These can be used to measure the speed of all four wheels, or slip ratios across a torque converter for example.
Serial data (RS232) input. The serial port can be configured to accept data from an external source - for example data from the ECU, OBDii or CAN data (with a suitable adapter)
Serial data (RS232) output. As well as logging the data to SD memory card it can also be streamed to other components in your vehicle’s data system.
Small and tough, at just 124mm x 73mm x 35mm (4.9" x 2.9" x 1.4") it can be fitted into the smallest single seater, motorbike or go kart.
Simple operation. A single button to start or stop logging, it's as simple as that! a remote button and status indicator can be added if required.
Power supply requirements. The power supply to the DL1 data logger can be taken directly from the vehicles 12v supply, or it can be powered from its own battery if required. The power supply is smoothed and regulated within the DL1 ensuring its performance is highly robust and stable.
Flash upgradeable firmware - as we add new features to the DL1MK3 you can upgrade yours to the latest specification for free.
APPENDIX 4: Patient Information Sheet
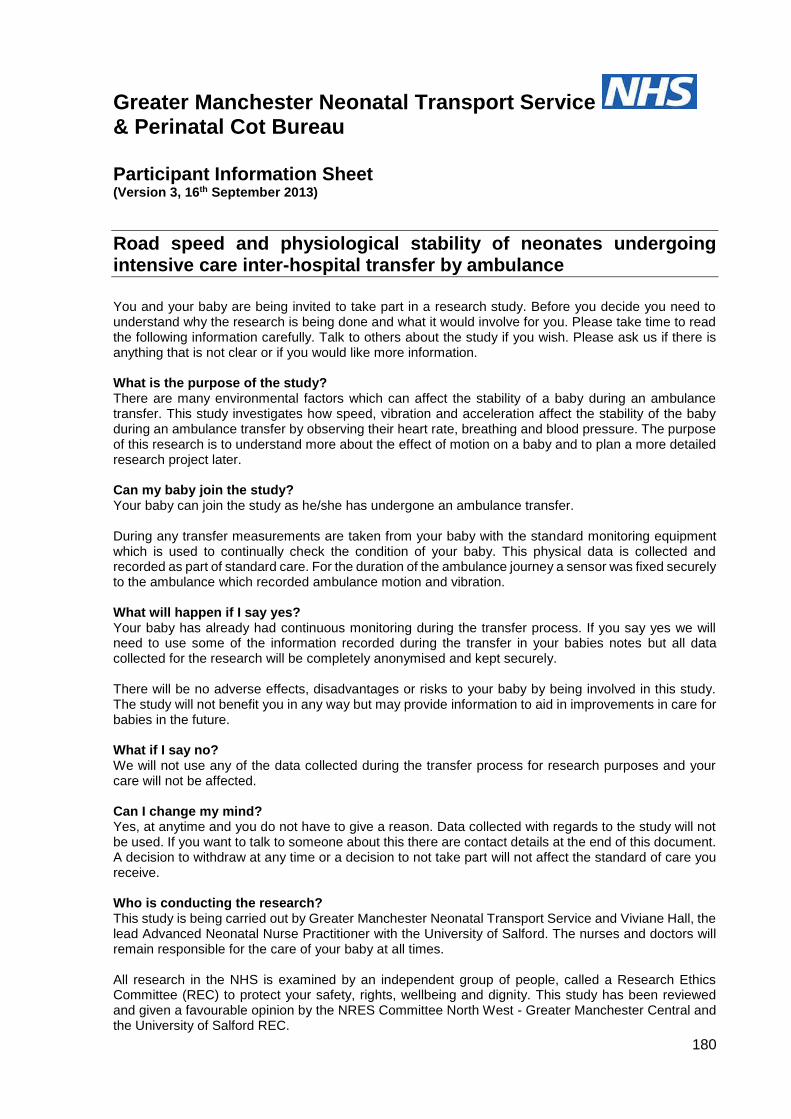
180
Greater Manchester Neonatal Transport Service & Perinatal Cot Bureau
Participant Information Sheet (Version 3, 16th September 2013)
Road speed and physiological stability of neonates undergoing intensive care inter-hospital transfer by ambulance
You and your baby are being invited to take part in a research study. Before you decide you need to understand why the research is being done and what it would involve for you. Please take time to read the following information carefully. Talk to others about the study if you wish. Please ask us if there is anything that is not clear or if you would like more information. What is the purpose of the study? There are many environmental factors which can affect the stability of a baby during an ambulance transfer. This study investigates how speed, vibration and acceleration affect the stability of the baby during an ambulance transfer by observing their heart rate, breathing and blood pressure. The purpose of this research is to understand more about the effect of motion on a baby and to plan a more detailed research project later. Can my baby join the study? Your baby can join the study as he/she has undergone an ambulance transfer. During any transfer measurements are taken from your baby with the standard monitoring equipment which is used to continually check the condition of your baby. This physical data is collected and recorded as part of standard care. For the duration of the ambulance journey a sensor was fixed securely to the ambulance which recorded ambulance motion and vibration. What will happen if I say yes? Your baby has already had continuous monitoring during the transfer process. If you say yes we will need to use some of the information recorded during the transfer in your babies notes but all data collected for the research will be completely anonymised and kept securely. There will be no adverse effects, disadvantages or risks to your baby by being involved in this study. The study will not benefit you in any way but may provide information to aid in improvements in care for babies in the future. What if I say no? We will not use any of the data collected during the transfer process for research purposes and your care will not be affected. Can I change my mind? Yes, at anytime and you do not have to give a reason. Data collected with regards to the study will not be used. If you want to talk to someone about this there are contact details at the end of this document. A decision to withdraw at any time or a decision to not take part will not affect the standard of care you receive. Who is conducting the research? This study is being carried out by Greater Manchester Neonatal Transport Service and Viviane Hall, the lead Advanced Neonatal Nurse Practitioner with the University of Salford. The nurses and doctors will remain responsible for the care of your baby at all times. All research in the NHS is examined by an independent group of people, called a Research Ethics Committee (REC) to protect your safety, rights, wellbeing and dignity. This study has been reviewed and given a favourable opinion by the NRES Committee North West - Greater Manchester Central and the University of Salford REC.
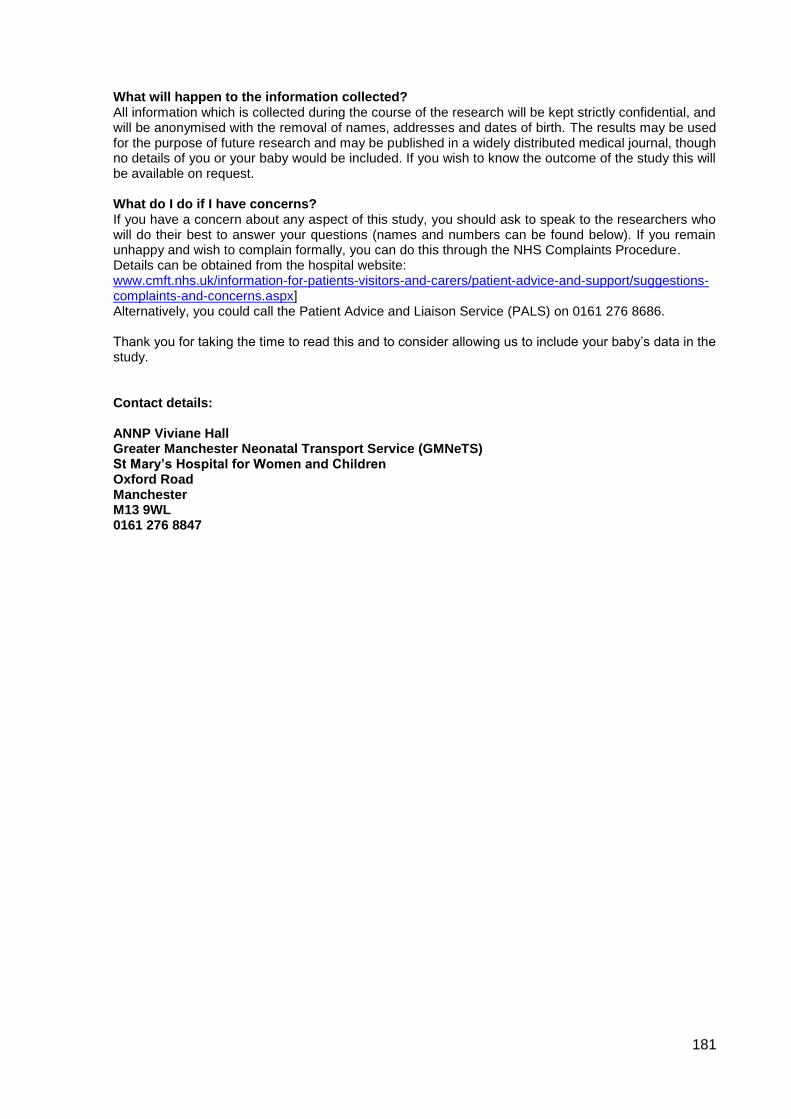
181
What will happen to the information collected? All information which is collected during the course of the research will be kept strictly confidential, and will be anonymised with the removal of names, addresses and dates of birth. The results may be used for the purpose of future research and may be published in a widely distributed medical journal, though no details of you or your baby would be included. If you wish to know the outcome of the study this will be available on request. What do I do if I have concerns? If you have a concern about any aspect of this study, you should ask to speak to the researchers who will do their best to answer your questions (names and numbers can be found below). If you remain unhappy and wish to complain formally, you can do this through the NHS Complaints Procedure. Details can be obtained from the hospital website: www.cmft.nhs.uk/information-for-patients-visitors-and-carers/patient-advice-and-support/suggestions-complaints-and-concerns.aspx] Alternatively, you could call the Patient Advice and Liaison Service (PALS) on 0161 276 8686. Thank you for taking the time to read this and to consider allowing us to include your baby’s data in the study. Contact details: ANNP Viviane Hall Greater Manchester Neonatal Transport Service (GMNeTS) St Mary’s Hospital for Women and Children Oxford Road Manchester M13 9WL 0161 276 8847

182
APPENDIX 5: Consent Form
Greater Manchester Neonatal Transport Service
& Perinatal Cot Bureau
Participant Consent Form
(Version 1, 03 April 2013)
Road speed and physiological stability of neonates undergoing intensive care interhospital
transfer by ambulance
Dr Ian Dady, Greater Manchester Neonatal Transport Service (GMNeTS)
Viviane Hall, Lead Advanced Neonatal Nurse Practitioner, Greater Manchester Neonatal
Transport Service (GMNeTS), University of Salford
Name of patient –
Name of parent / guardian -
Please initial each statement. 1. I confirm that I have read and understand the information sheet dated....................
(version............) for the above study. I have had the opportunity to consider the information,
ask questions and have had these answered satisfactorily.
2. I understand that my baby’s participation is voluntary and that I am free to withdraw my baby
at any time without giving any reason, without my baby’s medical care or legal rights being
affected.
3. I understand that relevant sections of my baby’s medical notes and data collected during the
study may be looked at by responsible individuals from the University of Salford, from
regulatory authorities or from the NHS Trust, where it is relevant to my baby taking part in this
research. I give permission for these individuals to have access to my baby’s records.
4. I agree to give consent for the participation of my baby in this study.
_________________________ ________________ _________________
Name of Parent / Guardian Date Signature
_________________________ ________________ ___________________
Name of Person taking consent Date Signature
183
APPENDIX 6: REC approval letters
184
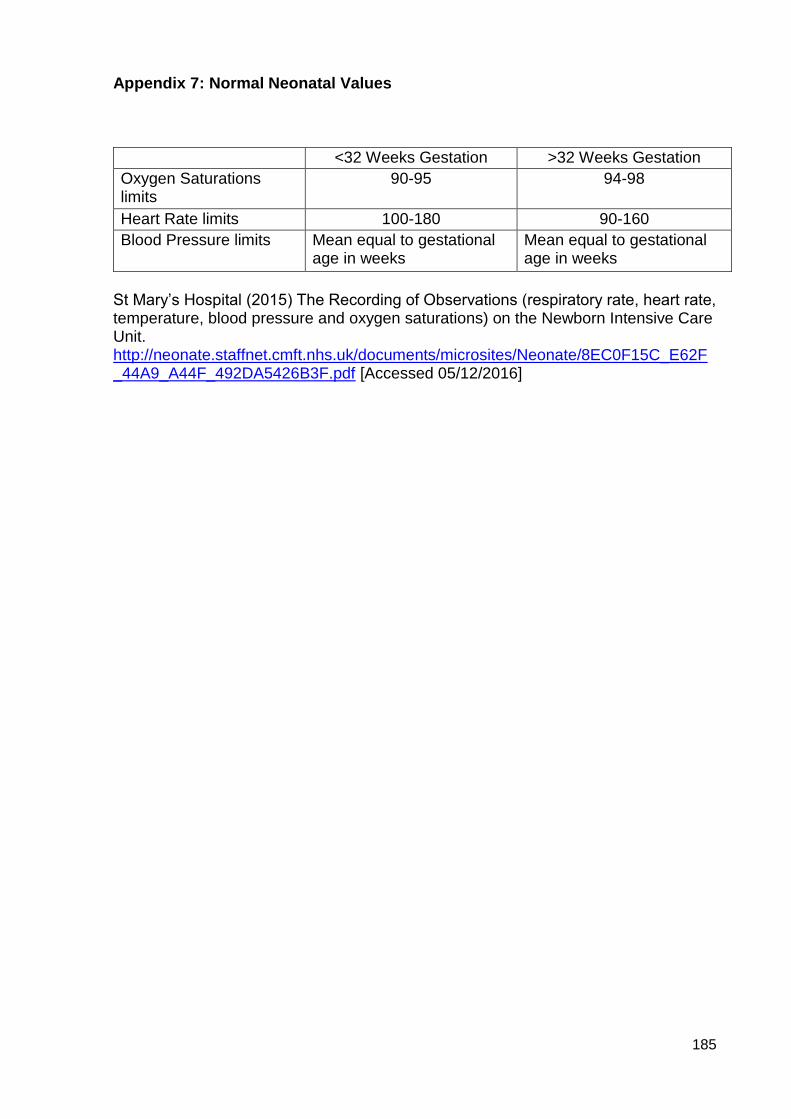
185
Appendix 7: Normal Neonatal Values
<32 Weeks Gestation >32 Weeks Gestation
Oxygen Saturations limits
90-95 94-98
Heart Rate limits 100-180 90-160
Blood Pressure limits Mean equal to gestational age in weeks
Mean equal to gestational age in weeks
St Mary’s Hospital (2015) The Recording of Observations (respiratory rate, heart rate, temperature, blood pressure and oxygen saturations) on the Newborn Intensive Care Unit. http://neonate.staffnet.cmft.nhs.uk/documents/microsites/Neonate/8EC0F15C_E62F_44A9_A44F_492DA5426B3F.pdf [Accessed 05/12/2016]


![[usir.salford.ac.uk]usir.salford.ac.uk/10047/1/1.pdfits relationship to practice. Second, paper explores on deductive and inductive research approaches for theory testing and theory](https://img.pdfslide.net/doc/110x75/5b2409067f8b9a5f458b57ed/usir-usir-relationship-to-practice-second-paper-explores-on-deductive-and.jpg)

![Bournemouth University Research Online [BURO] - Welcomeeprints.bournemouth.ac.uk/32706/1/WALSGROVE, Hilary_D.Prof._201… · This thesis for Doctor of Professional Practice (DProf)](https://img.pdfslide.net/doc/110x75/61030d427f759b48821ee315/bournemouth-university-research-online-buro-hilarydprof201-this-thesis.jpg)