Embed Size (px)
Citation preview

30 July 2010 Economics & FI/FX Research
Curves & Crosses
UniCredit Research page 1 See last pages for disclaimer.
A summer break with no breakthrough Fixed Income
■ FI Strategizer: Next week, US data confirming the slowdown in the economic recovery should be supportive for Treasuries. In the EMU, solid figures on German IP and orders should keep investors moderately optimistic, with Bunds suffering slightly. We do not expect major surprises from the ECB meeting.
■ EU Portfolio Strategy: We would return to a minor long duration stance of +0.5 years. We keep our positive view on Italy and we increase moderately our exposure on Spain, closing further the gap with EFFAS weightings. We remain moderately overweight on France.
■ Trade Idea: Over the last week, Spain tightened sharply vs. Italy, especially at the front end and at the extra long end. We prefer Italy, due to its sounder macroeconomic fundamentals and we thus suggest switching from Spain into Italy at the 3Y maturity.
■ MM: This week, results of the 3M auction sent a reassuring signal, confirming that the EU banking system is sound. Next week, only the 1W MRO is scheduled, with EUR 190bn expiring. In line with this week, we expect demand to be slightly lower than the amount expiring, leading to another modest drop in liquidity.
■ Supply Corner: Next week, primary market activity will slow down. There will be no redemptions or coupons in the EMU, while gross supply should be a modest EUR 4bn, coming from Austria and Spain. Activity should focus on the short end, with little action on the extra long end.
Forex
■ FX Strategizer: The USD took the full impact of soft US news, but we do not expect the current market scenario to improve sharply. Investors are likely to scale back their risk exposure, which should provide USD, JPY and CHF some relief and put AUD, NZD and EUR under pressure.
■ EUR: The EMU growth prospects will not be strong enough to completely offset the outstanding budget crisis. The EUR-USD strength should ease and the next key resistance level at 1.3125 won’t be broken easily.
■ JPY: The latent downward pressure in USD-JPY and the modest upside potential for EUR-USD will limit any EUR-JPY rebound. EUR-JPY is thus unlikely to break through, while USD-JPY should stay in the 86/88 band.
■ CHF: As feared, the EUR-CHF recovery proved to be quite capped above 1.38: as risk aversion might spark more demand for safe-haven currencies, a full break of the 1.36 base may prompt a further sell-off.
■ GBP: Sterling should stay firm also in August with risks that our medium-term target for cable at 1.60 may be hit rapidly. EUR-GBP should offer a more constrained picture, as a full break towards 0.80 might require time.
■ Pacific Rim & CAD: Commodity units are now less supported by tighter monetary policy at home. The AUD, NZD and CAD should hold the line vs. the USD, but their recent rally is likely to stay frozen in August.
■ Nordics: A more pronounced plunge of EUR-SEK and EUR-NOK below 9.40 and 7.95 appears quite ambitious at this stage. The two Nordic units should thus struggle in the “land of nowhere” in the coming weeks too.
More insight in our monitors: Swap Curve – Money Market – FX Monitor - FX PPP – IMM Monitor – Beta analysis - FX Hit Parade - FX Correlation – Calendar - Forecasts Table
MARKET PRICES & FORECASTS Actual Sep10 Dec10 Mar11 Jun11
US FedFunds 0.25 0.25 0.25 0.75 1.25 2Y UST 0.55 0.85 1.30 2.00 2.40 10Y UST 2.91 3.40 3.80 4.20 4.30 EUROZONE Refi 1.00 1.00 1.00 1.00 1.00 2Y Bund 0.79 0.85 1.05 1.15 1.30 10Y Bund 2.67 3.00 3.25 3.45 3.50 UK Base rate 0.50 0.50 0.50 0.75 1.50 2Y Gilt 0.76 0.90 1.20 1.60 2.20 10Y Gilt 3.33 3.55 3.70 3.90 4.00 (10Y, bp) US - EU 24 40 55 75 80 US - UK -42 -15 10 30 30 UK - EU 66 55 45 45 50 Swap Spread (10Y, bp) US -3 10 15 20 20 EUROZONE 28 25 25 25 20 UK 5 0 10 10 20
Currencies EUR-USD 1.31 1.24 1.22 1.20 1.18 USD-JPY 86 91 95 100 106 GBP-USD 1.56 1.52 1.57 1.60 1.63 EUR-CHF 1.35 1.29 1.27 1.30 1.33
EGB: CURRENT ASW AND 1W CHANGE (BP)
5Y 10Y 30Y Today 1W Today 1W Today 1W DE -42 -1 -26 -4 4 -2 FR -21 0 5 -5 35 -2 AT -5 0 17 3 41 5 NL -25 1 -4 -2 15 -2 ES 86 -26 116 -13 163 -9 BE 13 -6 35 -6 74 -4 PT 183 -36 214 -30 182 -20 IT 60 -3 98 -5 156 -8 GR 742 -27 599 -6 342 -10 US -24 -1 1 3 29 7 UK -28 -5 2 -6 36 -2 SZ -29 4 -42 3 -37 4
Source: Bloomberg, UniCredit Research
Chief Economist – UniCredit Group Head of Global Economics & FI/FX Research Marco Annunziata +44 20 7826-1770 [email protected] Head of Global FI & FX Research Michael Rottmann +49 89 378-15121 [email protected]
Editor Luca Cazzulani +39 02 8862-0640 [email protected]
Editorial deadline Friday, July 30, 2010 15:30 Prices as of Friday, July 30, 2010, 15:00 Bloomberg: UCGR Internet: www.research.unicreditgroup.eu
30 July 2010 Economics & FI/FX Research
Curves & Crosses
UniCredit Research page 2 See last pages for disclaimer.
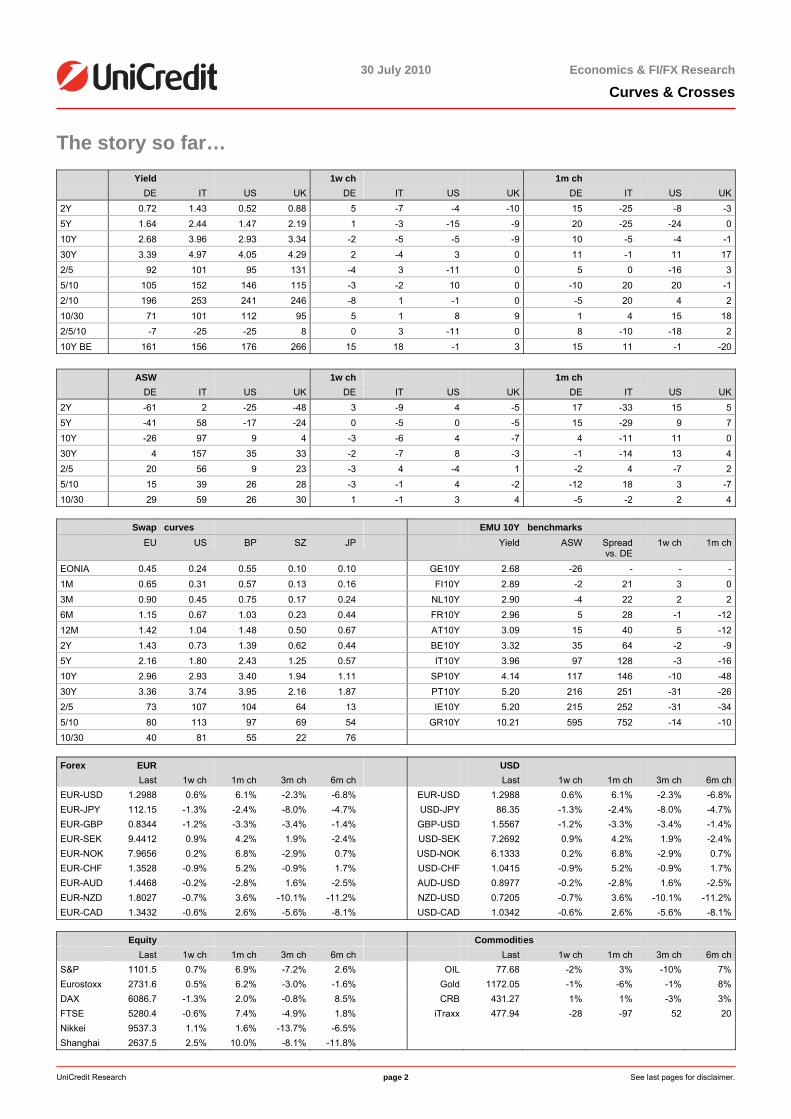
The story so far… Yield 1w ch 1m ch DE IT US UK DE IT US UK DE IT US UK2Y 0.72 1.43 0.52 0.88 5 -7 -4 -10 15 -25 -8 -35Y 1.64 2.44 1.47 2.19 1 -3 -15 -9 20 -25 -24 010Y 2.68 3.96 2.93 3.34 -2 -5 -5 -9 10 -5 -4 -130Y 3.39 4.97 4.05 4.29 2 -4 3 0 11 -1 11 172/5 92 101 95 131 -4 3 -11 0 5 0 -16 35/10 105 152 146 115 -3 -2 10 0 -10 20 20 -12/10 196 253 241 246 -8 1 -1 0 -5 20 4 210/30 71 101 112 95 5 1 8 9 1 4 15 182/5/10 -7 -25 -25 8 0 3 -11 0 8 -10 -18 210Y BE 161 156 176 266 15 18 -1 3 15 11 -1 -20 ASW 1w ch 1m ch DE IT US UK DE IT US UK DE IT US UK2Y -61 2 -25 -48 3 -9 4 -5 17 -33 15 55Y -41 58 -17 -24 0 -5 0 -5 15 -29 9 710Y -26 97 9 4 -3 -6 4 -7 4 -11 11 030Y 4 157 35 33 -2 -7 8 -3 -1 -14 13 42/5 20 56 9 23 -3 4 -4 1 -2 4 -7 25/10 15 39 26 28 -3 -1 4 -2 -12 18 3 -710/30 29 59 26 30 1 -1 3 4 -5 -2 2 4
Swap curves EMU 10Y benchmarks EU US BP SZ JP Yield ASW Spread
vs. DE 1w ch 1m ch
EONIA 0.45 0.24 0.55 0.10 0.10 GE10Y 2.68 -26 - - -1M 0.65 0.31 0.57 0.13 0.16 FI10Y 2.89 -2 21 3 03M 0.90 0.45 0.75 0.17 0.24 NL10Y 2.90 -4 22 2 26M 1.15 0.67 1.03 0.23 0.44 FR10Y 2.96 5 28 -1 -1212M 1.42 1.04 1.48 0.50 0.67 AT10Y 3.09 15 40 5 -122Y 1.43 0.73 1.39 0.62 0.44 BE10Y 3.32 35 64 -2 -95Y 2.16 1.80 2.43 1.25 0.57 IT10Y 3.96 97 128 -3 -1610Y 2.96 2.93 3.40 1.94 1.11 SP10Y 4.14 117 146 -10 -4830Y 3.36 3.74 3.95 2.16 1.87 PT10Y 5.20 216 251 -31 -262/5 73 107 104 64 13 IE10Y 5.20 215 252 -31 -345/10 80 113 97 69 54 GR10Y 10.21 595 752 -14 -1010/30 40 81 55 22 76
Forex EUR USD Last 1w ch 1m ch 3m ch 6m ch Last 1w ch 1m ch 3m ch 6m chEUR-USD 1.2988 0.6% 6.1% -2.3% -6.8% EUR-USD 1.2988 0.6% 6.1% -2.3% -6.8%EUR-JPY 112.15 -1.3% -2.4% -8.0% -4.7% USD-JPY 86.35 -1.3% -2.4% -8.0% -4.7%EUR-GBP 0.8344 -1.2% -3.3% -3.4% -1.4% GBP-USD 1.5567 -1.2% -3.3% -3.4% -1.4%EUR-SEK 9.4412 0.9% 4.2% 1.9% -2.4% USD-SEK 7.2692 0.9% 4.2% 1.9% -2.4%EUR-NOK 7.9656 0.2% 6.8% -2.9% 0.7% USD-NOK 6.1333 0.2% 6.8% -2.9% 0.7%EUR-CHF 1.3528 -0.9% 5.2% -0.9% 1.7% USD-CHF 1.0415 -0.9% 5.2% -0.9% 1.7%EUR-AUD 1.4468 -0.2% -2.8% 1.6% -2.5% AUD-USD 0.8977 -0.2% -2.8% 1.6% -2.5%EUR-NZD 1.8027 -0.7% 3.6% -10.1% -11.2% NZD-USD 0.7205 -0.7% 3.6% -10.1% -11.2%EUR-CAD 1.3432 -0.6% 2.6% -5.6% -8.1% USD-CAD 1.0342 -0.6% 2.6% -5.6% -8.1%
Equity Commodities Last 1w ch 1m ch 3m ch 6m ch Last 1w ch 1m ch 3m ch 6m chS&P 1101.5 0.7% 6.9% -7.2% 2.6% OIL 77.68 -2% 3% -10% 7%Eurostoxx 2731.6 0.5% 6.2% -3.0% -1.6% Gold 1172.05 -1% -6% -1% 8%DAX 6086.7 -1.3% 2.0% -0.8% 8.5% CRB 431.27 1% 1% -3% 3%FTSE 5280.4 -0.6% 7.4% -4.9% 1.8% iTraxx 477.94 -28 -97 52 20Nikkei 9537.3 1.1% 1.6% -13.7% -6.5% Shanghai 2637.5 2.5% 10.0% -8.1% -11.8%
30 July 2010 Economics & FI/FX Research
Curves & Crosses
UniCredit Research page 3 See last pages for disclaimer.
Favorite Trends & Medium Term Strategies Fixed Income EU US UK Change Actual Expected trend Change Actual Expected trend Change Actual Expected trend
-3M -1M 1M 3M -3M -1M 1M 3M -3M -1M 1M 3M
Key policy rates 1.00 1.00 1.00 0.25 0.25 0.25 0.50 0.50 0.50
Libor rates 0.70 0.79 0.90 0.54 0.53 0.45 0.71 0.73 0.75
10Y 2.66 2.58 2.67 3.29 2.98 2.91 3.58 3.35 3.33
2/10Y 215 192 188 252 235 236 270 258 257
2/5/10Y -3 -14 -7 7 1 -13 5 1 1
10Y SwSp 28 30 28 8 8 -3 -4 4 5
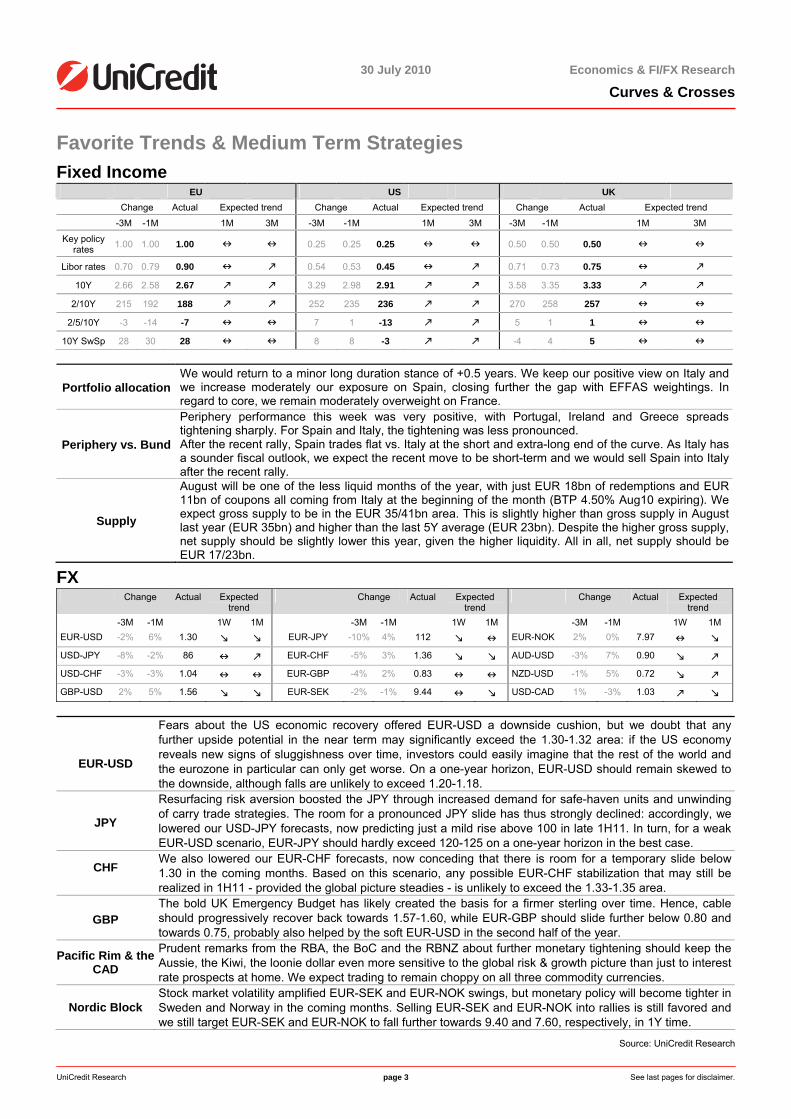
Portfolio allocation We would return to a minor long duration stance of +0.5 years. We keep our positive view on Italy and we increase moderately our exposure on Spain, closing further the gap with EFFAS weightings. In regard to core, we remain moderately overweight on France.
Periphery vs. Bund
Periphery performance this week was very positive, with Portugal, Ireland and Greece spreads tightening sharply. For Spain and Italy, the tightening was less pronounced. After the recent rally, Spain trades flat vs. Italy at the short and extra-long end of the curve. As Italy has a sounder fiscal outlook, we expect the recent move to be short-term and we would sell Spain into Italy after the recent rally.
Supply
August will be one of the less liquid months of the year, with just EUR 18bn of redemptions and EUR 11bn of coupons all coming from Italy at the beginning of the month (BTP 4.50% Aug10 expiring). We expect gross supply to be in the EUR 35/41bn area. This is slightly higher than gross supply in August last year (EUR 35bn) and higher than the last 5Y average (EUR 23bn). Despite the higher gross supply, net supply should be slightly lower this year, given the higher liquidity. All in all, net supply should be EUR 17/23bn.
FX Change Actual Expected
trend Change Actual Expected
trend Change Actual Expected
trend -3M -1M 1W 1M -3M -1M 1W 1M -3M -1M 1W 1M EUR-USD -2% 6% 1.30 EUR-JPY -10% 4% 112 EUR-NOK 2% 0% 7.97 USD-JPY -8% -2% 86 EUR-CHF -5% 3% 1.36 AUD-USD -3% 7% 0.90 USD-CHF -3% -3% 1.04 EUR-GBP -4% 2% 0.83 NZD-USD -1% 5% 0.72 GBP-USD 2% 5% 1.56 EUR-SEK -2% -1% 9.44 USD-CAD 1% -3% 1.03
EUR-USD
Fears about the US economic recovery offered EUR-USD a downside cushion, but we doubt that any further upside potential in the near term may significantly exceed the 1.30-1.32 area: if the US economy reveals new signs of sluggishness over time, investors could easily imagine that the rest of the world and the eurozone in particular can only get worse. On a one-year horizon, EUR-USD should remain skewed to the downside, although falls are unlikely to exceed 1.20-1.18.
JPY
Resurfacing risk aversion boosted the JPY through increased demand for safe-haven units and unwinding of carry trade strategies. The room for a pronounced JPY slide has thus strongly declined: accordingly, we lowered our USD-JPY forecasts, now predicting just a mild rise above 100 in late 1H11. In turn, for a weak EUR-USD scenario, EUR-JPY should hardly exceed 120-125 on a one-year horizon in the best case.
CHF
We also lowered our EUR-CHF forecasts, now conceding that there is room for a temporary slide below 1.30 in the coming months. Based on this scenario, any possible EUR-CHF stabilization that may still be realized in 1H11 - provided the global picture steadies - is unlikely to exceed the 1.33-1.35 area.
GBP The bold UK Emergency Budget has likely created the basis for a firmer sterling over time. Hence, cable should progressively recover back towards 1.57-1.60, while EUR-GBP should slide further below 0.80 and towards 0.75, probably also helped by the soft EUR-USD in the second half of the year.
Pacific Rim & the CAD
Prudent remarks from the RBA, the BoC and the RBNZ about further monetary tightening should keep the Aussie, the Kiwi, the loonie dollar even more sensitive to the global risk & growth picture than just to interest rate prospects at home. We expect trading to remain choppy on all three commodity currencies.
Nordic Block Stock market volatility amplified EUR-SEK and EUR-NOK swings, but monetary policy will become tighter in Sweden and Norway in the coming months. Selling EUR-SEK and EUR-NOK into rallies is still favored and we still target EUR-SEK and EUR-NOK to fall further towards 9.40 and 7.60, respectively, in 1Y time.
Source: UniCredit Research
30 July 2010 Economics & FI/FX Research
Curves & Crosses
UniCredit Research page 4 See last pages for disclaimer.
Favorite Trades
Favorite FI trades Type Trade Rationale Entry date Entry
level Act. Stop Target P&L (bp)
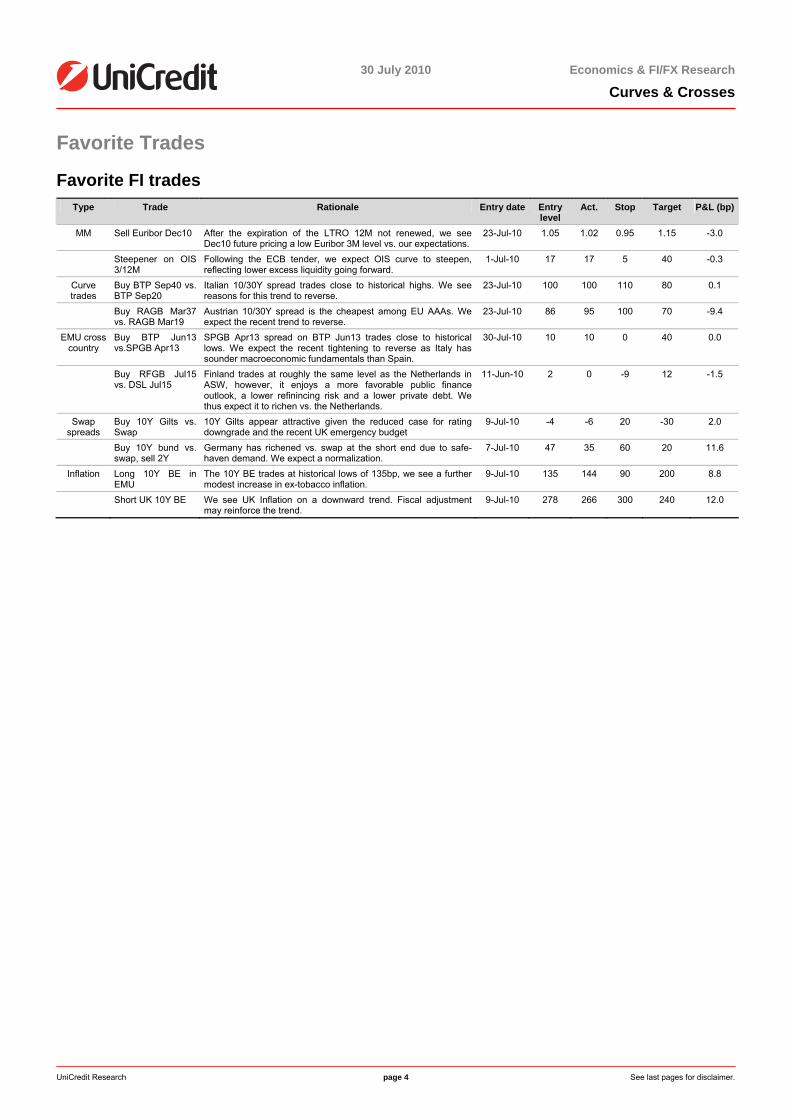
MM Sell Euribor Dec10 After the expiration of the LTRO 12M not renewed, we see Dec10 future pricing a low Euribor 3M level vs. our expectations.
23-Jul-10 1.05 1.02 0.95 1.15 -3.0
Steepener on OIS 3/12M
Following the ECB tender, we expect OIS curve to steepen, reflecting lower excess liquidity going forward.
1-Jul-10 17 17 5 40 -0.3
Curve trades
Buy BTP Sep40 vs. BTP Sep20
Italian 10/30Y spread trades close to historical highs. We see reasons for this trend to reverse.
23-Jul-10 100 100 110 80 0.1
Buy RAGB Mar37 vs. RAGB Mar19
Austrian 10/30Y spread is the cheapest among EU AAAs. We expect the recent trend to reverse.
23-Jul-10 86 95 100 70 -9.4
EMU cross country
Buy BTP Jun13 vs.SPGB Apr13
SPGB Apr13 spread on BTP Jun13 trades close to historical lows. We expect the recent tightening to reverse as Italy has sounder macroeconomic fundamentals than Spain.
30-Jul-10 10 10 0 40 0.0
Buy RFGB Jul15 vs. DSL Jul15
Finland trades at roughly the same level as the Netherlands in ASW, however, it enjoys a more favorable public finance outlook, a lower refinincing risk and a lower private debt. We thus expect it to richen vs. the Netherlands.
11-Jun-10 2 0 -9 12 -1.5
Swap spreads
Buy 10Y Gilts vs. Swap
10Y Gilts appear attractive given the reduced case for rating downgrade and the recent UK emergency budget
9-Jul-10 -4 -6 20 -30 2.0
Buy 10Y bund vs. swap, sell 2Y
Germany has richened vs. swap at the short end due to safe-haven demand. We expect a normalization.
7-Jul-10 47 35 60 20 11.6
Inflation Long 10Y BE in EMU
The 10Y BE trades at historical lows of 135bp, we see a further modest increase in ex-tobacco inflation.
9-Jul-10 135 144 90 200 8.8
Short UK 10Y BE We see UK Inflation on a downward trend. Fiscal adjustment may reinforce the trend.
9-Jul-10 278 266 300 240 12.0
30 July 2010 Economics & FI/FX Research
Curves & Crosses
UniCredit Research page 5 See last pages for disclaimer.
FX Trades
SHORT-TERM SPOT TRADES
Cross Position Start Entry Level
Target Current Spot
Stop 3M Carry % Return P/L net EUR
Rationale / Status
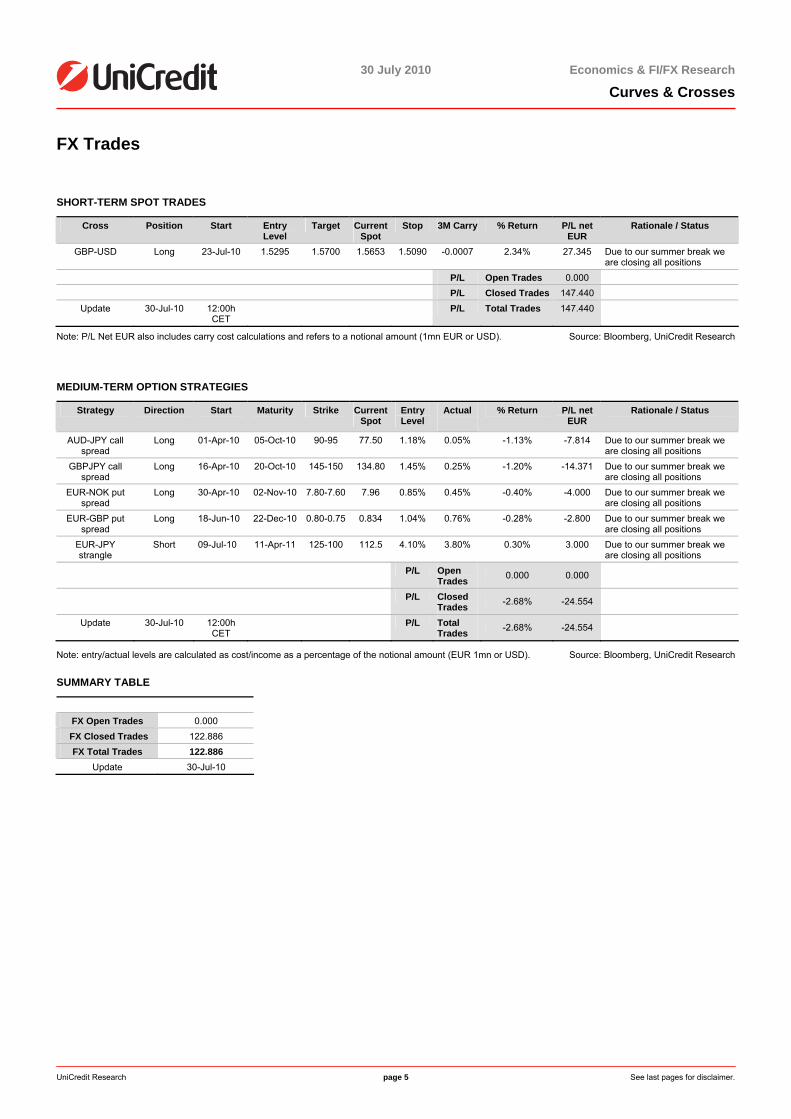
GBP-USD Long 23-Jul-10 1.5295 1.5700 1.5653 1.5090 -0.0007 2.34% 27.345 Due to our summer break we are closing all positions
P/L Open Trades 0.000 P/L Closed Trades 147.440
Update 30-Jul-10 12:00h CET
P/L Total Trades 147.440
Note: P/L Net EUR also includes carry cost calculations and refers to a notional amount (1mn EUR or USD). Source: Bloomberg, UniCredit Research
MEDIUM-TERM OPTION STRATEGIES
Strategy Direction Start Maturity Strike Current Spot
Entry Level
Actual
% Return P/L net EUR
Rationale / Status
AUD-JPY call spread
Long 01-Apr-10 05-Oct-10 90-95 77.50 1.18% 0.05% -1.13% -7.814 Due to our summer break we are closing all positions
GBPJPY call spread
Long 16-Apr-10 20-Oct-10 145-150 134.80 1.45% 0.25% -1.20% -14.371 Due to our summer break we are closing all positions
EUR-NOK put spread
Long 30-Apr-10 02-Nov-10 7.80-7.60 7.96 0.85% 0.45% -0.40% -4.000 Due to our summer break we are closing all positions
EUR-GBP put spread
Long 18-Jun-10 22-Dec-10 0.80-0.75 0.834 1.04% 0.76% -0.28% -2.800 Due to our summer break we are closing all positions
EUR-JPY strangle
Short 09-Jul-10 11-Apr-11 125-100 112.5 4.10% 3.80% 0.30% 3.000 Due to our summer break we are closing all positions
P/L Open Trades 0.000 0.000
P/L Closed Trades -2.68% -24.554
Update 30-Jul-10 12:00h CET
P/L Total Trades -2.68% -24.554
Note: entry/actual levels are calculated as cost/income as a percentage of the notional amount (EUR 1mn or USD). Source: Bloomberg, UniCredit Research
SUMMARY TABLE
FX Open Trades 0.000
FX Closed Trades 122.886 FX Total Trades 122.886
Update 30-Jul-10
30 July 2010 Economics & FI/FX Research
Curves & Crosses
UniCredit Research page 6 See last pages for disclaimer.
FI Strategizer
Cautiousness to prevail in the summer break Chiara Cremonesi (UniCredit Bank London) +44 207 826 1771 [email protected] Investors have adopted a constructive approach vs. the stress test results publication this week… …while in the US they concentrate on the dovish message coming from macroeconomic data and Fed’s officials
Investors showed a constructive approach after the publication of the stress test results last week. While a few critical issues have been highlighted this week, (for example, the use of the Tier 1 ratio biased the results on the positive side; on the assumption side, the exclusion ofthe hypothesis of default was rather optimistic, as well as the fact that haircuts on sovereign bonds have been applied only to the trading book), the market preferred to concentrate on the increase in transparency in the system brought about by the stress test publication. Indeed, expectations were rather low ahead of the publication, so therather detailed assumptions were a positive surprise. Data wise, in the eurozone, the EMU economic sentiment was up strongly in July (from 99 to 101.3) and the flash estimate for EMU CPI came in at 1.7%, rising from the previous 1.4% In the US, while housing data (new home sales and the S&P CaseShiller) came in above expectations, consumer confidence and durable goods orders were quite disappointing. The advanced release of 2Q GDP came in at 2.4%, slightly below expectations, with a rather weakconsumption component. The Fed’s Beige Book delivered a soft message. Finally, Fed’s Bullard underlined the risks of deflation in the Fed’s Minutes. While market sentiment has remained mildly positive in the EMU, in the US investorsconcentrated on the dovish messages coming from macroeconomic data and Fed’s officials.
All in all, after a positive start of the week for risky assets, risk aversion resurfaced slightly.Stocks were moderately down with the DAX decreasing 1.2% and the S&P decreasing 0.1%. In the EMU, a mild optimism weighed on Bunds, especially at the short end, while in the US,Treasuries were supported by further signs of an economic slowdown. US Treasuries outperformed Bunds at the short end.
The stress test results publication led to a sharp tightening of periphery spreads
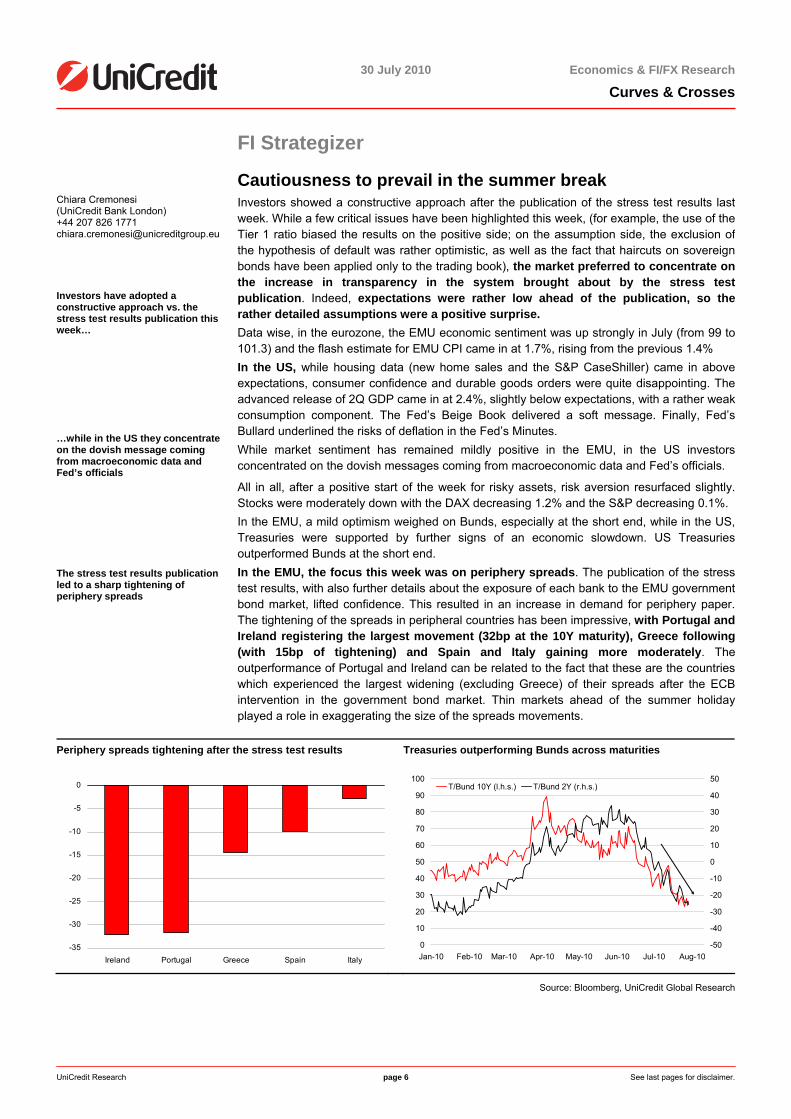
In the EMU, the focus this week was on periphery spreads. The publication of the stress test results, with also further details about the exposure of each bank to the EMU governmentbond market, lifted confidence. This resulted in an increase in demand for periphery paper.The tightening of the spreads in peripheral countries has been impressive, with Portugal and Ireland registering the largest movement (32bp at the 10Y maturity), Greece following (with 15bp of tightening) and Spain and Italy gaining more moderately. The outperformance of Portugal and Ireland can be related to the fact that these are the countrieswhich experienced the largest widening (excluding Greece) of their spreads after the ECBintervention in the government bond market. Thin markets ahead of the summer holiday played a role in exaggerating the size of the spreads movements.
Periphery spreads tightening after the stress test results Treasuries outperforming Bunds across maturities
-35
-30
-25
-20
-15
-10
-5
0
Ireland Portugal Greece Spain Italy
0
10
20
30
40
50
60
70
80
90
100
Jan-10 Feb-10 Mar-10 Apr-10 May-10 Jun-10 Jul-10 Aug-10-50
-40
-30
-20
-10
0
10
20
30
40
50T/Bund 10Y (l.h.s.) T/Bund 2Y (r.h.s.)
Source: Bloomberg, UniCredit Global Research
30 July 2010 Economics & FI/FX Research
Curves & Crosses
UniCredit Research page 7 See last pages for disclaimer.
3M ECB auction delivered a positive message
The constructive market reaction after the stress test publication is also consistent with the outcome of the ECB 3M auction this week. Demand was EUR 23.16bn, vs. EUR 4.8bn expiring, leading to a EUR 18bn increase in liquidity. As the increase in liquidity wasmodest (EUR 18.3bn), we interpret it as an adjustment after the sizeable decrease in liquidityover the last few weeks. The number of banks participating was 70, which compares favorably with the 171 banksparticipating at the end of June 3M, even taking into account the different environment. Backin June the number of banks was especially high because market participants were rollingover the expiry of the 12M LTRO. All in all, the 3M auction result was reassuring as it seems to confirm that the EU banking system is sound. MM rates put on another 1.5bp during the week. While the trendof increase remains intact, the pace has slightly decreased over the last week.
Next week's data calendar in the US…
Next week, the data calendar will be rather heavy, with ISM and non farm payrolls in the US and the ECB meeting in the EMU.
In the US, ISM Manufacturing should post another decrease, reflecting the fading away of the inventory cycle support and signs of a slowdown in the global economy. We expect the non farm payrolls to come in at -75K, improving from -125K registered in June. The unemployment rate should fall slightly to 9.5% from the previous 9.6%, however, the decline should have been caused again by a decrease in the labor force rather than by an improvement in employment. Data in the US next week should again confirm the currentslowdown in the economic cycle. Bernanke’s speech on Monday should not add any newelement to the recent Fed’s rhetoric.
…and in the EMU In the EMU, the focus should be on the ECB meeting. We do not expect any major surprise here. Trichet will likely welcome the stress test results as a major step towards a higher degree of transparency and coordination of the EU banking system. As far as themacroeconomic outlook is concerned, even though the most recent set of growth indicatorsvindicate the ECB's view that higher short term rates won't jeopardize the recovery, Trichet onThursday will continue to sound cautious on future growth prospects, not least because the lending cycle has not yet turned. Aside from this, June factory orders and industrial productionfigures will be released in Germany. We expect a strong reading for factory orders and IP topost another positive reading in line with the scenario of acceleration in the economic recovery in Germany.
Bond-friendly supply in the EMU and no supply in the US
Supply in the EMU should be friendly, as there should be only EUR 4bn of gross supplycoming from Austria and Spain. In the US, no supply is scheduled.
Macroeconomic data and the absence of supply pressure to support Treasuries next week
All in all, another round of soft data in the US and the absence of supply should favorbonds next week. Over the last few days, the 2Y has come back to trade in the 0.55% area, at its record lows, so we see little room here for a further rally. We see the 2Y Treasury likely to trade in the 0.55/0.60% range, while the 10Y yield should trade in the 2.90/2.95% range.
Optimism should lose momentum in the EMU, but strong data in Germany could support risk appetite
In the EMU, the impact of the optimism observed after the stress test results should lose some steam. However, strong data in Germany could provide some support to risk appetite.This should hit Bunds, with the 2Y yields rising again towards 0.85% and the 10Y towards 2.75%.
In regard to periphery spreads, the stress test has surely been a major trigger to install someconfidence, as shown by the fact that the tightening of periphery spreads following the publication of the stress test results has been very relevant. However, the positive reactionmay be similar to that observed after the ECB intervention in the government bonds marketand after the announcement of the fiscal consolidation programs by the EMU countries, basically short lived. Indeed, market mood on periphery remains fragile and vulnerable to bad news, as also confirmed by the widening or Irish spreads yesterday on Fitch worries on theIrish banking system and this morning on Moody’s remarks about a possible downgrade ofSpain.
A glance at the UK… Finally, in the UK next week, the July manufacturing and service PMIs and the June industrial production figures will be released, while the BoE will hold its meeting.
The PMIs should keep signaling a slowdown in economic activity from the very strongperformance recorded in 2Q, while June factory output might have increased less than in the
30 July 2010 Economics & FI/FX Research
Curves & Crosses
UniCredit Research page 8 See last pages for disclaimer.
previous month (we expect 0.2% mom).
We do not expect major surprises at the BoE meeting. We do not expect major surprises atthe BoE meeting. Gilts are actually trading at their record low levels. Mixed data next weekshould keep Gilt yields in the current trading range.
August trends in the FI market For the rest of August, investors should continue to lean on the cautious side. More evidence that the US economy is slowing down should continue to support the US Treasuries. In the eurozone, investors should remain slightly more positive, after that a few measures have been put in place in order to restore some confidence in the market following the burst of the sovereign debt crisis. However, also in the EMU uncertainty remains highon periphery and this should keep investors on the prudent side.
Back to front page
30 July 2010 Economics & FI/FX Research
Curves & Crosses
UniCredit Research page 9 See last pages for disclaimer.
Real Money Section: Euroland Portfolio Strategy
Back to a minor long duration stance Michael Rottmann (UniCredit Bank) +49 89 378-15121 [email protected]
The only thing booming these days is prophecies of doom. Anyone trying to catch a headline has to predict at least a sovereign default, a double-dip recession or deflation. In this regard, financial market commentators responded to the stress test as is their wont: missedopportunity, stress scenario too lax, markdowns on government bonds should have related not only to the exposure in the prop book, and the list goes on and on …
However, investors were deaf to these arguments. In a world dominated by numbers,psychology is apparently to some extent more important. Despite several hundred pages of critical research material immediately before and after the publication of the European stresstest results, the simulation we discussed over the last two weeks was spot on in terms of thedevelopment of currencies and fixed income markets. The EUR-USD exchange rate, the trade-weighted USD, and even yield movements in the euro zone reacted as suggested bythe experience of the US stress test - almost to the decimal place.
Psychology outperformed interpretation
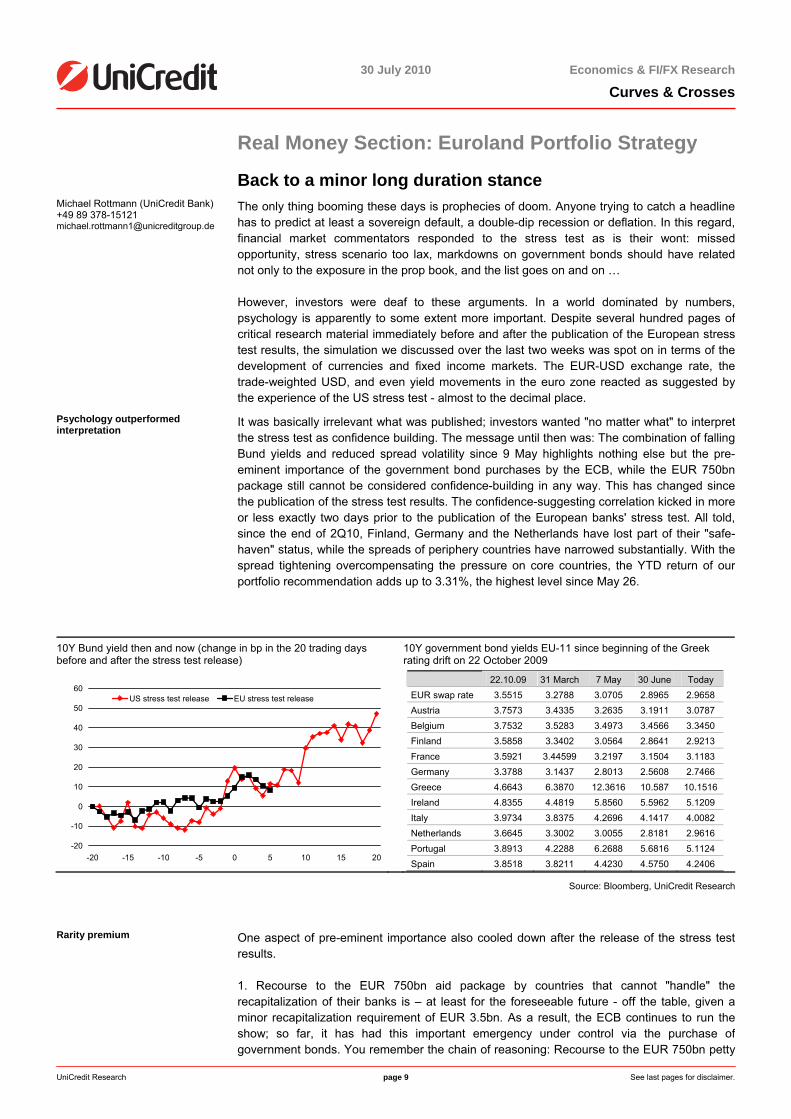
It was basically irrelevant what was published; investors wanted "no matter what" to interpretthe stress test as confidence building. The message until then was: The combination of fallingBund yields and reduced spread volatility since 9 May highlights nothing else but the pre-eminent importance of the government bond purchases by the ECB, while the EUR 750bnpackage still cannot be considered confidence-building in any way. This has changed since the publication of the stress test results. The confidence-suggesting correlation kicked in more or less exactly two days prior to the publication of the European banks' stress test. All told,since the end of 2Q10, Finland, Germany and the Netherlands have lost part of their "safe-haven" status, while the spreads of periphery countries have narrowed substantially. With the spread tightening overcompensating the pressure on core countries, the YTD return of ourportfolio recommendation adds up to 3.31%, the highest level since May 26.
10Y Bund yield then and now (change in bp in the 20 trading days before and after the stress test release)
10Y government bond yields EU-11 since beginning of the Greek rating drift on 22 October 2009
-20
-10
0
10
20
30
40
50
60
-20 -15 -10 -5 0 5 10 15 20
US stress test release EU stress test release 22.10.09 31 March 7 May 30 June Today
EUR swap rate 3.5515 3.2788 3.0705 2.8965 2.9658 Austria 3.7573 3.4335 3.2635 3.1911 3.0787 Belgium 3.7532 3.5283 3.4973 3.4566 3.3450 Finland 3.5858 3.3402 3.0564 2.8641 2.9213 France 3.5921 3.44599 3.2197 3.1504 3.1183 Germany 3.3788 3.1437 2.8013 2.5608 2.7466 Greece 4.6643 6.3870 12.3616 10.587 10.1516 Ireland 4.8355 4.4819 5.8560 5.5962 5.1209 Italy 3.9734 3.8375 4.2696 4.1417 4.0082 Netherlands 3.6645 3.3002 3.0055 2.8181 2.9616 Portugal 3.8913 4.2288 6.2688 5.6816 5.1124 Spain 3.8518 3.8211 4.4230 4.5750 4.2406
Source: Bloomberg, UniCredit Research
Rarity premium One aspect of pre-eminent importance also cooled down after the release of the stress test
results.
1. Recourse to the EUR 750bn aid package by countries that cannot "handle" therecapitalization of their banks is – at least for the foreseeable future - off the table, given a minor recapitalization requirement of EUR 3.5bn. As a result, the ECB continues to run theshow; so far, it has had this important emergency under control via the purchase ofgovernment bonds. You remember the chain of reasoning: Recourse to the EUR 750bn petty
30 July 2010 Economics & FI/FX Research
Curves & Crosses
UniCredit Research page 10 See last pages for disclaimer.
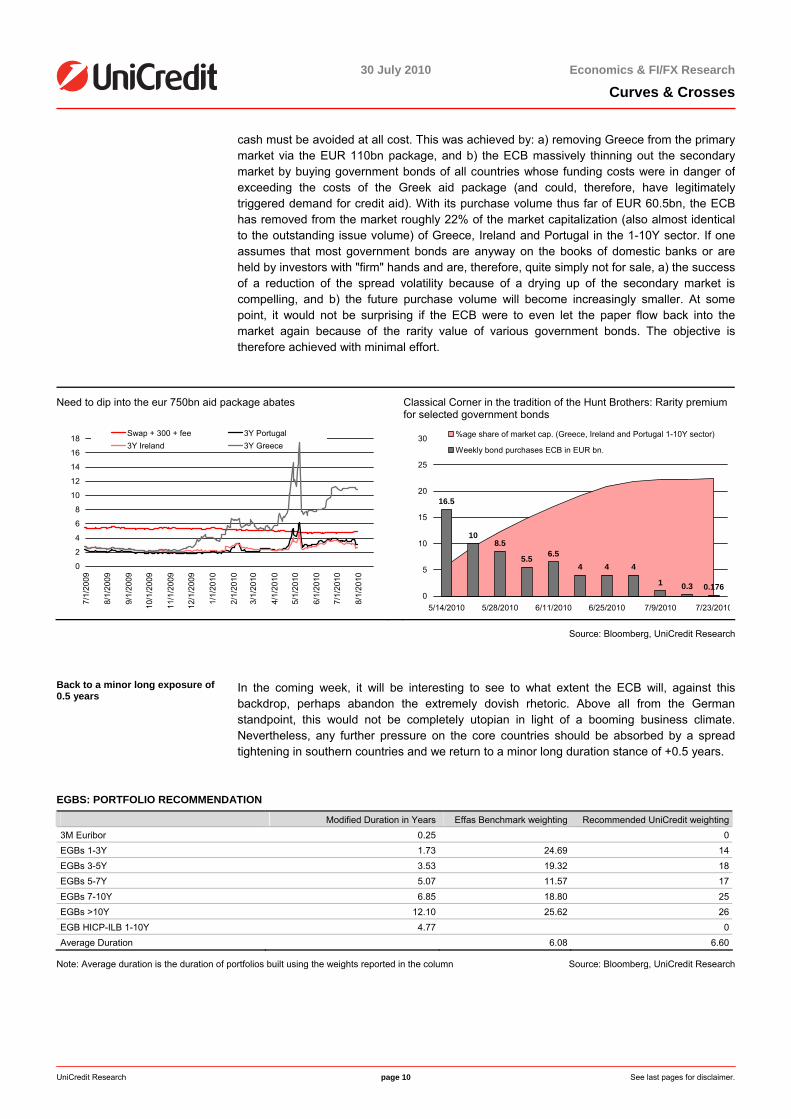
cash must be avoided at all cost. This was achieved by: a) removing Greece from the primarymarket via the EUR 110bn package, and b) the ECB massively thinning out the secondarymarket by buying government bonds of all countries whose funding costs were in danger ofexceeding the costs of the Greek aid package (and could, therefore, have legitimatelytriggered demand for credit aid). With its purchase volume thus far of EUR 60.5bn, the ECBhas removed from the market roughly 22% of the market capitalization (also almost identicalto the outstanding issue volume) of Greece, Ireland and Portugal in the 1-10Y sector. If one assumes that most government bonds are anyway on the books of domestic banks or are held by investors with "firm" hands and are, therefore, quite simply not for sale, a) the successof a reduction of the spread volatility because of a drying up of the secondary market iscompelling, and b) the future purchase volume will become increasingly smaller. At some point, it would not be surprising if the ECB were to even let the paper flow back into themarket again because of the rarity value of various government bonds. The objective istherefore achieved with minimal effort.
Need to dip into the eur 750bn aid package abates Classical Corner in the tradition of the Hunt Brothers: Rarity premium for selected government bonds
0
2
4
6
8
10
12
14
16
18
7/1/
2009
8/1/
2009
9/1/
2009
10/1
/200
9
11/1
/200
9
12/1
/200
9
1/1/
2010
2/1/
2010
3/1/
2010
4/1/
2010
5/1/
2010
6/1/
2010
7/1/
2010
8/1/
2010
Swap + 300 + fee 3Y Portugal3Y Ireland 3Y Greece
16.5
108.5
5.5 6.54 4 4
1 0.3 0.1760
5
10
15
20
25
30
5/14/2010 5/28/2010 6/11/2010 6/25/2010 7/9/2010 7/23/2010
%age share of market cap. (Greece, Ireland and Portugal 1-10Y sector)
Weekly bond purchases ECB in EUR bn.
Source: Bloomberg, UniCredit Research
Back to a minor long exposure of 0.5 years
In the coming week, it will be interesting to see to what extent the ECB will, against thisbackdrop, perhaps abandon the extremely dovish rhetoric. Above all from the Germanstandpoint, this would not be completely utopian in light of a booming business climate.Nevertheless, any further pressure on the core countries should be absorbed by a spreadtightening in southern countries and we return to a minor long duration stance of +0.5 years.
EGBS: PORTFOLIO RECOMMENDATION
Modified Duration in Years Effas Benchmark weighting Recommended UniCredit weighting3M Euribor 0.25 0EGBs 1-3Y 1.73 24.69 14EGBs 3-5Y 3.53 19.32 18EGBs 5-7Y 5.07 11.57 17EGBs 7-10Y 6.85 18.80 25EGBs >10Y 12.10 25.62 26EGB HICP-ILB 1-10Y 4.77 0Average Duration 6.08 6.60
Note: Average duration is the duration of portfolios built using the weights reported in the column Source: Bloomberg, UniCredit Research
30 July 2010 Economics & FI/FX Research
Curves & Crosses
UniCredit Research page 11 See last pages for disclaimer.
Real Money Section: Euroland Country Strategy
Taking profits after recent periphery tightening Elia Lattuga (UniCredit Bank Milan) +39 02 88622027 [email protected]
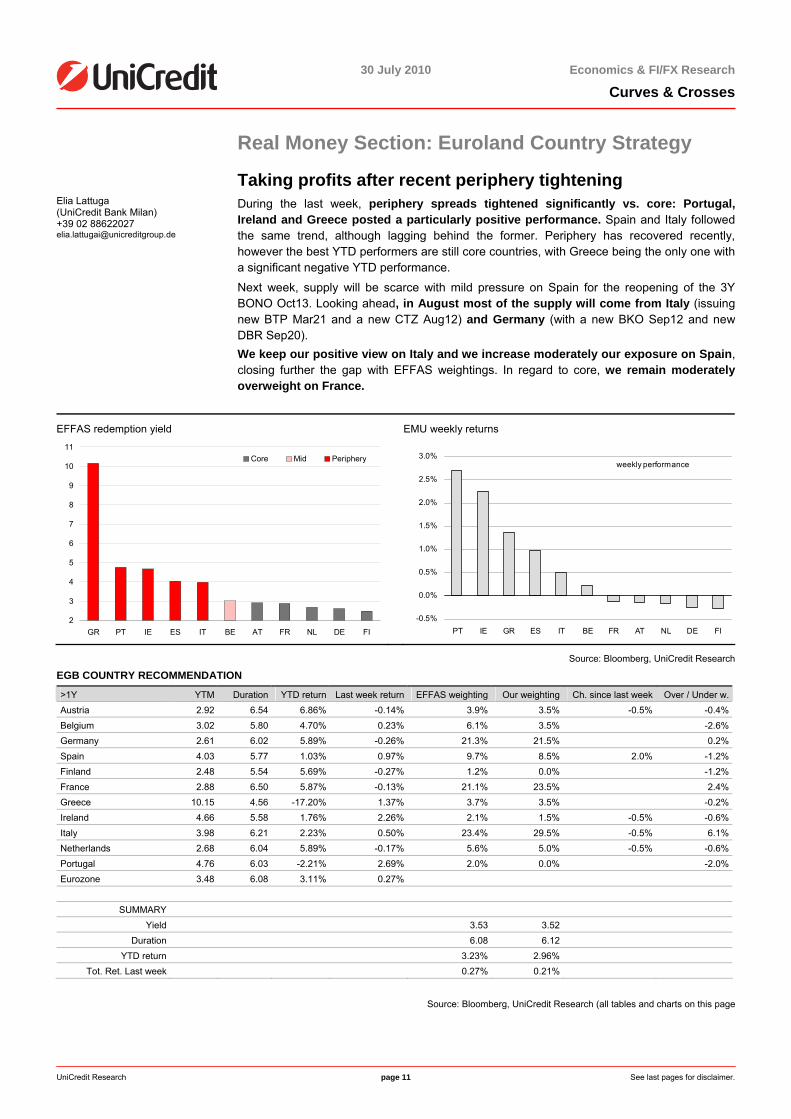
During the last week, periphery spreads tightened significantly vs. core: Portugal,Ireland and Greece posted a particularly positive performance. Spain and Italy followed the same trend, although lagging behind the former. Periphery has recovered recently, however the best YTD performers are still core countries, with Greece being the only one witha significant negative YTD performance.
Next week, supply will be scarce with mild pressure on Spain for the reopening of the 3Y BONO Oct13. Looking ahead, in August most of the supply will come from Italy (issuing new BTP Mar21 and a new CTZ Aug12) and Germany (with a new BKO Sep12 and new DBR Sep20). We keep our positive view on Italy and we increase moderately our exposure on Spain, closing further the gap with EFFAS weightings. In regard to core, we remain moderately overweight on France.
EFFAS redemption yield EMU weekly returns
2
3
4
5
6
7
8
9
10
11
GR PT IE ES IT BE AT FR NL DE FI
Core Mid Periphery
-0.5%
0.0%
0.5%
1.0%
1.5%
2.0%
2.5%
3.0%
PT IE GR ES IT BE FR AT NL DE FI
weekly performance
Source: Bloomberg, UniCredit Research
EGB COUNTRY RECOMMENDATION
>1Y YTM Duration YTD return Last week return EFFAS weighting Our weighting Ch. since last week Over / Under w.Austria 2.92 6.54 6.86% -0.14% 3.9% 3.5% -0.5% -0.4%Belgium 3.02 5.80 4.70% 0.23% 6.1% 3.5% -2.6%Germany 2.61 6.02 5.89% -0.26% 21.3% 21.5% 0.2%Spain 4.03 5.77 1.03% 0.97% 9.7% 8.5% 2.0% -1.2%Finland 2.48 5.54 5.69% -0.27% 1.2% 0.0% -1.2%France 2.88 6.50 5.87% -0.13% 21.1% 23.5% 2.4%Greece 10.15 4.56 -17.20% 1.37% 3.7% 3.5% -0.2%Ireland 4.66 5.58 1.76% 2.26% 2.1% 1.5% -0.5% -0.6%Italy 3.98 6.21 2.23% 0.50% 23.4% 29.5% -0.5% 6.1%Netherlands 2.68 6.04 5.89% -0.17% 5.6% 5.0% -0.5% -0.6%Portugal 4.76 6.03 -2.21% 2.69% 2.0% 0.0% -2.0%Eurozone 3.48 6.08 3.11% 0.27%
SUMMARY
Yield 3.53 3.52 Duration 6.08 6.12
YTD return 3.23% 2.96% Tot. Ret. Last week 0.27% 0.21%
Source: Bloomberg, UniCredit Research (all tables and charts on this page
30 July 2010 Economics & FI/FX Research
Curves & Crosses
UniCredit Research page 12 See last pages for disclaimer.
Total Return Monitor
TOTAL RETURN YTD OF FIXED INCOME ASSETS
1.1
9.5
1.9
6.8
1.9 3.
2
0.2
10.2
1.9
7.7
2.0 3.
4
0.3
20.6
12.3
8.9
17.8
3.3
14.1
21.3
0
4
8
12
16
20
24
28
32
Euro 7-10 Euro 1-3 US 7-10 US 1-3 UK 7-10 UK 1-3 JP 7-10 JP 1-3
Tota
l ret
urn
(%)
Asset return Hedged EUR Eur return
TOTAL RETURN YTD OF CURRENCIES AND EQUITIES
10.1
6.8
17.6
9.3
-3.2
1.4
-9.0
-3.4
3.9
0.4
6.6
1.4
7.0
3.2
14.4
10.6
-20
-16
-12
-8
-4
0
4
8
12
16
20
24
28
USD GBP JPY CHF S&P DAX Nikkei FTSE Gold CRB
Tota
l ret
urn
(%)
Asset return Eur return
TOTAL RETURN BY COUNTRY AND MATURITY BUCKET
Euro 7-10
Euro 1-3
US 7-10
US 1-3 UK 7-10
UK 1-3
JP 7-10
JP 1-3
1W 0.36 -0.01 -0.24 -0.03 -0.83 -0.19 -0.23 0.00 1M 0.91 0.37 0.35 0.17 -0.89 -0.18 -0.15 0.01
TOTAL RETURN BY ASSET CLASS EUROZONE (2010 YTD)
5.3
9.6
5.7
-0.9
1.6
4.5
3.33.4
3.3
1.8
3.8
6.7
4.1
1.1
2.5
2.2
1.9
3.6 4.
1
1.0
4.3
-0.6
7.6
9.5
3.5
-0.1
3.5 3.9
6.9
1.0
9.8
2.0
-4
-2
0
2
4
6
8
10
12
2003 2004 2005 2006 2007 2008 2009 2010
YTD
tota
l ret
urn
(%).
Euro 7-10 Euro 1-3 CCT ILB
TOTAL RETURN BY COUNTRY AND MATURITY BUCKET
USD GBP JPY CHF S&P DAX Nikkei
FTSE
Gold CRB
1W -1.48 0.70 -1.15 -1.09 0.22 -0.12 5.15 0.00 -2.58 0.55 1M -4.3 -1.6 -3.2 -2.4 6.7 4.7 5.5 10.6 -2.9 2.3
TOTAL RETURN BY ASSET CLASS US (2010 YTD)
3.3 4.
9
2.8
2.5
10.1
-5.2
9.5
2.4
1.0
3.8
7.3
6.4
0.9 1.
9
7.9
7.5
2.3
1.4
11.3
-2.6
2.8
17.2
1.8
12.0
-10
-5
0
5
10
15
20
2003 2004 2005 2006 2007 2008 2009 2010
YTD
tota
l ret
urn
(%).
US 7-10 US 1-3 ILB
TOTAL RETURN YTD BY COUNTRY AND MATURITY BUCKET
Maturity bucket DE FR AT FI NL BE ES PT IT GR IE 1 -3 1.59% 1.72% 2.23% 2.04% 1.70% 1.94% 0.67% 0.91% 1.23% -7.06% 1.84% 3 -5 4.35% 4.17% 4.58% 4.19% 4.30% 3.59% 2.12% 0.14% 2.65% -14.26% - 5 - 7 5.52% 5.58% 5.96% 5.25% 5.59% 4.14% 1.88% -1.31% 3.21% -18.75% 1.94% 7 - 10 6.86% 6.95% 7.23% 7.52% 7.16% 5.71% 1.13% -2.55% 3.08% -23.58% 2.26%
>1 5.79% 5.80% 6.84% 5.63% 5.80% 4.64% 0.99% -2.04% 2.18% -17.21% 2.02%
SPREAD TO DE
1 -3 - 0.13% 0.64% 0.45% 0.10% 0.35% -0.92% -0.68% -0.36% -8.66% 0.25%
3 -5 - -0.19% 0.23% -0.16% -0.05% -0.77% -2.23% -4.22% -1.70% -18.61% - 5 - 7 - 0.06% 0.44% -0.27% 0.07% -1.38% -3.64% -6.84% -2.31% -24.28% -3.58% 7 - 10 - 0.09% 0.36% 0.66% 0.29% -1.15% -5.73% -9.41% -3.78% -30.44% -4.60% >1 - 0.01% 1.05% -0.16% 0.01% -1.15% -4.81% -7.84% -3.62% -23.00% -3.77%
Total return for the following combinations of bucket & countries are calculated using EFFAS indices of total return: EUR 7-10, EUR 1-3, US 7-10, US 1-3, UK 7-10, UK 1-3, JP 7-10, JP 1-3. CCTs total return is calculated using MTS index
Source: Bloomberg, EFFAS, UniCredit Research (all tables and charts in this page
Back to front page
30 July 2010 Economics & FI/FX Research
Curves & Crosses
UniCredit Research page 13 See last pages for disclaimer.
Money Market Monitor Eurosystem liquidity analysis
Luca Cazzulani (UniCredit Bank Milan) +39 02 8862 0640 [email protected]
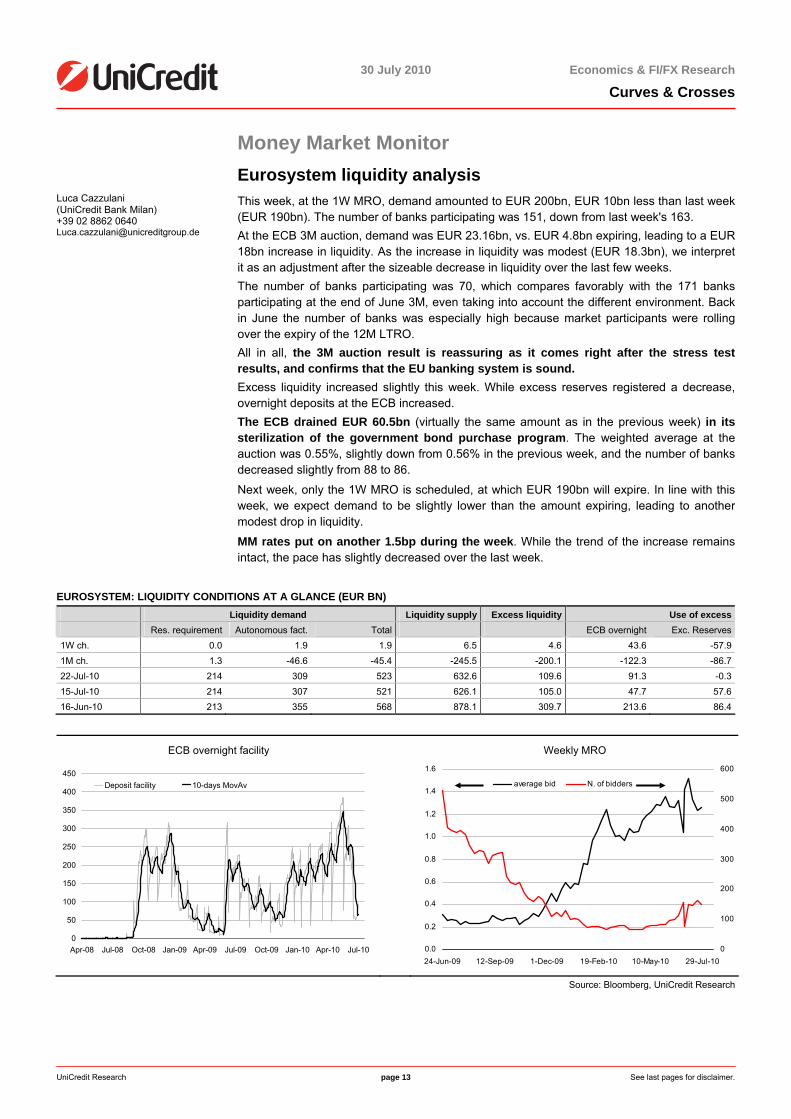
This week, at the 1W MRO, demand amounted to EUR 200bn, EUR 10bn less than last week (EUR 190bn). The number of banks participating was 151, down from last week's 163. At the ECB 3M auction, demand was EUR 23.16bn, vs. EUR 4.8bn expiring, leading to a EUR18bn increase in liquidity. As the increase in liquidity was modest (EUR 18.3bn), we interpretit as an adjustment after the sizeable decrease in liquidity over the last few weeks. The number of banks participating was 70, which compares favorably with the 171 banksparticipating at the end of June 3M, even taking into account the different environment. Backin June the number of banks was especially high because market participants were rollingover the expiry of the 12M LTRO. All in all, the 3M auction result is reassuring as it comes right after the stress testresults, and confirms that the EU banking system is sound. Excess liquidity increased slightly this week. While excess reserves registered a decrease, overnight deposits at the ECB increased.
The ECB drained EUR 60.5bn (virtually the same amount as in the previous week) in its sterilization of the government bond purchase program. The weighted average at theauction was 0.55%, slightly down from 0.56% in the previous week, and the number of banksdecreased slightly from 88 to 86.
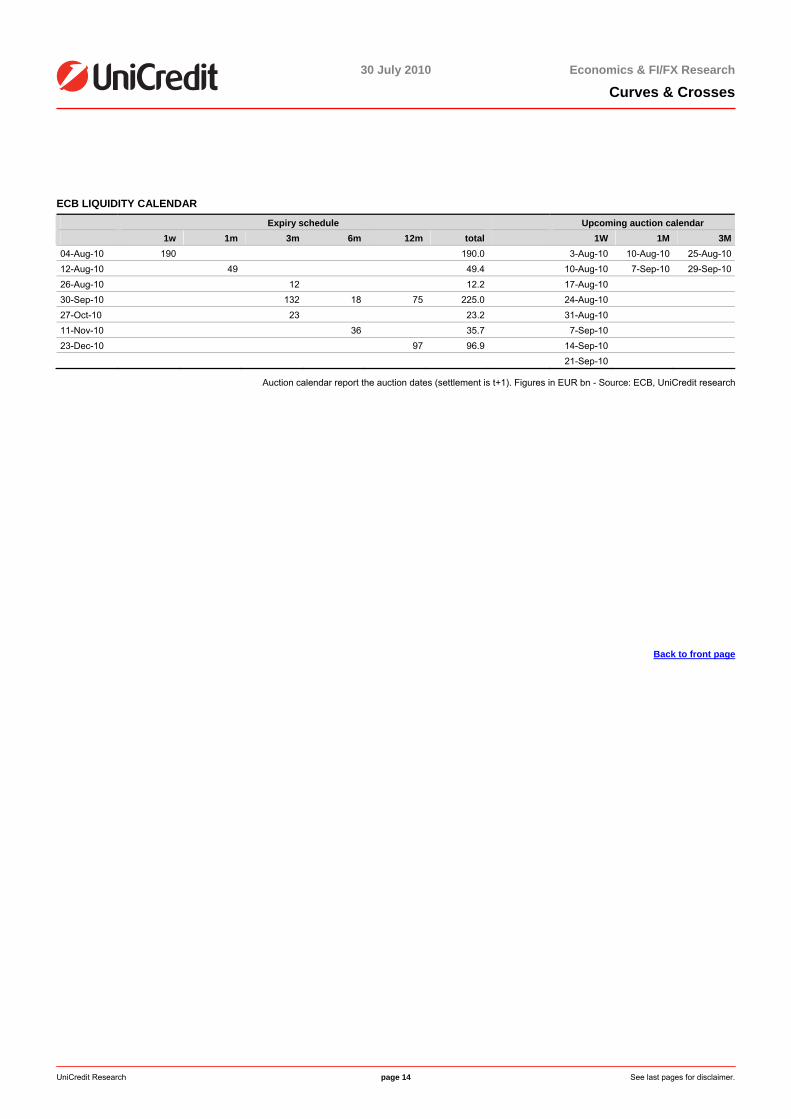
Next week, only the 1W MRO is scheduled, at which EUR 190bn will expire. In line with thisweek, we expect demand to be slightly lower than the amount expiring, leading to anothermodest drop in liquidity.
MM rates put on another 1.5bp during the week. While the trend of the increase remains intact, the pace has slightly decreased over the last week.
EUROSYSTEM: LIQUIDITY CONDITIONS AT A GLANCE (EUR BN) Liquidity demand Liquidity supply Excess liquidity Use of excess Res. requirement Autonomous fact. Total ECB overnight Exc. Reserves1W ch. 0.0 1.9 1.9 6.5 4.6 43.6 -57.91M ch. 1.3 -46.6 -45.4 -245.5 -200.1 -122.3 -86.722-Jul-10 214 309 523 632.6 109.6 91.3 -0.315-Jul-10 214 307 521 626.1 105.0 47.7 57.616-Jun-10 213 355 568 878.1 309.7 213.6 86.4
ECB overnight facility Weekly MRO
0
50
100
150
200
250
300
350
400
450
Apr-08 Jul-08 Oct-08 Jan-09 Apr-09 Jul-09 Oct-09 Jan-10 Apr-10 Jul-10
Deposit facility 10-days MovAv
0.0
0.2
0.4
0.6
0.8
1.0
1.2
1.4
1.6
24-Jun-09 12-Sep-09 1-Dec-09 19-Feb-10 10-May-10 29-Jul-100
100
200
300
400
500
600
average bid N. of bidders
Source: Bloomberg, UniCredit Research
30 July 2010 Economics & FI/FX Research
Curves & Crosses
UniCredit Research page 14 See last pages for disclaimer.
ECB LIQUIDITY CALENDAR
Expiry schedule Upcoming auction calendar 1w 1m 3m 6m 12m total 1W 1M 3M04-Aug-10 190 190.0 3-Aug-10 10-Aug-10 25-Aug-1012-Aug-10 49 49.4 10-Aug-10 7-Sep-10 29-Sep-1026-Aug-10 12 12.2 17-Aug-10 30-Sep-10 132 18 75 225.0 24-Aug-10 27-Oct-10 23 23.2 31-Aug-10 11-Nov-10 36 35.7 7-Sep-10 23-Dec-10 97 96.9 14-Sep-10 21-Sep-10
Auction calendar report the auction dates (settlement is t+1). Figures in EUR bn - Source: ECB, UniCredit research
Back to front page
30 July 2010 Economics & FI/FX Research
Curves & Crosses
UniCredit Research page 15 See last pages for disclaimer.
Euribor rates: historical movements and expectations 3M EURIBOR STRIP (RATES, %)***
0.60
0.70
0.80
0.90
1.00
1.10
1.20
1.30
1.40
1.50
Current 1st (Sep10 ) 2nd (Dec10 ) 3rd (Mar11 ) 4th (Jun11 )
Strip now Strip @ 25-Jun-10 3M (e) keyrate (e)
3M USD LIBOR STRIP (RATES, %)***
0.0
0.2
0.4
0.6
0.8
1.0
1.2
1.4
1.6
1.8
Current 1st (Sep10 ) 2nd (Dec10 ) 3rd (Mar11 ) 4th (Jun11 )
Strip now Strip @ 25-Jun-10 3M (e) keyrate (e)
3M GBP LIBOR STRIP (RATES, %)***
0.0
0.2
0.4
0.6
0.8
1.0
1.2
1.4
1.6
1.8
Current 1st (Sep10 ) 2nd (Dec10 ) 3rd (Mar11 ) 4th (Jun11 )
Strip now Strip @ 25-Jun-10 3M (e) keyrate (e)
3M 6M BASIS SWAP
-20
-15
-10
-5
0
5
10
15
20
25
30
35
Mar-02 Mar-04 Mar-06 Mar-08 Mar-10
3M 6M EUR
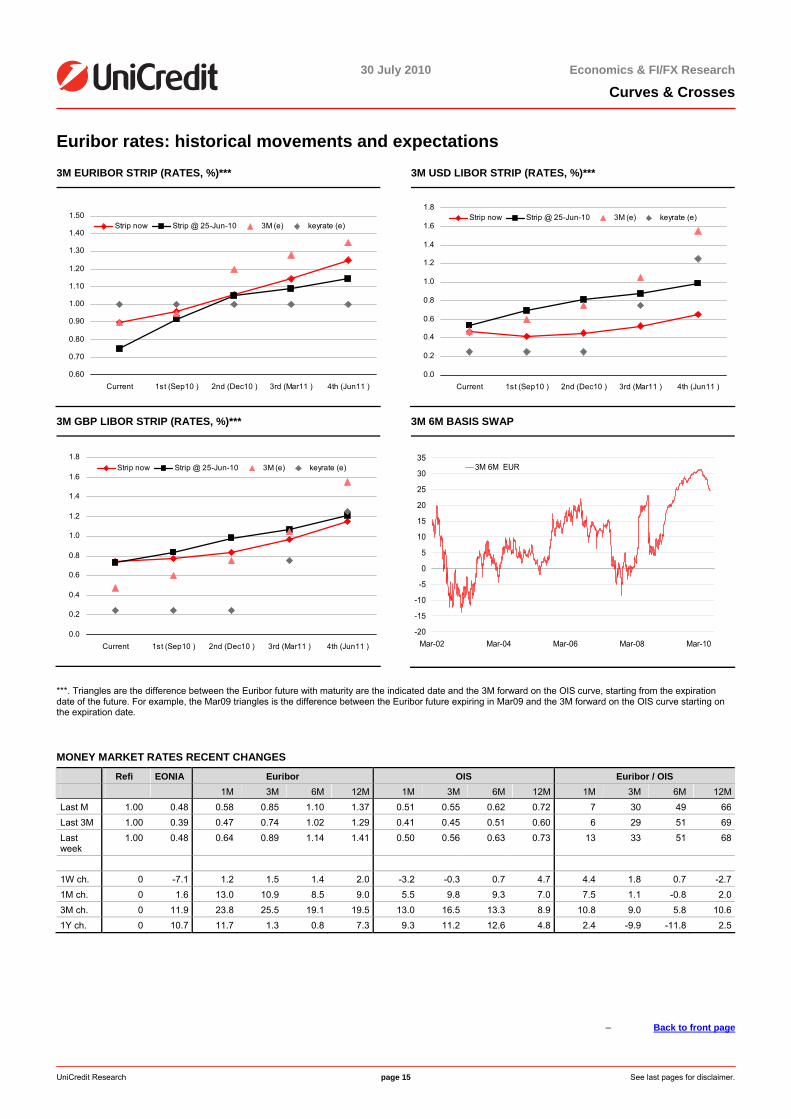
***. Triangles are the difference between the Euribor future with maturity are the indicated date and the 3M forward on the OIS curve, starting from the expiration date of the future. For example, the Mar09 triangles is the difference between the Euribor future expiring in Mar09 and the 3M forward on the OIS curve starting on the expiration date.
MONEY MARKET RATES RECENT CHANGES
Refi EONIA Euribor OIS Euribor / OIS 1M 3M 6M 12M 1M 3M 6M 12M 1M 3M 6M 12MLast M 1.00 0.48 0.58 0.85 1.10 1.37 0.51 0.55 0.62 0.72 7 30 49 66Last 3M 1.00 0.39 0.47 0.74 1.02 1.29 0.41 0.45 0.51 0.60 6 29 51 69Last week
1.00 0.48 0.64 0.89 1.14 1.41 0.50 0.56 0.63 0.73 13 33 51 68
1W ch. 0 -7.1 1.2 1.5 1.4 2.0 -3.2 -0.3 0.7 4.7 4.4 1.8 0.7 -2.71M ch. 0 1.6 13.0 10.9 8.5 9.0 5.5 9.8 9.3 7.0 7.5 1.1 -0.8 2.03M ch. 0 11.9 23.8 25.5 19.1 19.5 13.0 16.5 13.3 8.9 10.8 9.0 5.8 10.61Y ch. 0 10.7 11.7 1.3 0.8 7.3 9.3 11.2 12.6 4.8 2.4 -9.9 -11.8 2.5
– Back to front page

30 July 2010 Economics & FI/FX Research
Curves & Crosses
UniCredit Research page 16 See last pages for disclaimer.
Swap Monitor SWAP CURVE: PAST, SPOT, 3M FORWARD
1.41.2
6.9
-1.0
2.5
-0.3 3.6
0.0
0.5
1.0
1.5
2.0
2.5
3.0
3.5
4.0
0 5 10 15 20 25 30Maturity (years)
30-Jul-10 3 months ago Forward 3M
Numbers denote the 1w bp change in yields
ROLLDOWN &CARRY (3M HORIZON)
0
5
10
15
20
25
30
0 2 4 6 8 10 12 14 16 18 20 22 24 26 28 30maturity (years)
bp
2 & 5 YEAR SWAP RATE: WHAT FORWARDS TELL US
Cur
rent
: 72
3m: 7
0
6m: 7
2
9m: 7
2
12m
: 71
1.0
1.5
2.0
2.5
3.0
3.5
4.0
4.5
5.0
5.5
Dec-06 Jun-07 Dec-07 Jun-08 Dec-08 Jun-09 Dec-09 Jun-10 Dec-10 Jun-11
2Y swap rate (%) 5Y swap rate (%) Forward rates
Numbers denote the spread in bp
10 & 30 YEAR SWAP RATE: WHAT FORWARDS TELL US
12m
: 19
9m: 2
5
6m: 3
0
3m: 3
5
Cur
rent
: 40
2.5
3.0
3.5
4.0
4.5
5.0
5.5
Dec-06 Jun-07 Dec-07 Jun-08 Dec-08 Jun-09 Dec-09 Jun-10 Dec-10 Jun-11
10Y swap rate (%) 30Y swap rate (%) Forward rates
Numbers denote the spread in bp
10&30 AND 2&30 SPREADS: HISTORY AND FORWARD
192
3m 6m 9m 18m
-100
-50
0
50
100
150
200
250
Dec-06 Jun-07 Dec-07 Jun-08 Dec-08 Jun-09 Dec-09 Jun-10 Dec-10 Jun-11
10/30Y spread (bp)
2/30Y spread (bp)
2/10Y spread (bp)
Forward spread
SWAP RATES AT A GLANCE
Average Cheap / rich Last Short term
(last 6M) Long term
(Jan99)Short term
(last 6M) Long term
(Jan99)2Y 1.45 1.42 3.42 C EEEE5Y 2.17 2.29 3.93 E EEEE10Y 2.97 3.14 4.43 EE EEEE15Y 3.36 3.52 4.69 E EEEE30Y 3.37 3.51 4.81 E EEEE
Cheap and rich indicators are base on distribution percentiles. EEEE=Very expensive, E= Expensive, CCCC=Very cheap, C=cheap. Valuations are from the investor’s perspective.
5Y SWAP-OPTION VOLA AT 5Y TENOR
18.53
13.4
15.4
8
10
12
14
16
18
20
22
24
Jan-99 Dec-00 Dec-02 Dec-04 Dec-06 Dec-08 Dec-10 Dec-12
Swaption vola (5Y) average since 1999 average since Aug07
SWAP CURVE AT A GLANCE
Average Cheap / rich Last Short term
(last 6M)Long term
(Jan99) Short term
(last 6M)Long term
(Jan99)2/5 72 87 50 EEE CC5/10 80 85 49 EEE CCC10/15 39 37 25 CC CCCC15/30 1 -1 11 CC EEE2/5/10 -4 1 1 EEE EE10/15/30 19 19 7 - CCCC
Source: Bloomberg, UniCredit Research
Back to front page
30 July 2010 Economics & FI/FX Research
Curves & Crosses
UniCredit Research page 17 See last pages for disclaimer.
Trade Ideas We prefer Italy to Spain
Elia Lattuga (UniCredit Bank Milan) +39 02 8862 2027 [email protected]
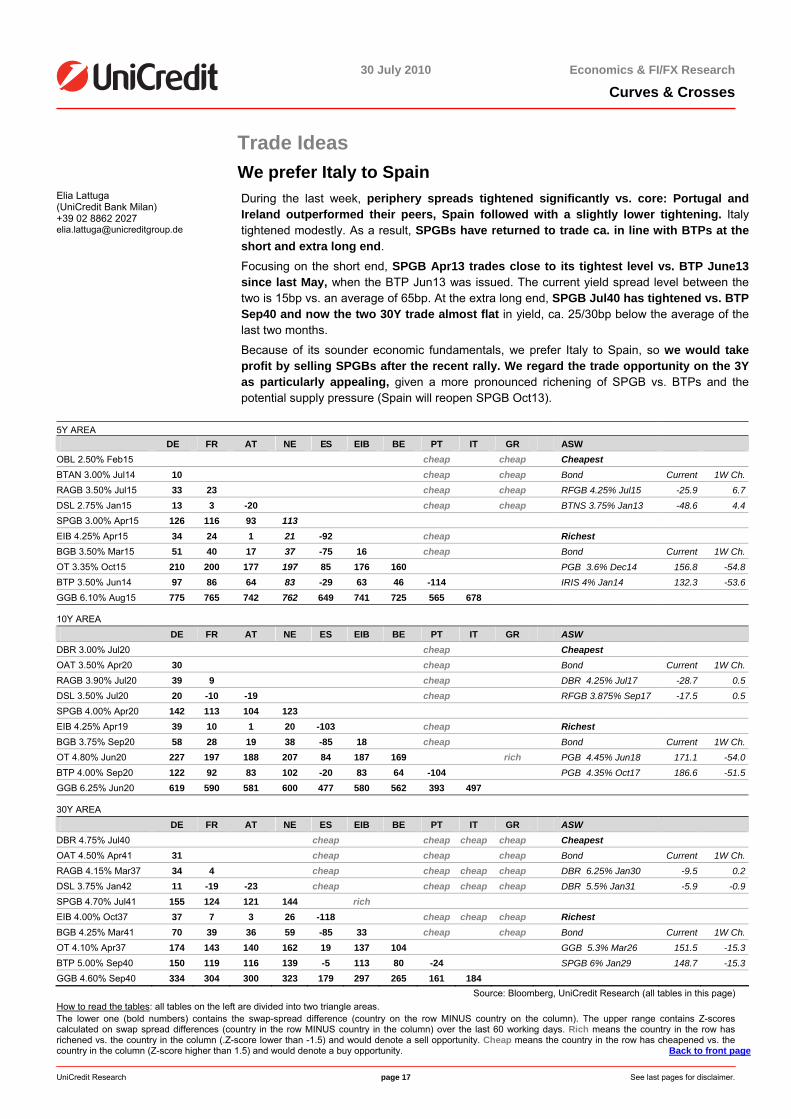
During the last week, periphery spreads tightened significantly vs. core: Portugal and Ireland outperformed their peers, Spain followed with a slightly lower tightening. Italy tightened modestly. As a result, SPGBs have returned to trade ca. in line with BTPs at theshort and extra long end.
Focusing on the short end, SPGB Apr13 trades close to its tightest level vs. BTP June13 since last May, when the BTP Jun13 was issued. The current yield spread level between thetwo is 15bp vs. an average of 65bp. At the extra long end, SPGB Jul40 has tightened vs. BTP Sep40 and now the two 30Y trade almost flat in yield, ca. 25/30bp below the average of the last two months.
Because of its sounder economic fundamentals, we prefer Italy to Spain, so we would take profit by selling SPGBs after the recent rally. We regard the trade opportunity on the 3Y as particularly appealing, given a more pronounced richening of SPGB vs. BTPs and the potential supply pressure (Spain will reopen SPGB Oct13).
5Y AREA
DE FR AT NE ES EIB BE PT IT GR ASW OBL 2.50% Feb15 cheap cheap Cheapest BTAN 3.00% Jul14 10 cheap cheap Bond Current 1W Ch.RAGB 3.50% Jul15 33 23 cheap cheap RFGB 4.25% Jul15 -25.9 6.7DSL 2.75% Jan15 13 3 -20 cheap cheap BTNS 3.75% Jan13 -48.6 4.4SPGB 3.00% Apr15 126 116 93 113 EIB 4.25% Apr15 34 24 1 21 -92 cheap Richest BGB 3.50% Mar15 51 40 17 37 -75 16 cheap Bond Current 1W Ch.OT 3.35% Oct15 210 200 177 197 85 176 160 PGB 3.6% Dec14 156.8 -54.8BTP 3.50% Jun14 97 86 64 83 -29 63 46 -114 IRIS 4% Jan14 132.3 -53.6GGB 6.10% Aug15 775 765 742 762 649 741 725 565 678
10Y AREA DE FR AT NE ES EIB BE PT IT GR ASW DBR 3.00% Jul20 cheap Cheapest OAT 3.50% Apr20 30 cheap Bond Current 1W Ch.RAGB 3.90% Jul20 39 9 cheap DBR 4.25% Jul17 -28.7 0.5DSL 3.50% Jul20 20 -10 -19 cheap RFGB 3.875% Sep17 -17.5 0.5SPGB 4.00% Apr20 142 113 104 123 EIB 4.25% Apr19 39 10 1 20 -103 cheap Richest BGB 3.75% Sep20 58 28 19 38 -85 18 cheap Bond Current 1W Ch.OT 4.80% Jun20 227 197 188 207 84 187 169 rich PGB 4.45% Jun18 171.1 -54.0BTP 4.00% Sep20 122 92 83 102 -20 83 64 -104 PGB 4.35% Oct17 186.6 -51.5GGB 6.25% Jun20 619 590 581 600 477 580 562 393 497
30Y AREA DE FR AT NE ES EIB BE PT IT GR ASW DBR 4.75% Jul40 cheap cheap cheap cheap Cheapest OAT 4.50% Apr41 31 cheap cheap cheap Bond Current 1W Ch.RAGB 4.15% Mar37 34 4 cheap cheap cheap cheap DBR 6.25% Jan30 -9.5 0.2DSL 3.75% Jan42 11 -19 -23 cheap cheap cheap cheap DBR 5.5% Jan31 -5.9 -0.9SPGB 4.70% Jul41 155 124 121 144 rich EIB 4.00% Oct37 37 7 3 26 -118 cheap cheap cheap Richest BGB 4.25% Mar41 70 39 36 59 -85 33 cheap cheap Bond Current 1W Ch.OT 4.10% Apr37 174 143 140 162 19 137 104 GGB 5.3% Mar26 151.5 -15.3BTP 5.00% Sep40 150 119 116 139 -5 113 80 -24 SPGB 6% Jan29 148.7 -15.3GGB 4.60% Sep40 334 304 300 323 179 297 265 161 184
Source: Bloomberg, UniCredit Research (all tables in this page) How to read the tables: all tables on the left are divided into two triangle areas. The lower one (bold numbers) contains the swap-spread difference (country on the row MINUS country on the column). The upper range contains Z-scores calculated on swap spread differences (country in the row MINUS country in the column) over the last 60 working days. Rich means the country in the row has richened vs. the country in the column (.Z-score lower than -1.5) and would denote a sell opportunity. Cheap means the country in the row has cheapened vs. the country in the column (Z-score higher than 1.5) and would denote a buy opportunity. Back to front page
30 July 2010 Economics & FI/FX Research
Curves & Crosses
UniCredit Research page 18 See last pages for disclaimer.
EGB spread monitor
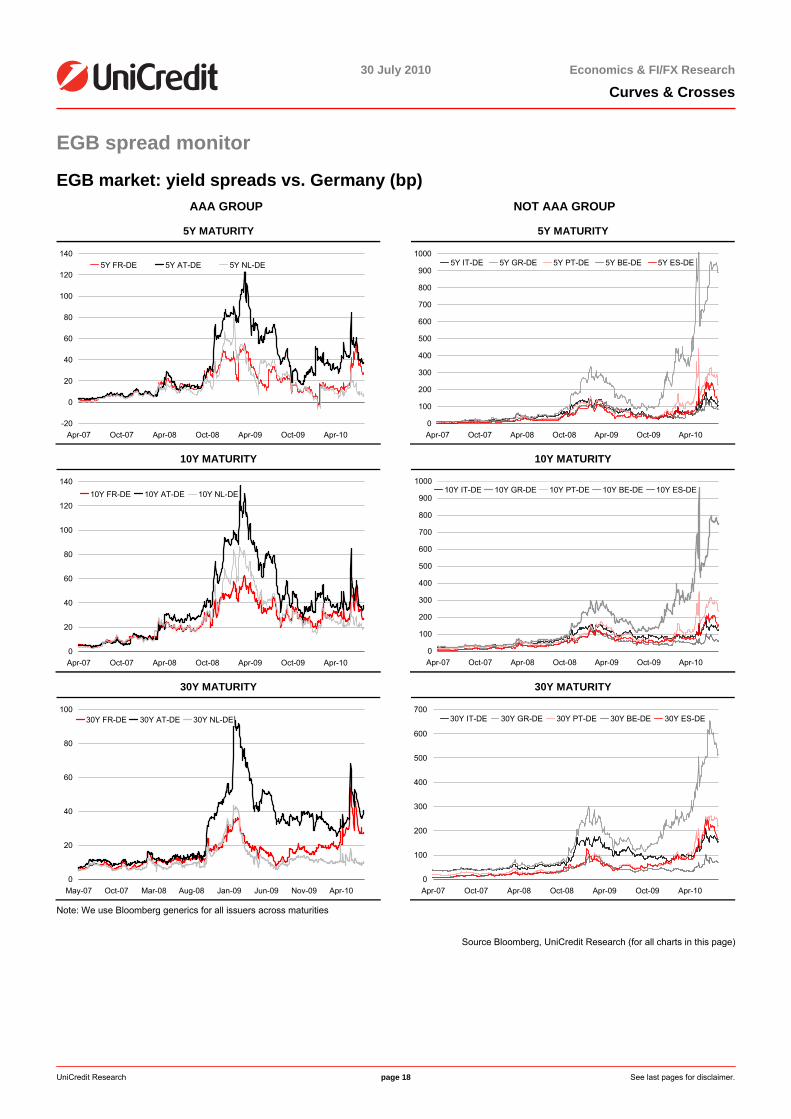
EGB market: yield spreads vs. Germany (bp) AAA GROUP NOT AAA GROUP
5Y MATURITY
-20
0
20
40
60
80
100
120
140
Apr-07 Oct-07 Apr-08 Oct-08 Apr-09 Oct-09 Apr-10
5Y FR-DE 5Y AT-DE 5Y NL-DE
5Y MATURITY
0
100
200
300
400
500
600
700
800
900
1000
Apr-07 Oct-07 Apr-08 Oct-08 Apr-09 Oct-09 Apr-10
5Y IT-DE 5Y GR-DE 5Y PT-DE 5Y BE-DE 5Y ES-DE
10Y MATURITY
0
20
40
60
80
100
120
140
Apr-07 Oct-07 Apr-08 Oct-08 Apr-09 Oct-09 Apr-10
10Y FR-DE 10Y AT-DE 10Y NL-DE
10Y MATURITY
0
100
200
300
400
500
600
700
800
900
1000
Apr-07 Oct-07 Apr-08 Oct-08 Apr-09 Oct-09 Apr-10
10Y IT-DE 10Y GR-DE 10Y PT-DE 10Y BE-DE 10Y ES-DE
30Y MATURITY
0
20
40
60
80
100
May-07 Oct-07 Mar-08 Aug-08 Jan-09 Jun-09 Nov-09 Apr-10
30Y FR-DE 30Y AT-DE 30Y NL-DE
30Y MATURITY
0
100
200
300
400
500
600
700
Apr-07 Oct-07 Apr-08 Oct-08 Apr-09 Oct-09 Apr-10
30Y IT-DE 30Y GR-DE 30Y PT-DE 30Y BE-DE 30Y ES-DE
Note: We use Bloomberg generics for all issuers across maturities
Source Bloomberg, UniCredit Research (for all charts in this page)

30 July 2010 Economics & FI/FX Research
Curves & Crosses
UniCredit Research page 19 See last pages for disclaimer.
Supply Corner: The week ahead
Holiday planning for primary market activity Weekly recap
Chiara Cremonesi (UniCredit Bank London) +44 207 826 1771 [email protected]
The main trend observed this week was strong demand for periphery paper. While core country auctions (Belgium and the Netherlands) did not report stellar results, the Italianauctions (BOTs, BTPei and BTPs), the Portuguese bond auction and the Spanish T-bill auctions were all very well bid. The auction of OT Oct14 and OT Oct23 in Portugal, for example, registered a bid-to-cover ratio higher than 3x for both bonds on auction. This is a positive sign, especially with respectto the sale of OT Oct23, as this was the first auction of a bond with a maturity longer than 10Y in Portugal since January 2010.
Positive sentiment on periphery boosted demand at auctions this week
This boosted further the positive sentiment on periphery, leading to a sharp tightening of thespreads, especially in Portugal.
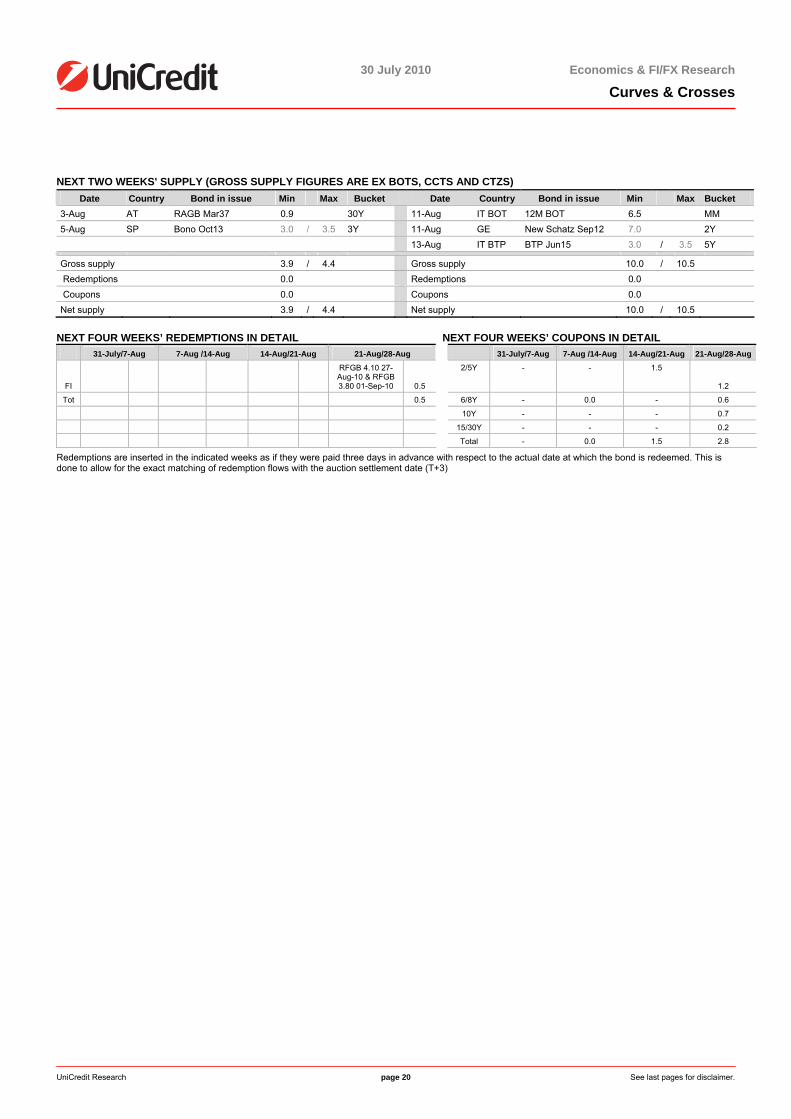
Next week's and next month’s preview Next week, primary market activity should be very subdued, with just EUR 4bn of gross supply
Next week, primary market activity will slow down. There will be no redemptions or coupons in the eurozone, while gross supply should be a modest EUR 4bn.
Activity should mainly come on the short end, with little activity on the extra long end. Austria will re-open RAGB Mar37 by EUR 0.88bn…
Austria will re-open RAGB Mar37 by EUR 0.88bn, bringing YTD supply to ca. EUR 16bn, or 70% of the yearly program we estimate for this year (EUR 22bn).
…while Spain will re-open Bono Oct13
Next Thursday, Spain will re-open Bono Oct13, we pencil in EUR 3/3.5bn of auction volume.Sentiment on periphery turned positive after the stress test release and supported demand for periphery paper this week. Spain benefited from this, registering a good result at the T-bill auction. We thus expect demand to be healthy at next week’s auction as well.
A quick glance at August: liquidity… After a very liquid July, August will be one of the less liquid months of the year, with just EUR 18bn of redemptions and EUR 11bn of coupons all coming from Italy at the beginning ofthe month (BTP 4.50% Aug10 expiring).
… gross supply… We expect gross supply to be in the EUR 35/41bn area. This is slightly higher than gross supply in August last year (EUR 35bn) and higher than the last 5Y average (EUR 23bn).
…and net supply Net supply should be EUR 17/23bn. Despite the higher gross supply, net supply should be slightly lower this year compared to last year, given the higher liquidity (EUR 13bn vs. EUR11bn).
60% of supply will come from periphery, with Italy as the main contributor
Almost 60% of the supply will come from periphery, with Italy likely to be the main contributor within this group (44%). Ca. 40% of the activity should come from corecountries, with Germany accounting for 33%. France and the Netherlands will not hold auctions in August. Finally, Finland should not hold any auction in August.
Distribution of supply in August In terms of maturities, we expect issuance to be rather heavy at the short end (35%) and atthe 10Y (30%), while it should be rather subdued at the 5Y (14%) and at the long and extra-long (4%).
New benchmarks: Germany… In August, Germany will issue two new benchmarks: the new Schatz Sep12 and the newBund Sep20.
…and Italy According to the 3Q funding plan, Italy will issue a new BTP Mar21 and a new CTZ 31Aug12 at the end of August auction (which settles in September). At the mid-month auction, in line with last year, we expect Italy to re-open only BTP Jun15 and not to re-open any new benchmark on the long end.
30 July 2010 Economics & FI/FX Research
Curves & Crosses
UniCredit Research page 20 See last pages for disclaimer.
NEXT TWO WEEKS' SUPPLY (GROSS SUPPLY FIGURES ARE EX BOTS, CCTS AND CTZS)
Date Country Bond in issue Min Max Bucket Date Country Bond in issue Min Max Bucket 3-Aug AT RAGB Mar37 0.9 30Y 11-Aug IT BOT 12M BOT 6.5 MM 5-Aug SP Bono Oct13 3.0 / 3.5 3Y 11-Aug GE New Schatz Sep12 7.0 2Y 13-Aug IT BTP BTP Jun15 3.0 / 3.5 5Y
Gross supply 3.9 / 4.4 Gross supply 10.0 / 10.5 Redemptions 0.0 Redemptions 0.0 Coupons 0.0 Coupons 0.0 Net supply 3.9 / 4.4 Net supply 10.0 / 10.5
NEXT FOUR WEEKS’ REDEMPTIONS IN DETAIL NEXT FOUR WEEKS’ COUPONS IN DETAIL 31-July/7-Aug 7-Aug /14-Aug 14-Aug/21-Aug 21-Aug/28-Aug 31-July/7-Aug 7-Aug /14-Aug 14-Aug/21-Aug 21-Aug/28-Aug
FI
RFGB 4.10 27-Aug-10 & RFGB 3.80 01-Sep-10 0.5
2/5Y - - 1.5
1.2
Tot 0.5 6/8Y - 0.0 - 0.6
10Y - - - 0.7
15/30Y - - - 0.2
Total - 0.0 1.5 2.8
Redemptions are inserted in the indicated weeks as if they were paid three days in advance with respect to the actual date at which the bond is redeemed. This is done to allow for the exact matching of redemption flows with the auction settlement date (T+3)
30 July 2010 Economics & FI/FX Research
Curves & Crosses
UniCredit Research page 21 See last pages for disclaimer.
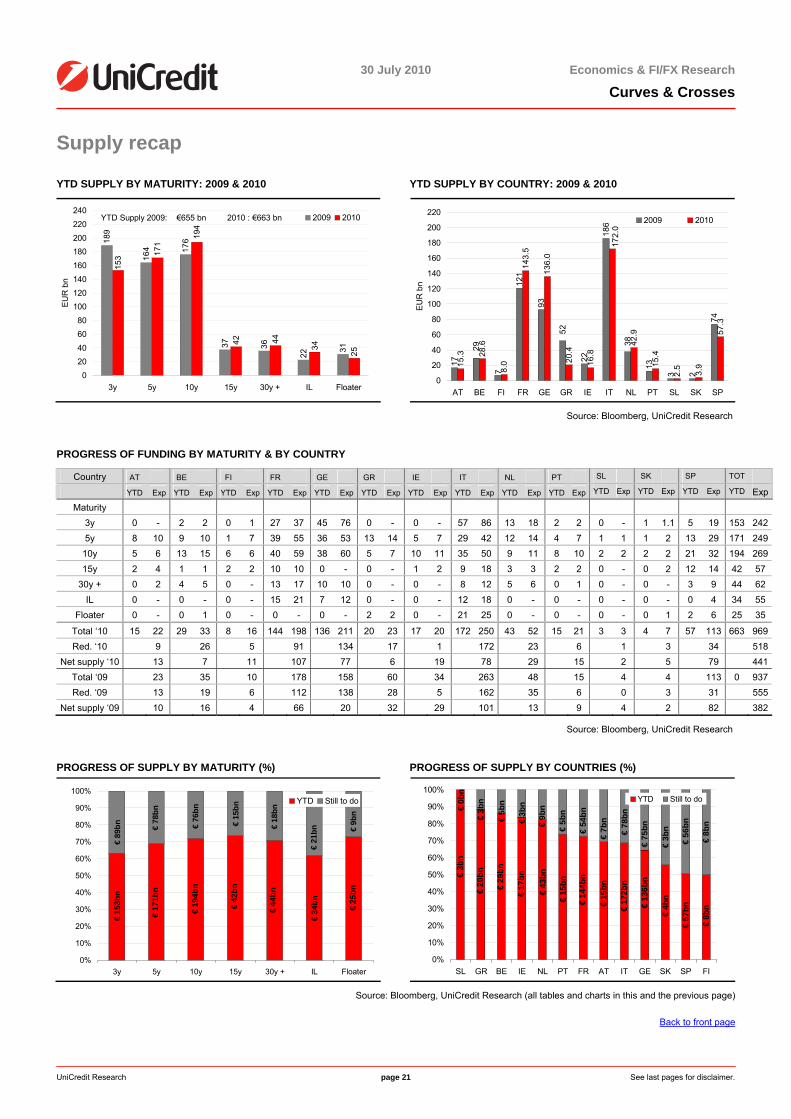
Supply recap
YTD SUPPLY BY MATURITY: 2009 & 2010 YTD SUPPLY BY COUNTRY: 2009 & 2010
189
164 17
6
37 36
22
31
171
42 44
34
25
153
194
02040
6080
100120140
160
180200
220
240
3y 5y 10y 15y 30y + IL Floater
EUR
bn
2009 2010YTD Supply 2009: €655 bn 2010 : €663 bn
17
121
93
22
186
13
3 2
74
15.3 28
.6
8.0
143.
5
136.
0
20.4
16.8
42.9
15.4
2.5
3.9
57.3
7
3829
52
172.
0
0
20
40
60
80
100
120
140
160
180
200
220
AT BE FI FR GE GR IE IT NL PT SL SK SP
EUR
bn
2009 2010
Source: Bloomberg, UniCredit Research
PROGRESS OF FUNDING BY MATURITY & BY COUNTRY
Country AT BE FI FR GE GR IE IT NL PT SL SK SP TOT YTD Exp YTD Exp YTD Exp YTD Exp YTD Exp YTD Exp YTD Exp YTD Exp YTD Exp YTD Exp YTD Exp YTD Exp YTD Exp YTD Exp
Maturity 3y 0 - 2 2 0 1 27 37 45 76 0 - 0 - 57 86 13 18 2 2 0 - 1 1.1 5 19 153 2425y 8 10 9 10 1 7 39 55 36 53 13 14 5 7 29 42 12 14 4 7 1 1 1 2 13 29 171 249
10y 5 6 13 15 6 6 40 59 38 60 5 7 10 11 35 50 9 11 8 10 2 2 2 2 21 32 194 26915y 2 4 1 1 2 2 10 10 0 - 0 - 1 2 9 18 3 3 2 2 0 - 0 2 12 14 42 57
30y + 0 2 4 5 0 - 13 17 10 10 0 - 0 - 8 12 5 6 0 1 0 - 0 - 3 9 44 62 IL 0 - 0 - 0 - 15 21 7 12 0 - 0 - 12 18 0 - 0 - 0 - 0 - 0 4 34 55
Floater 0 - 0 1 0 - 0 - 0 - 2 2 0 - 21 25 0 - 0 - 0 - 0 1 2 6 25 35
Total ‘10 15 22 29 33 8 16 144 198 136 211 20 23 17 20 172 250 43 52 15 21 3 3 4 7 57 113 663 969Red. ‘10 9 26 5 91 134 17 1 172 23 6 1 3 34 518
Net supply ‘10 13 7 11 107 77 6 19 78 29 15 2 5 79 441Total ‘09 23 35 10 178 158 60 34 263 48 15 4 4 113 0 937Red. ‘09 13 19 6 112 138 28 5 162 35 6 0 3 31 555
Net supply ‘09 10 16 4 66 20 32 29 101 13 9 4 2 82 382
Source: Bloomberg, UniCredit Research
PROGRESS OF SUPPLY BY MATURITY (%) PROGRESS OF SUPPLY BY COUNTRIES (%)
€ 25
bn
€ 34
bn
€ 44
bn
€ 42
bn
€ 19
4bn
€ 17
1bn
€ 15
3bn
€ 1
8bn
€ 9
bn
€ 8
9bn
€ 7
8bn
€ 7
6bn
€ 1
5bn
€ 2
1bn
0%
10%
20%
30%
40%
50%
60%
70%
80%
90%
100%
3y 5y 10y 15y 30y + IL Floater
YTD Still to do
€ 5
7bn
€ 8
bn
€ 56
bn
€ 8b
n
€ 1
72bn
€ 1
5bn
€ 1
44bn
€ 1
5bn
€ 4
3bn
€ 1
7bn
€ 2
9bn
€ 3
bn
€ 1
36bn
€ 2
0bn
€ 4
bn
€ 78
bn
€ 7b
n
€ 54
bn
€ 5b
n
€ 9b
n
€ 3b
n
€ 5b
n
€ 3b
n
€ 0b
n
€ 75
bn
€ 3b
n
0%
10%
20%
30%
40%
50%
60%
70%
80%
90%
100%
SL GR BE IE NL PT FR AT IT GE SK SP FI
YTD Still to do
Source: Bloomberg, UniCredit Research (all tables and charts in this and the previous page)
Back to front page
30 July 2010 Economics & FI/FX Research
Curves & Crosses
UniCredit Research page 22 See last pages for disclaimer.
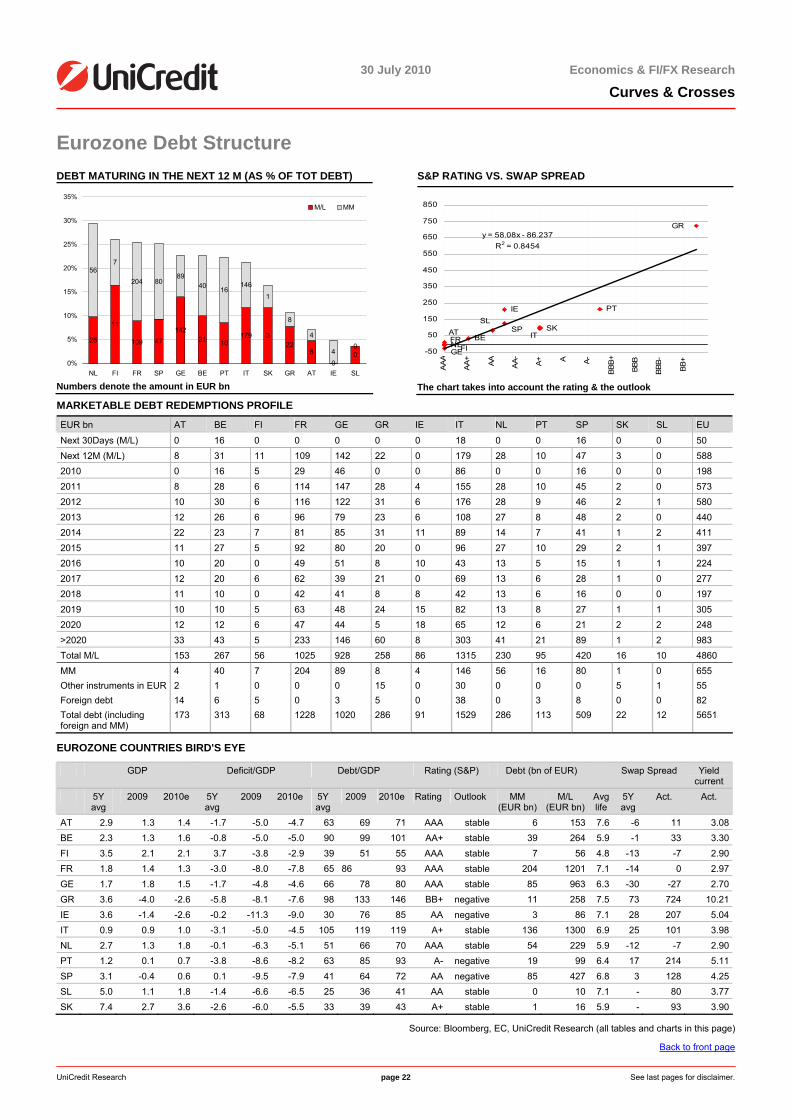
Eurozone Debt Structure DEBT MATURING IN THE NEXT 12 M (AS % OF TOT DEBT)
28
11
109 47142
31 10179 3
228
00
567
204 8089
40 16146
1
8
4
40
0%
5%
10%
15%
20%
25%
30%
35%
NL FI FR SP GE BE PT IT SK GR AT IE SL
M/L MM
Numbers denote the amount in EUR bn
S&P RATING VS. SWAP SPREAD
GR
IE
IT
GE
PT
SPBE
NLFR
FI
ATSL
SK
BB+
AAA
AA+ AA AA- A+ A A-
BBB
+
BBB
BBB
-
y = 58.08x - 86.237R2 = 0.8454
-50
50
150
250
350
450
550
650
750
850
The chart takes into account the rating & the outlook
MARKETABLE DEBT REDEMPTIONS PROFILE
EUR bn AT BE FI FR GE GR IE IT NL PT SP SK SL EU
Next 30Days (M/L) 0 16 0 0 0 0 0 18 0 0 16 0 0 50 Next 12M (M/L) 8 31 11 109 142 22 0 179 28 10 47 3 0 588 2010 0 16 5 29 46 0 0 86 0 0 16 0 0 198 2011 8 28 6 114 147 28 4 155 28 10 45 2 0 573 2012 10 30 6 116 122 31 6 176 28 9 46 2 1 580 2013 12 26 6 96 79 23 6 108 27 8 48 2 0 440 2014 22 23 7 81 85 31 11 89 14 7 41 1 2 411 2015 11 27 5 92 80 20 0 96 27 10 29 2 1 397 2016 10 20 0 49 51 8 10 43 13 5 15 1 1 224 2017 12 20 6 62 39 21 0 69 13 6 28 1 0 277 2018 11 10 0 42 41 8 8 42 13 6 16 0 0 197 2019 10 10 5 63 48 24 15 82 13 8 27 1 1 305 2020 12 12 6 47 44 5 18 65 12 6 21 2 2 248 >2020 33 43 5 233 146 60 8 303 41 21 89 1 2 983 Total M/L 153 267 56 1025 928 258 86 1315 230 95 420 16 10 4860 MM 4 40 7 204 89 8 4 146 56 16 80 1 0 655 Other instruments in EUR 2 1 0 0 0 15 0 30 0 0 0 5 1 55 Foreign debt 14 6 5 0 3 5 0 38 0 3 8 0 0 82 Total debt (including foreign and MM)
173 313 68 1228 1020 286 91 1529 286 113 509 22 12 5651
EUROZONE COUNTRIES BIRD'S EYE
GDP Deficit/GDP Debt/GDP Rating (S&P) Debt (bn of EUR) Swap Spread Yield current
5Y avg
2009 2010e 5Y avg
2009 2010e 5Y avg
2009 2010e Rating Outlook MM (EUR bn)
M/L (EUR bn)
Avg life
5Y avg
Act. Act.
AT 2.9 1.3 1.4 -1.7 -5.0 -4.7 63 69 71 AAA stable 6 153 7.6 -6 11 3.08BE 2.3 1.3 1.6 -0.8 -5.0 -5.0 90 99 101 AA+ stable 39 264 5.9 -1 33 3.30FI 3.5 2.1 2.1 3.7 -3.8 -2.9 39 51 55 AAA stable 7 56 4.8 -13 -7 2.90FR 1.8 1.4 1.3 -3.0 -8.0 -7.8 65 86 93 AAA stable 204 1201 7.1 -14 0 2.97GE 1.7 1.8 1.5 -1.7 -4.8 -4.6 66 78 80 AAA stable 85 963 6.3 -30 -27 2.70GR 3.6 -4.0 -2.6 -5.8 -8.1 -7.6 98 133 146 BB+ negative 11 258 7.5 73 724 10.21IE 3.6 -1.4 -2.6 -0.2 -11.3 -9.0 30 76 85 AA negative 3 86 7.1 28 207 5.04IT 0.9 0.9 1.0 -3.1 -5.0 -4.5 105 119 119 A+ stable 136 1300 6.9 25 101 3.98NL 2.7 1.3 1.8 -0.1 -6.3 -5.1 51 66 70 AAA stable 54 229 5.9 -12 -7 2.90PT 1.2 0.1 0.7 -3.8 -8.6 -8.2 63 85 93 A- negative 19 99 6.4 17 214 5.11SP 3.1 -0.4 0.6 0.1 -9.5 -7.9 41 64 72 AA negative 85 427 6.8 3 128 4.25SL 5.0 1.1 1.8 -1.4 -6.6 -6.5 25 36 41 AA stable 0 10 7.1 - 80 3.77SK 7.4 2.7 3.6 -2.6 -6.0 -5.5 33 39 43 A+ stable 1 16 5.9 - 93 3.90
Source: Bloomberg, EC, UniCredit Research (all tables and charts in this page)
Back to front page
30 July 2010 Economics & FI/FX Research
Curves & Crosses
UniCredit Research page 23 See last pages for disclaimer.
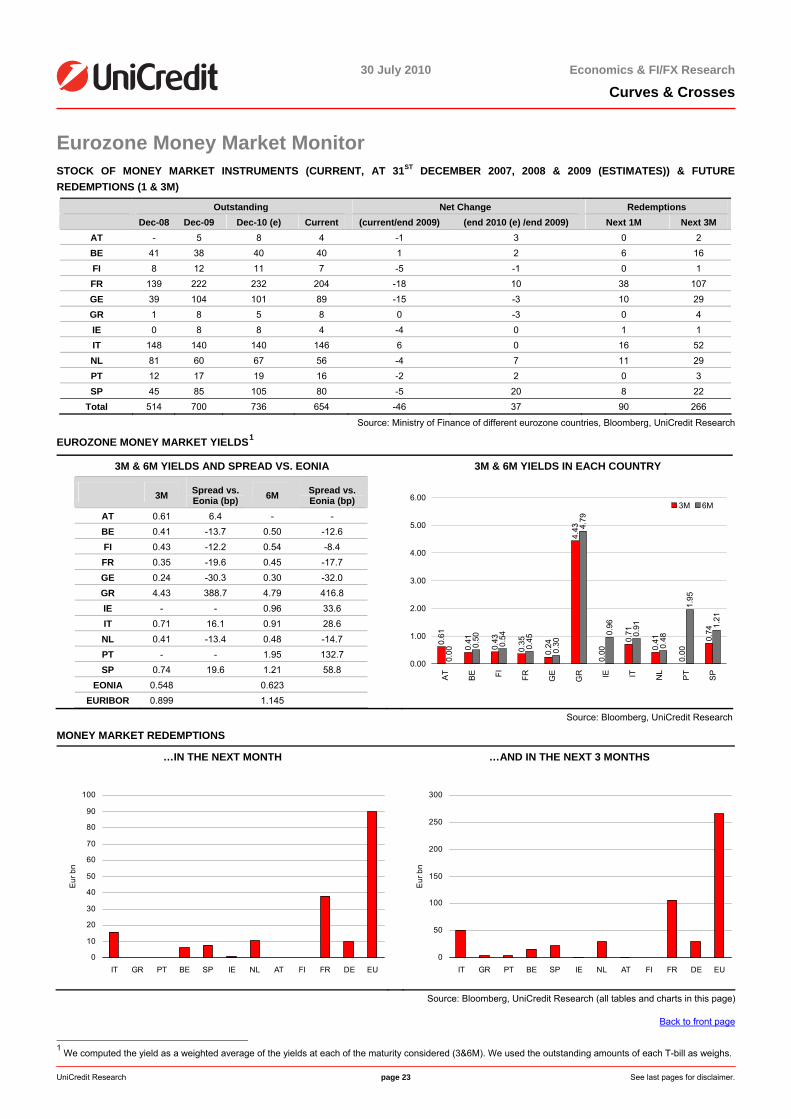
Eurozone Money Market Monitor STOCK OF MONEY MARKET INSTRUMENTS (CURRENT, AT 31ST DECEMBER 2007, 2008 & 2009 (ESTIMATES)) & FUTURE REDEMPTIONS (1 & 3M)
Outstanding Net Change Redemptions Dec-08 Dec-09 Dec-10 (e) Current (current/end 2009) (end 2010 (e) /end 2009) Next 1M Next 3M
AT - 5 8 4 -1 3 0 2 BE 41 38 40 40 1 2 6 16 FI 8 12 11 7 -5 -1 0 1 FR 139 222 232 204 -18 10 38 107 GE 39 104 101 89 -15 -3 10 29 GR 1 8 5 8 0 -3 0 4 IE 0 8 8 4 -4 0 1 1 IT 148 140 140 146 6 0 16 52 NL 81 60 67 56 -4 7 11 29 PT 12 17 19 16 -2 2 0 3 SP 45 85 105 80 -5 20 8 22
Total 514 700 736 654 -46 37 90 266
Source: Ministry of Finance of different eurozone countries, Bloomberg, UniCredit Research
EUROZONE MONEY MARKET YIELDS1
3M & 6M YIELDS AND SPREAD VS. EONIA 3M & 6M YIELDS IN EACH COUNTRY
3M Spread vs. Eonia (bp) 6M Spread vs.
Eonia (bp) AT 0.61 6.4 - - BE 0.41 -13.7 0.50 -12.6 FI 0.43 -12.2 0.54 -8.4 FR 0.35 -19.6 0.45 -17.7 GE 0.24 -30.3 0.30 -32.0 GR 4.43 388.7 4.79 416.8 IE - - 0.96 33.6 IT 0.71 16.1 0.91 28.6 NL 0.41 -13.4 0.48 -14.7 PT - - 1.95 132.7 SP 0.74 19.6 1.21 58.8
EONIA 0.548 0.623 EURIBOR 0.899 1.145
0.61
0.35
0.24
4.43
0.00
0.71
0.41
0.00
0.74
0.00
0.50
0.54
0.45
0.30
4.79
0.96
0.91
0.48
1.95
1.21
0.41
0.43
0.00
1.00
2.00
3.00
4.00
5.00
6.00
AT
BE FI FR GE
GR IE IT NL
PT
SP
3M 6M
Source: Bloomberg, UniCredit Research
MONEY MARKET REDEMPTIONS
…IN THE NEXT MONTH …AND IN THE NEXT 3 MONTHS
0
10
20
30
40
50
60
70
80
90
100
IT GR PT BE SP IE NL AT FI FR DE EU
Eur
bn
0
50
100
150
200
250
300
IT GR PT BE SP IE NL AT FI FR DE EU
Eur
bn
Source: Bloomberg, UniCredit Research (all tables and charts in this page)
Back to front page
1 We computed the yield as a weighted average of the yields at each of the maturity considered (3&6M). We used the outstanding amounts of each T-bill as weighs.
30 July 2010 Economics & FI/FX Research
Curves & Crosses
UniCredit Research page 24 See last pages for disclaimer.
FX Strategizer Euro to face obstacles
Armin Mekelburg (UniCredit Bank) +49 89 378-14307 [email protected] Roberto Mialich (UniCredit Bank Milan) +39 02 8862-0658 [email protected]
EXPECTED TRENDS
Next Week
Next Month
Cross EUR-USD USD-JPY USD-CHF GBP-USD EUR-JPY EUR-CHF EUR-GBP AUD-USD NZD-USD USD-CAD EUR-SEK EUR-NOK
View: Basically, it is almost never foreseeable whether bad US economic data will harm the US dollar or whether the opposite will occur, as investors might fear a quick clouding of the global risk picture and global risk perspectives. Over the last couple of weeks investors faced an easy task: the US dollar took the full impact of all the bad news coming from the US, including Bernanke's testimony, poor consumer sentiment, weak durable goods orders and the Fed's Beige Book. The USD TWI declined steadily. The reason for this was that US data contrasted with data from other economies, the euro zone in particular, which delivered some very strong economic indicators. The positive indicators, contributed to a clearly improved global risk picture, which was reflected by stable stock markets, declining volas and a narrowing of credit spreads. While the USD, the JPY and the rapidly appreciated CHF booked heavy losses across the board, the AUD, NZD and of course the EUR performed brilliantly.
The euro proved to be a very strong currency and has been recovering remarkably from the EMU sovereign crisis over the last couple of weeks. However, we don’t think that the EMU growth potential will be strong, sustained and broad based enough to offset the outstanding budget crisis issues completely. While Germany in particular delivered some very strong figures and can currently be considered the European growth engine, most of the periphery countries are still lacking decisive growth impulses. This may be acknowledged by Mr. Trichet at next week's ECB press conference.
We also believe the initial driving force, triggered by the greatly improved stress test results, to fade over the coming weeks. In turn, investors may review their whole growth assessment, which may turn more towards global growth risks again, on the basis of fears concerning the US and Chinese economies . Corresponding assessments were recently stated by the CBs in Great Britain and New Zealand. Hence, we do not expect the current bright risk picture to improve further, but predict that investor could scale back the risk exposures to a certain extent. This is likely to provide the USD, JPY and CHF some relief and set AUD, NZD and EUR under pressure. The USD in particular may regain some ground as early as next week, following a better than expected US unemployment report. EUR-USD: As some very strong figures from Germany and other EMU core countries contrasted with the very disappointing US data, in addition to relief provided by the long-awaited stress test result, the EUR-USD performed remarkably strongly and has been able to establish a 1.30 basis.
CHARTS OF THE WEEK
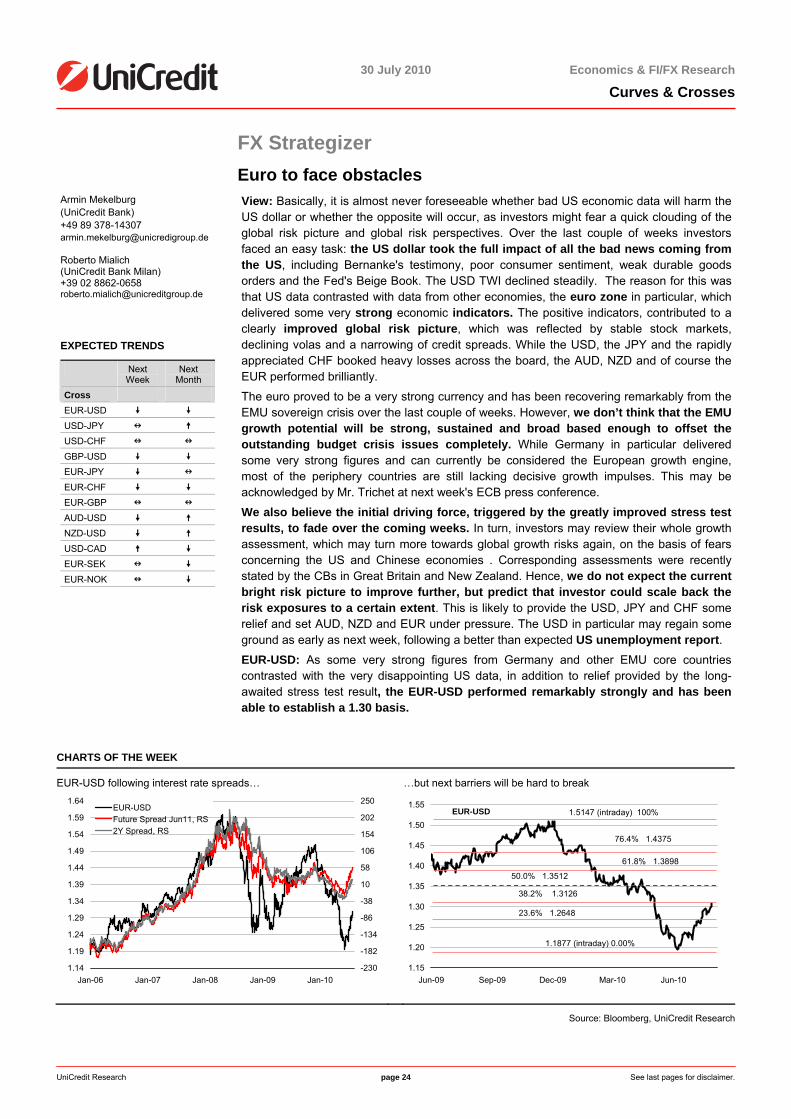
EUR-USD following interest rate spreads… …but next barriers will be hard to break
1.14
1.19
1.24
1.29
1.34
1.39
1.44
1.49
1.54
1.59
1.64
Jan-06 Jan-07 Jan-08 Jan-09 Jan-10-230
-182
-134
-86
-38
10
58
106
154
202
250EUR-USDFuture Spread Jun11, RS2Y Spread, RS
1.15
1.20
1.25
1.30
1.35
1.40
1.45
1.50
1.55
Jun-09 Sep-09 Dec-09 Mar-10 Jun-10
EUR-USD
1.1877 (intraday) 0.00%
38.2% 1.3126
61.8% 1.3898
1.5147 (intraday) 100%
50.0% 1.3512
23.6% 1.2648
76.4% 1.4375
Source: Bloomberg, UniCredit Research
30 July 2010 Economics & FI/FX Research
Curves & Crosses
UniCredit Research page 25 See last pages for disclaimer.
EUR: Interest rate spreads with an impact on EUR-USD. But the next technical resistance will be a real challenge for markets
Given the differing economic performance levels of the US and the euro zone, interest rates and money market futures spreads, an almost forgotten driving factor, came to the fore again. It was not the closing of the gap to implied rates of beyond 1.40, but simply the spreadwidening in the euro’s favor. However, as the spreads are already almost exhausted, the upward momentum in EUR-USD should fade strongly, as the next key resistance level of1.3125 is too significant to be simply passed through (see charts previous page).
JPY: EUR-JPY weaker and USD-JPY unchanged
Based on the recently improved market sentiment, the JPY should trade significantly weaker, primarily against the EUR. However, as long as we continue to receive weak US data, the latent downward pressure on the USD-JPY will limit the EUR-JPY's upside potential.Adding the almost exhausted correction potential of the EUR in general, EUR-JPY would even be hard pushed above beyond 115, while the USD-JPY should remain in the 86/88 band.
As expected, EUR-CHF upside proved fairly capped above 1.38, although EUR-USD took advantage from the latest economic data, hinting that the eurozone is apparently “decoupling” from the US. Yet, the EUR-CHF retreat back below 1.36 has been also fostered by talk that the SNB may sell some of its EUR holdings and by excessive speculation about a SNB rate hike after the summer. This reaction was also amplified by incorrect liquidity signals in the Swiss money market rather than any incumbent inflation menace. Any SNB move is unlikely to take place before 1Q11. The CHF may return further on bid in Autumn, when a broad debate of the 2011-2012 budgets across the eurozone may reignite EMU woes and a new demand for safe-haven assets. With USD-CHF also being exposed to a new slide towards parity once 1.04 has gone, a full break below 1.36 may spark a new EUR-CHF sell-off.
GBP: “…and she’s buying a stairway to heaven”
After the UK GDP for 2Q10 revealed a stunning 1.0% qoq growth, sterling was even better positioned for a sustained rally. Hence, cable continued to outperform the other major exchange rates, taking clear advantage of the weaker USD which made breaking through 1.55 easier. This paved then the way for the new target of 1.57. The MPC testimony beforeHM Treasury was basically ignored. Most BoE’s members sound cautious about UK growth,inflation and monetary policy prospects and while next week’s BoE meeting should be a non event, the bank is likely to be prudent in its new Inflation Report on August 11 too. Yet, with new UK data releases likely to be positive again, the pound’s ongoing strength should also continue next month: some profit taking can be expected after the current rally and thisis why we closed our long cable position, however, this would offer a new buying opportunityamid risks that our medium-term target for cable above 1.60 may be reached sooner than we initially predicted. On the other hand, EUR-GBP should reveal a more constrained dynamic: as long as the EUR-USD holds the line, a EUR-GBP break below 0.83 and towards 0.80 might require some time, but this medium-term target remains intact.
The three dollars (AUD, NZD & CAD): a more conservative tone to be expected in August
Commodity currencies are stuck between a rock and a hard place for now: on one hand, they have clearly benefited from a less adverse global risk picture and even more from theweaker USD; on the other hand, monetary policy at home appears less and less helpful:as feared, the RBNZ hiked rates by another 25bp to 3%, but Governor Bollard sounded muchmore cautious about the need for further intense monetary tightening, due to a less benignglobal economic picture that may hurt countries that are sensitive to the world economic cycle,like New Zealand. The RBA will not much differently: the OCR will remain steady at 4.50% on Tuesday and the bank will reaffirm its cautious stance on rates too. The upcoming general elections in Australia on August 21 should favor conservative trading too. Hence, the Aussie, the Kiwi and the loonie dollar should hold the line against the USD, but most of their recent upside potential is likely to remain frozen in August.
Nordics: Still struggling as breaking key levels will look harder
“It can’t shine forever”: a more pronounced appreciation of the two Nordic units appears quite ambitious at this stage. Due also to the firmer EUR-USD, the EUR-SEK and EUR-NOK failed to fall below 9.40 and 7.95 respectively, in turn sparking a pullback towards 9.50 andabove 8.00. Accordingly, both the SEK and the NOK are likely to struggle in the “land of nowhere” in the coming weeks too. The usual external factors (namely, equity markets and swings between risk aversion and risk appetite) should play greater roles here than domesticevents - the Norges Bank’s meeting on 11 August is the only local point of interest.
Back to front page
30 July 2010 Economics & FI/FX Research
Curves & Crosses
UniCredit Research page 26 See last pages for disclaimer.
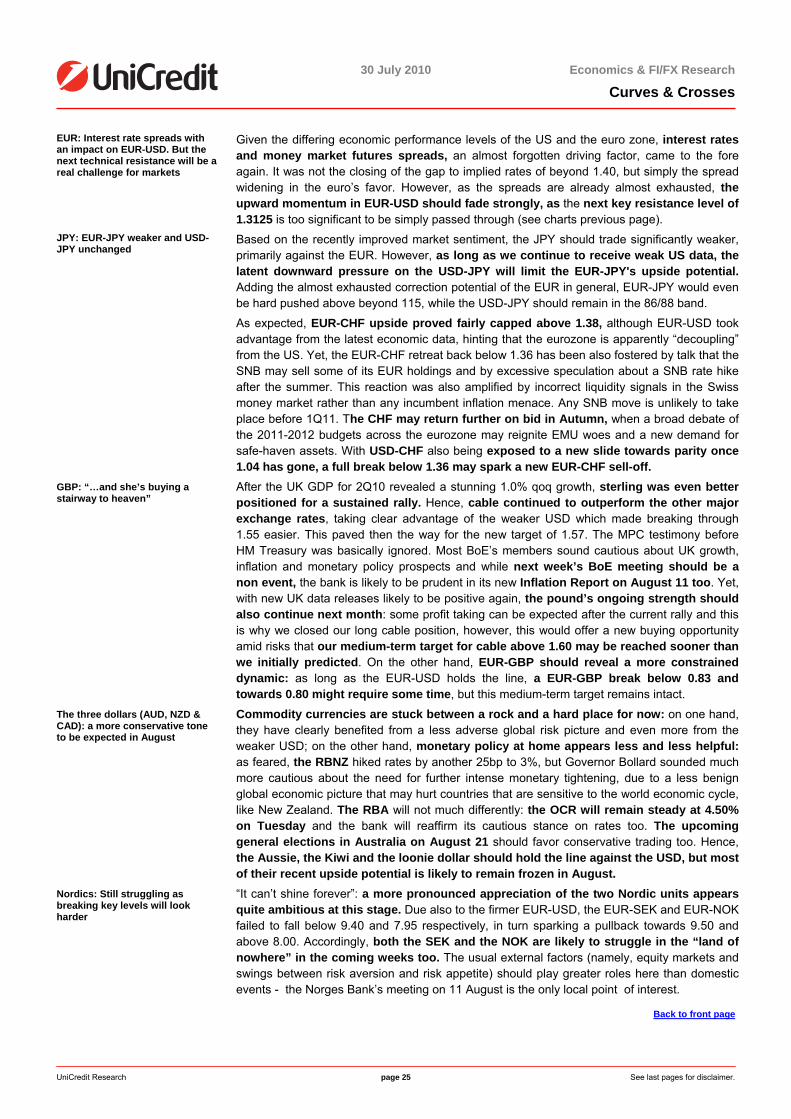
FX Monitor: G-10 Weekly Change Charts below show weekly changes among the G-10 currencies. In particular, positive percentage changes indicate a gain of the currency indicated in the title against the others, while negative percentage changes indicate a loss.
USD WEEKLY PERFORMANCE EUR WEEKLY PERFORMANCE
-0.94%-1.28%
-1.50%-1.31%
-0.23%
1.00%
-0.21%
-0.76%-1.00%
-3.0%
-2.0%
-1.0%
0.0%
1.0%
2.0%
3.0%
EUR JPY CHF GBP AUD NZD CAD SEK NOK
Weekly spot gains / losses of the USD vs. the other G-10 units
0.95%
-0.35%-0.61%
-0.41%
0.71%
1.95%
0.74%
0.17%
-0.07%
-3.0%
-2.0%
-1.0%
0.0%
1.0%
2.0%
3.0%
USD JPY CHF GBP AUD NZD CAD SEK NOK
Weekly spot gains / losses of the EUR vs. the other G-10 units
JPY WEEKLY PERFORMANCE CHF WEEKLY PERFORMANCE
1.29%
0.36%
-0.01%
1.09%
0.29%
-0.20%
1.07%
0.54%
2.29%
-3.0%
-2.0%
-1.0%
0.0%
1.0%
2.0%
3.0%
USD EUR CHF GBP AUD NZD CAD SEK NOK
Weekly spot gains / losses of the JPY vs. the other G-10 units
1.52%
0.57%
0.22% 0.18%
1.30%
0.72%0.50%
1.27%
2.52%
-3.0%
-2.0%
-1.0%
0.0%
1.0%
2.0%
3.0%
USD EUR JPY GBP AUD NZD CAD SEK NOK
Weekly spot gains / losses of the CHF vs. the other G-10 units
GBP WEEKLY PERFORMANCE NORDICS WEEKLY PERFORMANCE
1.34%
0.39%
-0.23%
1.12%
0.57%0.33%
2.35%
0.08%
1.08%
-3.0%
-2.0%
-1.0%
0.0%
1.0%
2.0%
3.0%
USD EUR JPY CHF AUD NZD CAD SEK NOK
Weekly spot gains / losses of the GBP vs. the others G.10 units
0.77%
-0.19%
-0.74%-0.56%
1.75%
0.56%
-0.25%
1.05%
0.08%
-0.34%-0.50% -0.38%
0.77%
2.02%
0.78%
0.25%
-0.50%
0.52%
-3.0%
-2.0%
-1.0%
0.0%
1.0%
2.0%
3.0%
USD EUR JPY CHF GBP AUD NZD CAD NOK
Weekly spot gains / losses of the SEK vs. the other G-10 units
Weekly spot gains / losses of the NOK vs. the other G-10 units
Update: July 30, 2010, 09.30 CET Source: Bloomberg, UniCredit Research (all charts in this page)
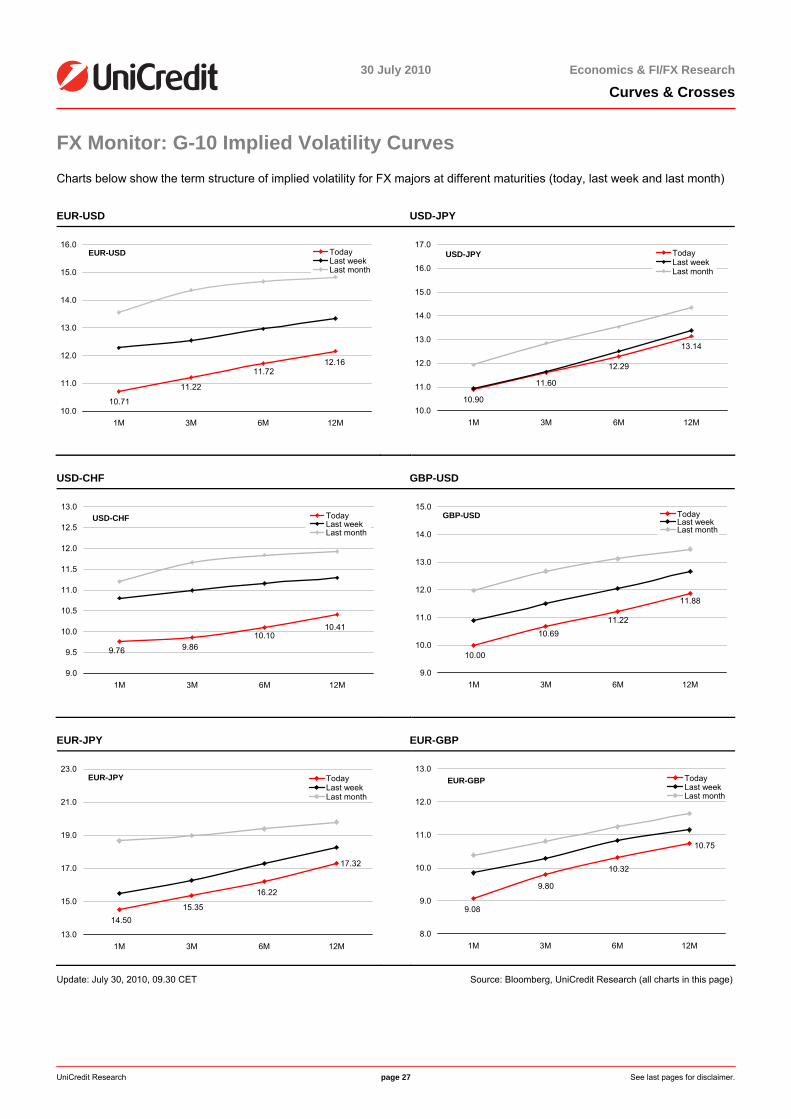
30 July 2010 Economics & FI/FX Research
Curves & Crosses
UniCredit Research page 27 See last pages for disclaimer.
FX Monitor: G-10 Implied Volatility Curves Charts below show the term structure of implied volatility for FX majors at different maturities (today, last week and last month)
EUR-USD USD-JPY
11.22
12.1611.72
10.7110.0
11.0
12.0
13.0
14.0
15.0
16.0
1M 3M 6M 12M
TodayLast weekLast month
EUR-USD
10.90
11.60
12.29
13.14
10.0
11.0
12.0
13.0
14.0
15.0
16.0
17.0
1M 3M 6M 12M
TodayLast weekLast month
USD-JPY
USD-CHF GBP-USD
10.1010.41
9.869.76
9.0
9.5
10.0
10.5
11.0
11.5
12.0
12.5
13.0
1M 3M 6M 12M
TodayLast weekLast month
USD-CHF
10.69
11.88
10.00
11.22
9.0
10.0
11.0
12.0
13.0
14.0
15.0
1M 3M 6M 12M
TodayLast weekLast month
GBP-USD
EUR-JPY EUR-GBP
16.22
14.50
17.32
15.35
13.0
15.0
17.0
19.0
21.0
23.0
1M 3M 6M 12M
TodayLast weekLast month
EUR-JPY
10.75
9.08
10.32
9.80
8.0
9.0
10.0
11.0
12.0
13.0
1M 3M 6M 12M
TodayLast weekLast month
EUR-GBP
Update: July 30, 2010, 09.30 CET Source: Bloomberg, UniCredit Research (all charts in this page)
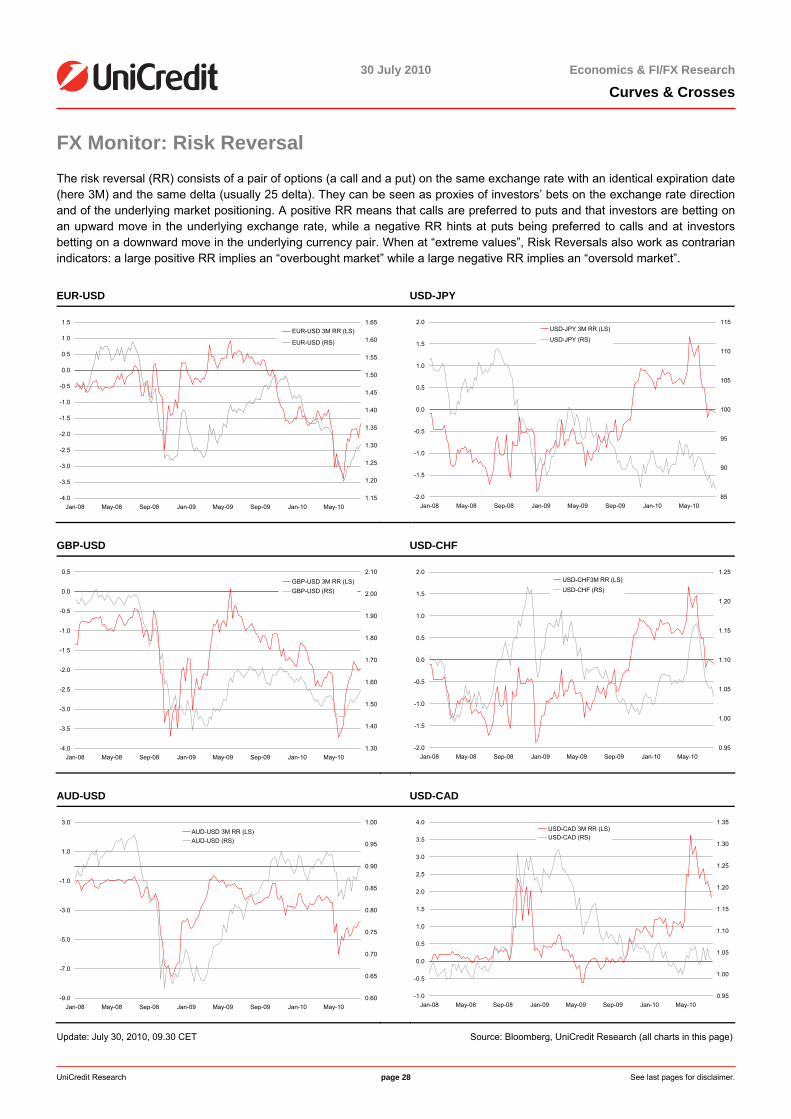
30 July 2010 Economics & FI/FX Research
Curves & Crosses
UniCredit Research page 28 See last pages for disclaimer.
FX Monitor: Risk Reversal The risk reversal (RR) consists of a pair of options (a call and a put) on the same exchange rate with an identical expiration date (here 3M) and the same delta (usually 25 delta). They can be seen as proxies of investors’ bets on the exchange rate direction and of the underlying market positioning. A positive RR means that calls are preferred to puts and that investors are betting on an upward move in the underlying exchange rate, while a negative RR hints at puts being preferred to calls and at investors betting on a downward move in the underlying currency pair. When at “extreme values”, Risk Reversals also work as contrarian indicators: a large positive RR implies an “overbought market” while a large negative RR implies an “oversold market”.
EUR-USD USD-JPY
-4.0
-3.5
-3.0
-2.5
-2.0
-1.5
-1.0
-0.5
0.0
0.5
1.0
1.5
Jan-08 May-08 Sep-08 Jan-09 May-09 Sep-09 Jan-10 May-101.15
1.20
1.25
1.30
1.35
1.40
1.45
1.50
1.55
1.60
1.65EUR-USD 3M RR (LS)
EUR-USD (RS)
-2.0
-1.5
-1.0
-0.5
0.0
0.5
1.0
1.5
2.0
Jan-08 May-08 Sep-08 Jan-09 May-09 Sep-09 Jan-10 May-1085
90
95
100
105
110
115USD-JPY 3M RR (LS)
USD-JPY (RS)
GBP-USD USD-CHF
-4.0
-3.5
-3.0
-2.5
-2.0
-1.5
-1.0
-0.5
0.0
0.5
Jan-08 May-08 Sep-08 Jan-09 May-09 Sep-09 Jan-10 May-101.30
1.40
1.50
1.60
1.70
1.80
1.90
2.00
2.10GBP-USD 3M RR (LS)GBP-USD (RS)
-2.0
-1.5
-1.0
-0.5
0.0
0.5
1.0
1.5
2.0
Jan-08 May-08 Sep-08 Jan-09 May-09 Sep-09 Jan-10 May-100.95
1.00
1.05
1.10
1.15
1.20
1.25USD-CHF3M RR (LS)USD-CHF (RS)
AUD-USD USD-CAD
-9.0
-7.0
-5.0
-3.0
-1.0
1.0
3.0
Jan-08 May-08 Sep-08 Jan-09 May-09 Sep-09 Jan-10 May-100.60
0.65
0.70
0.75
0.80
0.85
0.90
0.95
1.00AUD-USD 3M RR (LS)AUD-USD (RS)
-1.0
-0.5
0.0
0.5
1.0
1.5
2.0
2.5
3.0
3.5
4.0
Jan-08 May-08 Sep-08 Jan-09 May-09 Sep-09 Jan-10 May-100.95
1.00
1.05
1.10
1.15
1.20
1.25
1.30
1.35USD-CAD 3M RR (LS)USD-CAD (RS)
Update: July 30, 2010, 09.30 CET Source: Bloomberg, UniCredit Research (all charts in this page)
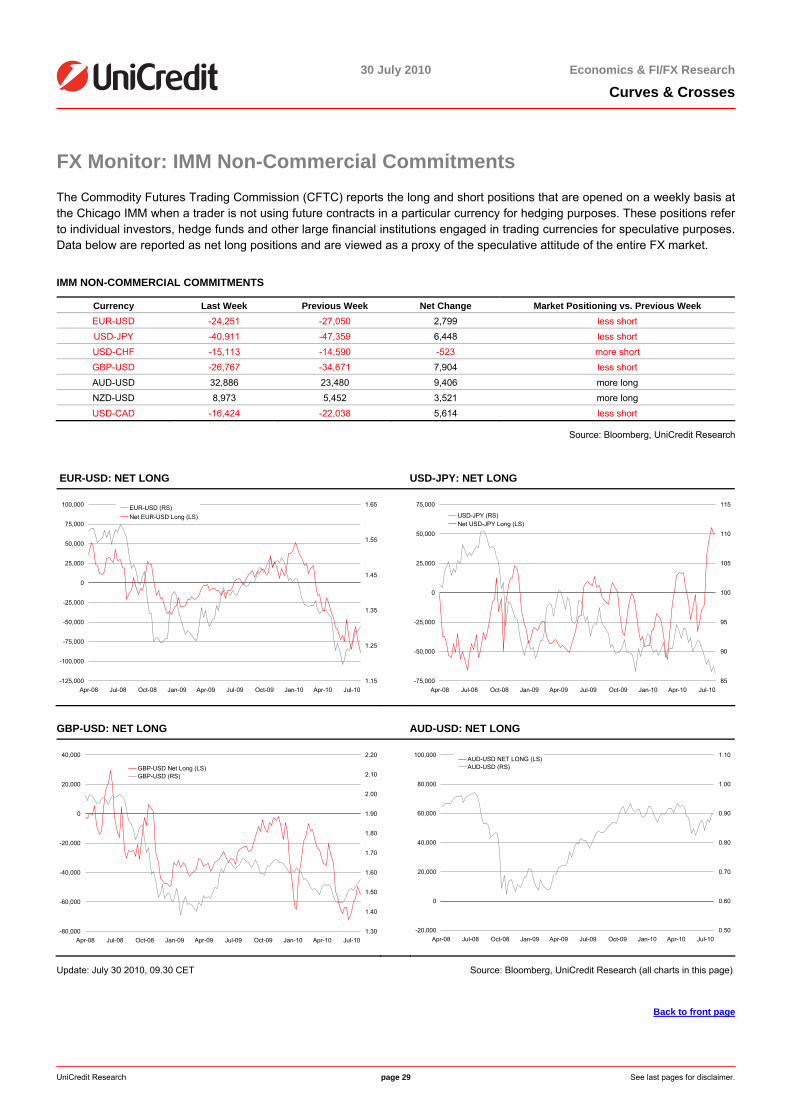
30 July 2010 Economics & FI/FX Research
Curves & Crosses
UniCredit Research page 29 See last pages for disclaimer.
FX Monitor: IMM Non-Commercial Commitments The Commodity Futures Trading Commission (CFTC) reports the long and short positions that are opened on a weekly basis at the Chicago IMM when a trader is not using future contracts in a particular currency for hedging purposes. These positions refer to individual investors, hedge funds and other large financial institutions engaged in trading currencies for speculative purposes. Data below are reported as net long positions and are viewed as a proxy of the speculative attitude of the entire FX market.
IMM NON-COMMERCIAL COMMITMENTS
Currency Last Week Previous Week Net Change Market Positioning vs. Previous Week EUR-USD -24,251 -27,050 2,799 less short USD-JPY -40,911 -47,359 6,448 less short USD-CHF -15,113 -14,590 -523 more short GBP-USD -26,767 -34,671 7,904 less short AUD-USD 32,886 23,480 9,406 more long NZD-USD 8,973 5,452 3,521 more long USD-CAD -16,424 -22,038 5,614 less short
Source: Bloomberg, UniCredit Research
EUR-USD: NET LONG USD-JPY: NET LONG
-125,000
-100,000
-75,000
-50,000
-25,000
0
25,000
50,000
75,000
100,000
Apr-08 Jul-08 Oct-08 Jan-09 Apr-09 Jul-09 Oct-09 Jan-10 Apr-10 Jul-101.15
1.25
1.35
1.45
1.55
1.65EUR-USD (RS)Net EUR-USD Long (LS)
-75,000
-50,000
-25,000
0
25,000
50,000
75,000
Apr-08 Jul-08 Oct-08 Jan-09 Apr-09 Jul-09 Oct-09 Jan-10 Apr-10 Jul-1085
90
95
100
105
110
115
USD-JPY (RS)Net USD-JPY Long (LS)
GBP-USD: NET LONG AUD-USD: NET LONG
-80,000
-60,000
-40,000
-20,000
0
20,000
40,000
Apr-08 Jul-08 Oct-08 Jan-09 Apr-09 Jul-09 Oct-09 Jan-10 Apr-10 Jul-101.30
1.40
1.50
1.60
1.70
1.80
1.90
2.00
2.10
2.20
GBP-USD Net Long (LS)GBP-USD (RS)
-20,000
0
20,000
40,000
60,000
80,000
100,000
Apr-08 Jul-08 Oct-08 Jan-09 Apr-09 Jul-09 Oct-09 Jan-10 Apr-10 Jul-100.50
0.60
0.70
0.80
0.90
1.00
1.10AUD-USD NET LONG (LS)AUD-USD (RS)
Update: July 30 2010, 09.30 CET Source: Bloomberg, UniCredit Research (all charts in this page)
Back to front page
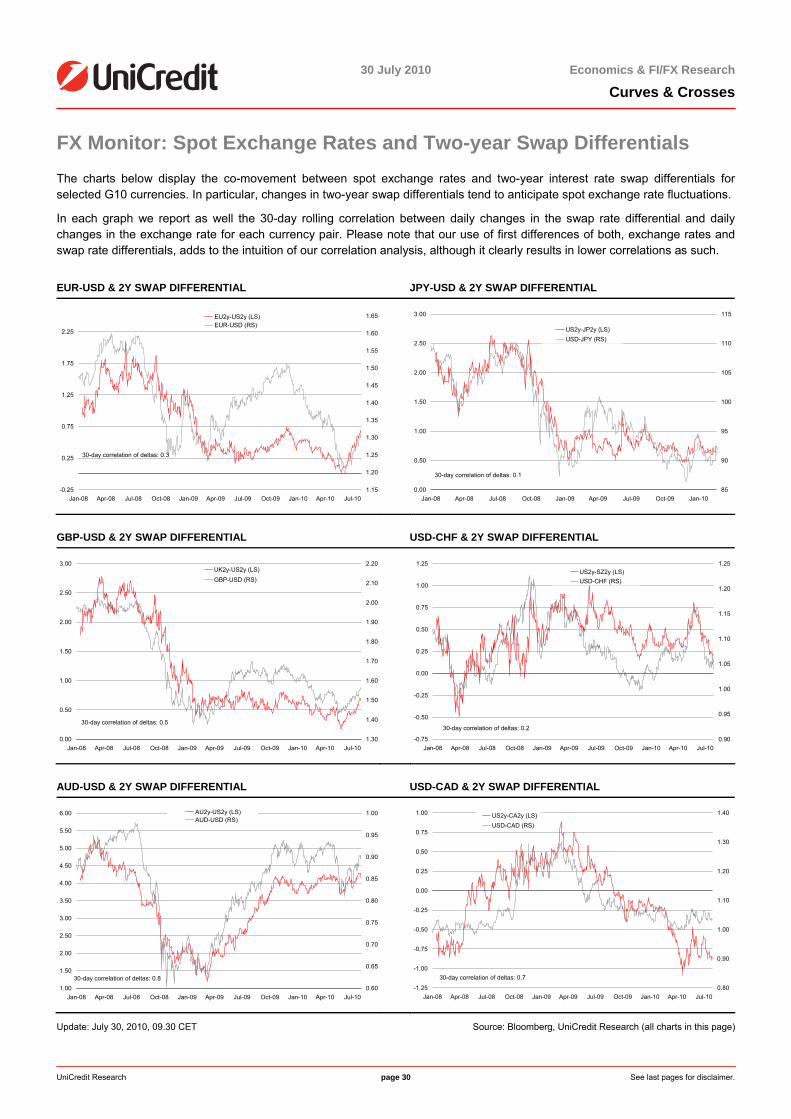
30 July 2010 Economics & FI/FX Research
Curves & Crosses
UniCredit Research page 30 See last pages for disclaimer.
FX Monitor: Spot Exchange Rates and Two-year Swap Differentials The charts below display the co-movement between spot exchange rates and two-year interest rate swap differentials for selected G10 currencies. In particular, changes in two-year swap differentials tend to anticipate spot exchange rate fluctuations.
In each graph we report as well the 30-day rolling correlation between daily changes in the swap rate differential and daily changes in the exchange rate for each currency pair. Please note that our use of first differences of both, exchange rates and swap rate differentials, adds to the intuition of our correlation analysis, although it clearly results in lower correlations as such.
EUR-USD & 2Y SWAP DIFFERENTIAL JPY-USD & 2Y SWAP DIFFERENTIAL
-0.25
0.25
0.75
1.25
1.75
2.25
Jan-08 Apr-08 Jul-08 Oct-08 Jan-09 Apr-09 Jul-09 Oct-09 Jan-10 Apr-10 Jul-101.15
1.20
1.25
1.30
1.35
1.40
1.45
1.50
1.55
1.60
1.65EU2y-US2y (LS)EUR-USD (RS)
30-day correlation of deltas: 0.3
0.00
0.50
1.00
1.50
2.00
2.50
3.00
Jan-08 Apr-08 Jul-08 Oct-08 Jan-09 Apr-09 Jul-09 Oct-09 Jan-1085
90
95
100
105
110
115
US2y-JP2y (LS)USD-JPY (RS)
30-day correlation of deltas: 0.1
GBP-USD & 2Y SWAP DIFFERENTIAL USD-CHF & 2Y SWAP DIFFERENTIAL
0.00
0.50
1.00
1.50
2.00
2.50
3.00
Jan-08 Apr-08 Jul-08 Oct-08 Jan-09 Apr-09 Jul-09 Oct-09 Jan-10 Apr-10 Jul-101.30
1.40
1.50
1.60
1.70
1.80
1.90
2.00
2.10
2.20UK2y-US2y (LS)GBP-USD (RS)
30-day correlation of deltas: 0.5
-0.75
-0.50
-0.25
0.00
0.25
0.50
0.75
1.00
1.25
Jan-08 Apr-08 Jul-08 Oct-08 Jan-09 Apr-09 Jul-09 Oct-09 Jan-10 Apr-10 Jul-100.90
0.95
1.00
1.05
1.10
1.15
1.20
1.25US2y-SZ2y (LS)USD-CHF (RS)
30-day correlation of deltas: 0.2
AUD-USD & 2Y SWAP DIFFERENTIAL USD-CAD & 2Y SWAP DIFFERENTIAL
1.00
1.50
2.00
2.50
3.00
3.50
4.00
4.50
5.00
5.50
6.00
Jan-08 Apr-08 Jul-08 Oct-08 Jan-09 Apr-09 Jul-09 Oct-09 Jan-10 Apr-10 Jul-100.60
0.65
0.70
0.75
0.80
0.85
0.90
0.95
1.00AU2y-US2y (LS)AUD-USD (RS)
30-day correlation of deltas: 0.8
-1.25
-1.00
-0.75
-0.50
-0.25
0.00
0.25
0.50
0.75
1.00
Jan-08 Apr-08 Jul-08 Oct-08 Jan-09 Apr-09 Jul-09 Oct-09 Jan-10 Apr-10 Jul-100.80
0.90
1.00
1.10
1.20
1.30
1.40US2y-CA2y (LS)USD-CAD (RS)
30-day correlation of deltas: 0.7
Update: July 30, 2010, 09.30 CET Source: Bloomberg, UniCredit Research (all charts in this page)
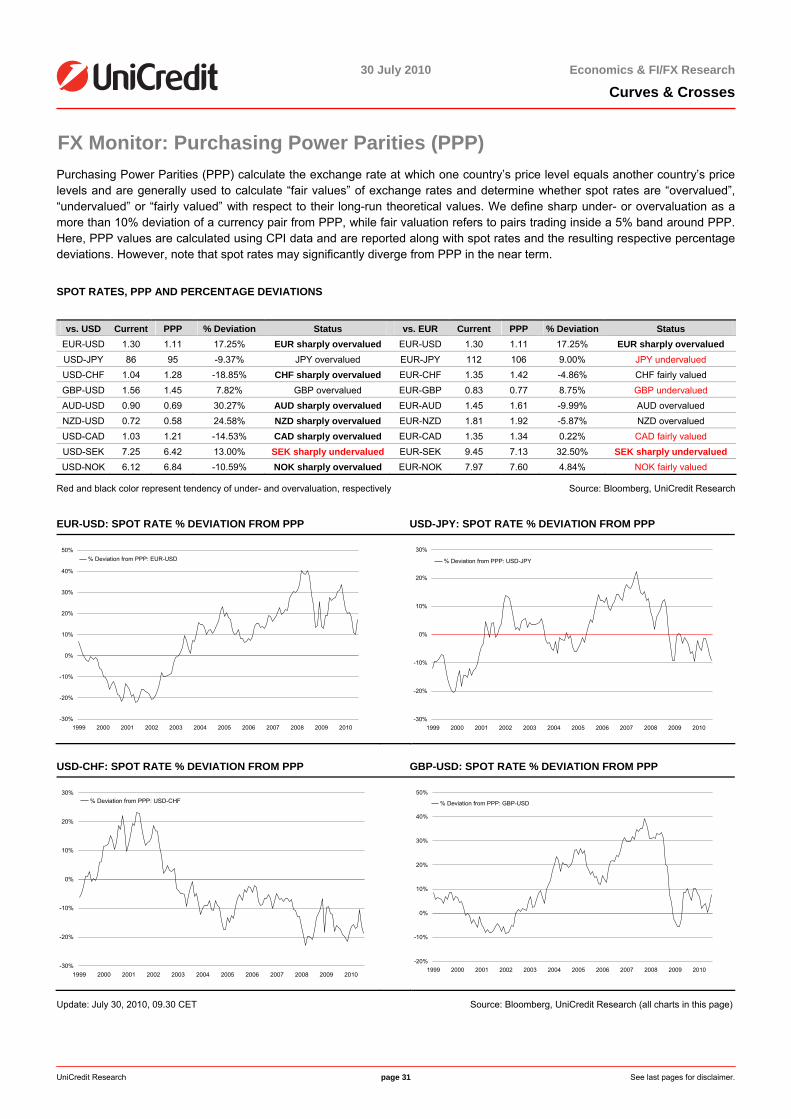
30 July 2010 Economics & FI/FX Research
Curves & Crosses
UniCredit Research page 31 See last pages for disclaimer.
FX Monitor: Purchasing Power Parities (PPP) Purchasing Power Parities (PPP) calculate the exchange rate at which one country’s price level equals another country’s price levels and are generally used to calculate “fair values” of exchange rates and determine whether spot rates are “overvalued”, “undervalued” or “fairly valued” with respect to their long-run theoretical values. We define sharp under- or overvaluation as a more than 10% deviation of a currency pair from PPP, while fair valuation refers to pairs trading inside a 5% band around PPP. Here, PPP values are calculated using CPI data and are reported along with spot rates and the resulting respective percentage deviations. However, note that spot rates may significantly diverge from PPP in the near term.
SPOT RATES, PPP AND PERCENTAGE DEVIATIONS
vs. USD Current PPP % Deviation Status vs. EUR Current PPP % Deviation Status
EUR-USD 1.30 1.11 17.25% EUR sharply overvalued EUR-USD 1.30 1.11 17.25% EUR sharply overvalued USD-JPY 86 95 -9.37% JPY overvalued EUR-JPY 112 106 9.00% JPY undervalued USD-CHF 1.04 1.28 -18.85% CHF sharply overvalued EUR-CHF 1.35 1.42 -4.86% CHF fairly valued GBP-USD 1.56 1.45 7.82% GBP overvalued EUR-GBP 0.83 0.77 8.75% GBP undervalued AUD-USD 0.90 0.69 30.27% AUD sharply overvalued EUR-AUD 1.45 1.61 -9.99% AUD overvalued NZD-USD 0.72 0.58 24.58% NZD sharply overvalued EUR-NZD 1.81 1.92 -5.87% NZD overvalued USD-CAD 1.03 1.21 -14.53% CAD sharply overvalued EUR-CAD 1.35 1.34 0.22% CAD fairly valued USD-SEK 7.25 6.42 13.00% SEK sharply undervalued EUR-SEK 9.45 7.13 32.50% SEK sharply undervalued USD-NOK 6.12 6.84 -10.59% NOK sharply overvalued EUR-NOK 7.97 7.60 4.84% NOK fairly valued
Red and black color represent tendency of under- and overvaluation, respectively Source: Bloomberg, UniCredit Research
EUR-USD: SPOT RATE % DEVIATION FROM PPP USD-JPY: SPOT RATE % DEVIATION FROM PPP
-30%
-20%
-10%
0%
10%
20%
30%
40%
50%
1999 2000 2001 2002 2003 2004 2005 2006 2007 2008 2009 2010
% Deviation from PPP: EUR-USD
-30%
-20%
-10%
0%
10%
20%
30%
1999 2000 2001 2002 2003 2004 2005 2006 2007 2008 2009 2010
% Deviation from PPP: USD-JPY
USD-CHF: SPOT RATE % DEVIATION FROM PPP GBP-USD: SPOT RATE % DEVIATION FROM PPP
-30%
-20%
-10%
0%
10%
20%
30%
1999 2000 2001 2002 2003 2004 2005 2006 2007 2008 2009 2010
% Deviation from PPP: USD-CHF
-20%
-10%
0%
10%
20%
30%
40%
50%
1999 2000 2001 2002 2003 2004 2005 2006 2007 2008 2009 2010
% Deviation from PPP: GBP-USD
Update: July 30, 2010, 09.30 CET Source: Bloomberg, UniCredit Research (all charts in this page)
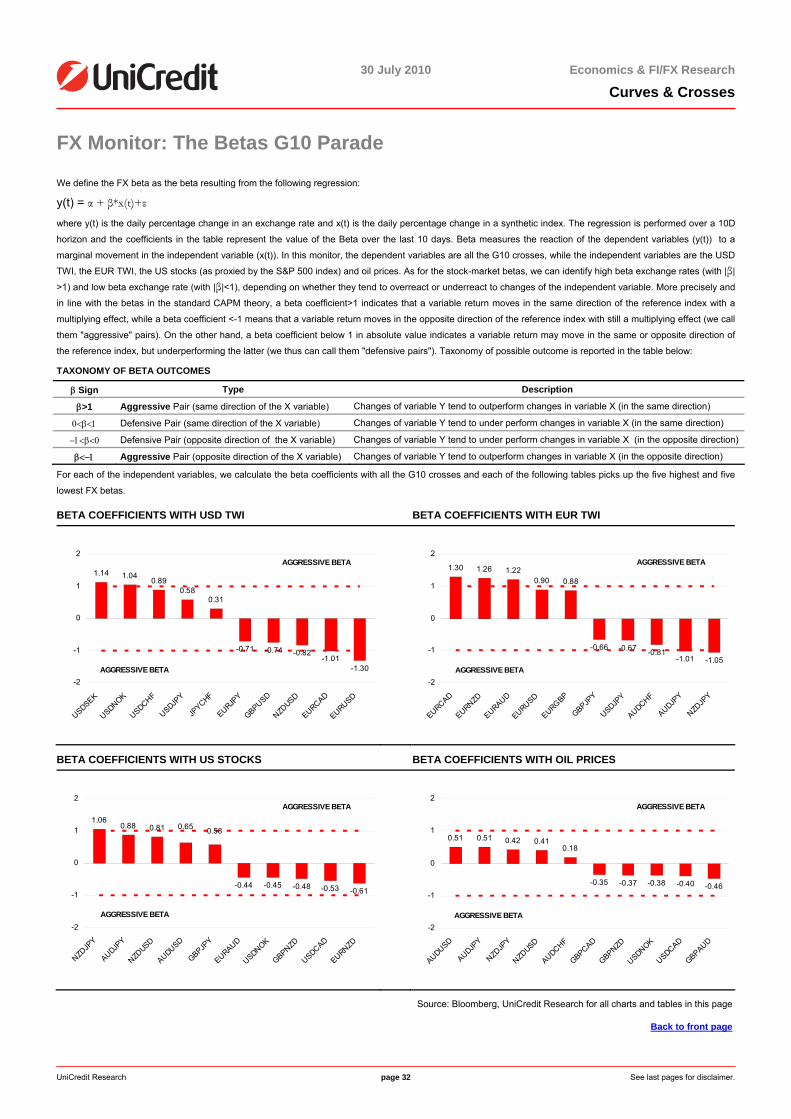
30 July 2010 Economics & FI/FX Research
Curves & Crosses
UniCredit Research page 32 See last pages for disclaimer.
FX Monitor: The Betas G10 Parade
We define the FX beta as the beta resulting from the following regression:
y(t) = α + β*x(t)+ε
where y(t) is the daily percentage change in an exchange rate and x(t) is the daily percentage change in a synthetic index. The regression is performed over a 10D
horizon and the coefficients in the table represent the value of the Beta over the last 10 days. Beta measures the reaction of the dependent variables (y(t)) to a
marginal movement in the independent variable (x(t)). In this monitor, the dependent variables are all the G10 crosses, while the independent variables are the USD
TWI, the EUR TWI, the US stocks (as proxied by the S&P 500 index) and oil prices. As for the stock-market betas, we can identify high beta exchange rates (with |β|
>1) and low beta exchange rate (with |β|<1), depending on whether they tend to overreact or underreact to changes of the independent variable. More precisely and
in line with the betas in the standard CAPM theory, a beta coefficient>1 indicates that a variable return moves in the same direction of the reference index with a
multiplying effect, while a beta coefficient <-1 means that a variable return moves in the opposite direction of the reference index with still a multiplying effect (we call
them "aggressive" pairs). On the other hand, a beta coefficient below 1 in absolute value indicates a variable return may move in the same or opposite direction of
the reference index, but underperforming the latter (we thus can call them "defensive pairs"). Taxonomy of possible outcome is reported in the table below:
TAXONOMY OF BETA OUTCOMES
β Sign Type Description
β>1 Aggressive Pair (same direction of the X variable) Changes of variable Y tend to outperform changes in variable X (in the same direction)
0<β<1 Defensive Pair (same direction of the X variable) Changes of variable Y tend to under perform changes in variable X (in the same direction)
−1<β<0 Defensive Pair (opposite direction of the X variable) Changes of variable Y tend to under perform changes in variable X (in the opposite direction)
β<−1 Aggressive Pair (opposite direction of the X variable) Changes of variable Y tend to outperform changes in variable X (in the opposite direction)
For each of the independent variables, we calculate the beta coefficients with all the G10 crosses and each of the following tables picks up the five highest and five
lowest FX betas.
BETA COEFFICIENTS WITH USD TWI BETA COEFFICIENTS WITH EUR TWI
1.14 1.040.89
0.580.31
-0.71 -0.74 -0.82-1.01
-1.30
-2
-1
0
1
2
USDSEK
USDNOK
USDCHF
USDJPY
JPYCHF
EURJPY
GBPUSD
NZDUSD
EURCAD
EURUSD
AGGRESSIVE BETA
AGGRESSIVE BETA
1.30 1.26 1.220.90 0.88
-0.66 -0.67 -0.81-1.01 -1.05
-2
-1
0
1
2
EURCAD
EURNZD
EURAUD
EURUSD
EURGBP
GBPJPY
USDJPY
AUDCHF
AUDJPY
NZDJP
Y
AGGRESSIVE BETA
AGGRESSIVE BETA
BETA COEFFICIENTS WITH US STOCKS BETA COEFFICIENTS WITH OIL PRICES
1.060.88 0.81
-0.44 -0.45 -0.48 -0.53 -0.61
0.65 0.58
-2
-1
0
1
2
NZDJP
Y
AUDJPY
NZDUSD
AUDUSD
GBPJPY
EURAUD
USDNOK
GBPNZD
USDCAD
EURNZD
AGGRESSIVE BETA
AGGRESSIVE BETA
0.51 0.51 0.42 0.410.18
-0.35 -0.37 -0.38 -0.40 -0.46
-2
-1
0
1
2
AUDUSD
AUDJPY
NZDJP
Y
NZDUSD
AUDCHF
GBPCAD
GBPNZD
USDNOK
USDCAD
GBPAUD
AGGRESSIVE BETA
AGGRESSIVE BETA
Source: Bloomberg, UniCredit Research for all charts and tables in this page
Back to front page
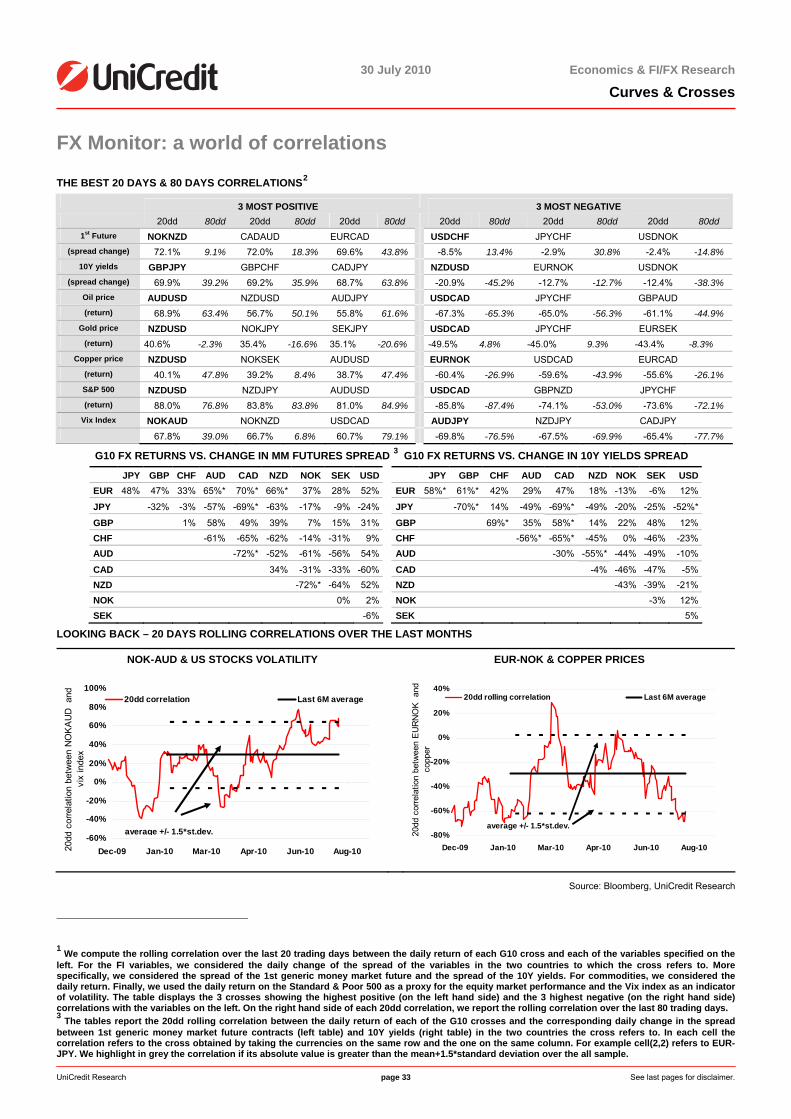
30 July 2010 Economics & FI/FX Research
Curves & Crosses
UniCredit Research page 33 See last pages for disclaimer.
FX Monitor: a world of correlations
THE BEST 20 DAYS & 80 DAYS CORRELATIONS2
3 MOST POSITIVE 3 MOST NEGATIVE 20dd 80dd 20dd 80dd 20dd 80dd 20dd 80dd 20dd 80dd 20dd 80dd
1st Future NOKNZD CADAUD EURCAD USDCHF JPYCHF USDNOK (spread change) 72.1% 9.1% 72.0% 18.3% 69.6% 43.8% -8.5% 13.4% -2.9% 30.8% -2.4% -14.8%
10Y yields GBPJPY GBPCHF CADJPY NZDUSD EURNOK USDNOK (spread change) 69.9% 39.2% 69.2% 35.9% 68.7% 63.8% -20.9% -45.2% -12.7% -12.7% -12.4% -38.3%
Oil price AUDUSD NZDUSD AUDJPY USDCAD JPYCHF GBPAUD (return) 68.9% 63.4% 56.7% 50.1% 55.8% 61.6% -67.3% -65.3% -65.0% -56.3% -61.1% -44.9%
Gold price NZDUSD NOKJPY SEKJPY USDCAD JPYCHF EURSEK (return) 40.6% -2.3% 35.4% -16.6% 35.1% -20.6% -49.5% 4.8% -45.0% 9.3% -43.4% -8.3%
Copper price NZDUSD NOKSEK AUDUSD EURNOK USDCAD EURCAD (return) 40.1% 47.8% 39.2% 8.4% 38.7% 47.4% -60.4% -26.9% -59.6% -43.9% -55.6% -26.1% S&P 500 NZDUSD NZDJPY AUDUSD USDCAD GBPNZD JPYCHF (return) 88.0% 76.8% 83.8% 83.8% 81.0% 84.9% -85.8% -87.4% -74.1% -53.0% -73.6% -72.1%
Vix Index NOKAUD NOKNZD USDCAD AUDJPY NZDJPY CADJPY 67.8% 39.0% 66.7% 6.8% 60.7% 79.1% -69.8% -76.5% -67.5% -69.9% -65.4% -77.7%
G10 FX RETURNS VS. CHANGE IN MM FUTURES SPREAD 3 G10 FX RETURNS VS. CHANGE IN 10Y YIELDS SPREAD
JPY GBP CHF AUD CAD NZD NOK SEK USD JPY GBP CHF AUD CAD NZD NOK SEK USDEUR 48% 47% 33% 65%* 70%* 66%* 37% 28% 52% EUR 58%* 61%* 42% 29% 47% 18% -13% -6% 12%
JPY -32% -3% -57% -69%* -63% -17% -9% -24% JPY -70%* 14% -49% -69%* -49% -20% -25% -52%*
GBP 1% 58% 49% 39% 7% 15% 31% GBP 69%* 35% 58%* 14% 22% 48% 12%CHF -61% -65% -62% -14% -31% 9% CHF -56%* -65%* -45% 0% -46% -23%AUD -72%* -52% -61% -56% 54% AUD -30% -55%* -44% -49% -10%
CAD 34% -31% -33% -60% CAD -4% -46% -47% -5%NZD -72%* -64% 52% NZD -43% -39% -21%NOK 0% 2% NOK -3% 12%SEK -6% SEK 5%
LOOKING BACK – 20 DAYS ROLLING CORRELATIONS OVER THE LAST MONTHS
NOK-AUD & US STOCKS VOLATILITY EUR-NOK & COPPER PRICES
-60%
-40%
-20%
0%
20%
40%
60%
80%
100%
Dec-09 Jan-10 Mar-10 Apr-10 Jun-10 Aug-10
20dd correlation Last 6M average
average +/- 1.5*st.dev.
20dd
cor
rela
tion
betw
een
NO
KA
UD
and
vi
x in
dex
-80%
-60%
-40%
-20%
0%
20%
40%
Dec-09 Jan-10 Mar-10 Apr-10 Jun-10 Aug-10
20dd rolling correlation Last 6M average
average +/- 1.5*st.dev.
20dd
cor
rela
tion
betw
een
EU
RN
OK
and
co
pper
Source: Bloomberg, UniCredit Research
1 We compute the rolling correlation over the last 20 trading days between the daily return of each G10 cross and each of the variables specified on the left. For the FI variables, we considered the daily change of the spread of the variables in the two countries to which the cross refers to. More specifically, we considered the spread of the 1st generic money market future and the spread of the 10Y yields. For commodities, we considered the daily return. Finally, we used the daily return on the Standard & Poor 500 as a proxy for the equity market performance and the Vix index as an indicator of volatility. The table displays the 3 crosses showing the highest positive (on the left hand side) and the 3 highest negative (on the right hand side) correlations with the variables on the left. On the right hand side of each 20dd correlation, we report the rolling correlation over the last 80 trading days. 3 The tables report the 20dd rolling correlation between the daily return of each of the G10 crosses and the corresponding daily change in the spread between 1st generic money market future contracts (left table) and 10Y yields (right table) in the two countries the cross refers to. In each cell the correlation refers to the cross obtained by taking the currencies on the same row and the one on the same column. For example cell(2,2) refers to EUR-JPY. We highlight in grey the correlation if its absolute value is greater than the mean+1.5*standard deviation over the all sample.
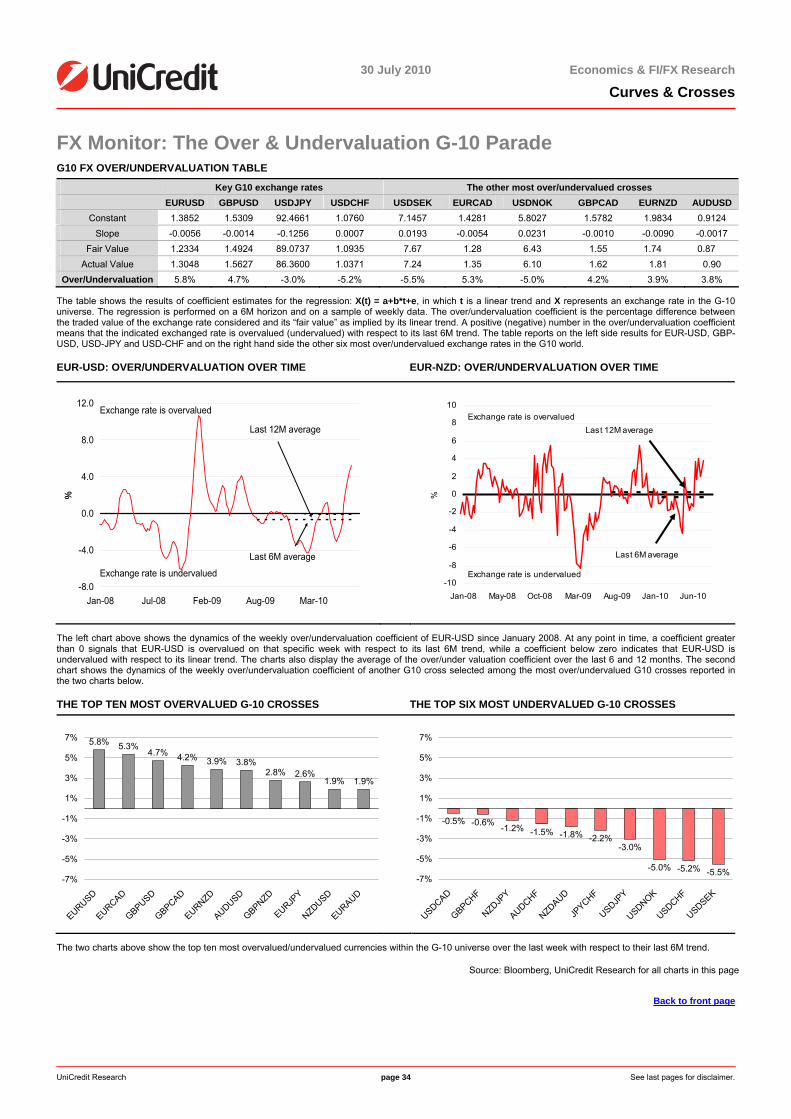
30 July 2010 Economics & FI/FX Research
Curves & Crosses
UniCredit Research page 34 See last pages for disclaimer.
FX Monitor: The Over & Undervaluation G-10 Parade G10 FX OVER/UNDERVALUATION TABLE
Key G10 exchange rates The other most over/undervalued crosses EURUSD GBPUSD USDJPY USDCHF USDSEK EURCAD USDNOK GBPCAD EURNZD AUDUSD
Constant 1.3852 1.5309 92.4661 1.0760 7.1457 1.4281 5.8027 1.5782 1.9834 0.9124 Slope -0.0056 -0.0014 -0.1256 0.0007 0.0193 -0.0054 0.0231 -0.0010 -0.0090 -0.0017
Fair Value 1.2334 1.4924 89.0737 1.0935 7.67 1.28 6.43 1.55 1.74 0.87 Actual Value 1.3048 1.5627 86.3600 1.0371 7.24 1.35 6.10 1.62 1.81 0.90
Over/Undervaluation 5.8% 4.7% -3.0% -5.2% -5.5% 5.3% -5.0% 4.2% 3.9% 3.8%
The table shows the results of coefficient estimates for the regression: X(t) = a+b*t+e, in which t is a linear trend and X represents an exchange rate in the G-10 universe. The regression is performed on a 6M horizon and on a sample of weekly data. The over/undervaluation coefficient is the percentage difference between the traded value of the exchange rate considered and its “fair value” as implied by its linear trend. A positive (negative) number in the over/undervaluation coefficient means that the indicated exchanged rate is overvalued (undervalued) with respect to its last 6M trend. The table reports on the left side results for EUR-USD, GBP-USD, USD-JPY and USD-CHF and on the right hand side the other six most over/undervalued exchange rates in the G10 world.
EUR-USD: OVER/UNDERVALUATION OVER TIME EUR-NZD: OVER/UNDERVALUATION OVER TIME
-8.0
-4.0
0.0
4.0
8.0
12.0
Jan-08 Jul-08 Feb-09 Aug-09 Mar-10
%
Exchange rate is overvalued
Exchange rate is undervalued
Last 6M average
Last 12M average
-10
-8
-6
-4
-2
0
2
4
6
8
10
Jan-08 May-08 Oct-08 Mar-09 Aug-09 Jan-10 Jun-10
%
Exchange rate is overvalued
Exchange rate is undervalued
Last 6M average
Last 12M average
The left chart above shows the dynamics of the weekly over/undervaluation coefficient of EUR-USD since January 2008. At any point in time, a coefficient greater than 0 signals that EUR-USD is overvalued on that specific week with respect to its last 6M trend, while a coefficient below zero indicates that EUR-USD is undervalued with respect to its linear trend. The charts also display the average of the over/under valuation coefficient over the last 6 and 12 months. The second chart shows the dynamics of the weekly over/undervaluation coefficient of another G10 cross selected among the most over/undervalued G10 crosses reported in the two charts below.
THE TOP TEN MOST OVERVALUED G-10 CROSSES THE TOP SIX MOST UNDERVALUED G-10 CROSSES
5.8% 5.3%4.7% 4.2% 3.9% 3.8%
2.8% 2.6%1.9% 1.9%
-7%
-5%
-3%
-1%
1%
3%
5%
7%
EURUSD
EURCAD
GBPUSD
GBPCAD
EURNZD
AUDUSD
GBPNZD
EURJPY
NZDUSD
EURAUD
-0.5% -0.6% -1.2% -1.5% -1.8% -2.2%-3.0%
-5.0% -5.2% -5.5%-7%
-5%
-3%
-1%
1%
3%
5%
7%
USDCAD
GBPCHF
NZDJPY
AUDCHF
NZDAUD
JPYCHF
USDJPY
USDNOK
USDCHF
USDSEK
The two charts above show the top ten most overvalued/undervalued currencies within the G-10 universe over the last week with respect to their last 6M trend.
Source: Bloomberg, UniCredit Research for all charts in this page
Back to front page
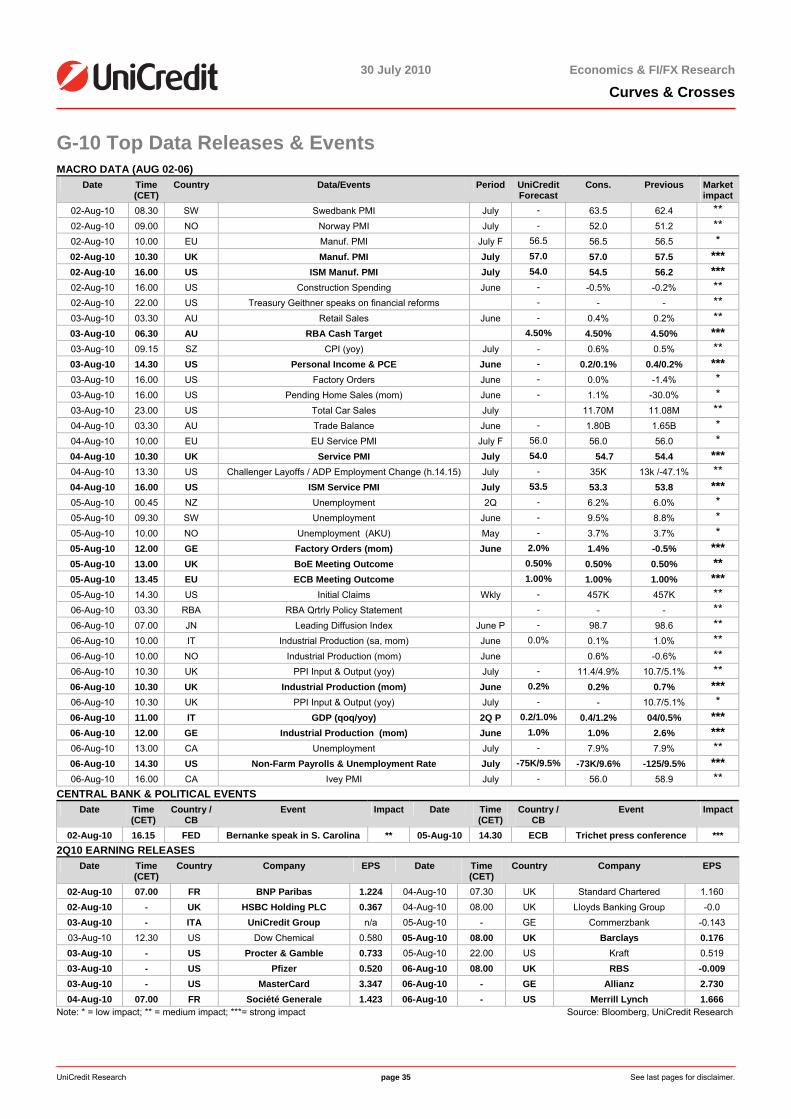
30 July 2010 Economics & FI/FX Research
Curves & Crosses
UniCredit Research page 35 See last pages for disclaimer.
G-10 Top Data Releases & Events MACRO DATA (AUG 02-06)
Date Time (CET)
Country Data/Events Period UniCredit Forecast
Cons. Previous Market impact
02-Aug-10 08.30 SW Swedbank PMI July - 63.5 62.4 ** 02-Aug-10 09.00 NO Norway PMI July - 52.0 51.2 ** 02-Aug-10 10.00 EU Manuf. PMI July F 56.5 56.5 56.5 * 02-Aug-10 10.30 UK Manuf. PMI July 57.0 57.0 57.5 *** 02-Aug-10 16.00 US ISM Manuf. PMI July 54.0 54.5 56.2 *** 02-Aug-10 16.00 US Construction Spending June - -0.5% -0.2% ** 02-Aug-10 22.00 US Treasury Geithner speaks on financial reforms - - - ** 03-Aug-10 03.30 AU Retail Sales June - 0.4% 0.2% ** 03-Aug-10 06.30 AU RBA Cash Target 4.50% 4.50% 4.50% *** 03-Aug-10 09.15 SZ CPI (yoy) July - 0.6% 0.5% ** 03-Aug-10 14.30 US Personal Income & PCE June - 0.2/0.1% 0.4/0.2% *** 03-Aug-10 16.00 US Factory Orders June - 0.0% -1.4% * 03-Aug-10 16.00 US Pending Home Sales (mom) June - 1.1% -30.0% * 03-Aug-10 23.00 US Total Car Sales July 11.70M 11.08M ** 04-Aug-10 03.30 AU Trade Balance June - 1.80B 1.65B * 04-Aug-10 10.00 EU EU Service PMI July F 56.0 56.0 56.0 * 04-Aug-10 10.30 UK Service PMI July 54.0 54.7 54.4 *** 04-Aug-10 13.30 US Challenger Layoffs / ADP Employment Change (h.14.15) July - 35K 13k /-47.1% ** 04-Aug-10 16.00 US ISM Service PMI July 53.5 53.3 53.8 *** 05-Aug-10 00.45 NZ Unemployment 2Q - 6.2% 6.0% * 05-Aug-10 09.30 SW Unemployment June - 9.5% 8.8% * 05-Aug-10 10.00 NO Unemployment (AKU) May - 3.7% 3.7% * 05-Aug-10 12.00 GE Factory Orders (mom) June 2.0% 1.4% -0.5% *** 05-Aug-10 13.00 UK BoE Meeting Outcome 0.50% 0.50% 0.50% ** 05-Aug-10 13.45 EU ECB Meeting Outcome 1.00% 1.00% 1.00% *** 05-Aug-10 14.30 US Initial Claims Wkly - 457K 457K ** 06-Aug-10 03.30 RBA RBA Qrtrly Policy Statement - - - ** 06-Aug-10 07.00 JN Leading Diffusion Index June P - 98.7 98.6 ** 06-Aug-10 10.00 IT Industrial Production (sa, mom) June 0.0% 0.1% 1.0% ** 06-Aug-10 10.00 NO Industrial Production (mom) June 0.6% -0.6% ** 06-Aug-10 10.30 UK PPI Input & Output (yoy) July - 11.4/4.9% 10.7/5.1% ** 06-Aug-10 10.30 UK Industrial Production (mom) June 0.2% 0.2% 0.7% *** 06-Aug-10 10.30 UK PPI Input & Output (yoy) July - - 10.7/5.1% * 06-Aug-10 11.00 IT GDP (qoq/yoy) 2Q P 0.2/1.0% 0.4/1.2% 04/0.5% *** 06-Aug-10 12.00 GE Industrial Production (mom) June 1.0% 1.0% 2.6% *** 06-Aug-10 13.00 CA Unemployment July - 7.9% 7.9% ** 06-Aug-10 14.30 US Non-Farm Payrolls & Unemployment Rate July -75K/9.5% -73K/9.6% -125/9.5% *** 06-Aug-10 16.00 CA Ivey PMI July - 56.0 58.9 **
CENTRAL BANK & POLITICAL EVENTS Date Time
(CET) Country /
CB Event Impact Date Time
(CET) Country /
CB Event Impact
02-Aug-10 16.15 FED Bernanke speak in S. Carolina ** 05-Aug-10 14.30 ECB Trichet press conference *** 2Q10 EARNING RELEASES
Date Time (CET)
Country Company EPS Date Time (CET)
Country Company EPS
02-Aug-10 07.00 FR BNP Paribas 1.224 04-Aug-10 07.30 UK Standard Chartered 1.160 02-Aug-10 - UK HSBC Holding PLC 0.367 04-Aug-10 08.00 UK Lloyds Banking Group -0.0 03-Aug-10 - ITA UniCredit Group n/a 05-Aug-10 - GE Commerzbank -0.143 03-Aug-10 12.30 US Dow Chemical 0.580 05-Aug-10 08.00 UK Barclays 0.176 03-Aug-10 - US Procter & Gamble 0.733 05-Aug-10 22.00 US Kraft 0.519 03-Aug-10 - US Pfizer 0.520 06-Aug-10 08.00 UK RBS -0.009 03-Aug-10 - US MasterCard 3.347 06-Aug-10 - GE Allianz 2.730 04-Aug-10 07.00 FR Société Generale 1.423 06-Aug-10 - US Merrill Lynch 1.666
Note: * = low impact; ** = medium impact; ***= strong impact Source: Bloomberg, UniCredit Research
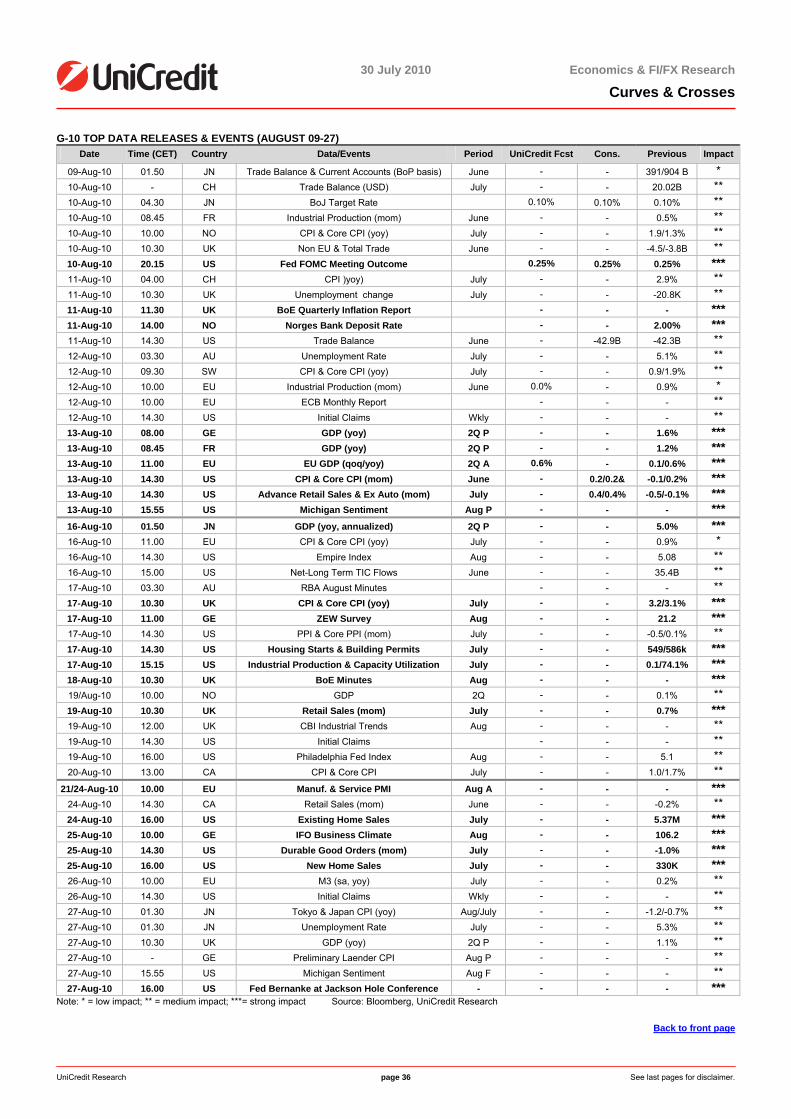
30 July 2010 Economics & FI/FX Research
Curves & Crosses
UniCredit Research page 36 See last pages for disclaimer.
G-10 TOP DATA RELEASES & EVENTS (AUGUST 09-27) Date Time (CET) Country Data/Events Period UniCredit Fcst Cons. Previous Impact
09-Aug-10 01.50 JN Trade Balance & Current Accounts (BoP basis) June - - 391/904 B * 10-Aug-10 - CH Trade Balance (USD) July - - 20.02B ** 10-Aug-10 04.30 JN BoJ Target Rate 0.10% 0.10% 0.10% ** 10-Aug-10 08.45 FR Industrial Production (mom) June - - 0.5% ** 10-Aug-10 10.00 NO CPI & Core CPI (yoy) July - - 1.9/1.3% ** 10-Aug-10 10.30 UK Non EU & Total Trade June - - -4.5/-3.8B ** 10-Aug-10 20.15 US Fed FOMC Meeting Outcome 0.25% 0.25% 0.25% *** 11-Aug-10 04.00 CH CPI )yoy) July - - 2.9% ** 11-Aug-10 10.30 UK Unemployment change July - - -20.8K ** 11-Aug-10 11.30 UK BoE Quarterly Inflation Report - - - *** 11-Aug-10 14.00 NO Norges Bank Deposit Rate - - 2.00% *** 11-Aug-10 14.30 US Trade Balance June - -42.9B -42.3B ** 12-Aug-10 03.30 AU Unemployment Rate July - - 5.1% ** 12-Aug-10 09.30 SW CPI & Core CPI (yoy) July - - 0.9/1.9% ** 12-Aug-10 10.00 EU Industrial Production (mom) June 0.0% - 0.9% * 12-Aug-10 10.00 EU ECB Monthly Report - - - ** 12-Aug-10 14.30 US Initial Claims Wkly - - - ** 13-Aug-10 08.00 GE GDP (yoy) 2Q P - - 1.6% *** 13-Aug-10 08.45 FR GDP (yoy) 2Q P - - 1.2% *** 13-Aug-10 11.00 EU EU GDP (qoq/yoy) 2Q A 0.6% - 0.1/0.6% *** 13-Aug-10 14.30 US CPI & Core CPI (mom) June - 0.2/0.2& -0.1/0.2% *** 13-Aug-10 14.30 US Advance Retail Sales & Ex Auto (mom) July - 0.4/0.4% -0.5/-0.1% *** 13-Aug-10 15.55 US Michigan Sentiment Aug P - - - *** 16-Aug-10 01.50 JN GDP (yoy, annualized) 2Q P - - 5.0% *** 16-Aug-10 11.00 EU CPI & Core CPI (yoy) July - - 0.9% * 16-Aug-10 14.30 US Empire Index Aug - - 5.08 ** 16-Aug-10 15.00 US Net-Long Term TIC Flows June - - 35.4B ** 17-Aug-10 03.30 AU RBA August Minutes - - - ** 17-Aug-10 10.30 UK CPI & Core CPI (yoy) July - - 3.2/3.1% *** 17-Aug-10 11.00 GE ZEW Survey Aug - - 21.2 *** 17-Aug-10 14.30 US PPI & Core PPI (mom) July - - -0.5/0.1% ** 17-Aug-10 14.30 US Housing Starts & Building Permits July - - 549/586k *** 17-Aug-10 15.15 US Industrial Production & Capacity Utilization July - - 0.1/74.1% *** 18-Aug-10 10.30 UK BoE Minutes Aug - - - *** 19/Aug-10 10.00 NO GDP 2Q - - 0.1% ** 19-Aug-10 10.30 UK Retail Sales (mom) July - - 0.7% *** 19-Aug-10 12.00 UK CBI Industrial Trends Aug - - - ** 19-Aug-10 14.30 US Initial Claims - - - ** 19-Aug-10 16.00 US Philadelphia Fed Index Aug - - 5.1 ** 20-Aug-10 13.00 CA CPI & Core CPI July - - 1.0/1.7% **
21/24-Aug-10 10.00 EU Manuf. & Service PMI Aug A - - - *** 24-Aug-10 14.30 CA Retail Sales (mom) June - - -0.2% ** 24-Aug-10 16.00 US Existing Home Sales July - - 5.37M *** 25-Aug-10 10.00 GE IFO Business Climate Aug - - 106.2 *** 25-Aug-10 14.30 US Durable Good Orders (mom) July - - -1.0% *** 25-Aug-10 16.00 US New Home Sales July - - 330K *** 26-Aug-10 10.00 EU M3 (sa, yoy) July - - 0.2% ** 26-Aug-10 14.30 US Initial Claims Wkly - - - ** 27-Aug-10 01.30 JN Tokyo & Japan CPI (yoy) Aug/July - - -1.2/-0.7% ** 27-Aug-10 01.30 JN Unemployment Rate July - - 5.3% ** 27-Aug-10 10.30 UK GDP (yoy) 2Q P - - 1.1% ** 27-Aug-10 - GE Preliminary Laender CPI Aug P - - - ** 27-Aug-10 15.55 US Michigan Sentiment Aug F - - - ** 27-Aug-10 16.00 US Fed Bernanke at Jackson Hole Conference - - - - ***
Note: * = low impact; ** = medium impact; ***= strong impact Source: Bloomberg, UniCredit Research
Back to front page
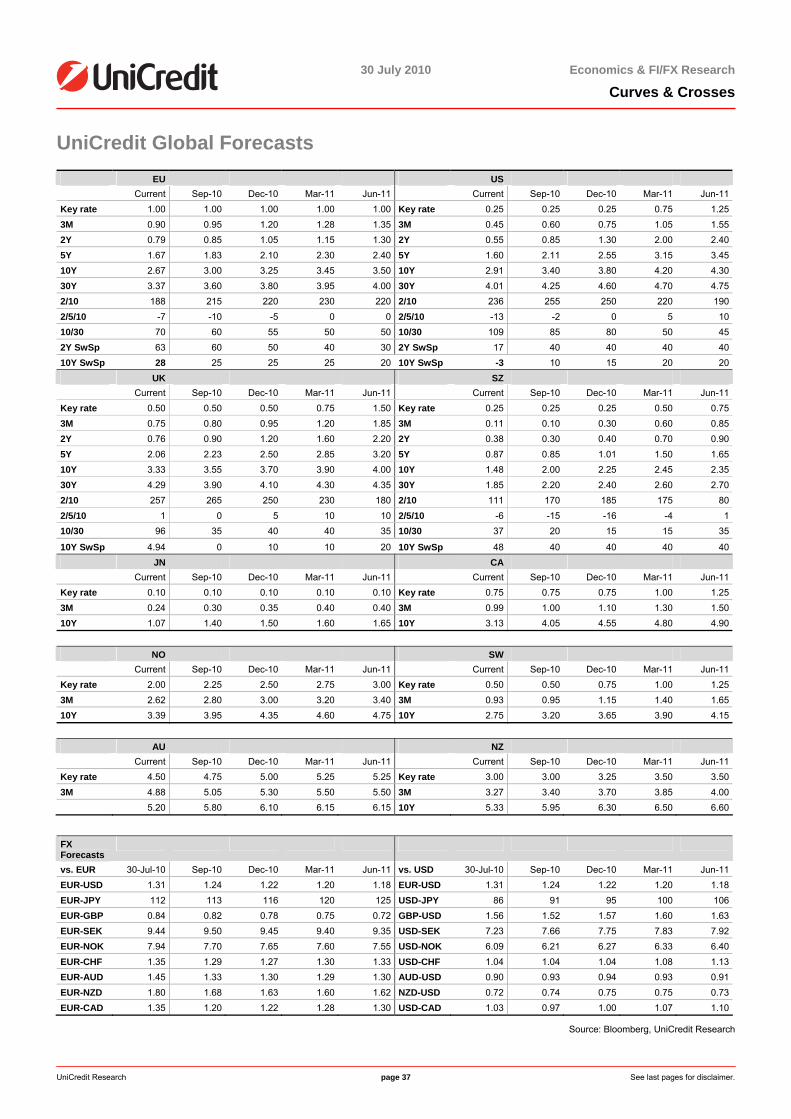
30 July 2010 Economics & FI/FX Research
Curves & Crosses
UniCredit Research page 37 See last pages for disclaimer.
UniCredit Global Forecasts EU US
Current Sep-10 Dec-10 Mar-11 Jun-11 Current Sep-10 Dec-10 Mar-11 Jun-11Key rate 1.00 1.00 1.00 1.00 1.00 Key rate 0.25 0.25 0.25 0.75 1.253M 0.90 0.95 1.20 1.28 1.35 3M 0.45 0.60 0.75 1.05 1.552Y 0.79 0.85 1.05 1.15 1.30 2Y 0.55 0.85 1.30 2.00 2.405Y 1.67 1.83 2.10 2.30 2.40 5Y 1.60 2.11 2.55 3.15 3.4510Y 2.67 3.00 3.25 3.45 3.50 10Y 2.91 3.40 3.80 4.20 4.3030Y 3.37 3.60 3.80 3.95 4.00 30Y 4.01 4.25 4.60 4.70 4.752/10 188 215 220 230 220 2/10 236 255 250 220 1902/5/10 -7 -10 -5 0 0 2/5/10 -13 -2 0 5 1010/30 70 60 55 50 50 10/30 109 85 80 50 452Y SwSp 63 60 50 40 30 2Y SwSp 17 40 40 40 4010Y SwSp 28 25 25 25 20 10Y SwSp -3 10 15 20 20 UK SZ Current Sep-10 Dec-10 Mar-11 Jun-11 Current Sep-10 Dec-10 Mar-11 Jun-11Key rate 0.50 0.50 0.50 0.75 1.50 Key rate 0.25 0.25 0.25 0.50 0.753M 0.75 0.80 0.95 1.20 1.85 3M 0.11 0.10 0.30 0.60 0.852Y 0.76 0.90 1.20 1.60 2.20 2Y 0.38 0.30 0.40 0.70 0.905Y 2.06 2.23 2.50 2.85 3.20 5Y 0.87 0.85 1.01 1.50 1.6510Y 3.33 3.55 3.70 3.90 4.00 10Y 1.48 2.00 2.25 2.45 2.3530Y 4.29 3.90 4.10 4.30 4.35 30Y 1.85 2.20 2.40 2.60 2.702/10 257 265 250 230 180 2/10 111 170 185 175 802/5/10 1 0 5 10 10 2/5/10 -6 -15 -16 -4 110/30 96 35 40 40 35 10/30 37 20 15 15 35
10Y SwSp 4.94 0 10 10 20 10Y SwSp 48 40 40 40 40 JN CA Current Sep-10 Dec-10 Mar-11 Jun-11 Current Sep-10 Dec-10 Mar-11 Jun-11Key rate 0.10 0.10 0.10 0.10 0.10 Key rate 0.75 0.75 0.75 1.00 1.253M 0.24 0.30 0.35 0.40 0.40 3M 0.99 1.00 1.10 1.30 1.5010Y 1.07 1.40 1.50 1.60 1.65 10Y 3.13 4.05 4.55 4.80 4.90
NO SW Current Sep-10 Dec-10 Mar-11 Jun-11 Current Sep-10 Dec-10 Mar-11 Jun-11Key rate 2.00 2.25 2.50 2.75 3.00 Key rate 0.50 0.50 0.75 1.00 1.253M 2.62 2.80 3.00 3.20 3.40 3M 0.93 0.95 1.15 1.40 1.6510Y 3.39 3.95 4.35 4.60 4.75 10Y 2.75 3.20 3.65 3.90 4.15
AU NZ Current Sep-10 Dec-10 Mar-11 Jun-11 Current Sep-10 Dec-10 Mar-11 Jun-11Key rate 4.50 4.75 5.00 5.25 5.25 Key rate 3.00 3.00 3.25 3.50 3.503M 4.88 5.05 5.30 5.50 5.50 3M 3.27 3.40 3.70 3.85 4.00 5.20 5.80 6.10 6.15 6.15 10Y 5.33 5.95 6.30 6.50 6.60
FX Forecasts
vs. EUR 30-Jul-10 Sep-10 Dec-10 Mar-11 Jun-11 vs. USD 30-Jul-10 Sep-10 Dec-10 Mar-11 Jun-11EUR-USD 1.31 1.24 1.22 1.20 1.18 EUR-USD 1.31 1.24 1.22 1.20 1.18EUR-JPY 112 113 116 120 125 USD-JPY 86 91 95 100 106EUR-GBP 0.84 0.82 0.78 0.75 0.72 GBP-USD 1.56 1.52 1.57 1.60 1.63EUR-SEK 9.44 9.50 9.45 9.40 9.35 USD-SEK 7.23 7.66 7.75 7.83 7.92EUR-NOK 7.94 7.70 7.65 7.60 7.55 USD-NOK 6.09 6.21 6.27 6.33 6.40EUR-CHF 1.35 1.29 1.27 1.30 1.33 USD-CHF 1.04 1.04 1.04 1.08 1.13EUR-AUD 1.45 1.33 1.30 1.29 1.30 AUD-USD 0.90 0.93 0.94 0.93 0.91EUR-NZD 1.80 1.68 1.63 1.60 1.62 NZD-USD 0.72 0.74 0.75 0.75 0.73EUR-CAD 1.35 1.20 1.22 1.28 1.30 USD-CAD 1.03 0.97 1.00 1.07 1.10
Source: Bloomberg, UniCredit Research
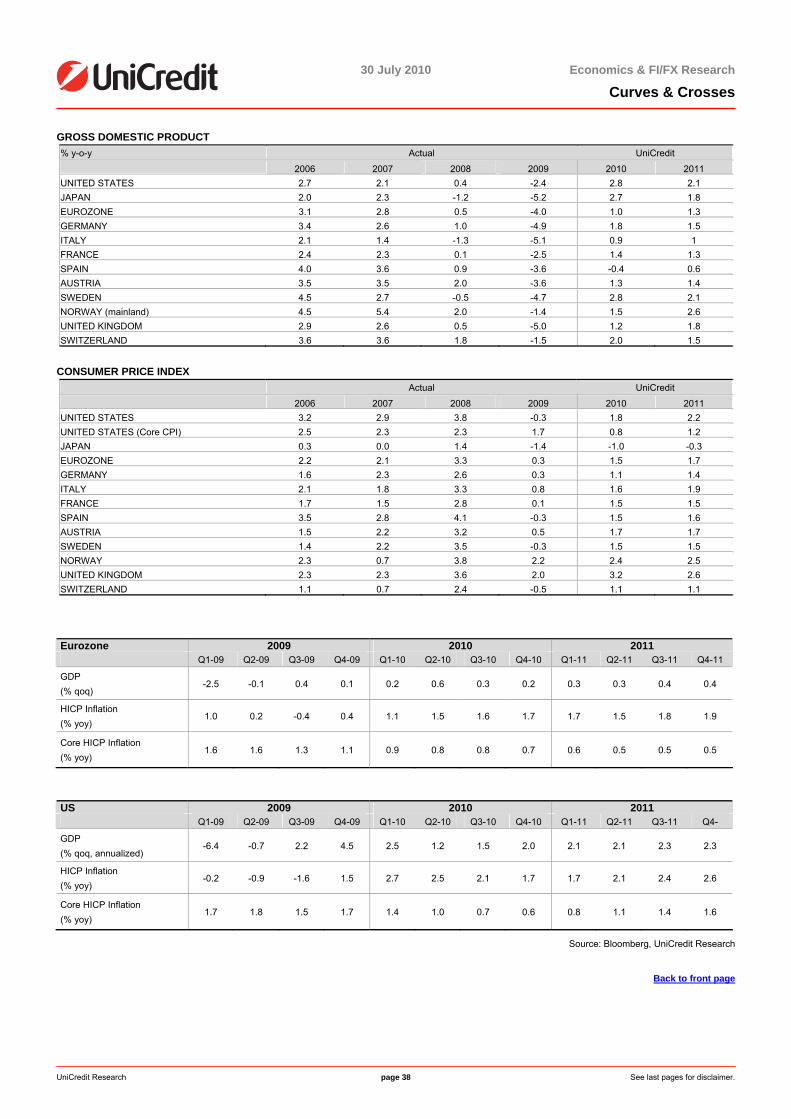
30 July 2010 Economics & FI/FX Research
Curves & Crosses
UniCredit Research page 38 See last pages for disclaimer.
GROSS DOMESTIC PRODUCT % y-o-y Actual UniCredit 2006 2007 2008 2009 2010 2011UNITED STATES 2.7 2.1 0.4 -2.4 2.8 2.1JAPAN 2.0 2.3 -1.2 -5.2 2.7 1.8EUROZONE 3.1 2.8 0.5 -4.0 1.0 1.3GERMANY 3.4 2.6 1.0 -4.9 1.8 1.5ITALY 2.1 1.4 -1.3 -5.1 0.9 1FRANCE 2.4 2.3 0.1 -2.5 1.4 1.3SPAIN 4.0 3.6 0.9 -3.6 -0.4 0.6AUSTRIA 3.5 3.5 2.0 -3.6 1.3 1.4SWEDEN 4.5 2.7 -0.5 -4.7 2.8 2.1NORWAY (mainland) 4.5 5.4 2.0 -1.4 1.5 2.6UNITED KINGDOM 2.9 2.6 0.5 -5.0 1.2 1.8SWITZERLAND 3.6 3.6 1.8 -1.5 2.0 1.5
CONSUMER PRICE INDEX Actual UniCredit 2006 2007 2008 2009 2010 2011UNITED STATES 3.2 2.9 3.8 -0.3 1.8 2.2UNITED STATES (Core CPI) 2.5 2.3 2.3 1.7 0.8 1.2JAPAN 0.3 0.0 1.4 -1.4 -1.0 -0.3EUROZONE 2.2 2.1 3.3 0.3 1.5 1.7GERMANY 1.6 2.3 2.6 0.3 1.1 1.4ITALY 2.1 1.8 3.3 0.8 1.6 1.9FRANCE 1.7 1.5 2.8 0.1 1.5 1.5SPAIN 3.5 2.8 4.1 -0.3 1.5 1.6AUSTRIA 1.5 2.2 3.2 0.5 1.7 1.7SWEDEN 1.4 2.2 3.5 -0.3 1.5 1.5NORWAY 2.3 0.7 3.8 2.2 2.4 2.5UNITED KINGDOM 2.3 2.3 3.6 2.0 3.2 2.6SWITZERLAND 1.1 0.7 2.4 -0.5 1.1 1.1
Eurozone 2009 2010 2011 Q1-09 Q2-09 Q3-09 Q4-09 Q1-10 Q2-10 Q3-10 Q4-10 Q1-11 Q2-11 Q3-11 Q4-11
GDP (% qoq)
-2.5 -0.1 0.4 0.1 0.2 0.6 0.3 0.2 0.3 0.3 0.4 0.4
HICP Inflation (% yoy)
1.0 0.2 -0.4 0.4 1.1 1.5 1.6 1.7 1.7 1.5 1.8 1.9
Core HICP Inflation (% yoy)
1.6 1.6 1.3 1.1 0.9 0.8 0.8 0.7 0.6 0.5 0.5 0.5
US 2009 2010 2011 Q1-09 Q2-09 Q3-09 Q4-09 Q1-10 Q2-10 Q3-10 Q4-10 Q1-11 Q2-11 Q3-11 Q4-
GDP (% qoq, annualized)
-6.4 -0.7 2.2 4.5 2.5 1.2 1.5 2.0 2.1 2.1 2.3 2.3
HICP Inflation (% yoy)
-0.2 -0.9 -1.6 1.5 2.7 2.5 2.1 1.7 1.7 2.1 2.4 2.6
Core HICP Inflation (% yoy)
1.7 1.8 1.5 1.7 1.4 1.0 0.7 0.6 0.8 1.1 1.4 1.6
Source: Bloomberg, UniCredit Research
Back to front page
30 July 2010 Economics & FI/FX Research
Curves & Crosses
UniCredit Research page 39
Disclaimer Our recommendations are based on information obtained from, or are based upon public information sources that we consider to be reliable but for the completeness and accuracy of which we assume no liability. All estimates and opinions included in the report represent the independent judgment of the analysts as of the date of the issue. We reserve the right to modify the views expressed herein at any time without notice. Moreover, we reserve the right not to update this information or to discontinue it altogether without notice. This analysis is for information purposes only and (i) does not constitute or form part of any offer for sale or subscription of or solicitation of any offer to buy or subscribe for any financial, money market or investment instrument or any security, (ii) is neither intended as such an offer for sale or subscription of or solicitation of an offer to buy or subscribe for any financial, money market or investment instrument or any security nor (iii) as an advertisement thereof. The investment possibilities discussed in this report may not be suitable for certain investors depending on their specific investment objectives and time horizon or in the context of their overall financial situation. The investments discussed may fluctuate in price or value. Investors may get back less than they invested. Changes in rates of exchange may have an adverse effect on the value of investments. Furthermore, past performance is not necessarily indicative of future results. In particular, the risks associated with an investment in the financial, money market or investment instrument or security under discussion are not explained in their entirety. This information is given without any warranty on an "as is" basis and should not be regarded as a substitute for obtaining individual advice. Investors must make their own determination of the appropriateness of an investment in any instruments referred to herein based on the merits and risks involved, their own investment strategy and their legal, fiscal and financial position. As this document does not qualify as an investment recommendation or as a direct investment recommendation, neither this document nor any part of it shall form the basis of, or be relied on in connection with or act as an inducement to enter into, any contract or commitment whatsoever. Investors are urged to contact their bank's investment advisor for individual explanations and advice. Neither UniCredit Bank AG, UniCredit Bank AG London Branch, UniCredit Bank AG Vienna Branch, UniCredit Bank AG Milan Branch, UniCredit Securities, UniCredit Menkul Değerler A.Ş., UniCredit Bulbank, Zagrebačka banka, UniCredit Bank, Bank Pekao, Yapi Kredi, UniCredit Tiriac Bank, ATFBank nor any of their respective directors, officers or employees nor any other person accepts any liability whatsoever (in negligence or otherwise) for any loss howsoever arising from any use of this document or its contents or otherwise arising in connection therewith. This analysis is being distributed by electronic and ordinary mail to professional investors, who are expected to make their own investment decisions without undue reliance on this publication, and may not be redistributed, reproduced or published in whole or in part for any purpose. Responsibility for the content of this publication lies with: a) UniCredit Bank AG, Am Tucherpark 16, 80538 Munich, Germany, (also responsible for the distribution pursuant to §34b WpHG). The company belongs to UCI Group. Regulatory authority: “BaFin“ – Bundesanstalt für Finanzdienstleistungsaufsicht, Lurgiallee 12, 60439 Frankfurt, Germany. b) UniCredit Bank AG London Branch, Moor House, 120 London Wall, London EC2Y 5ET, United Kingdom. Regulatory authority: “BaFin“ – Bundesanstalt für Finanzdienstleistungsaufsicht, Lurgiallee 12, 60439 Frankfurt, Germany and subject to limited regulation by the Financial Services Authority (FSA), 25 The North Colonnade, Canary Wharf, London E14 5HS, United Kingdom. Details about the extent of our regulation by the Financial Services Authority are available from us on request. c) UniCredit Bank AG Milan Branch, Via Tommaso Grossi 10, 20121 Milan, Italy, duly authorized by the Bank of Italy to provide investment services. Regulatory authority: “Bank of Italy”, Via Nazionale 91, 00184 Roma, Italy and Bundesanstalt für Finanzdienstleistungsaufsicht, Lurgiallee 12, 60439 Frankfurt, Germany. d) UniCredit Bank AG Vienna Branch, Julius-Tandler-Platz 3, 1090 Vienna, Austria Regulatory authority: Finanzmarktaufsichtsbehörde (FMA), Praterstrasse 23, 1020 Vienna, Austria and subject to limited regulation by the “BaFin“ – Bundesanstalt für Finanz-dienstleistungsaufsicht, Lurgiallee 12, 60439 Frankfurt, Germany. Details about the extent of our regulation by the Bundesanstalt für Finanzdienstleistungsaufsicht are available from us on request. e) UniCredit Securities, Boulevard Ring Office Building, 17/1 Chistoprudni Boulevard, Moscow 101000, Russia Regulatory authority: Federal Service on Financial Markets, 9 Leninsky prospekt, Moscow 119991, Russia f) UniCredit Menkul Değerler A.Ş., Büyükdere Cad. No. 195, Büyükdere Plaza Kat. 5, 34394 Levent, Istanbul, Turkey Regulatory authority: Sermaye Piyasası Kurulu – Capital Markets Board of Turkey, Eskişehir Yolu 8.Km No:156, 06530 Ankara, Turkey g) UniCredit Bulbank, Sveta Nedelya Sq. 7, BG-1000 Sofia, Bulgaria Regulatory authority: Financial Supervision Commission (FSC), 33 Shar Planina str.,1303 Sofia, Bulgaria h) Zagrebačka banka, Paromlinska 2, HR-10000 Zagreb, Croatia Regulatory authority: Croatian Agency for Supervision of Financial Services, Miramarska 24B, 10000 Zagreb, Croatia i) UniCredit Bank, Na Príkope 858/20, CZ-11121 Prague, Czech Republic Regulatory authority: CNB Czech National Bank, Na Příkopě 28, 115 03 Praha 1, Czech Republic j) Bank Pekao, ul. Grzybowska 53/57, PL-00-950 Warsaw, Poland Regulatory authority: Polish Financial Supervision Authority, Plac Powstańców Warszawy 1, 00-950 Warsaw, Poland k) UniCredit Bank, Prechistenskaya emb. 9, RF-19034 Moscow, Russia Regulatory authority: Federal Service on Financial Markets, 9 Leninsky prospekt, Moscow 119991, Russia l) UniCredit Bank, Šancova 1/A, SK-813 33 Bratislava, Slovakia Regulatory authority: National Bank of Slovakia, Stefanikovo nam. 10/19, 967 01 Kremnica, Slovakia m) Yapi Kredi, Yapi Kredi Plaza D Blok, Levent, TR-80620 Istanbul, Turkey Regulatory authority: Sermaye Piyasası Kurulu – Capital Markets Board of Turkey, Eskişehir Yolu 8.Km No:156, 06530 Ankara, Turkey n) UniCredit Tiriac Bank, Ghetarilor Street 23-25, RO-014106 Bucharest 1,Romania Regulatory authority: CNVM, Romanian National Securities Commission, Foişorului street, no.2, sector 3, Bucharest, Romania o) ATFBank, 100 Furmanov Str., KZ-050000 Almaty, Kazakhstan Agency of the Republic of Kazakhstan on the state regulation and supervision of financial market and financial organisations, 050000, Almaty, 67 Aiteke Bi str., Kazakhstan POTENTIAL CONFLICTS OF INTEREST UniCredit Bank AG acts as a Specialist or Primary Dealer in government bonds issued by the Italian, Portuguese and Greek Treasury. Main tasks of the Specialist are to participate with continuity and efficiency to the governments' securities auctions, to contribute to the efficiency of the secondary market through market making activity and quoting requirements and to contribute to the management of public debt and to the debt issuance policy choices, also through advisory and research activities. ANALYST DECLARATION The author’s remuneration has not been, and will not be, geared to the recommendations or views expressed in this study, neither directly nor indirectly. ORGANIZATIONAL AND ADMINISTRATIVE ARRANGEMENTS TO AVOID AND PREVENT CONFLICTS OF INTEREST To prevent or remedy conflicts of interest, UniCredit Bank AG, UniCredit Bank AG London Branch, UniCredit Bank AG Vienna Branch, UniCredit Bank AG Milan Branch, UniCredit Securities, UniCredit Menkul Değerler A.Ş., UniCredit Bulbank, Zagrebačka banka, UniCredit Bank, Bank Pekao, Yapi Kredi, UniCredit Tiriac Bank, ATFBank have established the organizational arrangements required from a legal and supervisory aspect, adherence to which is monitored by its compliance department. Conflicts of interest arising are managed by legal and physical and non-physical barriers (collectively referred to as “Chinese Walls”) designed to restrict the flow of information between one area/department of UniCredit Bank AG, UniCredit Bank AG London Branch, UniCredit Bank AG Vienna Branch, UniCredit Bank AG Milan Branch, UniCredit Securities, UniCredit Menkul Değerler A.Ş., UniCredit Bulbank, Zagrebačka banka, UniCredit Bank, Bank Pekao, Yapi Kredi, UniCredit Tiriac Bank, ATFBank and another. In particular, Investment Banking units, including corporate finance, capital market activities, financial advisory and other capital raising activities, are segregated by physical and non-physical boundaries from Markets Units, as well as the research department. In the case of equities execution by UniCredit Bank AG Milan Branch, other than as a matter of client facilitation or delta hedging of OTC and listed derivative positions, there is no proprietary trading. Disclosure of publicly available conflicts of interest and other material interests is made in the research. Analysts are supervised and managed on a day-to-day basis by line managers who do not have responsibility for Investment Banking activities, including corporate finance activities, or other activities other than the sale of securities to clients.
30 July 2010 Economics & FI/FX Research
Curves & Crosses
UniCredit Research page 40
ADDITIONAL REQUIRED DISCLOSURES UNDER THE LAWS AND REGULATIONS OF JURISDICTIONS INDICATED Notice to Austrian investors This document does not constitute or form part of any offer for sale or subscription of or solicitation of any offer to buy or subscribe for any securities and neither this document nor any part of it shall form the basis of, or be relied on in connection with or act as an inducement to enter into, any contract or commitment whatsoever. This document is confidential and is being supplied to you solely for your information and may not be reproduced, redistributed or passed on to any other person or published, in whole or part, for any purpose. Notice to Czech investors This report is intended for clients of UniCredit Bank AG, UniCredit Bank AG London Branch, UniCredit Bank AG Vienna Branch, UniCredit Bank AG Milan Branch, UniCredit Securities, UniCredit Menkul Değerler A.Ş., UniCredit Bulbank, Zagrebačka banka, UniCredit Bank, Bank Pekao, Yapi Kredi, UniCredit Tiriac Bank, ATFBank in the Czech Republic and may not be used or relied upon by any other person for any purpose. Notice to Italian investors This document is not for distribution to retail clients as defined in article 26, paragraph 1(e) of Regulation n. 16190 approved by CONSOB on October 29, 2007. In the case of a short note, we invite the investors to read the related company report that can be found on UniCredit Research website www.research.unicreditgroup.eu. Notice to Russian investors As far as we are aware, not all of the financial instruments referred to in this analysis have been registered under the federal law of the Russian Federation “On the Securities Market” dated April 22, 1996, as amended, and are not being offered, sold, delivered or advertised in the Russian Federation. Notice to Turkish investors Investment information, comments and recommendations stated herein are not within the scope of investment advisory activities. Investment advisory services are provided in accordance with a contract of engagement on investment advisory services concluded with brokerage houses, portfolio management companies, non-deposit banks and the clients. Comments and recommendations stated herein rely on the individual opinions of the ones providing these comments and recommendations. These opinions may not suit your financial status, risk and return preferences. For this reason, to make an investment decision by relying solely on the information stated here may not result in consequences that meet your expectations. Notice to Investors in Japan This document does not constitute or form part of any offer for sale or subscription for or solicitation of any offer to buy or subscribe for any securities and neither this document nor any part of it shall form the basis of, or be relied on in connection with or act as an inducement to enter into, any contract or commitment whatsoever. Notice to UK investors This communication is directed only at clients of UniCredit Bank AG, UniCredit Bank AG London Branch, UniCredit Bank AG Vienna Branch, UniCredit Bank AG Milan Branch, UniCredit Securities, UniCredit Menkul Değerler A.Ş., UniCredit Bulbank, Zagrebačka banka, UniCredit Bank, Bank Pekao, Yapi Kredi, UniCredit Tiriac Bank, ATFBank in the Czech Republic who (i) have professional experience in matters relating to investments or (ii) are persons falling within Article 49(2)(a) to (d) (“high net worth companies, unincorporated associations, etc.”) of the United Kingdom Financial Services and Markets Act 2000 (Financial Promotion) Order 2005 or (iii) to whom it may otherwise lawfully be communicated (all such persons together being referred to as “relevant persons”). This communication must not be acted on or relied on by persons who are not relevant persons. Any investment or investment activity to which this communication relates is available only to relevant persons and will be engaged in only with relevant persons. Notice to U.S. investors This report is being furnished to U.S. recipients in reliance on Rule 15a-6 ("Rule 15a-6") under the U.S. Securities Exchange Act of 1934, as amended. Each U.S. recipient of this report represents and agrees, by virtue of its acceptance thereof, that it is such a "major U.S. institutional investor" (as such term is defined in Rule 15a-6) and that it understands the risks involved in executing transactions in such securities. Any U.S. recipient of this report that wishes to discuss or receive additional information regarding any security or issuer mentioned herein, or engage in any transaction to purchase or sell or solicit or offer the purchase or sale of such securities, should contact a registered representative of UniCredit Capital Markets, Inc. (“UCI Capital Markets”). Any transaction by U.S. persons (other than a registered U.S. broker-dealer or bank acting in a broker-dealer capacity) must be effected with or through UCI Capital Markets. The securities referred to in this report may not be registered under the U.S. Securities Act of 1933, as amended, and the issuer of such securities may not be subject to U.S. reporting and/or other requirements. Available information regarding the issuers of such securities may be limited, and such issuers may not be subject to the same auditing and reporting standards as U.S. issuers. The information contained in this report is intended solely for certain "major U.S. institutional investors" and may not be used or relied upon by any other person for any purpose. Such information is provided for informational purposes only and does not constitute a solicitation to buy or an offer to sell any securities under the Securities Act of 1933, as amended, or under any other U.S. federal or state securities laws, rules or regulations. The investment opportunities discussed in this report may be unsuitable for certain investors depending on their specific investment objectives, risk tolerance and financial position. In jurisdictions where UCI Capital Markets is not registered or licensed to trade in securities, commodities or other financial products, transactions may be executed only in accordance with applicable law and legislation, which may vary from jurisdiction to jurisdiction and which may require that a transaction be made in accordance with applicable exemptions from registration or licensing requirements. The information in this publication is based on carefully selected sources believed to be reliable, but UCI Capital Markets does not make any representation with respect to its completeness or accuracy. All opinions expressed herein reflect the author’s judgment at the original time of publication, without regard to the date on which you may receive such information, and are subject to change without notice. UCI Capital Markets may have issued other reports that are inconsistent with, and reach different conclusions from, the information presented in this report. These publications reflect the different assumptions, views and analytical methods of the analysts who prepared them. Past performance should not be taken as an indication or guarantee of future performance, and no representation or warranty, express or implied, is provided in relation to future performance. UCI Capital Markets and any company affiliated with it may, with respect to any securities discussed herein: (a) take a long or short position and buy or sell such securities; (b) act as investment and/or commercial bankers for issuers of such securities; (c) act as market makers for such securities; (d) serve on the board of any issuer of such securities; and (e) act as paid consultant or advisor to any issuer. The information contained herein may include forward-looking statements within the meaning of U.S. federal securities laws that are subject to risks and uncertainties. Factors that could cause a company’s actual results and financial condition to differ from expectations include, without limitation: political uncertainty, changes in general economic conditions that adversely affect the level of demand for the company’s products or services, changes in foreign exchange markets, changes in international and domestic financial markets and in the competitive environment, and other factors relating to the foregoing. All forward-looking statements contained in this report are qualified in their entirety by this cautionary statement This document may not be distributed in Canada or Australia.
30 July 2010 Economics & FI/FX Research
Curves & Crosses
UniCredit Research page 41
UniCredit Research* Thorsten Weinelt, CFA Global Head of Research & Chief Strategist +49 89 378-15110 [email protected]
Dr. Ingo Heimig Head of Research Operations +49 89 378-13952 [email protected]
Economics & FI/FX Research
Marco Annunziata, Ph.D., Chief Economist +44 20 7826-1770 [email protected]
Economics & Commodity Research Global Economics Dr. Davide Stroppa, Global Economist +39 02 8862-2890 [email protected]
European Economics Andreas Rees, Chief German Economist +49 89 378-12576 [email protected]
Marco Valli, Chief Italian Economist +39 02 8862-8688 [email protected]
Stefan Bruckbauer, Chief Austrian Economist +43 50505 41951 [email protected]
Tullia Bucco +39 02 8862-2079 [email protected]
Chiara Corsa +39 02 8862-2209 [email protected]
Dr. Loredana Federico +39 02 8862-3180 [email protected]
Alexander Koch, CFA +49 89 378-13013 [email protected]
Chiara Silvestre [email protected]
US Economics Dr. Harm Bandholz, CFA +1 212 672 5957 [email protected]
Commodity Research Jochen Hitzfeld +49 89 378-18709 [email protected]
Nikolaus Keis +49 89 378-12560 [email protected]
EEMEA Economics & FI/FX Strategy Cevdet Akcay, Ph.D., Chief Economist, Turkey +90 212 319-8430, [email protected]
Matteo Ferrazzi, Economist, EEMEA +39 02 8862-8600, [email protected]
Dmitry Gourov, Economist, EEMEA +43 50505 823-64, [email protected]
Hans Holzhacker, Chief Economist, Kazakhstan +7 727 244-1463, [email protected]
Marcin Mrowiec, Chief Economist, Poland +48 22 656-0678, [email protected]
Vladimir Osakovsky, Ph.D., Head of Strategy and Research, Russia +7 495 258-7258 ext.7558, [email protected]
Rozália Pál, Ph.D., Chief Economist, Romania +40 21 203-2376, [email protected]
Kristofor Pavlov, Chief Economist, Bulgaria +359 2 9269-390, [email protected]
Goran Šaravanja, Chief Economist, Croatia +385 1 6006-678, [email protected]
Pavel Sobisek, Chief Economist, Czech Republic +420 2 211-12504, [email protected]
Gyula Toth, Head of EEMEA FI/FX Strategy +43 50505 823-62, [email protected]
Jan Toth, Chief Economist, Slovakia +421 2 4950-2267, [email protected]
Global FI/FX Strategy Michael Rottmann, Head +49 89 378-15121, [email protected]
Dr. Luca Cazzulani, Deputy Head, FI Strategy +39 02 8862-0640, [email protected]
Chiara Cremonesi, FI Strategy +44 20 7826-1771, [email protected]
Elia Lattuga, FI Strategy +39 02 8862-2027, [email protected]
Dr. Stephan Maier, FX Strategy +39 02 8862-8604, [email protected]
Armin Mekelburg, FX Strategy +49 89 378-14307, [email protected]
Roberto Mialich, FX Strategy +39 02 8862-0658, [email protected]
Kornelius Purps, FI Strategy +49 89 378-12753, [email protected]
Herbert Stocker, Technical Analysis +49 89 378-14305, [email protected]
Publication Address
UniCredit Research Corporate & Investment Banking UniCredit Bank AG Milan Branch Economics & FI/FX Research Via Tommaso Grossi, 10 - 20121 Milan Tel +39 02 8862.2019 - Fax +39 02 8862.2585
Bloomberg UCGR Internet www.research.unicreditgroup.eu
* UniCredit Research is the joint research department of UniCredit Bank AG (UniCredit Bank), UniCredit CAIB Group (UniCredit CAIB), UniCredit Securities (UniCredit Securities),
UniCredit Menkul Değerler A.Ş. (UniCredit Menkul), UniCredit Bulbank, Zagrebačka banka, UniCredit Bank, Bank Pekao, Yapi Kredi, UniCredit Tiriac Bank and ATFBank.


![I BREAKTHROUGH [Break Through] TBREAKTHROUGHJ](https://img.pdfslide.net/doc/110x75/6202f18ea5d63448b1532943/i-breakthrough-break-through-tbreakthroughj-.jpg)