Embed Size (px)
Citation preview
1
A SUPPLY CHAIN ANALYSIS OF INDIGENOUS CHICKENS AND EGGS IN DOWA
DISTRICT
ADIJA W. MASAMBO
A PROJECT REPORT SUBMITTED TO THE FACULTY OF AGRICULTURE IN PARTIAL FULFILLMENT OF THE
REQUIREMENTS OF THE DEGREE OF BACHELOR OF SCIENCE IN ANIMAL SCIENCE
Lilongwe University of Agriculture and Natural Resources
Bunda Campus
P.O. Box 219
Lilongwe
JULY, 2017
i
APPROVAL
We certify that the material presented in this research is a result of ADIJA W. MASAMBO’s own
work and that it has not been submitted for any award at any tertiary institution.
This research is submitted with our approval,
SUPERVISOR :………………………………………………………………..
DR. A. C. L. SAFALAOH
DATE :………………………………………………………………...
HEAD OF DEPARTMENT :……………………………………………………………….
DR. L. J. BANDA
DATE :………………………………………………………………..
DEAN OF FACULTY :……………………………………………………………….
DR. P. KUMAMBALA
DATE :……………………………………………………………….
ii
DECLARATION
This is to declare that the work presented in this project report is that of my own and I have not
submitted previously to the Lilongwe University of Agriculture and Natural Resources or any
establishment for a degree. All other sources of information have been acknowledged by means of
references.
SIGNED :
ADIJA W. MASAMBO
DATE :
iii
DEDICATION
I would like to firstly dedicate this project to God Almighty whom has given me the wisdom,
strength and capability to carry out this work, to my late father, Edwin W. Masambo, my mother
Catherine F. Chisala-Masambo who has encouraged me throughout the way, spiritually,
emotionally and physically and my siblings whom I look up to and am encouraged to achieve more
than I can, thank you all and God bless.
iv
ACKNOWLEDGEMENTS
I would like to acknowledge my supervisor Associate Professor A.C.L. Safalaoh for his support
for this work, without which this paper would not materialize. I would also like to recognize the
Lilongwe University of Agriculture and Natural Resources (LUANAR) in coordination with the
Animal Science Department for funding this research project as well as the Head of Animal
Science, Dr. L.J. Banda as a female figure. Finally, I would like to specifically acknowledge the
contribution of Dr. P. Boland, the Mponela AEDC, Mr. D.S Musukwa and AVO Mr. L.M Banda
for their important roles played in site selection and data collection.
v
TABLE OF CONTENTS
APPROVAL ............................................................................................................................... i
DECLARATION ....................................................................................................................... ii
DEDICATION .......................................................................................................................... iii
ACKNOWLEDGEMENTS....................................................................................................... iv
TABLE OF CONTENTS ............................................................................................................v
LIST OF TABLES ................................................................................................................... vii
LIST OF FIGURES ................................................................................................................ viii
LIST OF ACRONYMS AND ABBREVIATIONS ................................................................... ix
ABSTRACT ...............................................................................................................................x
1.0 INTRODUCTION ............................................................................................................1
1.1 Poultry Production System .................................................................................................1
1.2 Poultry Marketing ..............................................................................................................2
1.3 Value Chain Analysis ........................................................................................................3
1.4 Problem Statement and Justification...................................................................................5
1.5 Research Objectives ...........................................................................................................6
1.5.1 General objective.........................................................................................................6
1.5.2 Specific objectives .......................................................................................................6
2.0 LITERATURE REVIEW .................................................................................................7
3.0 METHODOLOGY ...........................................................................................................9
3.1 Study Location and Period .................................................................................................9
3.2 Sampling Procedure ...........................................................................................................9
3.3 Limitations ........................................................................................................................9
4.0 RESULTS ........................................................................................................................... 11
4.1 Main Actors, Roles and Functions within the Production Supply Chain ........................... 11
4.2 Vaccinations .................................................................................................................... 16
4.3 To Assess the Profitability of Various Participants along the Supply Chain ...................... 17
4.3.1 Profitability analysis .................................................................................................. 17
4.4 To Identify Challenges Faced by the Participants within the Supply Chain....................... 22
4.4.1 Challenges faced ....................................................................................................... 22
vi
5.0 DISCUSSION ................................................................................................................ 25
5.1 Contribution to Research ................................................................................................. 25
5.1.1 Production systems .................................................................................................... 25
5.1.2 Marketing systems..................................................................................................... 26
5.1.3 Transactions .............................................................................................................. 27
5.1.4 Farmer transactions ................................................................................................... 27
5.1.5 Vendor transactions ................................................................................................... 28
5.1.6 Restaurant transactions .............................................................................................. 28
6.0 CONCLUSION .............................................................................................................. 30
7.0 RECOMMENDATIONS ................................................................................................ 32
7.1 Proper Marketing Structure .............................................................................................. 32
7.2 Improve Existing Technologies ........................................................................................ 32
7.3 Active Lead Farmers ........................................................................................................ 33
7.4 Project Site Selection .................................................................................................. 33
7.5 Financial Restraint ...................................................................................................... 33
8.0 REFERENCES ............................................................................................................... 34
APPENDICES ................................................................................................................ 37
vii
LIST OF TABLES
Table 1: Performance requirements and risks of each target group............................................. 13
Table 2: Rewards of the groups ................................................................................................. 14
Table 3: Annual summary of farmers' gross margin analysis ..................................................... 18
Table 4: Annual summary of vendors' gross margin analysis ..................................................... 19
Table 5: Annual summary of value addition vendors' gross margin analysis .............................. 21
Table 6: Annual summary of restaurant gross margin analysis ................................................... 22
Table 7: Project Work Timeframe ............................................................................................. 58
Table 8: Estimated Project Budget ............................................................................................ 59
viii
LIST OF FIGURES
Figure 1: Poultry production structure model, Source: Thwala, (2011) ........................................2
Figure 2: Local chicken industry value chain mapping ................................................................3
Figure 3: Sample size of different participants ........................................................................... 12
Figure 4: Farmer chicken census ............................................................................................... 15
Figure 5: Farmer responses to egg sales ..................................................................................... 15
Figure 6: Farmer Vaccinations .................................................................................................. 16
Figure 7: Types of vaccines ....................................................................................................... 17
Figure 8: Various value additions .............................................................................................. 19
Figure 9: Farmer challenges ...................................................................................................... 23
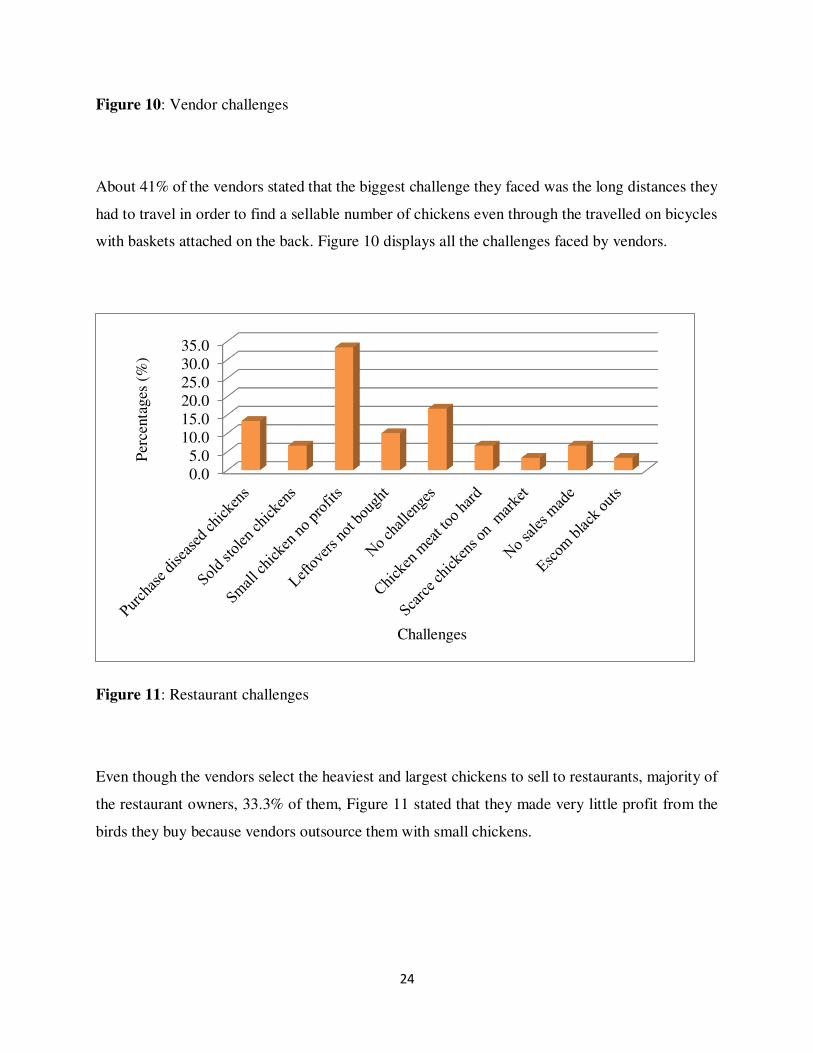
Figure 10: Vendor challenges .................................................................................................... 24
Figure 11: Restaurant challenges ............................................................................................... 24
ix
LIST OF ACRONYMS AND ABBREVIATIONS
AVO Assistant Veterinarian Officer
EPA Extension Project Area
GOM Government of Malawi
GMA Gross Margin Analysis
HH House hold
PRA Participatory Rural Appraisal
RDP Rural Development Project
SPSS Statistical Product for Services and Solutions
ND Newcastle Disease
x
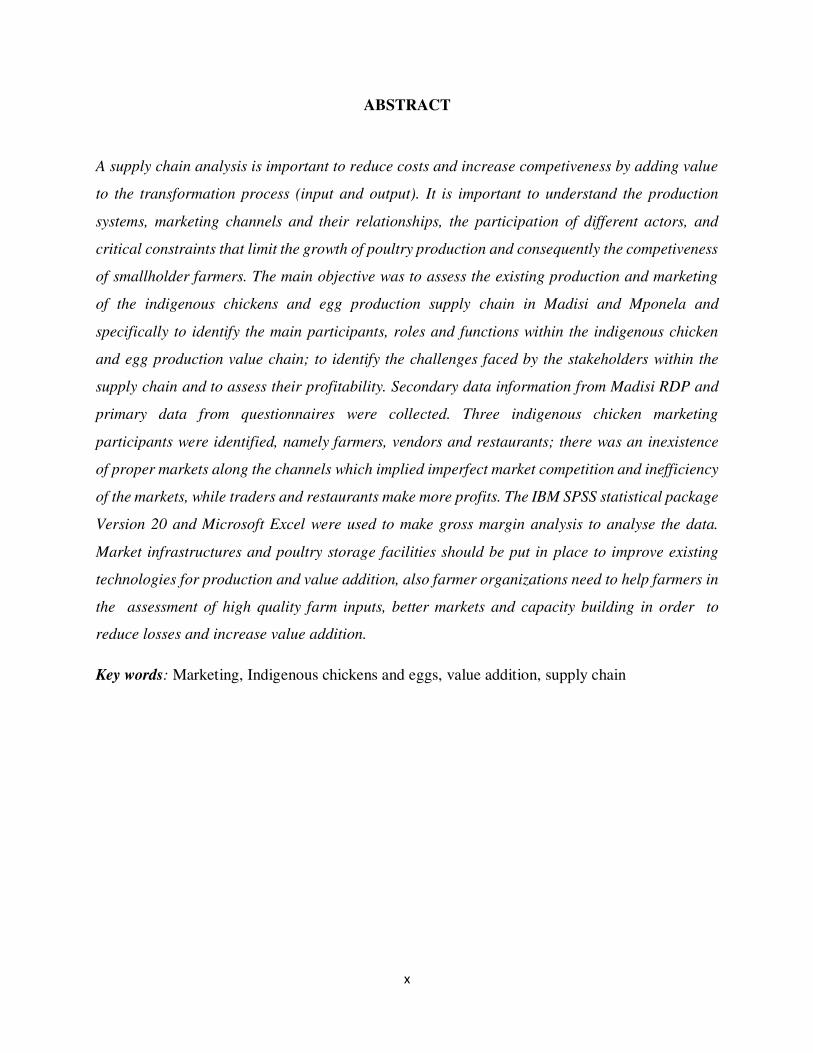
ABSTRACT
A supply chain analysis is important to reduce costs and increase competiveness by adding value
to the transformation process (input and output). It is important to understand the production
systems, marketing channels and their relationships, the participation of different actors, and
critical constraints that limit the growth of poultry production and consequently the competiveness
of smallholder farmers. The main objective was to assess the existing production and marketing
of the indigenous chickens and egg production supply chain in Madisi and Mponela and
specifically to identify the main participants, roles and functions within the indigenous chicken
and egg production value chain; to identify the challenges faced by the stakeholders within the
supply chain and to assess their profitability. Secondary data information from Madisi RDP and
primary data from questionnaires were collected. Three indigenous chicken marketing
participants were identified, namely farmers, vendors and restaurants; there was an inexistence
of proper markets along the channels which implied imperfect market competition and inefficiency
of the markets, while traders and restaurants make more profits. The IBM SPSS statistical package
Version 20 and Microsoft Excel were used to make gross margin analysis to analyse the data.
Market infrastructures and poultry storage facilities should be put in place to improve existing
technologies for production and value addition, also farmer organizations need to help farmers in
the assessment of high quality farm inputs, better markets and capacity building in order to
reduce losses and increase value addition.
Key words: Marketing, Indigenous chickens and eggs, value addition, supply chain
1
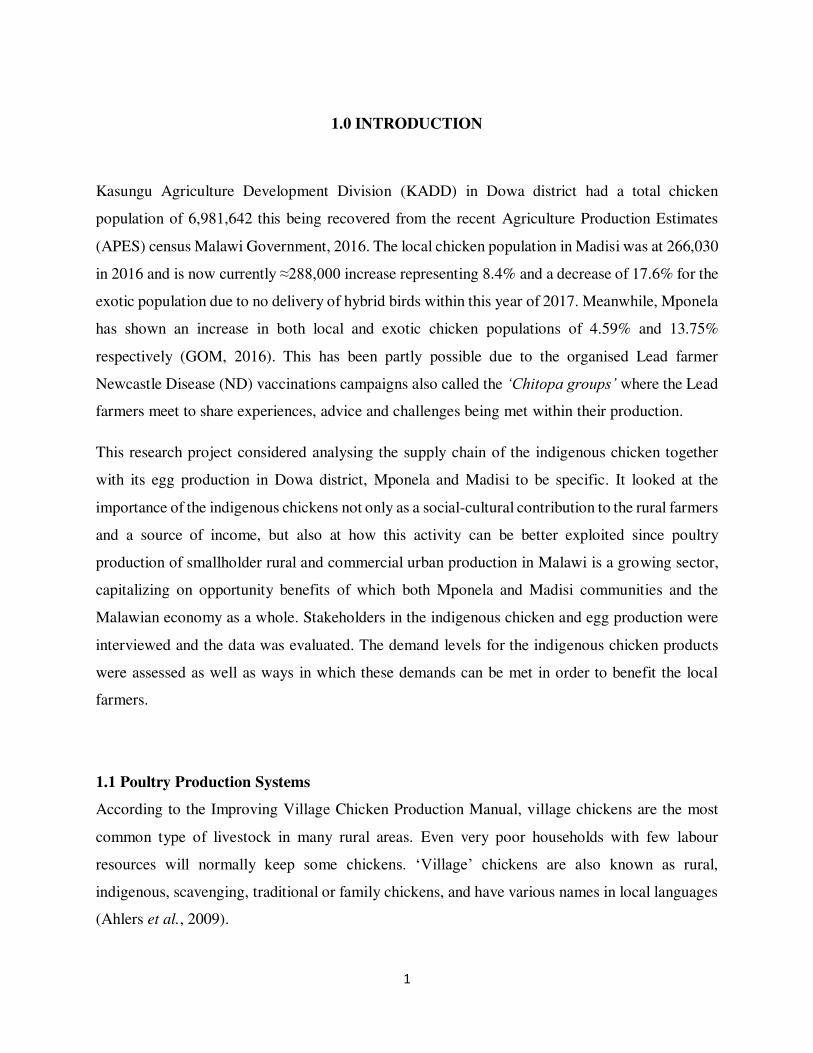
1.0 INTRODUCTION
Kasungu Agriculture Development Division (KADD) in Dowa district had a total chicken
population of 6,981,642 this being recovered from the recent Agriculture Production Estimates
(APES) census Malawi Government, 2016. The local chicken population in Madisi was at 266,030
in 2016 and is now currently ≈288,000 increase representing 8.4% and a decrease of 17.6% for the
exotic population due to no delivery of hybrid birds within this year of 2017. Meanwhile, Mponela
has shown an increase in both local and exotic chicken populations of 4.59% and 13.75%
respectively (GOM, 2016). This has been partly possible due to the organised Lead farmer
Newcastle Disease (ND) vaccinations campaigns also called the ‘Chitopa groups’ where the Lead
farmers meet to share experiences, advice and challenges being met within their production.
This research project considered analysing the supply chain of the indigenous chicken together
with its egg production in Dowa district, Mponela and Madisi to be specific. It looked at the
importance of the indigenous chickens not only as a social-cultural contribution to the rural farmers
and a source of income, but also at how this activity can be better exploited since poultry
production of smallholder rural and commercial urban production in Malawi is a growing sector,
capitalizing on opportunity benefits of which both Mponela and Madisi communities and the
Malawian economy as a whole. Stakeholders in the indigenous chicken and egg production were
interviewed and the data was evaluated. The demand levels for the indigenous chicken products
were assessed as well as ways in which these demands can be met in order to benefit the local
farmers.
1.1 Poultry Production Systems
According to the Improving Village Chicken Production Manual, village chickens are the most
common type of livestock in many rural areas. Even very poor households with few labour
resources will normally keep some chickens. ‘Village’ chickens are also known as rural,
indigenous, scavenging, traditional or family chickens, and have various names in local languages
(Ahlers et al., 2009).
2
Poultry keeping is practiced by many Malawians most of which are the indigenous breeds in
backyards and a source of meat protein, eggs and for social cultural uses.
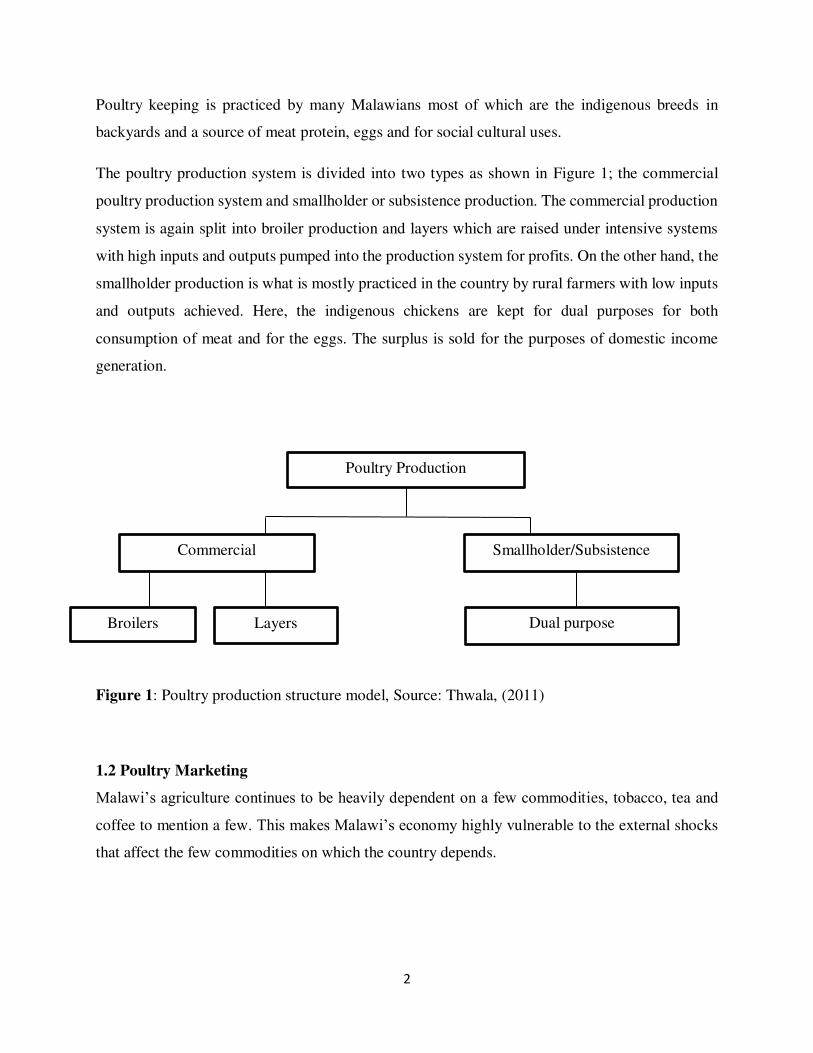
The poultry production system is divided into two types as shown in Figure 1; the commercial
poultry production system and smallholder or subsistence production. The commercial production
system is again split into broiler production and layers which are raised under intensive systems
with high inputs and outputs pumped into the production system for profits. On the other hand, the
smallholder production is what is mostly practiced in the country by rural farmers with low inputs
and outputs achieved. Here, the indigenous chickens are kept for dual purposes for both
consumption of meat and for the eggs. The surplus is sold for the purposes of domestic income
generation.
Figure 1: Poultry production structure model, Source: Thwala, (2011)
1.2 Poultry Marketing
Malawi’s agriculture continues to be heavily dependent on a few commodities, tobacco, tea and
coffee to mention a few. This makes Malawi’s economy highly vulnerable to the external shocks
that affect the few commodities on which the country depends.
Poultry Production
Smallholder/Subsistence Commercial
Broilers Layers Dual purpose
3
There is a critical need for Malawi to diversify its agricultural commodity basket, primarily
through implementation of strategies aimed at promoting productivity and competitiveness of the
smallholder farmers who comprise over 90% of the country’s farming population (Dzanja, et al.,
2013).
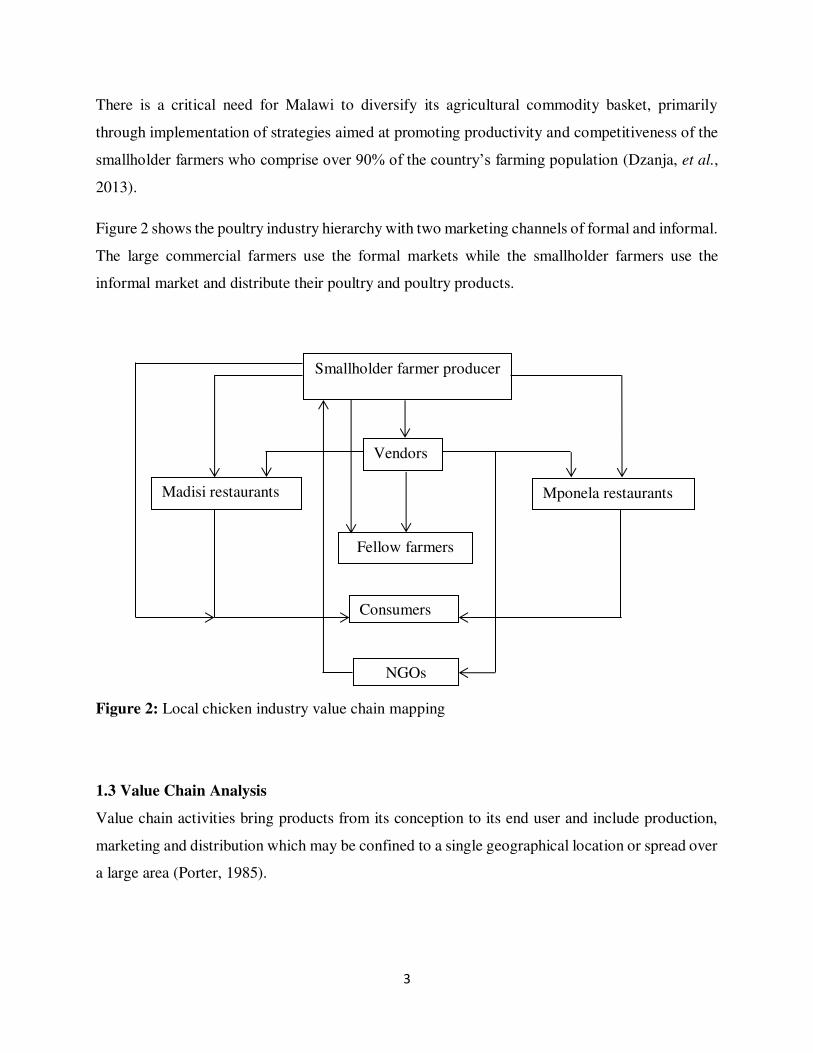
Figure 2 shows the poultry industry hierarchy with two marketing channels of formal and informal.
The large commercial farmers use the formal markets while the smallholder farmers use the
informal market and distribute their poultry and poultry products.
Figure 2: Local chicken industry value chain mapping
1.3 Value Chain Analysis
Value chain activities bring products from its conception to its end user and include production,
marketing and distribution which may be confined to a single geographical location or spread over
a large area (Porter, 1985).
Smallholder farmer producer
Madisi restaurants
Fellow farmers
Mponela restaurants
Vendors
Consumers
NGOs
4
Value Chain analysis is essential to understand the production system, marketing channels and
their relationships, the participation of different stakeholders, and the critical constraints that limit
the growth of poultry production and consequently the competitiveness of smallholder farmers.
In the case of the Dowa farmers, are currently to capitalize on the indigenous chicken ventures as
a result undercutting their returns and gains which directly impact their social economic status,
thus wellbeing. The farmers assume the greatest risk but recap the least rewards. According to
Rota (2009) in theory, risk and rewards should be shared down the chain source.
5
1.4 Problem Statement and Justification
Farmers lack knowledge, expertise and resources to capitalize on their venture of indigenous
chickens and eggs farming, since there is no clear understanding of the roles of each of the
stakeholders, their functions as well as the challenges faced by each of the stakeholders.
Subsequently profits being made from the transactions are not clearly defined.
It has been observed that more people prefer the flavourful local chicken as opposed to the broiler
chicken, thereby making the local chicken more marketable. Although some farmers have
organised themselves into Chitopa groups, mainly the Lead farmers, these farmers are failing to
sell their chicken and chicken products effectively in order to make profits due to a narrow
customer base which is mostly comprised of vendors who tend to haggle and usually dictate prices
especially in the seasons when farmers need money to buy farm inputs.
The project also looked at how value addition strategies can be done for the rural farmer to achieve
higher and possibly frequent profits through further processing of the indigenous chickens and
chicken products thereby increasing their marketing skills, customer base as well as proper general
management practices.
To justify these problems, the major constraints in rural chicken marketing were identified as low
prices (72.0% of the respondents), low marketable output (57.3% of respondents) and long
distances to reliable markets (26.6% of the respondents) (Gausi, 2003). According to an article on
www.wattagnet.com, Bill Gates started an initiative to supply impoverished people in sub-Saharan
Africa with chickens. In this article it was established that chickens provide a good return on
investment with a sale price of $5 (MK3,550) per chicken (the standard in West Africa), a producer
can earn more than $1,000 (MK710,000) a year, versus the extreme poverty line of about $700
(MK497,000) per year (http://www.wattagnet.com/articles, 2016).
More civic education on local chicken supply chain and marketing techniques can assist various
stakeholders in the formulation of pro-poor policies in as far as poultry production is concerned.
There is also a gap in this area of research.
This justification is linked to fulfilling the overall government goal which is to contribute towards
improve households, national food security and poverty reduction through sustainable private
sector and farmer demand driven service.
6
1.5 Research Objectives
This research firstly assessed the indigenous chicken population with rural farmers in the district,
as well as the management practices and the value chain participation. The study also looked at all
the stages of the value chain from producer to the consumer. It also tried to identify the main
participants in the value addition of the indigenous chicken, which were used to trying to achieve
better selling prices. It also looked into possibilities of creating marketing platforms as well as
tackling the challenges that the farmers are facing in light of selling their products.
1.5.1 General objective
The overall object for this research study was;
To assess the existing production and marketing systems of indigenous chicken and eggs supply
chain in Dowa district.
1.5.2 Specific objectives
The specific objectives of the research were;
1. To identify the main participants, roles and functions within the indigenous chicken meat
and egg production value chain
2. To assess the profitability of various participants along the supply chain
3. To identify the challenges faced by actors within the supply chain
7
2.0 LITERATURE REVIEW
The main research areas of interest are in the overall production of the indigenous chicken more
especially how they are marketed and the supply chain analysis. Poultry production consists of
smallholder rural and commercial urban production in Malawi. The rural poultry sector forms the
largest component with more than 80% of the poultry population, with an even faster production
rate in commercial birds in terms of meat production. Chickens constitute the majority (83%)
(Gondwe, 2004). Rural poultry in particular chickens are widely and equitably distributed among
households that even the marginalized in society own them (Gondwe, 2004). Rural poultry is an
important element in diversifying agricultural production and increasing household security
(Kitalyi, 1998). As such this literature encompasses Malawi’s indigenous chicken farming, it
substitutes the existence of poor supply chain in Dowa district. The phenomenological ideology
here attempts to match the supporting literature with the knowledge of the supply chain analysis,
which benefits the stakeholders of the indigenous chicken farming venture in Dowa district.
Local chickens offer a broad spectrum of uses to the majority of Malawians (Gondwe, 2004). In
most rural households, the indigenous chicken also provides a source of income and plays an
important role in several socio-cultural functions such as weddings, funerals, payments for court
fines, traditional medical treatments and other services (Gausi, 2003). Rural poultry can therefore
be used to empower and or marginalize groups socially and economically (Gondwe, 2004).
Despite a number of important roles it plays, the productivity of indigenous chickens has remained
low (Gausi, 2003). Evidence is seen from low consumption figures estimated at 0.87kgs per person
per annum for eggs and 1.13kg per person per annum for poultry meat (GOM, 1999). The average
diet of an average Malawian contains over 95% carbohydrates and fiber and only 5% protein. Of
the 5% protein the greater part 4-4.5% is of plant origin and only 1% or even less of the entire diet
comprises of animal protein of which the greater part is from fish. This is because fish is relatively
cheaper and readily available compared to the other animal protein sources (Kampeni, 1998).
Additionally, productive performance of indigenous chickens has been characterized by slow
growth rates, small body size and low hatchability (Safalaoh, 1997); low egg production averaging
40 eggs per annum and high mortality of up to 90% due to Newcastle Disease (GOM, 1999).
8
Despite the many attempts from Government and other supporting stakeholders to try and support
the poultry industry through pass-on programs, vaccinations and other such programs, the
marketing aspect still suffers a great deal. Lack of an organized poultry marketing system has
contributed to poor performance of the poultry industry in the country (Mgwadira, 1988). A
Participatory Rural Appraisal (PRA) exercise affirmed that rural smallholder poultry farmers
recognize that lack of an organized poultry marketing system has an input on the poor performance
of the rural poultry industry (Haule and Jere, 2000).
About 53% of the population of Malawi subsists below the poverty line (CIA World Factbook,
2004). It is recognized that it is impossible to sustain development, in an economy like Malawi
where those in poverty constitute at least 60%, unless growth emanates from the poor and is based
on their rising productivity and income (Rotberg et al., 1994).
It was found that local chickens exist in both rural and urban areas, both sexes and various
phenotypes are sold. Marketing at village level takes place through cash and direct barter
transaction. Thereafter, marketing of local chickens is in cash and is controlled by middlemen.
Farmers sell chickens to obtain household needs, but middlemen operate to make profits and
reduce transaction costs. The study has established prices, transaction costs and profit margins of
the market chain from producer to consumer of local chickens at different levels. This information
could be utilized in valuing the local chicken genetic resources, guiding production and marketing
management interventions as well as developing breeding programs (Gondwe et al., 2005).
The research project looked at firstly bridging the farmer consumer gap in relation to what else the
farmer can do to the indigenous chicken and its products (value addition) to be able to have a better
market and selling prices. It also looked at exploring viable market strategies and platforms which
can lead to more income and better living standards.
9
3.0 METHODOLOGY
Questionnaires were used to collect data on the incidence of whom, when and how the rural
farmers sell their indigenous chickens and products. From the data collected, Statistical Product
for Services and Solutions (SPSS) Version 20, excel and gross margins were used to analyse the
data collected.
3.1 Study Location and Period
The research study was conducted in March, 2017 for a period of 2 weeks in Dowa District from
several Extension Project Areas (EPAs). First, a list of names and places was drawn based on
information that was provided by the Mponela Rural Development Project (RDP) office.
Secondary information on the areal poultry population distribution was also sought. Mponela RDP
has a total of six (6) EPAs, namely Mponela proper, Madisi EPA, Bowe EPA, Mndolela EPA,
Nambuma EPA, and Chiseko EPA. From these six EPAs, only three were randomly selected as a
sample size in order to carry out the research project, namely Madisi, Mponela and Chiseko EPAs.
3.2 Sampling Procedure
Semi-structured questionnaires were used to measure the incidence of whom, when and how the
rural farmers sell their indigenous chickens and products. The various actors were categorised as
follows; farmer – village based middlemen – town middlemen – and restaurants the direct
customers and roadside middlemen were not interviewed due to limited time and resources which
were also found on the ground.
A total number of 82 survey questionnaires were conducted through random sampling. The sample
came from 30 randomly selected farmers from the six EPAs, 22 available middlemen and then 30
randomly selected resort restaurants from within and around Dowa district.
3.3 Limitations
- Inadequate funds to fully explore all the value chain participants.

10
- The initial project site and objectives had to be changed due to the resistance of the vendors
to be interviewed.
- At the final study site, the sample size was not achieved due to there being three groups of
vendors, of which only the walk around vendors were interviewed. Market day and
roadside vendors were not due to financial restraint.
11
4.0 RESULTS
The information collected has undertaken a situation analysis thereby creating a baseline
understanding of producers, production performance, marketing, institutional and infrastructural
environment and support services for poultry value chain development.
Based on the respondents interviewed and observations, 70% of the farmers were male with an
age range of between 30 to 50 years. 90% were married in monogamy families and 93% carry out
farming as a source of income. As for the vendors, 86% were male of which 72% were married in
monogamy families and were in the age range of between 20 and 40 years. Then for the restaurant
respondents 10% were male, 83% married in monogamy families within the age range of 20 and
40 years old.
The relationships between the supply chain actors were determined from the descriptive primary
data which was collected. The statistical package used to analyze the data after it had been
collected is IMB SPSS statistical package Version 20 and Microsoft Excel, where gross margin
analysis has been used.
4.1 Main Actors, Roles and Functions within the Production Supply Chain
The actors identified in the supply chain analysis included the farmers who produced the chickens,
the vendors who sold chickens to different clientele and the restaurants who sold the processed
chicken as an end product. It was found that the vendors are far and few in comparison to the
populations of the farmers and restaurants, making it difficult to cross correlate in the gross margin
analysis.
12
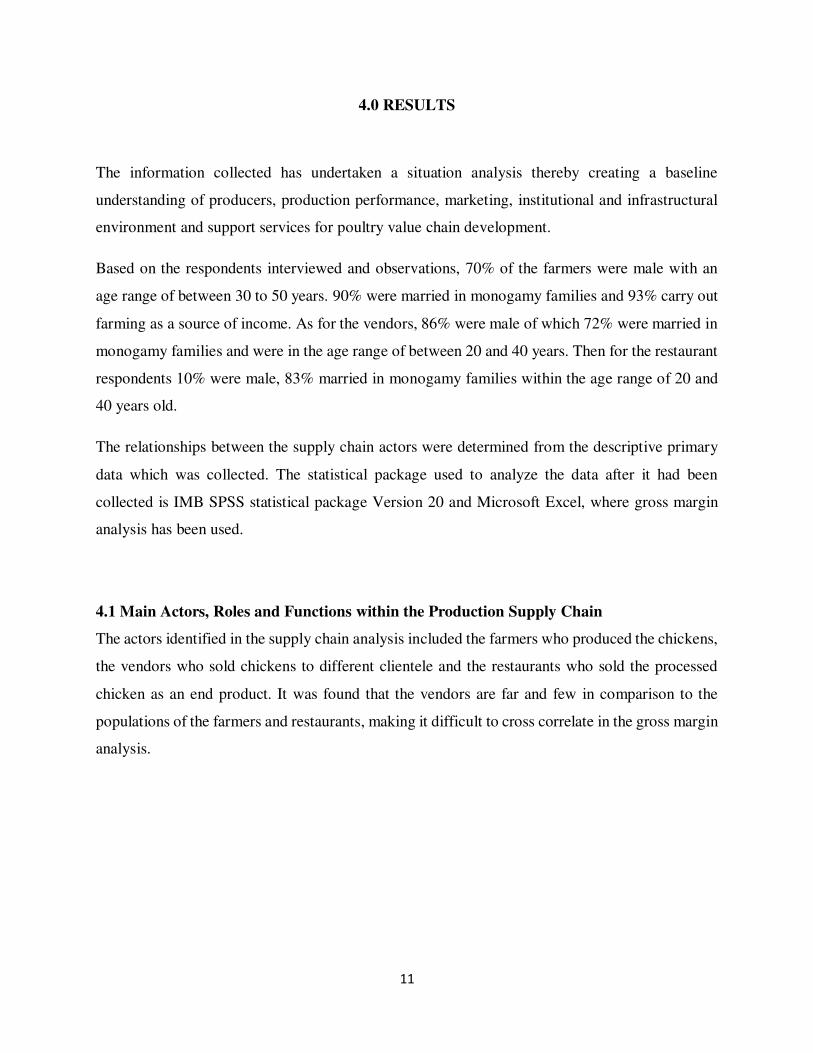
The total sample size in Figure 3 shows that the research ended up being a total of 82 participants
with only 27% (22) of the vendors who were found on the ground.
Figure 3: Sample size of different participants
Farmers30
Vendors22
Restaurants30
13
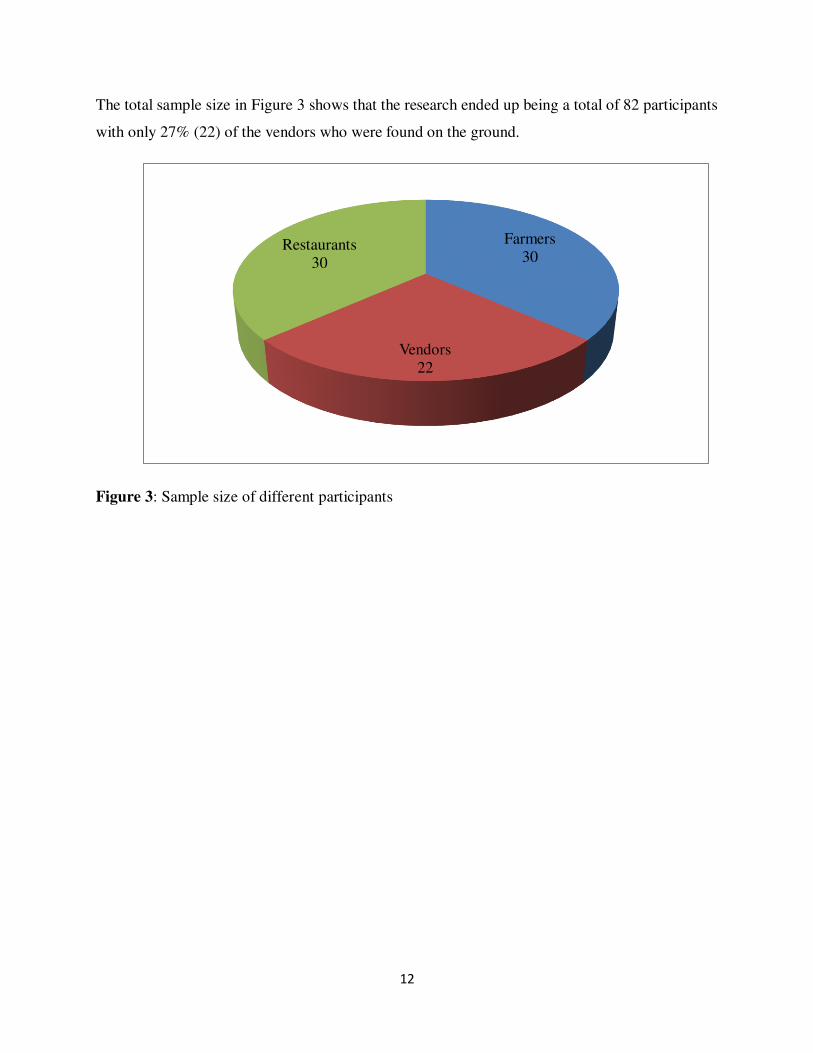
Table 1 shows the three different participants which were found on the ground and interviewed
with their performance requirements with expectations in their transactions and the reality on the
ground including the risks which they face.
Table 1: Performance requirements and risks of each target group
Participants Expectations Actual
Farmers To produce an adequate
number of large, healthy birds
and eggs suitable for
consumer use and
consumption
Small birds and populations raised, die from
diseases, poor lead farmer services, narrow
marketing base, losses due to poor selling prices
Vendors To transport large and many
birds from the villages and
distribute to consumers,
NGOs and restaurants
Transport small and few birds, death of chickens
in transit, not finding the targeted number of
chickens, losses due to poor buying and or
selling price
Restaurants To process chicken and eggs
into products which are
satisfactory to customers
Process small chickens and chicken products,
losses due to chickens size, losses to diseased
chickens, losses to power cuts, left overs
14
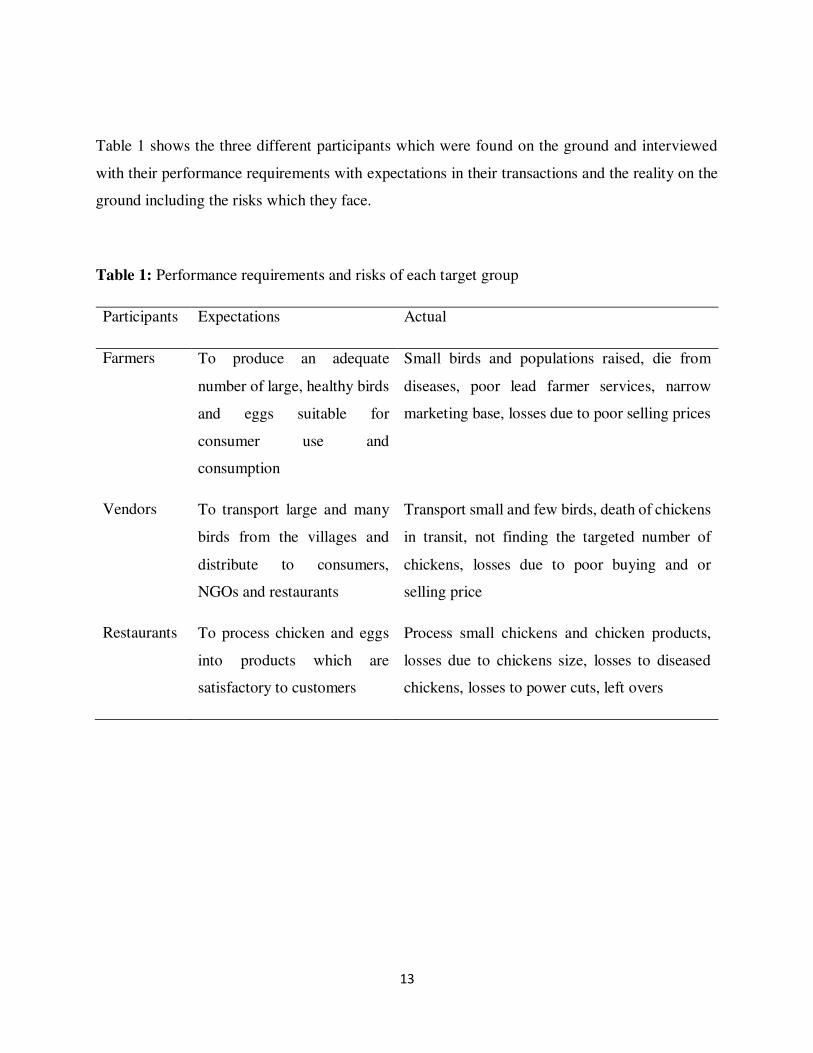
As shown in Table 2, it displays the rewards which each of the participants expect to achieve from
their indigenous poultry production in the supply chain.
Table 2: Rewards of the groups
Participants Actual
Farmers Improved production systems
High revenue and profit margins
Improved standard of living
Vendors High revenue and profit margins
Improved lifestyle
Improved transportation methods
Easy access of chicken and eggs
Restaurants High profits and revenue from chicken sells
High quality and quantity processed products
15
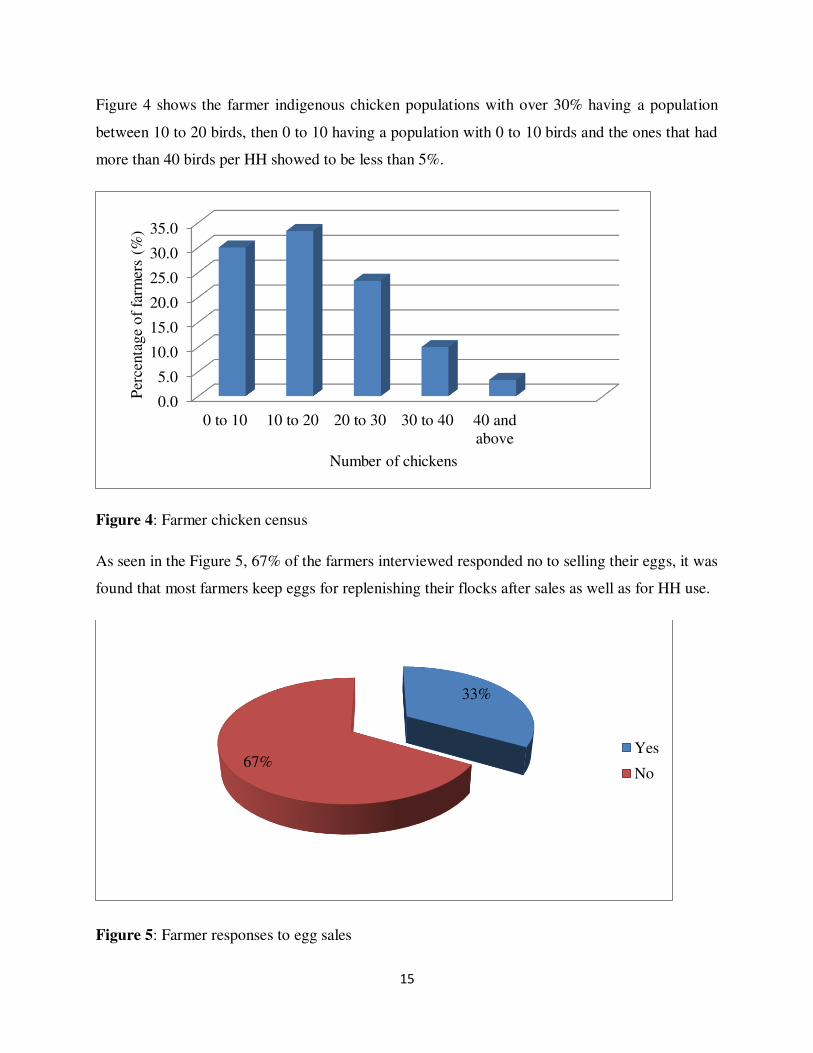
Figure 4 shows the farmer indigenous chicken populations with over 30% having a population
between 10 to 20 birds, then 0 to 10 having a population with 0 to 10 birds and the ones that had
more than 40 birds per HH showed to be less than 5%.
Figure 4: Farmer chicken census
As seen in the Figure 5, 67% of the farmers interviewed responded no to selling their eggs, it was
found that most farmers keep eggs for replenishing their flocks after sales as well as for HH use.
Figure 5: Farmer responses to egg sales
0.0
5.0
10.0
15.0
20.0
25.0
30.0
35.0
0 to 10 10 to 20 20 to 30 30 to 40 40 andabove
Per
centa
ge
of
farm
ers
(%)
Number of chickens
33%
67%Yes
No
16
4.2 Vaccinations
It was discovered that only a countable number of vendors used vaccination on their birds after
purchasing them from farmers to try and avoid flock death from NC disease. These are mostly
those that have huge tenders to sell to NGOs or other individual farmers seeking local chickens.
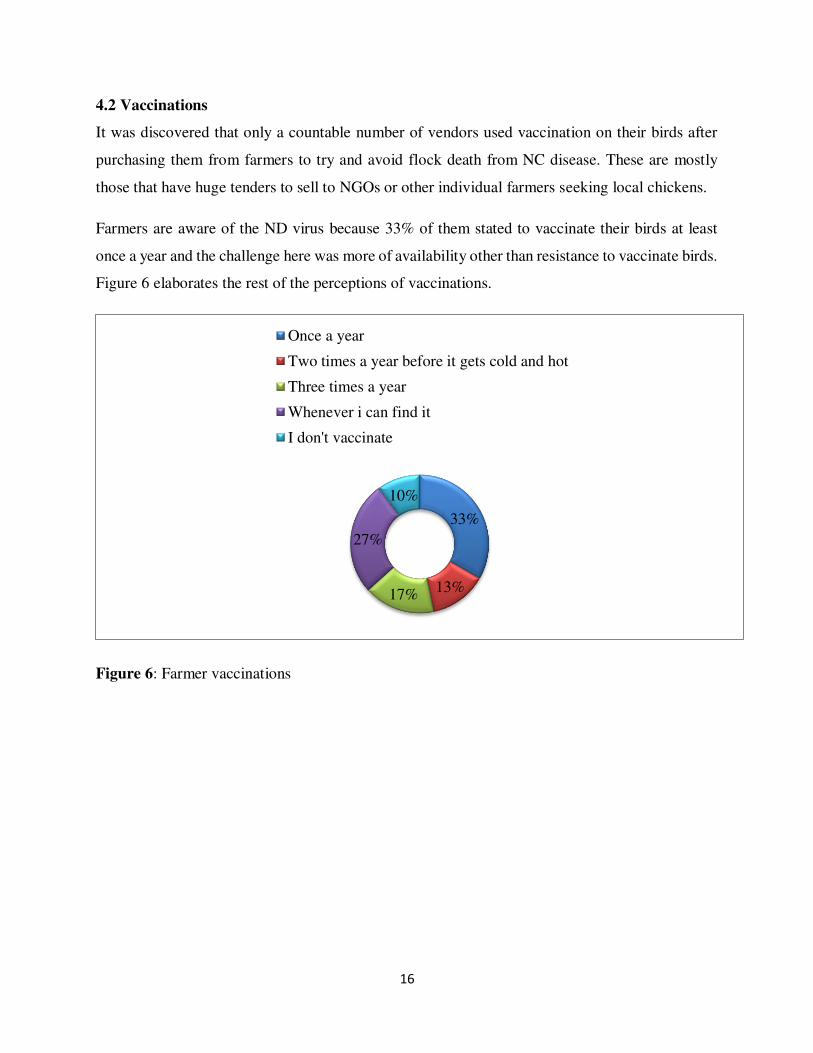
Farmers are aware of the ND virus because 33% of them stated to vaccinate their birds at least
once a year and the challenge here was more of availability other than resistance to vaccinate birds.
Figure 6 elaborates the rest of the perceptions of vaccinations.
Figure 6: Farmer vaccinations
33%
13%17%
27%
10%
Once a year
Two times a year before it gets cold and hot
Three times a year
Whenever i can find it
I don't vaccinate
17
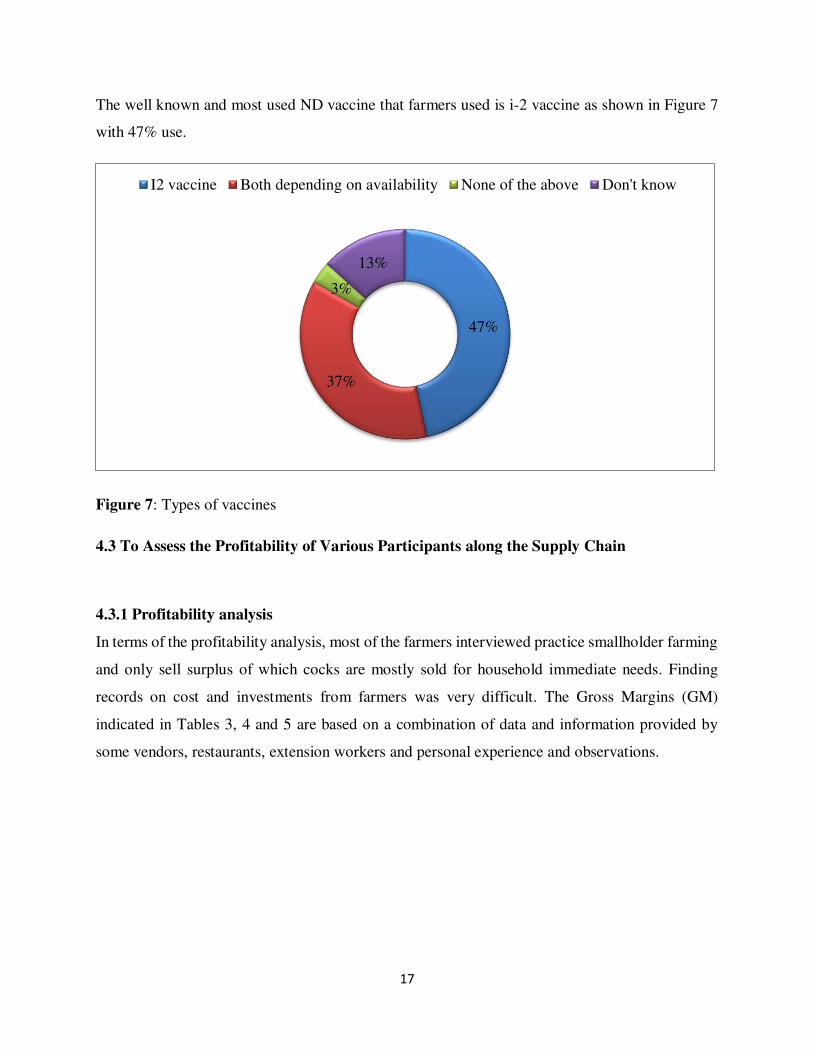
The well known and most used ND vaccine that farmers used is i-2 vaccine as shown in Figure 7
with 47% use.
Figure 7: Types of vaccines
4.3 To Assess the Profitability of Various Participants along the Supply Chain
4.3.1 Profitability analysis
In terms of the profitability analysis, most of the farmers interviewed practice smallholder farming
and only sell surplus of which cocks are mostly sold for household immediate needs. Finding
records on cost and investments from farmers was very difficult. The Gross Margins (GM)
indicated in Tables 3, 4 and 5 are based on a combination of data and information provided by
some vendors, restaurants, extension workers and personal experience and observations.
47%
37%
3%
13%
I2 vaccine Both depending on availability None of the above Don't know
18
Table 3: Annual summary of farmers' gross margin analysis
Gross income
22,876.12
Variable Costs
Vaccine
345.60
Feed
600.00
Transportation -
Family labour
1,500.00
Total Variable Costs
2,445.60
Gross Margin
20,430.52
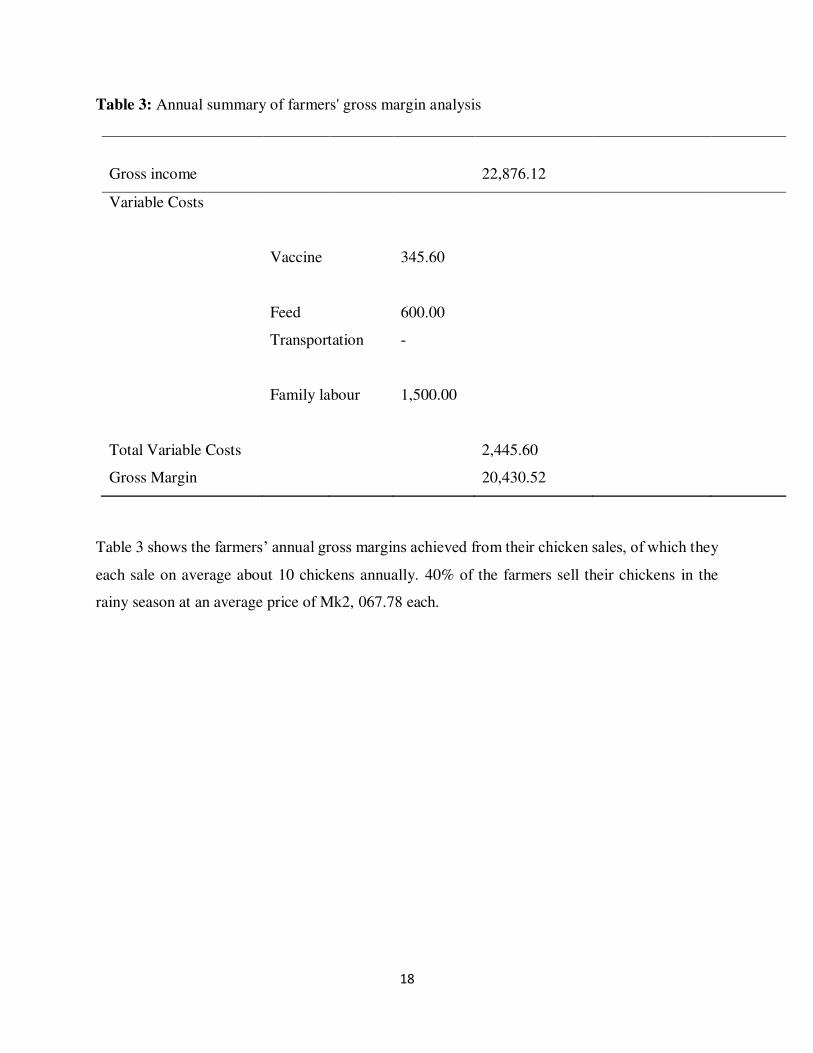
Table 3 shows the farmers’ annual gross margins achieved from their chicken sales, of which they
each sale on average about 10 chickens annually. 40% of the farmers sell their chickens in the
rainy season at an average price of Mk2, 067.78 each.
19
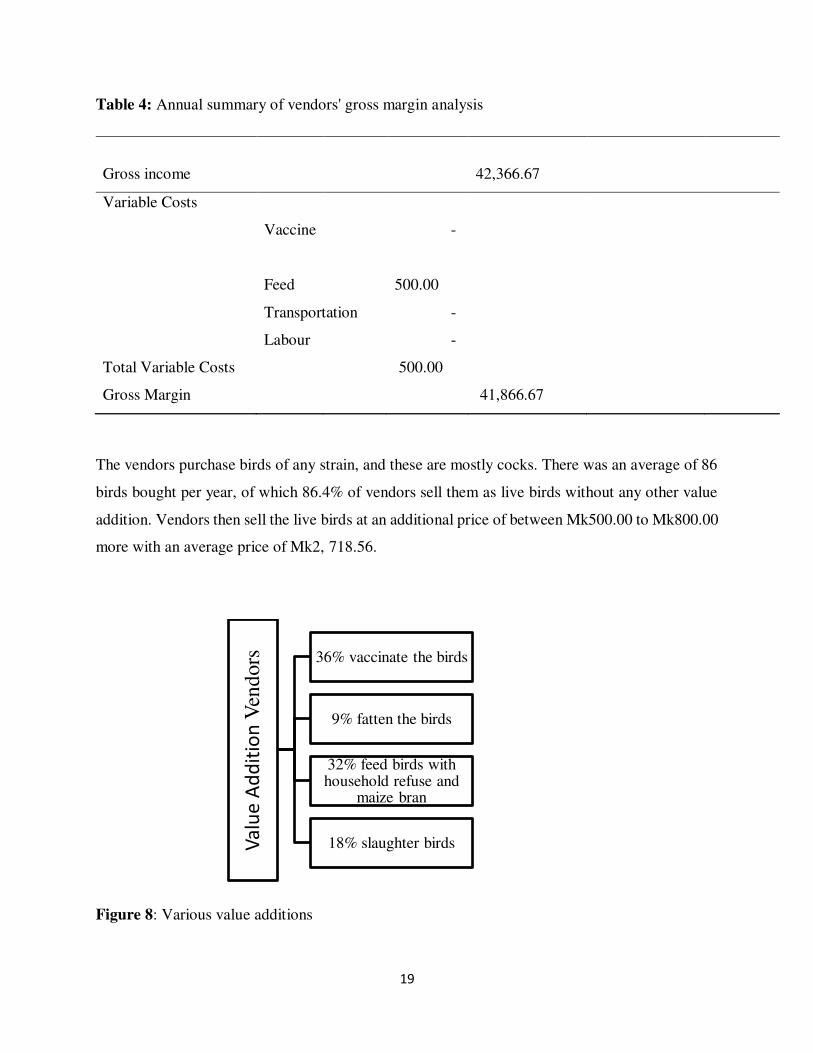
Table 4: Annual summary of vendors' gross margin analysis
Gross income
42,366.67
Variable Costs
Vaccine
-
Feed
500.00
Transportation -
Labour
-
Total Variable Costs 500.00
Gross Margin 41,866.67
The vendors purchase birds of any strain, and these are mostly cocks. There was an average of 86
birds bought per year, of which 86.4% of vendors sell them as live birds without any other value
addition. Vendors then sell the live birds at an additional price of between Mk500.00 to Mk800.00
more with an average price of Mk2, 718.56.
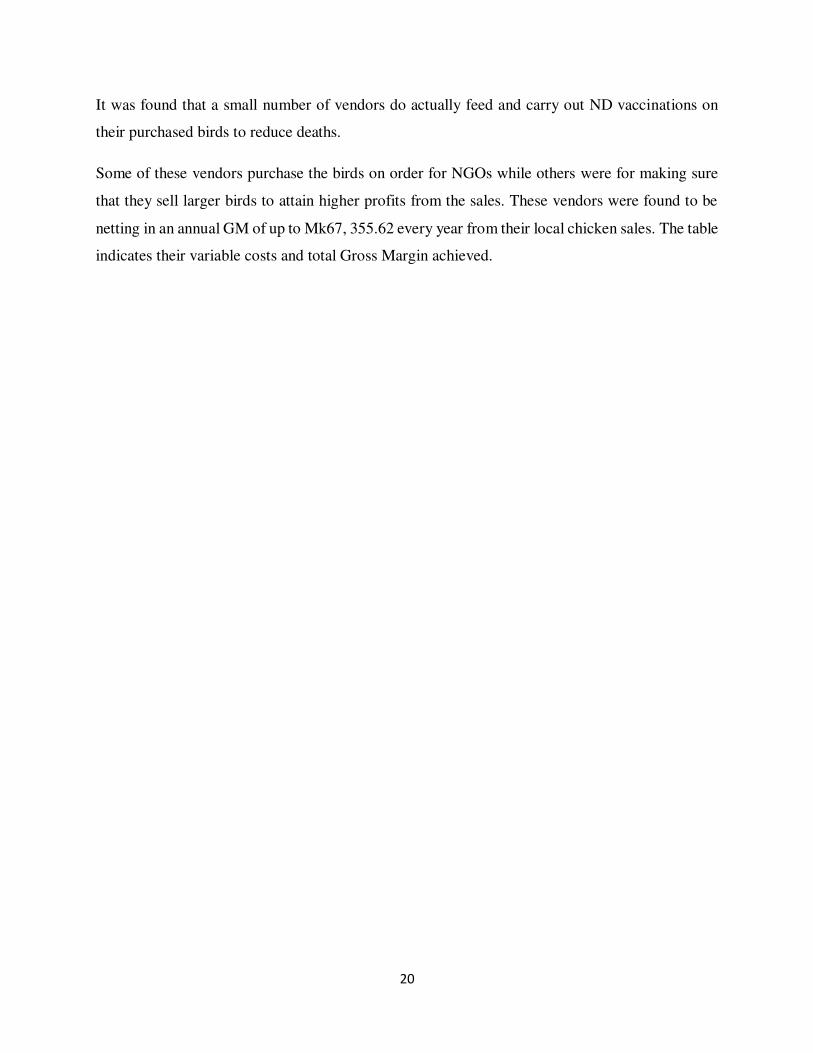
Figure 8: Various value additions
Va
lue
Ad
dit
ion
Ven
dors 36% vaccinate the birds
9% fatten the birds
32% feed birds with household refuse and
maize bran
18% slaughter birds
20
It was found that a small number of vendors do actually feed and carry out ND vaccinations on
their purchased birds to reduce deaths.
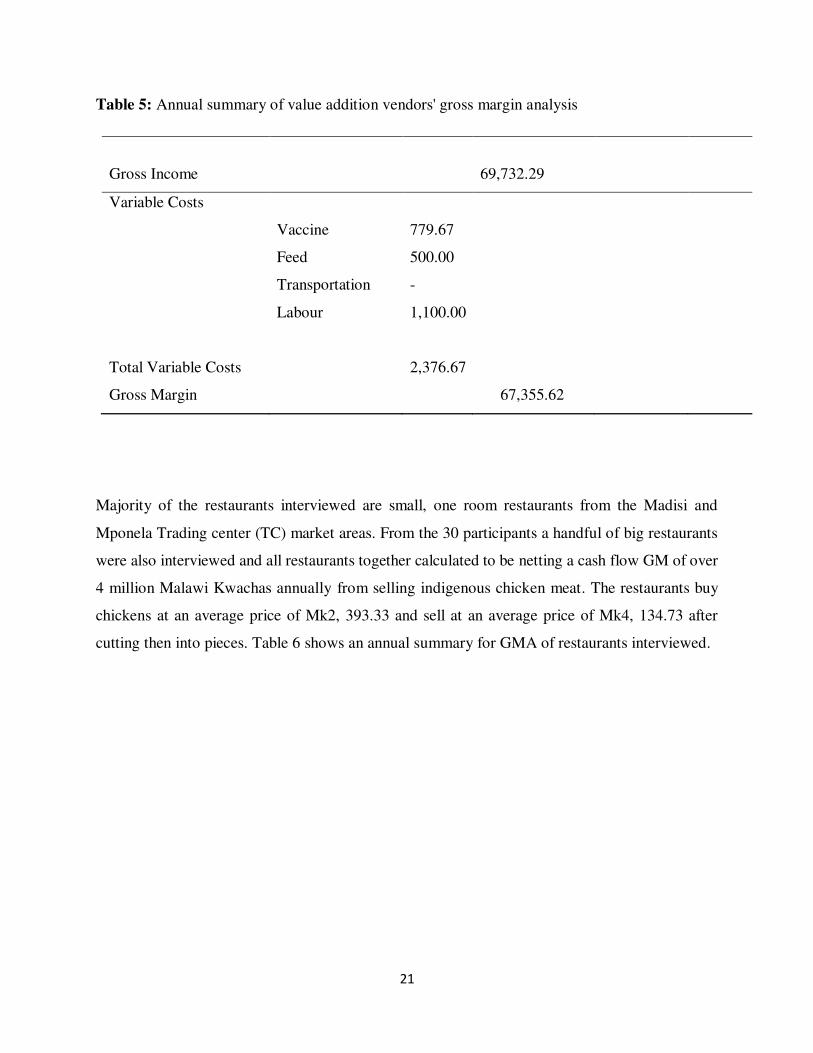
Some of these vendors purchase the birds on order for NGOs while others were for making sure
that they sell larger birds to attain higher profits from the sales. These vendors were found to be
netting in an annual GM of up to Mk67, 355.62 every year from their local chicken sales. The table
indicates their variable costs and total Gross Margin achieved.
21
Table 5: Annual summary of value addition vendors' gross margin analysis
Gross Income
69,732.29
Variable Costs
Vaccine 779.67
Feed 500.00
Transportation -
Labour 1,100.00
Total Variable Costs
2,376.67
Gross Margin 67,355.62
Majority of the restaurants interviewed are small, one room restaurants from the Madisi and
Mponela Trading center (TC) market areas. From the 30 participants a handful of big restaurants
were also interviewed and all restaurants together calculated to be netting a cash flow GM of over
4 million Malawi Kwachas annually from selling indigenous chicken meat. The restaurants buy
chickens at an average price of Mk2, 393.33 and sell at an average price of Mk4, 134.73 after
cutting then into pieces. Table 6 shows an annual summary for GMA of restaurants interviewed.

22
Table 6: Annual summary of restaurant gross margin analysis
Gross income
4,216,419.67
Variable Costs
Vaccine
-
Feed
-
Transportation -
Rent
11,500.00
Other ingredients -
Labour
10,618.17
Total Variable Costs
22,118.17
Gross Margin
4,194,301.50
4.4 To Identify Challenges Faced by the Participants within the Supply Chain
4.4.1 Challenges faced
Challenges are categorized according to the different participants in the chain of
farmers/producers, vendors and restaurants interviewed.
23
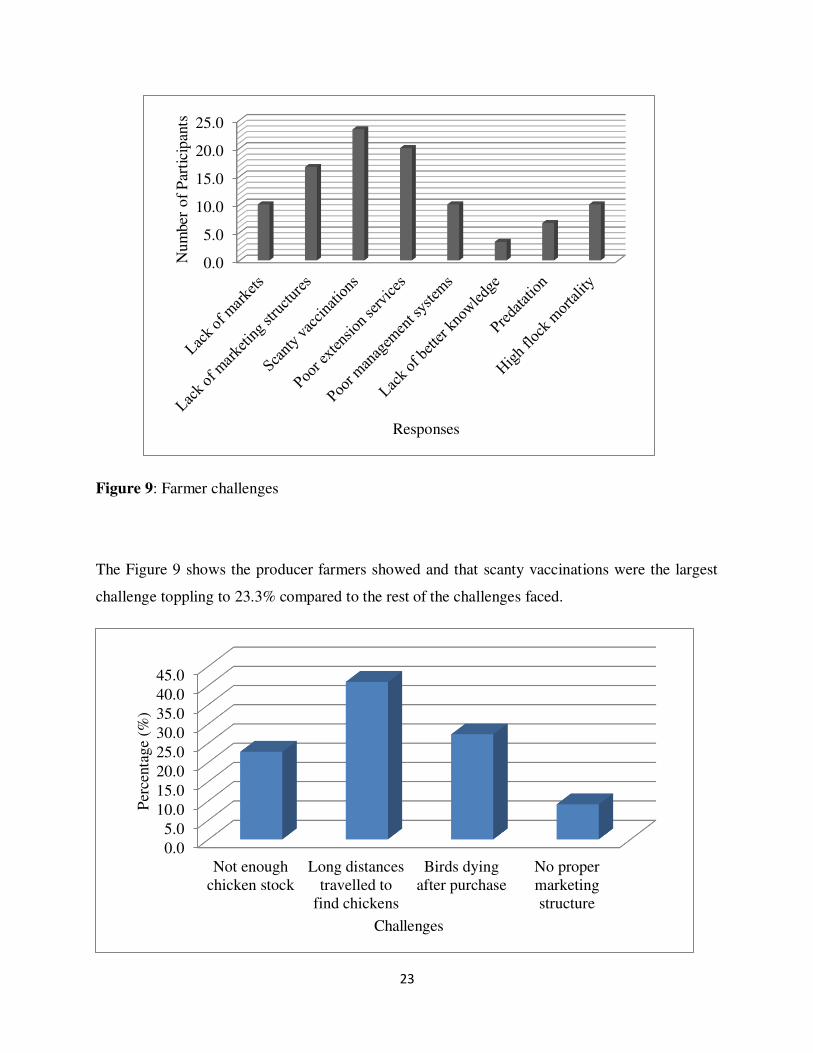
Figure 9: Farmer challenges
The Figure 9 shows the producer farmers showed and that scanty vaccinations were the largest
challenge toppling to 23.3% compared to the rest of the challenges faced.
0.0
5.0
10.0
15.0
20.0
25.0
Num
ber
of
Par
tici
pan
ts
Responses
0.0
5.0
10.0
15.0
20.0
25.0
30.0
35.0
40.0
45.0
Not enoughchicken stock
Long distancestravelled to
find chickens
Birds dyingafter purchase
No propermarketingstructure
Per
centa
ge
(%)
Challenges
24
Figure 10: Vendor challenges
About 41% of the vendors stated that the biggest challenge they faced was the long distances they
had to travel in order to find a sellable number of chickens even through the travelled on bicycles
with baskets attached on the back. Figure 10 displays all the challenges faced by vendors.
Figure 11: Restaurant challenges
Even though the vendors select the heaviest and largest chickens to sell to restaurants, majority of
the restaurant owners, 33.3% of them, Figure 11 stated that they made very little profit from the
birds they buy because vendors outsource them with small chickens.
0.05.0
10.015.020.025.030.035.0
Per
centa
ges
(%
)
Challenges
25
5.0 DISCUSSION
The research was carried out to identify the main participants and the challenges they face,
Descriptive statistics such as means, frequencies and percentages will be used. To assess the
factors affecting the quantity of indigenous chicken marketed and to assess the profitability of the
actors, gross margin analysis were also used.
5.1 Contribution to Research
The project was expected is to generate information on how the indigenous chickens can best
contribute towards improving the livelihoods of the rural farmers since the farmers mostly keep
poultry for immediate and household use such as for meat, for eggs and some few for breeding.
The poultry industry is highly saturated with commercial farmers rearing broilers and layers but is
competing with local chicken sales which are also in higher demand. The research has looked into
the duration from conception of the indigenous chickens and products; to point of sale, but for how
much they gain in terms of returns from the sales has been difficult to copulate due to poor record
keeping and general management of farmers.
There is indeed more than the three actors in the chicken supply chain, more especially of the
farmer sector. Otherwise the most active participants in the supply chain were the
vendors/middlemen and restaurants.
Indigenous chickens still constitute the largest distribution amongst the households, particularly in
the study area of Dowa, Madisi where there is a current increase of 4.6% from a population of
188,531 birds. These local chickens still have a broad spectrum of use among the farmers as they
use them to pay school fees, to buy food, earn a living where 40% of farmers interviewed
responded to use chickens for all the values collectively.
5.1.1 Production systems
In Malawi, chicken losses under village conditions are primarily due to Newcastle disease, and
predation (Kampeni 2000; Safalaoh 1997).
26
Unfortunately, productivity of indigenous chickens remains to be low with 33.3% of farmers being
the majority have a population between 10 to 20 birds at a time with the lowest at 3.3% having
more than 40 birds. This was found to be so due to scanty ND vaccinations, poor extension services
and poor management skills to mention a few.
The predisposition not to sell is a deliberate decision to spare survivors from the diminished flock
which is driven by the expectation of future shock to be drawn upon in times of need (Gausi, 2004).
Due to these challenges that farmers are facing, the production performance of these indigenous
chickens is still characterized as slow, with small body sizes and low hatchability and egg
production due to poor feeding (Safalaoh, 1997). The research found that 66.7% of farmers opt
not to sell their indigenous chicken eggs as they are used as relish as well as to breed replacement
stock.
Results of the previous research have helped to interpret these findings as they agree with the facts
in terms of poor feeding and supplementation of birds, 50% of the farmers provide household
refuse but not on a daily basis without any other supplements, while 40% make an at home feed
formulation and the rest don’t give the birds anything at all and leave the birds to scavenge for
food. In terms of vaccination, 44% of farmers vaccinate their birds not on a regular basis but rather
depending on availability of the vaccine, while the rest claimed not to afford the Mk30.00 per bird
i-2 vaccine or Lasota.
5.1.2 Marketing systems
Farmers in the area have recognized that the lack of organized poultry marketing systems has an
input to the poor performance due to the scanty vaccination and poor extension services of which
if they were available farmers would be able to produce more chickens. Small quantities of
chickens offered for sale restrict most farmers to take advantage of spatial arbitrage (Shepherd,
1997).
In all the market areas of both Madisi and Mponela, cages of hybrid chickens can be spotted and
they are given space by the council to market them.
27
Indigenous chickens on the other hand lack any proper marketing structures. 80% of farmers sell
to vendors who purchase chickens from door to door, using a bicycle with a basket attached.
After birds have been purchased from farmers, 36.4% of these vendors vaccinate the birds to
reduce risk of losses due to ND virus, 31.8% feed birds with household refuse and maize bran and
these are vendors who have won a tender from NGOs or who have failed to sell all birds.
5.1.3 Transactions
Firstly, farmers do not practice if at all any value addition aspects which could enhance and fetch
higher prices in their indigenous production. Most of them have no clue of any other way of selling
their birds because they are mainly raised for home consumption. Farmers are seen to sell their
birds when they are most in need of finances or other immediate household needs.
When they sell the birds, because of no proper cost analysis or record keeping, the price of the
birds are usually determined upon the weight and outlook of the bird thereby not netting the real
selling price of the birds. It was impossible to come up with a gross margin analysis for the farmers
because of lack of records, also majority of farmers acquired their breeding stock from fellow
farmer, don’t pay rent, nor do they hardly ever purchase mixed formulated feed rations or even
take note of the costs.
Vendors move on bicycles from door to door purchasing chickens of different age, sex, type and
size depending on if they have customer orders or tenders. They negotiate on the buying price to
get the stock as cheap as possible to make high profits.
Restaurants select from the array of chickens brought by the vendors and negotiate for lower prices
so that they too can make some profits.
5.1.4 Farmer transactions
According to Fafchamps (1999), households might build up liquid reserves that can be sold or
consumed in times of need or in anticipation for future shocks.
28
This research has found that 46.7% of the farmers sell their chickens when they reach 6 months of
age while 43.3% of others sell after they have reached 12 months of age.
Most of these sales are done during the September to December rain seasons when farmers need
finances for farm inputs, paying school fees, household necessities and buying food, all these done
within their locality.
It was found that farmer do not do any value addition, which could be done to the end products so
as to increase the farmers bargaining power. Farmers are also reluctant to sell chicken eggs as they
are used to replace sold chickens to grow the flock or are used for household uses.
This can be attributed to the small number of chickens offered for sale, long distances to the high-
demand urban and peri-urban markets and that selling of chickens is occasional and based on
prevalent pressing needs (Gausi et al, 2004).
5.1.5 Vendor transactions
The vendors of who are the main customers for farmers, go around villages, travelling long
distances in search to purchase birds of any strain so long as they are of a good weight and size,
for this reason cocks are those that are mostly bought. The number of birds bought is also
dependent on the number of birds found from the farmers, an average of 86 birds per year are
bought by each of the 22 vendors. Farmers sell the vendors live birds without any other value
addition and majority of the vendors 86.4% do the same, apart from a number of vendors who
vaccinate and provide additional feed to birds after purchase.
Although these may do this, another 27.3% of these vendors don’t carry out any of these at home
activities. These restaurant owners then slaughter the birds using halaal methods.
5.1.6 Restaurant transactions
Restaurants surrounding Madisi and Mponela can be found at almost every corner of the two
towns. This area being high in tobacco farmers and sells as well as conference meetings, these
restaurants benefit mostly for a season or two when these two groups populate the towns.
29
The most popular dishes sold are Nsima with local chicken braiied or the local chicken stew, if
chickens are not available, restaurants resolute to sell beef and beans which are also popular.
High sales of indigenous chicken meat were found to be at month ends, during the season of
tobacco sales and after farmers have sold field crops for the small market restaurants. The larger
restaurants don’t really have a season of high sells and seem to cater more for the middle class
clientele who come to the districts for conferences. These restaurant owners negotiate and mostly
buy live bird from vendors.
The gross margins for the three participants show that profits are made from the transactions and
an increase in the number of chickens produced would further increase surplus chickens for sale
as well as for household consumption, thereby increasing the overall livelihood of each of the
participants involved.
The results obtained are therefore clear manifestations that using appropriate mechanisms,
chickens can be used to increase people’s income hence are a tool for poverty alleviation (Gausi,
et al, 2004).
This project is a new model and has not been done in this region of the country and therefor it
would be of good use as a baseline study to try to give proposed solutions to all these encounters
from exploring the value chain analysis of the indigenous chicken and its products.
30
6.0 CONCLUSION
There are many challenges faced by the three actors, most of which did not correlate but general
management, vaccine availability, distance travelled and lack to technical know-how are within
the category of issues that require immediate attention to try and improve the value chain.
There is a high demand of indigenous chicken meat on the market whereby both farmers and
vendors are failing to fill. Currently, the critical threats /challenges to the production efforts are;
Three indigenous chicken marketing actors were identified with minimum value addition,
were the farmers, vendors and restaurants,
The inexistence of proper markets along the selling channels implies market imperfect
competition and inefficiency of the markets where there were no high production sellers,
The traders and restaurants make more profits apart from other factors and constraints.
This study has added to what is known that there is need for properly organized marketing
structures where all the actors in the value chain can benefit financially. If farmers are trained on
the importance of livestock and learn to raise them for both food and profits, this will give them
the bargaining power to dictate prices to vendors and other actors.
Some of the shortcomings in the project research were firstly limitation of funds to fully explore
all the value chain actors, some of which have not been included in this research. Secondly, the
first selected project site had to be changed because vendors in the area were very resistant to be
interviewed causing for changes in area of study as well as some of the objectives of the research
project. Thirdly in the second site where the study was finally carried out, the target sample size
number of vendors was not achieved because it was found that some of the vendors were market
day vendors and others were roadside vendors of who were not interviewed due to financial
restraint.
31
The research has left some unanswered questions not exclusive of the following:
- How government stakeholders can improve their extension services to train farmers to
improve production methods and ensure that there is adequate and timely supply of
vaccines and drugs to both the farmer and vendors.
- How farmers can be mobilized to raise these indigenous chickens as a business through
semi-extensive systems.
- How vendors can organize themselves in such a way that would support the farmers in the
production channel for example, by carrying out vaccination campaigns.
32
7.0 RECOMMENDATIONS
There is need for relevant innovations in order to develop the producer farmers who are at the
grass-root levels and are the foundation of the value chain. Additional investigations may lead to
further insight and amendment of the recommendation previously stated and as below.
7.1 Proper Marketing Structure
Farmers in both Madisi and Mponela sell to vendors and sometimes to fellow farmers. This limits
the farmers’ clientele base giving the buyers an upper hand to dictate bird prices. A proper
marketing structure will ensure farmers sell their birds at decent prices, that they realize a profit,
and even distribution of poultry products among the participants in the chain. There is need for
farmers to be linked with marketing networks to enable product exposure to export markets once
production has increased.
Platforms such as poultry slaughter houses, or abattoirs, will be conducive for a consistent supply
chain that ensures the sale of good quality products at competitive prices, accessible to a wide
range of customers.
Restaurants can benefit from the market structure by being able to buy healthy and affordable
birds.
Market infrastructures and poultry storage facilities will cater for high production volumes and
ensure high quality of the indigenous chickens and chicken products.
7.2 Improve Existing Technologies
There is need to develop and improve existing technologies of production. Consistent and timely
delivery of ND vaccination campaigns, provision of vitamins, and other drugs can increase
production and thus value addition. These interventions should be affordable and easily adopted
by both farmers and vendors to reduce losses and increase value addition as well as profits in the
supply chain.
33
7.3 Active Lead Farmers
Farmer organizations need to help farmers in accessing high quality farm inputs, better markets,
extension services, credit, and capacity building.
The Lead farmers need to encourage the communities, and train them on proper bird management
and production for higher flock populations. There is need for civic education to help farmers
realize the importance of livestock for business. Thereby improve farmer practices in feeding,
housing, flock health management and more.
7.4 Project Site Selection
Selection of the project site and objectives must be carefully considered due to the resistance of
vendors to be interviewed.
7.5 Financial Restraint
Adequate funds are required to fully explore all the value chain participants and at the final study
site, the sample size was not achieved due to there being three groups of vendors, of which only
the walk around vendors were interviewed. Market day and roadside vendors were not due to
financial restraint.
With reference to the data collected and analysed; three stakeholders identified were the rural
farmers, vendors and restaurants. The restaurants in the indigenous chicken market earn the highest
profit margins in comparison to the other participants. Low prices, long distances travelled,
Newcastle disease outbreaks, and low marketable chicken product outputs are the major problems
affecting the production system. The insight specifically for Madisi and Mponela, in Dowa district,
is that farmers need sensitization of local chickens as a live bank which can improve their
wellbeing both financially and nutritionally. Lead farmers also need to be aggressive in playing
their part in knowledge transfer and encouragement for better production.
34
8.0 REFERENCES
Ahlers, C., Alders, R.G., Bagnol B., Cambaza A.B., Harun, M., Mgomezulu, R., Msami, H., Pym,
B., Wegener, P., Wethli, E. and Young, M., 2009. Improving village chicken production:
A Manual for Field Workers and Trainers. ACIAR Monograph No. 139. Australian Centre
for International Agricultural Research: Canberra, 194 pp.
Anini, I. 1990. Indigenous chicken production in South – East Asia. World’s Poultry Science
Journal, 46:51 – 57.
CIA, World Factsbook, 2015. The Factbook, Africa, Malawi. Available At:
http://www.cia.gov/library/publications/the-world-factbook/geos/mi.html [Accessed on
February 11, 2016].
Dzanja, J., Kapondamgaga P., Tchale, H., 2013. Value Chain Analysis of Beef in Central and
Southern Malawi (Case Studies of Lilongwe and Chikhwawa Districts) International
Journal of Business and Social Science Vol. 4 No. 6; The World Bank, Sierra Leone
Country Office.
Dessie, T., and Ogle, B., 1996. Studies on Village Poultry Production in the Central Highlands of
Ethiopia. Tropical Animal Health and Production, 33(6); 521-537
Fafchamps M., 1999. Rural Poverty Risk and Development. F.A.O. Economic and Social
Development Paper 144. Food and Agriculture Organisation of the United Nations. Rome,
Italy. pp 4-12
Gausi, J.C.K., 2003. Characterisation of the Smallholder Poultry Marketing Systems in Rural
Malawi: A Case Study of Malingunde Extension Planning Area, Lilongwe.
Gausi, J.C.K., Safalaoh, A.C.L., Banda, J.W., and Ng’ong’ola, D.H., 2004; Characterisation of the
smallholder poultry marketing systems in rural Malawi: A Case Study of Malingunde
Extension Planning Area. Livestock Research for Rural Development. Vol. 16, Art. #97
GOM., 1999. National Livestock Development Master Plan. Department of Animal Health and
Industry, Ministry of Agriculture, Lilongwe, Malawi.
35
Gondwe T.N.P., 2004. Characterisation of Local Chicken in low output – low input Production
Systems. Tropical Animal Breeding and Husbandry: Goerg – August - Universitate
Gondwe T.N., Wolley C.B.A., and Kaumbata W., 2005. Marketing Systems and Channels for
Scavenging Local Chickens in Lilongwe, Malawi. Livestock Research for Rural
Development. Vol. 17 Article number 24. Available At:
http://www.irrd.org/irrd17/3/gond17024.htm [Accessed on January 28, 2016].
Haule, A.P., and Jere, J., 2000. Report on Participatory Situational Analysis of Livestock
Production by Smallholder Farmers in Lilongwe West and Kasungu R.D.Ps DASPS – II
Pilot Sites, Lilongwe, Malawi
Kampeni, F.L., 1998. Rural Poultry Production. NLDMP – Malawi. Ministry of Agriculture and
Irrigation. Lilongwe, Malawi. Pp 1-10
Kampeni, F.L., 2000. Smallholder Poultry Production in Malawi. Proceedings of a Workshop on
Possibilities for the Smallholder Poultry Projects in Eastern and Southern Africa.
Morogoro, Tanzania. May 22-25, 2000.pp 43-46
Kitalyi, J., 1998. Village Chicken Production Systems in Rural Africa: Household Food Security
and Gender Issues. FAO. Animal Production and Health paper 142. Food and Agriculture
Organisation of the United Nations. Rome, Italy. Pp 30 -32
Malawi Government, 2016. Agriculture Production Estimates. Department of Animal Health and
Livestock Development. Ministry of Agriculture and Irrigation. Lilongwe, Malawi
Malawi Government, 2013. National Livestock Development Master Plan. Final Report.
Department of Animal Health and Industry. Ministry of Agriculture and Irrigation.
Lilongwe, Malawi
Malawi Government, 1999. National Livestock Development Master Plan. Final Report.
Department of Animal Health and Industry. Ministry of Agriculture and Irrigation.
Lilongwe, Malawi
36
Mgwadira, A.L., 1988. Constraints to Marketing of Poultry Products. Paper presentation by the
National Workshop on Livestock Production in Malawi, Chancellor College, Zomba,
Malawi. Pp 14 – 20
Porter, M., 1985. Comparative Advantage: Creating and Sustaining Superior Performance: New
York USA. The Free Press
Rota, A., 2009. International Fund for Agriculture Development: Livestock Thematic Papers,
Value chains, linking producers to the markets
Safalaoh, A.C.L., 1997. Characteristics of Indigenous Chickens in Malawi. Animal Genetic
Resources Information. 22:61 – 69.
Shepherd A.W., 1997. Marketing Information Services: Theory and Practice. F.A.O. Agricultural
Services Bulletin 125. Food and Agricultural Organisation of the United Nations, Rome,
Italy.pp 5-12. Available At: http://www.fao.org/ag/ags/agsm/mispdf.HTM [Accessed on
August 31, 2017]
Thwala, M.S., 2011. Analysing the Value Chain of the Family Poultry Sub Sector in the Lower
Usuthu Project Area in Swaziland. FAO Project “Smallholder Poultry Development”.
(GCP/INT/197/IFA)
37
APPENDICES
Appendix 1.0 Face to face guideline (with poultry producers)
A Value Chain Analysis of Indigenous Chickens and Eggs in Dowa District
CHICKEN RETAILERS QUESTIONNAIRE
Hello, my name is Adija Masambo. I am an Animal Science student at the Lilongwe University
of Agriculture and Natural Resources, Bunda campus. I am conducting a survey on the topic of
the value chain analysis of indigenous chickens sold in rural and urban markets in and around
Mponela. This survey is completely voluntary and we can stop at any point if you are not
comfortable.
RESPONDENT DETAILS
Village: …………………………… T/A: ………………………… Section: ……………………
EPA: ……………………….. District: ………………………
Name of numerator: …………………………………..
Name of respondent: ……………………………………
Gender of respondent: (1) Male (2) Female
Marital status: (1) Married (monogamy), (2) Married (polygamy), (3) Single, (4) Divorce, (5)
Widowed.
Age of respondent: ………………
Religion: (1) Christian, (2) Muslim, (3) Other
Main source of income: ………………………………………… (1) Farming, (2) Livestock
specify (3), employment specify, (4) chicken retailer (5) other sources specify
PRODUCER/FARMER
INFORMATION RELATED TO CHICKEN OWNERSHIP
1. Do you keep local chickens? (1) Yes, (2) No
38
2. How many local chickens are you rearing at the moment?
a) Cocks ……………. b) Hens .………….. c) Pullets …………. d) Chicks …………….
3. Where do you get the following inputs?
Breeding stock?
a) Fellow farmers
b) Vet services
c) Mikolongwe
d) Local markets
e) Gift from friend/ family
Feed?
a) CP feed
b) Feed company
c) Proto Feeds
d) At home formulations
e) Household scraps/ leftovers
f) Nothing
4. Do you sell chickens of eggs? (1) Yes (2) No
5. If yes, how long have you been in the business?
a) 3 months
b) 6 months
c) 12 months
d) 18 months
e) 2 years
f) 3 years
g) Other, specify …………………………
6. What types of birds are highest in demand? (1) Cocks (2) Hens (3) Pullets (4) Chicks
7. What type of local strain is in highest demand?
a) Dwarf naked neck (Kameta)
a) Kambota
39
b) Kawangi
c) Normal black
d) Mawanga
e) Chiphulusa
f) Other, specify …………………………………………….
8. At what age do you sell your local chickens?
a) 1 month
b) 2 months
c) 3 months
d) 6 months
e) 12 months
f) 18 months
g) 2 years
h) Other, specify ……………………………….
9. Where do you normally sell your chickens?
a) Formal markets
b) Informal markets
c) Door to door
d) Mobile markets
e) Vendors
f) Direct to restaurants
g) Other, specify …………….
10. When do you have the most sells during the year?
a) Rain season (Sept. – Dec.)
b) Dry season (Jan. – March)
c) Cold season (April – June)
40
d) Fall (July – Aug.)
11. What is your clientele base?
a) Restaurants
b) NGOs
c) Vendors/ Middlemen
d) Supermarkets/ Shops
e) Fellow farmers
12. Apart from live chickens, what other products do you sell from your chickens?
a) Eggs
b) Manure
c) Feathers
d) Chicken parts
e) Pullets
f) Other, specify ………………………………….
13. What is the main reason you sell local chickens?
a) To pay school fees
b) To buy food
c) To earn a living
d) Other, specify ………………………………….
14. What value addition do you do to your local chickens?
a) Barbequing
41
b) Chicken parts packaging
c) Chicken mince
d) Selling slaughtered birds
e) Selling gizzards, hearts, intestines etc
f) Cured manure
g) Other, specify ……………..
15. What qualities of chickens are sought for by buyers?
a) Heaver chickens
b) Certain breed of chickens (specify…………………………….)
c) Cocks only
d) Hens only
e) Other? Specify …………………………………………………………………………
16. What else can be done to your end product in order to get a better price?
............................................................................................................................................................
17. Do you vaccinate your chickens against Newcastle disease?
a) Yes, every year
b) Yes, when vaccination is available
c) Yes, but not all the time
d) No, I can’t afford it
e) No, it’s never available
f) No, I don’t know anything about that
42
g) No, I don’t do it.
18. How often do you do the vaccination?
a) Once a year
b) Two times a year before it gets cold and hot
c) Three times a year
d) Whenever I can find it
e) I don’t vaccinate
19. What vaccines do you use?
a) Lasota vaccine
b) i-2 vaccine
c) Both depending on availability
d) None of the above
e) Don’t know
20. How much does the vaccine cost?
a) 20Mk per bird
b) 25Mk per bird
c) 30Mk per bird
d) 35Mk and above per bird
e) Don’t know the price
43
21. Months chickens were sold in large numbers for the past 12 months (2016)
Month No. of
chickens
Reason Price sold
(MK)
Ave. price
(MK)
(Pricing structure; Cocks, hens, braiied chicken parts, eggs)
CHALLENGES AND SOLUTIONS
22. What are the challenges you face in the business?
a) Lack of markets
b) Lack of marketing structure
c) High flock mortality
d) Scanty vaccinations
e) Poor extension services
f) Poor management systems
g) Lack of better knowledge
h) Other, specify …………………………………………………..
23. What can you do to solve those challenges?
………………………………………………………………………………………………………
………………………………………………………………………………………………………

44
24. Do you see any other bigger potential in this local chicken enterprise?
………………………………………………………………………………………………………
……………………………………………………………………………………………
THANK YOU FOR TAKING PART IN THIS SURVEY!

45
Appendix 2.0 Face to face interview guideline (with vendor/middlemen retailers)
A Value Chain Analysis of Indigenous Chickens and Eggs in Dowa District
VENDOR/ MIDDLEMAN QUESTIONNAIRE
Hello, my name is Adija Masambo. I am an Animal Science student at the Lilongwe University
of Agriculture and Natural Resources, Bunda campus. I am conducting a survey on the topic of
the value chain analysis of indigenous chickens sold in rural and urban markets in and around
Mponela. This survey is completely voluntary and we can stop at any point if you are not
comfortable.
RESPONDENT DETAILS
Village: …………………………… T/A: ………………………… Section: ……………………
EPA: ……………………….. District: ………………………
Name of numerator: …………………………………..
Name of respondent: ……………………………………
Gender of respondent: (1) Male (2) Female
Marital status: (1) Married (monogamy), (2) Married (polygamy), (3) Single, (4) Divorce, (5)
Widowed.
Age of respondent: ………………
Religion: (1) Christian, (2) Muslim, (3) Other
Main source of income: ………………………………………… (1) Farming, (2) Livestock
specify (3), employment specify, (4) chicken retailer (5) other sources specify
DETAILS OF THE CHICKEN ENTERPRISE
MIDDLE MAN/ VENDOR
1. When did you start buying local chickens?
a) Last week
46
b) A fortnight ago
c) One month ago
d) 2 months ago
e) 3 months ago
f) 6 months ago
g) 18 months ago
h) 1 year ago
i) 2 years ago
j) 3 years ago
k) Other, specify ……………………………………
2. Where do you buy your local chickens?
a) Door to door small-scale farmers
b) Farms
c) Market squares
d) Other vendors
e) Other, specify ……………………..
3. Which of the following local chicken breeds are preferred the most?
a. Kambota
b. Kameta
c. Kawangi
d. Normal black
e. Mawanga
f. Chiphulusa
g. Other, specify ………………………………………………..
Any specific reasons: ............................................................................................................
4. Sex of local chickens bought (1) Cocks: ………… (2) Hens: ………. (3) Pullets …………
5. What are your buying criteria? …………………………………………………………………
6. How often do you buy chickens?
Daily/weekly/monthly
47
How many; (1) Cocks: …. (2) Hens: …. (3) Pullets ....
7. What period of the year are you buying more cocks, hens or pullets?
a) Rain season (Sept. – Dec.)
b) Dry season (Jan. – March)
c) Cold season (April – June)
d) Fall (July – Aug.)
8. Purchasing price per chicken (MK).
a) Cocks: ……………
b) Hens: …………….
c) Pullets: ……………
d) Eggs: ……………..
e) Manure: ………………
f) Feathers: ………………
g) Other, specify: ………………………………………………………………………….
9. What is the number of poultry and poultry products bought?
a) Eggs: ……………
b) Cocks: …………….
c) Hens: ……………….
d) Other, specify: …………………………………………………………………………..
If yes;
(i) At what price each or per dozen? ..........................
48
(ii) How many do you buy at a time? ...................
(iii) How easily available are they found?
................................................................................................................................................
(iv) At what price do you sell them for? .....................
(v) How marketable are they? ........................................................................................
(vi) What types of customers buy them? .........................................................................
If no, N\A
10. Do you know anything about value addition?
a) Fattening the chickens
b) Selling live birds
c) Selling slaughtered birds
d) Selling chicken parts
e) Selling whole barbequed chickens
f) Selling barbequed chicken parts
e) Other? Specify ………………………………………………………………………
11. What other practices do you carry out?
a) Vaccinate birds upon arrival
b) Feed birds with proper ration
c) Feed birds with household refuse and maize bran
d) Treat for diseases other than Newcastle
e) Monitor birds for a while before selling them
49
f) Nothing else
12. Months chickens were sold in large numbers for the past 12 months (2016)
Month No. of
chickens
Reason Price sold
(MK)
Ave. price
(MK)
13. What mode of transport do you use?
a) Bicycle (tied upside down)
b) Bicycle with a basket
c) Walking basket on head
d) Walking upside down on stick
e) In a minibus
f) Hitch – hike rides (Matola) in basket
g) Hitch – hike rides (Matola) upside down
h) Moto bike in basket
50
i) Moto bike upside down
CHALLENGES AND SOLUTIONS
14. What are the challenges you face in the business?
a) Not enough chicken stock
b) Long distances traveled to find chickens
c) Birds dying after purchase
d) No proper marketing structure
e) Other, specify: …………………………………………………………………………...
15. What can you do to solve those challenges?
………………………………………………………………………………………………………
………………………………………………………………………………………………………
………………………………………………………………………………………………………
16. Do you see any other bigger potential in this chicken enterprise?
………………………………………………………………………………………………………
………………………………………………………………………………………………………
………………………………………………………………………………………………………
THANK YOU FOR TAKING PART IN THIS SURVEY!
51
Appendix 3.0 Face to face interview guideline (with Restaurant retailers)
A Value Chain Analysis of Indigenous Chickens and Eggs in Dowa District
RESTAURANTS QUESTIONNAIRE
Hello, my name is Adija Masambo. I am an Animal Science student at the Lilongwe University
of Agriculture and Natural Resources, Bunda campus. I am conducting a survey on the topic of
the value chain analysis of indigenous chickens sold in rural and urban markets in Mponela. This
survey is completely voluntary and we can stop at any point if you are not comfortable.
RESPONDENT DETAILS
Village: …………………………… T/A: ……………………… Section: ………………………
EPA: ……………………….. District: ………………………
Name of numerator: …………………………………..
Name of respondent: ……………………………………
Gender of respondent: (1) Male (2) Female
Marital status: (1) Married (monogamy), (2) Married (polygamy), (3) Single, (4) Divorce, (5)
Widowed.
Age of respondent: ………………
Religion: (1) Christian, (2) Muslim, (3) Other
Main source of income: ………………………………………… (1) Farming, (2) Livestock
specify (3), employment specify, (4) chicken retailer (5) other sources specify
DETAILS OF THE CHICKEN ENTERPRISE
RESTAURANTS
Name of restaurant: ..............................................................................................................
Location of restaurant: ..................................................................................................... .....
52
1. Where do you source your chickens from?
a) Door to door small-scale farmers
b) Farms
c) Market squares
d) Other vendors
e) Other, specify ……………………..
2. Where do your local chickens come from? (Village and or T/A)
………………………………………………………………………………………………………
3. What types of chicken do you purchase?
a) Kambota
b) Kameta
c) Kawangi
d) Normal black
e) Mawanga
f) Chiphulusa
Other, specific reasons: .................................................................................................... .....
4. What poultry products do you buy?
a) Eggs
b) Live chickens
c) Dressed chickens
d) Chicken mince
e) Chicken sausages
f) Others, specify ………………………………………………………..
5. From the types of chicken sold here, what seems to be more in demand? ….……………..
6. What poultry products do you buy?
a) Eggs
b) Live chickens
53
c) Dressed chickens
d) Chicken parts
e) Chicken mince
f) Chicken sausages
g) Others, specify: ………………………………………………………………………….
7. What are the buying prices for the poultry and poultry products (MK)?
a) Eggs: ……………….
b) Live chickens: ………………
c) Dressed chickens: ……………..
d) Chicken parts: ………………….
e) Chicken mince: ………………..
f) Chicken sausages: ……………..
g) Others, specify: ………………………………………………………………………….
8. Are you managing to fulfill the demand? (1) Yes (2) No
If no;
Why do you think you are not managing the demand?
a) Not enough chicken stock
b) Supplier is scanty on delivery
c) Chickens are small
d) Other, specify: ………………………………………………………………..
(ii) What do you do or think you could do to fulfill that demand? .......................................
............................................................................................................................................................
54
9. Do you purchase per;
a) Day
b) Week
c) Month
10. How many do purchase per day or week or month?
a) Per day: …………………
b) Per week: ……………….
c) Per month: ………………
11. What value addition do you do to the local chicken meal?
a) Braiied chicken pieces
b) Stewed chicken
c) Boiled chicken
d) Chicken mince
e) Whole roasted chicken
f) Other, specify: ………………………………………………………………………….
12. What is the most popular and most sold dish?
a) Nsima local chicken (stewed)
b) Rice local Chicken (stewed)
c) Chips local chicken (stewed)
d) Nsima local chicken (braiied)
e) Rice local chicken (braiied)
f) Chips local chicken (braiied)
g) Others, specify: ………………………………………………………………………
13. When does your restaurant business sell most chickens?
55
a) Month end
b) Mid-week
c) Weekends
d) Festive seasons
e) Other, specify: ………………………………………………………………………..
14. Do you also sell local chicken eggs?
a) Yes
b) No
15. Why do you sell or not sell local chicken eggs
a) Not available on the market
b) Not very popular to customers
c) Not profitable to sell
d) Scanty amounts found
e) Do not bother to sell
14. Months chickens were sold in large numbers for the past 12 months (2016)
Month No. of
chickens
Reason Price sold
(MK)
Ave. price
(MK)
56
15. How is the demand for local chicken meat compared to exotic chicken meat?
a) Extremely high
b) Very high
c) High
d) Moderate
e) Fair
f) Low
g) Very low
h) Extremely low
16. In order of preference, what is the meat most demanded by customers?
a) Beef ……
b) Goat meat ……..
c) Fish …………..
d) Exotic chicken …………
e) Local chicken ………….
f) Other, specify ………………………………………….
CHALLENGES AND SOLUTIONS
13. What are the challenges you face in the business?
………………………………………………………………………………………………………
………………………………………………………………………………………………………
………………………………………………………………………………………………………
57
14. What can you do to solve those challenges?
………………………………………………………………………………………………………
………………………………………………………………………………………………………
………………………………………………………………………………………………………
THANK YOU FOR TAKING PART IN THIS SURVEY!
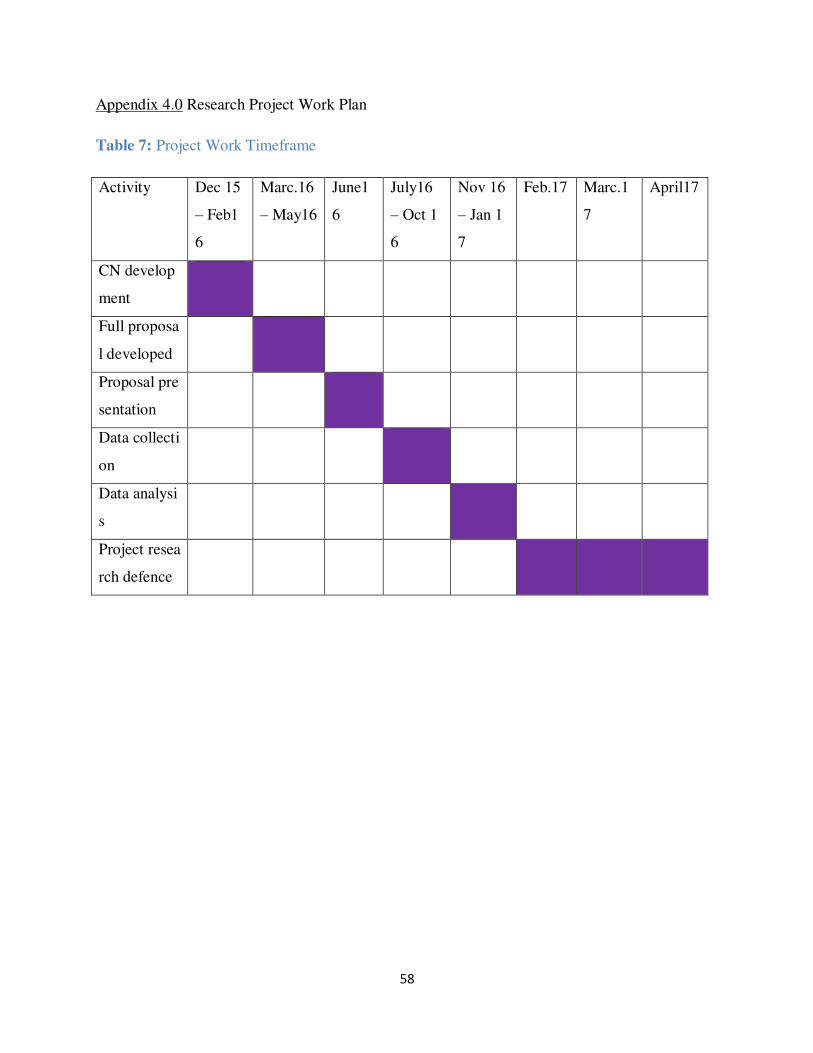
58
Appendix 4.0 Research Project Work Plan
Table 7: Project Work Timeframe
Activity Dec 15
– Feb1
6
Marc.16
– May16
June1
6
July16
– Oct 1
6
Nov 16
– Jan 1
7
Feb.17 Marc.1
7
April17
CN develop
ment
Full proposa
l developed
Proposal pre
sentation
Data collecti
on
Data analysi
s
Project resea
rch defence
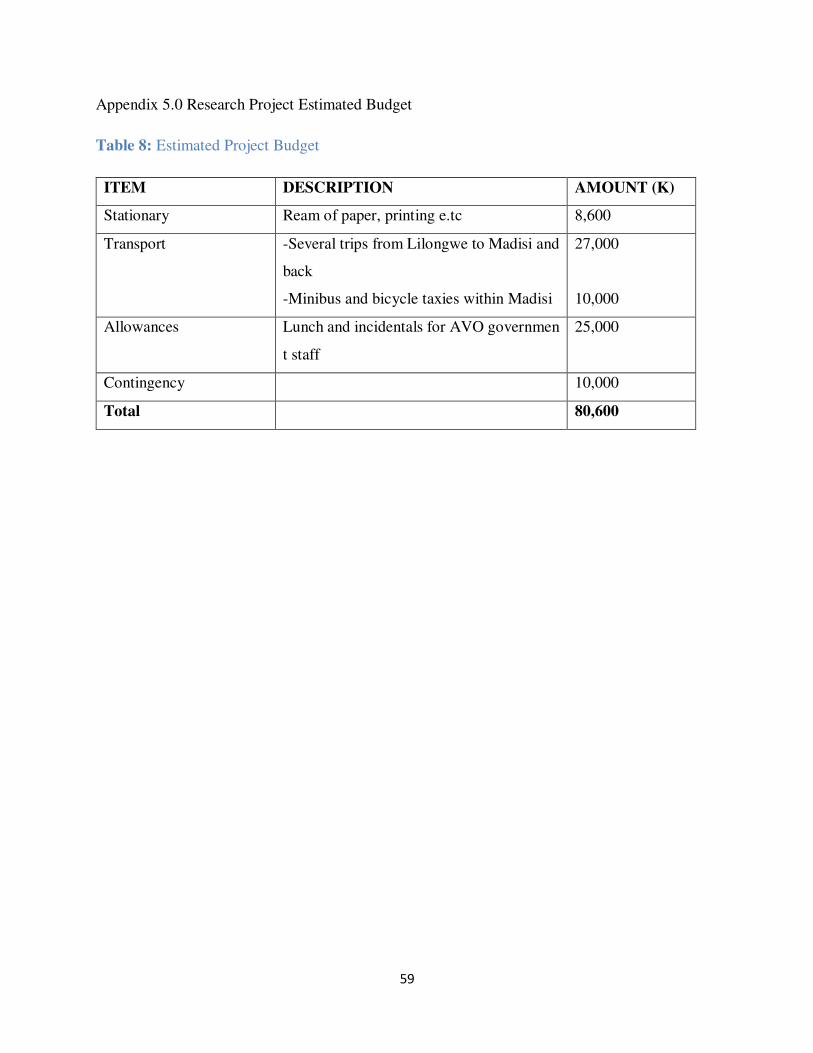
59
Appendix 5.0 Research Project Estimated Budget
Table 8: Estimated Project Budget
ITEM DESCRIPTION AMOUNT (K)
Stationary Ream of paper, printing e.tc 8,600
Transport -Several trips from Lilongwe to Madisi and
back
-Minibus and bicycle taxies within Madisi
27,000
10,000
Allowances Lunch and incidentals for AVO governmen
t staff
25,000
Contingency 10,000
Total 80,600