Embed Size (px)
Citation preview

A Supply Chain Generalized Network OligopolyModel for Pharmaceuticals
Under Brand Differentiation and Perishability
Amir H. Masoumi and Min Yuand
Anna NagurneyJohn F. Smith Memorial Professor
Isenberg School of ManagementUniversity of Massachusetts
Amherst, Massachusetts 01003
The 23rd Annual Conference of POMS, Chicago, ILApril 20-23, 2012
University of Massachusetts Amherst Pharmaceutical Product Supply Chains

Acknowledgments
This research was supported by the John F. Smith Memorial Fundat the University of Massachusetts Amherst. This support isgratefully acknowledged.
University of Massachusetts Amherst Pharmaceutical Product Supply Chains

This talk is based on the paper:
Masoumi, A. H., Yu, M., Nagurney, A., 2012. A supply chaingeneralized network oligopoly model for pharmaceuticals underbrand differentiation and perishability. Transportation Research E48, 762-780.
University of Massachusetts Amherst Pharmaceutical Product Supply Chains

Outline
I Background and Motivation
I Literature Review
I A Generalized Network Oligopoly Model for PharmaceuticalSupply Chains
I A Case Study
I Summary
University of Massachusetts Amherst Pharmaceutical Product Supply Chains

Background and Motivation
University of Massachusetts Amherst Pharmaceutical Product Supply Chains

The Pharmaceutical Industry
Pharmaceutical, that is, medicinal drug, manufacturing is animmense global industry.
In 2003, worldwide pharmaceutical industry sales were at $491.8billion, an increase in sales volume of 9% over the preceding yearwith the US being the largest national market, accounting for 44%of global industry sales.
In 2011, the global pharmaceutical industry was expected to recordgrowth of 5− 7% on sales of approximately $880 billion (ZacksEquity Research (2011)).
University of Massachusetts Amherst Pharmaceutical Product Supply Chains
The Pharmaceutical Industry
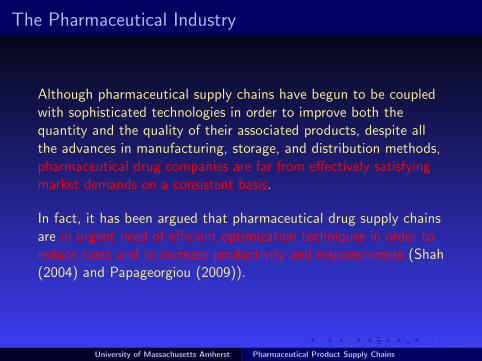
Although pharmaceutical supply chains have begun to be coupledwith sophisticated technologies in order to improve both thequantity and the quality of their associated products, despite allthe advances in manufacturing, storage, and distribution methods,pharmaceutical drug companies are far from effectively satisfyingmarket demands on a consistent basis.
In fact, it has been argued that pharmaceutical drug supply chainsare in urgent need of efficient optimization techniques in order toreduce costs and to increase productivity and responsiveness (Shah(2004) and Papageorgiou (2009)).
University of Massachusetts Amherst Pharmaceutical Product Supply Chains

Pharmaceutical Product Perishability
Product perishability is another critical issue in pharmaceutical /drug supply chains.
I In a 2003 survey, the estimated incurred cost due to theexpiration of branded products in supermarkets and drugstores was over 500 million dollars.
I In 2007, in a warehouse belonging to the Health Departmentof Chicago, over one million dollars in drugs, vaccines, andother medical supplies were found spoiled, stolen, orunaccounted for.
I In 2009, CVS pharmacies in California, as a result of asettlement of a lawsuit filed against the company, had to offerpromotional coupons to customers who had identified expireddrugs, including expired baby formula and children’smedicines, in more than 42 percent of the stores surveyed theyear before.
University of Massachusetts Amherst Pharmaceutical Product Supply Chains

Pharmaceutical Product Perishability
Other instances of medications sold more than a year past theirexpiration dates have occurred in other pharmacies across the US.
According to the Harvard Medical School (2003), since a law waspassed in the US in 1979, drug manufacturers are required tostamp an expiration date on their products. This is the date atwhich the manufacturer can still guarantee the full, that is, 100%,potency and safety of the drug, assuming, of course, that properstorage procedures have been followed.
For example, certain medications, including insulin, must be storedunder appropriate environmental conditions, and exposure towater, heat, humidity or other factors can adversely affect howcertain drugs perform in the human body.
University of Massachusetts Amherst Pharmaceutical Product Supply Chains

Waste and Environmental Impacts
The environmental impact of the medical waste includes theperished excess medicine, and inappropriate disposal on the retailer/ consumer end.
Abundant amounts of unused or expired drugs have been found in41 million American people’s drinking water due to improperdisposal in domestic trash or in the waste water.
University of Massachusetts Amherst Pharmaceutical Product Supply Chains

Pharmaceutical Product Shortages
Ironically, whereas some drugs may be unsold and unused and / orpast their expiration dates, the number of drugs that were reportedin short supply in the US in the first half of 2011 has risen to 211 –close to an all-time record – with only 58 in short supply in 2004.
According to the Food and Drug Administration (FDA), hospitalshave reported shortages of drugs used in a wide range ofapplications, ranging from cancer treatment to surgery, anesthesia,and intravenous feedings.
University of Massachusetts Amherst Pharmaceutical Product Supply Chains

Some Consequences of Product Shortages
The consequences of such shortages include the postponement ofsurgeries and treatments, and may also result in the use of lesseffective or costlier substitutes.
According to the American Hospital Association, all US hospitalshave experienced drug shortages, and 82% have reported delayedcare for their patients as a consequence (Szabo (2011)).
Shortages of some lifesaving drugs have resulted in huge spikes inprices, ranging from a 100% to a 4, 500% increase with an averageof 650% (Schneider (2011)).
University of Massachusetts Amherst Pharmaceutical Product Supply Chains

Some Possible Causes of Shortages
While the real causes of such shortages are complex, most casesappear to be related to manufacturers’ decisions to ceaseproduction in the presence of financial challenges.
It is interesting to note that, among curative cancer drugs, only theolder generic, yet, less expensive, ones, have experienced shortages.
As noted by Shah (2004), pharmaceutical companies securenotable returns solely in the early lifetime of a successful drug,before competition takes place. This competition-free time-span,however, has been observed to be shortening, from 5 years to only1− 2 years.
University of Massachusetts Amherst Pharmaceutical Product Supply Chains

Some Possible Causes of Shortages
Pharmaceutical companies are expected to suffer a significantdecrease in their revenues as a result of losing patent protection forten of the best-selling drugs by the end of 2012 (De la Garza(2011)).
Several pharmaceutical products, including Lipitor and Plavix, that,presently, generate more than $142 billion in sales, are expected,over the next five years, to be faced with generic competition.
In 2011, pharmaceutical products valued at more than $30 billionare losing patent protection, with such products generating morethan $15 billion in sales in 2010.
University of Massachusetts Amherst Pharmaceutical Product Supply Chains

Some Possible Causes of Shortages
Hence, the low profit margins associated with such drugs may beforcing pharmaceutical companies to make a difficult decision:whether to lose money by continuing to produce a lifesavingproduct or to switch to a more profitable drug.
Unfortunately, the FDA cannot force companies to continue toproduce low-profit medicines even if millions of lives rely on them.
University of Massachusetts Amherst Pharmaceutical Product Supply Chains

Safety Issues
I More than 80% of the ingredients of drugs sold in the US aremade overseas, mostly in remote facilities located in Chinaand India that are rarely – if not ever – visited by governmentinspectors.
I Supply chains of generic drugs, which account for 75% of theprescription medicines sold in the US, are, typically, moresusceptible to falsification with the supply chains of some ofthe over-the-counter products, such as vitamins or aspirins,also vulnerable to adulteration.
I The amount of counterfeit drugs in the Europeanpharmaceutical supply chains has considerably increased.
The emergence of counterfeit products has resulted in majorreforms in the relationships among various tiers in pharmaceuticalsupply chain.
University of Massachusetts Amherst Pharmaceutical Product Supply Chains

Relevant Literature
I Papageorgiou, L., Rotstein, G., Shah, N. (2001) Strategicsupply chain optimization for the pharmaceutical industries.Industrial & Engineering Chemistry Research 40, 275–286.
I Shah, N. (2004) Pharmaceutical supply chains: Key issuesand strategies for optimisation. Computers and ChemicalEngineering 28, 929–941.
I Jesson, J., Pocock, R., Wilson, K. (2005) Reducing medicineswaste in the community. Primary Health Care Research andDevelopment 6, 117–124.
I Sousa, R., Shah, N., Papageorgiou, L. (2008) Supply chaindesign and multilevel planning: An industrial case. Computersand Chemical Engineering 32, 2643–2663.
University of Massachusetts Amherst Pharmaceutical Product Supply Chains

I Niziolek, L. (2008) A simulation-based study of distributionstrategies for pharmaceutical supply chains. Ph.D. thesis inIndustrial Engineering, Purdue University, Indiana.
I Papageorgiou, L. (2009) Supply chain optimisation for theprocess industries: Advances and opportunities. Computersand Chemical Engineering 33, 1931–1938.
I Nagurney, A., Yu, M. (2012) Sustainable fashion supply chainmanagement under oligopolistic competition and branddifferentiation. International Journal of Production Economics135, 532–540.
I Liu, Z., Nagurney, A. (2011) Multiperiod competitive supplychain networks with inventorying and a transportation networkequilibrium reformulation. Optimization and Engineering, inpress.
University of Massachusetts Amherst Pharmaceutical Product Supply Chains

A Generalized Network Oligopoly Model forPharmaceutical Supply Chains
The supply chain generalized network oligopoly model has thefollowing novel features:
1. it handles the perishability of the pharmaceutical productthrough the introduction of arc multipliers;
2. it allows each firm to minimize the discarding cost of waste /perished medicine;
3. it captures product differentiation under oligopolisticcompetition through the branding of drugs, which can also includegenerics as distinct brands.
University of Massachusetts Amherst Pharmaceutical Product Supply Chains

Our proposed framework can also applied to similar cases ofoligopolistic competition in which a finite number of firms provideperishable products.
However, proper minor modifications may have to be made inorder to address differences in the supply chain network topologiesin related industries.
University of Massachusetts Amherst Pharmaceutical Product Supply Chains

A Generalized Network Oligopoly Model forPharmaceutical Supply Chains
I pharmaceutical firms are considered, with a typical firm denotedby i .
The firms compete noncooperatively, in an oligopolistic manner,and the consumers can differentiate among the products of thepharmaceutical firms through their individual product brands.
The supply chain network activities include manufacturing,shipment, storage, and, ultimately, the distribution of the brandname drugs to the demand markets.
University of Massachusetts Amherst Pharmaceutical Product Supply Chains

A Generalized Network Oligopoly Model forPharmaceutical Supply Chains
Each pharmaceutical firm i ; i = 1, . . . , I , utilizes niM manufacturing
plants and niD distribution / storage facilities, and the goal is to
serve nR demand markets consisting of pharmacies, retail stores,hospitals, and other medical centers.
Li denotes the set of directed links corresponding to the sequenceof activities associated with firm i . Also, G = [N, L] denotes thegraph composed of the set of nodes N, and the set of links L,where L contains all sets of Li s: L ≡ ∪i=1,...,IL
i .
University of Massachusetts Amherst Pharmaceutical Product Supply Chains

The Pharmaceutical Supply Chain Network Topology
mR1 · · · RnRDemand Markets
mHHHHHHj
PPPPPPPPPq?
���������) ?
�������· · · · · ·· · · · · ·· · · · · ·· · · · · ·
D11,2
m · · · mD1n1D ,2
D I1,2
m · · · mD InID ,2
?
. . .
?
. . .
?
. . .
?
. . .· · ·
D11,1
m · · · mD1n1D ,1
D I1,1
m · · · mD InID ,1
?
HHHH
HHj?
����
��� ?
HHHH
HHj?
����
���· · · · · · · · · · · · · · · · · ·ccccccccccccccc
· · ·
AAAAAAAAAAAA
· · ·
SSSSSSSSSSSS
· · ·
������������
###
###
###
##
####
· · ·
������������
· · ·
M11
m · · · mM1n1M
M I1
m · · · mM InIM
���
@@@R
���
@@@R
· · · · · · · · · · · ·
m1 mI· · ·
Pharmaceutical Firm 1 Pharmaceutical Firm I
University of Massachusetts Amherst Pharmaceutical Product Supply Chains

A Generalized Network Oligopoly Model forPharmaceutical Supply Chains
There are alternative shipment links to denote different possiblemodes of transportation.
Since drugs may require different storage conditions / technologiesbefore being ultimately shipped to the demand markets, werepresent these alternatives through multiple links at this tier.
There are direct links connecting manufacturing units with variousdemand markets in order to capture the possibility of direct mailshipments from manufacturers.
University of Massachusetts Amherst Pharmaceutical Product Supply Chains

How We Handle Perishability
Although pharmaceutical products may have different life-times,we can assign a multiplier to each activity / link of the supplychain to represent the fraction of the product that may perish / bewasted / be lost over the course of that activity.
Also, such multipliers can capture pilferage / theft, a significantissue in drug supply chains.
University of Massachusetts Amherst Pharmaceutical Product Supply Chains

How We Handle Perishability
The fraction of lost product depends on the type of the activitysince various processes of manufacturing, shipment, storage, anddistribution may result in dissimilar amounts of losses.
In addition, this fraction need not be the same among various linksof the same tier in the supply chain network since different firmsand even different units of the same firm may experiencenon-identical amounts of waste, depending on the brand of drug,the efficiency of the utilized technology, and the experience of thestaff, etc.
University of Massachusetts Amherst Pharmaceutical Product Supply Chains

How We Handle Perishability
Note that the arc multipliers may be obtained from historical andstatistical data.
They may also, in the case of certain perishable products, berelated to an exponential time decay function where the time, inour framework, is associated with each specific link activity (see,for instance, Blackburn and Scudder (2009) and Bai and Kendall(2009)).
University of Massachusetts Amherst Pharmaceutical Product Supply Chains

How We Handle Perishability
We associate with every link a in the supply chain network, amultiplier αa, which lies in the range of (0,1]. The parameter αa
may be interpreted as a throughput factor corresponding to link ameaning that αa × 100% of the initial flow of product on link areaches the successor node of that link.
Let fa denote the (initial) flow of product on link a with f ′a denotingthe final flow on link a; i.e., the flow that reaches the successornode of the link after wastage has taken place. Therefore, we have:
f ′a = αafa, ∀a ∈ L. (1)
Consequently, the waste / loss on link a is the difference betweenthe initial and the final flow, fa − f ′a , where
fa − f ′a = (1− αa)fa, ∀a ∈ L. (2)
University of Massachusetts Amherst Pharmaceutical Product Supply Chains

How We Handle Perishability
Associated with this waste is a discarding total cost function, za,which, in view of (2), is a function of flow on the link, fa, that is
za = za(fa), ∀a ∈ L, (3)
and which is assumed to be convex and continuously differentiable.
University of Massachusetts Amherst Pharmaceutical Product Supply Chains

How We Handle Perishability
We define the multiplier, αap, which is the product of themultipliers of the links on path p that precede link a in that path,as follows:
αap ≡
δap
∏a′<a
αa′ , if {a′ < a} 6= Ø,
δap, if {a′ < a} = Ø,
(4)
where {a′ < a} denotes the set of the links preceding link a in pathp, and Ø denotes the null set. As a result, αap is equal to theproduct of all link multipliers preceding link a in path p. Hence,the relationship between the link flow, fa, and the path flows canbe expressed as:
fa =I∑
i=1
nR∑k=1
∑p∈P i
k
xp αap, ∀a ∈ L. (5)
University of Massachusetts Amherst Pharmaceutical Product Supply Chains

How We Handle Perishability
Let µp denote the multiplier corresponding to the throughput onpath p, defined as the product of all link multipliers on linkscomprising that path, that is,
µp ≡∏a∈p
αa, ∀p ∈ P ik ; i = 1, . . . , I ; k = 1, . . . , nR . (6)
Let dik denote the demand for pharmaceutical firm i ’s brand drug;i = 1, . . . , I , at demand market Rk ; k = 1, . . . , nR . The followingequation reveals the relationship between the path flows and thedemands in the supply chain network:∑
p∈P ik
xpµp = dik , i = 1, . . . , I ; k = 1, . . . , nR , (7)
that is, the demand for a brand drug at the demand market Rk isequal to the sum of all the final flows – subject to perishability –on paths joining (i ,Rk).
University of Massachusetts Amherst Pharmaceutical Product Supply Chains

The Demand Price Functions
A demand price function is associated with each firm’spharmaceutical at each demand market. We denote the demandprice of firm i ’s product at demand market Rk by ρik and assumethat
ρik = ρik(d), i = 1, . . . , I ; k = 1, . . . , nR . (8)
These demand price functions are assumed to be continuous,continuously differentiable, and monotone decreasing.
The Total Cost Functions
The total operational cost on link a may, in general, depend uponthe product flows on all the links, that is,
ca = ca(f ), ∀a ∈ L, (9)
where f is the vector of all the link flows. The total cost on eachlink is assumed to be convex and continuously differentiable.
University of Massachusetts Amherst Pharmaceutical Product Supply Chains

The Profit Function of Firm i
Ui =
nR∑k=1
ρik(d)dik −∑a∈Li
ca(f )−∑a∈Li
za(fa). (10)
Xi : the vector of path flows associated with firm i ; i = 1, . . . , I ,where Xi ≡ {{xp}|p ∈ P i}} ∈ R
nPi
+ .
X : the vector of all the firm’ strategies, that is,X ≡ {{Xi}|i = 1, . . . , I}.Ui (X ) = Ui for all firms i ; i = 1, . . . , I .
U = U(X ). (11)
University of Massachusetts Amherst Pharmaceutical Product Supply Chains

Supply Chain Generalized Network Cournot-NashEquilibrium
In the Cournot-Nash oligopolistic market framework, each firmselects its product path flows in a noncooperative manner, seekingto maximize its own profit, until an equilibrium is achieved.
Definition 1: Supply Chain Generalized Network Cournot-NashEquilibrium
A path flow pattern X ∗ ∈ K =∏I
i=1 Ki constitutes a supply chaingeneralized network Cournot-Nash equilibrium if for each firm i;i = 1, . . . , I :
Ui (X ∗i , X∗i ) ≥ Ui (Xi , X
∗i ), ∀Xi ∈ Ki , (12)
where X ∗i ≡ (X ∗1 , . . . ,X∗i−1,X
∗i+1, . . . ,X
∗I ) and
Ki ≡ {Xi |Xi ∈ RnPi
+ }.
University of Massachusetts Amherst Pharmaceutical Product Supply Chains

The Variational Inequality Formulation
Theorem 1
Assume that, for each pharmaceutical firm i; i = 1, . . . , I , theprofit function Ui (X ) is concave with respect to the variables inXi , and is continuously differentiable. Then X ∗ ∈ K is a supplychain generalized network Cournot-Nash equilibrium according toDefinition 1 if and only if it satisfies the variational inequality:
−I∑
i=1
〈∇XiUi (X ∗)T ,Xi − X ∗i 〉 ≥ 0, ∀X ∈ K , (13)
where 〈·, ·〉 denotes the inner product in the correspondingEuclidean space and ∇Xi
Ui (X ) denotes the gradient of Ui (X ) withrespect to Xi .
University of Massachusetts Amherst Pharmaceutical Product Supply Chains

The Variational Inequality Formulation
Variational Inequality (Path Flows)
Determine x∗ ∈ K 1 such that:
I∑i=1
nR∑k=1
∑p∈P i
k
[∂Cp(x∗)
∂xp+∂Zp(x∗)
∂xp
]× [xp − x∗p ]
+I∑
i=1
nR∑k=1
[−ρik(d∗)−
nR∑l=1
∂ρil(d∗)
∂dikd∗il
]× [dik − d∗ik ] ≥ 0,
∀(x , d) ∈ K 1, (14)
where K 1 ≡ {(x , d)|x ∈ RnP+ and (7) holds}.
University of Massachusetts Amherst Pharmaceutical Product Supply Chains

The Variational Inequality Formulation
Variational Inequality (Link Flows)
Determine the vector of equilibrium link flows and the vector ofequilibrium demands (f ∗, d∗) ∈ K 2, such that:
I∑i=1
∑a∈Li
∑b∈Li
∂cb(f ∗)
∂fa+∂za(f ∗a )
∂fa
× [fa − f ∗a ]
+I∑
i=1
nR∑k=1
[−ρik(d∗)−
nR∑l=1
∂ρil(d∗)
∂dikd∗il
]× [dik − d∗ik ] ≥ 0,
∀(f , d) ∈ K 2, (15)
where K 2 ≡ {(f , d)|x ≥ 0, and (5), and (7) hold}.
University of Massachusetts Amherst Pharmaceutical Product Supply Chains

Corollaries
Corollary 1: Homogeneous Drug
Let dk and ρk denote the demand for the homogeneous drug andits demand price at demand market Rk , respectively. One canderive:
I∑i=1
∑p∈P i
k
xpµp = dk , k = 1, . . . , nR . (16)
Then, the profit function can be rewritten as:
Ui =
nR∑k=1
ρk(d)∑p∈P i
k
µpxp −∑a∈Li
ca(f )−∑a∈Li
za(fa). (17)
University of Massachusetts Amherst Pharmaceutical Product Supply Chains

Corollaries
Corollary 1 (cont’d): Homogeneous Drug
The corresponding variational inequality in terms of path flows canbe rewritten as: determine x∗ ∈ K 1 such that:
I∑i=1
nR∑k=1
∑p∈P i
k
∂Cp(x∗)
∂xp+∂Zp(x∗)
∂xp−
nR∑l=1
∂ρl(d∗)
∂dkµp
∑p∈P i
l
µpx∗p
×[xp − x∗p ]
+
nR∑k=1
[−ρk(d∗)]× [dk − d∗k ] ≥ 0, ∀(x , d) ∈ K 3, (18)
where K 3 ≡ {(x , d)|x ∈ RnP+ and (16) holds}.
University of Massachusetts Amherst Pharmaceutical Product Supply Chains

Corollaries
Corollary 2: Fixed Demand
Assume that the demand dik for firm i’s pharmaceutical is fixed.Then, the demand price of this product at demand market Rk willthen also be fixed. One can derive:
Ui =
nR∑k=1
ρikdik −∑a∈Li
ca(f )−∑a∈Li
za(fa), (19)
University of Massachusetts Amherst Pharmaceutical Product Supply Chains

Corollaries
Corollary 2 (cont’d): Fixed Demand
Therefore, the corresponding variational inequality in terms of pathflows simplifies, in this case, to: determine x∗ ∈ K 3 such that:
I∑i=1
nR∑k=1
∑p∈P i
k
[∂(∑
q∈P Cq(x∗))
∂xp+∂(∑
q∈P Zq(x∗))
∂xp
]×[xp−x∗p ] ≥ 0,
∀x ∈ K 4, (20)
where
K 4 ≡ {x |x ≥ 0, and (7) is satisfied with the diks known and fixed, ∀i , k.}
University of Massachusetts Amherst Pharmaceutical Product Supply Chains

Corollaries
Corollary 3: Homogeneous Drug and Fixed Demand
Assume that the firms produce a homogeneous drug for which thedemand dk at market Rk is fixed, as well as the demand price ρk . Onehas:
Ui =
nR∑k=1
ρk∑p∈P i
k
µpxp −∑a∈Li
ca(f )−∑a∈Li
za(fa). (21)
The corresponding variational inequality is: determine x∗ ∈ K 5 suchthat:
I∑i=1
nR∑k=1
∑p∈P i
k
[∂(
∑q∈P Cq(x
∗))
∂xp+
∂(∑
q∈P Zq(x∗))
∂xp
]× [xp − x∗p ] ≥ 0, ∀x ∈ K 5,
(22)
where K 5 ≡ {x |x ≥ 0, and (7) is satisfied with the dks known and fixed, ∀k.}.
University of Massachusetts Amherst Pharmaceutical Product Supply Chains
Case Study – Case I
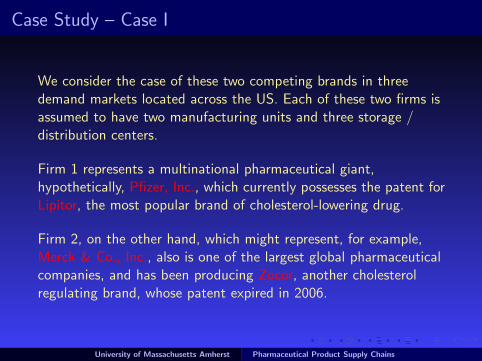
We consider the case of these two competing brands in threedemand markets located across the US. Each of these two firms isassumed to have two manufacturing units and three storage /distribution centers.
Firm 1 represents a multinational pharmaceutical giant,hypothetically, Pfizer, Inc., which currently possesses the patent forLipitor, the most popular brand of cholesterol-lowering drug.
Firm 2, on the other hand, which might represent, for example,Merck & Co., Inc., also is one of the largest global pharmaceuticalcompanies, and has been producing Zocor, another cholesterolregulating brand, whose patent expired in 2006.
University of Massachusetts Amherst Pharmaceutical Product Supply Chains
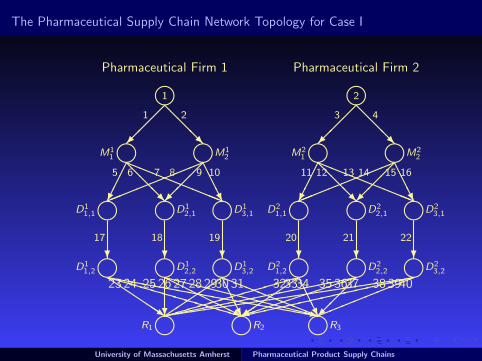
The Pharmaceutical Supply Chain Network Topology for Case I
mR1mR2
mR3
QQQQQs
XXXXXXXXXXXX
hhhhhhhhhhhhhhhhhh
23 24 25
?
HHHHHHj
XXXXXXXXXXXXz
26 27 28 �����
AAAU
aaaaaaaa
2930 31������������
���
��+
AAAU
323334
���������)
���
35 3637(((((((((((((((((((
!!!!!!!!
38 3940
D11,2
m mD12,2
mD13,2 D2
1,2m mD2
2,2mD2
3,2
?
17
?
18
?
19
?
20
?
21
?
22
D11,1
m mD12,1
mD13,1 D2
1,1m mD2
2,1mD2
3,1
����
@@@R
aaaaaaaa
!!!!!!!!
���
AAAU
5 6 7 8 9 10 ����
@@@R
aaaaaaaa
!!!!!!!!
���
AAAU
11 12 13 14 15 16
M11
m mM12 M2
1m mM2
2
���
1 @@@R
2 ���
3 @@@R
4
m1 m2Pharmaceutical Firm 1 Pharmaceutical Firm 2
University of Massachusetts Amherst Pharmaceutical Product Supply Chains

Case I
The demand price functions corresponding to the three demandmarkets for each of the two brands 1 and 2 were as follows:
ρ11(d) = −1.1d11−0.9d21+275; ρ21(d) = −1.2d21−0.7d11+210;
ρ12(d) = −0.9d12−0.8d22+255; ρ22(d) = −1.0d22−0.5d12+200;
ρ13(d) = −1.4d13−1.0d23+265; ρ23(d) = −1.5d23−0.4d13+186.
These cost functions have been selected based on the averagevalues of the data corresponding to the prices, the shipping costs,etc., available on the web. The values of arc multipliers, in turn,although hypothetical, are constructed in order to reflect thepercentage of perishability / waste / loss associated with thevarious supply chain network activities in medical drug supplychains.
University of Massachusetts Amherst Pharmaceutical Product Supply Chains

Link Multipliers, Total Cost Functions and Link Flow Solution for Case I
Link a αa ca(fa) za(fa) f ∗a1 .95 5f 21 + 8f1 .5f 21 13.732 .97 7f 22 + 3f2 .4f 22 10.773 .96 6.5f 23 + 4f3 .3f 23 8.424 .98 5f 24 + 7f4 .35f 24 10.555 1.00 .7f 25 + f5 .5f 25 5.216 .99 .9f 26 + 2f6 .5f 26 3.367 1.00 .5f 27 + f7 .5f 27 4.478 .99 f 28 + 2f8 .6f 28 3.029 1.00 .7f 29 + 3f9 .6f 29 3.9210 1.00 .6f 210 + 1.5f10 .6f 210 3.5011 .99 .8f 211 + 2f11 .4f 211 3.1012 .99 .8f 212 + 5f12 .4f 212 2.3613 .98 .9f 213 + 4f13 .4f 213 2.6314 1.00 .8f 214 + 2f14 .5f 214 3.7915 .99 .9f 215 + 3f15 .5f 215 3.1216 1.00 1.1f 216 + 3f16 .6f 216 3.4317 .98 2f 217 + 3f17 .45f 217 8.2018 .99 2.5f 218 + f18 .55f 218 7.2519 .98 2.4f 219 + 1.5f19 .5f 219 7.9720 .98 1.8f 220 + 3f20 .3f 220 6.85
University of Massachusetts Amherst Pharmaceutical Product Supply Chains

Link Multipliers, Total Cost Functions and Solution for Case I (cont’d)
Link a αa ca(fa) za(fa) f ∗a21 .98 2.1f 221 + 3f21 .35f 221 5.4222 .99 1.9f 222 + 2.5f22 .5f 222 6.0023 1.00 .5f 223 + 2f23 .6f 223 3.5624 1.00 .7f 224 + f24 .6f 224 1.6625 .99 .5f 225 + .8f25 .6f 225 2.8226 .99 .6f 226 + f26 .45f 226 3.3427 .99 .7f 227 + .8f27 .4f 227 1.2428 .98 .4f 228 + .8f28 .45f 228 2.5929 1.00 .3f 229 + 3f29 .55f 229 3.4530 1.00 .75f 230 + f30 .55f 230 1.2831 1.00 .65f 231 + f31 .55f 231 3.0932 .99 .5f 232 + 2f32 .3f 232 2.5433 .99 .4f 233 + 3f33 .3f 233 3.4334 1.00 .5f 234 + 3.5f34 .4f 234 0.7535 .98 .4f 235 + 2f35 .55f 235 1.7236 .98 .3f 236 + 2.5f36 .55f 236 2.6437 .99 .55f 237 + 2f37 .55f 237 0.9538 1.00 .35f 238 + 2f38 .4f 238 3.4739 1.00 .4f 239 + 5f39 .4f 239 2.4740 .98 .55f 240 + 2f40 .6f 240 0.00
University of Massachusetts Amherst Pharmaceutical Product Supply Chains

Case I: Result Analysis
The values of the equilibrium link flows in Table 1 demonstrate theimpact of perishability of the product throughout the supply chainnetwork links of each pharmaceutical firm. Under the abovedemand price functions, the computed equilibrium demands foreach of the two brands were:
d∗11 = 10.32, d∗12 = 4.17, d∗13 = 8.41;
d∗21 = 7.66, d∗22 = 8.46, d∗23 = 1.69.
The incurred equilibrium prices associated with the branded drugsat each demand market were as follows:
ρ11 = 256.75, ρ12 = 244.48, ρ13 = 251.52;
ρ21 = 193.58, ρ22 = 189.46, ρ23 = 180.09.
University of Massachusetts Amherst Pharmaceutical Product Supply Chains

Case I: Result Analysis
Firm 1, which produces the top-selling product, captures themajority of the market share at demand markets 1 and 3, despitethe higher price. While this firm has a slight advantage over itscompetitor in demand market 1, it has almost entirely seizeddemand market 3. Consequently, several links connecting Firm 2 todemand market 3 have insignificant flows including link 40 with aflow equal to zero.
Firm 2 dominates demand market 2, due to the consumers’willingness to lean towards this product there, perhaps as aconsequence of the lower price, or the perception of quality, etc.,as compared to the product of Firm 1.
The profits of the two firms are:
U1 = 2, 936.52 and U2 = 1, 675.89.
University of Massachusetts Amherst Pharmaceutical Product Supply Chains
Case Study – Case II
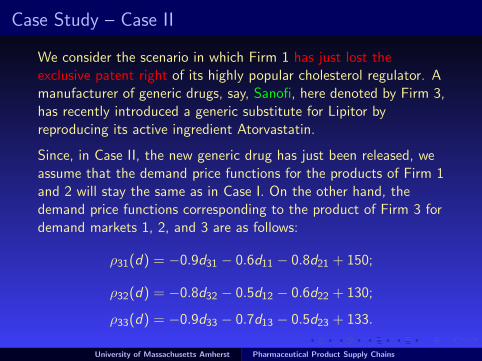
We consider the scenario in which Firm 1 has just lost theexclusive patent right of its highly popular cholesterol regulator. Amanufacturer of generic drugs, say, Sanofi, here denoted by Firm 3,has recently introduced a generic substitute for Lipitor byreproducing its active ingredient Atorvastatin.
Since, in Case II, the new generic drug has just been released, weassume that the demand price functions for the products of Firm 1and 2 will stay the same as in Case I. On the other hand, thedemand price functions corresponding to the product of Firm 3 fordemand markets 1, 2, and 3 are as follows:
ρ31(d) = −0.9d31 − 0.6d11 − 0.8d21 + 150;
ρ32(d) = −0.8d32 − 0.5d12 − 0.6d22 + 130;
ρ33(d) = −0.9d33 − 0.7d13 − 0.5d23 + 133.
University of Massachusetts Amherst Pharmaceutical Product Supply Chains

The Pharmaceutical Supply Chain Network Topology for Cases II and III
mR1mR2
mR3
PPPPPPPPP
23```````````````
24hhhhhhhhhhhhhhhhhhhhh
25 QQQQQs
26XXXXXXXXXXXX
27hhhhhhhhhhhhhhhhhh
28
?
29HHHHHHj
30XXXXXXXXXXXXz
31
?
32�������
33������������9
34 ���
��+
35������������
36((((((((((((((((((
37((((((((((((((((((((((
38
39���������
40���
49@@@R
50PPPPPPPPPq
51 ���������)
52���
53@@@R
54
D11,2
m mD12,2
mD13,2 D2
1,2m mD2
2,2mD2
3,2D31,1
m D32,1
m?
17
?
18
?
19
?
20
?
21
?
22
?
47
?
48
D11,1
m mD12,1
mD13,1 D2
1,1m mD2
2,1mD2
3,1D31,1
m D32,1
m����
@@@R
aaaaaaaa
!!!!!!!!
���
AAAU
5 6 7 8 9 10 ����
@@@R
aaaaaaaa
!!!!!!!!
���
AAAU
11 12 13 14 15 16
?
43HHHH
HHj
44
?
46����
���
45
M11
m mM12 M2
1m mM2
2M31
m mM32
���
1 @@@R
2 ���
3 @@@R
4���
41 @@@R
42
m1 m2m3Pharmaceutical Firm 1 Pharmaceutical Firm 2Pharmaceutical Firm 3
University of Massachusetts Amherst Pharmaceutical Product Supply Chains

Link Multipliers, Total Cost Functions and Link Flow Solution for Case II
Link a αa ca(fa) za(fa) f ∗a1 .95 5f 21 + 8f1 .5f 21 13.73
2 .97 7f 22 + 3f2 .4f 22 10.77
3 .96 6.5f 23 + 4f3 .3f 23 8.42
4 .98 5f 24 + 7f4 .35f 24 10.55
5 1.00 .7f 25 + f5 .5f 25 5.21
6 .99 .9f 26 + 2f6 .5f 26 3.36
7 1.00 .5f 27 + f7 .5f 27 4.47
8 .99 f 28 + 2f8 .6f 28 3.02
9 1.00 .7f 29 + 3f9 .6f 29 3.92
10 1.00 .6f 210 + 1.5f10 .6f 210 3.50
11 .99 .8f 211 + 2f11 .4f 211 3.10
12 .99 .8f 212 + 5f12 .4f 212 2.36
13 .98 .9f 213 + 4f13 .4f 213 2.63
14 1.00 .8f 214 + 2f14 .5f 214 3.79
15 .99 .9f 215 + 3f15 .5f 215 3.12
16 1.00 1.1f 216 + 3f16 .6f 216 3.43
17 .98 2f 217 + 3f17 .45f 217 8.20
18 .99 2.5f 218 + f18 .55f 218 7.25
19 .98 2.4f 219 + 1.5f19 .5f 219 7.97
20 .98 1.8f 220 + 3f20 .3f 220 6.85
21 .98 2.1f 221 + 3f21 .35f 221 5.42
22 .99 1.9f 222 + 2.5f22 .5f 222 6.00
23 1.00 .5f 223 + 2f23 .6f 223 3.56
24 1.00 .7f 224 + f24 .6f 224 1.66
25 .99 .5f 225 + .8f25 .6f 225 2.82
26 .99 .6f 226 + f26 .45f 226 3.34
27 .99 .7f 227 + .8f27 .4f 227 1.24
University of Massachusetts Amherst Pharmaceutical Product Supply Chains

Link Multipliers, Total Cost Functions and Solution for Case II (cont’d)
Link a αa ca(fa) za(fa) f ∗a28 .98 .4f 228 + .8f28 .45f 228 2.59
29 1.00 .3f 229 + 3f29 .55f 229 3.45
30 1.00 .75f 230 + f30 .55f 230 1.28
31 1.00 .65f 231 + f31 .55f 231 3.09
32 .99 .5f 232 + 2f32 .3f 232 2.54
33 .99 .4f 233 + 3f33 .3f 233 3.43
34 1.00 .5f 234 + 3.5f34 .4f 234 0.75
35 .98 .4f 235 + 2f35 .55f 235 1.72
36 .98 .3f 236 + 2.5f36 .55f 236 2.64
37 .99 .55f 237 + 2f37 .55f 237 0.95
38 1.00 .35f 238 + 2f38 .4f 238 3.47
39 1.00 .4f 239 + 5f39 .4f 239 2.47
40 .98 .55f 240 + 2f40 .6f 240 0.00
41 .97 3f 241 + 12f41 .3f 241 6.17
42 .96 2.7f 242 + 10f42 .4f 242 6.23
43 .98 1.1f 243 + 6f43 .45f 243 3.23
44 .98 .9f 244 + 5f44 .45f 244 2.75
45 .97 1.3f 245 + 6f45 .5f 245 3.60
46 .99 1.5f 246 + 7f46 .55f 246 2.38
47 .98 1.5f 247 + 4f47 .4f 247 6.66
48 .98 2.1f 248 + 6f48 .45f 248 5.05
49 .99 .6f 249 + 3f49 .55f 249 3.79
50 1.00 .7f 250 + 2f50 .7f 250 1.94
51 .98 .6f 251 + 7f51 .45f 251 0.79
52 .99 .9f 252 + 9f52 .5f 252 1.43
53 1.00 .55f 253 + 6f53 .55f 253 1.23
54 .98 .8f 254 + 4f54 .5f 254 2.28
University of Massachusetts Amherst Pharmaceutical Product Supply Chains
Case II: Result Analysis
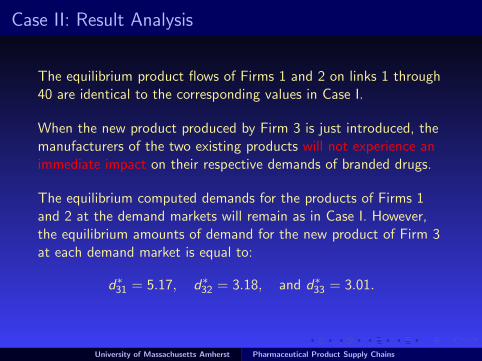
The equilibrium product flows of Firms 1 and 2 on links 1 through40 are identical to the corresponding values in Case I.
When the new product produced by Firm 3 is just introduced, themanufacturers of the two existing products will not experience animmediate impact on their respective demands of branded drugs.
The equilibrium computed demands for the products of Firms 1and 2 at the demand markets will remain as in Case I. However,the equilibrium amounts of demand for the new product of Firm 3at each demand market is equal to:
d∗31 = 5.17, d∗32 = 3.18, and d∗33 = 3.01.
University of Massachusetts Amherst Pharmaceutical Product Supply Chains

Case II: Result Analysis
The equilibrium prices associated with the branded drugs 1 and 2at the demand markets will not change, whereas the incurredequilibrium prices of generic drug 3 are as follows:
ρ31 = 133.02, ρ32 = 120.30, and ρ33 = 123.55,
which is significantly lower than the respective prices of itscompetitors in all the demand markets.
The profit that Firm 3 derived from manufacturing and deliveringthe new generic substitute to these 3 markets is:
U3 = 637.38,
while the profits of Firms 1 and 2 remain unchanged.
University of Massachusetts Amherst Pharmaceutical Product Supply Chains

Case Study – Case III
The generic product of Firm 3 has now been well established, and,thus, has affected the behavior of the consumers through thedemand price functions of the relatively more recognized productsof Firms 1 and 2. The demand price functions are now given by:
Firm 1: ρ11(d) = −1.1d11 − 0.9d21 − 1.0d31 + 192;
ρ12(d) = −0.9d12 − 0.8d22 − 0.7d32 + 166;
ρ13(d) = −1.4d13 − 1.0d23 − 0.5d33 + 173;
Firm 2: ρ21(d) = −1.2d21 − 0.7d11 − 0.8d31 + 176;
ρ22(d) = −1.0d22 − 0.5d12 − 0.8d32 + 146;
ρ23(d) = −1.5d23 − 0.4d13 − 0.7d33 + 164;
Firm 3: ρ31(d) = −0.9d31 − 0.6d11 − 0.8d21 + 170;
ρ32(d) = −0.8d32 − 0.5d12 − 0.6d22 + 153;
ρ33(d) = −0.9d33 − 0.7d13 − 0.5d23 + 157.
University of Massachusetts Amherst Pharmaceutical Product Supply Chains

Link Multipliers, Total Cost Functions and Link Flow Solution for Case III
Link a αa ca(fa) za(fa) f ∗a1 .95 5f 21 + 8f1 .5f 21 8.42
2 .97 7f 22 + 3f2 .4f 22 6.72
3 .96 6.5f 23 + 4f3 .3f 23 6.42
4 .98 5f 24 + 7f4 .35f 24 8.01
5 1.00 .7f 25 + f5 .5f 25 3.20
6 .99 .9f 26 + 2f6 .5f 26 2.07
7 1.00 .5f 27 + f7 .5f 27 2.73
8 .99 f 28 + 2f8 .6f 28 1.85
9 1.00 .7f 29 + 3f9 .6f 29 2.44
10 1.00 .6f 210 + 1.5f10 .6f 210 2.23
11 .99 .8f 211 + 2f11 .4f 211 2.42
12 .99 .8f 212 + 5f12 .4f 212 1.75
13 .98 .9f 213 + 4f13 .4f 213 2.00
14 1.00 .8f 214 + 2f14 .5f 214 2.84
15 .99 .9f 215 + 3f15 .5f 215 2.40
16 1.00 1.1f 216 + 3f16 .6f 216 2.60
17 .98 2f 217 + 3f17 .45f 217 5.02
18 .99 2.5f 218 + f18 .55f 218 4.49
19 .98 2.4f 219 + 1.5f19 .5f 219 4.96
20 .98 1.8f 220 + 3f20 .3f 220 5.23
21 .98 2.1f 221 + 3f21 .35f 221 4.11
22 .99 1.9f 222 + 2.5f22 .5f 222 4.56
23 1.00 .5f 223 + 2f23 .6f 223 2.44
24 1.00 .7f 224 + f24 .6f 224 1.47
25 .99 .5f 225 + .8f25 .6f 225 1.02
26 .99 .6f 226 + f26 .45f 226 2.48
27 .99 .7f 227 + .8f27 .4f 227 1.31
University of Massachusetts Amherst Pharmaceutical Product Supply Chains

Link Multipliers, Total Cost Functions and Solution for Case III (cont’d)
Link a αa ca(fa) za(fa) f ∗a28 .98 .4f 228 + .8f28 .45f 228 0.66
29 1.00 .3f 229 + 3f29 .55f 229 2.29
30 1.00 .75f 230 + f30 .55f 230 1.29
31 1.00 .65f 231 + f31 .55f 231 1.28
32 .99 .5f 232 + 2f32 .3f 232 2.74
33 .99 .4f 233 + 3f33 .3f 233 0.00
34 1.00 .5f 234 + 3.5f34 .4f 234 2.39
35 .98 .4f 235 + 2f35 .55f 235 1.82
36 .98 .3f 236 + 2.5f36 .55f 236 0.00
37 .99 .55f 237 + 2f37 .55f 237 2.21
38 1.00 .35f 238 + 2f38 .4f 238 3.46
39 1.00 .4f 239 + 5f39 .4f 239 0.00
40 .98 .55f 240 + 2f40 .6f 240 1.05
41 .97 3f 241 + 12f41 .3f 241 8.08
42 .96 2.7f 242 + 10f42 .4f 242 8.13
43 .98 1.1f 243 + 6f43 .45f 243 4.21
44 .98 .9f 244 + 5f44 .45f 244 3.63
45 .97 1.3f 245 + 6f45 .5f 245 4.62
46 .99 1.5f 246 + 7f46 .55f 246 3.19
47 .98 1.5f 247 + 4f47 .4f 247 8.60
48 .98 2.1f 248 + 6f48 .45f 248 6.72
49 .99 .6f 249 + 3f49 .55f 249 3.63
50 1.00 .7f 250 + 2f50 .7f 250 3.39
51 .98 .6f 251 + 7f51 .45f 251 1.41
52 .99 .9f 252 + 9f52 .5f 252 1.12
53 1.00 .55f 253 + 6f53 .55f 253 2.86
54 .98 .8f 254 + 4f54 .5f 254 2.60
University of Massachusetts Amherst Pharmaceutical Product Supply Chains

Case III: Results
The computed equilibrium demands and sales prices for theproducts of Firms 1, 2, and 3 are as follows:
d∗11 = 7.18, d∗12 = 4.06, d∗13 = 2.93,
d∗21 = 7.96, d∗22 = 0.00, d∗23 = 5.60,
d∗31 = 4.70, d∗32 = 6.25, and d∗33 = 3.93.
ρ11 = 172.24, ρ12 = 157.97, ρ13 = 161.33,
ρ21 = 157.66, ρ22 = 138.97, ρ23 = 151.67,
ρ31 = 155.09, ρ32 = 145.97, and ρ33 = 148.61.
The computed amounts of profit for each of the three competitorsare as follows:
U1 = 1, 199.87, U2 = 1, 062.73, and U3 = 980.83.
University of Massachusetts Amherst Pharmaceutical Product Supply Chains

Case III: Result Analysis
As a result of the consumers’ growing inclination towards thegeneric substitute of the previously popular Lipitor, Firm 2 has lostits entire share of market 2 to its competitors, resulting in zeroflows on several links. Similarly, Firm 1 now has declining sales ofits brand in demand markets 1 and 3.
As expected, the introduction of the generic substitute ofcholesterol regulators has also caused remarkable drops in theprices of the existing brands. Interestingly, the decrease in the priceof Firm 1’s product - Lipitor - in demand markets 2 and 3 exceeds35%.
Note that simultaneous declines in the amounts of demand andsales price has caused a severe reduction in the profits of Firms 1and 2. This decline for Firm 1 is observed to be as high as 60%.
University of Massachusetts Amherst Pharmaceutical Product Supply Chains

Summary
A new supply chain network model for the study of oligopolisticcompetition among the producers of a perishable product – that ofpharmaceuticals. The contributions of this paper are:
I a new oligopolistic supply chain network model, based onvariational inequality theory, that captures the perishability ofpharmaceuticals through the use of arc multipliers, thatassesses the discarding cost associated with the disposal ofwaste / perished products in the supply chain networkactivities, and that includes product differentiation by theconsumers, capturing, for example, as to whether or not theproducts are branded or generic; and
I a case study focused on a real-world scenario ofcholesterol-lowering drugs, with the investigation of theimpacts of patent rights expiration and generic drugcompetition.
University of Massachusetts Amherst Pharmaceutical Product Supply Chains

Thank You!
For more information, see: http://supernet.isenberg.umass.eduUniversity of Massachusetts Amherst Pharmaceutical Product Supply Chains