Embed Size (px)
Citation preview

A survey of Aboriginal water interestsSummary report
October 2016
Dr Susan Goff

A survey of Aboriginal water interests in the Murray–Darling Basin
Published by the Murray‒Darling Basin Authority
Postal Address: GPO Box 1801, Canberra ACT 2601Telephone: (02) 6279 0100 international + 61 2 6279 0100Facsimile: (02) 6248 8053 international + 61 2 6248 8053Email: [email protected]: www.mdba.gov.au
MDBA publication no.: 28/16ISBN (print): 978-1-925221-72-5ISBN (online): 978-1-925221-73-2
All material and work produced by the Murray‒Darling Basin Authority constitutes Commonwealth copyright. MDBA reserves the right to set out the terms and conditions for the use of such material.
With the exception of the Commonwealth Coat of Arms, photographs, the Murray‒Darling Basin Authority logo or other logos and emblems, any material protected by a trade mark, any content provided by third parties, and where otherwise noted, all material presented in this publication is provided under a Creative Commons Attribution 3.0 Australia licence.
http://creativecommons.org/licenses/by/3.0/au© Murray‒Darling Basin Authority 2016
The Murray‒Darling Basin Authority’s preference is that you attribute this publication (and any Murray‒Darling Basin Authority material sourced from it) using the following wording within your work:
Title: A survey of Aboriginal water interests in the Murray–Darling Basin – A summary reportSource: Licensed from the Murray‒Darling Basin Authority under a Creative Commons Attribution 3.0 Australia Licence
As far as practicable, material for which the copyright is owned by a third party will be clearly labelled. The Murray‒Darling Basin Authority has made all reasonable efforts to ensure that this material has been reproduced in this publication with the full consent of the copyright owners.
Inquiries regarding the licence and any use of this publication are welcome by contacting the Murray‒Darling Basin Authority.
Cover image: Elders at Broken Hill completing the water interests survey, 2012 (photo by Susan Goff).
DisclaimerTo the extent permitted by law, the Murray‒Darling Basin Authority and the Commonwealth excludes all liability to any person for any consequences, including but not limited to all losses, damages, costs, expenses and any other compensation, arising directly or indirectly from using this report (in part or in whole) and any information or material contained within it.
AccessibilityThe Murray‒Darling Basin Authority makes its documents and information available in accessible formats. On some occasions the highly technical nature of the document means that we cannot make some sections fully accessible. If you encounter accessibility problems or the document is in a format that you cannot access, please contact us.
Page 2

A survey of Aboriginal water interests in the Murray–Darling Basin
Acknowledgement of the Traditional Owners of the Murray–Darling Basin
The Murray–Darling Basin Authority acknowledges and pays respect to the Traditional Owners, and their Nations, of the Murray–Darling Basin, who have a deep cultural, social, environmental, spiritual and economic connection to their lands and waters. The MDBA understands the need for recognition of Traditional Owner knowledge and cultural values in natural resource management associated with the basin.
The approach of Traditional Owners to caring for the natural landscape, including water, can be expressed in the words of Darren Perry (Chair of the Murray Lower Darling Rivers Indigenous Nations) —
‘the environment that Aboriginal people know as Country has not been allowed to have a voice in contemporary Australia. Aboriginal First Nations have been listening to Country for many thousands of years and can speak for Country so that others can know what Country needs. Through the Murray Lower Darling Rivers Indigenous Nations and the Northern Basin Aboriginal Nations the voice of Country can be heard by all’.
This report may contain photographs or quotes by Aboriginal people who have passed away. The use of terms ‘Aboriginal’ and ‘Indigenous’ reflects usage in different communities within the Murray–Darling Basin.
The author acknowledges Neil Ward, Director Aboriginal Partnerships who formulated the original socio-economic survey and commissioned this report, and Phil Townsend, Senior Advisor and Economic Analyses who provided valuable critical review of an early draft of the report.
Additionally, appreciation is given to the Aboriginal town facilitators, MDBA staff and consultants who assisted with the administration of the survey, and to the generosity of the Aboriginal people living in the basin and who took the time to respond to the questions. The MDBA also acknowledges in principle support for the survey and its administration given by Murray Lower Darling River Indigenous Nations and Northern Basin Aboriginal Nations.
The report was prepared by Dr Susan Goff, Principal, CultureShift Pty Ltd.
Page 3

A survey of Aboriginal water interests in the Murray–Darling Basin
Contents
Tables..............................................................................................................................................5Figures.............................................................................................................................................5Summary.........................................................................................................................................6
The story of Aboriginal water-related socioeconomic interests in the Murray–Darling Basin......6
Overview..........................................................................................................................................8
History of the survey....................................................................................................................8
Scope of the survey tool..............................................................................................................8
Limitations of the survey and how to read the findings................................................................9
The value of the survey..............................................................................................................10
The structure of the report.........................................................................................................10
Findings.........................................................................................................................................11
Introduction................................................................................................................................11
Demographic findings................................................................................................................11
Nation identities......................................................................................................................11
Town of residence..................................................................................................................12
Socio-economic findings............................................................................................................15
Education and training............................................................................................................15
Employment and income........................................................................................................19
Health and wellbeing..................................................................................................................26
Self-determination......................................................................................................................33
Water-related interests...............................................................................................................37
Perspectives on the balance of water management in the basin...........................................37
Knowing about water management........................................................................................40
Water-dependent employment...............................................................................................43
Last comments...........................................................................................................................44
References....................................................................................................................................46Appendices....................................................................................................................................48
Table A: Analysis of open-ended responses to Q 37, on further education..............................48
Table B: Analysis of open-ended responses to Q 3...............................................................49
Table C: Analysis of open-ended responses to Q 5...............................................................50
Table D: Analysis of open-ended responses to Qs 8, 12 and 13...........................................51
Table E: Analysis of open-ended responses to Qs 10 and 11...............................................52
Page 4

A survey of Aboriginal water interests in the Murray–Darling Basin
TablesTable 1: Duration of residency over 10 years................................................................................31
Table 2: Other forms of participation in governance.....................................................................36
FiguresFigure 1: Respondents' Nation identities in the basin...................................................................12Figure 2: Townships where survey collected showing Nation identities
represented in the survey.......................................................................................................13Figure 3: Age distribution of respondents......................................................................................14Figure 4: Gender distribution of respondents................................................................................14Figure 5: Percentage of respondents who completed Year 12.....................................................16Figure 6: Gender distribution of respondents in reference to educational attainment...................17Figure 7: Age distribution of respondents who completed year 12...............................................18Figure 8: Respondents' employment situation..............................................................................20Figure 9: Duration of employed respondents' experiences of unemployment..............................21Figure 10: Duration of unemployed respondent's experiences of unemployment........................22Figure 11: Duration of unemployed respondents’ experiences of
unemployment over one year.................................................................................................23Figure 12: Types of employment...................................................................................................24Figure 13: Type of respondents' employer....................................................................................25Figure 14: Employed respondents' levels of satisfaction with employment..................................25Figure 16: Respondents' self-assessed health status...................................................................27Figure 17: Respondents living on their Country............................................................................28Figure 18: The regularity of visiting Country for those who do not live on Country.......................29Figure 19: Permanency of residency in current community..........................................................30Figure 20: Reasons for moving to current location........................................................................32Figure 21: Reasons for leaving current location............................................................................32Figure 22: Respondents' participation in community and organisational governance..................34Figure 23: The purposes of respondents' governance activities...................................................35Figure 24: Respondents' views regarding the balance between water for irrigation
and water for the environment as at June 2013.....................................................................38Figure 25: Respondents' views regarding more water for the environment and
less for irrigation.....................................................................................................................39Figure 26: Levels of respondents' awareness of government approaches to
water management in the basin.............................................................................................40Figure 27: Sources of information regarding government's approaches to
water management in the basin.............................................................................................41Figure 28: Degree of respondents' ownership of water licenses...................................................42Figure 29: Respondents' experiences of water-dependent employment in the basin...................43Figure 30: Water-dependent industries that have employed Aboriginal people in the basin........44
Page 5

A survey of Aboriginal water interests in the Murray–Darling Basin
SummaryThe survey that informs this report explores three areas of inquiry:
a) Demographic characteristics of the Aboriginal population that responded to the community consultations for the Draft Basin Plan (MDBA, 2011)
b) Participant views about their socio-economic conditions at that time, and c) Participant knowledge of water management in the basin.
The survey attracted 280 responses, representing 0.4% of the Aboriginal population in the basin (2006 figures).
The story of Aboriginal water-related interests in the Murray–Darling Basin The respondents identified with 32 of the 43 Sovereign Nation identities offered to choose
from in the survey. 92.5% of respondents identified with Aboriginal Sovereign Nations in the basin. With regard to educational experience, 79.6% of the sample group had not completed
Year 12 or equivalent, and neither gender nor age appear to have influenced this result. This figure is consistent with national averages for Aboriginal educational attainment of Year 12 as at 2008.
Approximately 13% of the whole sample group held diploma or degree-level qualifications. This level of attainment compares to 24% across the whole Australian population, but is relatively high compared to national figures for tertiary educational attainment within Aboriginal populations.
Despite the relatively high levels of further education and qualification, the sample group was experiencing 55% unemployment. 70% of the unemployed were experiencing long-term unemployment of over a year and in many cases considerably longer (56% unemployed for over 5 – 20 plus years). This compares to 6% unemployment for the whole Australian population.
For those who are employed, 71.3% of the respondents enjoyed full-time work. Aboriginal and government organisations were major employers, and workplace satisfaction was relatively high even though levels of income were relatively low ($600/household and less).
The basin’s Aboriginal population is not a transient group, with 82.3% of the respondents residing in the same home for the last five years. This compares to a national figure for stable Aboriginal residency over 5 years of 57% (ABS, 2006).
A very high proportion of respondents have lived in their current location for over five years, and most people (87%) have lived there for most (over 20 years) - or all - their lives
Of further interest, 77.4% of the respondents are living on their Country. Barkindji (Paakantyil) Nation had the highest populated Nation category for respondents to the survey living on their Country.
Those living on their Country were less likely to be employed (44% as compared to 51% of those not living on Country), which resulted in a lower income level and increased likelihood of working for Aboriginal organisations for those living on Country. Those not living on Country are more likely to have an income over $600 per week and to be employed by a government agency.
Page 6

A survey of Aboriginal water interests in the Murray–Darling Basin
For those not living on Country, visiting their Country was an established cultural practice with only 6.7% never visiting their Country. Wilcannia presented as the town with the highest percentage of respondents living on their Country (18.8%).
Family was the primary motivation for choice and permanency of residence for this population.
65.6% of the respondent group participated on boards, committees or advisory groups. Land Councils and cultural management took up the majority of responses and youth (ABS, 2010) support the least.
A very high majority of people (85.2%) was interested to earn and income by caring for Country.
When asked about their views, 59.6% of the respondents thought the current balance (as at June 2013) of water for irrigation and water for the environment was bad for Country, and 28.7% that it was good for economy. Benefits for the economy were largely expressed in terms of the national economy, and there were many comments about how this had little value for Aboriginal people in the basin with regard to access to jobs.
76.6% of the respondents thought more water for the environment and less for irrigation would be good for Country and a further 25.5% that it would also be good for economy (15% thought it would be bad for economy).
They were also of the view that more understanding and management ability with the balance between water for the environment and water for irrigation was needed in water management.
67.4% of respondents did not have information about how the government manages water in the basin. A high majority (83.9%) of those who did know about water management did so because they were interested in the river systems and environmental health and not because of government sources of information.
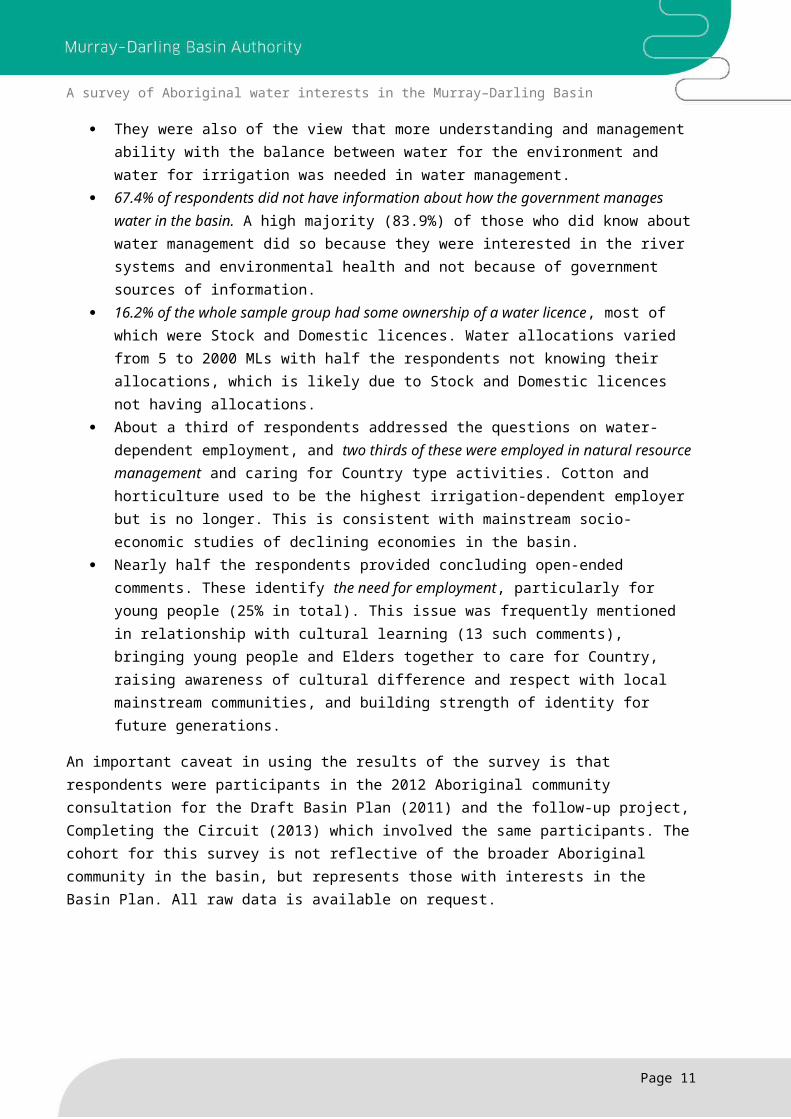
16.2% of the whole sample group had some ownership of a water licence, most of which were Stock and Domestic licences. Water allocations varied from 5 to 2000 MLs with half the respondents not knowing their allocations, which is likely due to Stock and Domestic licences not having allocations.
About a third of respondents addressed the questions on water-dependent employment, and two thirds of these were employed in natural resource management and caring for Country type activities. Cotton and horticulture used to be the highest irrigation-dependent employer but is no longer. This is consistent with mainstream socio-economic studies of declining economies in the basin.
Nearly half the respondents provided concluding open-ended comments. These identify the need for employment, particularly for young people (25% in total). This issue was frequently mentioned in relationship with cultural learning (13 such comments), bringing young people and Elders together to care for Country, raising awareness of cultural difference and respect with local mainstream communities, and building strength of identity for future generations.
An important caveat in using the results of the survey is that respondents were participants in the 2012 Aboriginal community consultation for the Draft Basin Plan (2011) and the follow-up project, Completing the Circuit (2013) which involved the same participants. The cohort for this survey is not reflective of the broader Aboriginal community in the basin, but represents those with interests in the Basin Plan. All raw data is available on request.
Page 7

A survey of Aboriginal water interests in the Murray–Darling Basin
Overview
History of the surveyThis report is a summary of a socio-economic survey of Aboriginal water-related interests in the Murray–Darling Basin.
Between 2012 and 2013, the Murray–Darling Basin Authority’s Aboriginal unit (now Aboriginal Partnerships) conducted a survey in collaboration with the MDBA’s socio-economic team. This first iteration of the survey was a component of the Aboriginal community engagement program for the Draft Basin Plan, which took place in 33 Aboriginal communities throughout the basin between January and May 2012. This initial engagement collected 33 responses.
A second round of consultation referred to as “Completing the Circuit” was carried out by Aboriginal Partnerships in 2013 and provided the opportunity to develop an updated iteration of the survey with the same participants as the earlier engagement strategy while seeking to increase the numbers of respondents to the survey.
Teams of Aboriginal Town Facilitators and Aboriginal and non-Aboriginal consultants administered the second iteration of the survey in face-to-face interactions with the individual respondents. 247 additional responses were gathered. This report provides analysis of the results from both iterations, with all 280 responses incorporated into the one computerised survey database.
Scope of the survey toolThe purpose of the survey was to produce a baseline reading about socio-economic water-related interests in the basin that affect people identifying with an Aboriginal background. The scope explores such interests from both non-Aboriginal and Aboriginal socio-economic surveying perspectives.
The demographic data includes age, gender, location of habitation and Aboriginal Nation identification. The socio-economic questions include employment, unemployment, income, education and training, and health and wellbeing including relationships to Country and self-determination. Finally, the survey covers questions about water-related interests such as views about watering regimes in the basin, accessing information about and participation in the water market.
The survey invited many opportunities for qualitative responses. These responses have been analysed by the author, and added to this survey overview. The details of the analyses are included in a series of tables in the Appendix. The tables are:
• Table A: Analysis of open-ended responses to Question (Q) 37, on further education• Table B: Analysis of open-ended responses to Q 3, exploring responses to Q 2 on the
current balance between water for irrigation and water for the environment as at June 2013
Page 8

A survey of Aboriginal water interests in the Murray–Darling Basin
• Table C: Analysis of open-ended responses to Q 5, exploring responses to Q 4 on changing the balance between water for irrigation and water for the environment to less for irrigation and more for the environment
• Table D: Analysis of open-ended responses to Qs 8,12 and 13 regarding sources of information about water management, licensing, and river and wetland health
• Table E: Analysis of open-ended responses to Qs 10 and 11 regarding types of water licenses held by Aboriginal people and their organisations, and water allocations related to licenses.
The second implementation of the survey produced a series of notes about improving the wording of the survey for future use. Many of these improvements are incorporated into a third iteration of the survey in a manner that does not affect the data.
Limitations of the survey and how to read the findingsAs the survey was delivered to a population that was responding to the Draft Basin Plan, the survey respondents are not a randomly selected sample of the Aboriginal population living in the basin. The sample is biased towards Aboriginal respondents who have an interest in water-related interests.
Of the 280 responses, no respondents answered all 39-survey questions. Ten questions attracted less than 100 responses (or less than a 37% response rate). The lowest response rate for a single question was Q 30 (regarding place of residence for respondents who had lived in their current location for less than two years) 11/280 or 4%. Twelve questions attracted between 100–200/280 responses, and 17 questions attracted over 200/280 responses (or 71.4% response rate).
In terms of representation, the estimated Aboriginal population in the basin at the time was 68,500 (ABS/ABARE/BRS, 2011, p.25). 280 responses represent 0.4% of this population, which is statistically insignificant with regard to generalising any findings to the whole Aboriginal population in the basin. This is to say that numbers of responses do not represent statistically significant percentages of populations of a Nation or township’s Aboriginal population1. Survey answering was linked to submission making: the numbers of submissions from each Nation or township were dependent on many factors including interest in the Draft Basin Plan.
Additionally, numbers of responses to a question do not represent more or less interest in a question: some questions were conditional and only required responses if the question applied to the respondent. The numbers of responses to each question as listed in the charts included in this report also does not take into account the contributions to an open-ended “other” option, which was provided with most questions, and in some instances attracted large numbers of additional contributions.
Each chart in the report is given the “n” value to provide the reader with the total number of respondents for each question. Each summary and commentary of the findings also presents this information. Use of this survey must identify the response rate to the question being considered
1 Relationships of less than +1.00 or -1.00 are too small to infer generalisations (Graziano, A. & Raulin, M.1993, Research methods: a process of inquiry. Second Edition. Harper Collins College Publishers. N.Y. p. 149)
Page 9

A survey of Aboriginal water interests in the Murray–Darling Basin
to afford the reader an accurate understanding of the finding. This risk also affects the validity of any cross tabulations.
Finally, the survey was conducted in 2012 and 2013. Being published in 2016 produces a slight anachronistic relationship between more current, triangulating research and the findings at the time of the survey. As a result only limited reference has been made to updated reports such as the Prime Minister’s Closing the Gap report (Department of the Prime Minister and Cabinet, 2016) and more recent ABS data.
The value of the surveyWith these limitations in mind, the value of the survey is that it invites Aboriginal people in the basin to give their views about water-related socio-economic matters where those matters are sensitive to Aboriginal values.
Such cultural distinctions include Nation identification, cultural obligations, relationships to Country, attitudes towards the environment, intergenerational responsibilities and concerns, experiences of health and wellbeing and qualities of infrastructure and life in Aboriginal populations in rural communities in the basin.
Western socio-economic values for the basin as indicated by for example, socio-economic reporting carried out by the Australian Bureau of Statistics reflect monetary values from the use of water for agriculture, mining, power generation and manufacturing and export related to these industries (ABS, 2012). This is not to say that all Aboriginal people do not share western views about the socio-economic value of the basin; it is to say that no generalisations can be made and that sensitivity towards Aboriginal values needs to inform the socio-economic value of the basin with regard to Aboriginal experiences.
At the time of conducting the survey (2012–13) Aboriginal views about water interests in the basin had not been previously surveyed, nor had they been surveyed through Aboriginal socio-economic perspectives. The Murray–Darling Basin is a relatively new geographical region in terms of western research (Arthur, 2010, p.1), and agencies have had little opportunity to collect data.
Bearing the bias of the cohort in mind, the response rate of over 70% in over 40% of the questions gives a cautiously informed picture about Aboriginal water related interests with regard to the basin. This report provides a baseline, which can be built upon over time with the re-use of the final version of the survey.
The structure of the reportFollowing this overview is an analysis of the survey’s findings, a reference list of literature and an Appendix. The Appendix includes five tables that detail qualitative responses from open-ended questions as reported in the main body of the report.
Page 10
A survey of Aboriginal water interests in the Murray–Darling Basin
Findings
IntroductionThis overview of the Aboriginal Socio-Economic Survey is structured around the three areas of interest that the survey addresses:
• Demographic information• Socio-economic information, and• Water-related interests.
The tables that represent response rates to questions are as produced through the computerised data management program, Survey Monkey. As this is a summary report and intended to identify a baseline of adequate information to support ongoing engagement with Aboriginal populations in the Murray–Darling Basin, the report does not carry out extensive triangulating analysis. Its purpose is to report rather than test the survey results.
Demographic findings
Nation identities
‘Cultural identity is a large factor… for our health and wellbeing; knowing who you are and your connections provides a better quality of life, and healthy knowledge is also a key to life.’
(Male respondent, 25–54 age bracket, Barkindji (Paakantyil) Nation, Wilcannia)
The survey asked respondents to choose Aboriginal Nations in the basin with which they identified (Q17). The survey offered 43 Aboriginal Nation options, consistent with those listed as member Nations by MLDRIN and NBAN in 2012. 259/280 (92.5%) of the sample group responded to the question. Figure 1 presents this information.
Page 11

A survey of Aboriginal water interests in the Murray–Darling Basin
Figure 1: Respondents' Nation identities in the basin
Some respondents chose more than one Nation with which they identified: identification can be through both maternal and paternal lines of heritance. As Figure 1 shows, Barkindji (Paakantyil), Gamillaroi, Wamba Wamba, Wiradjuri and Yorta Yorta Nations are those with the highest representation in the survey.
This result does not indicate that they are the most populous in the basin; it reflects the highest Nation responses to the invitation to provide submissions to the Aboriginal community consultation for the Draft Basin Plan in early 2012, and who also agreed to complete the survey.
Town of residenceThe survey asked respondents to identify their current town of residence (Q 1). 296/280 (96%) of participants responded. 38 options were provided in the survey. The townships of Wilcannia, Bourke, Deniliquin, Cunnamulla and Tamworth yielded the highest numbers of surveys. This information is important to understand any local influences informing responses that are brought into overall results.
Exploring the dataFigure 2 is a reading of the survey that indicates the cultural identities and extent of diversity of Nations in townships. Such a reading is relevant to engagement strategies, research findings and policy development, as well as water planning strategies that are culturally informed – in this case about the diversity of specified Nations in townships.
As before, it is important to note that the information only reflects the identities of those answering the survey and is not demographically accurate.
Page 12

A survey of Aboriginal water interests in the Murray–Darling Basin
Figure 2: Nations represented in each of the townships where the survey was undertaken
The chart shows that all respondents in Wilcannia, Menindee and Broken Hill identified with Barkindji Nation, whereas all respondents in Moree and Collarenebri identified with Gamillaroi Nation. By comparison, Deniliquin respondents reflected a greater diversity of Nation identifications including Barkindji, Gamillaroi, Wamba Wamba, Wiradjeri and Yorta Yorta. This finding is important to interpreting results on a township basis with regard to cultural identities.
Other demographic information gathered through the survey includes gender and age of respondents. 98.5% of the sample population answered the question on gender, and 98% answered the questions on age.
As Figure 3 shows, the majority of respondents (54%) were in the 25–54 year age bracket. This finding is shaped by the way the age categories were determined in the original draft of the survey reflecting Aboriginal seniority and life expectancy (55 to 64 years, and 65 years plus). This categorisation is not consistent with ABS age categories.
Page 13

A survey of Aboriginal water interests in the Murray–Darling Basin
Figure 3: Age distribution of respondents
Figure 4 illustrates the gender balance of respondents. It shows that slightly more females to males participated in the survey (51.4% – 48.6% of those responding respectively).
Figure 4: Gender distribution of respondents
Page 14

A survey of Aboriginal water interests in the Murray–Darling Basin
Socio-economic findings
‘This is a very poor community. Most people are on Centrelink – CDP – only a few good paying jobs in town. There used to be a lot of work here on the properties – we had 2 cafes, 2 shops, a chemist, a great baker. All have gone because the properties don't employ anymore.’
(Female respondent, over 65 years bracket, Murrawarri Nation, Goodooga, NSW)2
The survey explored Aboriginal experiences and perspectives of socio-economic questions relating to education and training, employment, income, health and wellbeing and self-determination.
The main street in Goodooga illustrating isolation and poor amenity associated with low socioeconomic realities
Education and training
“I went on to get a Diploma in Education at the Sydney Uni in 1996, after leaving school at 14 years 2 months.”
(Female respondent, over 65 years age bracket, Maljangapa Nation, Broken Hill, NSW)
There were two questions in the survey about education and training. The first question asks if respondents completed Year 12. Figure 5 shows the findings.
2 Currently there are no shops and only one club in Goodooga, residents have to drive for one hour to obtain essentials such as food and fuel.
Page 15

A survey of Aboriginal water interests in the Murray–Darling Basin
Figure 5: Percentage of respondents who completed Year 12
97.8% of respondents answered the question, of which 79.6% had not completed Year 12. ABS statistics (2010) report that nationally, Aboriginal attainment of Year 12 for individuals 15 years and over was 22%, which indicates that this survey result of 20.4% in 2013 was consistent with a national average even though the measure was made some three years later.
The COAG (2014, p.11) Prime Minister’s Report reviewing the Closing the Gap strategy reports that unpublished ABS 2011 Census research finds that for 20–24 year old Aboriginal Australians living in inner regional Australia, 68.1% had attained Year 12 or equivalent which compares to results for this survey for the same age group of 58.3%. However, this result only reflects 7 individuals.
A gender analysis regarding attainment of Year 12 is instructive, as Figure 6 illustrates.
Page 16

A survey of Aboriginal water interests in the Murray–Darling Basin
Figure 6: Gender distribution of respondents in reference to educational attainment
Figure 6 reveals that for this cohort there is only a modest gender difference in participation in mainstream education to Year 12: males are slightly more involved than females (21.7% compared to 19.7% of respondents). Gender does not appear to play a role in low participation.
Figure 7 shows that 58.3% of the under 25 year age bracket completed Year 12.
This is an improvement on older generations and their parents’ generations completion rates of Year 12 (25.5%), but still a very low rate compared to the national average of 85% in 2011 (COAG Reform Council, 2013, p.48).
The indicative finding is that the achievement of Year 12 is low across the board in Aboriginal communities in the basin. This reality is not related to either gender or age, and is consistent across different eras of Aboriginal participation in western educational systems.
Page 17

A survey of Aboriginal water interests in the Murray–Darling Basin
Figure 7: Age distribution of respondents who completed year 12
The second question about education and training was an open-ended option, asking respondents to identify any further education in which they had engaged. 75.7% of the sample group responded to the open-ended question.
Table A in the Appendix presents further analyses of educational themes arising from the qualitative responses and according to age groups. Cross tabulation showed that 75% of respondents under 25 years have some kind of qualification in further education, 82.7% in the 25–54 year age group, 76.1% in the 55–64 year age group and 58.6% in the 65 years and over age bracket.
The analysis does not take into account professional development, on the job training and general life experience, which were identified as being valuable by some respondents. The numbers represent qualifications that are evident in the responses. Many respondents hold multiple certificates in diverse industries, and the fact that approximately3 13% of the response group (27 individuals) of the whole sample group holds a degree or diploma level qualification is also noteworthy.
This indicative finding compares favourably to ABS (2010) research into non-school qualifications which notes that 40% of Aboriginal people attained a non-school qualification (compared to 62% of non-indigenous populations). Of those who attained a qualification, 7% achieved a Bachelor Degree or above (as compared to 26% for non-indigenous population) and 6% an Advanced Diploma or Diploma.
3 Some of the responses made generalized descriptions (such as “several TAFE certificates”), which produced an approximate rather than a specific finding.
Page 18

A survey of Aboriginal water interests in the Murray–Darling Basin
This question throws a different light on the question of education and shows the relatively high level of further education in the Aboriginal communities in the basin across all age groups despite the low level of attainment of Year 12. This is in part due to government funded training programs over the years to encourage people into the workforce, but indicates a depth of human resources within the basin with which labour force opportunities can be developed.
Interests such as the industry engaged with training and work readiness are very locally specific and need to be taken into account in any further socioeconomic work relating to industry. The concentrations of qualifications in different industries were identified in an open-ended question as follows:
• Natural resource management• Agriculture, horticulture, mining and associated skills such as mechanics• Health including aged care and palliative care• Community services including childcare, youth services and arts and crafts• Management including education, finance and IT, and• Tourism, hospitality and fashion.
Employment and income
‘Sick of being broke.’ (Male respondent, 25–54 age bracket, Kunja Nation, Euro)
Our next priority is getting people into real jobs. Too often, employment and training programmes provide ‘training for training’s sake’ without delivering the practical skills people need to get real jobs.
(COAG Reform Council, 2014, p.2)
The survey asked respondents if they were currently employed (Q18). 98.2% of the sample responded to the question.
Figure 8 shows 44.4% of the respondents identified being employed: that is over 55% of the sample group is unemployed. This is compared to a national average for all populations of 6% (ABS, 2014).
Page 19

A survey of Aboriginal water interests in the Murray–Darling Basin
Figure 8: Respondents' employment situation
COAG (2014, p.12) reported that no progress has been made in closing the gap on employment opportunities for Aboriginal Australians. The review found that in 2012–13, nationally 51.4% of Aboriginal Australians were employed in inner regional areas. While the findings for the basin and this specific cohort of respondents are some 7 percentage points lower than a national finding, the gap between educational attainment and employment status is broadly equivalent between the two data sources. COAG found that closure of Community Development Employment Projects (CDEP) as an employment option is a partial explanation for this result. This result was repeated in the 2016 Closing the Gap report (p.27).
The MDBA survey goes on to explore workforce participation experiences.
Page 20

A survey of Aboriginal water interests in the Murray–Darling Basin
Figure 9: Duration of employed respondents' experiences of unemployment
67.5% of the sample group answered Q19: “If employed, were you employed within the last 6 months, or within the last 6 months to 1 year?”4
As Figure 9 shows, 40.7% of those currently employed at the time of the survey reported being employed within the last 6 months, and 59.3% within the previous 6 to 12 months. This indicates that for about 60% of the cohort finding work is difficult and periods of unemployment are extended.
The survey went on to explore the question from another angle – Q 23: “If unemployed when were you last employed?”
4 N.B. This response rate is inconsistent with the percentage of respondents who identified as being employed - which was 44.4%. The response rate is an inconsistency in answering the survey.
Page 21

A survey of Aboriginal water interests in the Murray–Darling Basin
Figure 10: Duration of unemployed respondent's experiences of unemployment
98% of those identifying as being unemployed responded to the question. Figure 10 shows that 16.5% reported being employed within the previous 6 months, 13.4% within 6 months to 1 year, and 70% in more than a year.
45 respondents identifying as being unemployed went on to answer the “other” question (30%).
Figure 11 shows the author’s analysis of the qualitative data that this question produced.
Page 22

A survey of Aboriginal water interests in the Murray–Darling Basin
16; 36%
8; 18%
7; 16%
10; 22%
4; 9%
Q 23: n=45/150; If unemployed when were you last employed?
Retired, voluntary work, pensioner1-5 years5-10 years10-20 yearsNever
Figure 11: Duration of unemployed respondents’ experiences of unemployment over one year
The response includes a wide range of years of unemployment – from one year to “never employed”.
The “never employed” category includes those too young to work and those who are of senior age and never been employed or paid for their labour.
Of this group 56% have been unemployed for over five years, which sheds a disturbing light on the extent of disengagement from the work force for a majority of the respondent population despite the high levels of tertiary qualifications.
The survey then explored employment issues for those who were currently employed. Three questions were asked:
a) Q 20: the consistency of employment
b) Q 21: the nature of the employer, and
c) Q 22: how satisfied the person was with their employment.
122 of 280 or 43.5% of the sample group answered Q 20 about type of employment, which is a response rate close to the number identifying as “employed” (44.5%) and thus a reliable reading. 71.3% of employed people reported being involved in full-time employment.
Page 23

A survey of Aboriginal water interests in the Murray–Darling Basin
Figure 12: Types of employment
Of interest is that the option of “seasonal” employment attracted no responses, reflecting the lack of local employment from agriculture. The collection of submissions made for the Aboriginal community consultation for the Draft Basin Plan in 2012 include many references to agriculture as having been a reliable seasonal source of employment in previous decades.
This finding raises questions about the value of irrigation to Aboriginal people in the current socioeconomic systems in the basin if land ownership is not possible, as the following comment suggests:
‘Irrigation used to give people jobs, like chipping, but it's all gone now. We need to own more land to get Country into good shape. We need water and irrigation to grow crops, sheep and cattle, vegetables on our land, for our communities.’
(Male respondent, 65 years plus age bracket, Gamillaroi, Wiradjuri, Woonarua and Awabigul Nation identities, Tamworth)
When considering the type of employer respondents worked for, Figure 13 shows a similar response rate (43.5%). Respondents identified that Aboriginal organisations dominate the employment field (41.5%) with government also participating in the employment of Aboriginal people in the basin (38.2%).
Page 24

A survey of Aboriginal water interests in the Murray–Darling Basin
Figure 13: Type of respondents' employer
Figure 14 shows the result for Q 33 (139/280 respondents or 49.6%) with regard to levels of satisfaction with work.
Figure 14: Employed respondents' levels of satisfaction with employment
Page 25

A survey of Aboriginal water interests in the Murray–Darling Basin
The survey found that the rates of satisfaction with employment were relatively high: 66.4% reporting “satisfied” or “very satisfied” with their paid work.
Finally, Q 22 explored income levels from employment.
43.9% of respondents answered this question, which again, is close to the number identifying as “employed”.
Figure 15 shows that 54.5% have an income of over $600/week which leaves quite a high percentage of the population on relatively low incomes from full and part time employment.
Figure 15: Employed respondents' income brackets
The survey went on to explore aspects of health and wellbeing.
Health and wellbeing
'… I do a lot of training, I have been line dancing for 19 years – keep my health good. I have two doctors – one is a GP, the other a specialist. I do a NSW Health program and I walk a lot of places. I do 10–15 kms on Sundays. I had heart disease and diabetes and they are under control. I have bush medicine – wild plum bush tea.'
(Male respondent, 65 years plus age bracket, Gamillaroi, Wiradjuri and Woonarua Nation identities, Tamworth)
The survey asked one question about health, and several questions about a person’s sense of wellbeing in terms of two aspects: belonging to a community and self-determination.
Page 26

A survey of Aboriginal water interests in the Murray–Darling Basin
Q 34 was a self-assessment question, asking the respondents to rate their current level of health. 266/280 or 95% of all respondents answered the question.
Figure 15: Respondents' self-assessed health status
The question presented respondents with range from “unhealthy” to “very healthy”. As Figure 16 shows, only 12% of respondents self-identified as unhealthy; the remainder self-identified as experiencing degrees of good health.
This result is at odds with national Aboriginal health statistics (MacRae et al, 20135). Consultants supporting the survey administration did not influence the way questions were answered, but because the survey was administered in face-to-face engagement, it was apparent that respondents were not making associations between health risks such as high levels of smoking, obesity and health status.
Gray (2011) notes that Aboriginal self-assessment of health status is often reported as being higher than it actually is if clinical data is to be considered the reliable measure. The social norms against which people make such assessments in marginalised communities provide a different reference point for ‘good health’ than the norms that are visible and accepted in socioeconomically strong communities.
5 In its “concluding comments” this report states that while there is some evidence of “substantial improvements” to health conditions and the number of areas contributing to health status (such as immunisation) the overall reading is that Aboriginal people are still the least healthy population group in Australia. While there are ongoing issues with data collection, which make clear lines of evidence difficult: “clearly, the gap between the health status of Aboriginal people and that of other Australians is still very, very wide”.
Page 27

A survey of Aboriginal water interests in the Murray–Darling Basin
The aspect of “belonging” was explored through the question of whether respondents lived on their Country as an indicator of wellbeing. The results to this question were more reliable than those to questions about health.
Figure 16: Respondents living on their Country
96.4% of respondents answered the question regarding living on Country, of whom 77.4% were living on their Nation’s Country at the time of the survey, as illustrated in Figure 17 above.
A cross-tabulation of the variable of “living on Country” across the whole survey found that the Barkandtji Nation had the highest populated category of people living on their Country (31.2%) for this cohort. In reference to the health and wellbeing implications of living on Country, the same cross-tabulation found that those living on their Country were less likely to be employed than those not living on Country (44% as compared to 51%). Most people living on their Country, if employed, were employed by Aboriginal organisations (46.2%) and for those not living on their Country, Government was the highest employer (41.9%).
This finding, if generalised with further research, has a consequence that those not living on Country enjoy a higher income: 70% of those respondents not living on Country enjoyed an income over $600/week as compared to 48.9% of those living on Country. This finding also indicates that it is primarily those not living on Country who were involved in government-funded natural resource management or “Caring for Country” programs (81.3% of those not living on Country as compared to 57.8% of those who are). The reverse is true for participation on Land Councils (49.2% of those living on Country participate in Land Councils as compared to 25% who were not living on Country).
Page 28

A survey of Aboriginal water interests in the Murray–Darling Basin
Figure 17: The regularity of visiting Country for those who do not live on Country
95% of those not living on Country answered the question, and as Figure 18 above shows, of those not living on their Country only 6.7% never visited their Country. About a third (36.4%) visited yearly, another third (32.7%) monthly, with nearly 10% visiting weekly. For those who are not living on Country over two thirds of the respondents made regular visits to Country: such visits are a significant cultural practice taking into account the difficulty of travelling long distances on low incomes.
Another important factor of a sense of “belonging” is a person’s ability to reside in a community for a long period of time. As Figure 19 shows, with regard to permanency of residing in the current location, a high proportion of respondents had lived in their current location for between 5–10 years – or longer.
Page 29

A survey of Aboriginal water interests in the Murray–Darling Basin
Figure 18: Time of residency in current community
82.3% had lived in their current community for more than 5 years, which is significantly higher than national averages for Aboriginal populations. ABS (2006) research reported that in 2006 nationally, 57% of Aboriginal people had not relocated within the preceding five years, (60% for non-indigenous populations).
Only 42% of all survey respondents answered this question regarding permanency, and of those the difference between those living on Country and those who were not, was minor (81.7% and 88% respectively). For this survey, the variable of living on Country was not a significant factor in determining permanency of residence.
118 people responded to the “other” option for this question. The following table indicates the extent of people’s permanency of residence. Nearly half the respondents had lived in the current location for all their lives.
Page 30

A survey of Aboriginal water interests in the Murray–Darling Basin
Table 1: Duration of residency over 10 years
Duration of residency
10–20 years 20–40 years 40–60 years All my life
% of respondents 13 (11%) 24 (20%) 24 (20%) 55 (47%)
A reader may be inclined to think that the older person may be less transient, but a cross-tabulation on age with regard to Q 29 shows that the variation between the age groups is minor.6
The survey also inquired about how far respondents moved away from their communities when they relocated (Q 30). 10 responses clearly showed that when people moved the distances were relatively local. Movements were mainly between
• Mildura, Pooncarie, or Swan Hill• Broken Hill and Wilcannia• Moree and Tamworth• Walgett and Wagga• Leeton and Menindee.
One case of moving from Sydney to Bourke was the most extensive relocation.
Finally, the survey explored the aspect of health and wellbeing by asking respondents why they moved to where they currently live and if anything would make them leave.
6 (The data management program does not afford cross tabulation on the response to the open-ended option of “other” in order to explore the longer periods of residency in reference to age).
Page 31

A survey of Aboriginal water interests in the Murray–Darling Basin
Figure 19: Reasons for moving to current location
64% of respondents answered the first question (Q 31) and 52% the second (Q 32).
In both cases the majority of people gave “family” as the reason for both arriving at and leaving their current location: 71% and 63% respectively.
Figure 20: Reasons for leaving current location
Page 32

A survey of Aboriginal water interests in the Murray–Darling Basin
A cross-tabulation of how “living on Country” affects the issues of residential location shows that for people who don’t live on Country 30% would move from where they currently lived in order to live on Country.
Cunnamulla and Mildura have the highest percentage of people in this sample who do not live on their Country (14% of the respondents did not live on Country in each case), and Wilcannia presented as the town with the highest percentage of respondents living on their Country (18.8%). Deniliquin, at 9.4% of respondents living on their Country, was the next highest after Wilcannia.
‘Family always say they like to come back to Country when they are feeling down. It's the connection to Country that makes them feel good about themselves.’
(Female respondent, 55–64 age bracket, Kunja Nation, Cunnamulla)
Elders celebrating culture with children and family members on the river near Goodooga, NSW, 2013.
Self-determination
‘I would like to see my family history of the Board in my Country (Ulupna). My Country will die without its own story.’
(Female respondent, 25–54 age bracket, Wamba Wamba, Yorta Yorta and Woiworung Nations, Shepparton)
Self-determination is a culturally specific right and responsibility, distinctive to different peoples around the world. Within Australia and with regard to Australian Aboriginal peoples it is the
Page 33

A survey of Aboriginal water interests in the Murray–Darling Basin
means by which First Nations can expose and respond to the impacts of colonisation within their own terms:
Self-determination is an ‘ongoing process of choice’ to ensure that Indigenous communities are able to meet their social, cultural and economic needs. It is not about creating a separate Indigenous ‘state’.The right to self-determination is based on the simple acknowledgment that Indigenous peoples are Australia’s first people, recognised by law in the historic Mabo judgement.The loss of this right to live according to a set of common values and beliefs, and to have that right respected by others, is at the heart of the current disadvantage experienced by Indigenous Australians. Without self-determination it is not possible for Indigenous Australians to fully overcome the legacy of colonisation and dispossession.
(Human Rights and Equal Opportunity Commissioner, 2003)
Within the Murray–Darling Basin one of the ways self-determination is manifesting is through participation in community and organizational governance responsibilities, another is through participating in employment that is involved with caring for Country where Aboriginal cultural knowledge, cultural strength and social care are incorporated into natural resource management.
The survey explored the respondents’ experiences of both these aspects of self-determination.
Figure 21: Respondents' participation in community and organisational governance
Page 34

A survey of Aboriginal water interests in the Murray–Darling Basin
96.4% of the survey cohort responded to the question about participation on boards and management committees (Q 27). 65.6% of this group participated in this aspect of self-determination.
Of this group 88% identified the type of board that they contributed to (Q 28). Land Councils and cultural management took up the majority of responses, and youth support the least.
Figure 22: The purposes of respondents' governance activities
Cross-tabulation of the results shows 49% of respondents participating on Land Councils lived on their Country, and 55% of those participating in cultural management did not live on Country. The results reflect a leaning towards natural resource management of one form and another, and reflect the survey’s cohort bias towards participants concerned with river systems in the basin. Cultural management activities include teaching culture to children, and working with a Traditional Owner group.
The survey provided an “other” option regarding governance activities, which revealed a diversity of other community management activities taking place in the basin as an aspect of self-determination as listed in Table 3.
They include: leadership groups, housing, law and justice, family violence groups, women’s gatherings, Elders’ groups, Traditional Owner groups, church groups, community development and Aboriginal land holding groups, Native Title groups, advisory groups to mining interests and local councils. Youth support, health and education were least actively engaged with, but this could be a reflection of this sample group’s interests, which were focussed to natural resource management and land ownership. Participants were busy, with many respondents noting their participation on several different committees.
Page 35

A survey of Aboriginal water interests in the Murray–Darling Basin
Table 2: Other forms of participation in governance
N = 46/280 or 16.4%
Leadership (NBAN, MLDRIN, leadership groups)
Housing Law and justice
Family and community services including health
Cultural groups (Elders, women’s, Traditional Owners)
Native Title and land holding (ILC)
Advisory groups (mining, education, local government)
Church
3 5 3 11 8 8 9 2
Related to self-determination is the kind of employment that people wanted to be involved with. 236/280 or 84.2% of the sample group responded to the question about employment in Caring for Country. Of this group 85.2% expressed interest in this opportunity.
‘I would love to help. I am thinking about how here, there is a Bandicoot conservation program – they are going extinct because of the issue with water – they are building the population up in the zoo before returning them to the natural environment because they don't have enough food or water in the natural environment. People are building on their natural habitat and it’s affecting them.’
(Female respondent, 24–54 year age bracket, Gamillaroi Nation, Tamworth)
Having described the demographic characteristics and the socio-economic circumstances of the respondents, the report goes on to its final section, which is to describe the findings for those questions relating to the way in which water is managed in the basin.
Page 36

A survey of Aboriginal water interests in the Murray–Darling Basin
Water-related interests
‘We can live without everything else but NOT WATER. All birds, fish, animals and trees, small insects all gotta live.’
(Male respondent, 65 years plus age bracket, Githabul Nation, Warwick)
The Warrego River at Cunnamulla showing the siltation impact of weirs, June 2013
The line of questions regarding water management in the basin follows a logic of a) finding out about perspectives on the current balance between water for irrigation and water for the environment, followed by b) degrees of familiarity with water management systems in the basin, and finally c) dependence on water management systems for income.
Perspectives on the balance of water management in the basin
‘It creates jobs then takes away from Country.’ (Male respondent, 25–54 years age bracket,
Wiradjuri Nation, Wagga)
The survey asks two questions about the current water regimes.
The first asks about the current (as at 2012–13) balance between water for irrigation and water for the environment, and the second asks about a change to the current balance where the environment receives more water than it currently did, and irrigation less. Both questions encouraged respondents to choose multiple options and also offered an open-ended option for comment in terms of asking: “why do you think so?”
Page 37

A survey of Aboriginal water interests in the Murray–Darling Basin
These questions were challenging. They required the respondent to hold in their mind the tension between water for commercial value and water for environment, then to make a judgment about it. The question provided five options, which weighed up the relative possibilities for Country and economy.
Figure 23: Respondents' views regarding the balance between water for irrigation and water for the environment as at June 2013
95% of the survey sample answered Q 2 about the “current” balance of water for the environment and water for irrigation. 59.6% of the respondents were of the view that the current regime was bad for Country. 18.9% were of the view it was good for Country and 28.7% thought that it was good for economy.
A cross-tabulation reveals that Tamworth-located respondents could see the benefits of the current regime to local economy more than any other, and Mildura-based respondents could most see the benefits to Country. Of interest is that Wilcannia-based respondents were the highest percentage of respondents who saw the current regime as damaging to both Country and economy. 13.8% reserved their judgment and Deniliquin-based respondents were the highest percentage that did so.
The thinking behind these views was revealed in the open-ended question. 207 respondents (or 73.9% of the total sample group) made comments. Table B in the Appendix was compiled by the author and shows emerging themes from the responses regarding the current watering regime7.
7 The analysis of the open-ended question sometimes required individual statements to be coded differently multiple times, as one statement could explain more than one chosen option.
Page 38

A survey of Aboriginal water interests in the Murray–Darling Basin
Those who thought the current regime was good for the economy tended to answer the question in broad terms for the whole economy, as the experience of Aboriginal people having access to a struggling local regional economy has been restricted most significantly since the increased automation of rural industries and the professionalisation of local agricultural and horticultural businesses. Those who were of the view that the current regime had some benefit to Country, similarly were of a general view that water had to be managed somehow given the current state of the rivers, or, had seen the benefit of environmental watering in their area. Of interest is that there was some discussion about the lack of balance in the current regime, or the need for this question of balance to be better understood in the way water is managed in the basin.
Q 4 proposed a change to the current situation so that there was more water for environment and less for irrigation than was being observed in the “current” situation. 97.8% of the sample group responded to the question, and the response was that a good majority (76.6%) thought that more water for the environment and less for irrigation would also be good for Country. Interestingly a further 25.5% thought that such an arrangement would be good for the economy as compared with 15% who thought it would be bad for economy. This finding, though modest, indicates that a good quarter of the respondents were aware of the benefits of environmental watering to overall economic sustainability.
Figure 24: Respondents' views regarding more water for the environment and less for irrigation
Table C in the Appendix explores the open-ended responses to the prospect of a change in the watering regime. This table shows that more water for the environment and less for irrigation was recognised as a better balance. The comments also suggested that a better understanding of how this balance works was also needed for this scheme to work. The risk to the economy was foremost in peoples’ minds, however there was also some evidence that the benefits of
Page 39

A survey of Aboriginal water interests in the Murray–Darling Basin
environmental watering to Country, community and economy were clear. The benefits for jobs, community, culture and Country were also obvious as indicated by the response options.
Knowing about water managementThe survey explored how familiar the respondent was with water-related interests and water management services in the basin. These questions also assessed governments’ information dissemination approaches. The survey asked if respondents knew about how the government managed water in the basin.
Figure 25: Levels of respondents' awareness of government approaches to water management in the basin
96.4% of the sample group responded to the question; as Figure 26 shows 67.4% did not know about this aspect of water management.
The survey explored respondents’ sources of information if they were aware of how the government managed water.
Page 40

A survey of Aboriginal water interests in the Murray–Darling Basin
Figure 26: Sources of information regarding government's approaches to water management in the basin
The same number of people who responded that they did know about this question, responded to the question of how they knew. Figure 27 shows that a large majority of people (84.3%) know about water management because they were interested in the river systems. Having concerns about water quality and human health were also important reasons to source information.
The survey took a step further and asked if there are any other ways, other than those offered in the previous question, that people came to know about water management.
Table D in the Appendices shows the sources of information about water, water licensing and wetland and river health. Between 23% and 57% answered the three questions (Questions 8, 12 and 13) exploring these matters.
Living on the river, participating in cultural life and making use of cultural centres such as Yarkuwa Cultural Centre in Deniliquin were the primary sources of information for Aboriginal people outside of mainstream channels.
Local and State governments were a primary source of information regarding water licensing, though there were some statements about the lack of information in local councils in particular. Participation on boards including Catchment Management Authorities, Murray Lower Darling Rivers Indigenous Nations, Northern Basin Aboriginal Nations and Land Councils, as well as State government departments and agencies were other important sources of information about river and wetland health.
Page 41

A survey of Aboriginal water interests in the Murray–Darling Basin
The following quotation from a survey respondent gives some insight to the Aboriginal experience of working cross-culturally in the water industry. It is not an easy responsibility:
‘I work with the Aboriginal Lands Council, and on ground management committees with the Department of Land and Water – ground water – some years ago. I was stuck between the greenies, the bureaucrats and the farmers.’
(Male respondent, 25–54 years age bracket, Gamillaroi Nation, Tamworth)
The survey went on to explore Aboriginal ownership of water licences.
In 2010, Aboriginal people and their organisations held 81 water licences in the basin (Arthur, 2010, p.4).
The survey added some detail to this information by inquiring as to whether the respondent owned a water licence either personally or through an organisation to which they belong (Q 9). 95% of the sample group responded to this question. Figure 28 shows that 16.2% (or 43 people) affirmed that they had some ownership of a licence.
Figure 27: Degree of respondents' ownership of water licences
Page 42

A survey of Aboriginal water interests in the Murray–Darling Basin
The survey inquired about the kind of licence people owned and how much water the licence allocated to the licence holder. Table E in the Appendix analyses the open-ended responses to this question.
The results of these questions are mixed. Of the 43 respondents who answered “yes” to having some ownership of a water licence, 11 did not know what kind of license they had. Of the remainder, most had a Stock and Domestic licence (16), and others were less accurate about the class of licence they had referring to an “irrigation licence” (9). Two respondents referred to Land Council licences. State variations on licensing make this question difficult to generalise. Half of those who responded to the question about the amount of water (16/31) were unaware of their allocation, which is likely due to Stock and Domestic licences not having allocations.
Water-dependent employmentFinally, the survey inquired about dependence on water and irrigation for employment.
Figure 28: Respondents' experiences of water-dependent employment in the basin
The first question was conditional, only seeking answers from those who considered their employment was dependent on water allocations. 36.4% of the total survey sample responded to the question, indicating that a third of the sample considered their employment to be “water dependent”. As Figure 29 shows, nearly 60% of the respondents secured employment in natural resource management and Caring for Country. Mining was the smallest water dependent employer.
Q 25 explored the extent to which Aboriginal participants gained employment from irrigation dependent industries in the basin in the past. About one third of the respondents answered this
Page 43

A survey of Aboriginal water interests in the Murray–Darling Basin
question (28.2%) indicating that this is the extent to which Aboriginal people’s income was dependent on irrigation.
Figure 30 shows that 41 % (or 33 respondents) reported that their work used to be in the cotton industry, followed by horticulture and viticulture (21.5% and 0.3% respectively).
Figure 29: Water-dependent industries that have employed Aboriginal people in the basin
ABARE et al (2006, p. 43) find that between 2001 and 2006 (latest available information at the time of writing this report) agriculture, forestry and fishing experienced the most significant decline, which is consistent with the respondents’ experiences of declining employment opportunities in these sectors in the basin.
Last commentsThe survey concluded with an open-ended question regarding any matters related to the social and economic health and wellbeing of the respondent, their family or community. 136 people (48.5% or nearly half of the survey cohort) responded to this invitation.
There were six comments about the survey itself, two expressing dislike of it, and four appreciating it and expressing a wish for feedback to the communities about its results.
Comments regarding a need for employment opportunities were of the most numerous (34). In particular, youth unemployment was a recurring theme. This issue was frequently mentioned in relationship with cultural learning (13 such comments), bringing young people and Elders together to care for Country, raising awareness of cultural difference and respect with local mainstream communities, and building strength of identity for future generations.
Page 44

A survey of Aboriginal water interests in the Murray–Darling Basin
There were many comments made about family and community (13) with attention being focussed to the need for services for the aged, disabled and youth including housing and mental health. The intrusion of drugs and alcohol on community safety and health were also discussed (18 such comments). There were also several calls for improved basic local services (7) such as shops in which you can buy food in local rural communities.
Underpinning many of these statements were comments about the lack of coordination between services, the lack of inclusion of Elders and Traditional Owners in how services are delivered and the need for more respect and better listening. Some comments encouraged a good partnership between Aboriginal people and mainstream services to get the balance right for the environment and future generations of communities.
There were eight comments that discussed environmental interests such as water quality, flow and general health of the ecosystem. However, as the question did not call for these comments the relatively small number is no indication of the lack of importance of this issue to the sample group.
‘I just wish all service providers come on board with this so they know what to do and go about it in the community so we can all pull together as one to make a better place for everyone in all jobs and infrastructures.’
(Male respondent, 25–54 age bracket, Ngiyampaa Nation, Dareton)
Page 45

A survey of Aboriginal water interests in the Murray–Darling Basin
ReferencesABS (2006) 4713.0 – Population characteristics, Aboriginal and Torre Strait Islander Australians, 2006. Accessed 12/3/14 http://www.abs.gov.au/ausstats/[email protected]/Lookup/78CD1EFFC8A28042CA2578DB00283CB6?opendocument
ABS (2010) 4704.0 – The health and welfare of Aboriginal and Torres Strait Islander peoples, October 2010. Accessed 15/4/14 http://www.abs.gov.au/AUSSTATS/[email protected]/lookup/4704.0Chapter355Oct+2010
ABS (2012) 4628.0.55.001 – Completing the Picture – Environmental Accounting in Practice, chapter 6. Accessed 14/5/14 http://www.abs.gov.au/AUSSTATS/[email protected]/Lookup/4628.0.55.001main+features10May+2012
ABS (2014) 6202.0 – Labour Force, Australia, Feb 2014. Accessed 14/3/14 http://www.abs.gov.au/ausstats/[email protected]/mf/6202.0
ABS/ABARE/BRS (2009) Socio-economic context for the Murray–Darling Basin – Descriptive Report. Canberra.
ABS/ABARE.BRS (2011) Report to the Murray–Darling Basin Authority, Canberra.
Arthur, WS (Bill) (2010) The Murray–Darling Basin Regional and Basin plans: Aboriginal water and land data. The Australian Government. Accessed 18/3/14 http://www.mdba.gov.au/kid/files/1278-Aboriginal-water-land-ownership.pdf
COAG Reform Council (2013) Education in Australia 2012: Five years of performance. Report to the Council of Australian Governments. Commonwealth of Australia.
COAG Reform Council (2014) Closing the Gap: Prime Minister’s report. Commonwealth of Australia, 2014. Accessed 23/5/14 http://www.dpmc.gov.au/publications/docs/closing_the_gap_2014.pdf
Department of the Prime Minister and Cabinet (2016) Closing the Gap: Prime Minister’s Report. Australian Government. Accessed 30/9/16http://closingthegap.dpmc.gov.au/assets/pdfs/closing_the_gap_report_2016.pdf
Gray, M (2011) “A mile wide, inch deep: The future for Indigenous social surveys?” In Boyd Hunter & Nicholas Biddle (Eds), Survey Analysis for Indigenous Policy in Australia: Social Science Perspectives. ANU Press, Canberra.
Graziano, A & Raulin, M (1993) Research methods: A process of inquiry. Second Edition. Harper Collins College Publishers. N.Y.
Human Rights and Equal Opportunity Commissioner (2003) Social justice and human rights for Aboriginal and Torres Strait Islander peoples: Information Sheet. Accessed 14/5/14 http://www.humanrights.gov.au/information-sheet-social-justice-and-human-rights-aboriginal-and-torres-strait-islander-peoples
Page 46

A survey of Aboriginal water interests in the Murray–Darling Basin
MacRae A, Thomson N, Anomie, Burns J, Catto M, Gray C, Levitan L, McLoughlin N, Potter C, Ride K, Stumpers S, Trzesinski A, Urquhart B (2013) Overview of Australian Aboriginal health status, 2012. Accessed 18/3/14 http://www.healthinfonet.ecu.edu.au/health-facts/overviews
Murray–Darling Basin Authority (2011) Plain English summary of the proposed Basin Plan – including explanatory notes. Murray–Darling Basin Authority, Canberra.
Page 47

A survey of Aboriginal water interests in the Murray–Darling Basin
Appendices
Table A: Analysis of open-ended responses to Q 37, on further educationN= 212/280 or 75.7% of cohort
Responses 24 years or under
25–54 years
55–64 years
65 and over
Number of responses 8 116 42 46Certs in NRM 2 8 0 0Certs in agriculture, mining (mechanics, horticulture, carpentry, brick laying) 1 12 3 8
Certs in health (aged care, palliative care) 0 7 1Certs in community services (development, community services, youth, child care, arts)
0 10 8 7
Certs in management, education and finance computer courses 0 11 1 2
Certs in tourism/retail/clothing/hospitality/cosmetics 1 0 3 1
Undefined TAFE 2 18 9 4Degrees/Diplomas (education, Aboriginal studies, nursing, community development, commerce)
0 12 11 4
Undefined Yes 1 18 4 5No 2 20 10 19
Page 48
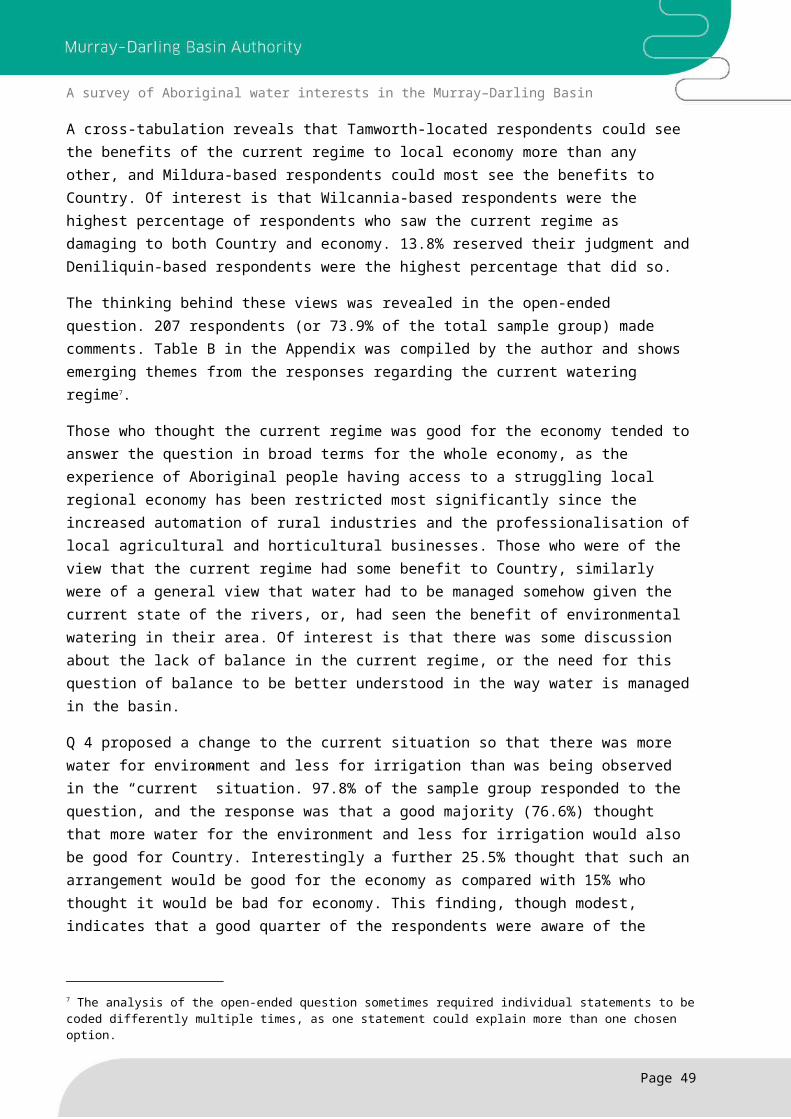
A survey of Aboriginal water interests in the Murray–Darling Basin
Table B: Analysis of open-ended responses to Q 3N = 211/280 or 75% of cohort
Exploring responses to Q 2 on the current balance between water for irrigation and water for the environment as at June 2013
Response options
Good for economy/jobs
Good for your Country
Bad for economy/jobs
Bad for your Country
Number of responses 66 36 28 136
Benefit to overall economy and jobs
29 9 0 19
No value or harm to jobs for Aboriginal people
7 0 7 15
Benefit to Country and environment
13 15 0 1
Harms Country and environment 15 2 15 88
Harms community and culture
1 5 22
Benefits community and/or culture
4 8 0 0
It’s common sense 1 4 3 4
Lack of balance 10 7 6 31
Page 49

A survey of Aboriginal water interests in the Murray–Darling Basin
Table C: Analysis of open-ended responses to Q 5 N=208/280 or 74% of cohort
Exploring responses to Q 4 on changing the balance between water for irrigation and water for the environment to les for irrigation and more for the environment
Response options Good for economy/jobs
Good for your Country
Bad for economy/jobs
Bad for your Country 8
Number of responses 62 38 27 133
Benefit to overall economy and jobs 4 0 3 1
Harm the economy 4 5 6 0Value or benefit to jobs for Aboriginal people
11 4 6 4
Harm or no benefit to jobs for Aboriginal people
5 2 8 3
Benefit to Country and environment 22 16 44 9
Harms Country and environment (inadequate water, bio-diversity losses)
3 0 1 0
Common sense 0 0 2 0Better understanding how to do it is needed
2 0 4 3
Harms community/or culture 0 0 1 0
Benefits community and/or culture 5 6 16 4
Bad management 1 2 1 0
8 It should be noted that the number of comments within a specific answer do not necessarily indicate agreement with the option provided; 133 comments made by people who ticked the “bad for Country” option were not all stating that a change to the regime was bad for Country – hence the need for a qualitative analysis of the comments as shown in the tables in the Appendix.
Page 50

A survey of Aboriginal water interests in the Murray–Darling Basin
Table D: Analysis of open-ended responses to Qs 8, 12 and 13Q 8: N= 65/280: 23.2% of cohort
Q 12: N= 137/280: 48.9% of cohort
Q: 13 N= 162/280: 57.8% of cohort
Exploring sources of information about water management, licensing and river and wetland health
Q 8: “Any other way you came to know about water management?”
Q 12: “If you have a problem or question about water licenses in your area which organization would you ask?”
Q 13: If you have a problem or question about river and wetland health which organisation would you ask?”
Participation on committees and boards (MLDRIN, NBAN, CMAs, Land Councils etc)
10 31 46
Professional work (DSE, SA Water, DLW, cultural protection works etc)
10 1 0
Commonwealth departments and agencies (incl MDBA)
0 6 16
State government and agency information, consultations and partnerships (DPI, LWE and others)
9 38 76
Land ownership and participation in being an irrigator and water trading
23 0 0
Water corporations (Lower Murray Water, Sun Corp etc)
0 21 2
Media (internet, t.v., radio, newspapers, documentaries)
7 1 1
Through living on the river and being with Elders and Traditional Owners including cultural centres (Yarkawa, e.g.)
22 5 9
Local government 0 36 29Local member 2 1Land Care 0 1 4
Page 51

A survey of Aboriginal water interests in the Murray–Darling Basin
Table E: Analysis of open-ended responses to Qs 10 and 11
Q 10: N = 43 (100%) Q 11: 31 72% of those who have a water license
Exploring types of water licenses held by Aboriginal people and their organisations and water allocations related to water licenses
Q10 If you answered "yes" to the previous question, what type of water license do you or your organisation have?
Q 11. If yes, how much water is allowed?
Irrigation Don't knowStock and Domestic; irrigation 23 MGsFarm use, 45 thousand acres Don't knowStock & Domestic Don't knowStock & Domestic Don't knowAgricultural Don't knowDon't know Don't knowIrrigation 2 GigsDon’t know 20 MLGrazing use Don't knowDon't know Don't knowStock and Domestic 5 MLStock and Domestic; irrigation Don't knowDomestic water allocation Don't knowIrrigation Don't knowStock and Domestic Don't knowDon't know 1500MLIrrigation Don't knowStock and Domestic 1,600 MGIrrigation 400–500 mlWLALC Irrigation license Don't knowFamily farming Don't knowStock and Domestic; irrigation 50 mgs – depends on capLocal Aboriginal Land Council Murrin Bridge 15 mgsHigh Security; Stock and Domestic 720 mgs; 243 mgsIrrigation Don't knowDon't know 9 megsFarming Don't knowHigh Security; Stock and Domestic 720 mgs, 243 mgsStock and Domestic; Irrigation 972 MLs
We lease a property with a water license Under 900 mgs; 600 out of the river and we also have a well
Trelawney Lands Council owns one – don't know what type Don’t know
Page 52