Embed Size (px)
Citation preview

A SURVEY OF COST ALLOCATION PRACTICES OF
MANUFACTURING COMPANIES IN KENYA
BY:
LANGAT BENJAMIN KIPKIRUI
THIS MANAGEMENT RESEARCH PROJECT IS SUBMITTED IN
PARTIAL FULFILLMENT FOR THE AWARD OF THE DEGREE OF
MASTER OF BUSINESS ADMINISTRATION
UNIVERSITY OF NAIROBI
NOVEMBER 2005
University of NAIROBI Library
■1110492739 8

DECLARATION
This research project is my original work and has not been presented for a degree at
any other University
Date
D61/7543/03
This research project has been submitted for examination with my approval as
University Supervisor
i

DEDICATION
This project is dedicated to my friend Eva, and to my mother Mrs. Sarah Too, my
brothers Joseph, David, Richard and to my sister Beatrice for all your sacrifices
throughout this study.
u
TABLE OF CONTENTS
DECLARATION................................................................................................................. I
DEDICATION.................................................................................................................... II
TABLE OF CONTENTS................................................................................................... Ill
ACKNOWLEDGEMENT................................................................................................... V
ABSTRACT......................................................................................................................VI
CHAPTER 1 ...................................................................................................................... 1
1.0 INTRODUCTION....................................................................................................1
1.1 BACKGROUND...................................................................................................11.2 Statement of the Problem................................................................................ 51.3 Objectives of the Study................................................................................... 61.4 Significance of the Study...................................................................................7
CHAPTER 2 ...................................................................................................................... 8
2.0 LITERATURE REVIEW..............................................................................................8
2.1 Cost Allocation Systems................................................................................. 82.1.1 Traditional Costing Systems........................................................................... 82.1.2 Activity Based Costing (ABC) System............................................................9
2.2 Purposes of cost allocation......................................................................... 112.3 Cost Centers and Overhead Application Rates............................................142.4 Cost Allocation Bases................................................................................... 192.5 Joint Cost Allocation Methods.....................................................................232.6 Inter Service Department Re-allocations....................................................24
CHAPTER 3 .................................................................................................................... 27
3.0 RESEARCH METHODOLOGY........................................................................... 27
3.1 Research Design............................................................................................. 273.2 Population...................................................................................................... 273.3 Sample..............................................................................................................273.4 Data Collection Methods.............................................................................. 283.5 Data Analysis................................................................................................. 28
iii
CHAPTER 4.................................................................................................................... 29
4.0 DATA ANALYSIS AND FINDINGS..................................................................... 29
4.1 Cost Centers...................................................................................................324.2 Overhead Application Rates.......................................................................... 324.3 Allocation Bases Used................................................................................... 344.4 Choice of Activity Level................................................................................. 364.5 Service Department cost Allocation............................................................ 37
CHAPTERS.................................................................................................................... 38
5.0 CONCLUSIONS AND SUGGESTIONS FOR FURTHER RESEARCH................... 38
5.1 CONCLUSIONS.....................................................................................................385.2 SUGGESTIONS FOR FURTHER RESEARCH................................................395.3 Limitations Of The Study..................................................................................... 39
REFERENCES................................................................................................................ 41
APPENDIX1 : QUESTIONNAIRE.................................................................................. 47
APPENDIX 2: LIST OF RESPONDENTS...................................................................... 52
iv

ACKNOWLEDGEMENT
This project was completed with the support and contributions of many people both
directly and indirectly. Directly, I wish to sincerely thank my supervisor, Mrs. Winnie
Nyamute, for her guidance throughout the period of study and for her comments and
suggestions that enriched this project.
I also sincerely thank the Department of Accounting Chairman, Mr. V.O. Kamasara, for
his advices, both academic and general. His constant reminder for the need to complete
the project in time gave me a constantly renewed impetus and vigor during the period of
this study. I also wish to thank my lecturers, Prof. N.D. Nzomo, Mr. M. Mwachiti, Mr H.
Ondigo, and Mr. J. Karanja whom I worked very closely with ,and who provided me a
rich experience in teaching.
I thank the University of Nairobi for awarding me a scholarship to pursue this program,
without which, it could have taken me a long time to start the program. I thank Ms
Nancy and Ms. Alice of Accounting Department for their support in various areas during
the period of my study.
I thank my mother, Mrs. Sarah Too, my brothers Joseph, David and Richard and my
sister Beatrice, all for their sacrifices, financial and otherwise, throughout my program.
Also for their advises and guidance which up to now continue to shape my life. I
appreciate my friend Eva for accepting my decision to join the program and for being
there for me throughout the period of the study.
Finally, I thank all my MBA colleagues, all of whom I cannot mention, for providing me
with a challenging and interesting learning environment, and wonderful academic and
social experiences. I thank Mr. John Kamiri Kamau for providing free consultations,
sometimes up to very late hours of the night, and Mr. Humphrey Simbovo for his
assistance, especially in the data analysis.
Thank you and God bless you all.
v
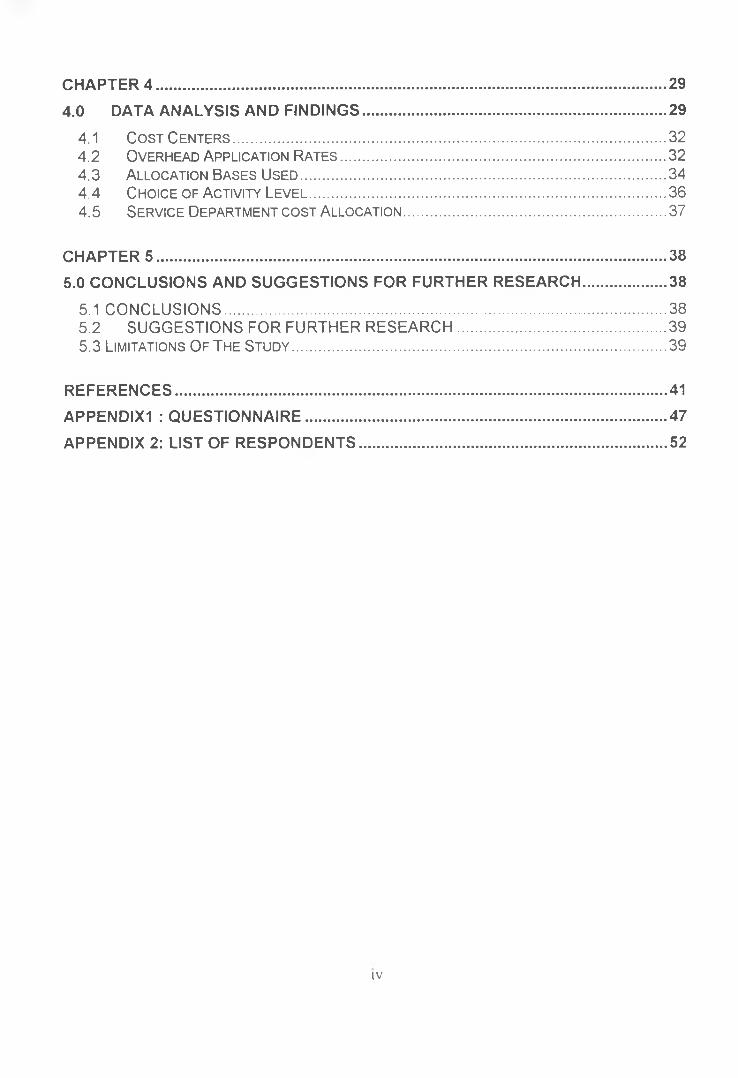
ABSTRACT
This study sought to survey how Kenyan manufacturing companies allocate their fixed
overheads to products or departments. Cost allocation affects reported figures in the
companies’ financial statements and hence the decisions taken on the basis of those
financial statements.
Fifty companies were selected, and asked to fill a semi-structured questionnaire on their
allocation method in terms of cost centers used, allocation base used, service
department cost allocation methods, over head application rates and how they deal with
under or over recovery of overheads. Response rate was 64 % of the surveyed
companies. Data was analyzed using percentages, proportions and tables.
Results indicate that cost allocation is practiced by majority of companies in Kenya.
However, most companies still use traditional volume-based approach, which suggests
that majority of companies, could be making serious mistakes in their decisions as
noted in the literature that bad allocation lead to poor decisions. The most important
reason for cost allocation noted by respondents is to provide information for managerial
decision-making.
On average, Kenyan manufacturing companies have two cost centers and majority of
companies use units of outputs as their allocation base. Majority of companies use
actual activity levels to determine an overhead application rate, and thus the problem of
dealing with over or under recovery of overheads is not common in Kenya. The few
companies that use budgeted activity levels; however, write- off over- or- under
application of overheads through profit and loss account. Results of this study also
indicate that Activity Based Costing has not been appreciated in Kenya.
VI
CHAPTER 1
1.0 INTRODUCTION
1.1 BACKGROUND
Corporate organizations accumulate costs of resources consumed in their operations
for the purpose of performance measurement and for decision-making. Snyder et al
(1997) argue that better managerial control in terms of decision making and
understanding the total costs of a system or service result from allocating indirect costs.
Costs are classified as direct, which are costs that are related to the cost object and can
be traced to it in an economically feasible way or indirect costs, which are costs that
cannot be traced to the cost object in an economically feasible way.
The accumulated costs need to be assigned to cost object using a selected criteria.
Accounting literature recognizes two methods of valuing cost objects. Horngren, (1994)
note that two methods of costing the inventories of manufacturing companies are direct
costing and absorption costing. Under direct costing, only those costs of production that
vary directly with activity are treated as product costs. These costs include direct
materials, labour, and variable portion of manufacturing overheads.
Under direct costing, fixed manufacturing overheads are treated as period costs, and
are charged in its entirety against revenue each period. Garrison (1991) notes that
advocates of direct costing argue that fixed overhead costs relate to the capacity to
produce rather than to the actual production of units of a product in a given year. They
argue that cost for facilities, equipment, insurance and supervisory salaries, represent
costs of being ready to produce and therefore will be incurred regardless of whether
actual production takes place.
1
Absorption costing treats all costs of production as product costs, regardless of whether
they are variable or fixed in nature. Advocates of absorption costing, argue that fixed
overheads are just as essential to the production process as variable costs. They argue
that to be fully costed, each unit of the product must bear an equitable share of all
manufacturing costs. Accordingly, fixed overheads need to be allocated. “If there is a
cost that must be divided up among many cost objects, and there is no causal or
statistical relationship to make this division, then division of such costs is an allocation",
Hirsch (1991).
Kaplan and Atkinson (1998) trace the need to properly allocate indirect costs to the mid-
nineteen century when complex metalworking companies emerged and the rise of
Scientific Management Theory. They note that before the advent of metal working
shops and scientific management movement, management accounting systems
focused on directly measured costs, such as material and labor that could easily be
traced to the output product. They conclude that although overhead and capital costs
existed, the narrow product lines of early manufacturing corporations created little
demand to attempt to assign indirect costs to output products.
The metalworking shops, however, produced a wide variety of finished products that
consumed resources at widely different rates. Because of the dispersion that the
various output products made on the firm’s capital, labor, and support resources, simple
measures of cost per pound or cost per unit of output were not adequate to summarize
the efficiency of conversion process. Kaplan and Atkinson (1998) notes that engineers
and managers of corporations therefore, started searching for ways to assign overhead
costs to products, especially when bidding for new jobs.
Kaplan and Atkinson (1998) argues that because information collection and processing
costs were quite high a century ago, and overhead costs were still less important than
direct material and labor costs, it was not deemed worthwhile to invest large amounts of
energy and resources to accurately measure and assign indirect and support
department costs to products.
?
Simple rules were thus adopted such as marking up direct labor hours or shillings by a
percentage that reflected the ratio of indirect and support department expenses.
This short cut, or approximation, of attributing the consumption of overhead resources
to the quantity of direct labor in a product was critized almost immediately. Church
(1908), quoted by Kaplan and Atkinson (1998), noted that if we apply this method to a
shop in which large and small machines, highly paid and cheap labor, heavy castings
and small parts, are all in operation together, then the result, unless measures are taken
to supplement it, is no longer trust worthy.
In order to correctly and fairly allocate indirect costs, it is necessary to first identify and
segregate costs as either direct or indirect, called cost pools. Once indirect cost have
been grouped together in cost pools that are like in nature, and in terms of their relative
contribution to particular cost objectives, the next step is to appropriately distribute
these costs using an acceptable method, (OMB A-21).
Snyder (1999) notes that cost allocation is a three-step process of selecting cost
objects, pooling related overhead costs and selecting the cost bases to connect the
objectives to the pooled costs He notes further that allocation may be simple, relying on
a single base, or Activity Based Costing (ABC), relying on multiple bases Horngren et
al (1994) argues that managers must first choose the primary purpose that a particular
cost allocation is to fulfill and then select the appropriate criterion in implementing the
allocation. He emphasizes the priority of cause and effect and the benefits received
criteria, especially when the purpose for cost allocation is related to economic decision
or motivation purposes.
Cost allocation serves important purposes in corporate organizations. According to
Bloncher et al (1999), the objectives of cost allocation are to achieve effective cost
management through method that motivate managers to exert a high level of effort to
achieve the goals of top management, provide the right incentive for managers to make
decisions that are consisted with the goals of top management and fairly determine the
3
rewards earned by the managers for their effort, skills and for the effectiveness of
decision making. They argue that a major advantage of cost allocation systems is that
they draw managers’ attention to shared facilities. The cost allocation provides a strong
incentive for individual and team efforts to manage the cost of these facilities. Also it
can have the benefit of reminding managers of the service and thereby encouraging
them to use it.
Despite the important purposes that cost allocation serves, academicians or practicing
accountants have suggested no objective methods of allocation. As a result, cost
allocation has been a controversial issue among scholars and practicing accountants.
Reed (1927) demonstrated the problem with allocation using a story of a butcher who
killed a calf, as described below: -
“The butcher he killed a calf, a nice young, adolescent bull. Being a modern butcher, he
then called upon his engineer, his secretary and his figurers to appear and perform a cost
allocation on the carcass. “What price veal? Quote he, and what price hide? How much
did the meat on this animal cost? How much did the hide cost in its present undressed
state: my rate of profit must be the same, too, on the bones and hoofs, so tell me the
cost per pound of each” There upon, and for many days thereafter, the figures flew freely.
The bull was spread upon the dissecting table and treated from every angle and by every
method. And finally, the city health authorities came and carted them all away.”
(Reed, C.S, “Veal, Hide and By-Products,” Electrical World, August 27, 1927)
Reed (1927) concludes that there has been a lot of good bull used up in allocations, but
the original bull remains unallocated. The controversy relates to selection of appropriate
allocation bases that meets the criteria for effective cost allocation, that is, one that has
a cause and effect relationship with the indirect costs.
4
1.2 Statement of the Problem
Bloncher et al (1999) note that one of the most pervasive problems in management
accounting is determining how the cost of shared facility; programme, production,
process or service should be allocated among its users. This is because there are no
objective acceptable methods of cost allocation.
As such cost allocation has generated a lot controversy among the accountants and
scholars for along time. The controversy emanates from the fact that no objective
methods or allocation bases exist, and thus allocation is viewed as being arbitrary.
Thomas (1980), a great critic of cost allocation, calls these allocations “notional figure
shuffling.’’ He argues that cost allocations do not represent economic reality but rather,
just accounting numbers. However, according to Hirsch (1988), allocations continue to
exist and do not seem to be substantially changing even in the light of at least twenty
years of critisms by many academicians
Cost allocation affects reported figures in the financial statements and thus the decision
usefulness of the financial statement information. According to Horngren (1994), cost
figures play a key. -role in many important decisions. If these figures result from
allocation bases that fail to capture cause and effect relationships, managers make
decisions that conflict with maximizing long run share value, for example, products may
be undercosted or overcosted.
Drury (2000) argues that managers using cost information extracted from simplistic
systems are more likely to make important mistakes arising from using inaccurate cost
information. The end result of this may be a high cost of errors. Conversely,
sophisticated systems are more expensive to operate but they minimize the chances
and cost of errors.
5
According to Drury (2000), more accurate product costs are required so that we can
distinguish between profitable and unprofitable products. By more accurately measuring
resources consumed by products or other cost objects, a firm can identify its sources of
profits or losses. If the cost system does not capture sufficiently accurately the
consumption of resources by products, the reported product costs will be distorted, and
there is a danger that managers may drop profitable products or continue production of
unprofitable products. A wrong allocation lead to wrong figures in the financial
statements eventually translating into sub optimal decisions by managers
Cost allocation related studies have been done in Norway by Bjornenak (1997b),
Holland by Boons et al (1994), Ireland by Clark (1995), in Australia and Japan by
Blayney and Yokoyama (1991) and in United Kingdom by Drury (1993). These studies
sort to determine how companies in respective countries deal with the problem of
allocation in terms of objectives of cost allocation, cost centers used, nature and
number of allocation bases used and methods of cost allocations in use. Therefore, this
study is necessary to shed some light on how the issue of cost allocation is addressed
in African manufacturing environments, characterized by low levels of technological
development, which affects the level of detail of analysis of cost information. This study
seeks to address the question “how do Kenyan manufacturing companies address cost
allocation issues?”
1.3 Objectives of the Study
(i) To establish the purposes of allocating indirect costs by manufacturing
companies in Kenya
(ii) To establish the number of cost centers used and the overhead application
rates used.
(iii) To establish the type and number of cost allocation bases used by Kenyan
manufacturing companies
(iv) To establish cost allocation methods used for service department costs.
6
This study is significant to a number of parties in academia, industry and the accounting
profession as described below.
1.4 Significance of the Study
Industry Players
Industry players and management of corporate organizations stand to benefit from the
findings and recommendations of this study. The study will highlight the various options
for cost allocation from which they could select. Hence they would improve their
allocation practices.
Academicians
The results of the study will be useful to academic community as a source of additional
theoretical knowledge, which can further be utilized as a basis for further research in the
area of cost allocation.
Standard Setting Bodies-lnstitute of Certified Public Accountants of Kenya
The findings of this study will be useful to standard -setting bodies like Institute of
Certified Public Accountants of Kenya (ICPAK) to determine the need for setting a
standard to guide the cost allocation decisions of corporate organizations. This has
happened in the USA where Cost Accounting Standards (CAS) has been established.
Management Consultants
The findings will also be very useful to management consultants who seek opportunities
from corporate organizations. If the findings indicate that traditional cost allocation
practices are still widely used in Kenya, the management consultants can seek
opportunities to help such companies establish modern improved cost allocation
methods, for example, Activity Based Costing (ABC).
7
CHAPTER 2
2.0 LITERATURE REVIEW
2.1 Cost Allocation Systems
According to Drury (2000), for accurate assignment of indirect costs to cost objects
cause- and- effect allocations should be used. He notes that two types systems can be
used to assign indirect costs to cost objects; these are Traditional Costing Systems and
Activity Based Costing (ABC) Systems.
2.1.1 Traditional Costing Systems
Drury (2000) notes that traditional costing systems were developed in the early 1900s
and are still widely used today. They rely extensively on arbitrary cost allocations.
Kaplan and Atkinson (1998), note that traditional systems tend to be simplistic and are
inexpensive to operate but they are likely to result in inaccurate cost assignments and
thus the reporting of inaccurate costs. Traditional costing systems rely on volume-based
allocation bases such as quantities of units produced, labor hours and machine hours
used.
Traditional costing system has a four-step allocation process (Drury 2000,Kaplan and
Atkinson 1998). These are; assigning all manufacturing overheads to production and
service cost centers, reallocating the costs assigned to service cost centers to
production cost centers, computing separate overhead application rate for each
production cost center and finally, assigning production cost center overheads to
products or other chosen cost objects.
8
2.1.2 Activity Based Costing (ABC) System
As a result of inadequacies of traditional costing systems, ABC costing systems
emerged in 1980s. Drury (2000) however notes low levels of adoption of ABC costing
systems. He notes that surveys in many countries suggest that between 20% and 30%
Of the surveyed organizations have implemented ABC systems.
He further notes that significant variations in the usage of ABC both within the same
country and across different countries have been reported. He argues that the
differences may arise from difficulty in precisely defining the difference between
traditional costing systems and the specific time period when the surveys were actually
undertaken.
Survey evidence suggests that over the last decade there has been an increasing
interest in ABC (Drury, 2000). In the UK, surveys in the early 1990s reported adoption
rates around 10% (Innes and Mitchell, 1991, Nichols, 1992; Drury et al., 1993). Similar
adoption rates of 10% were found in Ireland (Clark, 1992) and 14% in Canada
(Armitage and Nicholson, 1993). In the USA, Green and Amenkhienan (1992) claimed
that 45% of firms used ABC to some extent. More recent surveys suggest higher ABC
adoption rates. In the UK, reported usage was 20% (Innes and Mitchell, 1995a), 22%
(Banerjee and Kane, 1996), 21% (Evans and Asworth, 1996) and 23% (Drury and
Tayles, 2000). In the USA, Shim and Stagliano (1997) reported a usage rate of 27%.
Reported usage rates for mainland Europe are 19% in Belgium (Bruggeman et al.,
1996) and 6% in Finland in 1992, 11% in 1993 and 24% in 1995(Virtanen et al, 1996).
Low usage rates have been reported in Denmark (Israelsen et al., 1996), Sweden (Ask
et al., 1996) and Germany (Schemer, 1996). Activity -based techniques do not appear
to have been adopted in Greece (Balias and Venieris, 1996), Italy (Barbato et al., 1996)
or Spain (Saez-Torrecilla et al., 1996).
Other studies have examined the applications of ABC. Innes and Mitchell (1995) found
that cost reduction was the most widely used application. Other widely used
applications included product/service pricing, cost modeling and performance
9
measurement/improvement. ABC was used for stock valuation by 29% of ABC adopters
thus suggesting that majority of ABC users have separate systems for stock valuation
and management accounting applications.
According to Bjornenak (1997a), there has been little research on who adopts ABC and
for what reasons. His survey indicated that 40% of responding Norwegian companies
had adopted ABC as an idea (i.e. they had implemented ABC or planned to do so).
Drury (2000), notes that different variables relating to cost structure, competition,
existing cost systems, size and product diversity have been tested as explanatory
factors for the adoption of ABC but only cost structure and size emerged to be
statistically significant. A UK study by Drury and Tayles (2000) indicated company size
and business sector had a significant impact on ABC adoption rates. The adoption rates
were 45% for the largest organizations and 51% for financial and service organizations.
Although ABC adopters used significantly more cost pools and cost drivers than non
adopters, most adopters used fewer cost pools and drivers compared with what is
recommended in the literature. Approximately 50% of ABC adopters used less than 50
cost centers and less than 10 separate types of cost driver rates.
Friedman and Lyne’s (1995) case study research of 12 UK companies cited top
management support as a significant factor influencing the success or failure of ABC
systems. Implementation problems identified by the various studies included the amount
work in setting up the system and data collection, difficulties in identifying activities, and
selecting cost drivers, lack of resources and inadequate computer software. The
benefits reported by the studies included more accurate cost information for product
pricing, more accurate profitability analysis, improved cost control and better
understanding of cost causation.
Kaplan and Atkinson (1998) argues that ABC systems were developed to provide more
accurate ways of assigning the costs of indirect and support resources to activities,
business processes, products, services and customers. ABC systems recognize that
10
many of organization’s resources are required not for physical production of units of
product but to provide a broad array of support activities that enable a variety of
products and services to be produced for a diverse group of customers.
Kaplan and Atkinson (1998) notes that ABC system of costing attempts to first identify
the activities being performed by the organization’s support resources. Then it traces
the resource expenses of the support resources to activities, ending up with the total
cost of performing each of the organization’s support activities. In the next stage, ABC
systems trace activity costs to products by identifying a cost driver for each activity,
calculating an activity cost driver rate, and using this rate to drive activity costs to
products.
Kaplan and Atkinson (1998) conclude that ABC systems expand the type of production
cost centers used to accumulate costs. Rather than focus only on the location or
organization of responsibility centers, ABC systems focus on the actual activities
performed by organizational resources.
2.2 Purposes of cost allocation
Horgren et al (1994) note that indirect cost are often a sizable percentage of the cost
assigned to cost objects such as products, distribution channels, and customers. He
notes that cost allocation serves four purposes; to provide information for economic
decisions, to motivate manager and employees for example, to encourage the design of
products that are simple to manufacture or less costly to service, to justify cost or
complete reinforcement for example, cost product at a fair price, often done with
defense contracting, to measure income and assets for reporting to external parties, for
example, to cost inventories for financial reporting to stock holders and bond holders.
Drury (2004) argue that manufacturing organizations assign cost to products for two
purposes; for internal profit measurement and external financial accounting
requirements in order to allocate the manufacturing cost incL'red during a period
11 'USS?®71,» N A m ** W J c m e
between cost of goods sold and inventories, and secondly; to provide useful information
for managerial decision- making requirements.
Freemgen and Liao (1981) identified the following purposes of allocation of corporate
and support costs, ranked by frequency; to remind profit centre manager that indirect
cost exist and that profit centre earning must be adequate to cover some share of cost,
to encourage use of central services that would otherwise be underutilized, to stimulate
profit center managers to put pressure on central managers to control service cost.
Atkinson (1987) found out that Canadian executives have the following objectives,
ranked in order of importance, for allocating costs to divisions and department; to
determine costs, to evaluate profit centers, to fix accountability, to allocate costs per
usage, to promote more effective resource usage, to foster cost awareness
They further found out that these executives encountered the following difficulties in
implementing their cost allocation programs; making the allocation results in losses
being reported, friction arises among managers, market prices are unstable, allocations
are perceived as arbitrary, usage is hard to monitor, agreement on the allocation
method is difficult to obtain, and that allocation process is time Consuming
Similar surveys among Australian, Ramadan (1989) and United Kingdom, Dean, Joye
and Blayney (1991) found that managers in Australia and United Kingdom gave the
same ranking to the following reasons for allocating corporate costs; to acknowledge
that division would incur such costs if they were independent units or if the services
were not provided centrally, to make division managers aware that central cost exists, to
stimulate divisional managers to put pressure on central support managers to control
costs, to stimulate divisional managers to economize in usage of central service.
Snyder et al (1997) notes that there are two outcomes from allocating costs: better
economic decisions and a higher level of managerial motivation. In the first case,
management seeks to understand the “true" costs of a particular product or service
better. The outcome of better economic knowledge should be better decision-making or
12
pricing concerning services. A failure to include increases in overhead such as
administrative cost leads managers to underestimate the costs of new services.
Thus, according to Snyder (1997), too little money will be requested or budgeted, and
the services will drain resources from other programmes. Similarly, if the services are
priced, it may be at a level too low to recover a reasonable amount of operating costs.
Secondly, Snyder et al (1997) further argued that another outcome of allocation should
be to encourage lower level managers to behave in ways that further the aims of the
organization (as set forth in the planning of upper management). For example, upper
management may want to increase the use of internal data processing resources.
Individual departments may then be assessed a yearly, lump-sum expense based on
the amount of data processing services available to them. They argue that since the
department pays for the service regardless of how often they use them, they are
encourage to use them to get the full benefit of the allocated costs.
Bloncher et al (1999) argues that cost allocation has both strategic and ethical roles.
They note that a number of strategic and ethical issues are important in cost allocation
They argue that ethical issues arise when costs are allocated for products or services
that are produced for both competitive environments and public agencies or government
departments. The incentive in these situations is for the manufacturer, using cost
allocation methods, to shift manufacturing costs from competitive products to cost-plus
products. They cite evidence from a 1984 study reported by former US Secretary of
Navy Mr. John F. Lehman. The study performed for the navy by a CPA firm, found that
defense contractors’ profits on military work were higher than for non-military work.
A second and related issue, according to Bloncher et al (1999), in implementing cost
allocation methods, is the equity or fair share issue that arises when the government
reimburses the cost of private institution, or when the government provides a service for
a fee to the public. In both cases, cost allocation methods are used to determine the
profit price or reimbursement amount.
13
A third important issue, according to Bloncher et al (1999), in cost allocation, is the
effect of the chosen cost allocation method on the costs of products sold to or
purchased from foreign subsidiaries. The cost allocation method usually affects the
costs of products traded internationally and therefore the amount of taxes paid in the
domestic and the foreign countries. Firms can reduce their worldwide tax liability by
increasing the costs of products purchased in high tax countries countries, or countries
where the firm does not have favorable tax treatment. Bloncher et al (1999) conclude
that, for these reasons, international tax authorities closely watch the cost allocation
methods used by multinational companies.
Jae et al (2000) argue that other than product costing, the reasons to allocate service
departmental costs include; to control and aid in efficiency evaluation, for superior
income and asset measurement for external parties, to remind production department
managers of existence of indirect costs they have to absorb, motivate department
managers to use the service wisely, and to accomplish a basis for cost justification or
reimbursement.
Hilton (1997) argues that for product costing purposes, a joint product cost usually is
allocated to the joint products that result from the joint production process. He notes that
such an allocation is necessary for inventory valuation and income determination,
among other reasons.
2.3 Cost Centers and Overhead Application Rates
Drury (2000) defines cost centers or cost pools as the locations to which overhead costs
are initially assigned. The total costs accumulated in each cost center are then assigned
to cost objects using a separate allocation base for each cost center.
14
According to Drury (2000), if only a small number of cost centers are established, it is
likely that activities within a cost center will not be homogeneous and, if the
consumption of the activities by products/ services within the cost centers varies, activity
resource consumption will not be accurately measured. Therefore, in most situations,
increasing the number of cost centers increases the accuracy of measuring indirect
costs consumed by cost objects. Drury, however, advises that the choice of number of
cost should be based on cost-benefit- criteria
Ask and Ax (1992) in a survey of Swedish organizations concluded that 70% indicated
that cost centre consisted of departments, 32% indicated that cost centre consisted of
work cells, 22% noted that cost centers consisted of groups of machines and15% noted
that cost centers consisted of single machines
A Norwegian study by Bjomenak (1997b) reported an average of 38.3% cost centres
used by the respondents. A survey of the United Kingdom (UK) organizations by Drury
and Tayles (2000) concluded that 14% of respondents used less than six cost centers,
21% of the respondents used six to ten cost centers, 29% of the respondents used
eleven to twenty cost centers and 36% of them used more than 20 cost centers.
Drury (2000) notes that the most simplistic traditional costing systems assigns indirect
costs to cost objects using a single overhead rate for the organization as a whole. He
argues that a blanket overhead rate will generally result in the reporting of inaccurate
product costs. He suggests that a blanket overhead rate can only be justified when all
products consume departmental overheads in approximately the same proportions. He
advises that if a diverse product range is produced, with products spending different
proportions of time in each department, separate departmental overhead rates should
be established.
Drury (2000) argues a case for establishment of cost center overhead rates. He notes
that in some situations, it is possible to go a stage further and establish separate
overhead rates for smaller segments within an organization, such as groups of similar
15
machines within the same department. He notes that a single overhead rate for the
whole department will result in inaccurate assignment of overheads when a department
consists of a number of different production centers and products passing through the
departments consume overheads of each production center in different proportions.
If a single overhead rate for the whole department were applied, all of the overheads
within the department would be averaged out and the product would be indirectly
allocated with some of the overheads of the remaining production centers. Drury
concludes that if the department consists of a number of different production centers,
each with significant overhead costs, and products consume production center
overheads in different proportions, separate overhead application rates should be
established for each production center within the department.
Hilton (1997) note that in some production processes, the relation between overhead
costs and the firm’s products differs substantially across production departments. In
such cases, he advises that the firm may use departmental overhead application rate,
which differs across production departments. This, he argues, usually results in a more
accurate assignment of overhead costs to the firm’s products.
However, significant usage of blanket overhead rates has been reported in surveys
undertaken in many different countries. For example, the percentage usages vary from
20- 30% in UK (Drury and Tayles 1994), USA (Emore and Ness 1991), Australian (Joye
and Blayney 1990; 1991) and Indian (Joshi 1998) surveys. In contrast, in Scandinavia
only 5% of the Finnish companies (Lukka and Granlund 1996), one Norwegian
company (Bjornenak, 1997 b) and none of the Swedish companies sampled (Ask et al.,
1996) used a single plant-wide rate. Zero usage of plant-wide rates was also reported
from a survey of Greek companies (Balias and Venieris 1996). In a more recent study
of UK organizations, Drury and Tayles 2000) reported that a blanket rate was used by
3% of the surveyed organizations.
16
A survey of Australian organizations by Joye and Blayne (1990) concluded that 36% of
the responding organization used a single plant wide rate, 24% used overhead rates for
groups of work center, 31% used overhead rates for each work centers, 9% used
overhead rates for each machine
A survey of United Kingdom companies by Osborne et al (1993) reported that only 26%
of companies used a single plant wide overhead rate, 31% used separate overhead
rates for each department, and 38% used separate overhead rates for work centers
within each department and 5% used none of the above.
Hilton (1997) argues that the use of predetermined overhead application rate leads to
under application or over application of overhead costs. He notes that the amount by
which actual overhead exceed applied overheads is called under applied overheads,
while the amount by which applied overheads exceed actual overheads is called over
applied overheads. He further argues that over or under applied overheads is caused by
errors in the estimates of the overhead costs and amount of activity measure used to
compute the predetermined overhead rate.
Hilton (1997) note that at the end of the accounting period, the managerial accountant
has two alternatives for the disposition of under or over applied overheads. Under the
most common alternative, the under or over applied overheads is closed into cost of
goods sold. This reflects the fact that the cost of units sold had been underestimated
due to the slightly underestimated predetermined overhead rate. He argues that most
companies use this approach because it is simple and the amount of under or over
applied overheads is usually small. Moreover, most firms wait until the end of the year
to close under or over applied overheads into cost of goods sold.
Another alternative for disposition of under or over applied overhead costs according to
Hilton (1997) is to prorate among cost of goods sold, work-in -progress and finished
goods inventory.
17
He notes that some companies use a more accurate procedure to dispose of under or
over applied overheads. This approach recognizes that underestimation or
overestimation of the predetermined overhead rate affects not only cost of goods sold,
but also work- in -progress and finished goods inventory. Therefore, under or over
applied overheads affects all these accounts.
Hilton (1997) considers further aspects of overhead application. Specifically, he notes
that the issue of overhead application illustrates the importance of cost benefit theme.
He notes that a product costing system could be designed to use an actual overhead
rate instead of a predetermined overhead rate. However, an actual overhead rate can
be computed only at the end of the accounting period. The result is more accurate, but
rather untimely product costing information.
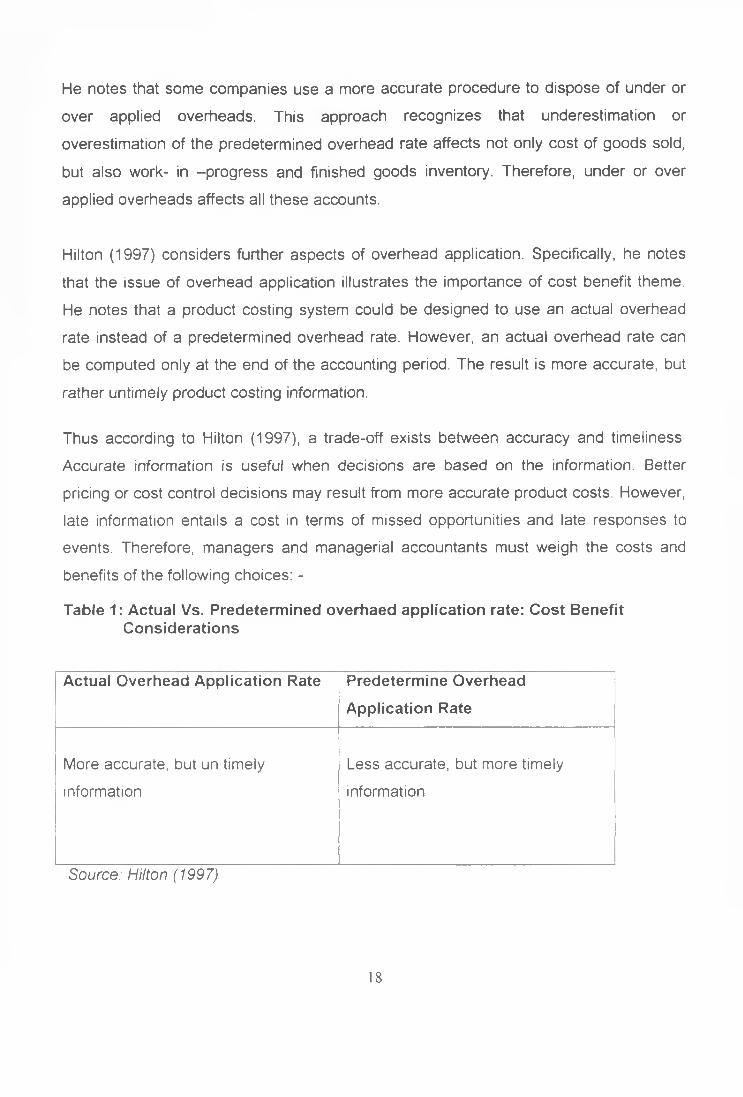
Thus according to Hilton (1997), a trade-off exists between accuracy and timeliness.
Accurate information is useful when decisions are based on the information. Better
pricing or cost control decisions may result from more accurate product costs. However,
late information entails a cost in terms of missed opportunities and late responses to
events. Therefore, managers and managerial accountants must weigh the costs and
benefits of the following choices: -
Table 1: Actual Vs. Predetermined overhaed application rate: Cost Benefit Considerations
Actual Overhead Application Rate Predetermine Overhead
Application Rate
More accurate, but un timely
information
Less accurate, but more timely
information
Source: Hilton (1997)
18
Hilton (1997) argues that it might be tempting to solve the overhead rate problem by
using an actual rate and recomputing the rate frequently to provide more timely
information. For example, the rate could be recomputed monthly. According to him, the
problem with this is that some manufacturing overhead costs are seasonal. Thus, since
overhead costs are incurred unevenly throughout the year, the monthly overhead rate
would fluctuate widely. Moreover, the level of a volume-based cost driver, used as a
denominator of overhead rate also may vary from period to period. These activity
variations can add to the fluctuations in the overhead rate. The resulting inconsistency
in product costs could give misleading signals for product pricing and other decisions
that may depend on product cost information.
Hilton (1997) notes that accountants generally choose to smooth out fluctuations in the
overhead rate by computing the overhead rate over along period of time. An overhead
rate computed in this fashion is called a normalized overhead rate. The use of a
relatively long time period forces the accountant to face the trade-off between accuracy
and timeliness.
2.4 Cost A llocation Bases
According to Hilton (1997), the accounting department chooses some measure of
productive activity to use as a basis for overhead head application. In traditional product
costing systems, this measure usually is some volume-based cost driver such as direct
labor, direct labor cost, or machine hours. He notes that to determine an overhead
application rate, an estimate is made of the amount of manufacturing overhead that will
be incurred during a specified period of time, and the amount of cost driver or activity
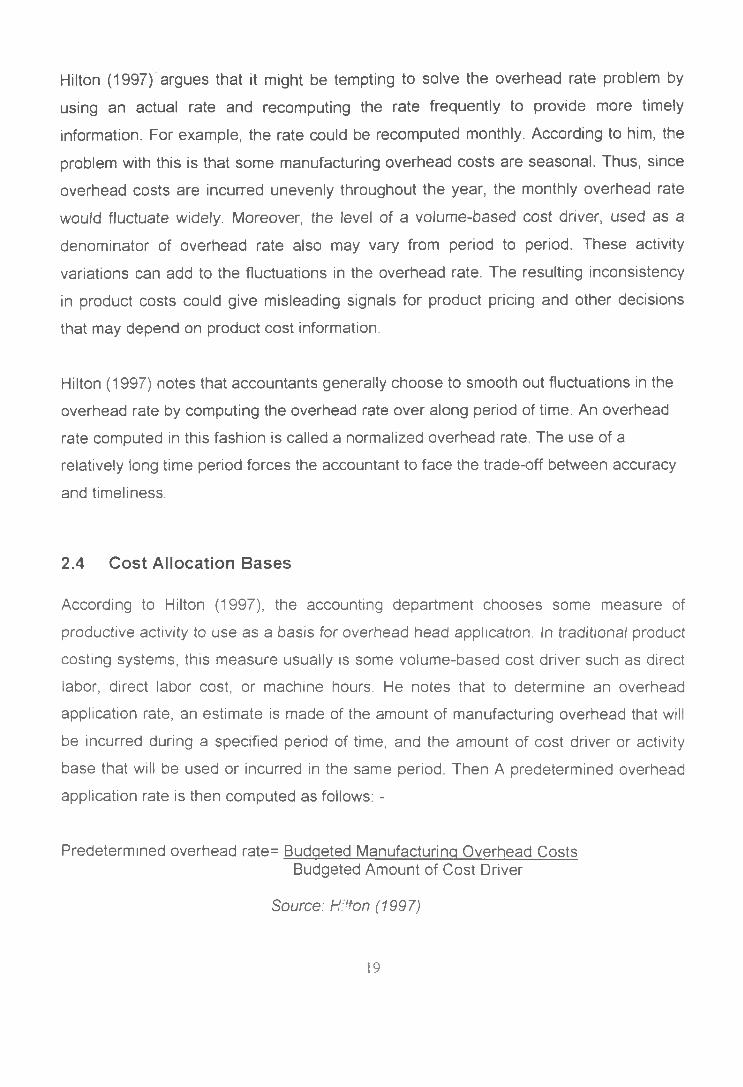
base that will be used or incurred in the same period. Then A predetermined overhead
application rate is then computed as follows: -
Predetermined overhead rate= Budgeted Manufacturing Overhead CostsBudgeted Amount of Cost Driver
Source: Hi'ton (1997)
19
Hilton (1997) further note that manufacturing overhead includes various indirect
manufacturing costs that varies greatly in their relationship to the production process.
He argues that if a single volume-based cost driver (or activity base) is used in
calculating a predetermined overhead application rate, it should be some productive
input that is common across all of the firm’s products. According to him, if for example,
all of the firm’s products require direct labor, but only some products require machine
time, direct labor hours would be a preferable activity base. If machine hours were used
as the base, products not requiring machine time would not be assigned any overhead
costs.
Hilton (1997) advises that in selecting a volume- based cost driver (or activity base); the
goal is to choose an input that varies in a pattern that is most similar to the pattern with
which overhead costs vary. Thus products that indirectly cause large amounts of
overhead costs should also require large amounts of the cost driver, and vice versa.
During periods when the cost diver is at low level, the overhead costs incurred should
be low. Thus, there should be a correlation between the incurrence of overhead costs
and use of the cost driver.
Hilton (1997) notes that in traditional product costing systems, the most common
volume-based cost divers are direct labor hours and direct labor costs. However, he
argues that there is a trend away from using direct labor as an overhead application
base. More production processes are becoming increasingly automated, through use of
robotics and computer integrated manufacturing systems. Increased automation brings
two results. First, manufacturing overhead costs represent a larger proportion of total
production costs and secondly, direct labor decreases in importance as a factor of
production. As direct labor declines in importance as a productive input, it becomes less
appropriate as a cost driver. For this reason, Hilton (2000), concludes that some firms
have switched to machine hours, process time, or throughput time as cost divers that
better reflect the pattern of overhead cost incurrence.
20
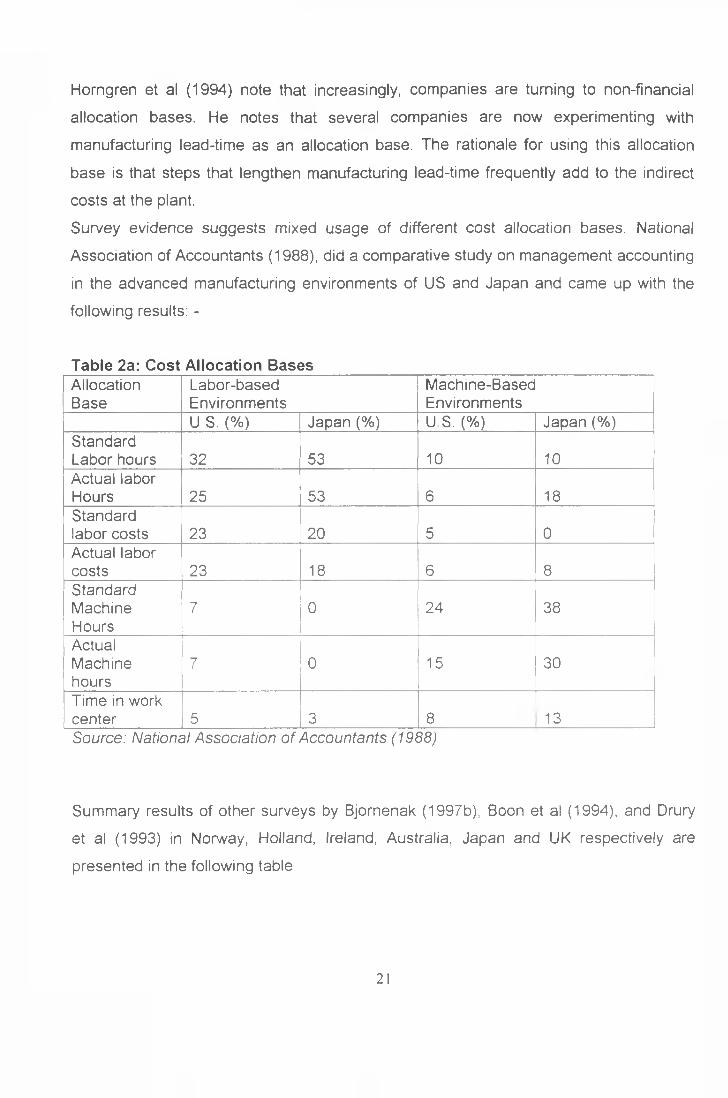
Horngren et al (1994) note that increasingly, companies are turning to non-financial
allocation bases. He notes that several companies are now experimenting with
manufacturing lead-time as an allocation base. The rationale for using this allocation
base is that steps that lengthen manufacturing lead-time frequently add to the indirect
costs at the plant.
Survey evidence suggests mixed usage of different cost allocation bases. National
Association of Accountants (1988), did a comparative study on management accounting
in the advanced manufacturing environments of US and Japan and came up with the
following results: -
Table 2a: Cost Allocation BasesAllocationBase
Labor-basedEnvironments
Machine-BasedEnvironments
U S. (%) Japan (%) U S. (%) Japan (%)Standard Labor hours 32 53 10 10Actual labor Hours 25 53 6 18Standard labor costs 23 20 5 0Actual labor costs 23 18 6 8StandardMachineHours
7 0 24 38
ActualMachinehours
7 0 15 30
Time in work center 5 3 8 13Source: National Association of Accountants (1988)
Summary results of other surveys by Bjornenak (1997b), Boon et al (1994), and Drury
et al (1993) in Norway, Holland, Ireland, Australia, Japan and UK respectively are
presented in the following table.
2 1
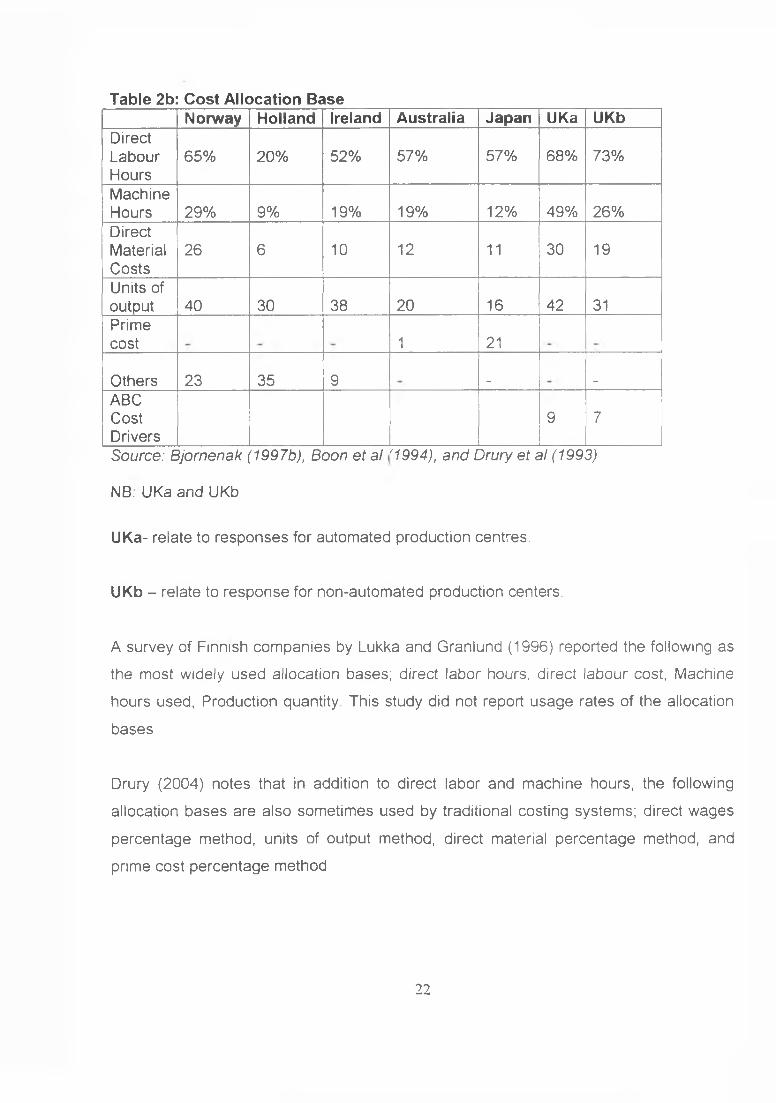
Table 2b: Cost Allocation BaseNorway Holland Ireland Australia Japan UKa UKb
DirectLabourHours
65% 20% 52% 57% 57% 68% 73%
MachineHours 29% 9% 19% 19% 12% 49% 26%DirectMaterialCosts
26 6 10 12 11 30 19
Units of output 40 30 38 20 16 42 31Primecost 1 21
Others 23 35 9 . .ABCCostDrivers
9 7
Source: Eijornenak (1997b), Boon et al f1994), and Drury et al (1993)
NB. UKa and UKb
UKa- relate to responses for automated production centres.
UKb - relate to response for non-automated production centers.
A survey of Finnish companies by Lukka and Granlund (1996) reported the following as
the most widely used allocation bases; direct labor hours, direct labour cost, Machine
hours used, Production quantity. This study did not report usage rates of the allocation
bases
Drury (2004) notes that in addition to direct labor and machine hours, the following
allocation bases are also sometimes used by traditional costing systems; direct wages
percentage method, units of output method, direct material percentage method, and
prime cost percentage method
22
Drury and Tayles (2000), surveyed UK organizations and concluded that, 34% used one
cost driver, 25% used two cost drivers, 10% used three cost drivers, 21% used three to
ten cost drivers, and 10% used more than ten cost drivers. A Norwegian study by
Bjornenak (1997a) reported an average usage of 1.79 cost drivers
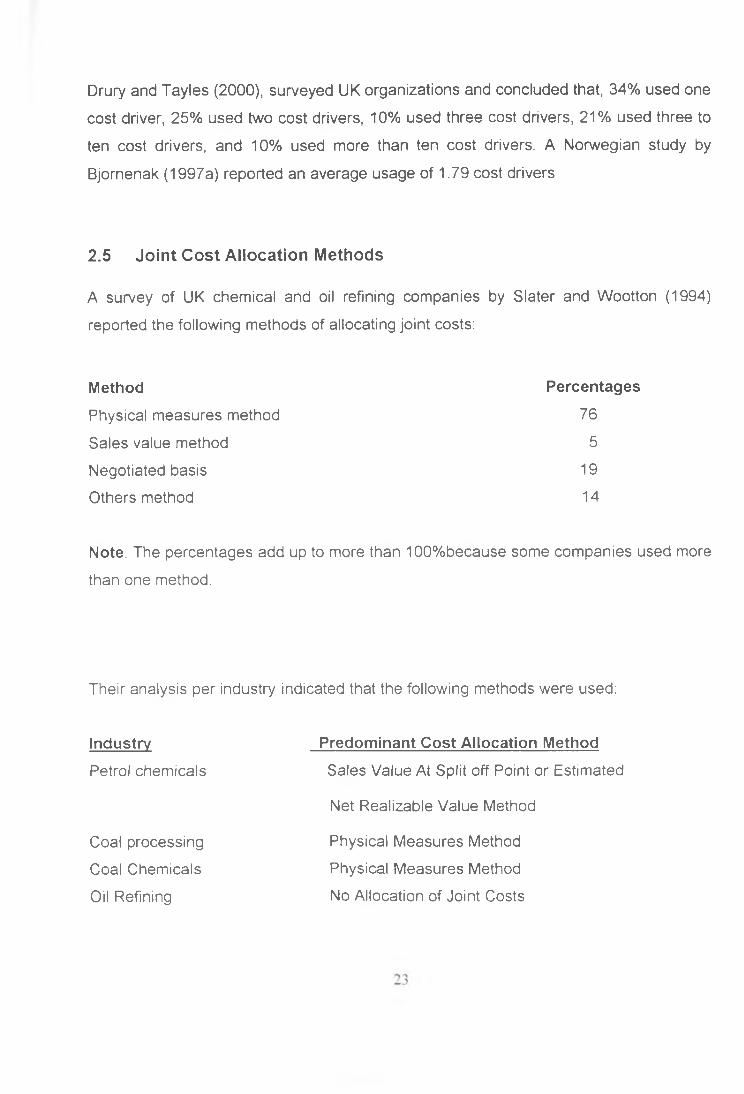
2.5 Joint Cost Allocation Methods
A survey of UK chemical and oil refining companies by Slater and Wootton (1994)
reported the following methods of allocating joint costs:
Method Percentages
Physical measures method 76
Sales value method 5
Negotiated basis 19
Others method 14
Note: The percentages add up to more than 100%because some companies used more
than one method.
Their analysis per industry indicated that the following methods were used:
Industry
Petrol chemicals
Coal processing
Coal Chemicals
Oil Refining
Predominant Cost Allocation Method
Sales Value At Split off Point or Estimated
Net Realizable Value Method
Physical Measures Method
Physical Measures Method
No Allocation of Joint Costs
Slater and Wootton, (1994) further noted that it was considered by the majority of oil
refineries that the complex nature of the process involved and the vast number of joint
products, made it impossible to establish any meaningful cost allocation between
products.
Hilton (1997) argue that there are three commonly used methods for allocating joint
product costs; physical- units method, relative sales value method, and net-realizable
value method
2.6 Inter Service Department Re-allocations
Service department provides service to production departments and other service
departments. When interaction between service departments, exists the allocation
process can become complicated. Drury (2004) identified four different method of
allocating the service department costs as; repeated distribution method, simultaneous
equation method, specified order of closing method and direct allocation method.
Jae et al ((2000), notes that in allocating service department costs, there are two
general approaches that may be used: single rate method and dual rate method. They
note that under single rate method, departmental costs are accumulated into a single
cost pool, with no distinction between variable costs and fixed cost. With the dual rate
method, departmental costs are accumulated into two or more cost pools.
Jae et al (2000) further note that once the service departmental costs are known, the
next step is to allocate service departmental costs to the production departments They
note that there are three basic methods of allocating service department costs; the
direct method, the step method and reciprocal method. The direct method allocates the
costs of each service directly to production departments, with no intermediate allocation
to other service departments.
24
The step method allocates cost of services rendered to other departments using an
allocation sequence; this method is also called “step-down method”. Jae et al (2000)
note that reciprocal method is a method of allocating service department costs to
production departments, where reciprocal services are allowed between service
departments. They note that the method sets up simultaneous equations to determine
the allocable cost of each service department.
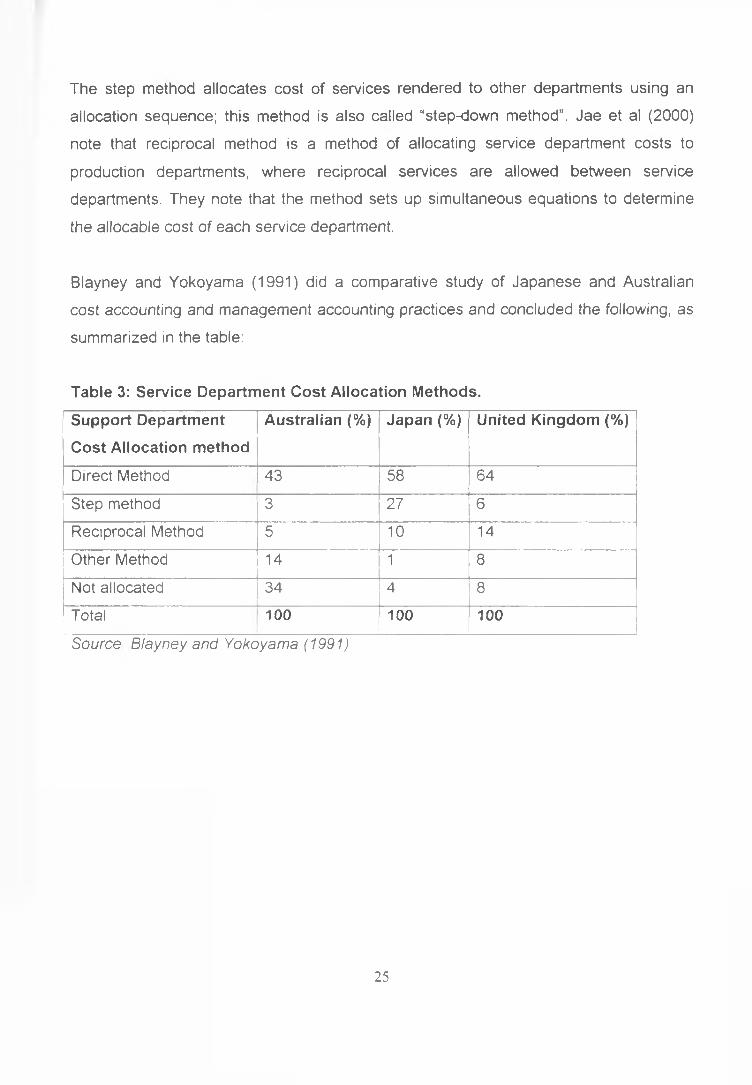
Blayney and Yokoyama (1991) did a comparative study of Japanese and Australian
cost accounting and management accounting practices and concluded the following, as
summarized in the table:
Table 3: Service Department Cost Allocation Methods.
Support Department
Cost Allocation method
Australian (%) Japan(%) United Kingdom (%)
Direct Method 43 58 64
Step method 3 27 6
Reciprocal Method 5 10 14
Other Method 14 1 8
Not allocated 34 4 8
Total 100 100 100
Source Blayney and Yokoyama (1991)
25
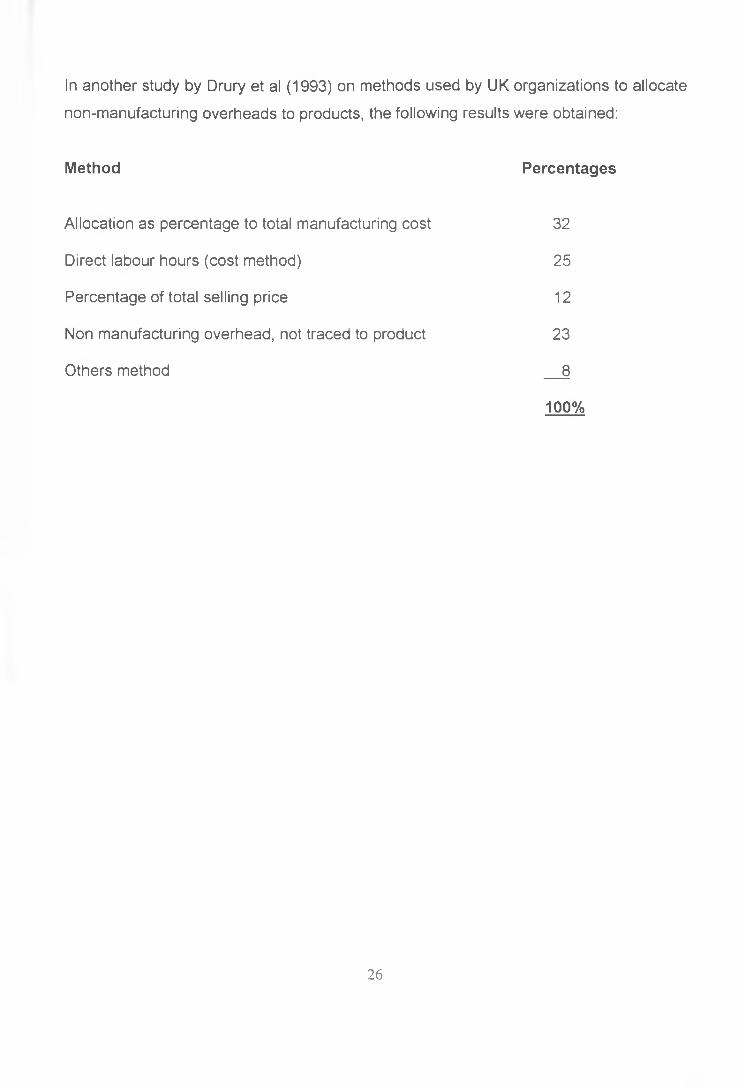
In another study by Drury et al (1993) on methods used by UK organizations to allocate
non-manufacturing overheads to products, the following results were obtained:
Method Percentages
Allocation as percentage to total manufacturing cost 32
Direct labour hours (cost method) 25
Percentage of total selling price 12
Non manufacturing overhead, not traced to product 23
Others method 8
100%
26
CHAPTER 3
3.0 RESEARCH METHODOLOGY
3.1 Research Design
This chapter highlights procedures adopted to achieve the objectives of the study and
thus address the reseach problem. It explains the type of data used, population of
interest, sampling technique, sample size taken for the study and methods of data
collection and analysis
This was a descriptive survey aimed at determining how kenyan manufacturing
companies allocate their fixed overheads. A sample was selected using stratified
random sampling technique This approach was considered appropriate since the
population of interest was too large for each element to be considered. The stratified
random sampling technique was adopted since manufacturing companies differ in terms
of products they produce, which also differ in resource consumption. Thus to ensure
that the sample was representative in the light of this product differences, stratified
random sampling technique was considered more appropriate.The survey provided a
basis of exploring the research question.
3.2 Population
The population of interest in this study comprised of manufacturing companies four
hundred and seventy five manufacturing companies as listed by Kenya Association of
Manufacturers at time of the study. This is because the problem of cost allocation is
most felt in the multi-product manufacturing set-ups.
3.3 Sample
The sampling frame for this survey was list of manufacturing companies maintained by
Kenya Association of Manufacturers. A sample of 50 companies out of a total of 475
companies was picked for this survey using stratified random sampling technique
27
Because of time and resource constrains, only companies in Nairobi City were
considered.
Stratification was based on the listing of manufacturing companies in Kenya maintained
by Kenya Association of Manufacturers. The following formula was used to determine
the number of companies in each stratum to pick: -
nj = n x N,N
Where: N= total population
Ni=stratum population
nj= stratum sample size
n=sample size desired
3.4 Data Collection Methods
The survey utilized primary data collected using a structured questionnaire with closed-
type questions and some few open-ended questions. The questionnaire was directed at
corporate finance managers, management accountants or chief accountants because
they are concerned with the allocation of overheads in corporate organizations. The
questionnaire was administered through drop and pick system.
3.5 Data Analysis
Descriptive statistics including total scores, mean score and proportions were used to
analyze data. For presentation purposes, summary statistics including tables and
percentages was used.
28
CHAPTER 4
4.0 DATA ANALYSIS AND FINDINGS
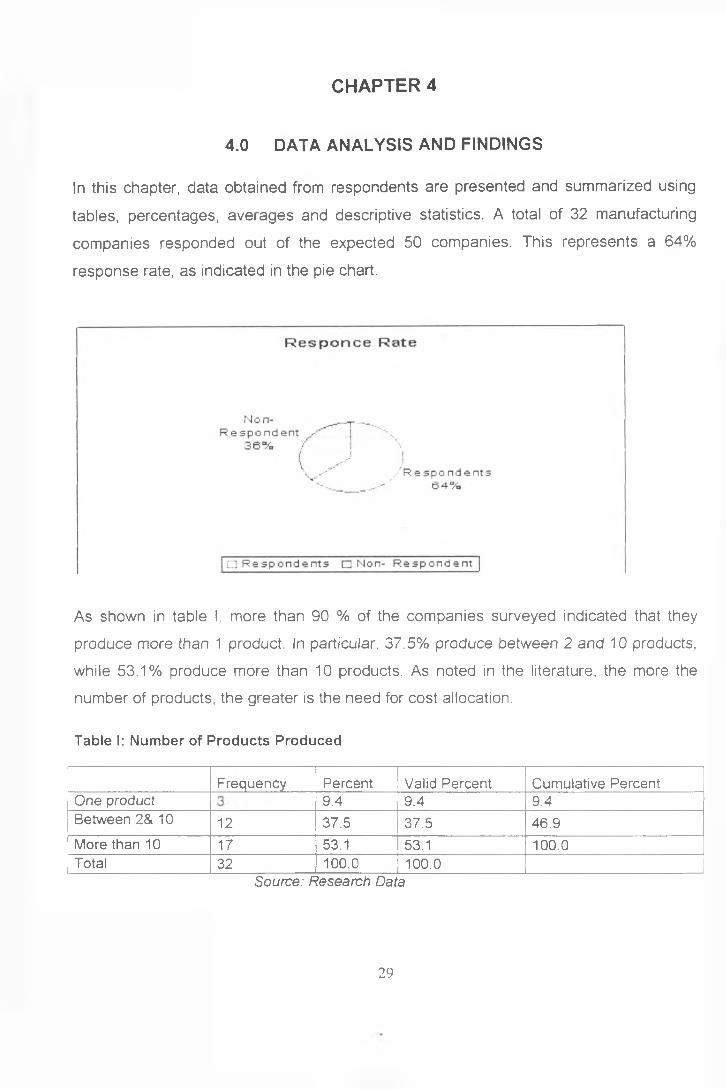
In this chapter, data obtained from respondents are presented and summarized using
tables, percentages, averages and descriptive statistics. A total of 32 manufacturing
companies responded out of the expected 50 companies. This represents a 64%
response rate, as indicated in the pie chart.
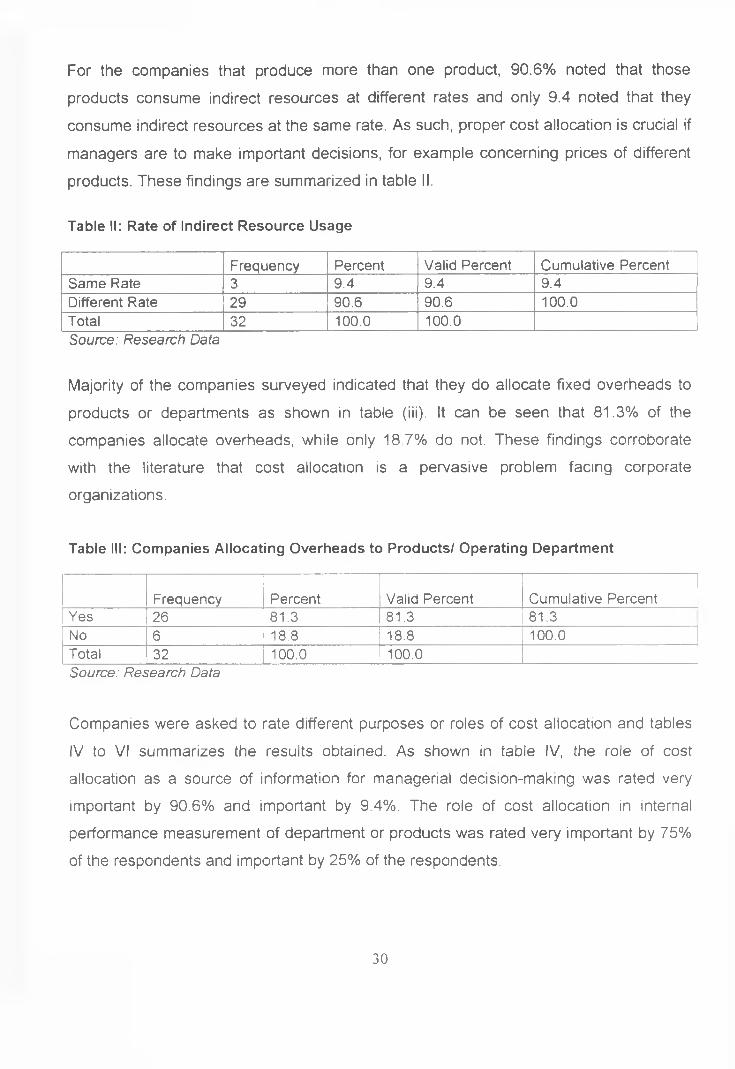
As shown in table I, more than 90 % of the companies surveyed indicated that they
produce more than 1 product. In particular, 37.5% produce between 2 and 10 products,
while 53.1% produce more than 10 products. As noted in the literature, the more the
number of products, the greater is the need for cost allocation.
Table I: Number of Products Produced
Frequency Percent Valid Percent Cumulative PercentOne product 9.4 9.4 9.4Between 2& 10 12 37.5 37.5 46.9More than 10 17 53.1 53.1 100.0Total 32 100.0 100.0
Source: Research Data
29
For the companies that produce more than one product, 90.6% noted that those
products consume indirect resources at different rates and only 9.4 noted that they
consume indirect resources at the same rate. As such, proper cost allocation is crucial if
managers are to make important decisions, for example concerning prices of different
products. These findings are summarized in table II.
Table II: Rate of Indirect Resource Usage
Frequency Percent Valid Percent Cumulative PercentSame Rate 3 9.4 9.4 9.4Different Rate 29 90.6 90.6 100.0Total 32 100.0 100.0Source: Research Data
Majority of the companies surveyed indicated that they do allocate fixed overheads to
products or departments as shown in table (iii). It can be seen that 81.3% of the
companies allocate overheads, while only 18 7% do not. These findings corroborate
with the literature that cost allocation is a pervasive problem facing corporate
organizations.
Table III: Companies Allocating Overheads to Products/ Operating Department
Frequency Percent Valid Percent Cumulative PercentYes 26 81.3 81.3 81.3No ""6 18.8 18.8 100.0Total 32 100.0 100.0Source: Research Data
Companies were asked to rate different purposes or roles of cost allocation and tables
IV to VI summarizes the results obtained. As shown in table IV, the role of cost
allocation as a source of information for managerial decision-making was rated very
important by 90.6% and important by 9.4%. The role of cost allocation in internal
performance measurement of department or products was rated very important by 75%
of the respondents and important by 25% of the respondents.
30
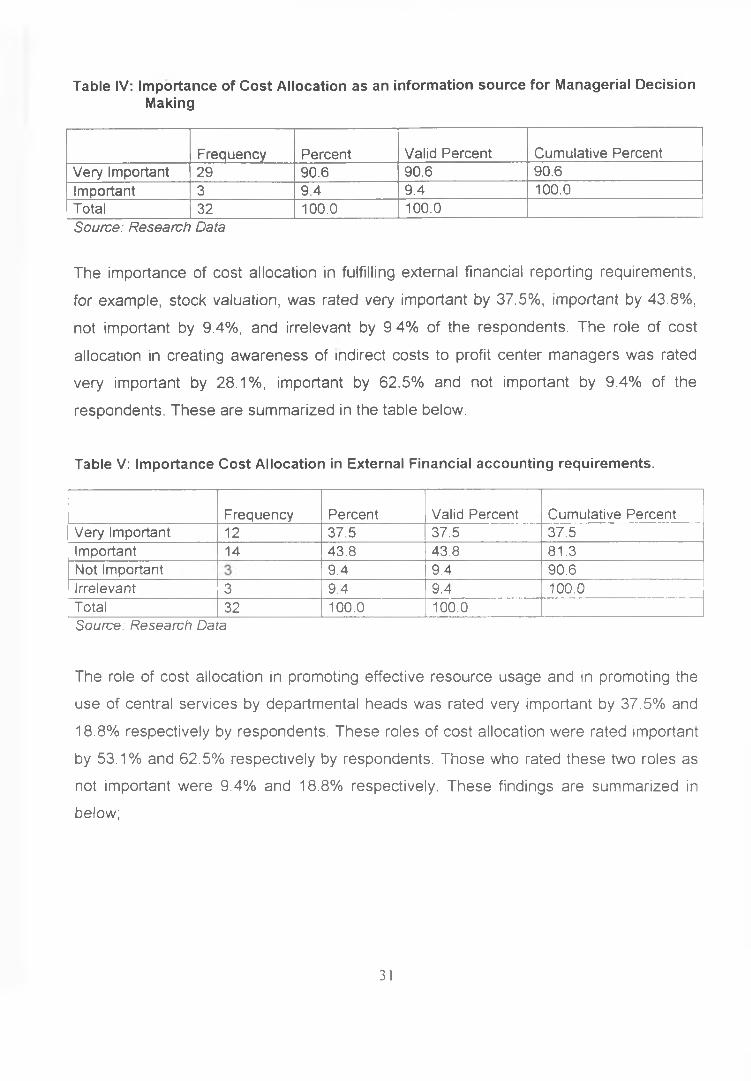
Table IV: Importance of Cost Allocation as an information source for Managerial Decision Making
Frequency Percent Valid Percent Cumulative PercentVery Important 29 90.6 90.6 90.6Important 3 9.4 9.4 100.0Total 32 100.0 100.0Source: Research Data
The importance of cost allocation in fulfilling external financial reporting requirements,
for example, stock valuation, was rated very important by 37.5%, important by 43.8%,
not important by 9.4%, and irrelevant by 9.4% of the respondents. The role of cost
allocation in creating awareness of indirect costs to profit center managers was rated
very important by 28.1%, important by 62.5% and not important by 9.4% of the
respondents. These are summarized in the table below.
Table V: Importance Cost Allocation in External Financial accounting requirements.
Frequency Percent Valid Percent Cumulative PercentVery Important 12 37.5 37.5 37.5Important 14 43.8 43.8 81.3Not Important 9.4 9.4 90.6Irrelevant l~3 9.4 9.4 100.0Total 32 100.0 100.0Source: Research Data
The role of cost allocation in promoting effective resource usage and in promoting the
use of central services by departmental heads was rated very important by 37.5% and
18.8% respectively by respondents. These roles of cost allocation were rated important
by 53.1% and 62.5% respectively by respondents. Those who rated these two roles as
not important were 9.4% and 18.8% respectively. These findings are summarized in
below;
31
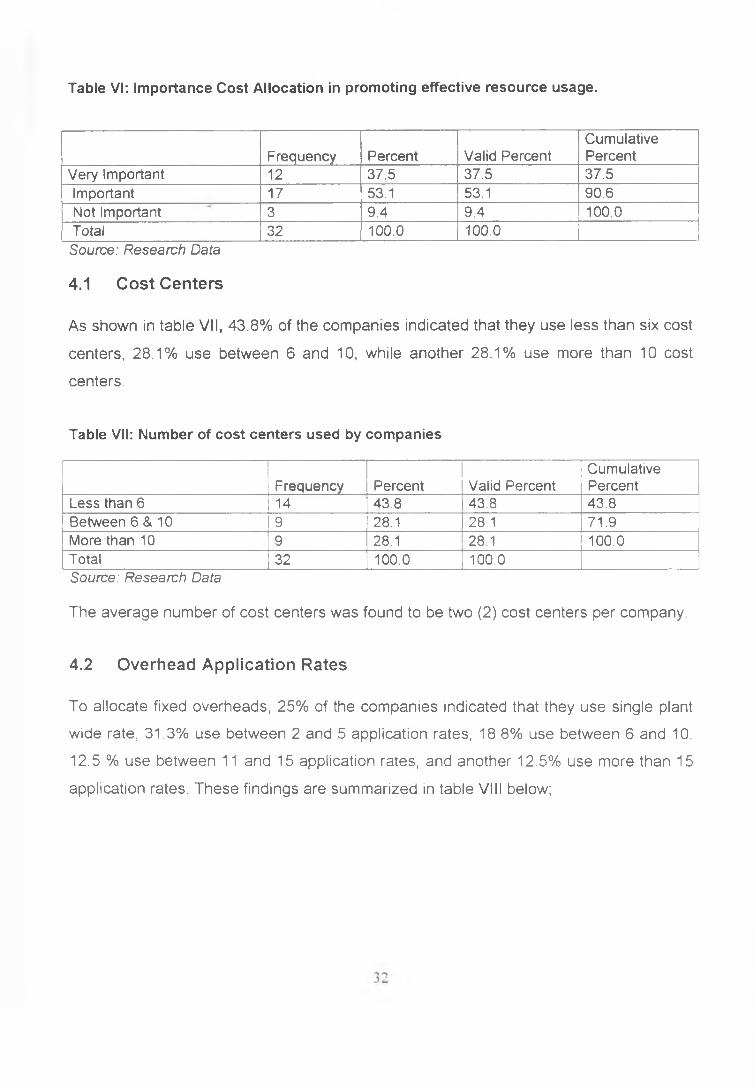
Table VI: Importance Cost Allocation in promoting effective resource usage.
Frequency Percent Valid PercentCumulativePercent
Very Important 12 37.5 37.5 37.5Important 17 53.1 53.1 90.6Not Important 3 9.4 9.4 100.0Total 32 100.0 100.0Source: Research Data
4.1 Cost Centers
As shown in table VII, 43.8% of the companies indicated that they use less than six cost
centers, 28.1% use between 6 and 10, while another 28.1% use more than 10 cost
centers.
Table VII: Number of cost centers used by companies
Frequency Percent Valid PercentCumulativePercent
Less than 6 14 43.8 43.8 43.8Between 6 & 10 9 28.1 28.1 71.9More than 10 9 28.1 28.1 100.0Total 32 100.0 100.0Source: Research Data
The average number of cost centers was found to be two (2) cost centers per company.
4.2 Overhead Application Rates
To allocate fixed overheads, 25% of the companies indicated that they use single plant
wide rate, 31.3% use between 2 and 5 application rates, 18.8% use between 6 and 10,
12.5 % use between 11 and 15 application rates, and another 12.5% use more than 15
application rates. These findings are summarized in table VIII below;
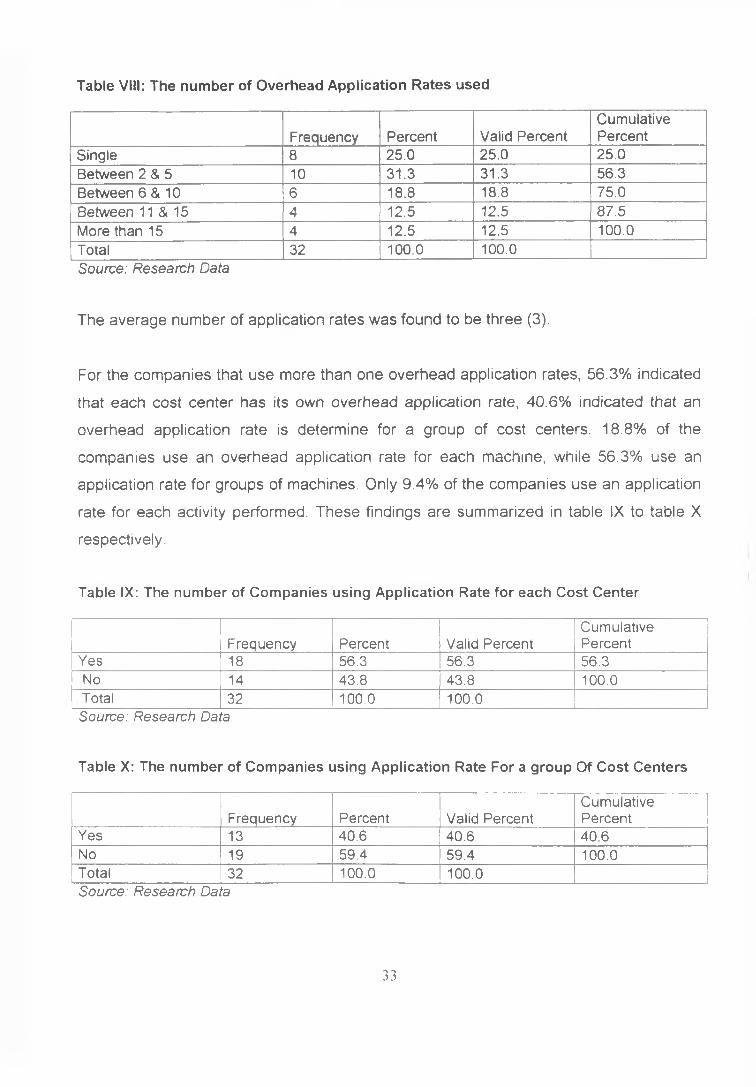
Table VIII: The number of Overhead Application Rates used
Frequency Percent Valid PercentCumulativePercent
Single 8 25.0 25.0 25.0Between 2 & 5 10 31.3 31.3 56.3Between 6 & 10 6 18.8 18.8 75.0Between 11 & 15 4 12.5 12.5 87.5More than 15 4 12.5 12.5 100.0Total 32 100.0 100.0Source: Research Data
The average number of application rates was found to be three (3).
For the companies that use more than one overhead application rates, 56.3% indicated
that each cost center has its own overhead application rate, 40.6% indicated that an
overhead application rate is determine for a group of cost centers. 18.8% of the
companies use an overhead application rate for each machine, while 56.3% use an
application rate for groups of machines. Only 9.4% of the companies use an application
rate for each activity performed. These findings are summarized in table IX to table X
respectively.
Table IX: The number of Companies using Application Rate for each Cost Center
Frequency Percent Valid PercentCumulativePercent
Yes 18 56.3 56.3 56.3No 14 43.8 43.8 100.0Total 32 100.0 100.0Source: Research Data
Table X: The number of Companies using Application Rate For a group Of Cost Centers
Frequency Percent Valid PercentCumulativePercent
Yes 13 40.6 40.6 40.6No 19 59.4 59.4 100.0Total 32 100.0 100.0Source: Research Data
33
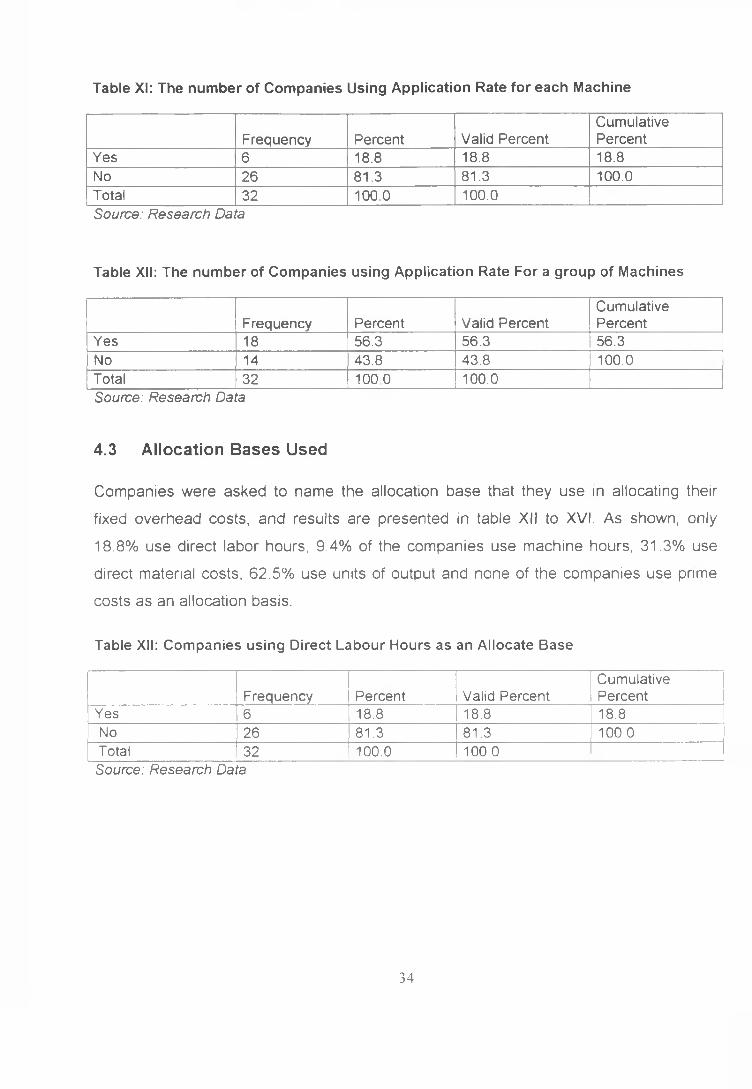
Table XI: The number of Companies Using Application Rate for each Machine
Frequency Percent Valid PercentCumulativePercent
Yes 6 18.8 18.8 18.8No 26 81.3 81.3 100.0Total 32 100.0 100.0Source: Research Data
Table XII: The number of Companies using Application Rate For a group of Machines
Frequency Percent Valid PercentCumulativePercent
Yes 18 56.3 56.3 56.3No 14 43.8 43.8 100.0Total 32 100 0 100.0Source: Research Data
4.3 Allocation Bases Used
Companies were asked to name the allocation base that they use in allocating their
fixed overhead costs, and results are presented in table XII to XVI. As shown, only
18.8% use direct labor hours, 9.4% of the companies use machine hours, 31.3% use
direct material costs, 62.5% use units of output and none of the companies use prime
costs as an allocation basis.
Table XII: Companies using Direct Labour Hours as an Allocate Base
Frequency Percent Valid PercentCumulativePercent
Yes 6 18.8 18.8 18.8No 26 81.3 81.3 100.0Total 32 100.0 100.0Source: Research Data
34
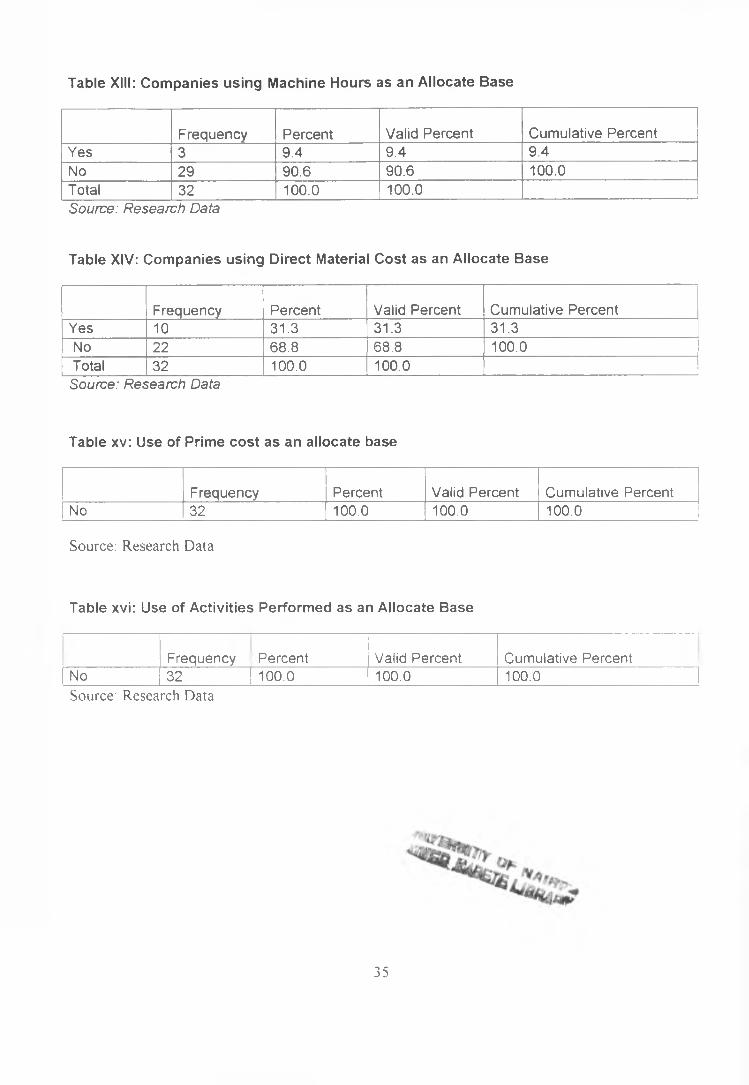
Table XIII: Companies using Machine Hours as an Allocate Base
Frequency Percent Valid Percent Cumulative PercentYes 3 9.4 9.4 9.4No 29 90.6 90.6 100.0Total 32 100.0 100.0Source: Research Data
Table XIV: Companies using Direct Material Cost as an Allocate Base
Frequency Percent Valid Percent Cumulative PercentYes 10 31.3 31.3 31.3No 22 68.8 68.8 100.0Total 32 100.0 100.0Source: Research Data
Table xv: Use of Prime cost as an allocate base
Frequency Percent Valid Percent Cumulative PercentNo 32 100.0 100.0 100.0
Source: Research Data
Table xvi: Use of Activities Performed as an Allocate Base
Frequency Percent Valid Percent Cumulative PercentNo 32 100.0 100.0 100.0Source: Research Data
35
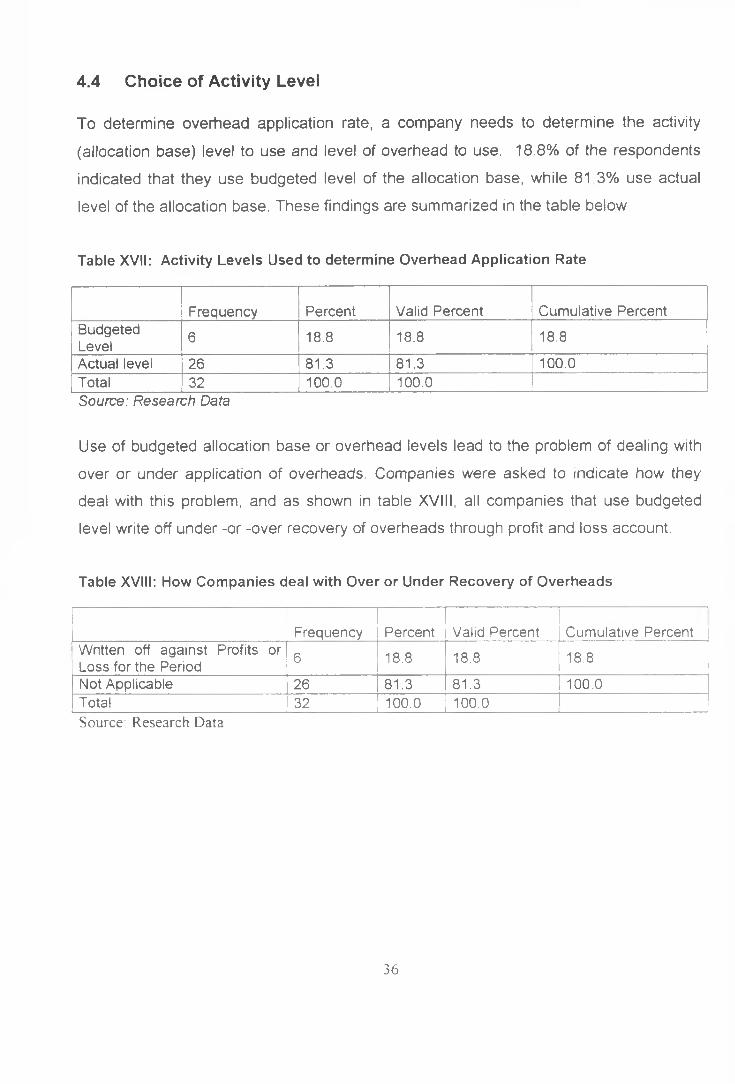
4.4 Choice of Activity Level
To determine overhead application rate, a company needs to determine the activity
(allocation base) level to use and level of overhead to use. 18.8% of the respondents
indicated that they use budgeted level of the allocation base, while 81 3% use actual
level of the allocation base. These findings are summarized in the table below
Table XVII: Activity Levels Used to determine Overhead Application Rate
Frequency Percent Valid Percent Cumulative PercentBudgetedLevel 6 18.8 18.8 18.8
Actual level 26 81.3 81.3 100.0Total 32 100.0 100.0Source: Research Data
Use of budgeted allocation base or overhead levels lead to the problem of dealing with
over or under application of overheads. Companies were asked to indicate how they
deal with this problem, and as shown in table XVIII, all companies that use budgeted
level write off under -or -over recovery of overheads through profit and loss account.
Table XVIII: How Companies deal with Over or Under Recovery of Overheads
Frequency Percent Valid Percent Cumulative PercentWritten off against Profits or Loss for the Period 6 18.8 18.8 18.8
Not Applicable 26 81.3 81.3 100.0Total 32 100.0 100.0 _|Source: Research Data
36
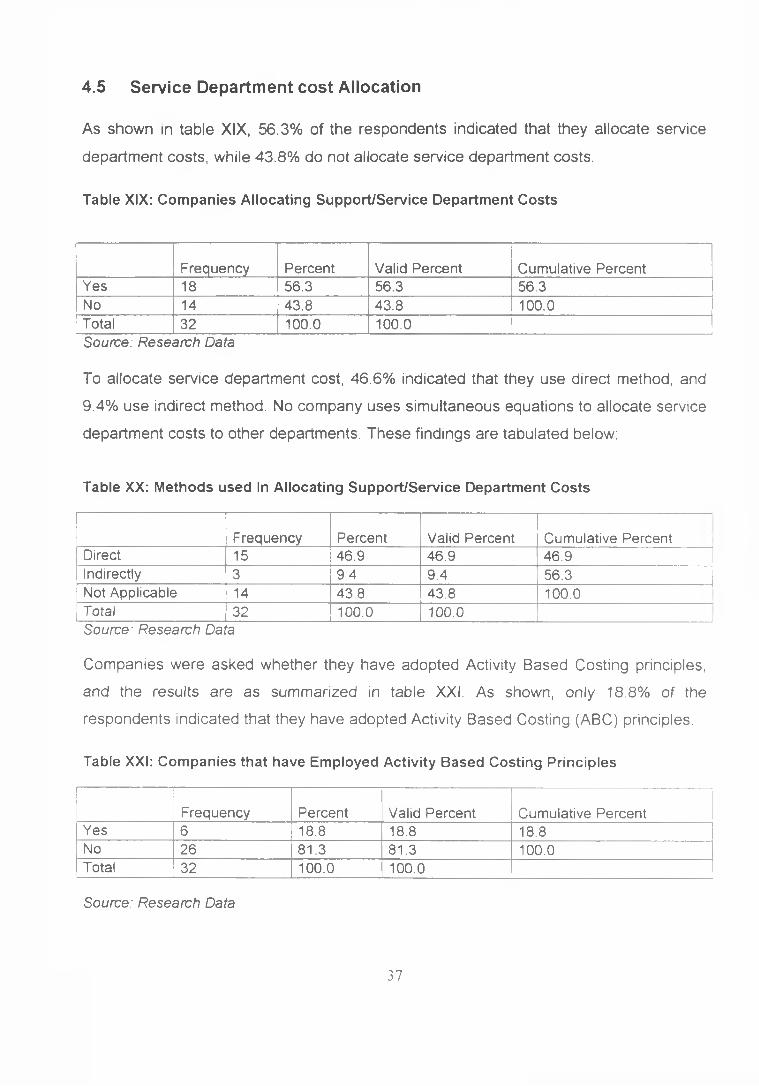
As shown in table XIX, 56.3% of the respondents indicated that they allocate service
department costs, while 43.8% do not allocate service department costs.
4.5 Service Department cost Allocation
Table XIX: Companies Allocating Support/Service Department Costs
Frequency Percent Valid Percent Cumulative PercentYes 18 56.3 56.3 56.3No 14 43.8 43.8 100.0Total 32 100.0 100.0Source: Research Data
To allocate service department cost, 46.6% indicated that they use direct method, and
9.4% use indirect method. No company uses simultaneous equations to allocate service
department costs to other departments. These findings are tabulated below:
Table XX: Methods used In Allocating Support/Service Department Costs
Frequency Percent Valid Percent Cumulative PercentDirect 15 46.9 46.9 46.9Indirectly 3 9.4 9.4 56.3Not Applicable 14 43.8 43.8 100.0Total 32 100.0 100.0 ___________________ ISource: Research Data
Companies were asked whether they have adopted Activity Based Costing principles,
and the results are as summarized in table XXI. As shown, only 18.8% of the
respondents indicated that they have adopted Activity Based Costing (ABC) principles.
Table XXI: Companies that have Employed Activity Based Costing Principles
Frequency Percent Valid Percent Cumulative PercentYes 6 18.8 18.8 18.8No 26 81.3 81.3 100.0Total 32 100.0 100.0
Source: Research Data
37
CHAPTER 55.0 CONCLUSIONS AND SUGGESTIONS FOR FURTHER RESEARCH
5.1 CONCLUSIONS
The findings of this survey indicate that allocation is a wide spread practice among
Kenyan manufacturing companies. However, these findings indicate that majority of
these companies still use traditional volume-based cost allocation approaches. Activity
Based Costing (ABC) is not yet common amongst Kenyan manufacturers.
The most important reason for cost allocation by manufacturing companies in Kenya is
to provide information for managerial decision-making, such as pricing decisions. Other
reasons for cost allocation ranked in order of importance; are to fulfill external financial
accounting requirements, such as stock valuation for balance sheet purposes, to
promote effective resource usage and to create awareness amongst departmental
managers on their existence.
The average number of cost centers used by manufacturing companies in Kenya is two
(2), while most companies use more than one overhead application rate in cost
allocation. Units of output are the most widely used allocation bases.. Other allocation
bases that are used to a lesser extent are direct labor hours, machine hours, and direct
material costs.
81.3% of manufacturing companies in Kenya use actual levels of activities in
determining an overhead application rate, thus the problem of dealing with under or
over recovery of overheads is not common in Kenya. However, the 18.7% of the
companies that use budgeted levels write off under or over recovery of overheads
through profit and loss account.Service department cost allocation is also widely
practiced by Kenyan manufacturing companies and the most commonly used method is
the direct method.
38
5.2 SUGGESTIONS FOR FURTHER RESEARCH
Findings from this study indicate that 62.5% of the respondents use number of units as
an allocation base, 18.8% use direct labor hours, and 9.4% use machine hours as an
allocation base. All these allocation bases are categorized in the literature as traditional
volume -based and thus, it is concluded that majority of Kenyan manufacturing
companies still use traditional volume- based cost allocation approaches. This is despite
the fact that modern cost allocation approaches such as Activity Based Costing (ABC)
has been in existence since 1980s. There is therefore need to study the reasons behind
the low adoption of ABC in Kenya.
Also there is need to undertake a study on how ABC principles can be adopted to small
scale manufacturing companies in Kenya.
It is further suggested that a study be done to check whether Kenyan manufacturing
companies have experienced any problems resulting from their allocation approaches.
For example, sub optimal decision could have resulted from their cost allocation
method.
5.3 Lim itations Of The Study
This study did not consider the size of the target population yet literature suggests that
the size and the sector of various companies affect the choice of cost allocation
approaches. For example, Drury (2000), notes that different variables relating to cost
structure, competition, existing cost systems, size and product diversity were tested as
explanatory factors for the adoption of ABC but only cost structure and size were found
to be statistically significant. Drury and Tayles (2000), indicated that company size and
business sector had a significant impact on ABC adoption rates. For example, their
study indicated that the adoption rates were 45% for the largest organizations and 51%
for financial and service organizations. Therefore, the extent to which the results of this
study can be generalized is limited, since cost structure and size characteristics of the
sampled companies were not considered.
39
Another problem is that the concept of Activity Based Costing approach, as a cost
allocation approach has not been understood in Kenya. Thus, there was inconsistency
between the proportions of companies that have Adopted Activity Based Costing (ABC)
principles and the proportion of companies using number of activities as an allocation
base. Table xvi indicate that no company is using number of activities as an allocation
base, yet table XXI indicate that 18.8% have adopted Activity Based Costing Principles.
This should be the same, since essentially, companies that have adopted ABC use
number of activities as their allocation base. This inconsistency indicates low
understanding of ABC, which in turn affects the reliability of the responses received and
thus the results of the study.
40
REFERENCES
Armitage, H.M. and Nicholson, R. (1993), “Activity Based Costing: A Survey Of Canadian Practice,” Issue Paper No. 3, Society Of Management Accountants Of Canada.
Ask, U. And Ax, C. (1992):”Trends in the Development Of Product Costing Practice And Technique - A Survey Of Swedish Manufacturing Industry’’ Paper Presented At The 15th Annual Congress Of The European Accounting Association, Madrid.
Ask, U., Ax, C and Johnson, S (1996),” Cost Management In Sweden: From Modern to Post-Modern,” in Bhimani, A (Ed) Management Accounting: European Perspectives, Oxford, Oxford University Press 199-217.
Atkinson, A (1987), “Intrafirm Cost and Resource Allocations: Theory And Practice,”
(Hamilton, Canada. Society Of Management Accountants Of Canada and Canadian
Academic Accounting Association Research Monograph)
Balias, A. And Vemieris, G. (1996), “A Survey Of Management Accounting Practices In
Greek Firms,” In Bhimani, A (Ed.) Management Accounting: European Perspectives,
Oxford, Oxford University Press.
Banerjee J. and Kane, W. (1996), “Management Accounting,” Report on CIMA/JS
October. 30, 37
Bjornenak T. (1991a),” Diffusion and Accounting: The case of ABC in Norway,”
Management Accounting Research, 8(1) 317.
Bjornenak T. (1997b) “Conventional Wisdom And Accounting Practice,” Management
Accounting Research, 8 (4), 367 -82.
Blayney, P. And Yokoyama, I (1991) “Comparative Analysis Of Japanese And
Australian Cost Accounting And Management Practices”, Working Papers, University Of
Sydney, Australia.
41
Bloncher, E, J., Chen, K., H. and Lin, T. W. (1999), “Cost Management: A Strategic
Emphasis,’’ Irwin/McGraw-Hill.
Bruggeman, W. Slagmulder, R. and Waeytens. D. (1996), “Management Accounting
Changes: The Belgian Experience,” In Bhimani, A. (Ed) Management Accounting
European Perspectives, Oxford, Oxford University Press.
Church A H. (1908) “The Proper Distribution of Expense Burden” The Engineering
Magazine, New York, in Kaplan R.S. and Atkinson A. (1998), Advanced Management
Accounting.” Boston.
Clarke P.J. (1992), “Management Accounting Practices And Technigues In Irish
Manufacturing Firms.” The 15th Annual Congress Of The European Accounting
Association, Madrid, Spain.
Clarke, P (1995), “Management Accounting Practices And Technigues In Irish
Manufacturing Companies.1’ Working Paper, Trinity College, Dublin
Dean, G. Joye, M and Blayney, P, “Strategic Management Accounting Survey”, Sydney.
Australia; the University Of Sydney (1991)
Drury, C (2000), Management and Cost Accounting, Thompson Learning, London. 5th
Edition.
Drury, C (2004), Management and Cost Accounting, Thompson Learning, London. 6th
Edition.
Drury, C and Tayles, M (1994), “Product Costing In UK Manufacturing Organization.’’
The European Accounting Review, 3 (3), 443 - 69
42
Drury, C and Tayles, M (2000), Cost System Design and Profitability Analysis in UK
Companies. Chartered Institute Of Management Accountants, London.
Emore, J.R. And Ness, J.A. (1991), “The Slow Pace of Meaningful Changes in Cost
Systems,” Journal of Cost Management, For Manufacturing Industry, Winter36-45
Evans, H. And Ashworth, G. (1996). “Survey Conclusions: Wake Up to the
Competition,' Management Accounting (UK) May 16-18
Freemgen, J. and Liao S. (1981) “The Allocation of Corporate Indirect Costs,” New
York, National Association of Accountants
Friedman, A.L and Lyne, S.R. (1995),"Activity Based Techniques: The Real Life
Consequences, ’ Chartered Institute Of Management Accountants.
Gantt H. L. (1994), “The Relationship between Production and Costs”, Journal of Cost
Management
Garrison, R.H. (1991),"Managerial Accounting: Concepts for Planning, Control, Decision
Making, ’ Irwin, Homewood, IL
Granlund. M. and Lukka, K (1998), “It Is A Small World of Management Accounting
Practices.” Journal of Management Accounting Research, 10, 151-79
Green, F. B. And Amenkhienan, F. E (1992),"Accounting Innovations: A Cross
Sectional Survey Of Manufacturing," Journal Of Cost Management For The
Manufacturing Industry, Spring.
Hilton, R.W. (1997), “Managerial Accounting,” 3rd ed, McGraw-Hill. New York.
Hirsch, M L (1988), “Advanced Management Accounting," Illinois.
43
Innes, J. And Mitchell, F. (1991), “ABC: A Survey Of CIMA Members.” Management
Accounting October 28 -30.
Innes, J. And Mitchell, F. (1995a), “A Survey of Activity Based Costing In The UK’s
Largest Companies,’’ Management Accounting Research, June 137-54.
Israelsen, P.. Anderson. M., Rohde. C. And Sorensen. P.E. (1996), "Management
Accounting In Denmark, Theory And Practice,’’ In Bhimani, A (Ed). Management
Accounting European Perspective, 3, Oxford, Oxford University Press,
Jae, K. S. And Joel. G.S. (2000), “Modern Cost Management And Analysis. 2nd ed.
Baron's Educational Series, Inc., New York
Joshi, P. (1998),”An Exploratory Study Of Activity Based Costing Practices And Benefits
In Large Size Companies In India, ’ Accounting And Business Review, 5(1), 65-93
Joye, M.P and Blayney P.J (1991) Strategic Management Accounting Survey,
Monograph No. 8, University Of Sydney
Joye, M.P and Blayney, P.J (1990),’’Cost And Management Accounting Practices in
Australia Manufacturing Companies. Survey Results, Monograph No. 7 University Of
Sydney.
Kaplan R.S and Johnson H. J, (1987), “Relevance Lost: The Rise and Fall of
Management Accounting’, Boston, Havard Business School Press.
Kaplan R.S. and Atkinson A. (1998), “Advanced Management Accounting,” Prentice-
Hall
44
Lukka, K and Granlund M. (1996), “Cost Accounting in Finland: Current Practice and
Trends of Development.” The European Accounting Review 5 (1), 1-28.
Lukka, K And Granlund, M (2002),” The Fragmented Communication Structure Within
the Accounting Academia: The Case Of Activity Based Costing Genres”. Accounting,
Organization And Society, 27, 165-90.
National Association of Accountants (1988),"Management Accounting In The Advanced
Manufacturing Environment. Comparative Study On Survey In Japan And USA," Tokyo
Nicholls, B (1992), “ABC in the UK - A Status Report." Management Accounting, May.
OMB A-21” The Cost allocation Model," Office of Management and Budget, USA.
Ramadan, S. (1989) “The Rationale for Cost Allocation: a Study of UK Divisionalised
Companies ’. Accounting & Business Research, winter, 31-7
Reed, C.S, (1927), "Veal, Hide and By-Products." Electrical World
Saez-Torrecilla, A., Femadez-Fernadez, A., Texeira-Quiros, J. and Vaquera-Mosguero.
M. (1996), Management Accounting in Spain: trends in thougnt and practice, in
Bhimani, A (ed.) Management Accounting European Perspective, 3, Oxford, Oxford
University Press.
Scherrer, G. (1996), “Management Accounting a German perspective.” in Bhimani, A
(ed.) Management Accounting European Perspective, 3, Oxford, Oxford University
Press.
Shim, E., and Stagliano, A. (1997), “A Survey of U S Manufacturers on Implementation
of ABC,’1 Journal of Cost Management, March/April
45

Slater, K. And Wootton, C. (1984), “Joint And By -Product Costing In The UK.” Institute
Of Cost and Management Accounting
Snyder, H. and Elizabeth, D. (1997), “What does it really cost? Allocating indirect costs,”
Asian Libraries, Vol. 6, No. 3/4 pp. 205-214
Tomsett, S.E (1992), “Allocation of Central Cost In International Group.” World Tax,
Deloitte and Touch International
46
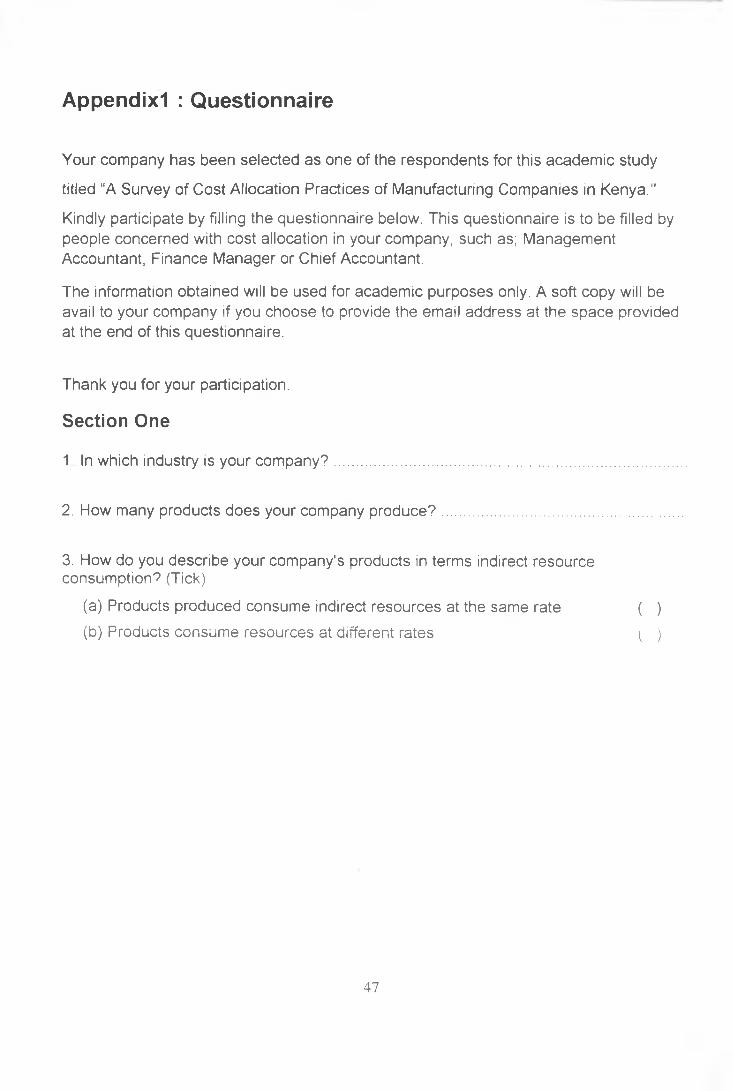
Appendixl : Questionnaire
Your company has been selected as one of the respondents for this academic study
titled “A Survey of Cost Allocation Practices of Manufacturing Companies in Kenya."
Kindly participate by filling the questionnaire below. This questionnaire is to be filled by people concerned with cost allocation in your company, such as; Management Accountant, Finance Manager or Chief Accountant.
The information obtained will be used for academic purposes only. A soft copy will be avail to your company if you choose to provide the email address at the space provided at the end of this questionnaire.
Thank you for your participation.
Section One
1 In which industry is your company?..........................................................................
2. How many products does your company produce?.................................................
3. How do you describe your company's products in terms indirect resource consumption'? (Tick)
(a) Products produced consume indirect resources at the same rate ( )
(b) Products consume resources at different rates ( )
47
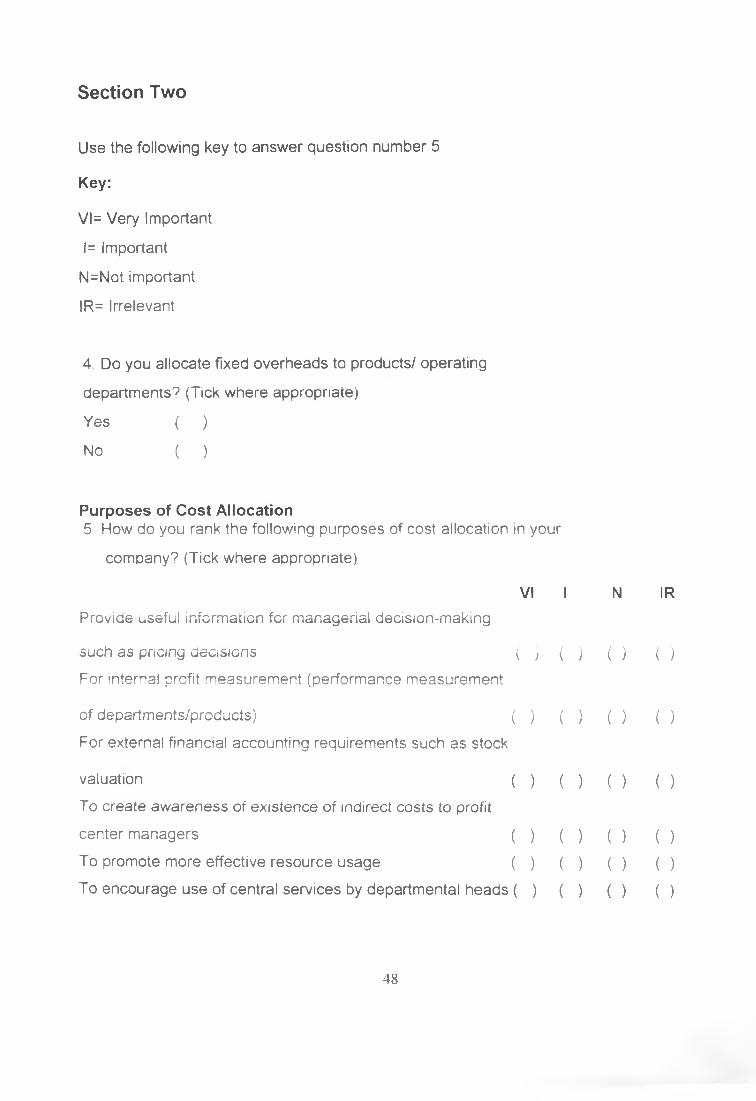
Section Two
Use the following key to answer question number 5
Key:
Vl= Very Important
1= Important
N=Not important
IR= Irrelevant
4 Do you allocate fixed overheads to products/ operating
departments? (Tick where appropriate)
Yes ( )
No ( )
N IR
( ) ( )
( ) ( )
( ) ( )
( ) ( )
( ) ( )( ) ( )
Purposes of Cost Allocation5 How do you rank the following purposes of cost allocation in your
company? (Tick where appropriate)
VI IProvide useful information for managerial decision-making
such as pricing decisions ( ) ( )
For internal profit measurement (performance measurement
of departments/products) ( ) ( )
For external financial accounting requirements such as stock
valuation ( ) ( )
To create awareness of existence of indirect costs to profit
center managers ( ) ( )
To promote more effective resource usage ( ) ( )
To encourage use of central services by departmental heads ( ) ( )
48
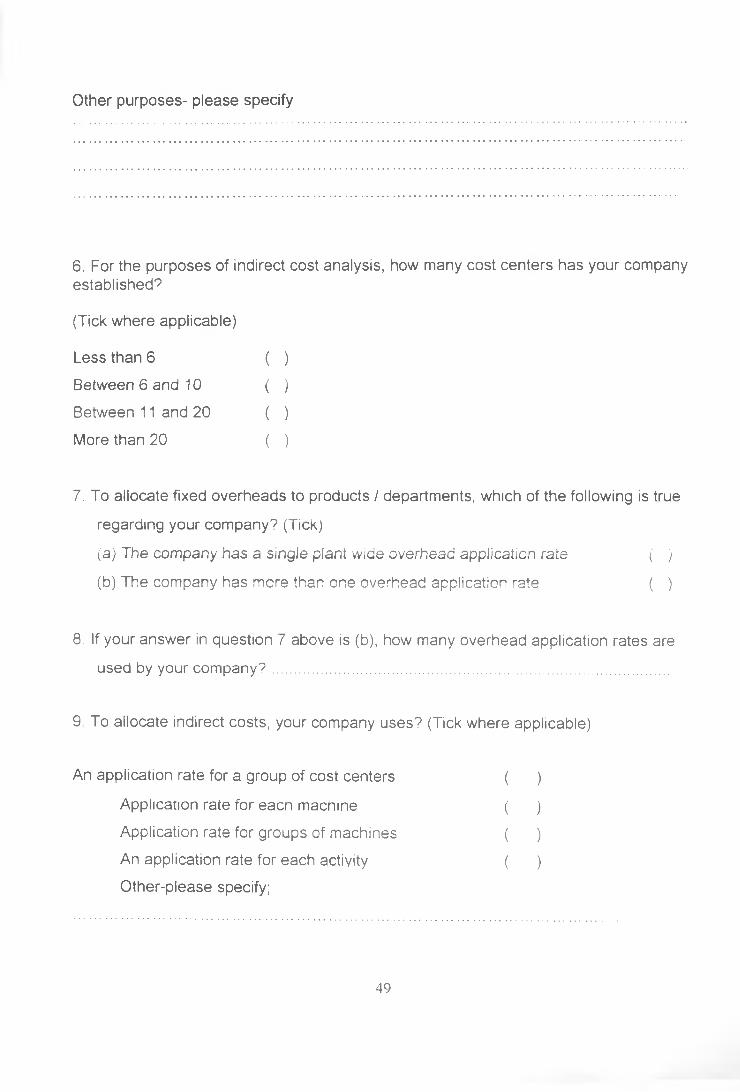
Other purposes- please specify
6. For the purposes of indirect cost analysis, how many cost centers has your company established7
(Tick where applicable)
Less than 6 ( )
Between 6 and 10 ( )
Between 11 and 20 ( )
More than 20 ( )
7. To allocate fixed overheads to products / departments, which of the following is true
regarding your company? (Tick)
(a) The company has a single plant wide overhead application rate ( )
(b) The company has more than one overhead application rate ( )
8. If your answer in question 7 above is (b), how many overhead application rates are
used by your company?..........................................................................................
9 To allocate indirect costs, your company uses? (Tick where applicable)
An application rate for a group of cost centers ( )
Application rate for each machine ( )
Application rate for groups of machines ( )
An application rate for each activity ( )
Other-please specify;
49
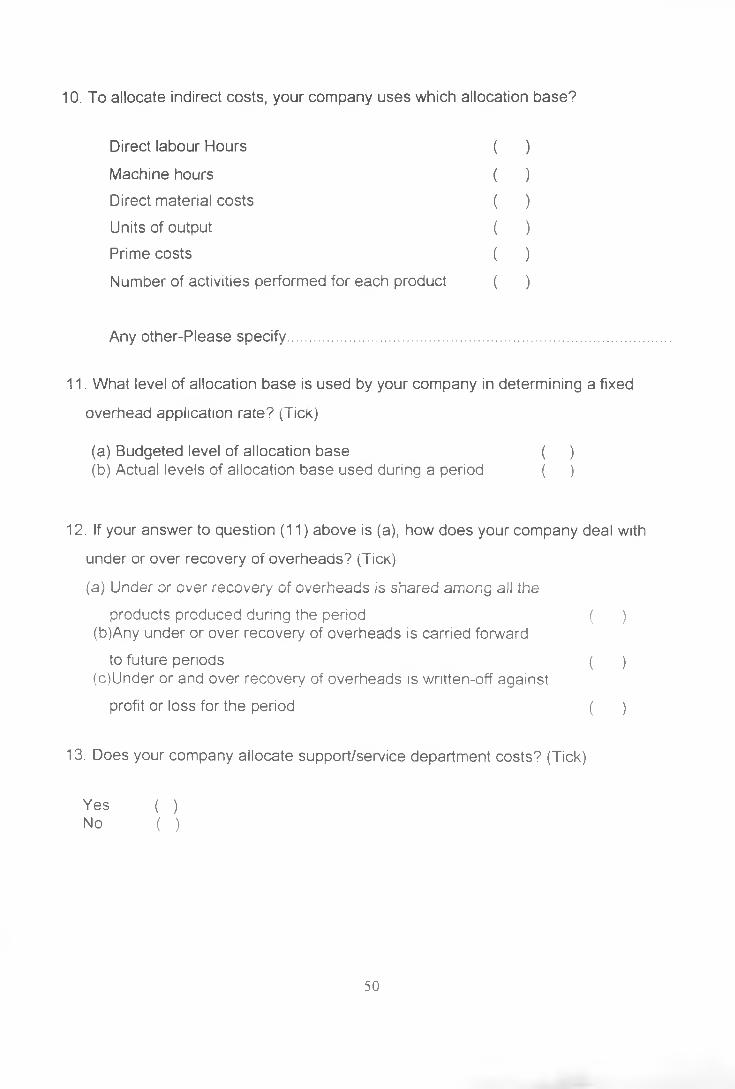
10. To allocate indirect costs, your company uses which allocation base?
Direct labour Hours ( )
Machine hours ( )
Direct material costs ( )
Units of output ( )
Prime costs ( )
Number of activities performed for each product ( )
Any other-Please specify.................................................................................
11. What level of allocation base is used by your company in determining a fixed
overhead application rate? (Tick)
(a) Budgeted level of allocation base ( )(b) Actual levels of allocation base used during a period ( )
12. If your answer to question (11) above is (a), how does your company deal with
under or over recovery of overheads? (Tick)
(a) Under or over recovery of overheads is shared among all the
products produced during the period ( )(b) Any under or over recovery of overheads is carried forward
to future periods ( )(c) Under or and over recovery of overheads is written-off against
profit or loss for the period ( )
13. Does your company allocate support/service department costs? (Tick)
Yes ( )No ( )
50
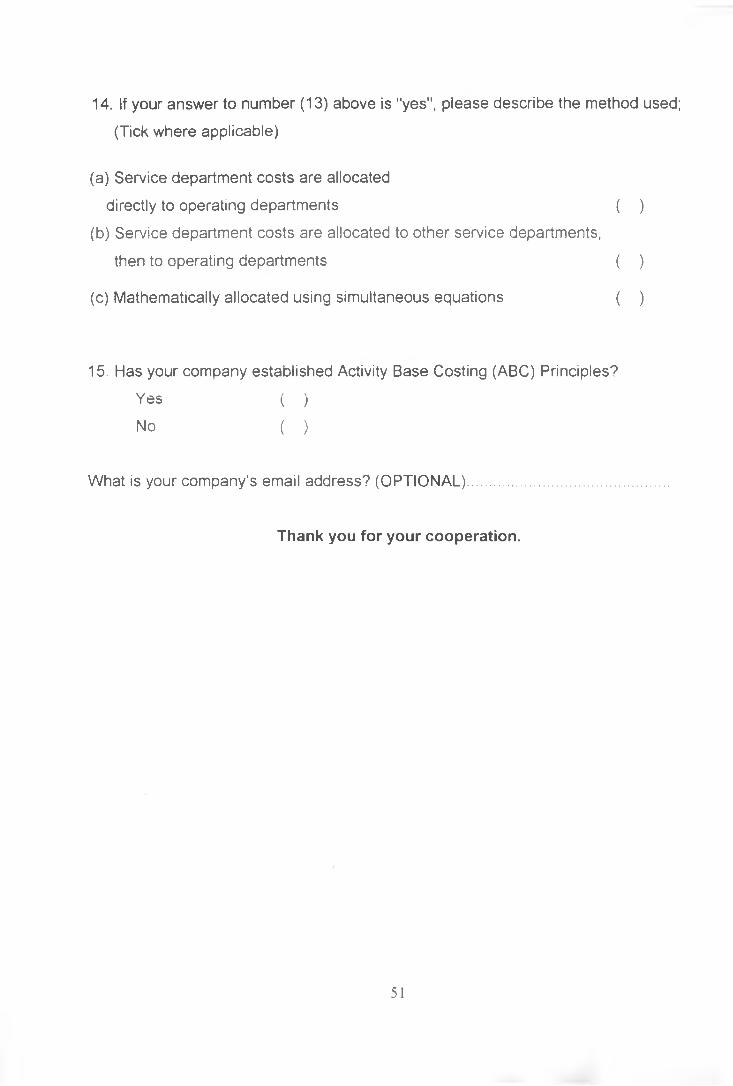
14. If your answer to number (13) above is "yes", please describe the method used;
(Tick where applicable)
(a) Service department costs are allocated
directly to operating departments ( )
(b) Service department costs are allocated to other service departments,
then to operating departments ( )
(c) Mathematically allocated using simultaneous equations ( )
15. Has your company established Activity Base Costing (ABC) Principles?
Yes ( )
No ( )
What is your company’s email address? (OPTIONAL).............................................
Thank you for your cooperation.
51
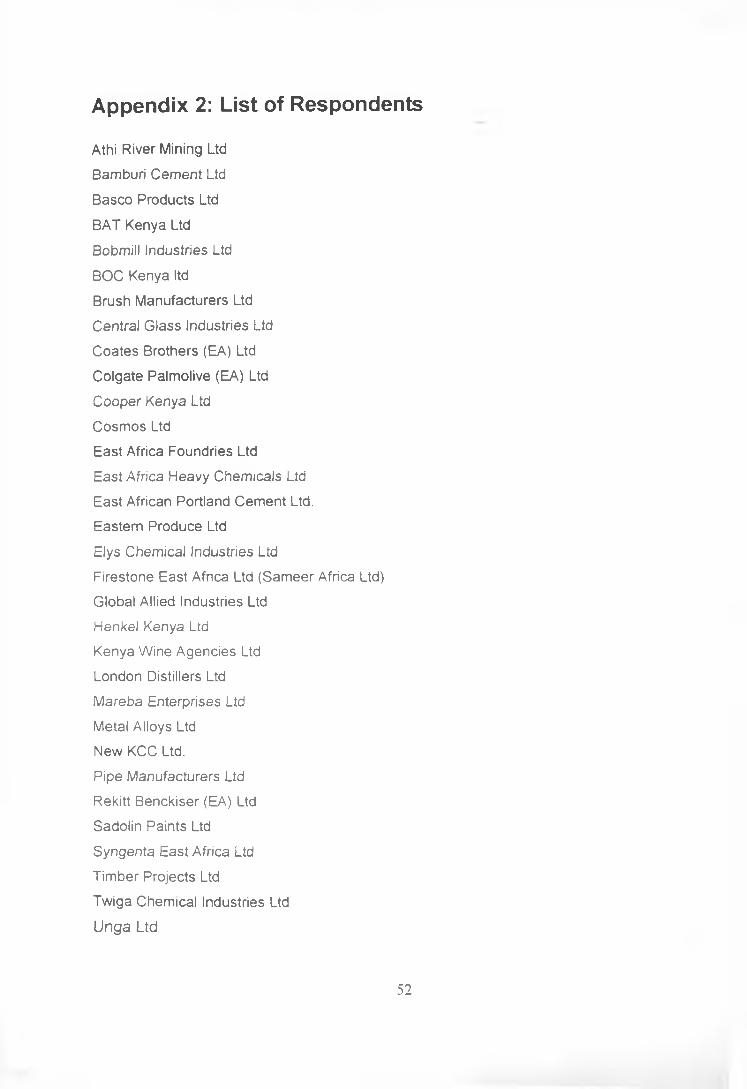
Appendix 2: List of Respondents
Athi River Mining Ltd
Bamburi Cement Ltd
Basco Products Ltd
BAT Kenya Ltd
Bobmiil Industries Ltd
BOC Kenya ltd Brush Manufacturers Ltd
Central Glass Industries Ltd
Coates Brothers (EA) Ltd Colgate Palmolive (EA) Ltd
Cooper Kenya Ltd
Cosmos LtdEast Africa Foundries Ltd
East Africa Heavy Chemicals Ltd East African Portland Cement Ltd.
Eastern Produce Ltd
Elys Chemical Industries LtdFirestone East Africa Ltd (Sameer Africa Ltd)
Global Allied Industries LtdHenkel Kenya Ltd
Kenya Wine Agencies LtdLondon Distillers Ltd
Mareba Enterprises LtdMetal Alloys LtdNew KCC Ltd.
Pipe Manufacturers Ltd Rekitt Benckiser (EA) Ltd
Sadolin Paints Ltd
Syngenta East Africa Ltd Timber Projects Ltd
Twiga Chemical Industries Ltd
Unga Ltd
52