Embed Size (px)
Citation preview

A Survey of HPC Usage in Europe and the PRACE Benchmark Suite
Dr Mark BullDr Jon HillDr Alan Simpson
EPCC, University of EdinburghEmail: [email protected], [email protected], [email protected]

Overview
• Background
• Survey design
• Survey results▫ HPC Systems▫ HPC Applications
• Selecting a benchmark suite

Background
• The PRACE project is working towards the installation of Petaflop/s scale systems in Europe in 2010/2011.
• Requirement for a set of benchmark applications to assess performance of systems during procurement process
• Benchmark applications should be representative of HPC usage by PRACE partners
• To understand current applications usage, we conducted a survey of PRACE partners’ current HPC systems

• We took the opportunity to gather other interesting data as well
• We also devised a method for selecting (and weighting) a set of applications which can be considered representative of the current usage ▫ we wanted to do this in a quantifiable way▫ we wanted to avoid political considerations▫ …but it was not entirely successful!

Survey Design

Survey Design
• We asked the PRACE centres to complete: ▫ a systems survey for their largest system, and any
other system over 10Tflop/s Linpack▫ an application survey for all applications which
consumed more than 5% of the utilised cycles on each system
• We collected data for 24 systems and 69 applications
Systems surveyed
169522675415926176 Totals
33011821577TNCe325/v40z/x4600 clusterIBM, SunPSNCTNC52016002200TNCx4100 clusterSUNUC-LCAMilipeia2562400-TNCHS21 clusterHPCINECAXC538437003000FNCp690/p575 clusterIBMGENCIHERA
102439006550FNCp690/p690+/p655 clusterIBMGENCIZAHIR131255688921FNCp690 clusterIBMFZJJump2176820010649TNCCP400 BL ProLiant SuperClusterHPCSCmurska.csc.fi2024888310525MPPXT4CrayCSCLouhi57689239216VECSX8NECUSTUTT-HLRShww SX-8
40961111013926MPPBlue Gene/PIBMEPSRCLegion19201149014592FNCp575 clusterIBMNCFHuygens25601294015360FNCp575 clusterIBMEPSRCHPCx33281422017306MPPXT3CrayETHZPalu56321500059900TNCBL460cHPSIGMAStallo51201991053248TNCBladeCenter Cluster LS21IBMCINECABCX
163843733045875MPPBlue Gene/LIBMFZJJubl53763817050104TNCX7DBT-INFSupermicroPSNCGalera55524200051700MPPXT4CraySIGMAHexagon76804213049152TNC3045BullGENCIPlatine64404446059648TNCCluster 3000 DL140HPSNICNeolith
113285464863437MPPXT4CrayEPSRCHECToR97285652062259FNCAltix 4700SGIBADW-LRZHLRB II
102406383094208TNCJS21 clusterIBMBSCMareNostrum65536167300222822MPPBlue Gene/PIBMFZJJugene
CoresRmaxRpeakArchitectureModelManufacturerCentreSystem

Compute power by architecture type
MPP50%
Thin-node Cluster
35%
Fat-node Cluster14%
Vector1%

Availability and utilisation
0
10
20
30
40
50
60
70
80
90
100N
eo
lith
Pa
lu
Jub
l
Le
gio
n
Ma
reN
ost
rum
Jug
en
e
hw
wS
X-8
BC
X
ha
lo
Jum
p
Pla
tine
Hu
yge
ns
HE
RA
HP
Cx
Mili
pe
ia
HL
RB
II
ZA
HIR
Sta
llo
XC
5
HE
CT
oR
mu
rska
.csc
.fi
Ga
lera
Availability %
Utilisation %

LEFs
• The measure of computational power and consumed cycles we use is the Linpack Equivalent Flop (LEF).
• A system which has a Linpack Rmax of 50 Tflop/s is said to have a power of 50T LEFs
• An application which uses 10% of the time on that system is said to consume 5T LEFs

Distribution of LEFs by job size
< 3214.1%
33 - 12822.8%
129 - 51219.4%
512 - 204817.6%
> 204826.1%

Mean job size as % of machine
0
5
10
15
20
25
30
35
Galer
a
Neolith
Stallo
BCX
HLRB II
mur
ska.
csc.f
i
Platine
Milip
eia halo
Huyge
ns
ZAHIR
Mar
eNos
trum
Jum
pPalu
hww S
X-8
HERAHPCx
HECToRLo
uhi
Jubl
Juge
neXC5
Legio
n
% o
f m
ac
hin
e o
f th
e m
ea
n jo
b s
ize

Job size distribution by system
0%
10%
20%
30%
40%
50%
60%
70%
80%
90%
100%Ju
ge
ne
Jub
l
Lo
uh
i
XC
5
Le
gio
n
HE
CT
oR
Pa
lu
Ma
reN
ost
rum
Sta
llo
Pla
tine
Ne
olit
h
HP
Cx
HL
RB
II
BC
X
Hu
yge
ns
ZA
HIR
mu
rska
.csc
.fi
hw
w S
X-8
Jum
p
HE
RA
Ga
lera
Mili
pe
ia
TN
C
>2048
513-2048
129-512
33-128
<32

Distribution of LEFs by scientific area
Particle Physics 23.5
Computational Chemistry 22.1
Condensed Matter Physics 14.2
CFD 8.6
Earth & Climate 7.8
Astronomy & Cosmology 5.8
Life Sciences 5.3
Computational Engineering 3.7
Plasma Physics 3.3
Other 5.8
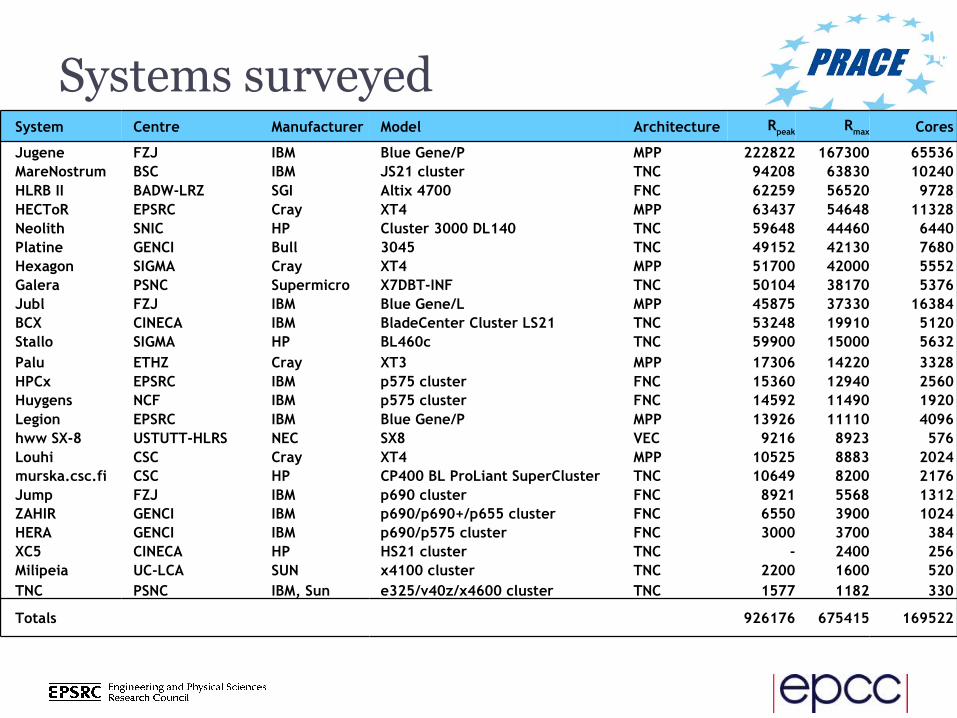
No. of users and Rmax per user
0
200
400
600
800
1000
1200
Jump
HPCx
hww S
X-8
ZAHIR
HLR
B II
Jubl
HERA
mur
ska.
csc.f
i
Huy
gens
Neo
lith
Juge
ne
HECToR
BCX
TNC P
alu
Lou
hi
Gale
ra
Milip
eia
Leg
ion
XC5
Machine Name
No
. o
f U
se
rs
0
200
400
600
800
1000
1200
Rm
ax p
er
Us
er
No. Users Rmax Per User

Top 30 applications by usage
11233pdkgrav-gasoline11398magnum12249helium12525cp2k12713bqcd12713trace12713bam12713wien2k12745chroma12802tripoli422857pepc32903gromacs13092tfs/piano23181smmp13202trio_u13798cactus13982quantum-espresso14223casino24779dl_poly24846materials with strong correlations25206spintronics17947dynamical fermions28412gadget59680cpmd39975dalton410335namd212393lqcd (two flavor)225007lqcd (twisted mass)935766vasp254923overlap and wilson fermions
Number of systems using this code
LEFs Used(Gflop/s)
Application Name

Parallelisation techniques
• Of the 69 applications, all but two use MPI for parallelisation ▫ exceptions are Gaussian (OpenMP) and BLAST
(sequential). • Of the 67 MPI applications, six also have standalone
OpenMP versions and three have standalone SHMEM versions.
• 13 applications have hybrid implementations▫ 10 MPI+OpenMP, 2 MPI+SHMEM, 1 MPI+Posix threads
• Only one application was reported as using MPI2 single sided communication.

Languages
• 16 applications mix Fortran with C/C
1Mathematica
2Perl
3Python
7C99
10C++
15Fortran77
22C90
50Fortran90
No. of applicationsLanguage
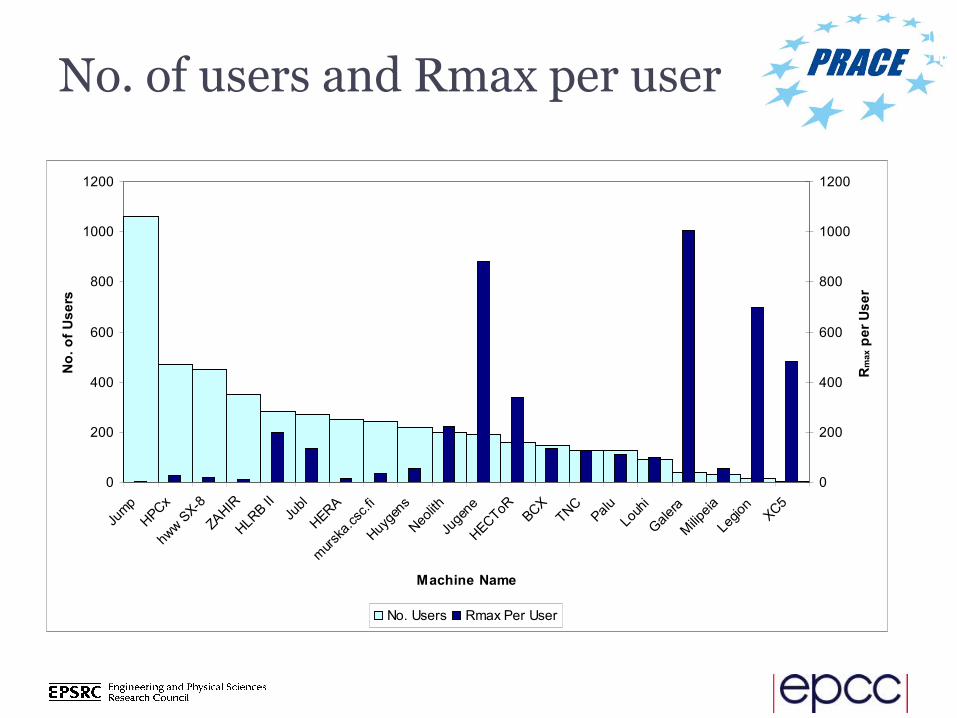
Distribution of LEFs by dwarves
Map reduce methods45.1%
Spectral methods18.4%
Dense linear algebra14.4%
Structured grids9.0%
Particle methods7.2%
Sparse linear algebra3.4%
Unstructured grids2.4%

Distribution of LEFs by dwarf and area
0.000.000.000.000.000.000.00Other
0.630.422.220.000.000.000.00Plasma Physics
89.270.000.100.924.320.0012.50Particle Physics
3.460.280.940.130.944.720.00Life Science
0.000.220.000.003.310.700.00Earth and Climate Science
5.700.281.760.060.9614.339.02Condensed Matter Physics
0.001.010.321.067.091.700.00Computational Fluid Dynamics
2.800.530.000.530.530.000.00Computational Engineering
12.980.497.492.791.1424.8915.09Computational Chemistry
0.002.995.433.264.580.620.00Astronomy and Cosmology
Map
reduce
meth
ods
Unstru
cturedgrids
Particle
meth
ods
Sparse linear
algebra
Structu
red
grids
Spectralm
ethods
Den
se linearalge
braArea/Dwarf

Choosing a benchmark suite
• Want to choose a set of applications to form a benchmark suite▫ to be used in the procurement process for Petaflop/s
systems• Suggested process: find a set of applications that is a
best fit to the area/dwarf table in the sense that it minimises the norm of
Uw-v where v is a linearised vector containing the table entriesU is a matrix describing the area/dwarf combinations
satisfied by the applicationsw is vector of weights

• In principle, one could search all possible lists of applications up to a certain length and find the list with the smallest residual▫ in practise, do a manual search▫ we want to include other criteria, such as usage of
applications, geographical spread, etc.
• Gives a quantitative measure of how well a benchmark suite represents current usage
• Also gives a weighting for the applications which could be used to weight benchmark results

Problems with this approach
• Classification of codes into dwarves (and to some extent, areas) is somewhat arbitrary▫ some applications use more than one dwarf: we split
the LEFs equally between dwarves• Bias to recently acquired systems
▫ high LEFs▫ recently acquired systems may have atypical usage by
early users• Reflects past, rather than future usage

Current status
• We used the above process as a starting point, then swapped some applications to meet some of the concerns
• 12 core applications, plus 8 additional applications
• Core apps: NAMD, CPMD, VASP, QCD, GADGET, Code_Saturne, TORB, NEMO, ECHAM5, CP2K, GROMACS, N3D
• Additional apps: AVBP, HELIUM, TRIPOLI_4, GPAW, ALYA, SIESTA, BSIT, PEPC

Future
• The benchmark applications will now be:▫ Analysed▫ Optimised▫ Peta-scaled
• Used to form a benchmark suite for procurement
• Enable research into how to petascale applications

Acknowledgements
• The authors would like to acknowledge all those who contributed by filling in survey forms and taking part in subsequent discussions.
• A full report is available at: http://www.prace-project.eu/documents/