Embed Size (px)
Citation preview
Dr. Terry Bergeson State Superintendent of
Public Instruction November 2005
Student Readiness for Kindergarten A Survey of Kindergarten Teachers in Washington State
Student Readiness for Kindergarten
A Survey of Kindergarten Teachers in Washington State
Prepared by Dave Pavelchek, Senior Research Manager Washington State University Social and Economic Sciences Research Center
Dr. Terry Bergeson Superintendent of Public Instruction
Marty S. Daybell
Deputy Superintendent, Administration and Operations Chief Information Officer
Marcia L. Riggers
Assistant Superintendent, Student Support
Martin T. Mueller Director, Learning and Teaching Support
Debra Williams-Appleton
Program Supervisor, Early Childhood Education
November 2005

Office of Superintendent of Public Instruction Old Capitol Building
P.O. Box 47200 Olympia, WA 98504-7200
For more information about the contents
of this document, please contact: Debra Williams-Appleton, OSPI
E-mail: [email protected] Phone: (360) 725-6049
To order more copies of this document, please call 1-888-59-LEARN (I-888-595-3276)
or visit our Web site at http://www.k12.wa.us/publications
Please refer to the document number below for quicker service: 05-0040
This document is available online at:
http://www.k12.wa.us/
This material is available in alternative format upon request. Contact the Resource Center at (888) 595-3276, TTY (360) 664-3631.
Student Readiness for Kindergarten November 2005 Office of Superintendent of Public Instruction
Sponsorship The Office of Superintendent of Public Instruction (OSPI) sponsored the survey of Student Readiness for Kindergarten in Washington State; conducted in the fall of 2004. Funding for the survey originated from the following federal source: The U.S. Department of Education, Even Start Family Literacy Program, administered through the Office of Superintendent of Public Instruction. The Even Start Family Literacy Program is intended to help break the cycle of illiteracy and poverty and improve the educational opportunity of low income families. About Social and Economic Sciences Research Center (SESRC)
The Social and Economic Sciences Research Center at Washington State University is a recognized leader in the development and conduct of survey research. SESRC-Puget Sound Division provides technical services and consultation to assist clients in acquiring data, understanding what data means, and applying that information to solving problems. The SESRC-Puget Sound Division specializes in research design, data collection, and analysis, using both qualitative and quantitative methods. The Division also provides interpretive reports, policy studies, presentations, and consulting services directly to individual clients, organizations, and consortia. Contact information for the SESRC-Puget Sound Division is as follows: WSU-SESRC PO Box 43170 203 E. 4th Avenue, Suite 521 Olympia, WA 98504-3170 Phone: 360-586-9292 E-mail: [email protected] Acknowledgements The Office of Superintendent of Public Instruction would like to give special thanks to the following individuals who provided guidance to the development of the survey and review and input to the final report. Elizabeth Bonbright Thompson, Washington State Child Care Resource and Referral Network Jerene Callan, Tacoma School District Sangree M. Froelicher, Governor’s Head Start State Collaboration Office Lorrie Grevstad, Washington State Department of Health Bea Kelleigh, Early Care and Education Coalition Garrison Kurtz, Foundation for Early Learning Wendy Roedell, Puget Sound Educational Service District Lynne Shanafelt, Washington State Department of Community, Trade, and Economic Development
Student Readiness for Kindergarten November 2005 Office of Superintendent of Public Instruction
TABLE OF CONTENTS
Executive Summary....................................................................................................................... i
Background ................................................................................................................................... 1
Are our Children Ready for School? .......................................................................................... 1
What is School Readiness? ......................................................................................................... 1 What does School Readiness Mean? ...................................................................................... 1 What Elements of School Readiness does this Survey Address? ........................................... 2
Survey Overview ......................................................................................................................... 2
Design and Analysis ...................................................................................................................... 3
Survey Methodology.................................................................................................................... 3
Information Collected ................................................................................................................. 3
Interpreting Data Collected at the Class Level .......................................................................... 3
Teacher, Class, and Student Counts ........................................................................................... 4
All Data is Approximate.............................................................................................................. 4
Response to the Survey................................................................................................................. 5
School Districts........................................................................................................................... 5
Geography................................................................................................................................... 5 East-West ................................................................................................................................ 5 Counties .................................................................................................................................. 5
Classes ............................................................................................................................................ 6
Type of Class............................................................................................................................... 6
Class Size .................................................................................................................................... 6
Student Demographics.................................................................................................................. 8
Gender......................................................................................................................................... 8
Ethnicity ...................................................................................................................................... 8
Screening and Assessment Practices ........................................................................................... 9
How Common is Screening?....................................................................................................... 9
Sources of Screening Tools and Assessments ............................................................................. 9 Commercially-Available Tools............................................................................................... 9 Locally-Developed Tools...................................................................................................... 10

Student Readiness for Kindergarten November 2005 Office of Superintendent of Public Instruction
Generic Descriptions............................................................................................................. 10
Student Characteristics and Prior Experiences ....................................................................... 11
Overview ................................................................................................................................... 11
Transition to Kindergarten/Communication Received ............................................................. 11
Risk Factors and Program Eligibility....................................................................................... 12 Pre-existing Health Problems ............................................................................................... 12 Prior Experience.................................................................................................................... 12 Participation in Programs...................................................................................................... 13 Referrals for Screening and Assessment for Special Services.............................................. 13 Non-Response ....................................................................................................................... 13
Preparedness ............................................................................................................................... 15
Preparedness Data was Analyzed Three Ways......................................................................... 16
Overall Preparedness ............................................................................................................... 16
Preparedness by Domain.......................................................................................................... 18
Preparedness Estimates for Specific Indicators ....................................................................... 18
Importance to Teachers.............................................................................................................. 22
Overview ................................................................................................................................... 22
Average Importance by Domain ............................................................................................... 22
Importance Ratings of Specific Indicators................................................................................ 24
What do Teachers Expect to Teach?......................................................................................... 26
Combining Preparedness and Importance Data...................................................................... 28
Higher Importance Ratings with Large Preparedness Gaps.................................................... 29
Lower Importance Ratings but Large Preparedness Gaps....................................................... 31
Low Disparities Between Importance Ratings and Student Preparedness............................... 33
Teacher Experience .................................................................................................................... 34
Classroom Support ..................................................................................................................... 35
Teacher Comments ..................................................................................................................... 36
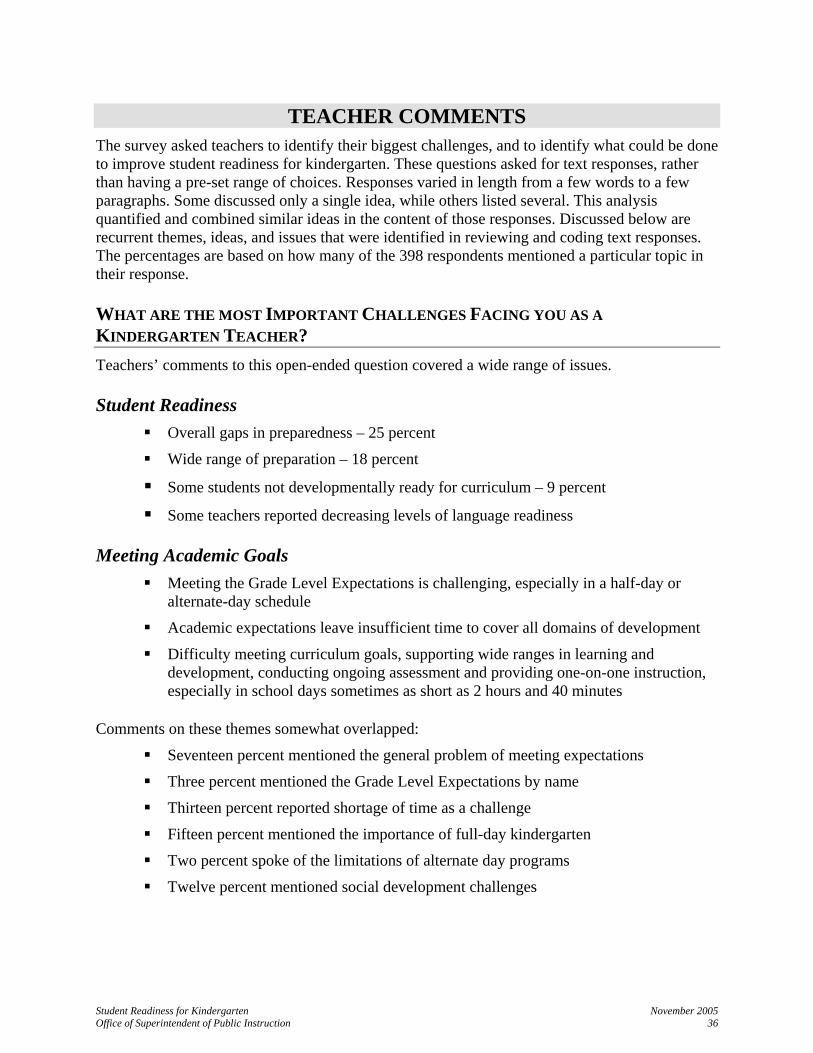
What are the most Important Challenges Facing you as a Kindergarten Teacher? ................ 36 Student Readiness ................................................................................................................. 36 Meeting Academic Goals...................................................................................................... 36 Parent Role............................................................................................................................ 37 Class Size and Staffing ......................................................................................................... 37 Meeting the Needs of English Language Learners ............................................................... 37

Student Readiness for Kindergarten November 2005 Office of Superintendent of Public Instruction
What is the most Important Thing that can be done to Improve School Readiness for Kindergarten? ........................................................................................................................... 37
Role and Participation of Parents.......................................................................................... 37 Improved Access to Early Learning Programs ..................................................................... 38 Improved Access to High Quality Early Care and Education Experiences for Children that Focuses on School Readiness .................................................................................. 38 Full-day Kindergarten........................................................................................................... 38 Improved Screening and Assessment ................................................................................... 38
Possible Next Steps...................................................................................................................... 39
Appendices................................................................................................................................... 40
Appendix A - Survey Instrument ............................................................................................... 40
Appendix B - Geography of Response Tables........................................................................... 51
Appendix C - What is School Readiness? ................................................................................. 55
Student Readiness for Kindergarten November 2005 Office of Superintendent of Public Instruction
TABLE OF FIGURES
Percentage of Entering Kindergarten Students Adequately Prepared in Specific Indicators ........ iii Type of Class Kindergarten Students Attend.................................................................................. 6 Average Class Sizes........................................................................................................................ 7 Distributions of Class Sizes for Full-Day Kindergarten Classes .................................................... 7 Distributions of Class Sizes for Half-Day Kindergarten Classes ................................................... 7 Comparison of Respondents’ Student Population with State Student Population.......................... 8 Number of Screening/Assessment Tools Listed ............................................................................. 9 Sources of Screening/Assessment Tools ...................................................................................... 10 Prior Experience and Advance Communication........................................................................... 12 Pre-Existing Health Barriers ......................................................................................................... 12 Prior Early Childhood Education Experience............................................................................... 12 Program Eligibility........................................................................................................................ 13 Referrals........................................................................................................................................ 13 Teacher Knowledge About Incoming Students ............................................................................ 14 How Prepared did Teachers find Their Incoming Classes?.......................................................... 17 Estimated Cumulative Distribution of Preparedness .................................................................... 17 Estimated Percent of Students Prepared – Average of Indicators by Domain ............................. 18 Average Preparedness for Indicators Within each Domain.......................................................... 18 Specific Indicators – Sorted Lowest to Highest Average Preparedness ....................................... 19 Average Preparedness Percentages for Specific Indicators by Domain ....................................... 20 Relationship of Preparedness to Prevalence of Low-Income ....................................................... 21 Average Importance Ratings for Indicators by Domain – Scaled 1 to 5 ...................................... 22 Average Importance for Indicators Within each Domain............................................................. 23 Average Importance Rating .......................................................................................................... 24 Average Importance Rating for Specific Indicators by Domain .................................................. 25 Percentage Reporting Indicator as Less Important for Student Preparedness Because Teachers
Expect to Teach this Ability/Skill......................................................................................... 26 Percentage Reporting as Less Important for Student Preparedness Because Teachers Expect to
Teach this Ability/Skill ......................................................................................................... 27 Importance and Preparedness of Indicators by Domain ............................................................... 28 Professional Experience of Responding Teachers........................................................................ 34 Presence of Adult Support in the Classroom ................................................................................ 35
Student Readiness for Kindergarten November 2005 Office of Superintendent of Public Instruction i
EXECUTIVE SUMMARY Student Readiness for Kindergarten:
A Survey of Kindergarten Teachers in Washington State
Prepared by Dave Pavelchek Social & Economic Sciences Research Center, Puget Sound Office
Washington State University September 2005
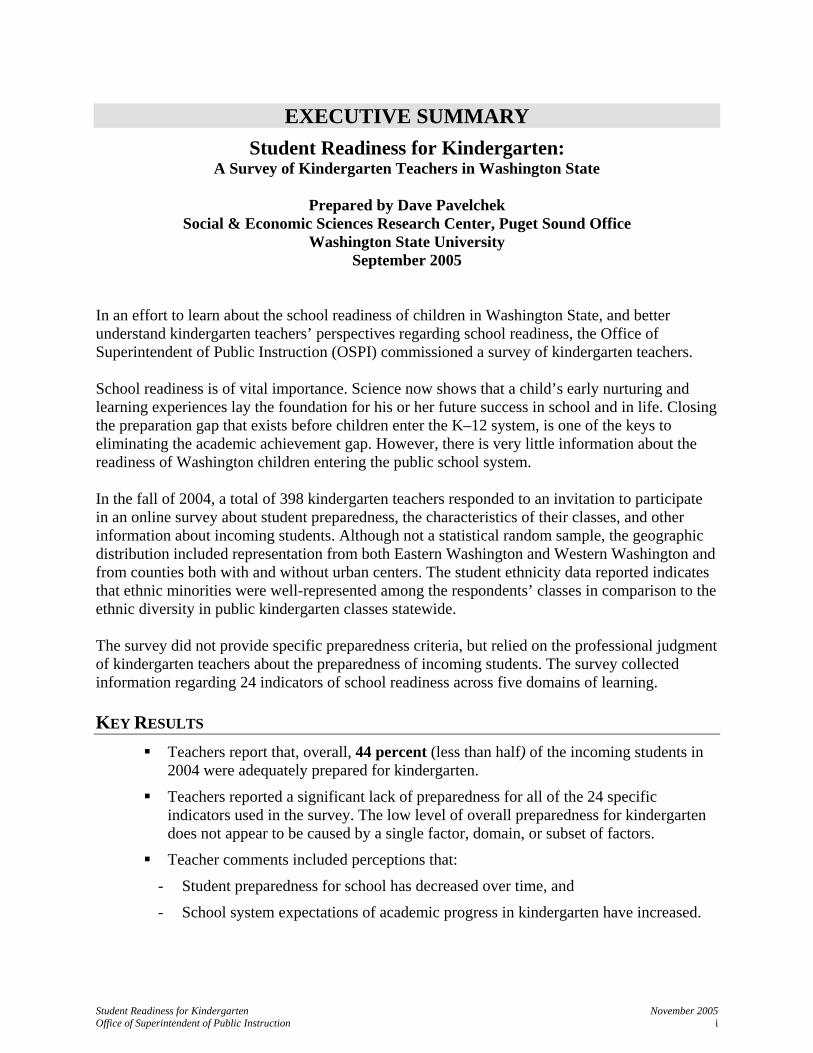
In an effort to learn about the school readiness of children in Washington State, and better understand kindergarten teachers’ perspectives regarding school readiness, the Office of Superintendent of Public Instruction (OSPI) commissioned a survey of kindergarten teachers. School readiness is of vital importance. Science now shows that a child’s early nurturing and learning experiences lay the foundation for his or her future success in school and in life. Closing the preparation gap that exists before children enter the K–12 system, is one of the keys to eliminating the academic achievement gap. However, there is very little information about the readiness of Washington children entering the public school system. In the fall of 2004, a total of 398 kindergarten teachers responded to an invitation to participate in an online survey about student preparedness, the characteristics of their classes, and other information about incoming students. Although not a statistical random sample, the geographic distribution included representation from both Eastern Washington and Western Washington and from counties both with and without urban centers. The student ethnicity data reported indicates that ethnic minorities were well-represented among the respondents’ classes in comparison to the ethnic diversity in public kindergarten classes statewide. The survey did not provide specific preparedness criteria, but relied on the professional judgment of kindergarten teachers about the preparedness of incoming students. The survey collected information regarding 24 indicators of school readiness across five domains of learning.
KEY RESULTS Teachers report that, overall, 44 percent (less than half) of the incoming students in
2004 were adequately prepared for kindergarten.
Teachers reported a significant lack of preparedness for all of the 24 specific indicators used in the survey. The low level of overall preparedness for kindergarten does not appear to be caused by a single factor, domain, or subset of factors.
Teacher comments included perceptions that:
- Student preparedness for school has decreased over time, and
- School system expectations of academic progress in kindergarten have increased.
Student Readiness for Kindergarten November 2005 Office of Superintendent of Public Instruction ii
Most teachers reported that they routinely screen or assess incoming kindergarten students in order to inform instruction (79 percent).
Teachers reported that nearly half (46 percent) of the entering students had previously attended a preschool or childcare.
Teachers received information about entering students from prior preschool teachers or childcare providers in only about one-third of the cases in which the teacher reported that there was a prior provider.
Student preparedness levels tended to be lower in classes with high rates of poverty. Averaging across the indicators within each domain, all domains had average preparedness below 75 percent, and in two domains the average was below 50 percent. (Cognition and General Knowledge and Language and Literacy) Among the 24 specific preparedness indicators, only in large motor skills were more than 75 percent of the students adequately prepared. In two early literacy indicators, alphabet knowledge and ability to rhyme words, less than one-third of the students were adequately prepared.
SPECIFIC INDICATORS OF PREPAREDNESS Teachers were asked to rate 24 specific indicators of student preparedness, representing five key “domains.”
Physical Well Being, Health, and Motor Development
Social and Emotional Development
Approaches Toward Learning
Cognition and General Knowledge
Language and Literacy
Student Readiness for Kindergarten November 2005 Office of Superintendent of Public Instruction iii
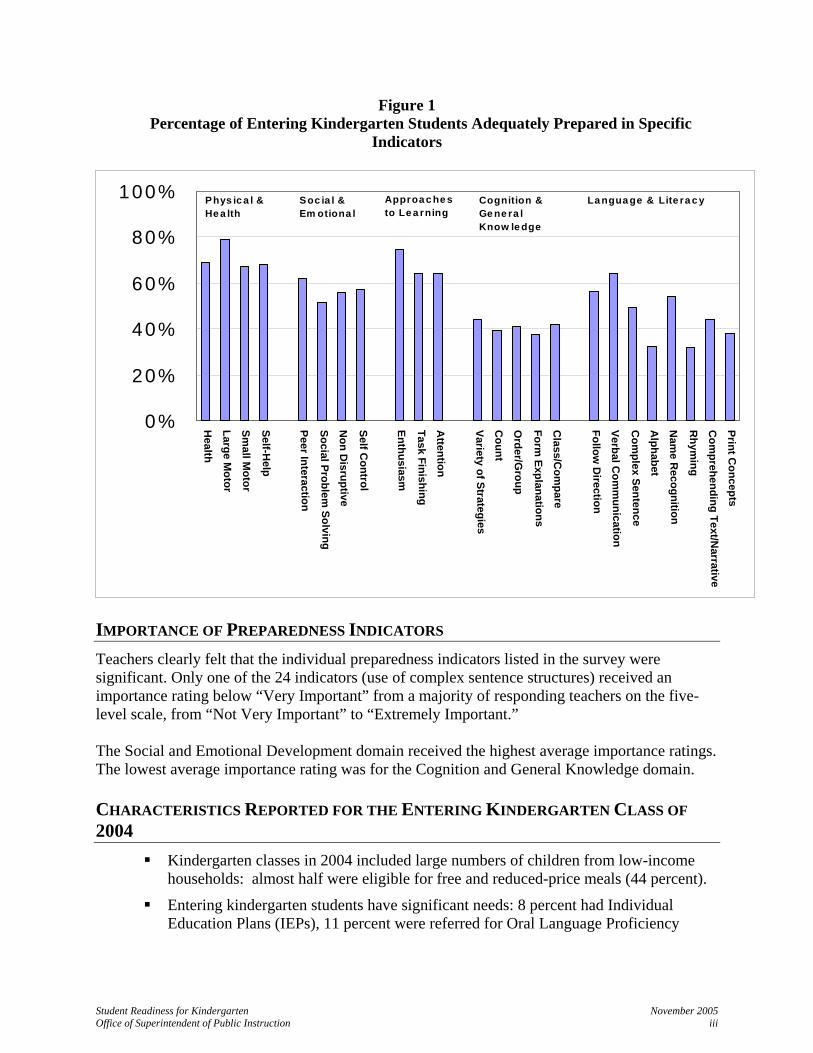
Figure 1 Percentage of Entering Kindergarten Students Adequately Prepared in Specific
Indicators
0%
20%
40%
60%
80%
100%
Hea lth
L arg e Mo tor
Smal l M
o to r
Se lf-Help
Pe er I n te racti on S oc ia l Pro blem
So lving N
on Disrup tiv e
Se lf Co ntrol
En th us ias m
Ta sk Fin is hing A
tte ntio n
V ari ety of Strateg i es C
ou nt O
rde r/Gro up
Fo rm E xp la nati on s
Clas s/C
o mpa re
F ol lo w D
i recti on V erba l C
omm
u nicati on C
o mplex S en te nce
Alph ab et
Nam
e Re cog ni tio n
Rhym
in g C
omp re he ndin g Tex t/N
arrati ve Print C
onc ep ts
Soc ia l &Em otiona l
Approa c he s to Le a rning
Cognition & Ge ne ra l Know le dge
La ngua ge & Lite ra c yPhys ic a l & He a lth
IMPORTANCE OF PREPAREDNESS INDICATORS Teachers clearly felt that the individual preparedness indicators listed in the survey were significant. Only one of the 24 indicators (use of complex sentence structures) received an importance rating below “Very Important” from a majority of responding teachers on the five-level scale, from “Not Very Important” to “Extremely Important.” The Social and Emotional Development domain received the highest average importance ratings. The lowest average importance rating was for the Cognition and General Knowledge domain.
CHARACTERISTICS REPORTED FOR THE ENTERING KINDERGARTEN CLASS OF 2004
Kindergarten classes in 2004 included large numbers of children from low-income households: almost half were eligible for free and reduced-price meals (44 percent).
Entering kindergarten students have significant needs: 8 percent had Individual Education Plans (IEPs), 11 percent were referred for Oral Language Proficiency
Student Readiness for Kindergarten November 2005 Office of Superintendent of Public Instruction iv
testing, and teachers reported that they had referred or were considering referring another 10 percent of their entering students “for special education services.”
Half-day kindergarten classes outnumbered full-day classes almost 3 to 1.
The vast majority of kindergarten classes have between 17 and 24 students, with an average of about 20 for half-day classes and 21 for full-day classes.
Teachers who responded averaged almost 15 years of professional experience in education.
According to the National Education Goals Panel, overall school readiness includes:
Children’s readiness to enter school
Schools’ readiness for children
Family and community supports that contribute to the readiness of children This survey focused on the first strand of overall readiness, the readiness of the child to enter school, specifically public school kindergarten classes. The full report discusses teachers’ greatest challenges and their recommendations for improving readiness, as well as what could be done to improve the survey if it were repeated in future years, and additional uses of the data.

Student Readiness for Kindergarten November 2005 Office of Superintendent of Public Instruction 1
BACKGROUND
ARE OUR CHILDREN READY FOR SCHOOL? A number of recent groundbreaking reports provide compelling evidence of the critical relationship between school readiness, school success, and positive life-long outcomes. Research suggests that children, who arrive at kindergarten unprepared for success in school, have a difficult time closing that preparation gap. That gap often persists over time, especially for children with other barriers to success. Closing the preparation gap that exists before children enter the K–12 system is one of the keys to eliminating the academic achievement gap. However, there is very little information about the readiness of Washington children entering the public school system. In an effort to learn about the school readiness of children in Washington State, and better understand kindergarten teachers’ perspectives regarding school readiness, OSPI commissioned a survey of kindergarten teachers.
WHAT IS SCHOOL READINESS?
What does School Readiness Mean? The National Education Goals Panel,1 three-part definition of school readiness includes:
Children’s readiness to enter school
Schools’ readiness for children
Family and community supports that contribute to the readiness of children
A child’s school readiness is the culmination of the experiences and care that he/she has received from birth to school entry. Young children need stimulating, nurturing experiences every step along the way. There are five dimensions to a child’s school readiness: physical health, well-being, and motor development; social and emotional development; approaches toward learning; cognition and general knowledge; and language and literacy.
Ready schools are prepared to support the learning and development of every child in their
community. They are committed to the success of every child, to helping children learn and make sense of their complex and exciting world; and to smooth the transition between home and school.
Families strive to raise children who are ready to achieve their full potential. Communities—all of us—contribute to school readiness by building strong schools and safe
neighborhoods where children thrive, by ensuring that families and children have adequate food and housing, and by ensuring access to health care and high quality early education programs.
1 Child Trends, 2001; Kagan, Moore, and Bredekamp, 1995
Student Readiness for Kindergarten November 2005 Office of Superintendent of Public Instruction 2
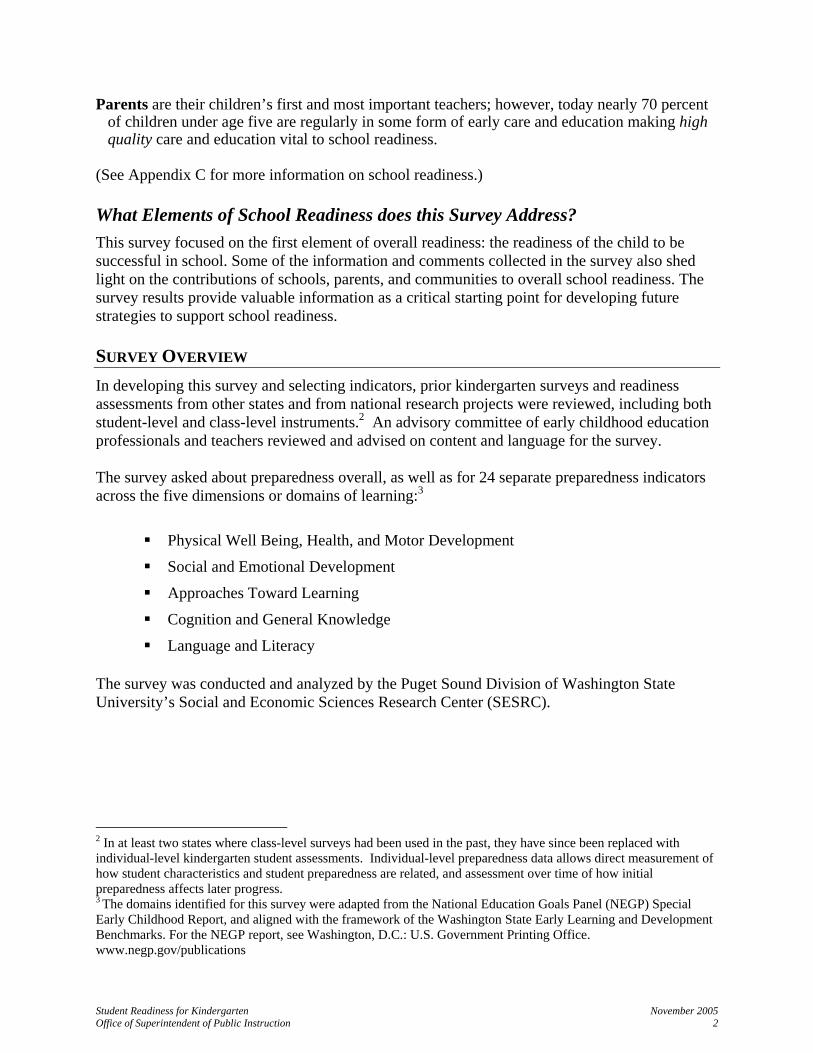
Parents are their children’s first and most important teachers; however, today nearly 70 percent of children under age five are regularly in some form of early care and education making high quality care and education vital to school readiness.
(See Appendix C for more information on school readiness.)
What Elements of School Readiness does this Survey Address? This survey focused on the first element of overall readiness: the readiness of the child to be successful in school. Some of the information and comments collected in the survey also shed light on the contributions of schools, parents, and communities to overall school readiness. The survey results provide valuable information as a critical starting point for developing future strategies to support school readiness.
SURVEY OVERVIEW In developing this survey and selecting indicators, prior kindergarten surveys and readiness assessments from other states and from national research projects were reviewed, including both student-level and class-level instruments.2 An advisory committee of early childhood education professionals and teachers reviewed and advised on content and language for the survey. The survey asked about preparedness overall, as well as for 24 separate preparedness indicators across the five dimensions or domains of learning:3
Physical Well Being, Health, and Motor Development
Social and Emotional Development
Approaches Toward Learning
Cognition and General Knowledge
Language and Literacy The survey was conducted and analyzed by the Puget Sound Division of Washington State University’s Social and Economic Sciences Research Center (SESRC).
2 In at least two states where class-level surveys had been used in the past, they have since been replaced with individual-level kindergarten student assessments. Individual-level preparedness data allows direct measurement of how student characteristics and student preparedness are related, and assessment over time of how initial preparedness affects later progress. 3 The domains identified for this survey were adapted from the National Education Goals Panel (NEGP) Special Early Childhood Report, and aligned with the framework of the Washington State Early Learning and Development Benchmarks. For the NEGP report, see Washington, D.C.: U.S. Government Printing Office. www.negp.gov/publications

Student Readiness for Kindergarten November 2005 Office of Superintendent of Public Instruction 3
DESIGN AND ANALYSIS
SURVEY METHODOLOGY The invitation to participate in the survey was mailed to all principals of public elementary schools in Washington with a request that it be distributed to all kindergarten teachers. The invitation included the Web site address through which the survey could be answered or be printed in paper form. The intent was to obtain teachers’ perceptions of the incoming class after they had enough experience and observation to be well-informed about the preparedness of their new students, but before there would be significant possibility of confusion between incoming preparedness and the rate of progress students made during the year. Teachers were given the option of printing a paper copy, either to prepare their answers, or to mail their responses. Responding teachers were promised that their individual responses would remain confidential and unidentifiable.
INFORMATION COLLECTED In cases where a teacher taught more than one class, some of the information was collected separately on the two separate classes. However, preparedness information was collected only once for all the incoming students taught by each teacher. In addition to information about student preparedness and the importance of specific indicators of preparation, teachers were also asked about:
Demographics and prior experiences of their incoming students
Level of classroom support from professional and volunteer adults
Screening practices routinely used with incoming kindergarten students
How long they had been teaching
What they perceived as the major challenges in teaching kindergarten and possible measures to improve school readiness
INTERPRETING DATA COLLECTED AT THE CLASS LEVEL Because this survey asked about the overall characteristics of classes, it is not possible to analyze the relationship of the characteristics of individual students to their individual preparedness. The data can be analyzed to determine how often or consistently two characteristics of classes appear to be related, such as the percentage of students in poverty and the percentage of students adequately prepared. Extending that example, because these data do not directly measure individual student characteristics and preparedness, no matter how strong the data, it will never be possible to determine the cause of this relationship. Group data cannot tell the difference between inadequate preparation of students from poor households and prevailing unpreparedness at the community level due to fewer economic resources.
Student Readiness for Kindergarten November 2005 Office of Superintendent of Public Instruction 4
TEACHER, CLASS, AND STUDENT COUNTS Because some survey questions asked about teachers, some about each class a teacher taught, and some about student counts, there are issues addressed by the survey that can be analyzed three different ways. For example, we can ask three different questions about average class sizes, and get three slightly different answers:
What percentage of teachers have classes with more than 20 students?
What percentage of classes have more than 20 students? (Some teachers teach two classes.)
What percentage of students are in classes of more than 20?
Each of those questions will result in a slightly different answer.
Because of the structure of the questions, not all questions can be analyzed all three ways. But it is important, especially when comparing information from different sections or tables, to note whether the data is by teacher, class, or student.
ALL DATA IS APPROXIMATE In order to make it possible for teachers to complete this survey in a reasonable amount of time without extensively consulting records, exact counts were requested in only a few questions. In some questions, teachers were asked for approximate numbers or approximate percentages. In other cases, they were given the choice of general percentage ranges. For almost every question, a few teachers did not provide answers, choosing either to skip the question or select “Don’t Know” or “Not Applicable.” Further, as in every survey, there were occasional obvious entry errors. While obvious errors were corrected or deleted, there were presumably uncorrected errors that were not so obvious. In order to systematically analyze the responses, these approximate answers were arithmetically treated as if they were precise numbers. Therefore, it is important not to treat very small differences as significant, and to remember that the data is all approximate. Nevertheless, the overall picture presented in this data is the best current estimate of the preparedness of kindergarten students in Washington State.
Student Readiness for Kindergarten November 2005 Office of Superintendent of Public Instruction 5
RESPONSE TO THE SURVEY Survey responses were received October 18, 2004, through November 27, 2004. The majority of the responses were received in the first few weeks after distribution of the invitation through elementary school principals. A few teachers preferred to respond via paper copy, and those responses were entered into the response database by SESRC staff. At total of 398 kindergarten teachers completed surveys by the time the Web site was closed.
SCHOOL DISTRICTS Out of about 300 Washington school districts that have kindergarten classes, survey respondents included at least one teacher from 144 districts.4 Although there was considerable variation in the number of responding teachers by district and county, the overall pattern of response is not greatly different from the distribution of the kindergarten student population.
GEOGRAPHY
East-West Responses were fairly evenly distributed between Eastern and Western Washington, with 69 percent coming from teachers in the more populous part, west of the Cascades. This is similar to the overall distribution of public school kindergarten students, which is 75 percent Western Washington, 25 percent Eastern Washington.5
Counties At a county level, at least one teacher responded from 36 of the 39 counties. All three of the unrepresented counties have small populations, fewer than 20,000. The more heavily populated parts of the state generated the majority of the responses, with 68 percent coming from the 11 counties with major urban centers. In the overall distribution of public school kindergarten students, 82 percent of all public school kindergarten students attend school in those counties.6
4 The fall statewide P105 report for 2003 lists 1,185 schools at 292 districts as having one or more kindergarten students. 5 Fall statewide P105 report for 2003. 6 Ibid.
Student Readiness for Kindergarten November 2005 Office of Superintendent of Public Instruction 6
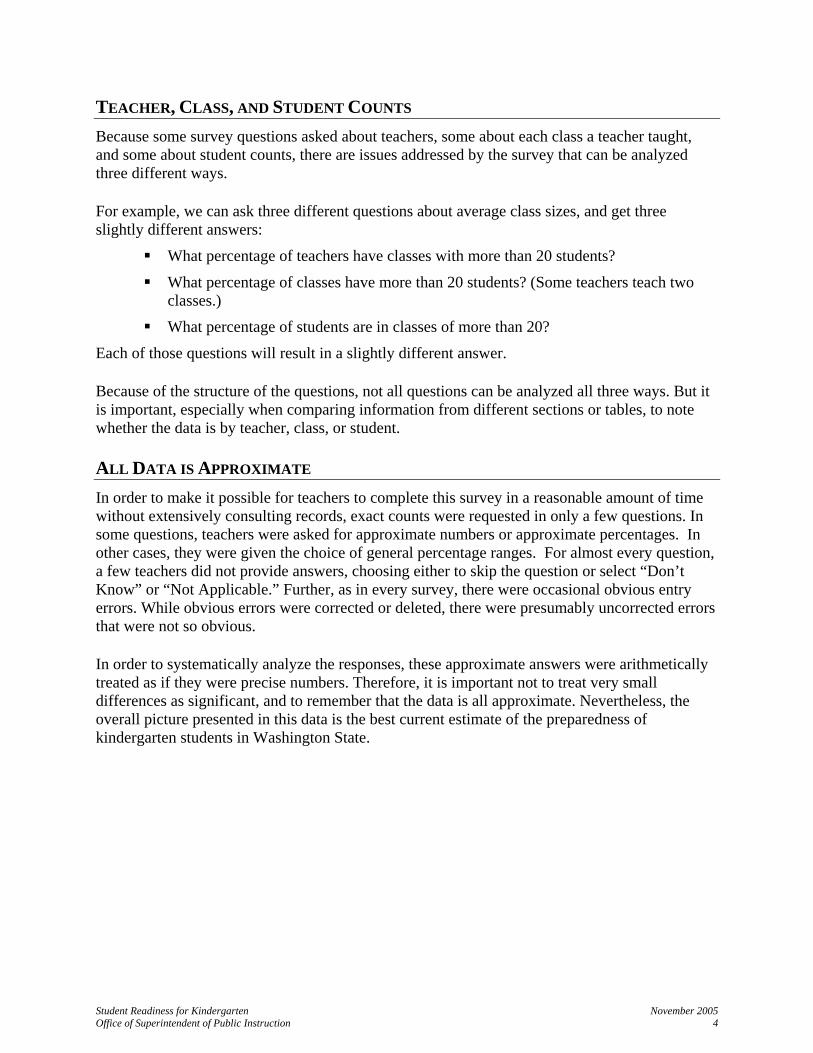
CLASSES The 398 teachers reported on 568 separate kindergarten classes that they taught.
TYPE OF CLASS Most teachers reported that they taught half-day kindergarten classes, with a very small proportion teaching kindergarteners in a multi-grade classroom.7 The legal requirement for a kindergarten program is 450 hours during the school year. For a 180 day school year, that would average to 2.5 hours per school day. Teacher comments indicated that some half-day kindergarten programs keep approximately those hours.
Full-day classes were slightly larger on average than half-day classes (21.0 vs. 19.9 for half-day classes). However, this difference was not very large and the ratio of three half-day for every one full day holds for both classes and students.
Figure 3 Type of Class Kindergarten Students Attend
Multi-Grade1%
Other2%
Full-Day25%
Half-Day72%
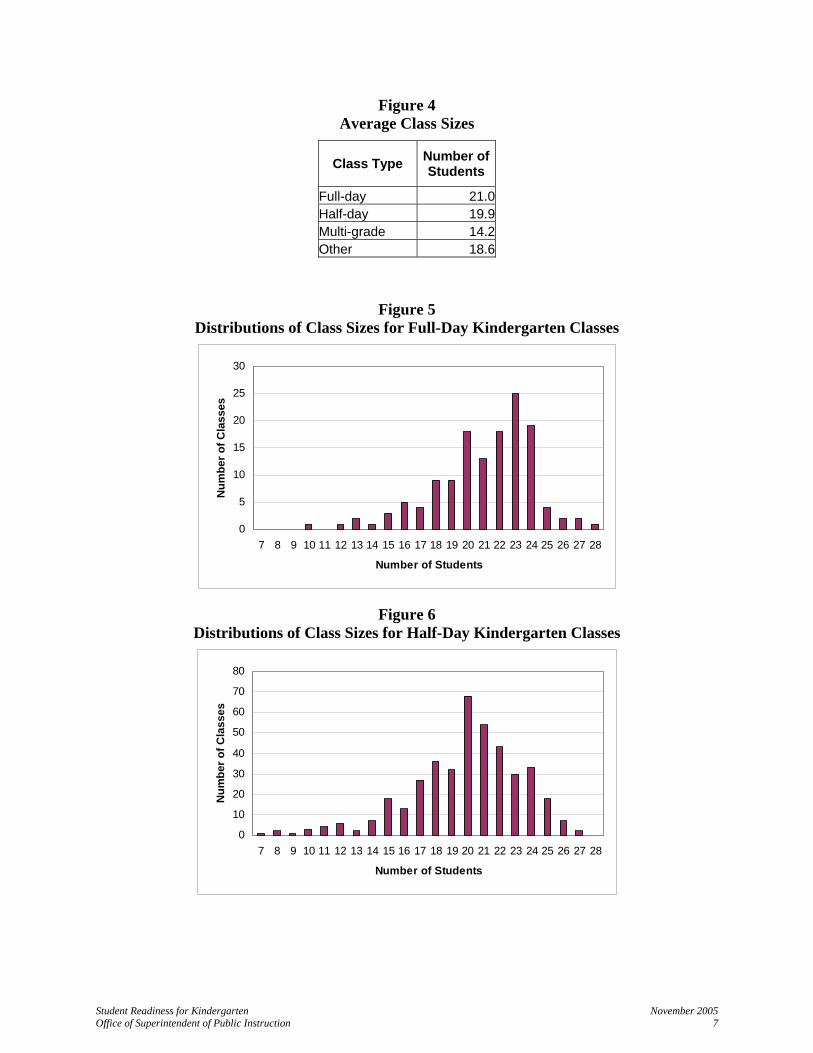
CLASS SIZE Most students (over 90 percent) were in classes of 17–24 students. Almost a third (31.6 percent) were in classes with more than 22 students.
The average class size is about 20 students.
7 Unfortunately, the survey did not give teachers an option for reporting classes as “full-day, every-other-day.” It is apparent from comments that there are a significant number of such programs and that some teachers reported these programs as “full-day” some as “half-day” and some as “Other.”
Student Readiness for Kindergarten November 2005 Office of Superintendent of Public Instruction 7
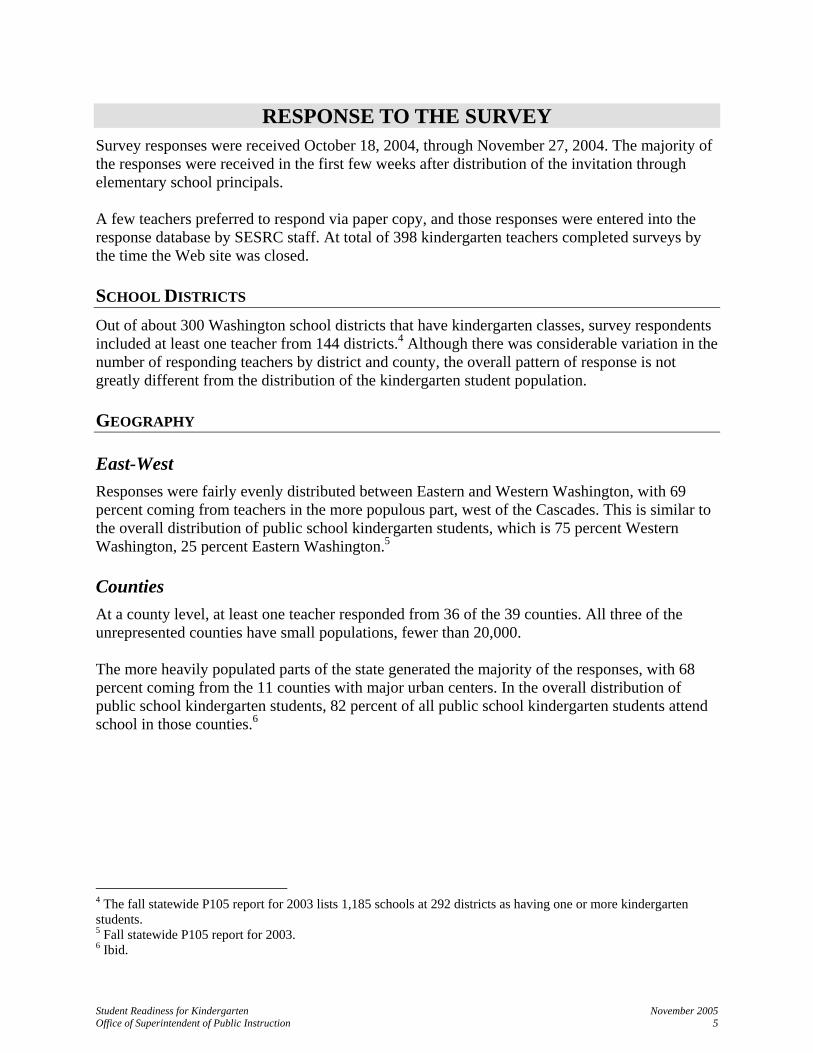
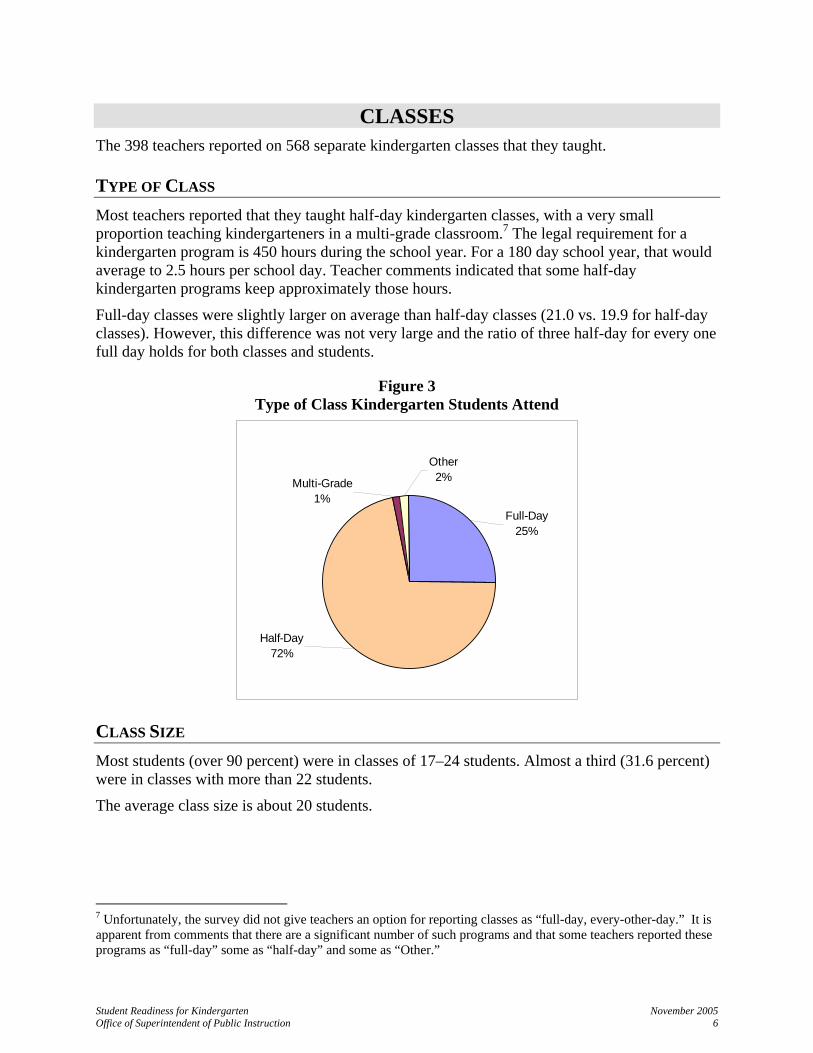
Figure 4 Average Class Sizes
Class Type Number of Students
Full-day 21.0Half-day 19.9Multi-grade 14.2Other 18.6
Figure 5 Distributions of Class Sizes for Full-Day Kindergarten Classes
0
5
10
15
20
25
30
7 8 9 10 11 12 13 14 15 16 17 18 19 20 21 22 23 24 25 26 27 28
Number of Students
Num
ber o
f Cla
sses
Figure 6 Distributions of Class Sizes for Half-Day Kindergarten Classes
0
10
20
30
40
50
60
70
80
7 8 9 10 11 12 13 14 15 16 17 18 19 20 21 22 23 24 25 26 27 28
Number of Students
Num
ber o
f Cla
sses

Student Readiness for Kindergarten November 2005 Office of Superintendent of Public Instruction 8
STUDENT DEMOGRAPHICS The classes on which teachers reported in the survey included over 11,000 students.8
GENDER The student population that was described by the teachers included slightly more males than females, 51.6 percent to 48.4 percent. This is within tenths of a percent of the gender distribution of the fall 2003 statewide public kindergarten statistic (October 2003 P105).
ETHNICITY Because the survey collected ethnicity information using Census categories, exact comparison to the statewide public school count is not possible. However, as shown below, the distribution of kindergarten students’ ethnicity in this survey is similar to the official statewide data. It does appear that the classes of responding teachers had a higher percentage of Hispanic students than the statewide average. However, none of the identified differences are large enough to suggest major bias in the results.
Figure 7 Comparison of Respondents’ Student Population with State Student Population
Ethnicity Reported by
Survey Respondents
Fall 2003 Statewide P105
Reports
American Indian or Alaskan Native 2.8% 2.9% Asian 4.8% 7.9% Black or African American 4.0% 6.0% Hispanic or Latino 17.4% 15.8% Native Hawaiian or Other Pacific Islander 1.3% N/A White or Caucasian 64.5% 67.4% Mixed/Other 5.3% N/A
8 A few teachers reported the gender but not the ethnicity of their students. A few reported neither. Therefore, the demographic statistics are computed for slightly smaller numbers of students, based on how many teachers provided the requested information.

Student Readiness for Kindergarten November 2005 Office of Superintendent of Public Instruction 9
SCREENING AND ASSESSMENT PRACTICES Teachers were asked whether there were procedures to “routinely screen and/or assess the school readiness of incoming kindergarten students in order to inform instruction.” Teachers could list up to five separate entries in response to the request to “list the screening/assessment tools that you use.”
HOW COMMON IS SCREENING? Almost four out of five teachers reported screening procedures for new kindergarten students. Half listed two or more screening tools or procedures.
Figure 8 Number of Screening/Assessment Tools Listed
Tw o Tools21%
Three or more 29%
No Pre-screen21%
One Screening Tool29%
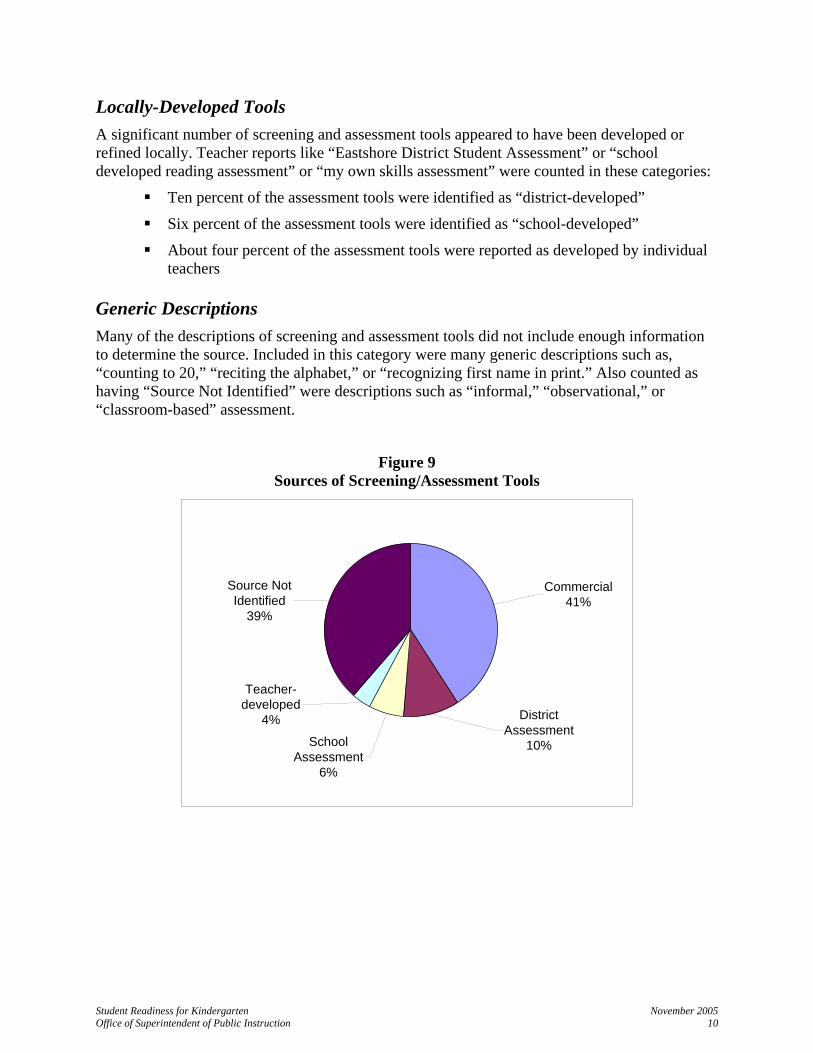
SOURCES OF SCREENING TOOLS AND ASSESSMENTS Commercially-available assessments accounted for about 41 percent of the screening and assessment tools reported. About 39 percent of the reported assessment tools had descriptions that did not identify where it was developed. Instead, teachers described the skills that were being measured, or the method used (e.g., observation), or a local name that did not indicate source.
Commercially-Available Tools At least 47 different commercially-available screening and assessment tools were listed.
Some of these were curriculum-based assessments
Seven products accounted for over 61 percent of commercial screening tools
Many of these tools were reported by only one or two teachers
Student Readiness for Kindergarten November 2005 Office of Superintendent of Public Instruction 10
Locally-Developed Tools A significant number of screening and assessment tools appeared to have been developed or refined locally. Teacher reports like “Eastshore District Student Assessment” or “school developed reading assessment” or “my own skills assessment” were counted in these categories:
Ten percent of the assessment tools were identified as “district-developed”
Six percent of the assessment tools were identified as “school-developed”
About four percent of the assessment tools were reported as developed by individual teachers
Generic Descriptions Many of the descriptions of screening and assessment tools did not include enough information to determine the source. Included in this category were many generic descriptions such as, “counting to 20,” “reciting the alphabet,” or “recognizing first name in print.” Also counted as having “Source Not Identified” were descriptions such as “informal,” “observational,” or “classroom-based” assessment.
Figure 9 Sources of Screening/Assessment Tools
School Assessment
6%
Source Not Identified
39%
Teacher-developed
4% District Assessment
10%
Commercial41%
Student Readiness for Kindergarten November 2005 Office of Superintendent of Public Instruction 11
STUDENT CHARACTERISTICS AND PRIOR EXPERIENCES Teachers were asked about the extent of prior preschool or childcare experience and other factors that may affect student preparedness.
OVERVIEW Teachers were asked: The approximate PERCENT of incoming students…
who previously attended a preschool or childcare.
about whom they received records from or communicated with a preschool teacher or childcare provider.
about whom they received records from or had communication with family/parents. The approximate NUMBER of incoming students…
who were repeating kindergarten.
who were coming from an early childhood program (e.g., ECEAP or Head Start).
who were coming from a transitional kindergarten.
who already had an IEP when they entered kindergarten.
who already had a Section 504 Accommodation Plan when they entered kindergarten.
Who were referred for Oral Language Proficiency testing.
Who had pre-existing health problems, which interfered with their success in school.
Who were eligible for Free and Reduced-Price Meals.
Who were children (without an IEP or Section 504 plan) that the teacher did/will/would refer for special education services, due to developmental delay, behavior, speech/language, or other reasons.
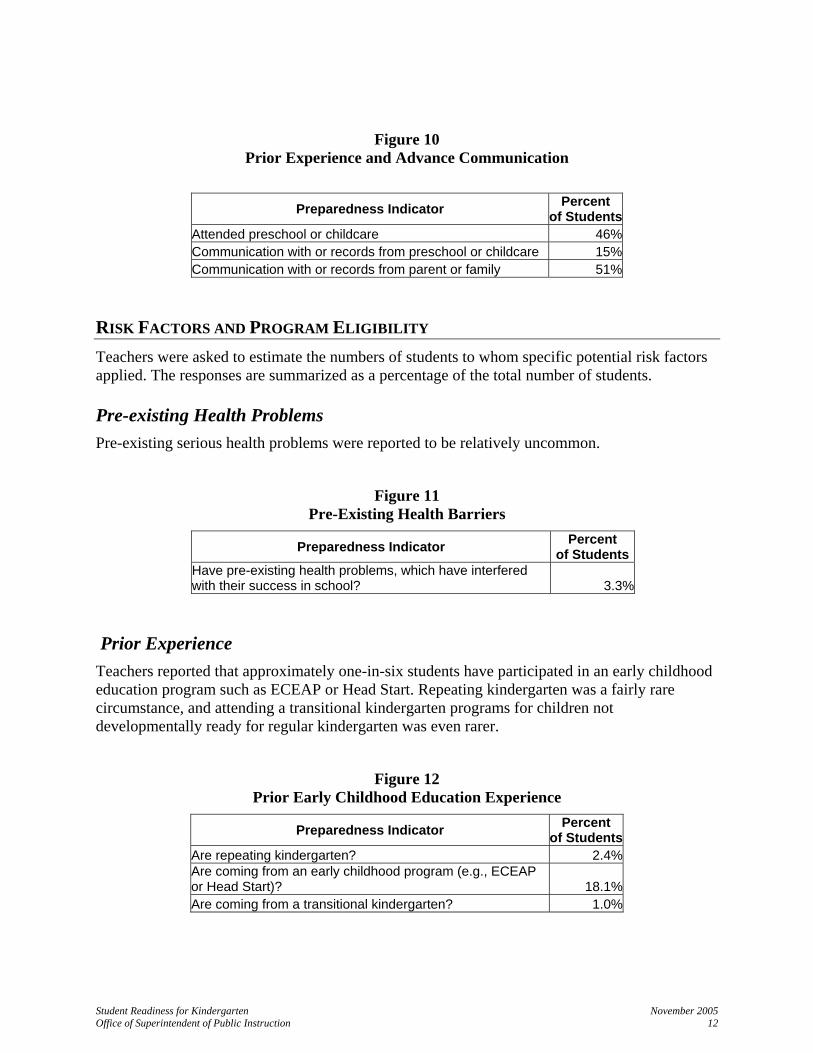
TRANSITION TO KINDERGARTEN/COMMUNICATION RECEIVED Teachers were asked about the percentage of children for whom they had received records or communication from prior care and education providers and parents. Responses indicated that teachers had relatively little information or communication about incoming students from prior providers of care or preschool. Teachers received communication from prior childcare or preschool providers for about one-third of the children who had previous providers of care. Teachers also indicated they have not had prior communication with many parents about their children—nearly half—before the child arrives in the classroom.
Student Readiness for Kindergarten November 2005 Office of Superintendent of Public Instruction 12
Figure 10 Prior Experience and Advance Communication
Preparedness Indicator Percent
of StudentsAttended preschool or childcare 46%Communication with or records from preschool or childcare 15%Communication with or records from parent or family 51%
RISK FACTORS AND PROGRAM ELIGIBILITY Teachers were asked to estimate the numbers of students to whom specific potential risk factors applied. The responses are summarized as a percentage of the total number of students.
Pre-existing Health Problems Pre-existing serious health problems were reported to be relatively uncommon.
Figure 11 Pre-Existing Health Barriers
Preparedness Indicator Percent of Students
Have pre-existing health problems, which have interfered with their success in school? 3.3%
Prior Experience Teachers reported that approximately one-in-six students have participated in an early childhood education program such as ECEAP or Head Start. Repeating kindergarten was a fairly rare circumstance, and attending a transitional kindergarten programs for children not developmentally ready for regular kindergarten was even rarer.
Figure 12 Prior Early Childhood Education Experience
Preparedness Indicator Percent of Students
Are repeating kindergarten? 2.4%Are coming from an early childhood program (e.g., ECEAP or Head Start)? 18.1%Are coming from a transitional kindergarten? 1.0%
Student Readiness for Kindergarten November 2005 Office of Superintendent of Public Instruction 13
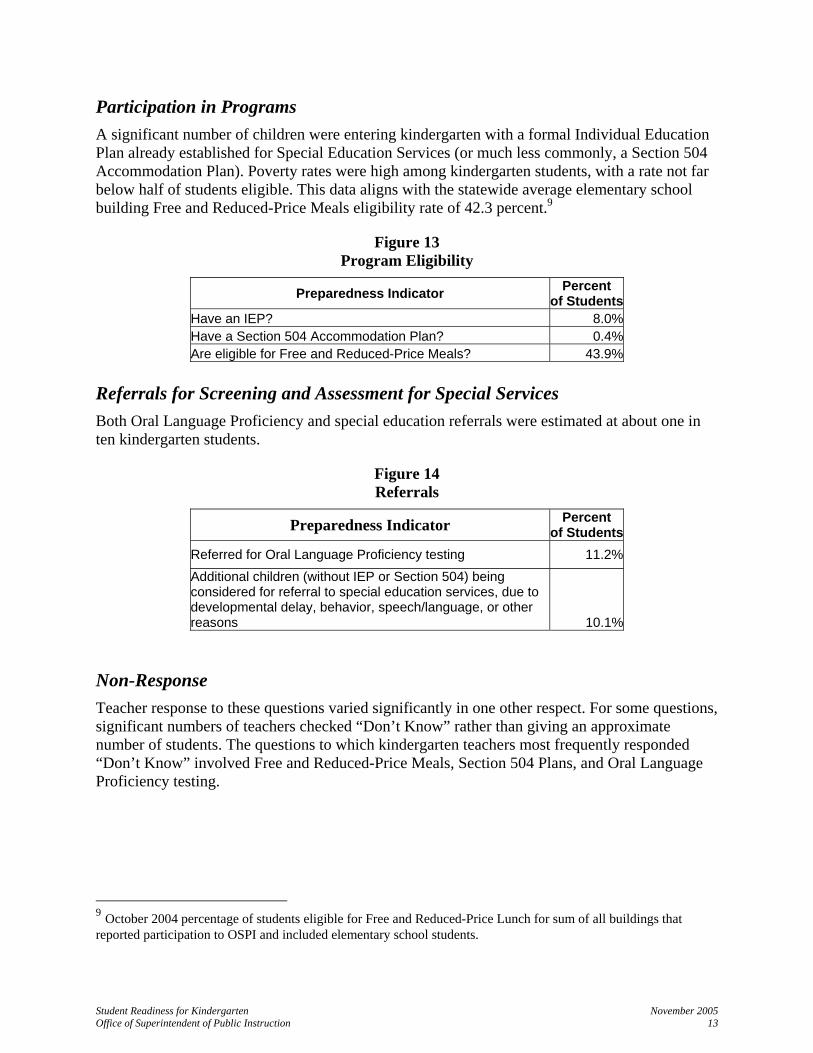
Participation in Programs A significant number of children were entering kindergarten with a formal Individual Education Plan already established for Special Education Services (or much less commonly, a Section 504 Accommodation Plan). Poverty rates were high among kindergarten students, with a rate not far below half of students eligible. This data aligns with the statewide average elementary school building Free and Reduced-Price Meals eligibility rate of 42.3 percent.9
Figure 13 Program Eligibility
Preparedness Indicator Percent of Students
Have an IEP? 8.0%Have a Section 504 Accommodation Plan? 0.4%Are eligible for Free and Reduced-Price Meals? 43.9%
Referrals for Screening and Assessment for Special Services Both Oral Language Proficiency and special education referrals were estimated at about one in ten kindergarten students.
Figure 14 Referrals
Preparedness Indicator Percent of Students
Referred for Oral Language Proficiency testing 11.2% Additional children (without IEP or Section 504) being considered for referral to special education services, due to developmental delay, behavior, speech/language, or other reasons 10.1%
Non-Response Teacher response to these questions varied significantly in one other respect. For some questions, significant numbers of teachers checked “Don’t Know” rather than giving an approximate number of students. The questions to which kindergarten teachers most frequently responded “Don’t Know” involved Free and Reduced-Price Meals, Section 504 Plans, and Oral Language Proficiency testing.
9 October 2004 percentage of students eligible for Free and Reduced-Price Lunch for sum of all buildings that reported participation to OSPI and included elementary school students.
Student Readiness for Kindergarten November 2005 Office of Superintendent of Public Instruction 14
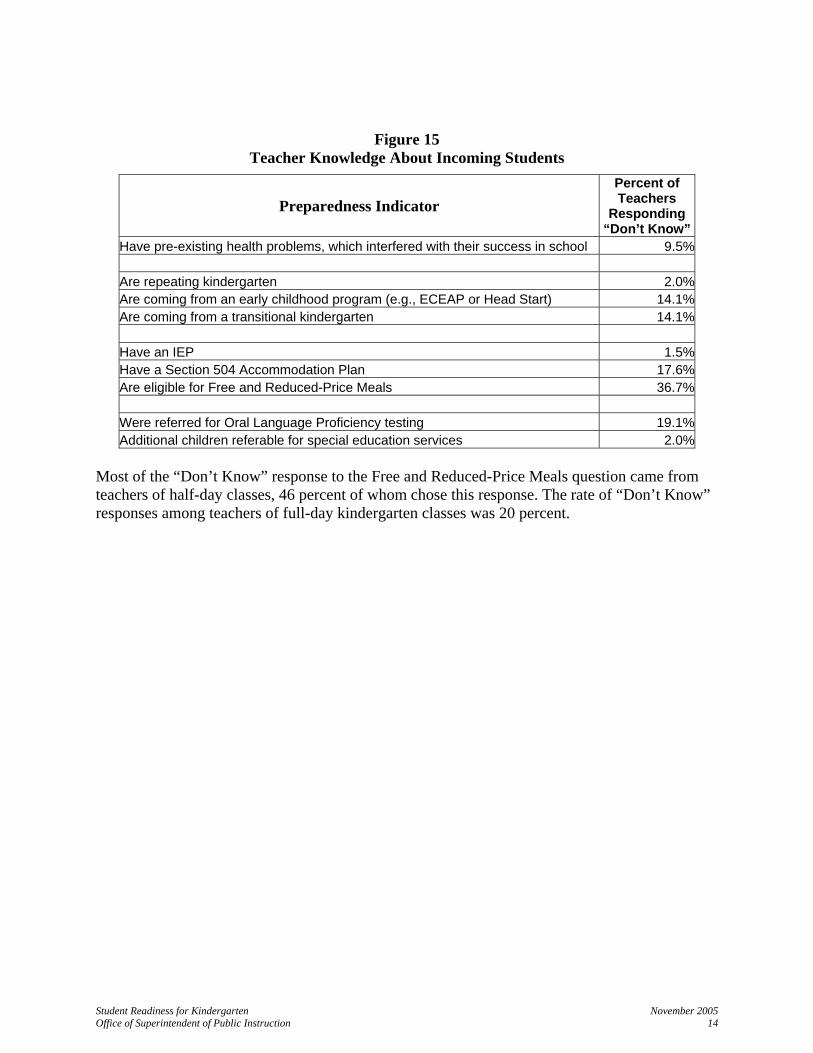
Figure 15 Teacher Knowledge About Incoming Students
Preparedness Indicator
Percent of Teachers
Responding “Don’t Know”
Have pre-existing health problems, which interfered with their success in school 9.5% Are repeating kindergarten 2.0%Are coming from an early childhood program (e.g., ECEAP or Head Start) 14.1%Are coming from a transitional kindergarten 14.1% Have an IEP 1.5%Have a Section 504 Accommodation Plan 17.6%Are eligible for Free and Reduced-Price Meals 36.7% Were referred for Oral Language Proficiency testing 19.1%Additional children referable for special education services 2.0%
Most of the “Don’t Know” response to the Free and Reduced-Price Meals question came from teachers of half-day classes, 46 percent of whom chose this response. The rate of “Don’t Know” responses among teachers of full-day kindergarten classes was 20 percent.
Student Readiness for Kindergarten November 2005 Office of Superintendent of Public Instruction 15
PREPAREDNESS The survey included both an overall question about how many students were prepared for kindergarten, as well as 24 specific preparedness questions across the five domains. The list of specific preparedness indicators included between three and eight indicators from each of the five identified domains:
Physical Well Being, Health, and Motor Development
Social and Emotional Development
Approaches Toward Learning
Cognition and General Knowledge
Language and Literacy The specific indicators used within those domains were:
Physical Well Being, Health, and Motor Development - Being physically healthy, rested, well-nourished
- Ability to walk, run, climb, balance (Large Motor)
- Ability to use manipulative materials such as table blocks, scissors, eating utensils, and puzzles (Small Motor)
- Demonstrating self-help skills
Social and Emotional Development - Ability to interact positively with other children: sharing, participating in group
activities, etc.
- Ability to use problem-solving skills in social situations
- Not being disruptive of the class
- Demonstrating self control/impulse control
Approaches Toward Learning - Demonstrating enthusiasm/curiosity when approaching new activities
- Finishing tasks
- Demonstrating age-appropriate attention span
Student Readiness for Kindergarten November 2005 Office of Superintendent of Public Instruction 16
Cognition and General Knowledge - Demonstrating a variety of problem-solving strategies
- Ability to count to 20 or more in their primary language
- Ability to order groups of objects
- Ability to form explanations based on observations and explorations
- Ability to sort, classify, and compare materials by attributes
Language and Literacy - Ability to follow directions
- Communicating needs, wants, and thoughts verbally in child’s primary language
- Use of complex sentence structures
- Knowing most of the letters of the alphabet
- Recognizing own name in print
- Ability to produce rhyming words
- Understanding and interpreting a story or other text read to him/her
- Demonstrating an understanding of the concepts of print
PREPAREDNESS DATA WAS ANALYZED THREE WAYS From the overall preparedness question
For each of the five domains, by averaging ratings for all the indicators in the domain
For each separate preparedness indicator
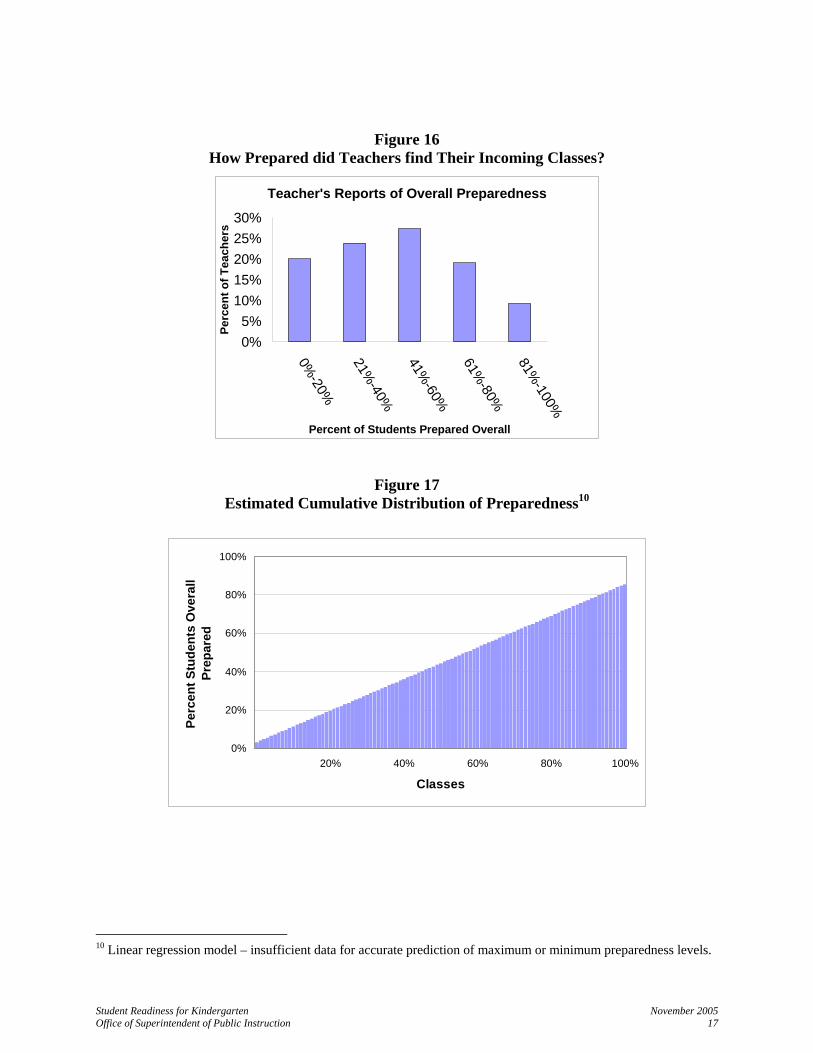
OVERALL PREPAREDNESS Based on teachers’ responses, the percentage of entering students who were prepared, overall, for kindergarten was 44 percent. As shown in Figure 16, only 9 percent of teachers reported that over 80 percent of their new students were adequately prepared. In contrast, roughly half of all teachers reported that less than half of their students were prepared for kindergarten overall.
Student Readiness for Kindergarten November 2005 Office of Superintendent of Public Instruction 17
Figure 16 How Prepared did Teachers find Their Incoming Classes?
Teacher's Reports of Overall Preparedness
0%5%
10%15%20%25%30%
0%-20%
21%-40%
41%-60%
61%-80%
81%-100%
Percent of Students Prepared Overall
Perc
ent o
f Tea
cher
s
Figure 17 Estimated Cumulative Distribution of Preparedness10
0%
20%
40%
60%
80%
100%
20% 40% 60% 80% 100%
Classes
Perc
ent S
tude
nts
Ove
rall
Prep
ared
10 Linear regression model – insufficient data for accurate prediction of maximum or minimum preparedness levels.
Student Readiness for Kindergarten November 2005 Office of Superintendent of Public Instruction 18
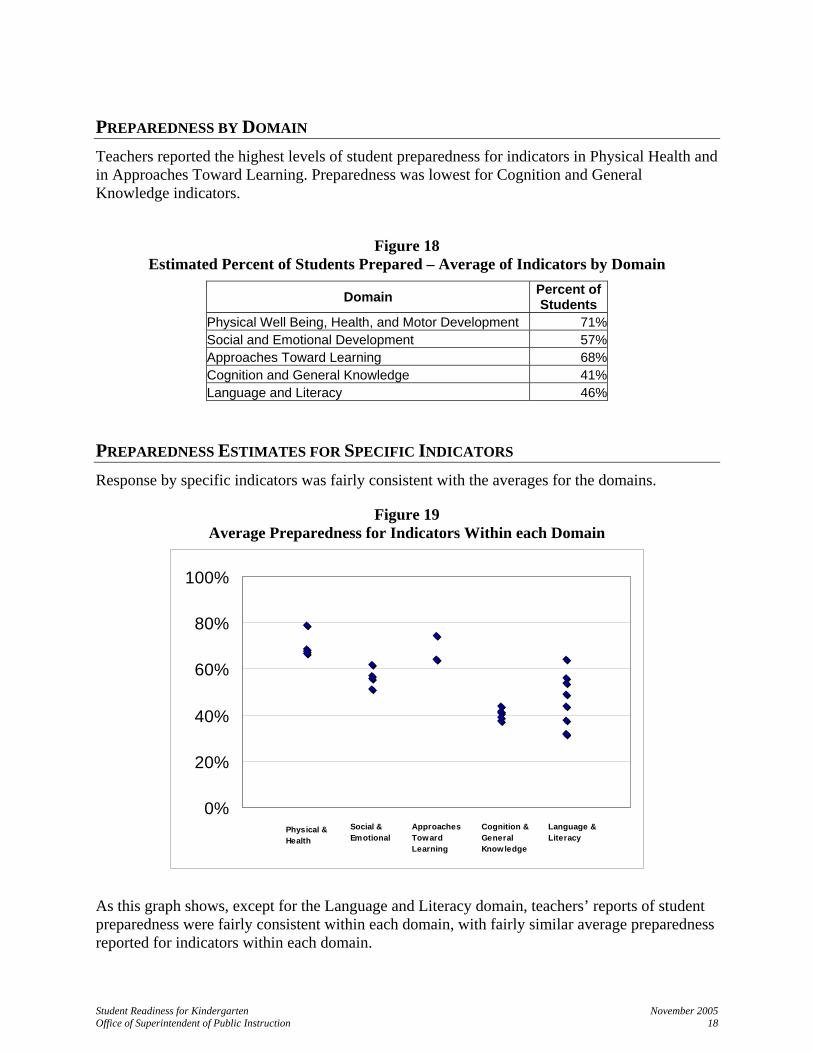
PREPAREDNESS BY DOMAIN Teachers reported the highest levels of student preparedness for indicators in Physical Health and in Approaches Toward Learning. Preparedness was lowest for Cognition and General Knowledge indicators.
Figure 18 Estimated Percent of Students Prepared – Average of Indicators by Domain
Domain Percent of Students
Physical Well Being, Health, and Motor Development 71%Social and Emotional Development 57%Approaches Toward Learning 68%Cognition and General Knowledge 41%Language and Literacy 46%
PREPAREDNESS ESTIMATES FOR SPECIFIC INDICATORS Response by specific indicators was fairly consistent with the averages for the domains.
Figure 19 Average Preparedness for Indicators Within each Domain
0%
20%
40%
60%
80%
100%
0 1 2 3 4 5 6
Social &Emotional
Approaches Toward Learning
Cognition & General Knowledge
Language & Literacy
Physical & Health
As this graph shows, except for the Language and Literacy domain, teachers’ reports of student preparedness were fairly consistent within each domain, with fairly similar average preparedness reported for indicators within each domain.
Student Readiness for Kindergarten November 2005 Office of Superintendent of Public Instruction 19
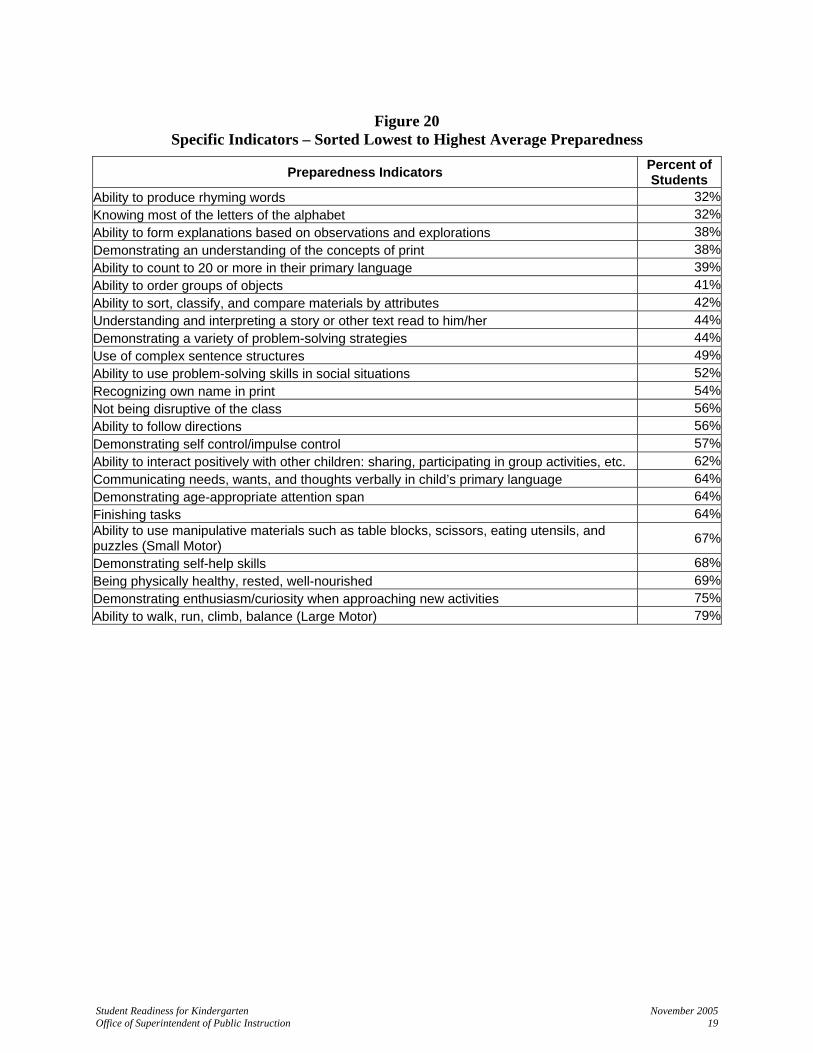
Figure 20 Specific Indicators – Sorted Lowest to Highest Average Preparedness
Preparedness Indicators Percent of Students
Ability to produce rhyming words 32%Knowing most of the letters of the alphabet 32%Ability to form explanations based on observations and explorations 38%Demonstrating an understanding of the concepts of print 38%Ability to count to 20 or more in their primary language 39%Ability to order groups of objects 41%Ability to sort, classify, and compare materials by attributes 42%Understanding and interpreting a story or other text read to him/her 44%Demonstrating a variety of problem-solving strategies 44%Use of complex sentence structures 49%Ability to use problem-solving skills in social situations 52%Recognizing own name in print 54%Not being disruptive of the class 56%Ability to follow directions 56%Demonstrating self control/impulse control 57%Ability to interact positively with other children: sharing, participating in group activities, etc. 62%Communicating needs, wants, and thoughts verbally in child’s primary language 64%Demonstrating age-appropriate attention span 64%Finishing tasks 64%Ability to use manipulative materials such as table blocks, scissors, eating utensils, and puzzles (Small Motor) 67%
Demonstrating self-help skills 68%Being physically healthy, rested, well-nourished 69%Demonstrating enthusiasm/curiosity when approaching new activities 75%Ability to walk, run, climb, balance (Large Motor) 79%
Student Readiness for Kindergarten November 2005 Office of Superintendent of Public Instruction 20
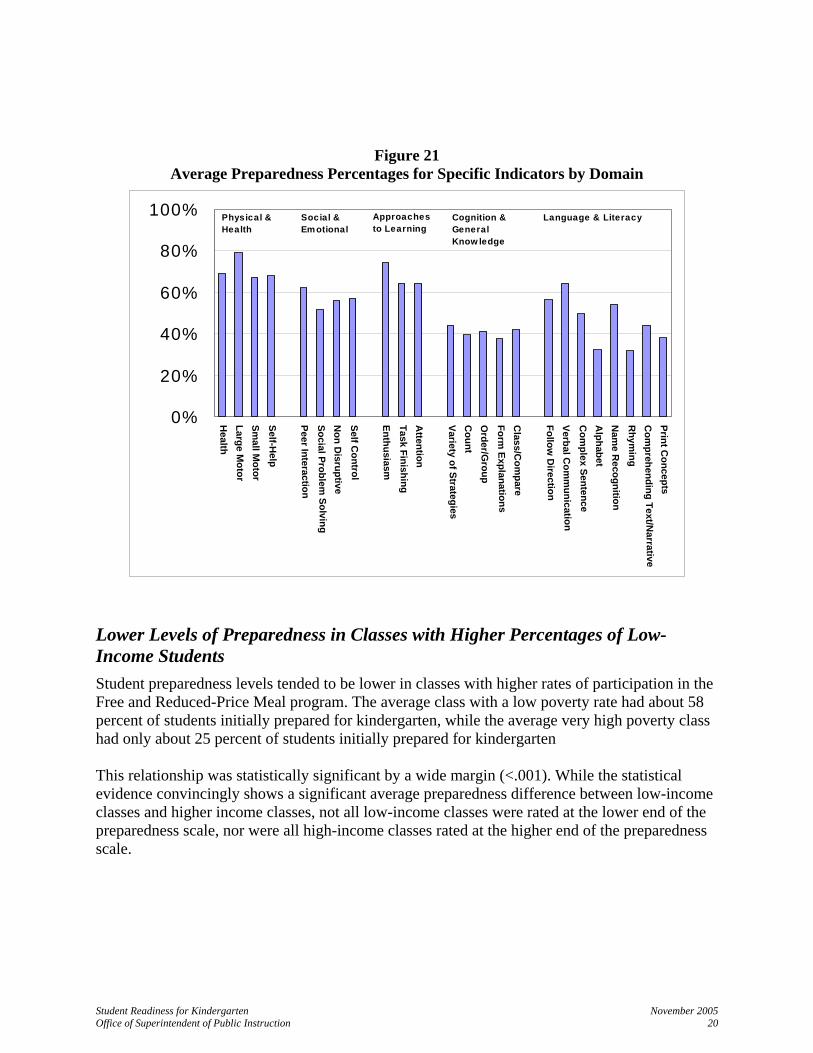
Figure 21 Average Preparedness Percentages for Specific Indicators by Domain
0%
20%
40%
60%
80%
100%
Heal th
L arge Motor
S mall M
o to r Sel f -H
el p
Pee r I nteract io n S oci al P ro bl em
S ol vin g N
on Di srup ti ve
Sel f Cont rol
Enthu sia sm
Ta sk F in ish in g A
ttent i on
V arie ty of St rategi es C
oun t O
rder/ Grou p
Form Exp lan at ion s
Cl ass/ C
ompare
Fo ll ow D
i re ct ion V erbal C
omm
uni cat i on C
omp lex S entence
Al phab et
Nam
e Re cogn it i on
Rhym
in g C
o mprehen di ng Text / N
a rrat i ve Pri nt C
onc epts
Social &Em otional
Approaches to Learning
Cognition & General Know ledge
Language & LiteracyPhysical & Health
Lower Levels of Preparedness in Classes with Higher Percentages of Low-Income Students Student preparedness levels tended to be lower in classes with higher rates of participation in the Free and Reduced-Price Meal program. The average class with a low poverty rate had about 58 percent of students initially prepared for kindergarten, while the average very high poverty class had only about 25 percent of students initially prepared for kindergarten This relationship was statistically significant by a wide margin (<.001). While the statistical evidence convincingly shows a significant average preparedness difference between low-income classes and higher income classes, not all low-income classes were rated at the lower end of the preparedness scale, nor were all high-income classes rated at the higher end of the preparedness scale.
Student Readiness for Kindergarten November 2005 Office of Superintendent of Public Instruction 21
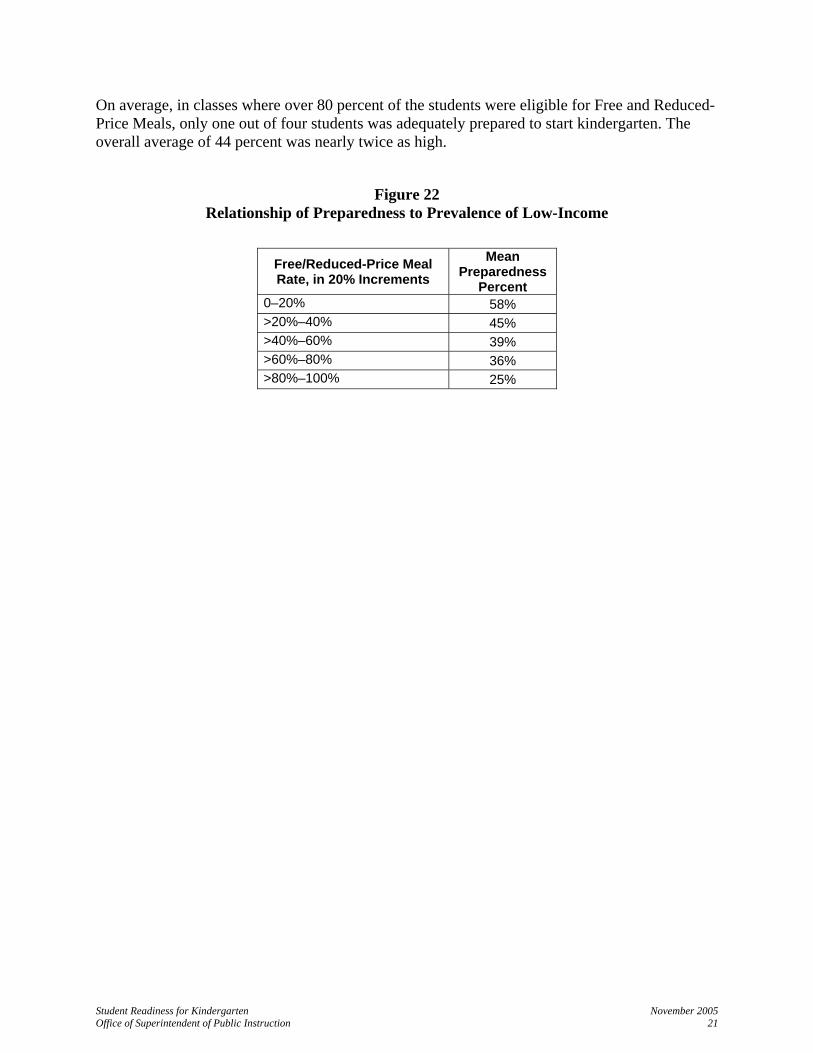
On average, in classes where over 80 percent of the students were eligible for Free and Reduced-Price Meals, only one out of four students was adequately prepared to start kindergarten. The overall average of 44 percent was nearly twice as high.
Figure 22 Relationship of Preparedness to Prevalence of Low-Income
Free/Reduced-Price Meal Rate, in 20% Increments
Mean Preparedness
Percent 0–20% 58% >20%–40% 45% >40%–60% 39% >60%–80% 36% >80%–100% 25%
Student Readiness for Kindergarten November 2005 Office of Superintendent of Public Instruction 22
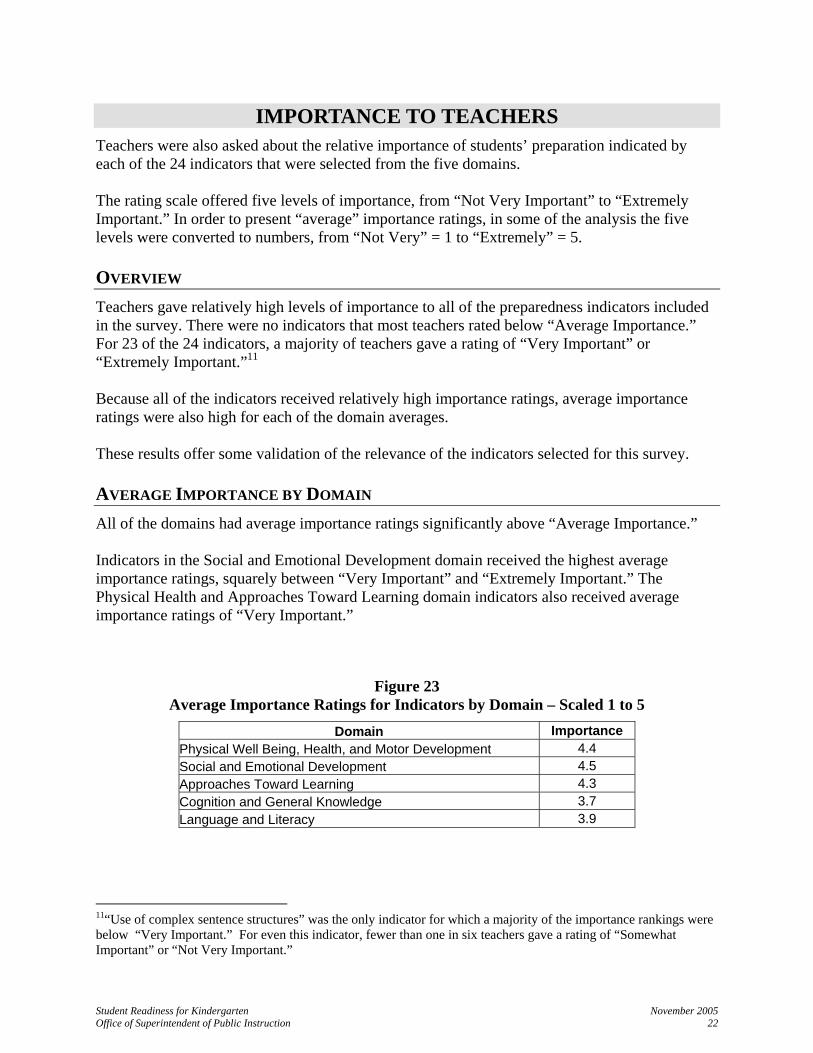
IMPORTANCE TO TEACHERS Teachers were also asked about the relative importance of students’ preparation indicated by each of the 24 indicators that were selected from the five domains. The rating scale offered five levels of importance, from “Not Very Important” to “Extremely Important.” In order to present “average” importance ratings, in some of the analysis the five levels were converted to numbers, from “Not Very” = 1 to “Extremely” = 5.
OVERVIEW Teachers gave relatively high levels of importance to all of the preparedness indicators included in the survey. There were no indicators that most teachers rated below “Average Importance.” For 23 of the 24 indicators, a majority of teachers gave a rating of “Very Important” or “Extremely Important.”11 Because all of the indicators received relatively high importance ratings, average importance ratings were also high for each of the domain averages. These results offer some validation of the relevance of the indicators selected for this survey.
AVERAGE IMPORTANCE BY DOMAIN All of the domains had average importance ratings significantly above “Average Importance.” Indicators in the Social and Emotional Development domain received the highest average importance ratings, squarely between “Very Important” and “Extremely Important.” The Physical Health and Approaches Toward Learning domain indicators also received average importance ratings of “Very Important.”
Figure 23 Average Importance Ratings for Indicators by Domain – Scaled 1 to 5
Domain Importance Physical Well Being, Health, and Motor Development 4.4 Social and Emotional Development 4.5 Approaches Toward Learning 4.3 Cognition and General Knowledge 3.7 Language and Literacy 3.9
11“Use of complex sentence structures” was the only indicator for which a majority of the importance rankings were below “Very Important.” For even this indicator, fewer than one in six teachers gave a rating of “Somewhat Important” or “Not Very Important.”
Student Readiness for Kindergarten November 2005 Office of Superintendent of Public Instruction 23
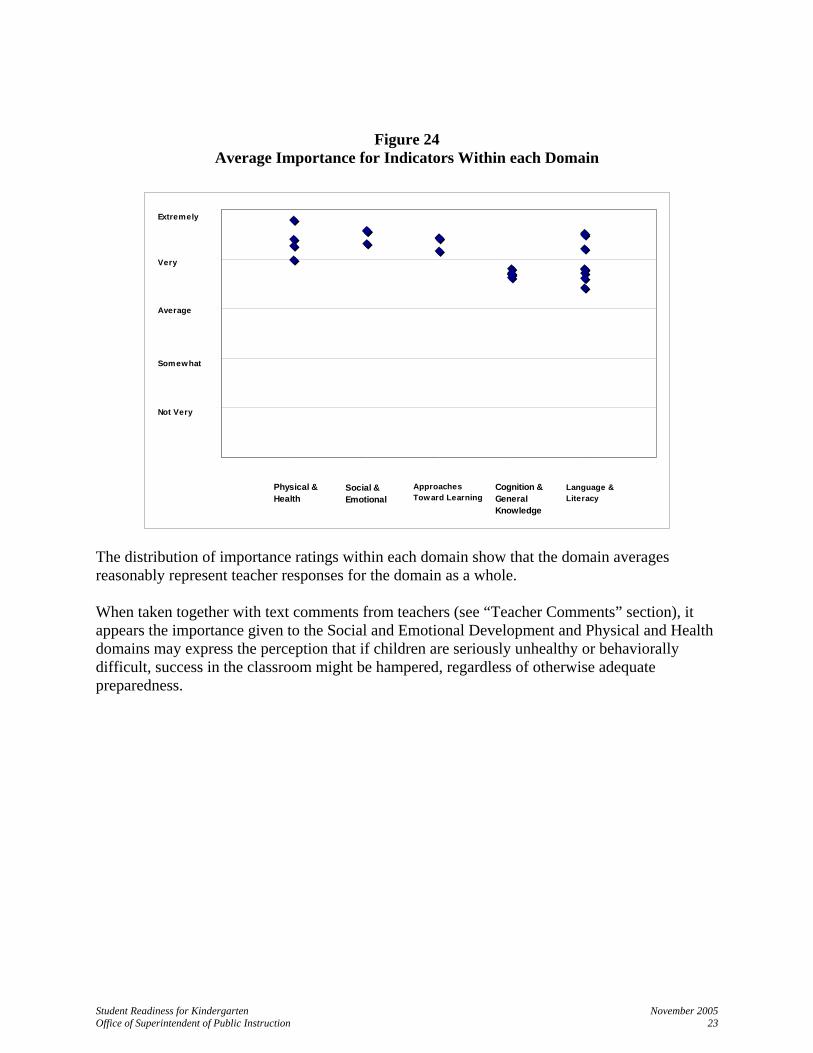
Figure 24 Average Importance for Indicators Within each Domain
0
1
2
3
4
5
0 1 2 3 4 5 6
Physical & Health
Social &Emotional
Approaches Toward Learning
Cognition & General Knowledge
Language & Literacy
Extremely
Very
Average
Somewhat
Not Very
The distribution of importance ratings within each domain show that the domain averages reasonably represent teacher responses for the domain as a whole. When taken together with text comments from teachers (see “Teacher Comments” section), it appears the importance given to the Social and Emotional Development and Physical and Health domains may express the perception that if children are seriously unhealthy or behaviorally difficult, success in the classroom might be hampered, regardless of otherwise adequate preparedness.
Student Readiness for Kindergarten November 2005 Office of Superintendent of Public Instruction 24
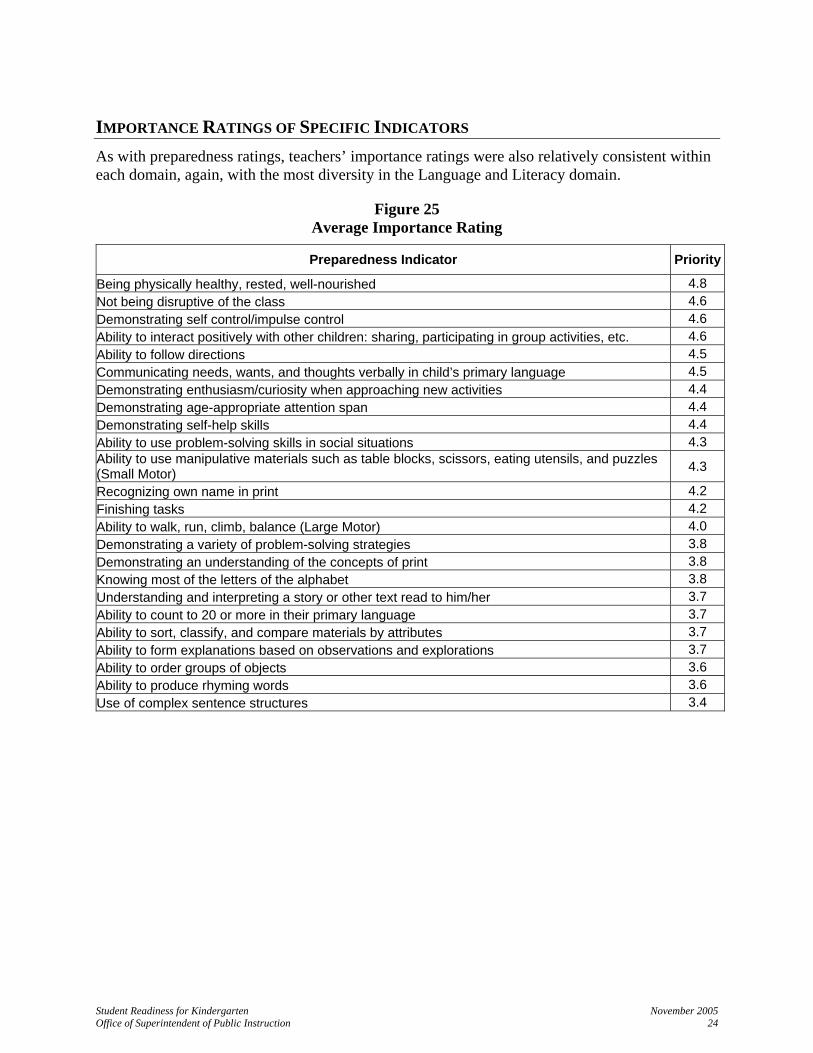
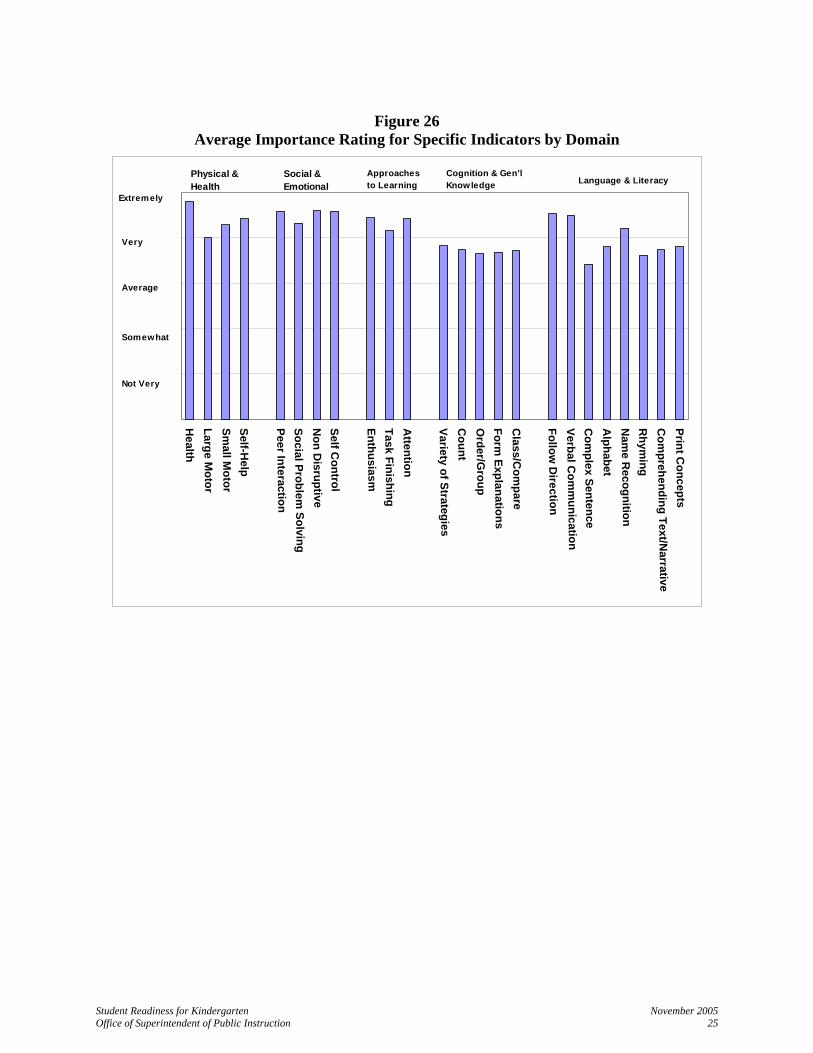
IMPORTANCE RATINGS OF SPECIFIC INDICATORS As with preparedness ratings, teachers’ importance ratings were also relatively consistent within each domain, again, with the most diversity in the Language and Literacy domain.
Figure 25 Average Importance Rating
Preparedness Indicator Priority
Being physically healthy, rested, well-nourished 4.8 Not being disruptive of the class 4.6 Demonstrating self control/impulse control 4.6 Ability to interact positively with other children: sharing, participating in group activities, etc. 4.6 Ability to follow directions 4.5 Communicating needs, wants, and thoughts verbally in child’s primary language 4.5 Demonstrating enthusiasm/curiosity when approaching new activities 4.4 Demonstrating age-appropriate attention span 4.4 Demonstrating self-help skills 4.4 Ability to use problem-solving skills in social situations 4.3 Ability to use manipulative materials such as table blocks, scissors, eating utensils, and puzzles (Small Motor) 4.3
Recognizing own name in print 4.2 Finishing tasks 4.2 Ability to walk, run, climb, balance (Large Motor) 4.0 Demonstrating a variety of problem-solving strategies 3.8 Demonstrating an understanding of the concepts of print 3.8 Knowing most of the letters of the alphabet 3.8 Understanding and interpreting a story or other text read to him/her 3.7 Ability to count to 20 or more in their primary language 3.7 Ability to sort, classify, and compare materials by attributes 3.7 Ability to form explanations based on observations and explorations 3.7 Ability to order groups of objects 3.6 Ability to produce rhyming words 3.6 Use of complex sentence structures 3.4
Student Readiness for Kindergarten November 2005 Office of Superintendent of Public Instruction 25
Figure 26 Average Importance Rating for Specific Indicators by Domain
0
1
2
3
4
5
Hea lth
La rge Mo tor
Smal l M
o to r Se lf-H
elp
Pee r In te raction Soc ia l P rob le m
So lv in g N
on Disru ptive
Sel f Con trol
En thu siasm
Tas k Finis hing A
tten tio n
Variety of S tra tegies C
ou nt O
rde r/Gro up
Fo rm Ex plan atio ns
Clas s/C
omp are
F ol low D
i rec tio n Verb al C
omm
un ication C
omp lex Sen te nc e
Alp ha be t
Nam
e Rec og ni tio n
Rh ym
in g C
ompre he nd in g Te xt/N
a rrative P rint C
o nc ep ts
Physical & Health
Social &Emotional
Extremely
Very
Average
Somewhat
Not Very
Approaches to Learning
Cognition & Gen'l Knowledge Language & Literacy

Student Readiness for Kindergarten November 2005 Office of Superintendent of Public Instruction 26
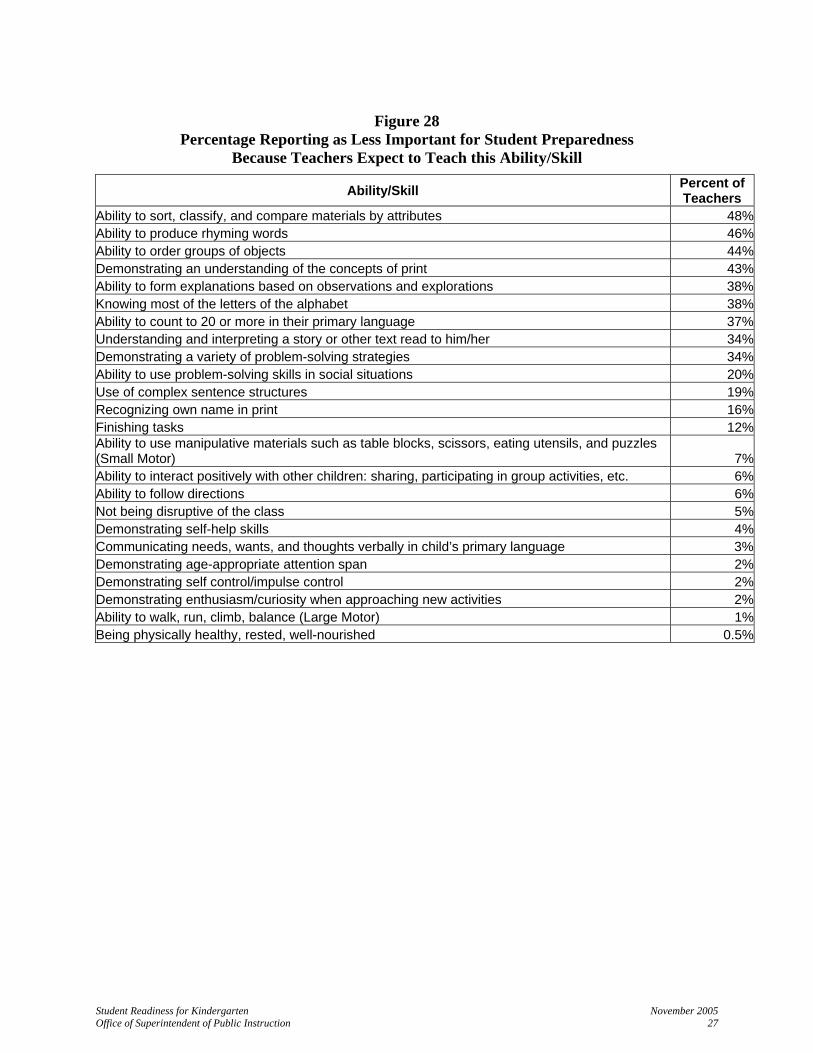
WHAT DO TEACHERS EXPECT TO TEACH? The survey also gave teachers the option of responding that a particular preparedness indicator was “less important” because they “expected to teach” that ability or skill. The frequency with which teachers chose that option varied greatly among the 24 specific preparedness indicators. Most of the indicators that teachers reported as “less important because (they) expected to teach” were in the domains of Cognition and General Knowledge or Language and Literacy. The exceptions from other domains were social problem solving and finishing tasks, which 10 percent or more “expected to teach.” Conversely, there were two indicators from Language and Literacy that few teachers expected to teach: verbal communication and following directions.
Figure 27 Percentage Reporting Indicator as Less Important for Student Preparedness
Because Teachers Expect to Teach This Ability/Skill
0%
10%
20%
30%
40%
50%
Physical/Health
Large Motor
Small M
otor
Self Help
Peer Interaction
Social Problem Solving
Non D
isruptive
Self/Impulse C
ontrol
Enthusiasm/C
uriosity
Finish Tasks
Attention
Variety of Strategies
Count to 20
Order/G
roup Objects
Form Explanations
Classify &
Com
pare
Follow D
irections
Com
municate Verbally
Com
plex Sentences
Alphabet
Recognize O
wn N
ame
Produces Rhym
ing Words
Understand N
arrative/Text
Print Concepts
Social & Emotional
Approaches to Learning
Language & LiteracyCognition & General Knowledge
Physical & Health
Student Readiness for Kindergarten November 2005 Office of Superintendent of Public Instruction 27
Figure 28 Percentage Reporting as Less Important for Student Preparedness
Because Teachers Expect to Teach this Ability/Skill
Ability/Skill Percent of Teachers
Ability to sort, classify, and compare materials by attributes 48%Ability to produce rhyming words 46%Ability to order groups of objects 44%Demonstrating an understanding of the concepts of print 43%Ability to form explanations based on observations and explorations 38%Knowing most of the letters of the alphabet 38%Ability to count to 20 or more in their primary language 37%Understanding and interpreting a story or other text read to him/her 34%Demonstrating a variety of problem-solving strategies 34%Ability to use problem-solving skills in social situations 20%Use of complex sentence structures 19%Recognizing own name in print 16%Finishing tasks 12%Ability to use manipulative materials such as table blocks, scissors, eating utensils, and puzzles (Small Motor) 7%Ability to interact positively with other children: sharing, participating in group activities, etc. 6%Ability to follow directions 6%Not being disruptive of the class 5%Demonstrating self-help skills 4%Communicating needs, wants, and thoughts verbally in child’s primary language 3%Demonstrating age-appropriate attention span 2%Demonstrating self control/impulse control 2%Demonstrating enthusiasm/curiosity when approaching new activities 2%Ability to walk, run, climb, balance (Large Motor) 1%Being physically healthy, rested, well-nourished 0.5%
Student Readiness for Kindergarten November 2005 Office of Superintendent of Public Instruction 28
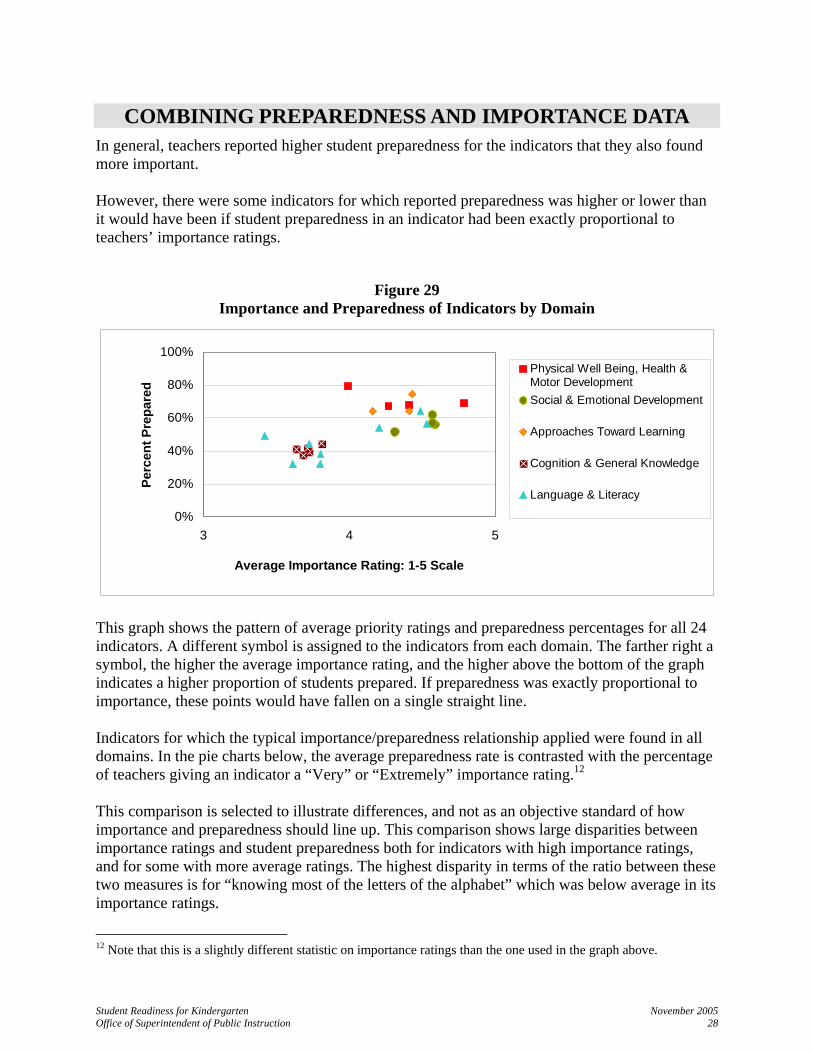
COMBINING PREPAREDNESS AND IMPORTANCE DATA In general, teachers reported higher student preparedness for the indicators that they also found more important. However, there were some indicators for which reported preparedness was higher or lower than it would have been if student preparedness in an indicator had been exactly proportional to teachers’ importance ratings.
Figure 29 Importance and Preparedness of Indicators by Domain
0%
20%
40%
60%
80%
100%
3 4 5
Average Importance Rating: 1-5 Scale
Perc
ent P
repa
red
Physical Well Being, Health &Motor Development Social & Emotional Development
Approaches Toward Learning
Cognition & General Knowledge
Language & Literacy
This graph shows the pattern of average priority ratings and preparedness percentages for all 24 indicators. A different symbol is assigned to the indicators from each domain. The farther right a symbol, the higher the average importance rating, and the higher above the bottom of the graph indicates a higher proportion of students prepared. If preparedness was exactly proportional to importance, these points would have fallen on a single straight line. Indicators for which the typical importance/preparedness relationship applied were found in all domains. In the pie charts below, the average preparedness rate is contrasted with the percentage of teachers giving an indicator a “Very” or “Extremely” importance rating.12 This comparison is selected to illustrate differences, and not as an objective standard of how importance and preparedness should line up. This comparison shows large disparities between importance ratings and student preparedness both for indicators with high importance ratings, and for some with more average ratings. The highest disparity in terms of the ratio between these two measures is for “knowing most of the letters of the alphabet” which was below average in its importance ratings.
12 Note that this is a slightly different statistic on importance ratings than the one used in the graph above.
Student Readiness for Kindergarten November 2005 Office of Superintendent of Public Instruction 29
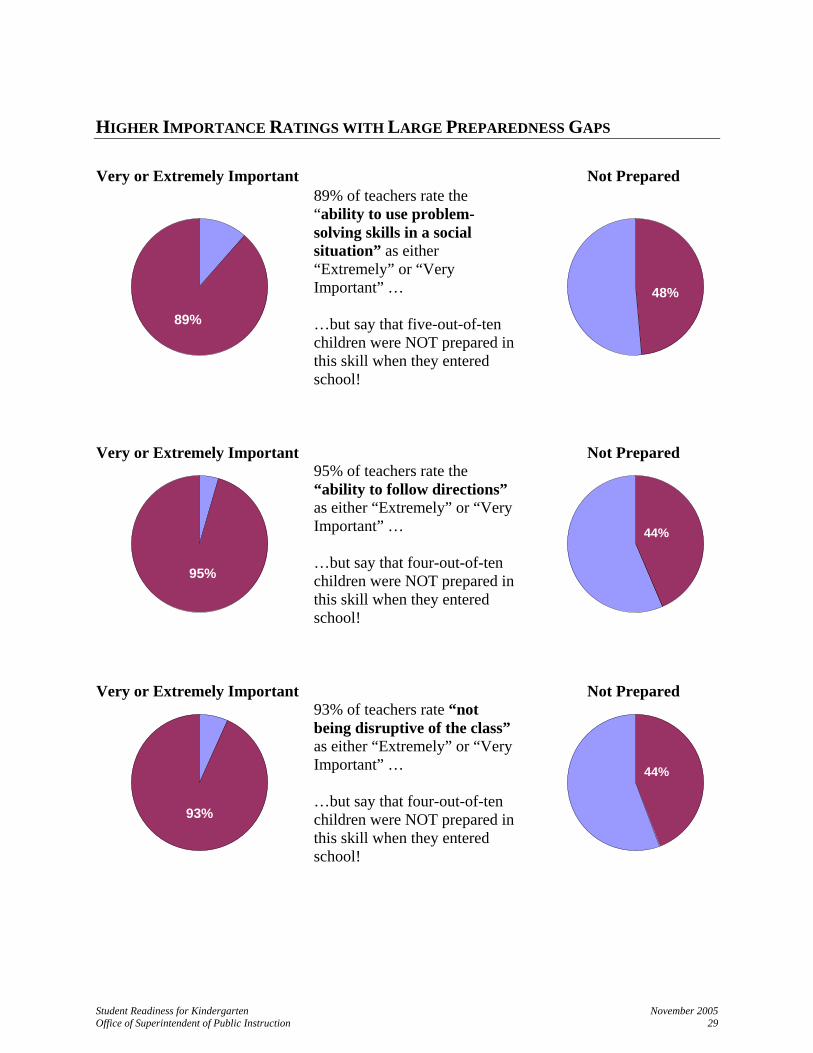
HIGHER IMPORTANCE RATINGS WITH LARGE PREPAREDNESS GAPS Very or Extremely Important Not Prepared
11%
89%
89% of teachers rate the “ability to use problem-solving skills in a social situation” as either “Extremely” or “Very Important” … …but say that five-out-of-ten children were NOT prepared in this skill when they entered school!
Prepared52%
48%
Very or Extremely Important
Not Prepared
95%
95% of teachers rate the “ability to follow directions” as either “Extremely” or “Very Important” … …but say that four-out-of-ten children were NOT prepared in this skill when they entered school!
44%56%
Very or Extremely Important
Not Prepared
93%
93% of teachers rate “not being disruptive of the class” as either “Extremely” or “Very Important” … …but say that four-out-of-ten children were NOT prepared in this skill when they entered school!
56% 44%
Student Readiness for Kindergarten November 2005 Office of Superintendent of Public Instruction 30
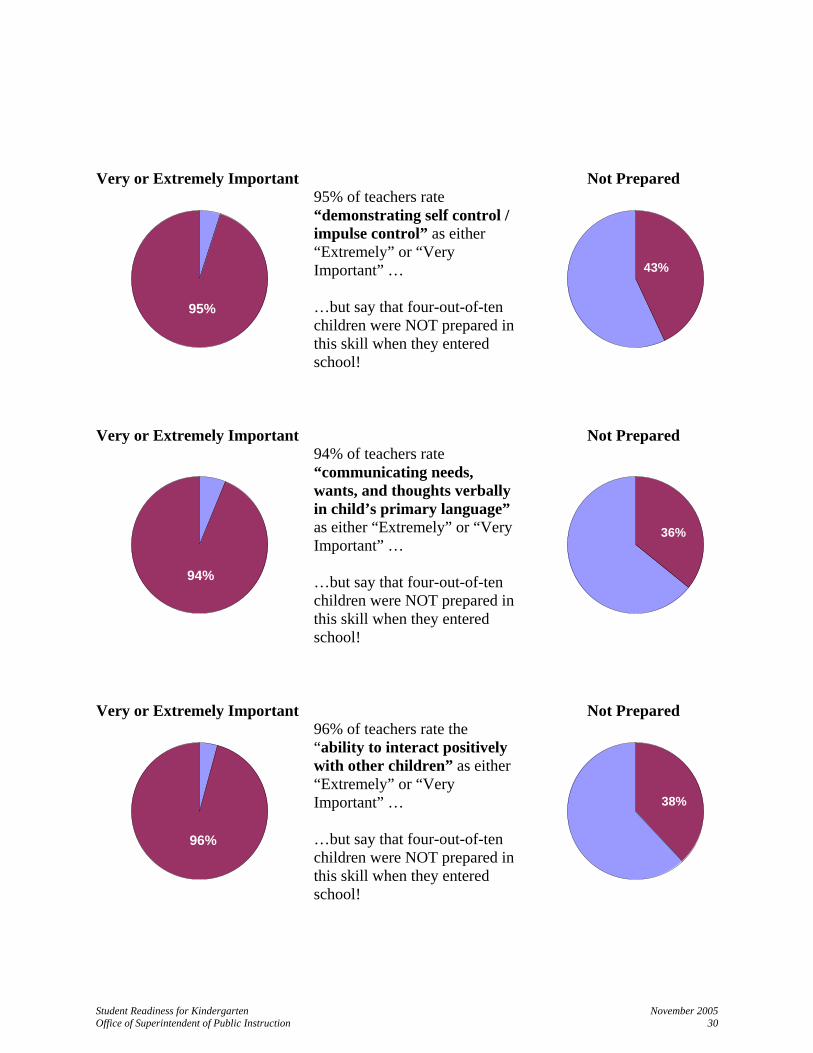
Very or Extremely Important
Not Prepared
95%
95% of teachers rate “demonstrating self control / impulse control” as either “Extremely” or “Very Important” … …but say that four-out-of-ten children were NOT prepared in this skill when they entered school!
43%57%
Very or Extremely Important
Not Prepared
94%
94% of teachers rate “communicating needs, wants, and thoughts verbally in child’s primary language” as either “Extremely” or “Very Important” … …but say that four-out-of-ten children were NOT prepared in this skill when they entered school!
64%
36%
Very or Extremely Important
Not Prepared
96%
96% of teachers rate the “ability to interact positively with other children” as either “Extremely” or “Very Important” … …but say that four-out-of-ten children were NOT prepared in this skill when they entered school!
38%62%
Student Readiness for Kindergarten November 2005 Office of Superintendent of Public Instruction 31
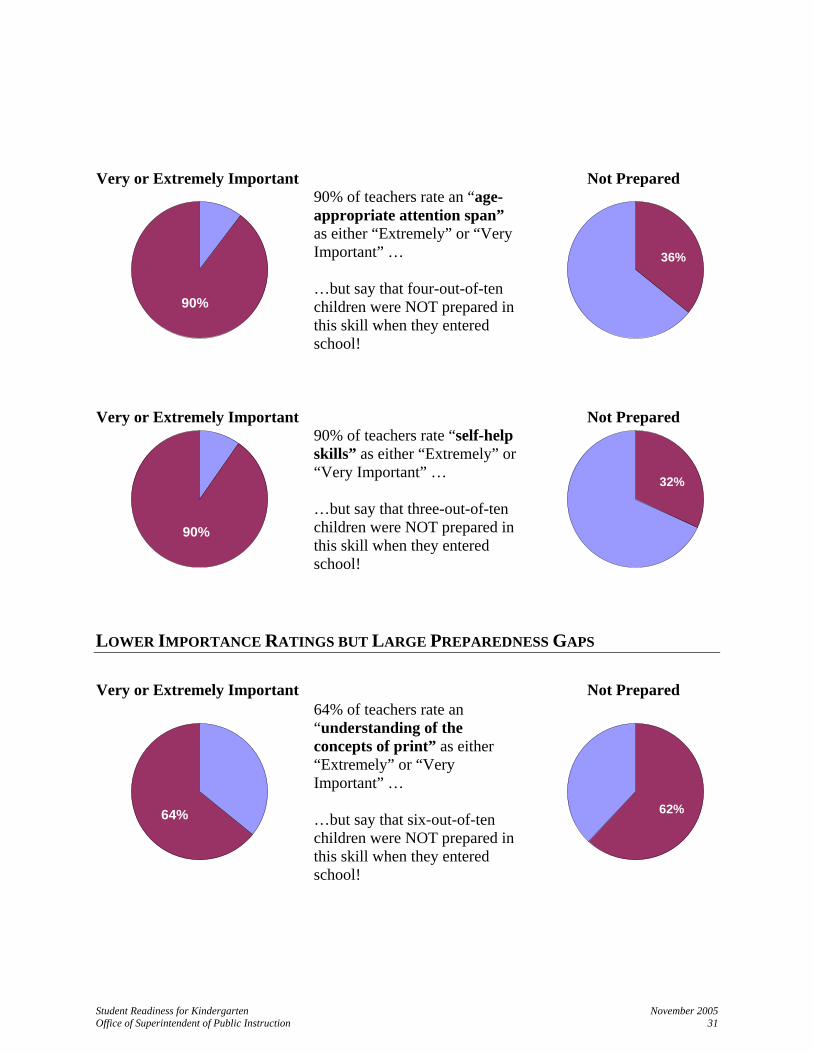
Very or Extremely Important
Not Prepared
90%
90% of teachers rate an “age-appropriate attention span” as either “Extremely” or “Very Important” … …but say that four-out-of-ten children were NOT prepared in this skill when they entered school!
64%
36%
Very or Extremely Important
Not Prepared
90%
90% of teachers rate “self-help skills” as either “Extremely” or “Very Important” … …but say that three-out-of-ten children were NOT prepared in this skill when they entered school!
32%
68%
LOWER IMPORTANCE RATINGS BUT LARGE PREPAREDNESS GAPS Very or Extremely Important Not Prepared
36%
64%
64% of teachers rate an “understanding of the concepts of print” as either “Extremely” or “Very Important” … …but say that six-out-of-ten children were NOT prepared in this skill when they entered school!
62%
38%
Student Readiness for Kindergarten November 2005 Office of Superintendent of Public Instruction 32
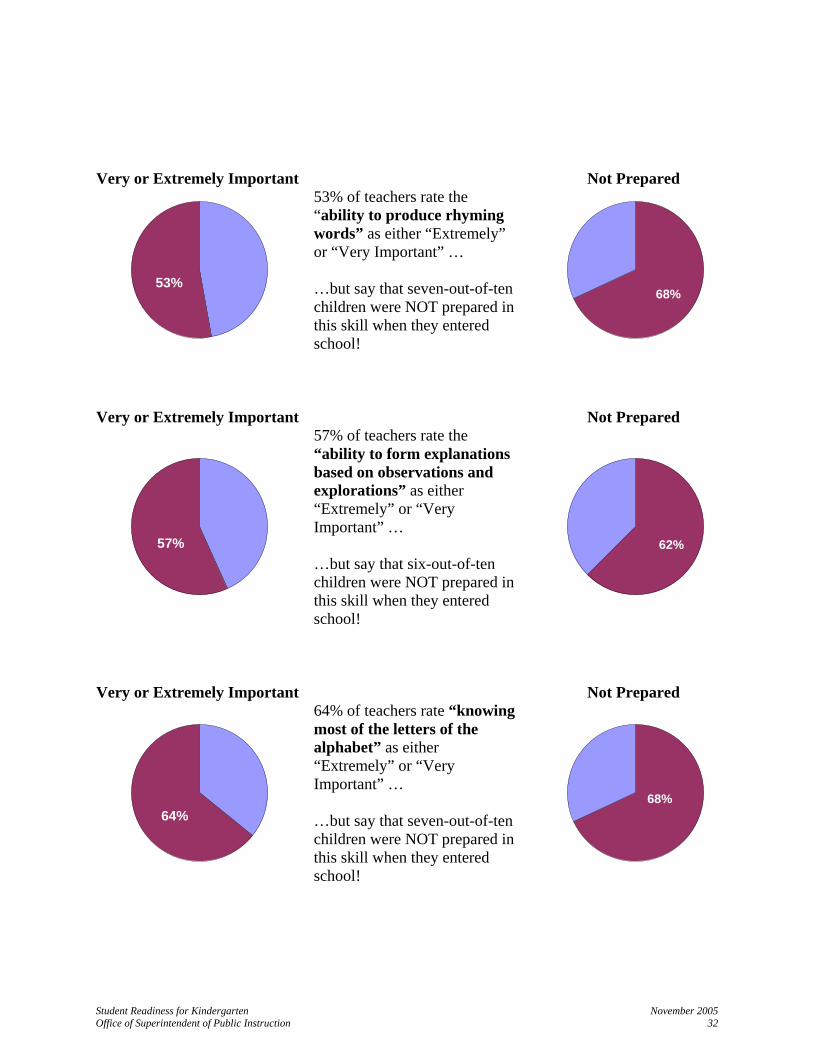
Very or Extremely Important
Not Prepared
47%53%
53% of teachers rate the “ability to produce rhyming words” as either “Extremely” or “Very Important” … …but say that seven-out-of-ten children were NOT prepared in this skill when they entered school!
68%
32%
Very or Extremely Important
Not Prepared
43%
57%
57% of teachers rate the “ability to form explanations based on observations and explorations” as either “Extremely” or “Very Important” … …but say that six-out-of-ten children were NOT prepared in this skill when they entered school!
62%
38%
Very or Extremely Important
Not Prepared
36%
64%
64% of teachers rate “knowing most of the letters of the alphabet” as either “Extremely” or “Very Important” … …but say that seven-out-of-ten children were NOT prepared in this skill when they entered school!
32%
68%
Student Readiness for Kindergarten November 2005 Office of Superintendent of Public Instruction 33
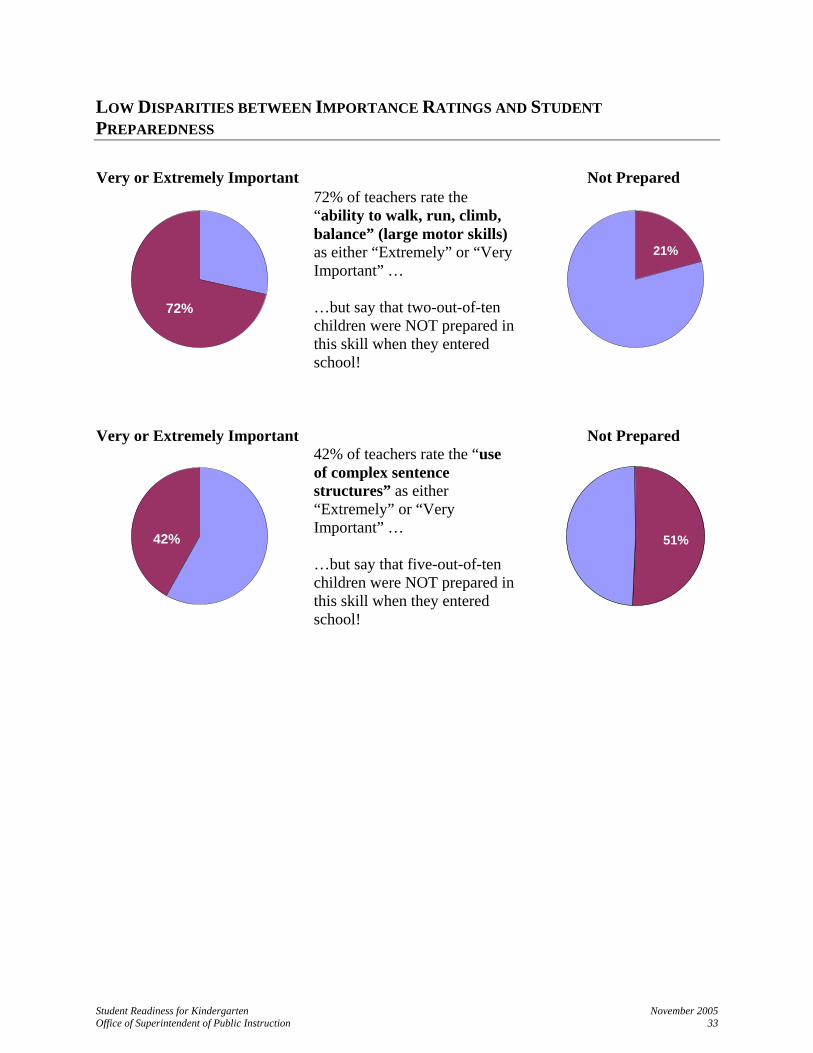
LOW DISPARITIES BETWEEN IMPORTANCE RATINGS AND STUDENT PREPAREDNESS Very or Extremely Important Not Prepared
28%
72%
72% of teachers rate the “ability to walk, run, climb, balance” (large motor skills) as either “Extremely” or “Very Important” … …but say that two-out-of-ten children were NOT prepared in this skill when they entered school!
21%
79%
Very or Extremely Important
Not Prepared
58%42%
42% of teachers rate the “use of complex sentence structures” as either “Extremely” or “Very Important” … …but say that five-out-of-ten children were NOT prepared in this skill when they entered school!
51%
49%

Student Readiness for Kindergarten November 2005 Office of Superintendent of Public Instruction 34
TEACHER EXPERIENCE Teachers were asked how much experience they had teaching at different levels. On average, respondents had almost 15 years of teaching experience, mostly at the primary level. Over one-third also had experience teaching at the preschool level, with an average of over 5 years among those with that experience. Only one percent of the responses came from teachers in their first year, and only an additional one percent were experienced teachers who had not previously taught primary grades.
Figure 30 Professional Experience of Responding Teachers
Grade Level Percent
Experienced by Level
Average Years
ExperiencePreschool 39% 5.4Primary 98% 11.8Intermediate 27% 3.4Secondary 7% 4.0Total 99% 14.9
Note that the averages by level do not add to the overall average. This is because the averages were calculated only among those teachers who had some experience at a particular level. For example, only 7 percent of all respondents had experience in secondary teaching, but among those who did, they averaged four years secondary teaching.
Student Readiness for Kindergarten November 2005 Office of Superintendent of Public Instruction 35
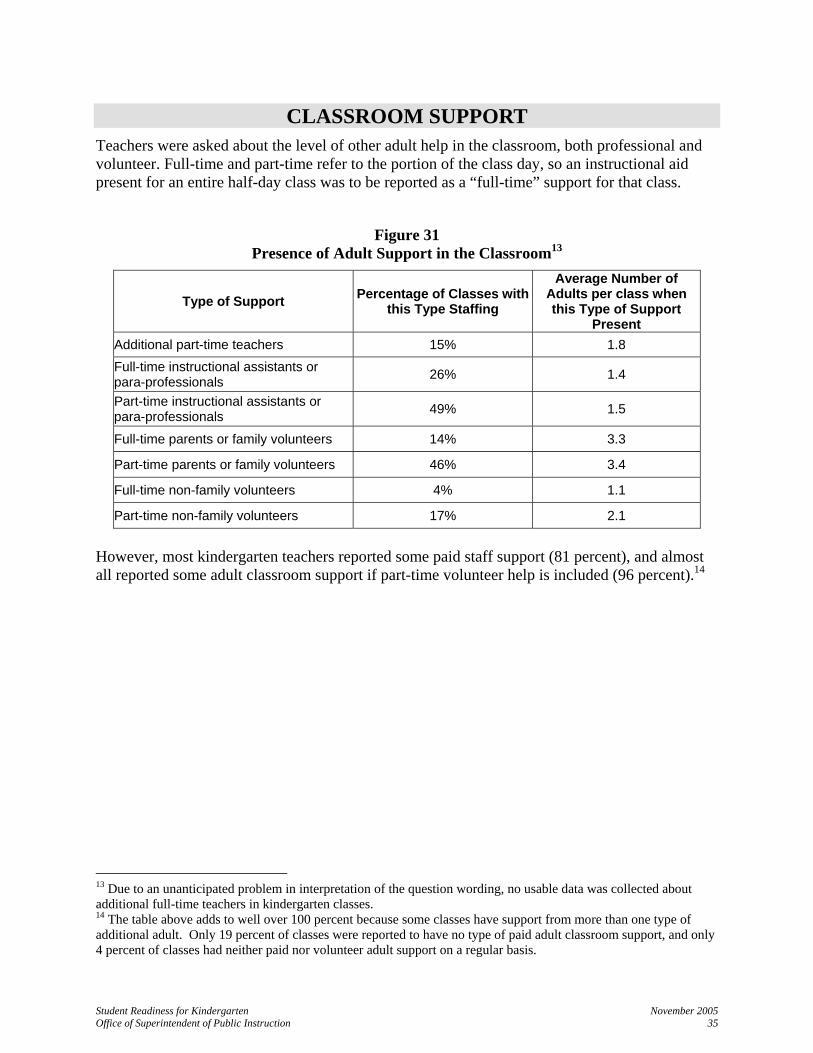
CLASSROOM SUPPORT Teachers were asked about the level of other adult help in the classroom, both professional and volunteer. Full-time and part-time refer to the portion of the class day, so an instructional aid present for an entire half-day class was to be reported as a “full-time” support for that class.
Figure 31 Presence of Adult Support in the Classroom13
Type of Support Percentage of Classes with this Type Staffing
Average Number of Adults per class when this Type of Support
Present Additional part-time teachers 15% 1.8 Full-time instructional assistants or para-professionals 26% 1.4
Part-time instructional assistants or para-professionals 49% 1.5
Full-time parents or family volunteers 14% 3.3
Part-time parents or family volunteers 46% 3.4
Full-time non-family volunteers 4% 1.1
Part-time non-family volunteers 17% 2.1
However, most kindergarten teachers reported some paid staff support (81 percent), and almost all reported some adult classroom support if part-time volunteer help is included (96 percent).14
13 Due to an unanticipated problem in interpretation of the question wording, no usable data was collected about additional full-time teachers in kindergarten classes. 14 The table above adds to well over 100 percent because some classes have support from more than one type of additional adult. Only 19 percent of classes were reported to have no type of paid adult classroom support, and only 4 percent of classes had neither paid nor volunteer adult support on a regular basis.
Student Readiness for Kindergarten November 2005 Office of Superintendent of Public Instruction 36
TEACHER COMMENTS The survey asked teachers to identify their biggest challenges, and to identify what could be done to improve student readiness for kindergarten. These questions asked for text responses, rather than having a pre-set range of choices. Responses varied in length from a few words to a few paragraphs. Some discussed only a single idea, while others listed several. This analysis quantified and combined similar ideas in the content of those responses. Discussed below are recurrent themes, ideas, and issues that were identified in reviewing and coding text responses. The percentages are based on how many of the 398 respondents mentioned a particular topic in their response.
WHAT ARE THE MOST IMPORTANT CHALLENGES FACING YOU AS A KINDERGARTEN TEACHER? Teachers’ comments to this open-ended question covered a wide range of issues.
Student Readiness Overall gaps in preparedness – 25 percent
Wide range of preparation – 18 percent
Some students not developmentally ready for curriculum – 9 percent Some teachers reported decreasing levels of language readiness
Meeting Academic Goals Meeting the Grade Level Expectations is challenging, especially in a half-day or
alternate-day schedule
Academic expectations leave insufficient time to cover all domains of development
Difficulty meeting curriculum goals, supporting wide ranges in learning and development, conducting ongoing assessment and providing one-on-one instruction, especially in school days sometimes as short as 2 hours and 40 minutes
Comments on these themes somewhat overlapped:
Seventeen percent mentioned the general problem of meeting expectations
Three percent mentioned the Grade Level Expectations by name
Thirteen percent reported shortage of time as a challenge
Fifteen percent mentioned the importance of full-day kindergarten
Two percent spoke of the limitations of alternate day programs
Twelve percent mentioned social development challenges
Student Readiness for Kindergarten November 2005 Office of Superintendent of Public Instruction 37
Parent Role Mentioned by 17 percent
Parent awareness of expectations for school readiness
Parent awareness of expectations for family’s role in their child’s education
Class Size and Staffing Large class size and need for additional staffing were reported as challenges by 12
percent and 11 percent respectively
Meeting the Needs of English Language Learners Mentioned by 7 percent
WHAT IS THE MOST IMPORTANT THING THAT CAN BE DONE TO IMPROVE SCHOOL READINESS FOR KINDERGARTEN? Teachers constructed their answers to this question in different ways. Some listed skills or experiences children needed to have to be prepared for kindergarten. Others described programmatic or societal changes that would result in improved preparedness. About 30 percent of respondents focused on specific skills or experiences. The more programmatic responses are analyzed below. (Percentages are out of the total of 398 survey respondents, 385 of whom answered this question.)
Role and Participation of Parents The vital role of parents in kindergarten preparedness and progress was a major topic (42 percent). This includes both:
Increased information and resources for parents regarding child development and school readiness, to support them in their role as their child’s first teacher
More family involvement in support of children’s progress in kindergarten
Comments highlighting the direct role of parents in their child’s kindergarten readiness were made by one-third (33 percent) of the respondents, many with concrete suggestions of things parents could do.
The importance of reading to and talking with children was frequently mentioned
Informing parents and parent education was frequently mentioned (17 percent), and some respondents discussed specific programs or types of parent communication and engagement. It is clear that this issue represented different aspects for different respondents, including:
Educating parents about parenting in general, starting at the child’s birth
Student Readiness for Kindergarten November 2005 Office of Superintendent of Public Instruction 38
Providing information to parents about developmentally appropriate learning and enrichment activities
Informing parents about the preparedness expectations for kindergarten
Informing parents about kindergarten activities, curriculum, and expectations
Communication with parents about their children before and during kindergarten
Improved Access to Early Learning Programs Improved or universal access to preschool – 30 percent
- About one-third of these noted the importance of high-quality preschool programs
A range of other suggestions were offered, including availability of:
- Multi-year preschool
- Summer kindergarten transition programs
- Social interaction opportunities to prepare children for work in a group setting
Improved Access to High Quality Early Care and Education Experiences for Children that Focuses on School Readiness
Alignment of childcare programs with kindergarten preparedness
Improved communication between kindergarten teachers and early care and education providers was also suggested
Full-day Kindergarten Shift from half-day to full-day kindergarten – 7 percent
Improved Screening and Assessment Improved procedures for screening and assessment of kindergarten students – 8
percent
Student Readiness for Kindergarten November 2005 Office of Superintendent of Public Instruction 39
POSSIBLE NEXT STEPS Teacher cooperation with the survey was substantial enough that continued use of web surveys for collecting information on kindergarten student preparedness appears feasible. Although the data from volunteer participants is far from an ideal statistical sample, response was large and diverse enough to provide a description of the preparedness of students entering kindergarten in Washington State in 2004. The data collected can be further analyzed to examine the relationships between categories of information collected – for example, between student poverty and risk factors, levels of classroom staff support, and teacher experience. Other analysis could access census data to look at the connection between adult education levels and preparedness. The relationship between screening practices and referrals for testing and evaluation could also be explored. Correlation analysis could be performed to look for patterns in teacher ratings of the relative importance of different aspects of preparedness, and to measure if those were associated with student or community characteristics. If the survey were to be repeated, it is recommended that the following improvements be made:
Reach a wider range of kindergarten teachers, by consulting with teachers and district administrators to identify strategies to get wider participation
Add an open-ended question for teachers to identify the most important preparedness issues or skills which are not included on the survey list
Revise questions which proved problematic this year
Request information about hours of classes and the availability of school age childcare and extended learning opportunities
Clarify question about additional full-time teachers in the classroom
Clarify questions about teacher experience in elementary, kindergarten, and pre-kindergarten education
Obtain more specific information about classes which are neither “full-day every day” nor “half-day every day” by creating a category for “full-day alternate-day,” and by asking teachers to describe “Other” class configurations
Improve data quality by defining key terms in questions and indicators so that respondents could understand more clearly what information was requested
Student Readiness for Kindergarten November 2005 Office of Superintendent of Public Instruction 40
APPENDICES
APPENDIX A - SURVEY INSTRUMENT
Thank you for participating. All responses are confidential to Washington State University-Social and Economic Sciences Research Center (WSU-SESRC), and individual responses will not be disclosed to Office of Superintendent of Public Instruction (OSPI), district, or school management. Providing contact information is optional – SESRC will use it only if we need to clarify some of your responses. If you have trouble accessing this survey on-line, contact keysurvey.com or (781) 849-8118. If you do not have Internet access, you can still participate. Mailing address for completed surveys: Survey Coordinator Social & Economic Sciences Research Center - Washington State University PO Box 43170, Olympia, WA 98504-3170 Remember, the focus of our questions is the preparedness of your incoming students as they arrived at the start of the year. Again, we appreciate the time and effort you take in participating.
Welcome to the Kindergarten Readiness Survey. NOTE: If you wish to review or change your responses, you may go back and do so at
anytime, until you press, “SUBMIT.” ONCE YOU SUBMIT YOUR SURVEY, YOU CANNOT GO BACK.
CLASSROOM CHARACTERISTICS
Please indicate the County where you are teaching THIS YEAR.
County
Please indicate the School District Name and/or School District Number where you are teaching THIS YEAR.
School District Name School District # (optional)
Please enter the School Building Name where you are teaching THIS YEAR.
School Building Name School Building # (optional)
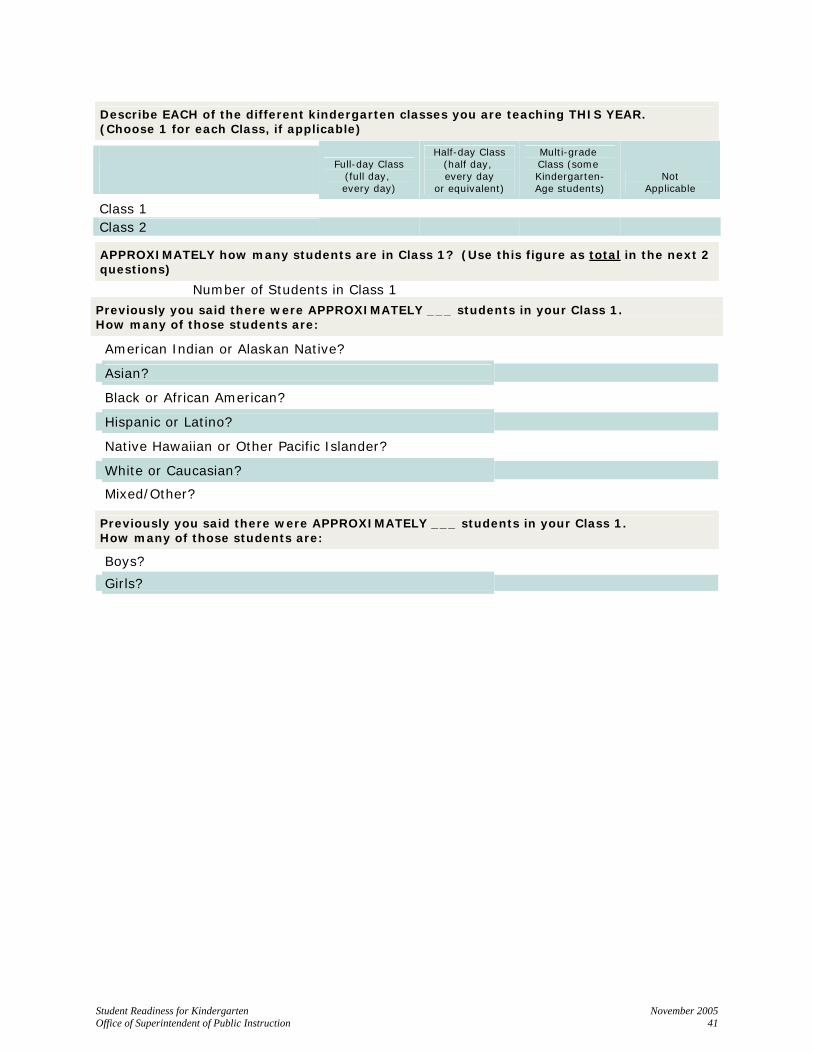
Student Readiness for Kindergarten November 2005 Office of Superintendent of Public Instruction 41
Describe EACH of the different kindergarten classes you are teaching THIS YEAR. (Choose 1 for each Class, if applicable)
Full-day Class
(full day, every day)
Half-day Class (half day, every day
or equivalent)
Multi-grade Class (some Kindergarten- Age students)
Not Applicable
Class 1 Class 2
APPROXIMATELY how many students are in Class 1? (Use this figure as total in the next 2 questions)
Number of Students in Class 1
Previously you said there were APPROXIMATELY ___ students in your Class 1. How many of those students are:
American Indian or Alaskan Native?
Asian?
Black or African American?
Hispanic or Latino?
Native Hawaiian or Other Pacific Islander?
White or Caucasian?
Mixed/Other?
Previously you said there were APPROXIMATELY ___ students in your Class 1. How many of those students are:
Boys?
Girls?
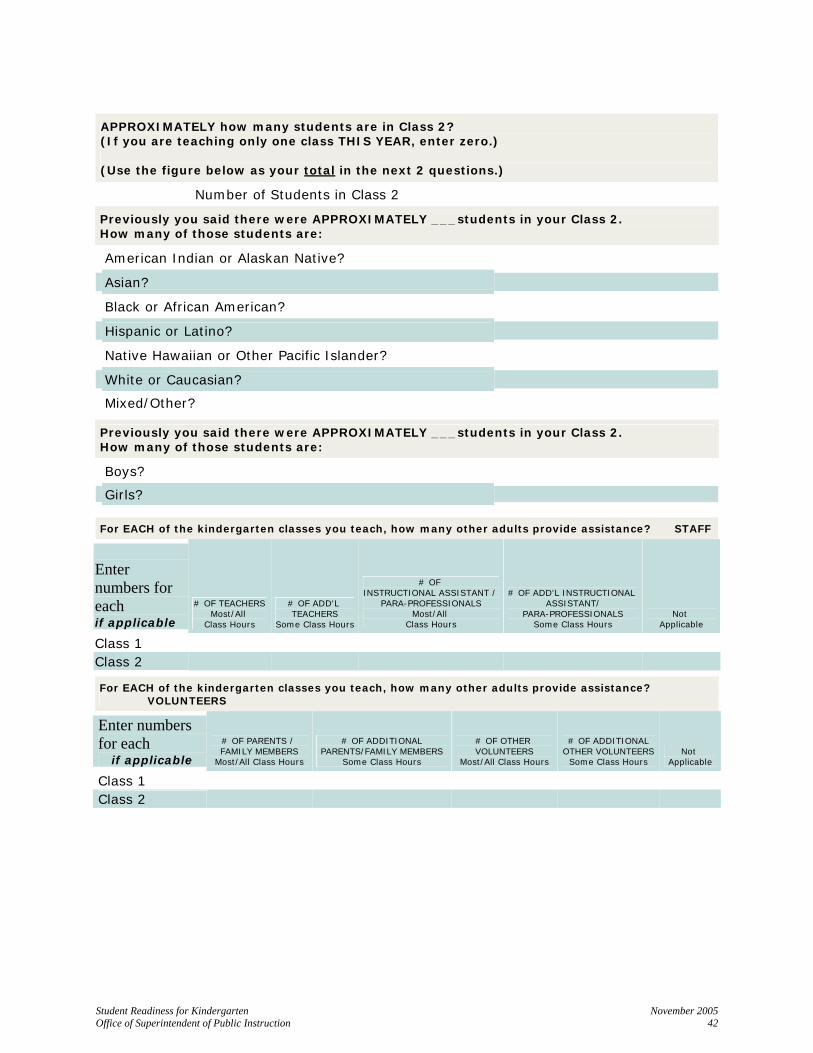
Student Readiness for Kindergarten November 2005 Office of Superintendent of Public Instruction 42
APPROXIMATELY how many students are in Class 2? (If you are teaching only one class THIS YEAR, enter zero.) (Use the figure below as your total in the next 2 questions.)
Number of Students in Class 2
Previously you said there were APPROXIMATELY ___students in your Class 2. How many of those students are:
American Indian or Alaskan Native?
Asian?
Black or African American?
Hispanic or Latino?
Native Hawaiian or Other Pacific Islander?
White or Caucasian?
Mixed/Other?
Previously you said there were APPROXIMATELY ___students in your Class 2. How many of those students are:
Boys?
Girls?
For EACH of the kindergarten classes you teach, how many other adults provide assistance? STAFF
Enter numbers for each if applicable
# OF TEACHERS Most/All
Class Hours
# OF ADD'L TEACHERS
Some Class Hours
# OF INSTRUCTIONAL ASSISTANT /
PARA-PROFESSIONALS Most/All
Class Hours
# OF ADD'L INSTRUCTIONAL ASSISTANT/
PARA-PROFESSIONALS Some Class Hours
Not Applicable
Class 1 Class 2
For EACH of the kindergarten classes you teach, how many other adults provide assistance? VOLUNTEERS
Enter numbers for each
if applicable # OF PARENTS / FAMILY MEMBERS
Most/All Class Hours
# OF ADDITIONAL PARENTS/FAMILY MEMBERS
Some Class Hours
# OF OTHER VOLUNTEERS
Most/All Class Hours
# OF ADDITIONAL OTHER VOLUNTEERS
Some Class Hours Not
Applicable
Class 1 Class 2
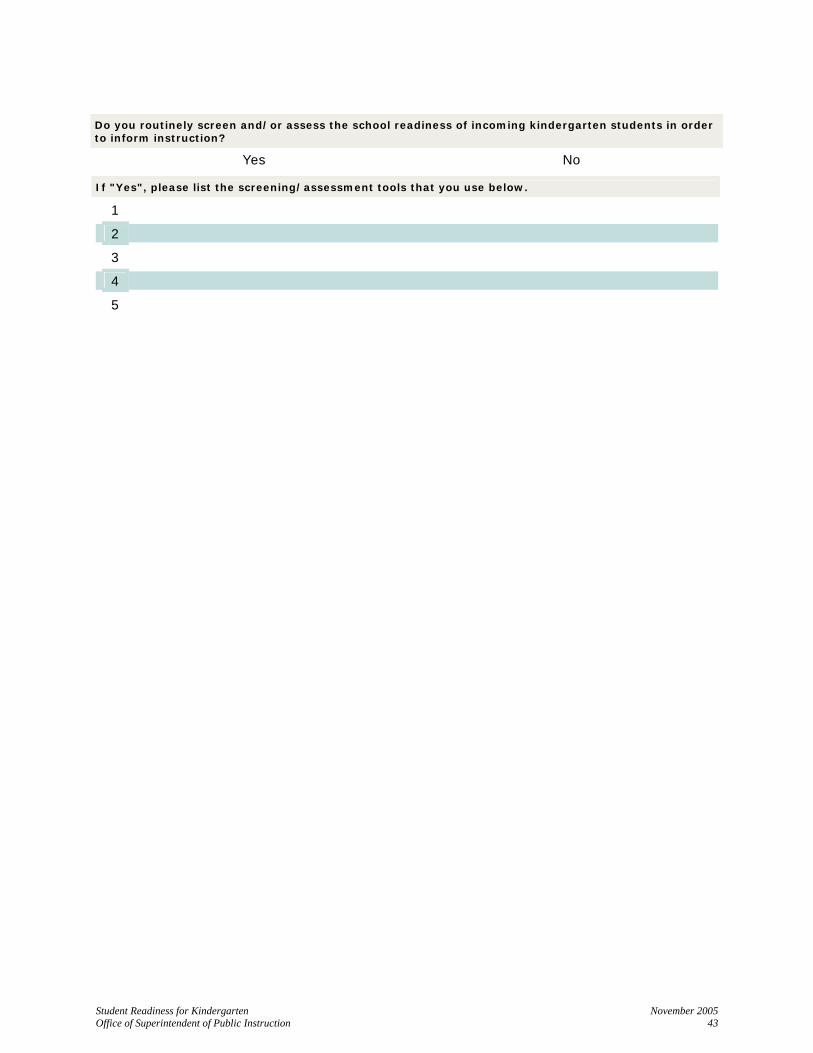
Student Readiness for Kindergarten November 2005 Office of Superintendent of Public Instruction 43
Do you routinely screen and/or assess the school readiness of incoming kindergarten students in order to inform instruction?
Yes No
If "Yes", please list the screening/assessment tools that you use below.
1
2
3
4
5
Student Readiness for Kindergarten November 2005 Office of Superintendent of Public Instruction 44
STUDENT CHARACTERISTICS
Across ALL your entering class(es) this year, about what PERCENT of children previously attended a preschool or childcare? (Choose 1 category for each row)
0%-20% 21%-40% 41%-60% 61%-80% 81%-100%
Across ALL your entering class(es) this year, about what PERCENT of children did you receive records from or communicate with their preschool teacher or childcare provider? (Choose 1 category for each row)
0%-20% 21%-40% 41%-60% 61%-80% 81%-100%
Across ALL your entering class(es) this year, about what PERCENT of children did you receive records from or communicate with their family/parents? (Choose 1 category for each row)
0%-20% 21%-40% 41%-60% 61%-80% 81%-100%
Across ALL your entering class(es) this year, estimate the number of children you know who:
APPROXIMATE Number Don't Know
Are repeating Kindergarten? Are coming from an early childhood program (e.g., ECEAP or Head Start)?
Are coming from a transitional Kindergarten? Have an IEP? Have a Section 504 Accommodation Plan? Were referred for Oral Language Proficiency testing? Have pre-existing health problems, which have interfered with their success in school?
Are eligible for Free and Reduced-Price Meals?
Across ALL your entering class(es) this year, APPROXIMATELY how many additional children (who do not have IEP or Sec 504) did/will/would you refer for special education services, due to developmental delay, behavior, speech/language, or other reasons?
Number of ADDITIONAL children
Across ALL your students as they first entered class(es) THIS YEAR, what PERCENT of your students showed overall preparedness upon entry into Kindergarten? (Choose 1 category for each row)
0%-20% 21%-40% 41%-60% 61%-80% 81%-100%
Student Readiness for Kindergarten November 2005 Office of Superintendent of Public Instruction 45
SKILLS ASSESSMENT
PHYSICAL WELL BEING, HEALTH & MOTOR DEVELOPMENT (Choose 1 category for each row) Across ALL your entering students this year, what PERCENT of your students were adequately prepared in terms of:
0%-20% 21%-40% 41%-60% 61%-80% 81%-100%
Being physically healthy, rested, well nourished?
Ability to walk, run, climb, balance? Ability to use manipulative materials such as table blocks, scissors, eating utensils, and puzzles?
Demonstrating self-help skills?
How important to you is adequate student preparation in: (Choose 1 category for each row)
Not Very Important
Somewhat Important
Average Importance
Very Important
Extremely Important
Less Important Because we expect
to/do teach this
Being physically healthy, rested, well nourished?
Ability to walk, run, climb, balance? Ability to use manipulative
materials such as table blocks, scissors, eating utensils, and puzzles?
Demonstrating self-help skills?
Student Readiness for Kindergarten November 2005 Office of Superintendent of Public Instruction 46
SOCIAL & EMOTIONAL DEVELOPMENT (Choose 1 category for each row) Across ALL your entering students this year, what PERCENT of your students were adequately prepared in terms of:
0%-20% 21%-40% 41%-60% 61%-80% 81%-100%
Ability to interact positively with other children - sharing, participating group activities, etc.?
Ability to use problem-solving skills in social situations?
Not being disruptive of the class? Demonstrating self control/impulse control?
How important to you is adequate student preparation in: (Choose 1 category for each row)
Not Very Important
Somewhat Important
Average Importance
Very Important
Extremely Important
Less Important Because we expect
to/do teach this
Ability to interact positively with other children - sharing, participating group activities, etc.?
Ability to use problem-solving skills in social situations?
Not being disruptive of the class? Demonstrating self control/impulse
control?
Student Readiness for Kindergarten November 2005 Office of Superintendent of Public Instruction 47
APPROACHES TOWARD LEARNING (Choose 1 category for each row) Across ALL your entering students this year, what PERCENT of your students were adequately prepared in terms of:
0%-20% 21%-40% 41%-60% 61%-80% 81%-100%
Demonstrating enthusiasm/curiosity when approaching new activities?
Finishing tasks? Demonstrating age-appropriate attention span?
How important to you is adequate student preparation in: (Choose 1 category for each row)
Not Very Important
Somewhat Important
Average Importance
Very Important
Extremely Important
Less Important Because we expect
to/do teach this
Demonstrating enthusiasm/curiosity when engaging and approaching new activities?
Finishing tasks? Demonstrating age-appropriate
attention span?
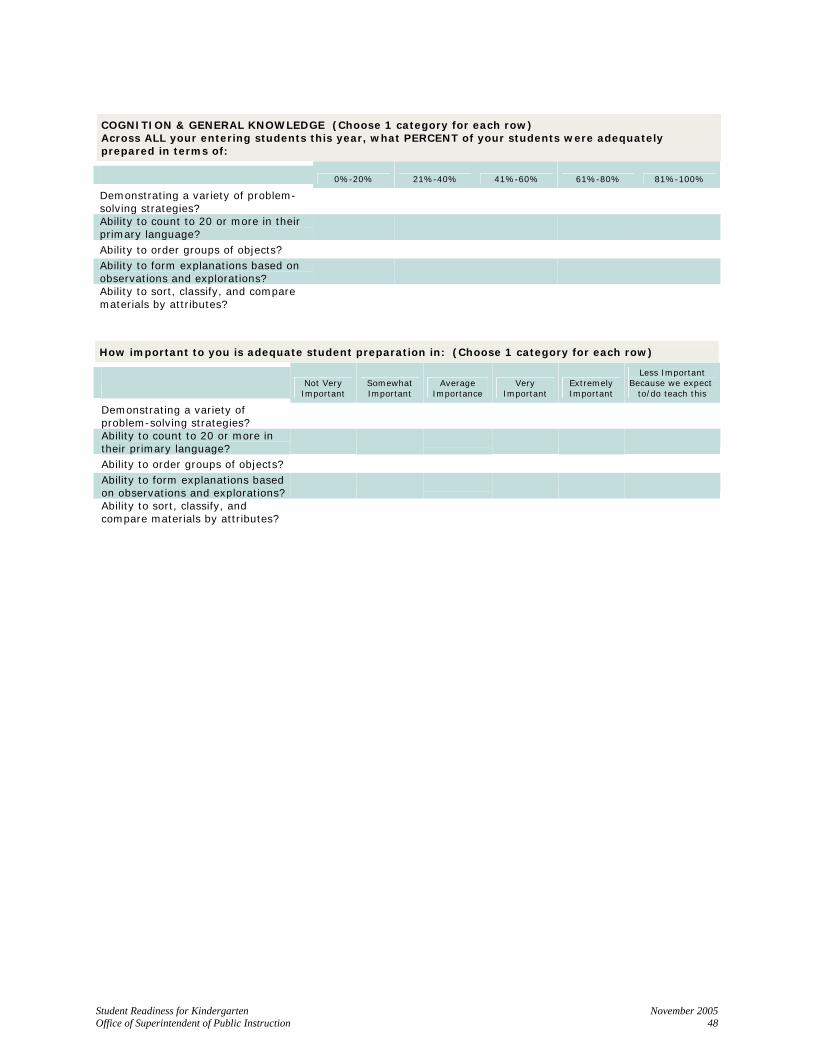
Student Readiness for Kindergarten November 2005 Office of Superintendent of Public Instruction 48
COGNITION & GENERAL KNOWLEDGE (Choose 1 category for each row) Across ALL your entering students this year, what PERCENT of your students were adequately prepared in terms of:
0%-20% 21%-40% 41%-60% 61%-80% 81%-100%
Demonstrating a variety of problem-solving strategies?
Ability to count to 20 or more in their primary language?
Ability to order groups of objects? Ability to form explanations based on observations and explorations?
Ability to sort, classify, and compare materials by attributes?
How important to you is adequate student preparation in: (Choose 1 category for each row)
Not Very Important
Somewhat Important
Average Importance
Very Important
Extremely Important
Less Important Because we expect
to/do teach this
Demonstrating a variety of problem-solving strategies?
Ability to count to 20 or more in
their primary language?
Ability to order groups of objects? Ability to form explanations based
on observations and explorations?
Ability to sort, classify, and compare materials by attributes?
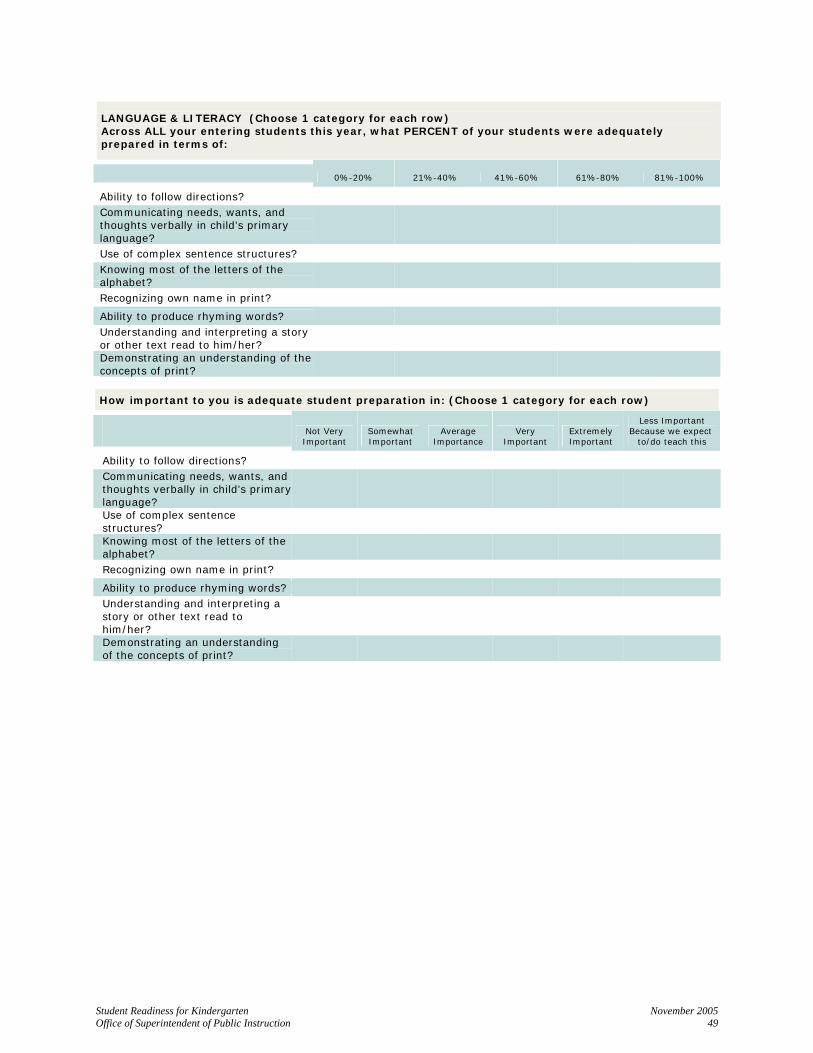
Student Readiness for Kindergarten November 2005 Office of Superintendent of Public Instruction 49
LANGUAGE & LITERACY (Choose 1 category for each row) Across ALL your entering students this year, what PERCENT of your students were adequately prepared in terms of:
0%-20% 21%-40% 41%-60% 61%-80% 81%-100%
Ability to follow directions? Communicating needs, wants, and thoughts verbally in child’s primary language?
Use of complex sentence structures? Knowing most of the letters of the alphabet?
Recognizing own name in print? Ability to produce rhyming words? Understanding and interpreting a story or other text read to him/her?
Demonstrating an understanding of the concepts of print?
How important to you is adequate student preparation in: (Choose 1 category for each row)
Not Very Important
Somewhat Important
Average Importance
Very Important
Extremely Important
Less Important Because we expect
to/do teach this
Ability to follow directions? Communicating needs, wants, and
thoughts verbally in child’s primary language?
Use of complex sentence structures?
Knowing most of the letters of the
alphabet?
Recognizing own name in print? Ability to produce rhyming words? Understanding and interpreting a
story or other text read to him/her?
Demonstrating an understanding of the concepts of print?
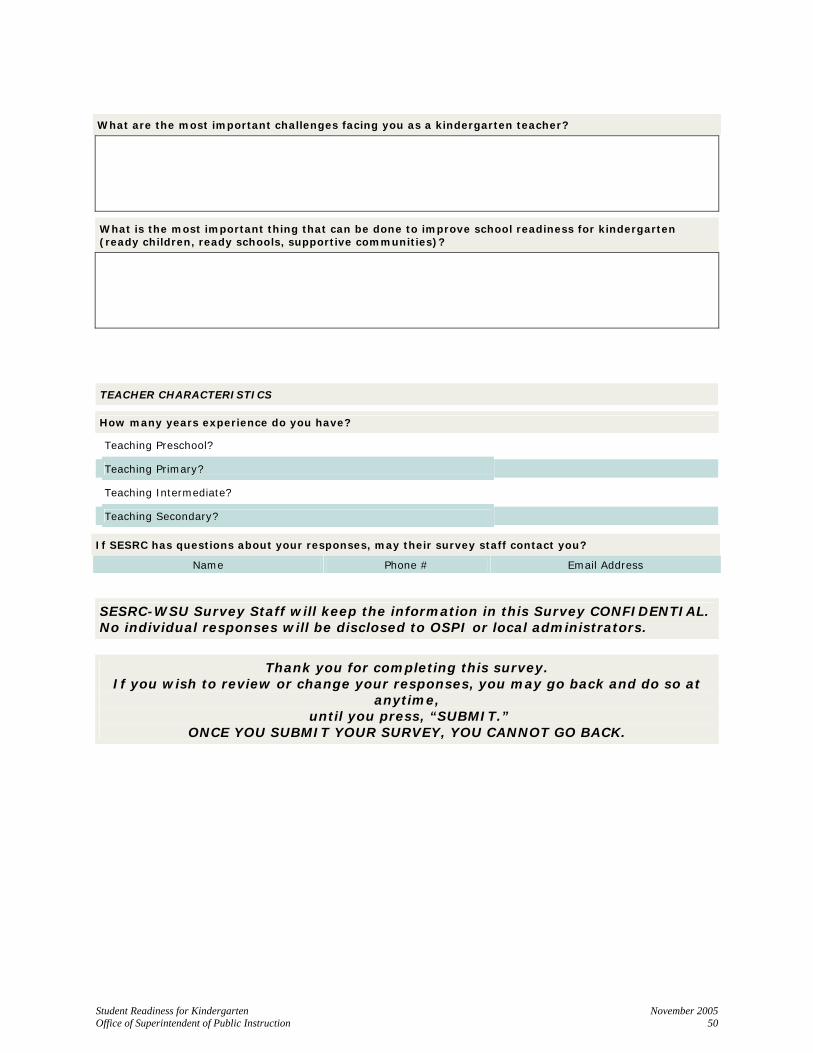
Student Readiness for Kindergarten November 2005 Office of Superintendent of Public Instruction 50
What are the most important challenges facing you as a kindergarten teacher?
What is the most important thing that can be done to improve school readiness for kindergarten (ready children, ready schools, supportive communities)?
TEACHER CHARACTERISTICS
How many years experience do you have?
Teaching Preschool?
Teaching Primary?
Teaching Intermediate?
Teaching Secondary?
If SESRC has questions about your responses, may their survey staff contact you?
Name Phone # Email Address
SESRC-WSU Survey Staff will keep the information in this Survey CONFIDENTIAL. No individual responses will be disclosed to OSPI or local administrators.
Thank you for completing this survey.
If you wish to review or change your responses, you may go back and do so at anytime,
until you press, “SUBMIT.” ONCE YOU SUBMIT YOUR SURVEY, YOU CANNOT GO BACK.

Student Readiness for Kindergarten November 2005 Office of Superintendent of Public Instruction 51
APPENDIX B - GEOGRAPHY OF RESPONSE TABLES
Response by County
County Responses County Responses County ResponsesAdams 3 Grays Harbor 5 Pierce 37Asotin 1 Island 7 San Juan 1Benton 12 Jefferson 0 Skagit 9Chelan 6 King 73 Skamania 1Clallam 4 Kitsap 26 Snohomish 38Clark 22 Kittitas 2 Spokane 23Columbia 0 Klickitat 2 Stevens 7Cowlitz 10 Lewis 11 Thurston 8Douglas 5 Lincoln 2 Wahkiakum 1Ferry 0 Mason 6 Walla Walla 10Franklin 4 Okanogan 4 Whatcom 13Garfield 1 Pacific 2 Whitman 6Grant 7 Pend Oreille 1 Yakima 27 Refuse 1
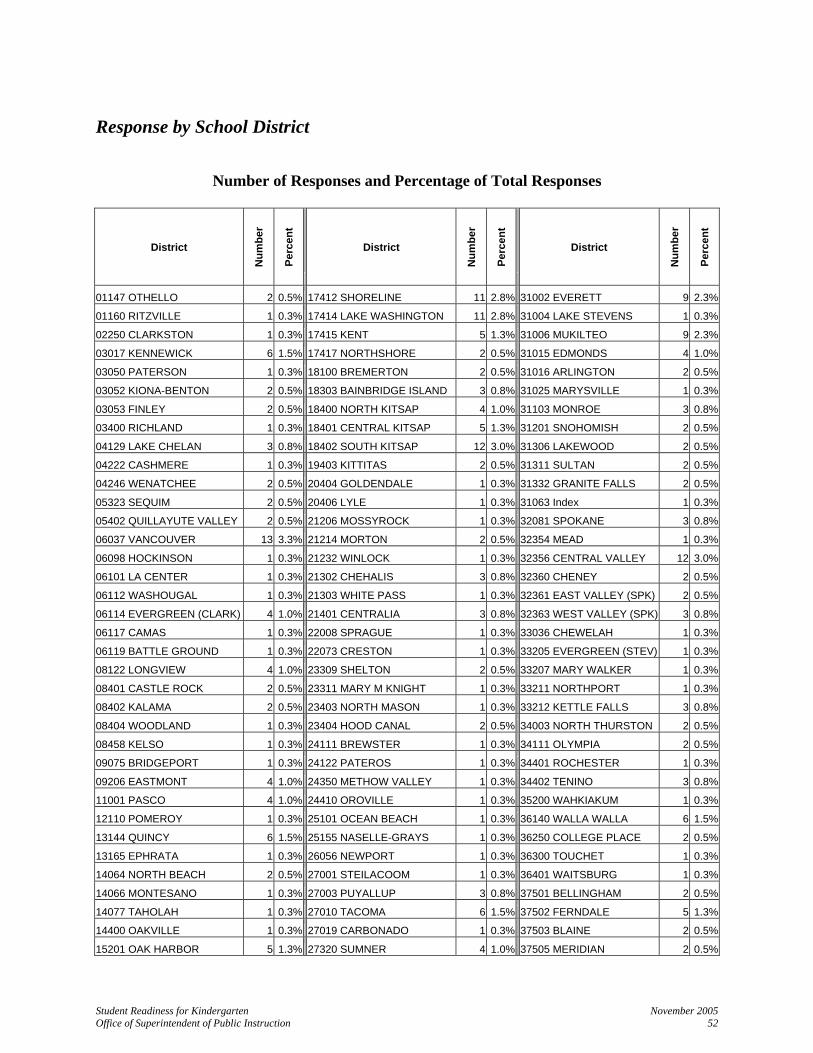
Student Readiness for Kindergarten November 2005 Office of Superintendent of Public Instruction 52
Response by School District
Number of Responses and Percentage of Total Responses
District N
umbe
r
Perc
ent
District
Num
ber
Perc
ent
District
Num
ber
Perc
ent
01147 OTHELLO 2 0.5% 17412 SHORELINE 11 2.8% 31002 EVERETT 9 2.3%
01160 RITZVILLE 1 0.3% 17414 LAKE WASHINGTON 11 2.8% 31004 LAKE STEVENS 1 0.3%
02250 CLARKSTON 1 0.3% 17415 KENT 5 1.3% 31006 MUKILTEO 9 2.3%
03017 KENNEWICK 6 1.5% 17417 NORTHSHORE 2 0.5% 31015 EDMONDS 4 1.0%
03050 PATERSON 1 0.3% 18100 BREMERTON 2 0.5% 31016 ARLINGTON 2 0.5%
03052 KIONA-BENTON 2 0.5% 18303 BAINBRIDGE ISLAND 3 0.8% 31025 MARYSVILLE 1 0.3%
03053 FINLEY 2 0.5% 18400 NORTH KITSAP 4 1.0% 31103 MONROE 3 0.8%
03400 RICHLAND 1 0.3% 18401 CENTRAL KITSAP 5 1.3% 31201 SNOHOMISH 2 0.5%
04129 LAKE CHELAN 3 0.8% 18402 SOUTH KITSAP 12 3.0% 31306 LAKEWOOD 2 0.5%
04222 CASHMERE 1 0.3% 19403 KITTITAS 2 0.5% 31311 SULTAN 2 0.5%
04246 WENATCHEE 2 0.5% 20404 GOLDENDALE 1 0.3% 31332 GRANITE FALLS 2 0.5%
05323 SEQUIM 2 0.5% 20406 LYLE 1 0.3% 31063 Index 1 0.3%
05402 QUILLAYUTE VALLEY 2 0.5% 21206 MOSSYROCK 1 0.3% 32081 SPOKANE 3 0.8%
06037 VANCOUVER 13 3.3% 21214 MORTON 2 0.5% 32354 MEAD 1 0.3%
06098 HOCKINSON 1 0.3% 21232 WINLOCK 1 0.3% 32356 CENTRAL VALLEY 12 3.0%
06101 LA CENTER 1 0.3% 21302 CHEHALIS 3 0.8% 32360 CHENEY 2 0.5%
06112 WASHOUGAL 1 0.3% 21303 WHITE PASS 1 0.3% 32361 EAST VALLEY (SPK) 2 0.5%
06114 EVERGREEN (CLARK) 4 1.0% 21401 CENTRALIA 3 0.8% 32363 WEST VALLEY (SPK) 3 0.8%
06117 CAMAS 1 0.3% 22008 SPRAGUE 1 0.3% 33036 CHEWELAH 1 0.3%
06119 BATTLE GROUND 1 0.3% 22073 CRESTON 1 0.3% 33205 EVERGREEN (STEV) 1 0.3%
08122 LONGVIEW 4 1.0% 23309 SHELTON 2 0.5% 33207 MARY WALKER 1 0.3%
08401 CASTLE ROCK 2 0.5% 23311 MARY M KNIGHT 1 0.3% 33211 NORTHPORT 1 0.3%
08402 KALAMA 2 0.5% 23403 NORTH MASON 1 0.3% 33212 KETTLE FALLS 3 0.8%
08404 WOODLAND 1 0.3% 23404 HOOD CANAL 2 0.5% 34003 NORTH THURSTON 2 0.5%
08458 KELSO 1 0.3% 24111 BREWSTER 1 0.3% 34111 OLYMPIA 2 0.5%
09075 BRIDGEPORT 1 0.3% 24122 PATEROS 1 0.3% 34401 ROCHESTER 1 0.3%
09206 EASTMONT 4 1.0% 24350 METHOW VALLEY 1 0.3% 34402 TENINO 3 0.8%
11001 PASCO 4 1.0% 24410 OROVILLE 1 0.3% 35200 WAHKIAKUM 1 0.3%
12110 POMEROY 1 0.3% 25101 OCEAN BEACH 1 0.3% 36140 WALLA WALLA 6 1.5%
13144 QUINCY 6 1.5% 25155 NASELLE-GRAYS 1 0.3% 36250 COLLEGE PLACE 2 0.5%
13165 EPHRATA 1 0.3% 26056 NEWPORT 1 0.3% 36300 TOUCHET 1 0.3%
14064 NORTH BEACH 2 0.5% 27001 STEILACOOM 1 0.3% 36401 WAITSBURG 1 0.3%
14066 MONTESANO 1 0.3% 27003 PUYALLUP 3 0.8% 37501 BELLINGHAM 2 0.5%
14077 TAHOLAH 1 0.3% 27010 TACOMA 6 1.5% 37502 FERNDALE 5 1.3%
14400 OAKVILLE 1 0.3% 27019 CARBONADO 1 0.3% 37503 BLAINE 2 0.5%
15201 OAK HARBOR 5 1.3% 27320 SUMNER 4 1.0% 37505 MERIDIAN 2 0.5%
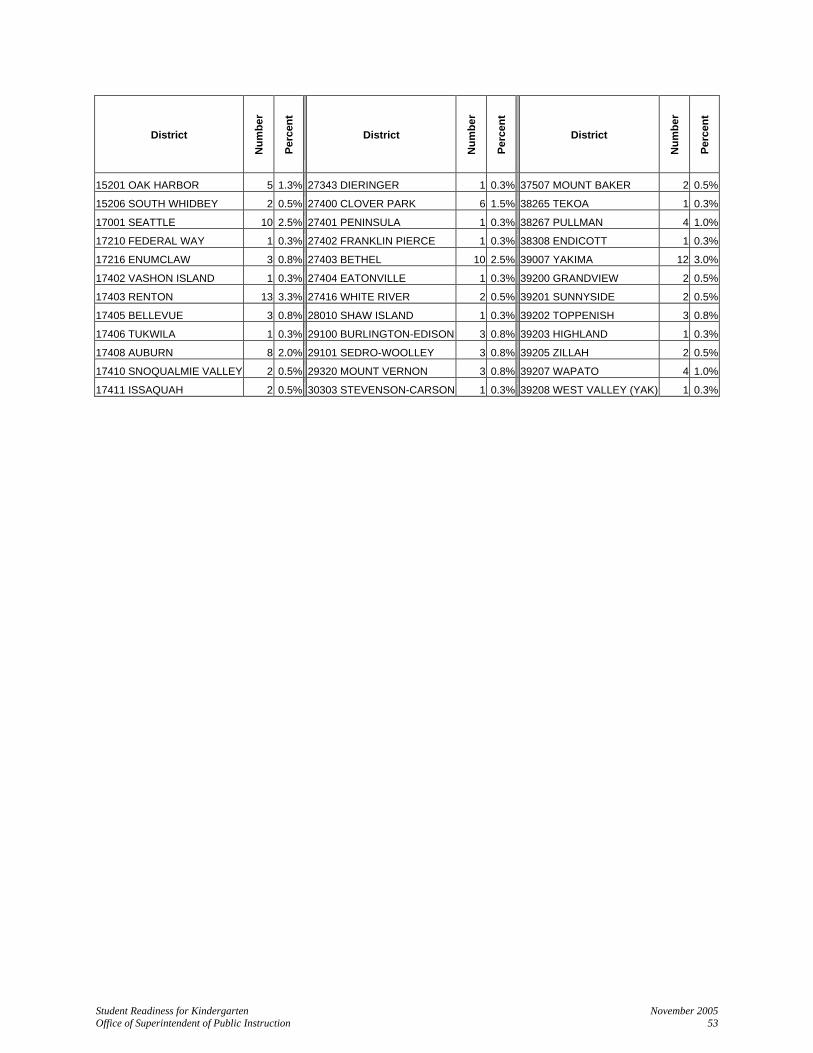
Student Readiness for Kindergarten November 2005 Office of Superintendent of Public Instruction 53
District
Num
ber
Perc
ent
District
Num
ber
Perc
ent
District
Num
ber
Perc
ent
15201 OAK HARBOR 5 1.3% 27343 DIERINGER 1 0.3% 37507 MOUNT BAKER 2 0.5%
15206 SOUTH WHIDBEY 2 0.5% 27400 CLOVER PARK 6 1.5% 38265 TEKOA 1 0.3%
17001 SEATTLE 10 2.5% 27401 PENINSULA 1 0.3% 38267 PULLMAN 4 1.0%
17210 FEDERAL WAY 1 0.3% 27402 FRANKLIN PIERCE 1 0.3% 38308 ENDICOTT 1 0.3%
17216 ENUMCLAW 3 0.8% 27403 BETHEL 10 2.5% 39007 YAKIMA 12 3.0%
17402 VASHON ISLAND 1 0.3% 27404 EATONVILLE 1 0.3% 39200 GRANDVIEW 2 0.5%
17403 RENTON 13 3.3% 27416 WHITE RIVER 2 0.5% 39201 SUNNYSIDE 2 0.5%
17405 BELLEVUE 3 0.8% 28010 SHAW ISLAND 1 0.3% 39202 TOPPENISH 3 0.8%
17406 TUKWILA 1 0.3% 29100 BURLINGTON-EDISON 3 0.8% 39203 HIGHLAND 1 0.3%
17408 AUBURN 8 2.0% 29101 SEDRO-WOOLLEY 3 0.8% 39205 ZILLAH 2 0.5%
17410 SNOQUALMIE VALLEY 2 0.5% 29320 MOUNT VERNON 3 0.8% 39207 WAPATO 4 1.0%
17411 ISSAQUAH 2 0.5% 30303 STEVENSON-CARSON 1 0.3% 39208 WEST VALLEY (YAK) 1 0.3%
Student Readiness for Kindergarten November 2005 Office of Superintendent of Public Instruction 54
APPENDIX C - WHAT IS SCHOOL READINESS?
( Prepared for the Washington State School Readiness Summit, November 8, 2004)
What does school readiness mean? According to the National Education Goals Panel, school readiness means: (1) children’s readiness to enter school; (2) schools’ readiness for children, and (3) family and community supports that contribute to the readiness of children (Child Trends, 2001; Kagan, Moore and Bredekamp, 1995).
1. A child’s school readiness is the culmination of the experiences and care that he/she has received from birth to school entry. There are five dimensions to a child’s school readiness: • physical health, well-being and motor development; • social and emotional development; • approaches to learning; • language and literacy development; and • cognition and general knowledge. (Copple, 1997; Kagan, Moore and Bredekamp, 1995)
Affecting the child’s readiness are the environment, context and conditions in which the child learns and acquires skills (Meisels, 1999). The adults in a young child’s life shape these factors.
Parents will always be their children’s first and most important teachers, caregivers and decision makers. But in a national survey conducted in 2000, only onethird of parents felt “very prepared” for parenthood (DYG, Inc., 2000). High-quality early education and care are essential for school readiness. Nearly 70 percent of children under age five are in some form of early care and education setting on a regular basis (Business Roundtable, 2003). In early learning settings, high quality includes nurturing and well-trained teachers and caregivers, an enriching learning environment, age-appropriate materials, low staff turnover, and low staff/child ratios (National Education Goals Panel, 1997). But for many families today, high-quality care is not accessible or affordable.
2. Ready schools are prepared to support the learning and development of every child in their community. Ready schools: (a) smooth the transition between home and school; (b) strive for continuity between early care and education programs and elementary schools; (c) help children learn and make sense of their complex and exciting world; (d) are committed to the success of every child; (e) are committed to the success of every teacher and every adult who interacts with children during the school day; (f) introduce or expand approaches that have been shown to raise achievement; (g) are learning organizations that alter practices and programs if they do not benefit children; (h) serve children in communities; (i) take responsibility for results; and (j) have strong leadership (Shore, 1998).
3. Family and community supports that contribute to school readiness include: • Information and support for parents to help them
raise healthy children who are ready to achieve their full potential;
• High-quality, culturally competent and developmentally appropriate child care and early education programs that help prepare children for school;
• The nutrition, health care and physical activity children need to arrive at school with healthy minds and bodies;
• A comprehensive system of developmental assessment, and access to effective early interventions;
• Family economic resources; and • Strong, safe neighborhoods. (National Education Goals Panel, 1997)
Why is it urgent and important to address school readiness? • A need for all children: As the chief for the Child
Development and Behavior Branch of the National Institutes of Health has explained: “[E]nsuring that all of our children are cognitively, socially, emotionally, and physically ready for school respects no economic, racial, or ethnic boundaries” (Lyon, 2001).
• Begins at birth: New scientific research has told us that children’s brains develop faster than we ever imagined. Ninety percent of the brain’s architecture is formed in the first five years of life. What children learn in these years lays the foundation for all later learning. Perhaps more surprising, a child’s early experiences that are enriching directly affect the brain’s development in a positive way. And the reverse also seems to be the case. Either way, nurturing and early experiences shape a child’s ability to learn and relate to others for the rest of his or her life (Shonkoff, 2000).
• Learning environments: Children learn in the context of relationships. They learn most effectively: • when they have warm and secure relationships with
parents and other caring adults; • through play—alone and with peers; • through their interactions with other children and
adults; and • in environments that are rich in language stimulation
and where they can explore engaging materials. Our new knowledge calls upon all adults to be more intentional about how we interact with young children from infancy on, and the kinds of play and learning environments we provide for them (Office of the Governor and Office of the Superintendent of Public Instruction, 2004).
Student Readiness for Kindergarten November 2005 Office of Superintendent of Public Instruction 55
• High percentage have trouble: National research shows that nearly 50 percent of entering kindergartners experience moderate to serious problems in making the transition into kindergarten (National Center for Early Development and Learning, 1996). A national poll of kindergarten teachers in 2004 found that in nearly half the classrooms, at least one out of five children was inadequately prepared for kindergarten (Mason-Dixon Polling and Research, 2004). In Washington state, we don’t track information on school readiness, but the national research is consistent with estimates from local school districts.
• Readiness/achievement gap: Children who are behind when they start school are unlikely to catch up. The gap in achievement grows as these children continue in school (Coley, 2002; West, Denton and Reaney, 2001).
• Lifetime effects: Children who are ready to be successful students tend to do better in school and in life. Children whose early experiences—at home and in care settings— nurture and support their learning and development are less likely to fail or repeat grades, be placed in special education, or drop out of school entirely—with significant consequences for their future (Bowman, 2002; Ewing Marion Kauffman Foundation, 2002).
Why are partnerships important for school readiness? There are four critical factors influencing a child’s development: the child, the family, child care and early childhood teachers, and the neighborhood and community. Improving school readiness requires the concerted action of these individuals and groups plus schools, all working together (National Education Goals Panel, 1997; Pianta and Kraft-Sayre, 2003). Connections among the home, early learning settings, school and community create a critical continuity of experience that smoothes the path into school for young children and their families (Ahearn, Nally and Cabson, 2000; Kraft-Sayre and Pianta, 2000). The new Washington State Early Learning and Development Benchmarks can help put all the adults in children’s lives are “on the same page” regarding what children need for healthy development and school readiness.
The need to work together for school readiness is becoming clear to more and more people. Schools are interested. Child care and early learning teachers are interested. Parents are interested. One recent survey suggests that the time is also ripe for engaging everyone in the community. “Today, most Americans (72%) say that raising children is the responsibility of parents with support of others in the community . . . [including] people in their neighborhoods, places of work, schools and communities” (Ad Council, 2004).
References
Ad Council. 2004. Turning Point: Engaging the Public on Behalf of Children. New York, N.Y.: The Advertising Council. www.adcouncil.org/research/commitment_children/index.html Ahearn, Charles, Donna Nalley and Christy Cabson, eds. 2000. Continuity in Early Childhood: A Framework for Home, School, and Community Linkages. Regional Educational Laboratories, Early Childhood Collaboration Network. www.relnetwork.org Bowman, Barbara T. 2002. “Ready to Learn in School.” Remarks to Getting School Ready Conference, King County, Washington. www.gettingschoolready.org Business Roundtable. 2003. Early Childhood Education: A Call to Action from the Business Community – Why America Needs High-Quality Early Childhood Education. www.businessroundtable.org/document.cfm/901 Child Trends. 2001 School Readiness: Helping Communities Get Children Ready for School and Schools Ready for Children. Research Brief. Washington, D.C.: Child Trends. www.childtrends.org Coley, Richard J. 2002. An Uneven Start: Indicators of Inequality in School Readiness. Princeton, N.J.: Educational Testing Service Policy Center. www.ets.org/research/dload/Unevenstart.pdf Copple, Carol, and the Goal 1 Early Childhood Assessments Resource Group, eds. 1997. Getting a Good Start in School – A Document Based on Reconsidering Children’s Early Development and Learning. National Education Goals Panel, Goal 1 Technical Planning Group on Readiness for School. Washington, D.C.: U. S. Government Printing Office. www.negp.gov/Reports/good-sta.htm DYG, Inc. 2000. What Grown-ups Understand About Child Development: A National Benchmark Survey. Survey commissioned by Civitas, Zero to Three, and Brio. Ewing Marion Kauffman Foundation. 2002. Set for Success: Building a Strong Foundation for School Readiness Based on the Social-Emotional Development of Young Children. Kansas City, Mo.: Ewing Marion Kauffman Foundation. www.kauffman.org/pdf/eex_summary.pdf Kagan, Sharon Lynn, Evelyn Moore, and Sue Bredekamp, eds. 1995. Reconsidering Children’s Early Development and Learning: Toward Common Views and Vocabulary. National Education Goals Panel, Goal 1 Technical Planning Group on Readiness for School. Washington, D.C.: U. S. Government Printing Office. www.negp.gov/reports/child-ea.htm Kraft-Sayre, Marcia, and Robert C. Pianta. 2000. Enhancing the Transition to Kindergarten. Charlottesville, Va.: University of Virginia, National Center for Early Development and Learning.
Lyon, G. Reid. 2001. “Summary Comments.” Address to the White House Summit on Early Childhood Cognitive Development. July 27. www.whitehouse.gov/firstlady/initiatives/education/earlychildhood.html Mason-Dixon Polling and Research. 2004. Fight Crime: Invest in Kinds – A National Survey of Kindergarten Teachers on the Preparedness of Our Nation’s Youngest Students. Washington, D.C. www.fightcrime.org/releases.php?id=101 Meisels, S. J. “Assessing Readiness,” in Robert C. Pianta and J. J. Cox, eds. 1999. The Transition to Kindergarten. Baltimore, Md.: Paul H. Brookes Publishing Co. National Academies – National Research Council, Institute of Medicine. 2000. News release: “Policies, Programs that Affect Young Children Fail to Keep Pace with Scientific Advances, Changing Society.” October 3. National Center for Early Development and Learning. 1996. National Survey of Kindergarten Transition Practices. Chapel Hill, N.C.: University of North Carolina. National Education Goals Panel. 1997. Special Early Childhood Report. Washington, D.C.: U. S. Government Printing Office. www.negp.gov/publications Office of the Governor and Office of the Superintendent of Public Instruction. 2004. A Guide to the Formation of Washington State’s Early Learning and Development Benchmarks. Olympia, Wash.: State of Washington. www1.dshs.wa.gov/esa/dccel/hsstate.shtml Pianta, Robert C., and Marcia Kraft-Sayre. 2003. Successful Kindergarten Transition: Your Guide to Connecting Children, Families and Schools. Baltimore, Md.: Paul H. Brookes Publishing Co. Shepard, Lorrie, Sharon Lynn Kagan, and Emily Wurtz, eds. 1998. Principles and Recommendations for Early Childhood Assessments. National Education Goals Panel, Goal 1 Early Childhood Assessments Resource Group on Readiness for School. Washington, D.C.: U. S. Government Printing Office. www.negp.gov/publications Shonkoff, J. P., and D. A. Phillips, eds. 2000. From Neurons to Neighborhoods: The Science of Early Childhood Development. Institute of Medicine, National Research Council. Washington, D.C.: National Academy Press. Shore, Rima. 1998. Ready Schools. National Education Goals Panel, Goal 1 Ready Schools Resource Group. Washington, D.C.: U.S. Government Printing Office. www.negp.gov/publications West, Jerry, Kristin Denton, and Lizabeth M. Reaney. 2001. The Kindergarten Year: Findings from the Early Childhood Longitudinal Study, Kindergarten Class of 1998– 99. Washington, D.C.: National Center for Education Statistics. www.nces.ed.gov/pubs2001/2001023.pdf


![KINDERGARTEN PARENT SURVEY 2018...[Service Name] results 9 Kindergarten Parent Opinion Survey 2018 Question: Teachers and educators at the kindergarten service provide updates on your](https://img.pdfslide.net/doc/110x75/5e52369ea58bff1b96542dbd/kindergarten-parent-survey-2018-service-name-results-9-kindergarten-parent.jpg)