Embed Size (px)
Citation preview
A Survey of Recent Empirical Money Demand Studies
SUBRAMANIAN S. SRIRAM*
This paper surveys a selected number of studies that evaluated the demand formoney using the error-correction model approach in the 1990s across a range ofindustrial and developing countries. It briefly presents issues relevant to modelingand estimating the demand for money; and synthesizes information concerningvariables, data period and frequency, unit root and cointegration techniques,stability tests, and findings in a tabular form. In addition, it presents estimatedlong-run income elasticity and elasticities or semi-elasticities for opportunity costand other variables in a comparable framework. It aims to provide a referencetool for future research on demand for money in various countries. [JEL E41]
Demand for money plays a major role in macroeconomic analysis, especiallyin selecting appropriate monetary policy actions. Consequently, a steady
stream of theoretical and empirical research has been carried out worldwide overthe past several decades. The interest has, however, heightened in recent years,triggered primarily by the concern among central banks and researchers on theimpact of the movement toward flexible exchange rate regime, globalization ofcapital markets, ongoing domestic financial liberalization and innovation,advancement in time series econometrics, and country-specific issues.
The extensive literature underscores two major points relevant to modelingand estimating the demand for money: variable selection and representation, and
334
IMF Staff PapersVol. 47, No. 3© 2001 International Monetary Fund
MVPY
=
s
t
−+1
PS
=*
PV
QX
t
t
t+
()
+
+1
yp+ (β
1+( )i
S
*
L Y i( ), *
Y SPP
,
ε+ >*
*This paper was written while the author was with the IMF Research Department; currently he is anEconomist in the IMF Statistics Department. He thanks Michael D. Bradley and Frederick L. Joutz ofGeorge Washington University; Charles Adams, James Boughton, and Timothy D. Lane of the IMF; NeilEricsson of the Board of Governors of the Federal Reserve System, and K.S. Venkatraman, formerly ofthe World Bank, for useful comments.
A SURVEY OF RECENT EMPIRICAL MONEY DEMAND STUDIES
335
framework chosen. Failure to provide due consideration to these issues has tendedto yield poor results. For the former, proper specification of opportunity cost vari-ables happens to be the most important factor in getting meaningful results.Regarding the latter, the chosen system should be free of theoretical and estima-tion problems, and should perform well in empirical testing. The error-correctionmodels (ECMs) have shown to meet these criteria.
This paper surveys a selected number of papers that applied the ECMapproach to analyze the demand for money (of various definitions) during the1990s in several industrial and developing countries.1 The objective is to extractrelevant information from these studies and provide it in a readily useable andcomparable framework. In specific, the paper presents details concerning thetechniques followed, variables chosen, periods and frequency selected, and majorfindings. In addition, it summarizes the long-run income elasticities, interest-ratesemi-elasticities (or elasticities), and the coefficients of other relevant variables.It is hoped that the materials presented in this paper provide some reference pointsconcerning the behavior of money demand in various countries, which in turn willhelp the policy makers in designing appropriate monetary policy actions and theresearchers in carrying out further research.2
The paper is organized as follows: Section I briefly specifies the generalframework that usually underlies the empirical formulation in estimating thedemand for money. Section II carries out relevant discussion regarding the vari-ables and estimation techniques, and summarizes information concerning variousstudies including the findings and estimated coefficients. Finally, Section IIIpresents the conclusions.
I. General Framework
There is a diverse spectrum of money demand theories emphasizing the transac-tions, speculative, precautionary or utility considerations.3 These theories implic-itly address a broad range of hypotheses. One significant aspect, however, is thatthey share common important elements (variables) among almost all of them. Ingeneral, they bring forth relationship between the quantity of money demandedand a set of few important economic variables linking money to the real sector ofthe economy (see Judd and Scadding, 1982, p. 993). What sets apart among thesetheories is that although they consider similar variables to explain the demand formoney, they frequently differ in the specific role assigned to each. Consequentlyone consensus that emerges from the literature is that the empirical work is moti-vated by a blend of theories.
The general specification begins with the following functional relationshipfor the long-term demand for money:
1This paper is based on Sriram (1999b, 1999c, and 2000). There have been other survey papers (forexample, Judd and Scadding, 1982; Goldfeld and Sichel, 1990; Boughton, 1992; Laidler, 1993); but none ofthem focused exclusively on ECMs and covering a wide range of both industrial and developing countries.
2Refer to Ericsson (1998) for general issues concerning the empirical modeling of money demand.3See, Laidler (1993) and Sriram (1999c), among others, for a survey of these approaches.
(1)
where the demand for real balances M/P is a function of the chosen scale variable(S) to represent the economic activity and the opportunity cost of holding money(OC). M stands for the selected monetary aggregate in nominal term and P for theprice. Like in theoretical models, the empirical models generally specify themoney demand as a function of real balances (see Laidler, 1993).4
II. Discussion on Variables and Estimation Techniques
Given the above general framework, this section provides a brief overview ofissues concerning selection and representation of variables, modeling, and esti-mation. Sriram (1999c) presents detailed account of these issues, including rele-vant references justifying various approaches undertaken by the researchers. Theliterature shows that money demand has been estimated for various aggregates,their components, or certain combination of these components. As definitions ofmoney differ across countries (see Boughton, 1992, and Kumah, 1989), measuresconsidered, including divisia aggregates, also varied across studies. Scale variableis used in the estimation as a measure of transactions relating to the economicactivity. It is usually represented by variables expressing income, expenditure, orwealth concept (although a host of other variables is discussed in the literature).The price variable is selected to follow closely the chosen scale variable, althoughconsumer price index is the most commonly used measure.
One of the most important aspects of modeling the demand for money is theselection of appropriate opportunity cost variables. The literature has shown thatstudies which paid inadequate attention on this matter produced poor results.There are two major ingredients: (i) own-rate and (ii) alternative return on money.The former happens to be very important, especially if the financial innovation hasbeen taking place in an economy (see Ericsson, 1998). The latter involves yieldson domestic financial and real assets for a closed economy, and additionally onforeign assets for an open economy. A number of instruments are available torepresent the yields on domestic financial assets. The yield on real assets is usuallyproxied by the expected inflation. And, on foreign assets by foreign interest rateor some form of exchange rate variable. Prior to selecting appropriate opportunitycost variables, careful attention should be paid on evaluating macroeconomic situ-ation and developments in the financial system (including institutional details andthe regulatory environment), and degree of openness of the economy.
The economic theory provides some guidance in reference to the relationshipbetween demand for money and its arguments. As the scale variable represents thetransactions or wealth effects, it is positively related to the demand for money. The
MP
f S OC= ( ),
Subramanian S. Sriram
336
4Using the real money balance as the dependent variable will also mean that price homogeneity is explic-itly imposed into the model. Additionally, there are less severe econometric problems associated with usingreal rather than nominal balances as the dependent variable (see Boughton, 1981, and Johansen, 1992b). And,majority of the empirical work does find evidence for the demand being for real balances.
own-rate is expected to be positively related as higher the return on money, lessthe incentive to hold assets alternative for money. Conversely, higher the returnson alternative assets, lower the incentive to hold money, and hence, the coeffi-cients of alternative returns expected to be negative. The expected inflation gener-ally affects the demand for money negatively as agents prefer to hold real assetsas hedges during the periods of rising inflation. The foreign interest rates areexpected to exert negative influence as increase in foreign interest rates potentiallyinduce the domestic residents to increase their holdings of foreign assets whichwill be financed by drawing down domestic money holdings. Similarly, theexpected exchange depreciation will also have a negative relationship. An increasein expected depreciation implies that the expected returns from holding foreignmoney increases, and hence, agents would substitute the domestic currency forforeign currency.5
The economic theory does not provide any rationale as to the correct mathe-matical form of the money demand function. There is consensus, however, that thelog-linear version is the most appropriate functional form (see Zarembka, 1968).While money and scale variables typically enter in logarithms, interest rate vari-ables appear either in levels or in logarithms. Consequently, estimates of the coef-ficient for the scale variable directly provides the measure of income elasticity,and those of interest rates show either elasticities or semi-elasticities depending onthe way they are introduced in the formulation.
The partial adjustment framework was extremely popular in the 1970s.However, it was shown to suffer from specification problem and highly restrictivedynamics (see, for example, Cooley and LeRoy, 1981; Goodfriend, 1985; Hendry,1979 and 1985; Hendry and Mizon, 1978). To counter these problems, two majorsolutions were proposed—modifying the theoretical base and improving thedynamic structure. The former led to buffer-stock models (BSMs), which werebuilt upon the theory of precautionary demand for money (see, for example,Laidler, 1984; Cuthbertson and Taylor, 1987; Milbourne, 1988), and the latter toECMs.6 The BSMs also ran into criticism, especially in their relevance in theempirical estimation (see Milbourne, 1988). Meanwhile, ECMs seem to bepromising. An important aspect of these models is that the data characteristics arethoroughly examined before selecting the appropriate estimation techniques.Furthermore, lag structures are selected based on the data generating process ofthe economic variables and not on a priori based on the economic theory or naivedynamic theory.
The ECM is shown to contain information on both the short- and long-runproperties of the model with disequilibrium as a process of adjustment to the long-run equilibrium. Granger (1983 and 1986) has demonstrated that the concept ofstable long-run equilibrium is the statistical equivalence of cointegration. Whencointegration holds and if there is any shock that causes disequilibrium, thereexists a well-defined short-term dynamic adjustment process such as the error-
A SURVEY OF RECENT EMPIRICAL MONEY DEMAND STUDIES
337
5Refer to Jusoh (1987) and Tan (1997) for reasons to expect positive relationship for expected inflationand expected exchange rate depreciation with the demand for real money respectively.
6In fact, Hendry, Pagan, and Sargan (1984) showed that PAMs and BSMs form the special cases of ECMs.
correction mechanism that will push back the system toward the long-run equilib-rium. In fact, cointegration does imply the existence of a dynamic error-correctionform relating to variables in question (see Engle and Granger, 1987). The majoradvantage of the error-correction modeling is that the economic theory is allowedto specify the long-run equilibrium while the short-run dynamics be defined fromthe data.
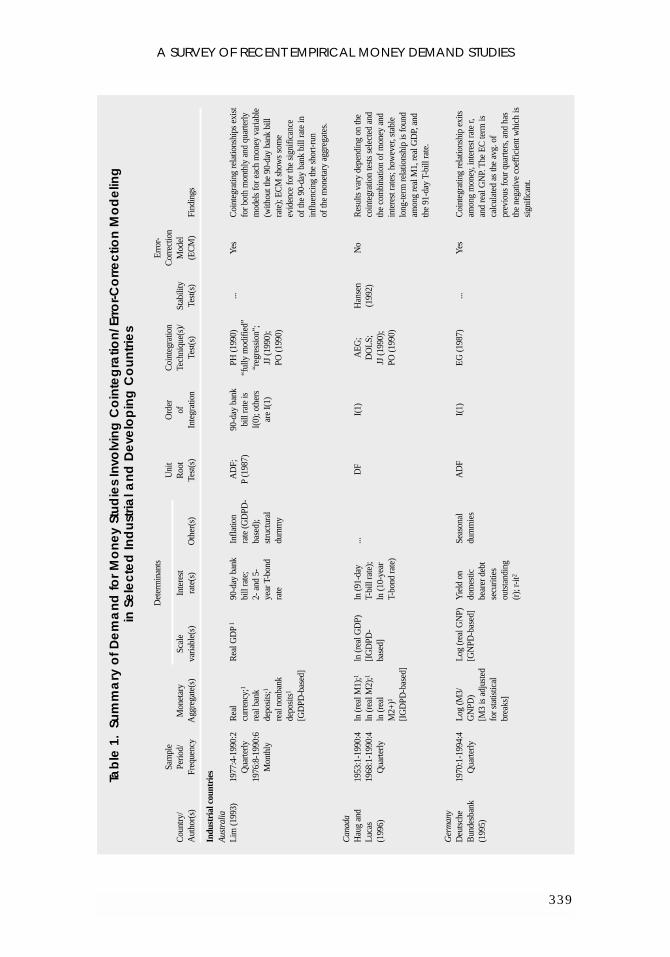
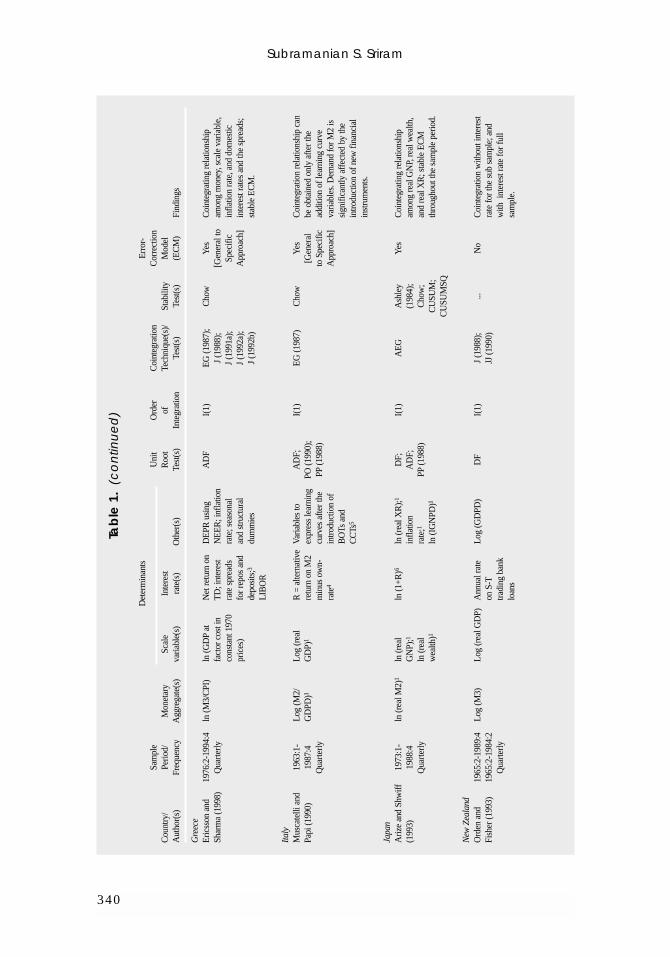
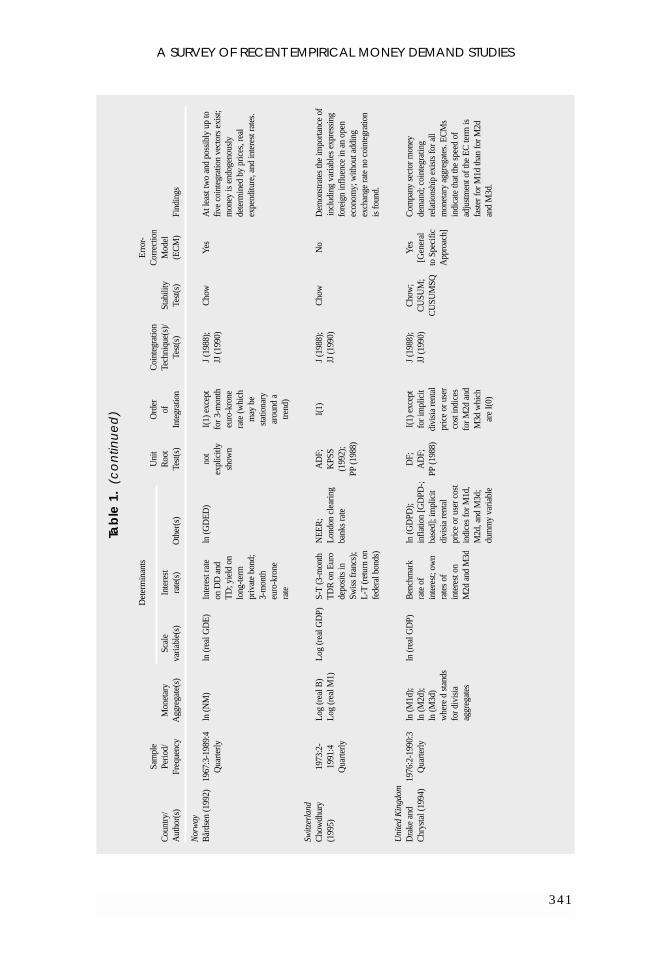
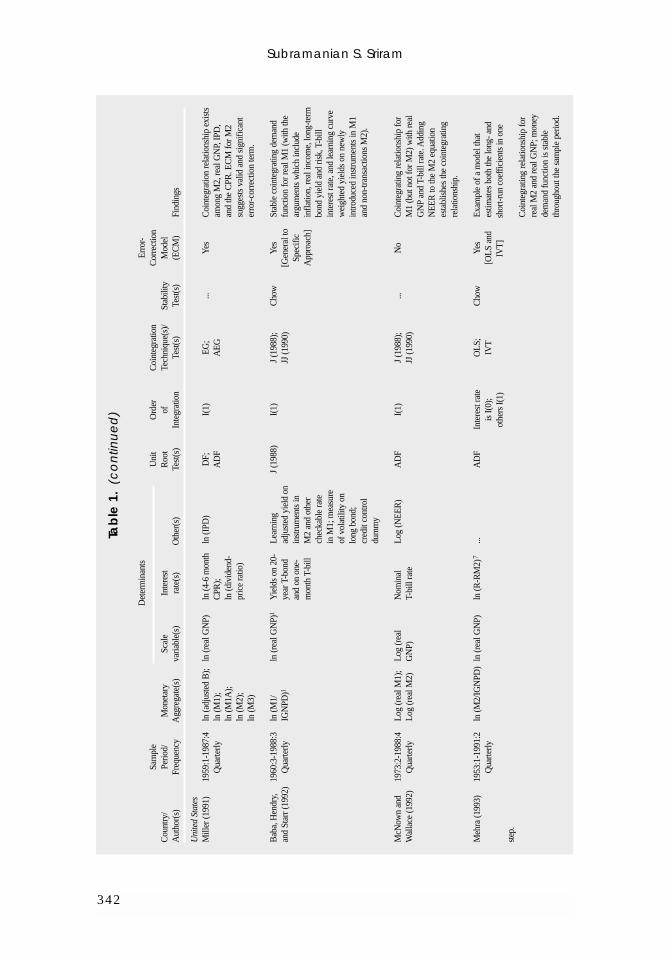
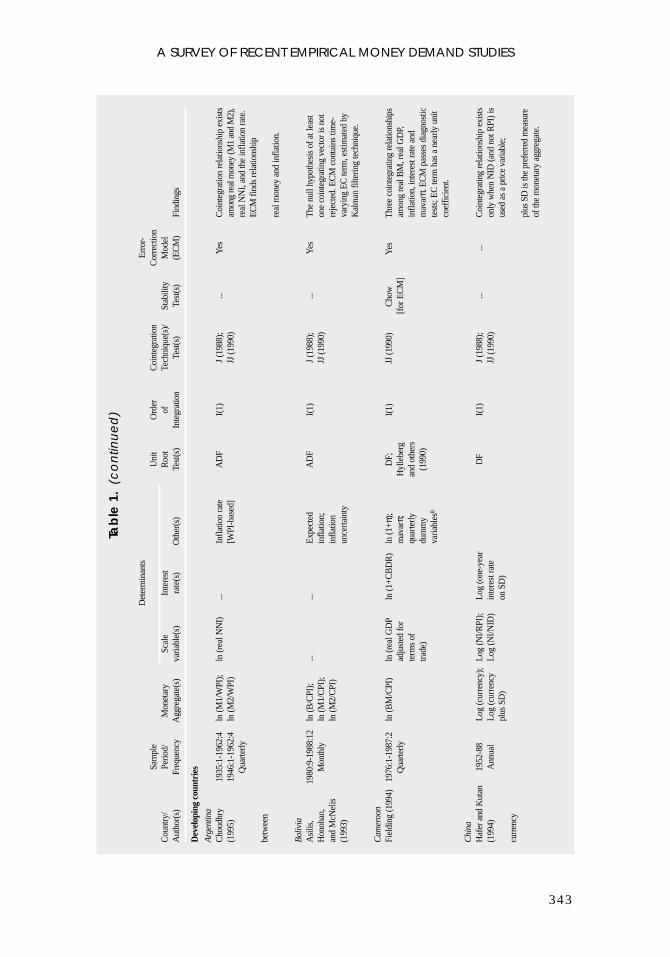
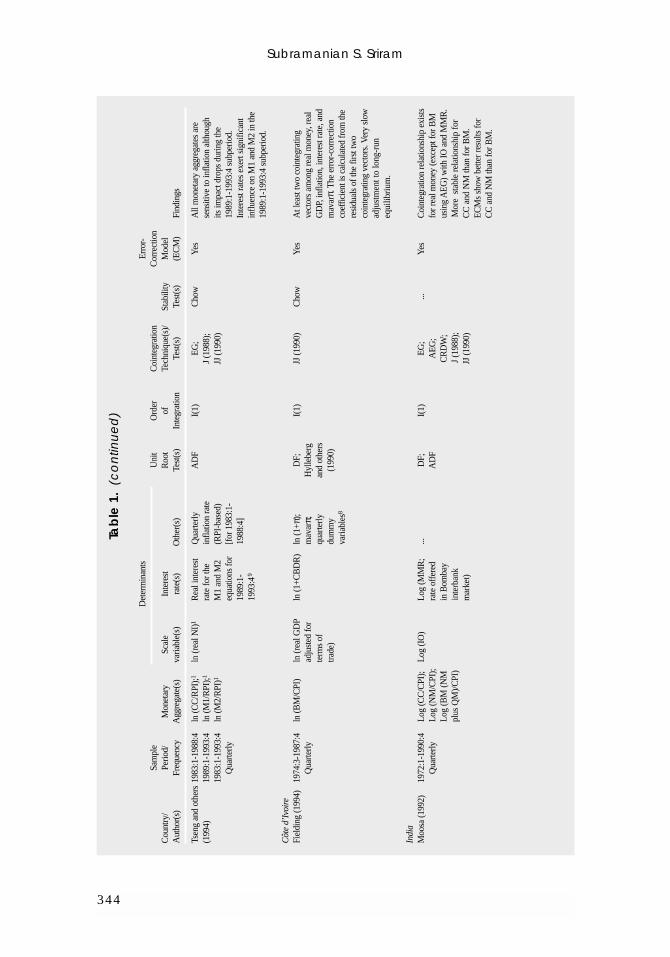
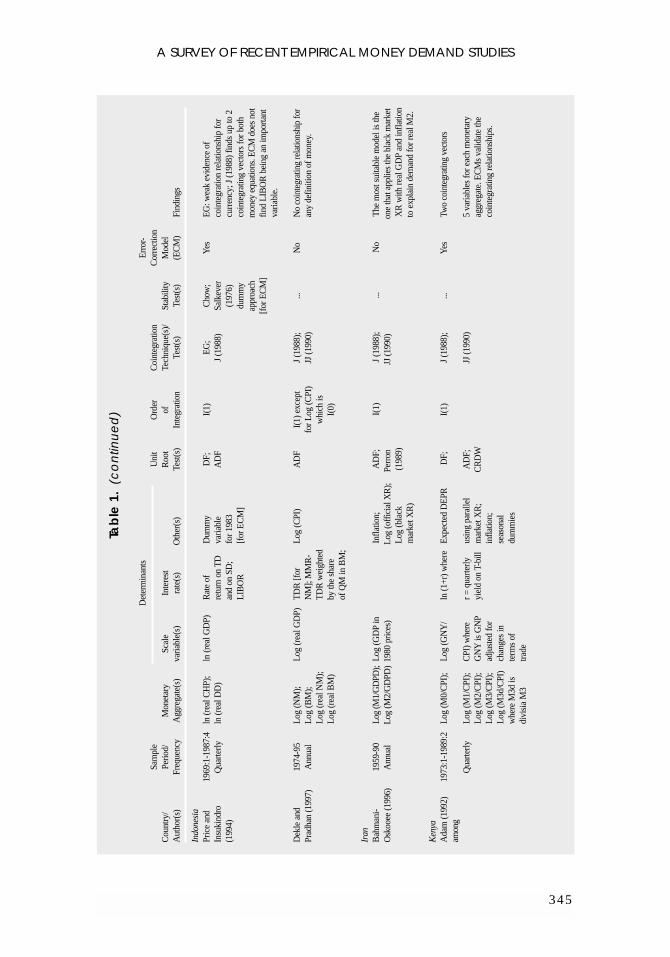
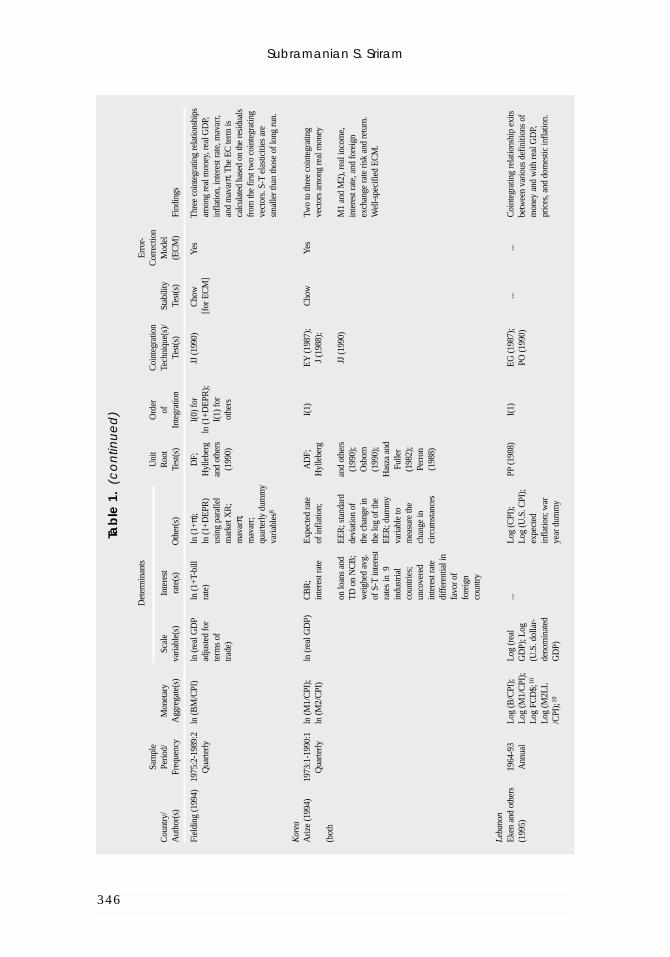
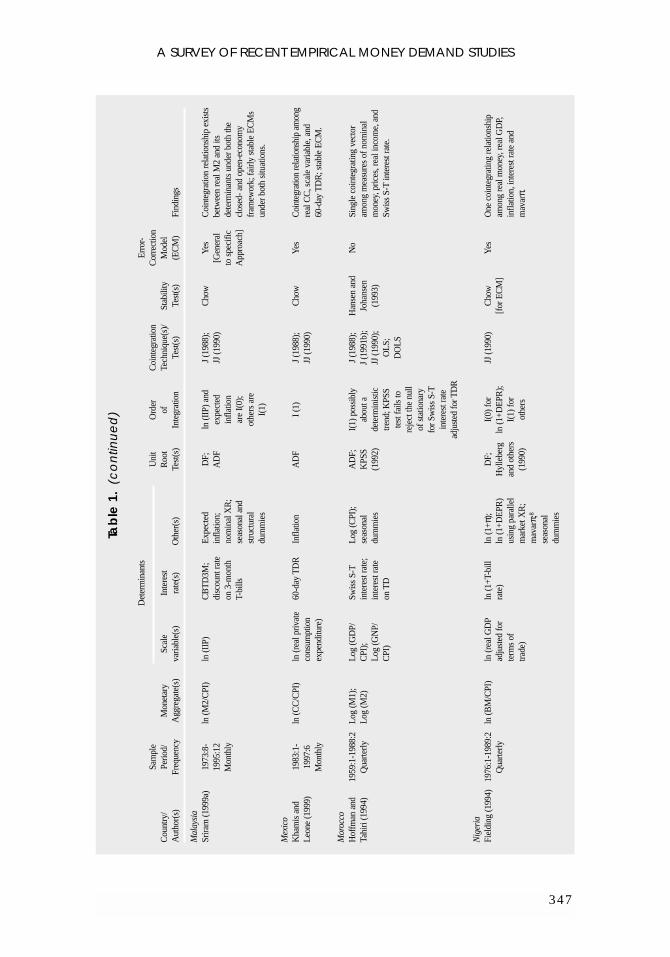
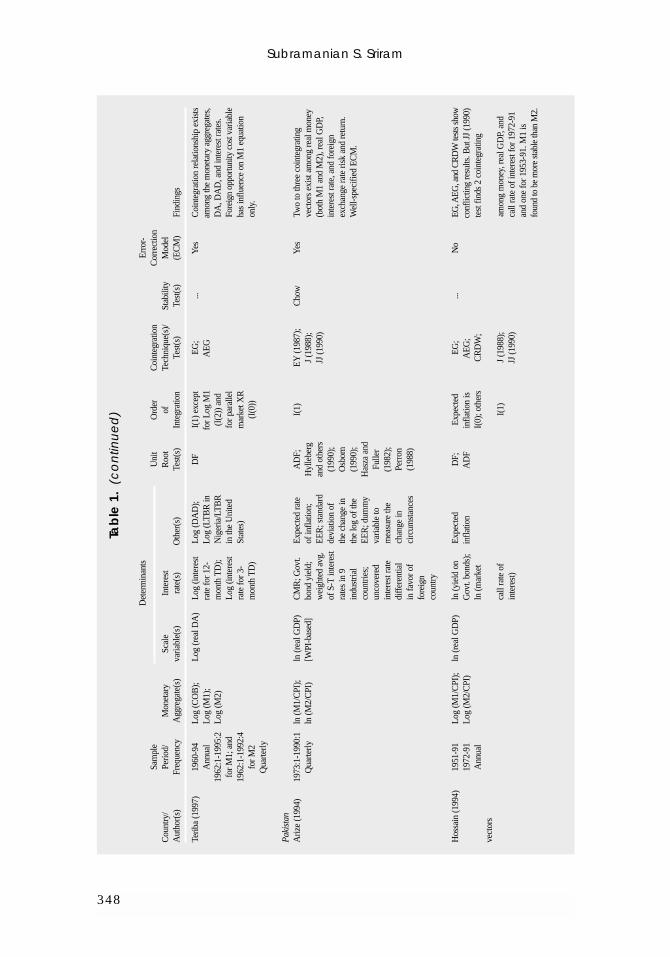
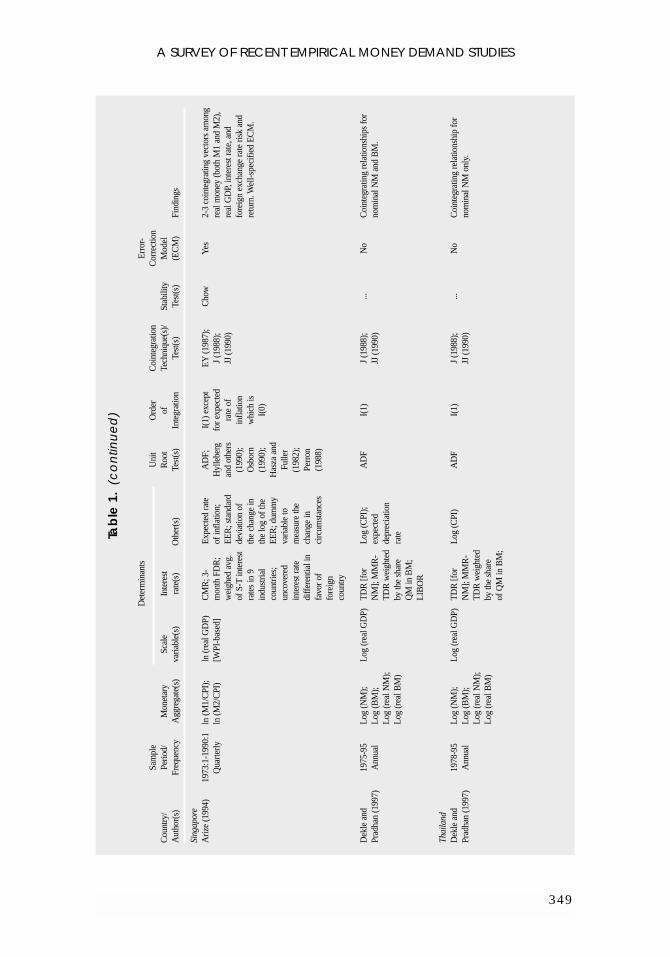
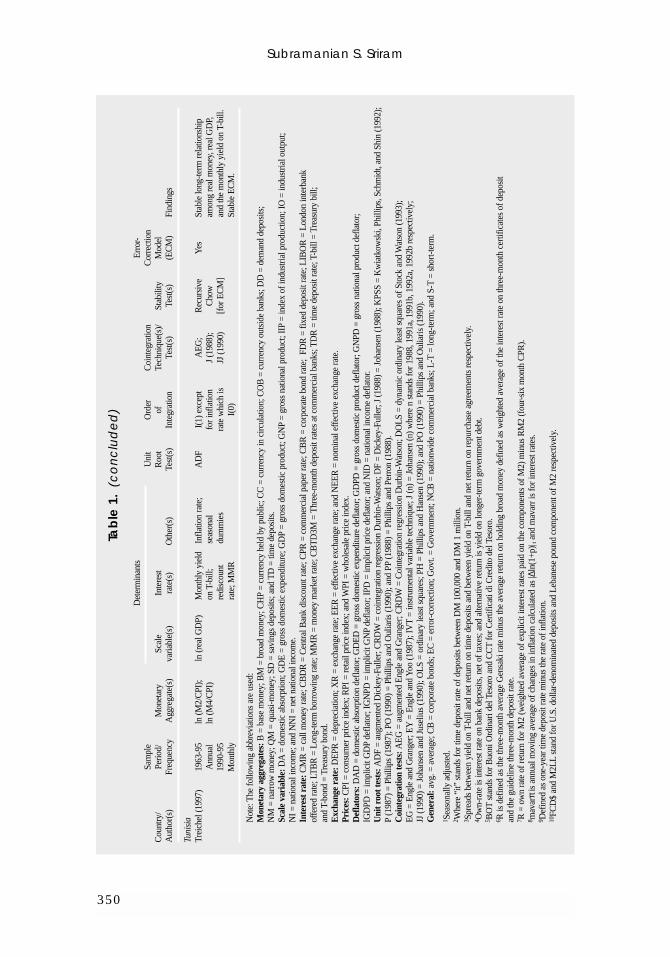
The earlier ECMs on money demand tended to be based on the single equa-tion cointegrating relationship between money and the chosen scale variables asdeveloped by Engle and Granger (1987). However, further research suggested thatmultivariate cointegrating vectors encompassing a broader number of variablesprovided a fuller characterization of the long-run determinants of demand. Thespecification of such multiple cointegrating vectors between nonstationary vari-ables primarily employs the procedures developed by Johansen (1988) andJohansen and Juselius (1990) which make the original Engle-Granger frameworka special case. However, as can be seen from Table 1, a number of other measuresavailable to conduct the cointegration analysis.7
Table 1 also presents details relevant to modeling and estimating the demandfor money from various studies. In specific, it summarizes information for a cross-section of developing and industrial countries, on monetary aggregates (nominalor real), scale variable(s), and the opportunity cost and other variables included;data period and frequency chosen; unit root, cointegration, and stability testsapplied; nature of various time series (such as the order of integration and whetherseasonally adjusted or not). It also presents the findings. The presentation of infor-mation will enable the researchers to draw some insights into the justification ofselecting diverse set of variables and approaches across various countries.
Table 2 summarizes the long-run income elasticities and the semi-elasticities orelasticities of opportunity cost and other variables from those studies listed in Table1. As the short-run dynamics can be potentially complicated, the table concentratesonly on the long-run results. In order to promote comparability, the results are shownonly for those studies which reported the long-term relationship (existence of cointe-gration). If more than one cointegration relationship is found, results are reported onlyfor the preferred cointegration vector(s) as identified by the author(s), which not onlymeet a battery of statistical tests but also economically make sense with correct signsof the variables and meaningful size of coefficients.
Figures 1–3 show the distribution of income elasticities for real money aspresented in Table 2 for components of narrow money, narrow money, and broadmoney respectively. The relevant descriptive statistics is shown in Table 3. It isclear from the table, the medians for all three groups are closer to one than to 0.5thereby indicating that money does not play the role of transaction measure alone.There is no clear guidance from the theory or empirical studies regarding theacceptable magnitude on elasticities or semi-elasticities of the opportunity costvariables. The most relevant information will be the signs of the coefficients—positive for own-rate and negative for alternative return on money and expected
Subramanian S. Sriram
338
7Refer to Sriram (1999c) for a longer list of studies that applied the ECM framework to analyze thedemand for money in the past two decades.
A SURVEY OF RECENT EMPIRICAL MONEY DEMAND STUDIES
339
Tab
le 1
.Su
mm
ary
of D
em
an
d fo
r M
on
ey
Stu
die
s In
volv
ing
Co
inte
gra
tion
/Err
or-C
orr
ec
tion
Mo
de
ling
in
Se
lec
ted
Ind
ust
rial a
nd
De
velo
pin
g C
ou
ntri
es
Det
erm
inan
tsE
rror
-Sa
mpl
eU
nit
Ord
erC
oint
egra
tion
Cor
rect
ion
Cou
ntry
/Pe
riod/
Mon
etar
ySc
ale
Inte
rest
Roo
tof
Tech
niqu
e(s)
/St
abili
tyM
odel
Aut
hor(
s)Fr
eque
ncy
Agg
rega
te(s
)va
riabl
e(s)
rate
(s)
Oth
er(s
)Te
st(s
)In
tegr
atio
nTe
st(s
)Te
st(s
)(E
CM
)Fi
ndin
gs
Indu
stri
al c
ount
ries
Aus
tral
iaL
im (1
993)
1977
:4-1
990:
2R
eal
Rea
l GD
P1
90-d
ay b
ank
Infla
tion
AD
F;90
-day
ban
kPH
(199
0)...
Yes
Coi
nteg
ratin
g re
latio
nshi
ps e
xist
Qua
rterly
curr
ency
;1bi
ll ra
te;
rate
(GD
PD-
P(1
987)
bill
rate
is“f
ully
mod
ified
” fo
r bot
h m
onth
ly a
nd q
uarte
rly19
76:8
-199
0:6
real
ban
k 2-
and
5-
base
d);
I(0)
; oth
ers
“reg
ress
ion”
;m
odel
s fo
r eac
h m
oney
var
iabl
eM
onth
lyde
posi
ts;1
year
T-b
ond
stru
ctur
alar
e I(
1)JJ
(199
0);
(with
out t
he 9
0-da
y ba
nk b
illre
al n
onba
nkra
tedu
mm
yPO
(199
0)ra
te);
EC
M s
how
s so
me
depo
sits
1ev
iden
ce fo
r the
sig
nific
ance
[GD
PD-b
ased
]of
the
90-d
ay b
ank
bill
rate
in
influ
enci
ng th
e sh
ort-r
un
of th
e m
onet
ary
aggr
egat
es.
Can
ada
Hau
g an
d 19
53:1
-199
0:4
ln (r
eal M
1);1
ln (r
eal G
DP)
ln (9
1-da
y...
DF
I(1)
AE
G;
Han
sen
No
Res
ults
var
y de
pend
ing
on th
eL
ucas
19
68:1
-199
0:4
ln (r
eal M
2);1
[IG
DPD
-T-
bill
rate
);D
OL
S;(1
992)
coin
tegr
atio
n te
sts
sele
cted
and
(199
6)Q
uarte
rlyln
(rea
lba
sed]
ln (1
0-ye
arJJ
(199
0);
the
com
bina
tion
of m
oney
and
M2+
)1T-
bond
rate
)PO
(199
0)in
tere
st ra
tes;
how
ever
, sta
ble
[IG
DPD
-bas
ed]
long
-term
rela
tions
hip
is fo
und
amon
g re
al M
1, re
al G
DP,
and
the
91-d
ay T
-bill
rate
.
Ger
man
yD
euts
che
1970
:1-1
994:
4L
og (M
3/L
og (r
eal G
NP)
Yie
ld o
n Se
ason
al
AD
FI(
1)E
G (1
987)
...Y
esC
oint
egra
ting
rela
tions
hip
exits
Bun
desb
ank
Qua
rterly
GN
PD)
[GN
PD-b
ased
]do
mes
ticdu
mm
ies
amon
g m
oney
, int
eres
t rat
e r,
(199
5)[M
3 is
adj
uste
dbe
arer
deb
tan
d re
al G
NP.
The
EC
term
isfo
r sta
tistic
alse
curit
ies
calc
ulat
ed a
s th
e av
g. o
f br
eaks
]ou
tsta
ndin
g pr
evio
us fo
ur q
uarte
rs, a
nd h
as
(r);
r-it2
the
nega
tive
coef
ficie
nt w
hich
is
sign
ifica
nt.
Subramanian S. Sriram
340
Tab
le 1
.(c
on
tinu
ed
)
Det
erm
inan
tsE
rror
-Sa
mpl
eU
nit
Ord
erC
oint
egra
tion
Cor
rect
ion
Cou
ntry
/Pe
riod/
Mon
etar
ySc
ale
Inte
rest
Roo
tof
Tech
niqu
e(s)
/St
abili
tyM
odel
Aut
hor(
s)Fr
eque
ncy
Agg
rega
te(s
)va
riabl
e(s)
rate
(s)
Oth
er(s
)Te
st(s
)In
tegr
atio
nTe
st(s
)Te
st(s
)(E
CM
)Fi
ndin
gs
Gre
ece
Eric
sson
and
1976
:2-1
994:
4ln
(M3/
CPI
)ln
(GD
Pat
Net
retu
rn o
nD
EPR
usi
ngA
DF
I(1)
EG
(198
7);
Cho
wY
esC
oint
egra
ting
rela
tions
hip
Shar
ma
(199
8)Q
uarte
rlyfa
ctor
cos
t in
TD
; int
eres
tN
EE
R; i
nfla
tion
J (1
988)
;[G
ener
al to
amon
g m
oney
, sca
le v
aria
ble,
co
nsta
nt 1
970
rate
spr
eads
ra
te; s
easo
nal
J (1
991a
);Sp
ecifi
cin
flatio
n ra
te, a
nd d
omes
tic
pric
es)
for r
epos
and
an
d st
ruct
ural
J (1
992a
);A
ppro
ach]
inte
rest
rate
s an
d th
e sp
read
s;
depo
sits
;3du
mm
ies
J (1
992b
)st
able
EC
M.
LIB
OR
Italy
Mus
cate
lli a
nd19
63:1
-L
og (M
2/L
og (r
eal
R =
alte
rnat
ive
Var
iabl
es to
AD
F;I(
1)E
G (1
987)
Cho
wY
esC
oint
egra
tion
rela
tions
hip
can
Papi
(199
0)19
87:4
GD
PD)1
GD
P)1
retu
rn o
n M
2ex
pres
s le
arni
ngPO
(199
0);
[Gen
eral
be o
btai
ned
only
afte
r the
Q
uarte
rlym
inus
ow
n-cu
rves
afte
r the
PP(1
988)
to S
peci
ficad
ditio
n of
lear
ning
cur
ve
rate
4in
trodu
ctio
n of
App
roac
h]va
riabl
es. D
eman
d fo
r M2
is
BO
Ts a
nd
sign
ifica
ntly
aff
ecte
d by
the
CC
Ts5
intro
duct
ion
of n
ew fi
nanc
ial
inst
rum
ents
.
Japa
nA
rize
and
Shw
iff19
73:1
-ln
(rea
l M2)
1ln
(rea
lln
(1+R
)6ln
(rea
l XR
);1D
F;I(
1)A
EG
Ash
ley
Yes
Coi
nteg
ratin
g re
latio
nshi
p (1
993)
1988
:4
GN
P);1
infla
tion
AD
F;(1
984)
;am
ong
real
GN
P, re
al w
ealth
, Q
uarte
rlyln
(rea
lra
te;1
PP(1
988)
Cho
w;
and
real
XR
; sta
ble
EC
M
wea
lth)1
ln (I
GN
PD)1
CU
SUM
;th
roug
hout
the
sam
ple
perio
d.C
USU
MSQ
New
Zea
land
Ord
en a
nd
1965
:2-1
989:
4L
og (M
3)L
og (r
eal G
DP)
Ann
ual r
ate
Log
(GD
PD)
DF
I(1)
J (1
988)
;...
No
Coi
nteg
ratio
n w
ithou
t int
eres
t Fi
sher
(199
3)19
65:2
-198
4:2
on S
-TJJ
(199
0)ra
te fo
r the
sub
sam
ple;
and
Q
uarte
rlytra
ding
ban
kw
ith i
nter
est r
ate
for f
ull
loan
ssa
mpl
e.
A SURVEY OF RECENT EMPIRICAL MONEY DEMAND STUDIES
341
Tab
le 1
.(c
on
tinu
ed
)
Det
erm
inan
tsE
rror
-Sa
mpl
eU
nit
Ord
erC
oint
egra
tion
Cor
rect
ion
Cou
ntry
/Pe
riod/
Mon
etar
ySc
ale
Inte
rest
Roo
tof
Tech
niqu
e(s)
/St
abili
tyM
odel
Aut
hor(
s)Fr
eque
ncy
Agg
rega
te(s
)va
riabl
e(s)
rate
(s)
Oth
er(s
)Te
st(s
)In
tegr
atio
nTe
st(s
)Te
st(s
)(E
CM
)Fi
ndin
gs
Nor
way
Bår
dsen
(199
2)19
67:3
-198
9:4
ln (N
M)
ln (r
eal G
DE
)In
tere
st ra
teln
(GD
ED
)no
tI(
1) e
xcep
tJ
(198
8);
Cho
w
Yes
At l
east
two
and
poss
ibly
up
toQ
uarte
rlyon
DD
and
expl
icitl
yfo
r 3-m
onth
JJ (1
990)
five
coin
tegr
atio
n ve
ctor
s ex
ist;
TD
; yie
ld o
nsh
own
euro
-kro
nem
oney
is e
ndog
enou
sly
long
-term
rate
(whi
chde
term
ined
by
pric
es, r
eal
priv
ate
bond
;m
ay b
e ex
pend
iture
, and
inte
rest
rate
s.3-
mon
th
stat
iona
ry
euro
-kro
ne
arou
nd a
ra
tetre
nd)
Switz
erla
ndC
how
dhur
y19
73:2
-L
og (r
eal B
)L
og (r
eal G
DP)
S-T
(3-m
onth
NE
ER
;A
DF;
I(1)
J (1
988)
;C
how
No
Dem
onst
rate
s th
e im
porta
nce
of(1
995)
1991
:4L
og (r
eal M
1)T
DR
on
Eur
oL
ondo
n cl
earin
gK
PSS
JJ (1
990)
incl
udin
g va
riabl
es e
xpre
ssin
g Q
uarte
rlyde
posi
ts in
ba
nks
rate
(199
2);
fore
ign
influ
ence
in a
n op
en
Swis
s fr
ancs
);PP
(198
8)ec
onom
y; w
ithou
t add
ing
L-T
(ret
urn
onex
chan
ge ra
te n
o co
inte
grat
ion
fede
ral b
onds
)is
foun
d.
Uni
ted
Kin
gdom
Dra
ke a
nd
1976
:2-1
990:
3ln
(M1d
);ln
(rea
l GD
P)B
ench
mar
kln
(GD
PD);
DF;
I(1)
exc
ept
J (1
988)
;C
how
;Y
esC
ompa
ny s
ecto
r mon
ey
Chr
ysta
l (19
94)
Qua
rterly
ln (M
2d);
rate
of
infla
tion
[GD
PD-;
AD
F;fo
r im
plic
itJJ
(199
0)C
USU
M;
[Gen
eral
dem
and;
coi
nteg
ratin
g ln
(M3d
)in
tere
st; o
wn
base
d]; i
mpl
icit
PP(1
988)
divi
sia
rent
alC
USU
MSQ
to S
peci
fic
rela
tions
hip
exis
ts fo
r all
whe
re d
sta
nds
rate
s of
di
visi
a re
ntal
pric
e or
use
r A
ppro
ach]
mon
etar
y ag
greg
ates
. EC
Ms
for d
ivis
iain
tere
st o
npr
ice
or u
ser c
ost
cost
indi
ces
indi
cate
that
the
spee
d of
ag
greg
ates
M2d
and
M3d
indi
ces
for M
1d,
for M
2d a
ndad
just
men
t of t
he E
C te
rm is
M
2d, a
nd M
3d;
M3d
whi
chfa
ster
for M
1d th
an fo
r M2d
du
mm
y va
riabl
ear
e I(
0)an
d M
3d.
Subramanian S. Sriram
342
Tab
le 1
.(c
on
tinu
ed
)
Det
erm
inan
tsE
rror
-Sa
mpl
eU
nit
Ord
erC
oint
egra
tion
Cor
rect
ion
Cou
ntry
/Pe
riod/
Mon
etar
ySc
ale
Inte
rest
Roo
tof
Tech
niqu
e(s)
/St
abili
tyM
odel
Aut
hor(
s)Fr
eque
ncy
Agg
rega
te(s
)va
riabl
e(s)
rate
(s)
Oth
er(s
)Te
st(s
)In
tegr
atio
nTe
st(s
)Te
st(s
)(E
CM
)Fi
ndin
gs
Uni
ted
Stat
esM
iller
(199
1)19
59:1
-198
7:4
ln (a
djus
ted
B);
ln (r
eal G
NP)
ln (4
-6 m
onth
ln (I
PD)
DF;
I(1)
EG
;...
Yes
Coi
nteg
ratio
n re
latio
nshi
p ex
ists
Qua
rterly
ln (M
1);
CPR
);A
DF
AE
Gam
ong
M2,
real
GN
P, IP
D,
ln (M
1A);
ln (d
ivid
end-
and
the
CPR
. EC
M fo
r M2
ln (M
2);
pric
e ra
tio)
sugg
ests
val
id a
nd s
igni
fican
t ln
(M3)
erro
r-co
rrec
tion
term
.
Bab
a, H
endr
y,19
60:3
-198
8:3
ln (M
1/ln
(rea
l GN
P)1
Yie
lds
on 2
0-L
earn
ing
J (1
988)
I(1)
J (1
988)
;C
how
Yes
Stab
le c
oint
egra
ting
dem
and
and
Star
r (19
92)
Qua
rterly
IGN
PD)1
year
T-b
ond
adju
sted
yie
ld o
nJJ
(199
0)[G
ener
al to
func
tion
for r
eal M
1 (w
ith th
ean
d on
one
-in
stru
men
ts in
Spec
ific
argu
men
ts w
hich
incl
ude
mon
th T
-bill
M2
and
othe
rA
ppro
ach]
infla
tion,
real
inco
me,
long
-term
ch
ecka
ble
rate
bond
yie
ld a
nd ri
sk, T
-bill
in
M1;
mea
sure
inte
rest
rate
, and
lear
ning
cur
ve
of v
olat
ility
on
wei
ghte
d yi
elds
on
new
ly
long
bon
d;
intro
duce
d in
stru
men
ts in
M1
cred
it co
ntro
lan
d no
n-tra
nsac
tions
M2)
.du
mm
y
McN
own
and
1973
:2-1
988:
4L
og (r
eal M
1);
Log
(rea
lN
omin
alL
og (N
EE
R)
AD
FI(
1)J
(198
8);
...N
oC
oint
egra
ting
rela
tions
hip
for
Wal
lace
(199
2)Q
uarte
rlyL
og (r
eal M
2)G
NP)
T-bi
ll ra
teJJ
(199
0)
M1
(but
not
for M
2) w
ith re
al
GN
Pan
d T-
bill
rate
. Add
ing
NE
ER
to th
e M
2 eq
uatio
nes
tabl
ishe
s th
e co
inte
grat
ing
rela
tions
hip.
Meh
ra (1
993)
1953
:1-1
991:
2ln
(M2/
IGN
PD)
ln (r
eal G
NP)
ln (R
-RM
2)7
...A
DF
Inte
rest
rate
OL
S;C
how
Yes
Exa
mpl
e of
a m
odel
that
Qua
rterly
is I(
0);
IVT
[OL
S an
des
timat
es b
oth
the
long
- and
ot
hers
I(1)
IVT]
shor
t-run
coe
ffic
ient
s in
one
step
.C
oint
egra
ting
rela
tions
hip
for
real
M2
and
real
GN
P; m
oney
dem
and
func
tion
is s
tabl
e th
roug
hout
the
sam
ple
perio
d.
A SURVEY OF RECENT EMPIRICAL MONEY DEMAND STUDIES
343
Tab
le 1
.(c
on
tinu
ed
)
Det
erm
inan
tsE
rror
-Sa
mpl
eU
nit
Ord
erC
oint
egra
tion
Cor
rect
ion
Cou
ntry
/Pe
riod/
Mon
etar
ySc
ale
Inte
rest
Roo
tof
Tech
niqu
e(s)
/St
abili
tyM
odel
Aut
hor(
s)Fr
eque
ncy
Agg
rega
te(s
)va
riabl
e(s)
rate
(s)
Oth
er(s
)Te
st(s
)In
tegr
atio
nTe
st(s
)Te
st(s
)(E
CM
)Fi
ndin
gs
Dev
elop
ing
coun
trie
sA
rgen
tina
Cho
udhr
y19
35:1
-196
2:4
ln (M
1/W
PI);
ln (r
eal N
NI)
...In
flatio
n ra
teA
DF
I(1)
J (1
988)
;...
Yes
Coi
nteg
ratio
n re
latio
nshi
p ex
ists
(199
5)19
46:1
-196
2:4
ln (M
2/W
PI)
[WPI
-bas
ed]
JJ (1
990)
amon
g re
al m
oney
(M1
and
M2)
,Q
uarte
rlyre
al N
NI,
and
the
infla
tion
rate
. E
CM
find
s re
latio
nshi
pbe
twee
nre
al m
oney
and
infla
tion.
Bol
ivia
Asi
lis,
1980
:9-1
988:
12ln
(B/C
PI);
......
Exp
ecte
dA
DF
I(1)
J (1
988)
;...
Yes
The
nul
l hyp
othe
sis
of a
t lea
stH
onoh
an,
Mon
thly
ln (M
1/C
PI);
infla
tion;
JJ (1
990)
one
coin
tegr
atin
g ve
ctor
is n
otan
d M
cNel
isln
(M2/
CPI
)in
flatio
nre
ject
ed. E
CM
con
tain
s tim
e-(1
993)
unce
rtain
tyva
ryin
g E
C te
rm, e
stim
ated
by
Kal
man
filte
ring
tech
niqu
e.
Cam
eroo
nFi
eldi
ng (1
994)
1976
:1-1
987:
2ln
(BM
/CPI
)ln
(rea
l GD
Pln
(1+C
BD
R)
ln (1
+π);
DF;
I(1)
JJ (1
990)
Cho
wY
esTh
ree
coin
tegr
atin
g re
latio
nshi
psQ
uarte
rlyad
just
ed fo
rm
avar
π;
Hyl
lebe
rg[f
or E
CM
]am
ong
real
BM
, rea
l GD
P,te
rms
of
quar
terly
an
d ot
hers
infla
tion,
inte
rest
rate
and
trade
)du
mm
y(1
990)
mav
arπ.
EC
M p
asse
s di
agno
stic
varia
bles
8te
sts;
EC
term
has
a n
early
uni
tco
effic
ient
.
Chi
naH
afer
and
Kut
an19
52-8
8L
og (c
urre
ncy)
;L
og (N
I/RPI
);L
og (o
ne-y
ear
DF
I(1)
J (1
988)
;...
...C
oint
egra
ting
rela
tions
hip
exis
ts
(199
4)A
nnua
lL
og (c
urre
ncy
Log
(NI/N
ID)
inte
rest
rate
JJ (1
990)
only
whe
n N
ID (a
nd n
ot R
PI) i
spl
us S
D)
on S
D)
used
as
a pr
ice
varia
ble;
curr
ency
plus
SD
is th
e pr
efer
red
mea
sure
of th
e m
onet
ary
aggr
egat
e.
Subramanian S. Sriram
344
Tab
le 1
.(c
on
tinu
ed
)
Det
erm
inan
tsE
rror
-Sa
mpl
eU
nit
Ord
erC
oint
egra
tion
Cor
rect
ion
Cou
ntry
/Pe
riod/
Mon
etar
ySc
ale
Inte
rest
Roo
tof
Tech
niqu
e(s)
/St
abili
tyM
odel
Aut
hor(
s)Fr
eque
ncy
Agg
rega
te(s
)va
riabl
e(s)
rate
(s)
Oth
er(s
)Te
st(s
)In
tegr
atio
nTe
st(s
)Te
st(s
)(E
CM
)Fi
ndin
gs
Tsen
g an
d ot
hers
1983
:1-1
988:
4ln
(CC
/RPI
);1ln
(rea
l NI)
1R
eal i
nter
est
Qua
rterly
AD
FI(
1)E
G;
Cho
wY
esA
ll m
onet
ary
aggr
egat
es a
re
(199
4)19
89:1
-199
3:4
ln (M
1/R
PI);1
rate
for t
hein
flatio
n ra
teJ
(198
8);
sens
itive
to in
flatio
n al
thou
gh19
83:1
-199
3:4
ln (M
2/R
PI)1
M1
and
M2
(RPI
-bas
ed)
JJ (1
990)
its im
pact
dro
ps d
urin
g th
e Q
uarte
rlyeq
uatio
ns fo
r[f
or 1
983:
1-19
89:1
-199
3:4
subp
erio
d.
1989
:1-
1988
:4]
Inte
rest
rate
s ex
ert s
igni
fican
t 19
93:4
9in
fluen
ce o
n M
1 an
d M
2 in
the
1989
:1-1
993:
4 su
bper
iod.
Côt
e d’
Ivoi
reFi
eldi
ng (1
994)
1974
:3-1
987:
4ln
(BM
/CPI
)ln
(rea
l GD
Pln
(1+C
BD
R)
ln (1
+π);
DF;
I(1)
JJ (1
990)
Cho
wY
esA
t lea
st tw
o co
inte
grat
ing
Qua
rterly
adju
sted
for
mav
arπ;
H
ylle
berg
vect
ors
amon
g re
al m
oney
, rea
l te
rms
of
quar
terly
an
d ot
hers
GD
P, in
flatio
n, in
tere
st ra
te, a
ndtra
de)
dum
my
(199
0)m
avar
π. T
he e
rror
-cor
rect
ion
varia
bles
8co
effic
ient
is c
alcu
late
d fr
om th
ere
sidu
als
of th
e fir
st tw
oco
inte
grat
ing
vect
ors.
Ver
y sl
owad
just
men
t to
long
-run
eq
uilib
rium
.
Indi
aM
oosa
(199
2)19
72:1
-199
0:4
Log
(CC
/CPI
);L
og (I
O)
Log
(MM
R;
...D
F;I(
1)E
G;
...Y
esC
oint
egra
tion
rela
tions
hip
exis
tsQ
uarte
rlyL
og (N
M/C
PI);
rate
off
ered
AD
FA
EG
;fo
r rea
l mon
ey (e
xcep
t for
BM
L
og (B
M (N
Min
Bom
bay
CR
DW
;us
ing
AE
G) w
ith IO
and
MM
R.
plus
QM
)/CPI
)in
terb
ank
J (1
988)
;M
ore
sta
ble
rela
tions
hip
for
mar
ket)
JJ (1
990)
CC
and
NM
than
for B
M.
EC
Ms
show
bet
ter r
esul
ts fo
r C
C a
nd N
M th
an fo
r BM
.
A SURVEY OF RECENT EMPIRICAL MONEY DEMAND STUDIES
345
Tab
le 1
.(c
on
tinu
ed
)
Det
erm
inan
tsE
rror
-Sa
mpl
eU
nit
Ord
erC
oint
egra
tion
Cor
rect
ion
Cou
ntry
/Pe
riod/
Mon
etar
ySc
ale
Inte
rest
Roo
tof
Tech
niqu
e(s)
/St
abili
tyM
odel
Aut
hor(
s)Fr
eque
ncy
Agg
rega
te(s
)va
riabl
e(s)
rate
(s)
Oth
er(s
)Te
st(s
)In
tegr
atio
nTe
st(s
)Te
st(s
)(E
CM
)Fi
ndin
gs
Indo
nesi
aPr
ice
and
1969
:1-1
987:
4ln
(rea
l CH
P);
ln (r
eal G
DP)
Rat
e of
D
umm
yD
F;I(
1)E
G;
Cho
w;
Yes
EG
: wea
k ev
iden
ce o
f In
suki
ndro
Qua
rterly
ln (r
eal D
D)
retu
rn o
n T
Dva
riabl
eA
DF
J (1
988)
Salk
ever
coin
tegr
atio
n re
latio
nshi
p fo
r(1
994)
and
on S
D;
for 1
983
(197
6)cu
rren
cy; J
(198
8) fi
nds
up to
2L
IBO
R[f
or E
CM
]du
mm
yco
inte
grat
ing
vect
ors
for b
oth
appr
oach
mon
ey e
quat
ions
. EC
M d
oes
not
[for
EC
M]
find
LIB
OR
bei
ng a
n im
porta
ntva
riabl
e.
Dek
le a
nd19
74-9
5L
og (N
M);
Log
(rea
l GD
P)T
DR
[for
Log
(CPI
)A
DF
I(1)
exc
ept
J (1
988)
;...
No
No
coin
tegr
atin
g re
latio
nshi
p fo
rPr
adha
n (1
997)
Ann
ual
Log
(BM
);N
M];
MM
R-
for L
og (C
PI)
JJ (1
990)
any
defin
ition
of m
oney
.L
og (r
eal N
M);
TD
R w
eigh
ted
whi
ch is
Log
(rea
l BM
)by
the
shar
eI(
0)of
QM
in B
M;
Iran
Bah
man
i-19
59-9
0Lo
g (M
1/G
DPD
);L
og (G
DP
inIn
flatio
n;
AD
F;I(
1)J
(198
8);
...N
oT
he m
ost s
uita
ble
mod
el is
the
Osk
ooee
(199
6)A
nnua
lL
og (M
2/G
DPD
)19
80 p
rices
)L
og (o
ffic
ial X
R);
Perr
onJJ
(199
0)on
e th
at a
pplie
s th
e bl
ack
mar
ket
Log
(bla
ck(1
989)
XR
with
real
GD
Pan
d in
flatio
n m
arke
t XR
)to
exp
lain
dem
and
for r
eal M
2.
Ken
yaA
dam
(199
2)19
73:1
-198
9:2
Log
(M0/
CPI
);L
og (G
NY
/ln
(1+r
) whe
reE
xpec
ted
DE
PRD
F;I(
1)J
(198
8);
...Y
esTw
o co
inte
grat
ing
vect
ors
amon
gQ
uarte
rlyL
og (M
1/C
PI);
CPI
) whe
rer =
qua
rterly
usin
g pa
ralle
lA
DF;
JJ (1
990)
5 va
riabl
es fo
r eac
h m
onet
ary
Log
(M2/
CPI
);G
NY
is G
NP
yiel
d on
T-b
illm
arke
t XR
;C
RD
Wag
greg
ate.
EC
Ms
valid
ate
the
Log
(M3/
CPI
);ad
just
ed fo
rin
flatio
n;co
inte
grat
ing
rela
tions
hips
.L
og (M
3d/C
PI)
chan
ges
inse
ason
al
whe
re M
3d is
term
s of
du
mm
ies
divi
sia
M3
trade
Subramanian S. Sriram
346
Tab
le 1
.(c
on
tinu
ed
)
Det
erm
inan
tsE
rror
-Sa
mpl
eU
nit
Ord
erC
oint
egra
tion
Cor
rect
ion
Cou
ntry
/Pe
riod/
Mon
etar
ySc
ale
Inte
rest
Roo
tof
Tech
niqu
e(s)
/St
abili
tyM
odel
Aut
hor(
s)Fr
eque
ncy
Agg
rega
te(s
)va
riabl
e(s)
rate
(s)
Oth
er(s
)Te
st(s
)In
tegr
atio
nTe
st(s
)Te
st(s
)(E
CM
)Fi
ndin
gs
Fiel
ding
(199
4)19
75:2
-198
9:2
ln (B
M/C
PI)
ln (r
eal G
DP
ln (1
+T-b
illln
(1+π
);D
F;I(
0) fo
rJJ
(199
0)C
how
Yes
Thre
e co
inte
grat
ing
rela
tions
hips
Qua
rterly
adju
sted
for
rate
)ln
(1+D
EPR
)H
ylle
berg
ln (1
+DE
PR);
[for
EC
M]
amon
g re
al m
oney
, rea
l GD
P,te
rms
of
usin
g pa
ralle
lan
d ot
hers
I(1)
for
infla
tion,
inte
rest
rate
, mav
arr,
trade
)m
arke
t XR
;(1
990)
othe
rsan
d m
avar
π. T
he E
C te
rm is
mav
arπ;
ca
lcul
ated
bas
ed o
n th
e re
sidu
als
mav
arr;
from
the
first
two
coin
tegr
atin
gqu
arte
rly d
umm
yve
ctor
s. S
-Tel
astic
ities
are
varia
bles
8sm
alle
r tha
n th
ose
of lo
ng ru
n.
Kor
eaA
rize
(199
4)19
73:1
-199
0:1
ln (M
1/C
PI);
ln (r
eal G
DP)
CB
R;
Exp
ecte
d ra
teA
DF;
I(1)
EY
(198
7);
Cho
wY
esTw
o to
thre
e co
inte
grat
ing
Qua
rterly
ln (M
2/C
PI)
inte
rest
rate
of in
flatio
n;
Hyl
lebe
rgJ
(198
8);
vect
ors
amon
g re
al m
oney
(bot
hon
loan
s an
dE
ER
; sta
ndar
dan
d ot
hers
JJ (1
990)
M1
and
M2)
, rea
l inc
ome,
T
D o
n N
CB
;de
viat
ion
of(1
990)
;in
tere
st ra
te, a
nd fo
reig
nw
eigh
ed a
vg.
the
chan
ge in
Osb
orn
exch
ange
rate
risk
and
retu
rn.
of S
-Tin
tere
stth
e lo
g of
the
(199
0);
Wel
l-spe
cifie
d E
CM
.ra
tes
in 9
EE
R; d
umm
yH
asza
and
indu
stria
lva
riabl
e to
Fulle
rco
untri
es;
mea
sure
the
(198
2);
unco
vere
dch
ange
inPe
rron
inte
rest
rate
circ
umst
ance
s(1
988)
diff
eren
tial i
nfa
vor o
f fo
reig
nco
untry
Leba
non
Eke
n an
d ot
hers
1964
-93
Log
(B/C
PI);
Log
(rea
l...
Log
(CPI
);PP
(198
8)I(
1)E
G (1
987)
;...
...C
oint
egra
ting
rela
tions
hip
exits
(199
5)A
nnua
lL
og (M
1/C
PI);
GD
P); L
ogL
og (U
.S. C
PI);
PO (1
990)
betw
een
vario
us d
efin
ition
s of
Log
FC
D$;
10(U
.S. d
olla
r-ex
pect
edm
oney
and
with
real
GD
P,
Log
(M2L
Lde
nom
inat
edin
flatio
n; w
arpr
ices
, and
dom
estic
infla
tion.
/CPI
);10
GD
P)ye
ar d
umm
y
A SURVEY OF RECENT EMPIRICAL MONEY DEMAND STUDIES
347
Tab
le 1
.(c
on
tinu
ed
)
Det
erm
inan
tsE
rror
-Sa
mpl
eU
nit
Ord
erC
oint
egra
tion
Cor
rect
ion
Cou
ntry
/Pe
riod/
Mon
etar
ySc
ale
Inte
rest
Roo
tof
Tech
niqu
e(s)
/St
abili
tyM
odel
Aut
hor(
s)Fr
eque
ncy
Agg
rega
te(s
)va
riabl
e(s)
rate
(s)
Oth
er(s
)Te
st(s
)In
tegr
atio
nTe
st(s
)Te
st(s
)(E
CM
)Fi
ndin
gs
Mal
aysi
aSr
iram
(199
9a)
1973
:8-
ln (M
2/C
PI)
ln (I
IP)
CB
TD
3M;
Exp
ecte
d D
F;ln
(IIP
) and
J (1
988)
;C
how
Yes
Coi
nteg
ratio
n re
latio
nshi
p ex
ists
1995
:12
disc
ount
rate
in
flatio
n;A
DF
expe
cted
JJ (1
990)
[Gen
eral
betw
een
real
M2
and
its
Mon
thly
on 3
-mon
thno
min
al X
R;
infla
tion
to s
peci
ficde
term
inan
ts u
nder
bot
h th
eT-
bills
seas
onal
and
are
I(0)
;A
ppro
ach]
clos
ed- a
nd o
pen-
econ
omy
stru
ctur
alot
hers
are
fram
ewor
k; fa
irly
stab
le E
CM
sdu
mm
ies
I(1)
unde
r bot
h si
tuat
ions
.
Mex
ico
Kha
mis
and
1983
:1-
ln (C
C/C
PI)
ln (r
eal p
rivat
e60
-day
TD
RIn
flatio
nA
DF
I (1)
J (1
988)
;C
how
Yes
Coi
nteg
ratio
n re
latio
nshi
p am
ong
Leo
ne (1
999)
1997
:6co
nsum
ptio
nJJ
(199
0)re
al C
C, s
cale
var
iabl
e, a
nd
Mon
thly
expe
nditu
re)
60-d
ay T
DR
; sta
ble
EC
M.
Mor
occo
Hof
fman
and
19
59:1
-198
8:2
Log
(M1)
;L
og (G
DP/
Swis
s S-
TL
og (C
PI);
AD
F;I(
1) p
ossi
bly
J (1
988)
;H
anse
n an
dN
oSi
ngle
coi
nteg
ratin
g ve
ctor
Ta
hiri
(199
4)Q
uarte
rlyL
og (M
2)C
PI);
inte
rest
rate
;se
ason
alK
PSS
abou
t a
J (1
991b
);Jo
hans
en
amon
g m
easu
res
of n
omin
alL
og (G
NP/
inte
rest
rate
dum
mie
s(1
992)
dete
rmin
istic
JJ (1
990)
;(1
993)
mon
ey, p
rices
, rea
l inc
ome,
and
CPI
)on
TD
trend
; KPS
SO
LS;
Swis
s S-
Tin
tere
st ra
te.
test
fails
toD
OL
Sre
ject
the
null
of s
tatio
nary
for S
wis
s S-
Tin
tere
st ra
tead
just
ed fo
r TD
R
Nig
eria
Fiel
ding
(199
4)19
76:1
-198
9:2
ln (B
M/C
PI)
ln (r
eal G
DP
ln (1
+T-b
illln
(1+π
);D
F;I(
0) fo
rJJ
(199
0)C
how
Yes
One
coi
nteg
ratin
g re
latio
nshi
pQ
uarte
rlyad
just
ed fo
rra
te)
ln (1
+DE
PR)
Hyl
lebe
rgln
(1+D
EPR
);[f
or E
CM
]am
ong
real
mon
ey, r
eal G
DP,
term
s of
us
ing
para
llel
and
othe
rsI(
1) fo
rin
flatio
n, in
tere
st ra
te a
ndtra
de)
mar
ket X
R;
(199
0)ot
hers
mav
arπ.
mav
arπ;
8
seas
onal
dum
mie
s
Subramanian S. Sriram
348
Tab
le 1
.(c
on
tinu
ed
)
Det
erm
inan
tsE
rror
-Sa
mpl
eU
nit
Ord
erC
oint
egra
tion
Cor
rect
ion
Cou
ntry
/Pe
riod/
Mon
etar
ySc
ale
Inte
rest
Roo
tof
Tech
niqu
e(s)
/St
abili
tyM
odel
Aut
hor(
s)Fr
eque
ncy
Agg
rega
te(s
)va
riabl
e(s)
rate
(s)
Oth
er(s
)Te
st(s
)In
tegr
atio
nTe
st(s
)Te
st(s
)(E
CM
)Fi
ndin
gs
Terib
a (1
997)
1960
-94
Log
(CO
B);
Log
(rea
l DA
)L
og (i
nter
est
Log
(DA
D);
DF
I(1)
exc
ept
EG
;...
Yes
Coi
nteg
ratio
n re
latio
nshi
p ex
ists
Ann
ual
Log
(M1)
;ra
te fo
r 12-
Log
(LT
BR
info
r Log
M1
AE
Gam
ong
the
mon
etar
y ag
greg
ates
,19
62:1
-199
5:2
Log
(M2)
mon
th T
D);
Nig
eria
/LT
BR
(I(2
)) a
ndD
A, D
AD
, and
inte
rest
rate
s.fo
r M1;
and
Log
(int
eres
tin
the
Uni
ted
for p
aral
lel
Fore
ign
oppo
rtuni
ty c
ost v
aria
ble
1962
:1-1
992:
4ra
te fo
r 3-
Stat
es)
mar
ket X
Rha
s in
fluen
ce o
n M
1 eq
uatio
n fo
r M2
mon
th T
D)
(I(0
))on
ly.
Qua
rterly
Pak
ista
nA
rize
(199
4)19
73:1
-199
0:1
ln (M
1/C
PI);
ln (r
eal G
DP)
CM
R; G
ovt.
Exp
ecte
d ra
teA
DF;
I(1)
EY
(198
7);
Cho
wY
esTw
o to
thre
e co
inte
grat
ing
Qua
rterly
ln (M
2/C
PI)
[WPI
-bas
ed]
bond
yie
ld;
of in
flatio
n;
Hyl
lebe
rgJ
(198
8);
vect
ors
exis
t am
ong
real
mon
eyw
eigh
ted
avg.
EE
R; s
tand
ard
and
othe
rsJJ
(199
0)(b
oth
M1
and
M2)
, rea
l GD
P,of
S-T
inte
rest
devi
atio
n of
(199
0);
inte
rest
rate
, and
fore
ign
rate
s in
9th
e ch
ange
inO
sbor
nex
chan
ge ra
te ri
sk a
nd re
turn
.in
dust
rial
the
log
of th
e(1
990)
;W
ell-s
peci
fied
EC
M.
coun
tries
;E
ER
; dum
my
Has
za a
ndun
cove
red
varia
ble
toFu
ller
inte
rest
rate
mea
sure
the
(198
2);
diff
eren
tial
chan
ge in
Perr
on
in fa
vor o
fci
rcum
stan
ces
(198
8)fo
reig
nco
untry
Hos
sain
(199
4)19
51-9
1L
og (M
1/C
PI);
ln (r
eal G
DP)
ln (y
ield
on
Exp
ecte
dD
F;E
xpec
ted
EG
;...
No
EG, A
EG, a
nd C
RD
Wte
sts sh
ow19
72-9
1L
og (M
2/C
PI)
Gov
t. bo
nds)
;in
flatio
nA
DF
infla
tion
isA
EG
;co
nflic
ting
resu
lts. B
ut J
J (1
990)
Ann
ual
ln (m
arke
t I(
0); o
ther
sC
RD
W;
test
find
s 2
coin
tegr
atin
gve
ctor
sca
ll ra
te o
fI(
1)J
(198
8);
amon
g m
oney
, rea
l GD
P, a
nd
inte
rest
)JJ
(199
0)ca
ll ra
te o
f int
eres
t for
197
2-91
and
one
for 1
953-
91. M
1 is
fo
und
to b
e m
ore
stab
le th
an M
2.
A SURVEY OF RECENT EMPIRICAL MONEY DEMAND STUDIES
349
Tab
le 1
.(c
on
tinu
ed
)
Det
erm
inan
tsE
rror
-Sa
mpl
eU
nit
Ord
erC
oint
egra
tion
Cor
rect
ion
Cou
ntry
/Pe
riod/
Mon
etar
ySc
ale
Inte
rest
Roo
tof
Tech
niqu
e(s)
/St
abili
tyM
odel
Aut
hor(
s)Fr
eque
ncy
Agg
rega
te(s
)va
riabl
e(s)
rate
(s)
Oth
er(s
)Te
st(s
)In
tegr
atio
nTe
st(s
)Te
st(s
)(E
CM
)Fi
ndin
gs
Sing
apor
eA
rize
(199
4)19
73:1
-199
0:1
ln (M
1/C
PI);
ln (r
eal G
DP)
CM
R; 3
-E
xpec
ted
rate
AD
F;I(
1) e
xcep
tE
Y(1
987)
;C
how
Yes
2-3
coin
tegr
atin
g ve
ctor
s am
ong
Qua
rterly
ln (M
2/C
PI)
[WPI
-bas
ed]
mon
th F
DR
;of
infla
tion;
H
ylle
berg
for e
xpec
ted
J (1
988)
;re
al m
oney
(bot
h M
1 an
d M
2),
wei
ghed
avg
.E
ER
; sta
ndar
dan
d ot
hers
rate
of
JJ (1
990)
real
GD
P, in
tere
st ra
te, a
ndof
S-T
inte
rest
devi
atio
n of
(199
0);
infla
tion
fore
ign
exch
ange
rate
risk
and
rate
s in
9th
e ch
ange
inO
sbor
nw
hich
isre
turn
. Wel
l-spe
cifie
d E
CM
.in
dust
rial
the
log
of th
e(1
990)
;I(
0)co
untri
es;
EE
R; d
umm
yH
asza
and
unco
vere
dva
riabl
e to
Fulle
rin
tere
st ra
tem
easu
re th
e(1
982)
;di
ffer
entia
l in
chan
ge in
Perr
onfa
vor o
f ci
rcum
stan
ces
(198
8)fo
reig
nco
untry
Dek
le a
nd19
75-9
5L
og (N
M);
Log
(rea
l GD
P)T
DR
[for
Log
(CPI
);A
DF
I(1)
J (1
988)
;...
No
Coi
nteg
ratin
g re
latio
nshi
ps fo
rPr
adha
n (1
997)
Ann
ual
Log
(BM
);N
M];
MM
R-
expe
cted
JJ
(199
0)no
min
al N
M a
nd B
M.
Log
(rea
l NM
);T
DR
wei
ghte
dde
prec
iatio
nL
og (r
eal B
M)
by th
e sh
are
rate
QM
in B
M;
LIB
OR
Thai
land
Dek
le a
nd19
78-9
5L
og (N
M);
Log
(rea
l GD
P)T
DR
[for
Log
(CPI
)A
DF
I(1)
J (1
988)
;...
No
Coi
nteg
ratin
g re
latio
nshi
p fo
rPr
adha
n (1
997)
Ann
ual
Log
(BM
);N
M];
MM
R-
JJ (1
990)
nom
inal
NM
onl
y.L
og (r
eal N
M);
TD
R w
eigh
ted
Log
(rea
l BM
)by
the
shar
eof
QM
in B
M;
Subramanian S. Sriram
350
Tab
le 1
.(c
on
clu
de
d)
Det
erm
inan
tsE
rror
-Sa
mpl
eU
nit
Ord
erC
oint
egra
tion
Cor
rect
ion
Cou
ntry
/Pe
riod/
Mon
etar
ySc
ale
Inte
rest
Roo
tof
Tech
niqu
e(s)
/St
abili
tyM
odel
Aut
hor(
s)Fr
eque
ncy
Agg
rega
te(s
)va
riabl
e(s)
rate
(s)
Oth
er(s
)Te
st(s
)In
tegr
atio
nTe
st(s
)Te
st(s
)(E
CM
)Fi
ndin
gs
Tuni
sia
Trei
chel
(199
7)19
63-9
5ln
(M2/
CPI
);ln
(rea
l GD
P)M
onth
ly y
ield
Infla
tion
rate
;A
DF
I(1)
exc
ept
AE
G;
Rec
ursi
veY
esSt
able
long
-term
rela
tions
hip
Ann
ual
ln (M
4/C
PI)
on T
-bill
;se
ason
al
for i
nfla
tion
J (1
988)
;C
how
amon
g re
al m
oney
, rea
l GD
P,19
90-9
5re
disc
ount
dum
mie
sra
te w
hich
isJJ
(199
0)[f
or E
CM
]an
d th
e m
onth
ly y
ield
on
T-bi
ll.M
onth
lyra
te; M
MR
I(0)
Stab
le E
CM
.
Not
e: T
he fo
llow
ing
abbr
evia
tions
are
use
d:
Mon
etar
y ag
greg
ates
: B =
bas
e m
oney
; BM
= b
road
mon
ey; C
HP
= cu
rren
cy h
eld
by p
ublic
; CC
= c
urre
ncy
in c
ircul
atio
n; C
OB
= c
urre
ncy
outs
ide
bank
s; D
D =
dem
and
depo
sits
;N
M =
nar
row
mon
ey; Q
M =
qua
si-m
oney
; SD
= s
avin
gs d
epos
its; a
nd T
D =
tim
e de
posi
ts.
Scal
e va
riab
le: D
A=
dom
estic
abs
orpt
ion;
GD
E =
gro
ss d
omes
tic e
xpen
ditu
re; G
DP
= gr
oss
dom
estic
pro
duct
; GN
P=
gros
s na
tiona
l pro
duct
; IIP
= in
dex
of in
dust
rial p
rodu
ctio
n; IO
= in
dust
rial o
utpu
t;N
I = n
atio
nal i
ncom
e; a
nd N
NI =
net
nat
iona
l inc
ome.
Inte
rest
rat
e: C
MR
= c
all m
oney
rate
; CB
DR
= C
entra
l Ban
k di
scou
nt ra
te; C
PR =
com
mer
cial
pap
er ra
te; C
BR
= c
orpo
rate
bon
d ra
te;
FDR
= fi
xed
depo
sit r
ate;
LIB
OR
= L
ondo
n in
terb
ank
offe
red
rate
; LT
BR
= L
ong-
term
bor
row
ing
rate
; MM
R =
mon
ey m
arke
t rat
e; C
BT
D3M
= T
hree
-mon
th d
epos
it ra
tes
at c
omm
erci
al b
anks
; TD
R =
tim
e de
posi
t rat
e; T
-bill
= T
reas
ury
bill;
an
d T-
bond
= T
reas
ury
bond
.E
xcha
nge
rate
: DE
PR =
dep
reci
atio
n; X
R =
exc
hang
e ra
te; E
ER
= e
ffec
tive
exch
ange
rate
; and
NE
ER
= n
omin
al e
ffec
tive
exch
ange
rate
.Pr
ices
: CPI
= c
onsu
mer
pric
e in
dex;
RPI
= re
tail
pric
e in
dex;
and
WPI
= w
hole
sale
pric
e in
dex.
Def
lato
rs: D
AD
= d
omes
tic a
bsor
ptio
n de
flato
r; G
DE
D =
gro
ss d
omes
tic e
xpen
ditu
re d
efla
tor;
GD
PD =
gro
ss d
omes
tic p
rodu
ct d
efla
tor;
GN
PD =
gro
ss n
atio
nal p
rodu
ct d
efla
tor;
IGD
PD =
impl
icit
GD
Pde
flato
r; IG
NPD
= im
plic
it G
NP
defla
tor;
IPD
= im
plic
it pr
ice
defla
tor;
and
NID
= n
atio
nal i
ncom
e de
flato
r.U
nit r
oot t
ests
: AD
F =
augm
ente
d D
icke
y-Fu
ller;
CR
DW
= co
inte
grat
ion
regr
essi
on D
urbi
n-W
atso
n; D
F =
Dic
key-
Fulle
r; J
(198
8) =
Joh
anse
n (1
988)
; KPS
S =
Kw
iatk
owsk
i, Ph
illip
s, S
chm
idt,
and
Shin
(199
2);
P(1
987)
= P
hilli
ps (1
987)
; PO
(199
0) =
Phi
llips
and
Oul
iaris
(199
0); a
nd P
P(1
988)
= P
hilli
ps a
nd P
erro
n (1
988)
.C
oint
egra
tion
test
s: A
EG
= a
ugm
ente
d E
ngle
and
Gra
nger
; CR
DW
= C
oint
egra
tion
regr
essi
on D
urbi
n-W
atso
n; D
OL
S =
dyna
mic
ord
inar
y le
ast s
quar
es o
f Sto
ck a
nd W
atso
n (1
993)
;E
G =
Eng
le a
nd G
rang
er; E
Y=
Eng
le a
nd Y
oo (1
987)
; IV
T=
inst
rum
enta
l var
iabl
e te
chni
que;
J (n
) = J
ohan
sen
(n) w
here
n s
tand
s fo
r 198
8, 1
991a
, 199
1b, 1
992a
, 199
2b re
spec
tivel
y;
JJ (1
990)
= J
ohan
sen
and
Juse
lius
(199
0); O
LS
= or
dina
ry le
ast s
quar
es; P
H =
Phi
llips
and
Han
sen
(199
0); a
nd P
O (1
990)
= P
hilli
ps a
nd O
ulia
ris (1
990)
.G
ener
al: a
vg. =
ave
rage
; CB
= c
orpo
rate
bon
ds; E
C =
err
or-c
orre
ctio
n; G
ovt.
= G
over
nmen
t; N
CB
= n
atio
nwid
e co
mm
erci
al b
anks
; L-T
= lo
ng-te
rm; a
nd S
-T=
shor
t-ter
m.
1 Sea
sona
lly a
djus
ted.
2 Whe
re “
it” s
tand
s fo
r tim
e de
posi
t rat
e of
dep
osits
bet
wee
n D
M 1
00,0
00 a
nd D
M 1
mill
ion.
3 Spr
eads
bet
wee
n yi
eld
on T
-bill
and
net
retu
rn o
n tim
e de
posi
ts a
nd b
etw
een
yiel
d on
T-b
ill a
nd n
et re
turn
on
repu
rcha
se a
gree
men
ts re
spec
tivel
y.4 O
wn-
rate
is in
tere
st ra
te o
n ba
nk d
epos
its, n
et o
f tax
es; a
nd a
ltern
ativ
e re
turn
is y
ield
on
long
er-te
rm g
over
nmen
t deb
t.5 B
OT
stan
ds fo
r Buo
ni O
rdin
ari d
el T
esor
o an
d C
CT
for C
ertif
icat
i di C
redi
to d
el T
esor
o.6 R
is d
efin
ed a
s th
e th
ree-
mon
th a
vera
ge G
ensa
ki ra
te m
inus
the
aver
age
retu
rn o
n ho
ldin
g br
oad
mon
ey d
efin
ed a
s w
eigh
ted
aver
age
of th
e in
tere
st ra
te o
n th
ree-
mon
th c
ertif
icat
es o
f dep
osit
and
the
guid
elin
e th
ree-
mon
th d
epos
it ra
te.
7 R =
ow
n ra
te o
f ret
urn
for M
2 (w
eigh
ted
aver
age
of e
xplic
it in
tere
st ra
tes
paid
on
the
com
pone
nts
of M
2) m
inus
RM
2 (f
our-
six
mon
th C
PR).
8 mav
arπ
is a
nnua
l mov
ing
aver
age
of c
hang
es in
infla
tion
calc
ulat
ed a
s |∆
ln(1
+p)|
tan
d m
avar
r is
for i
nter
est r
ates
.9 D
efin
ed a
s on
e-ye
ar ti
me
depo
sit r
ate
min
us th
e ra
te o
f inf
latio
n.10
FCD
$ an
d M
2LL
stan
d fo
r U.S
. dol
lar-
deno
min
ated
dep
osits
and
Leb
anes
e po
und
com
pone
nt o
f M2
resp
ectiv
ely.
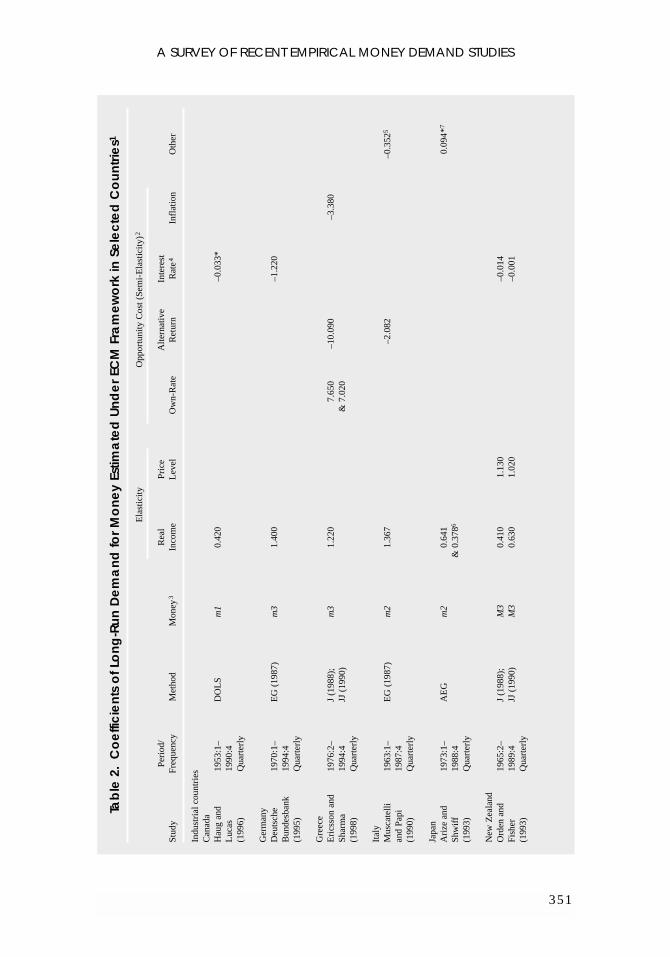
A SURVEY OF RECENT EMPIRICAL MONEY DEMAND STUDIES
351
Tab
le 2
.C
oe
ffic
ien
ts o
f Lo
ng
-Ru
n D
em
an
d fo
r M
on
ey
Estim
ate
d U
nd
er
ECM
Fra
me
wo
rk in
Se
lec
ted
Co
un
trie
s1
Ela
stic
ityO
ppor
tuni
ty C
ost (
Sem
i-E
last
icity
)2
Peri
od/
Rea
lPr
ice
Alte
rnat
ive
Inte
rest
Stud
yFr
eque
ncy
Met
hod
Mon
ey3
Inco
me
Lev
elO
wn-
Rat
eR
etur
nR
ate4
Infl
atio
nO
ther
Indu
stri
al c
ount
ries
Can
ada
Hau
g an
d19
53:1
–D
OL
Sm
10.
420
–0.0
33*
Luc
as19
90:4
(199
6)Q
uart
erly
Ger
man
yD
euts
che
1970
:1–
EG
(19
87)
m3
1.40
0–1
.220
Bun
desb
ank
1994
:4(1
995)
Qua
rter
ly
Gre
ece
Eri
csso
n an
d19
76:2
–J
(198
8);
m3
1.22
07.
650
–10.
090
–3.3
80Sh
arm
a19
94:4
JJ (
1990
)&
7.0
20(1
998)
Qua
rter
ly
Ital
yM
usca
telli
1963
:1–
EG
(19
87)
m2
1.36
7–2
.082
–0.3
525
and
Papi
1987
:4(1
990)
Qua
rter
ly
Japa
nA
rize
and
1973
:1–
AE
Gm
20.
641
0.09
4*7
Shw
iff
1988
:4&
0.3
786
(199
3)Q
uart
erly
New
Zea
land
Ord
en a
nd19
65:2
–J
(198
8);
M3
0.41
01.
130
–0.0
14Fi
sher
1989
:4JJ
(19
90)
M3
0.63
01.
020
–0.0
01(1
993)
Qua
rter
ly
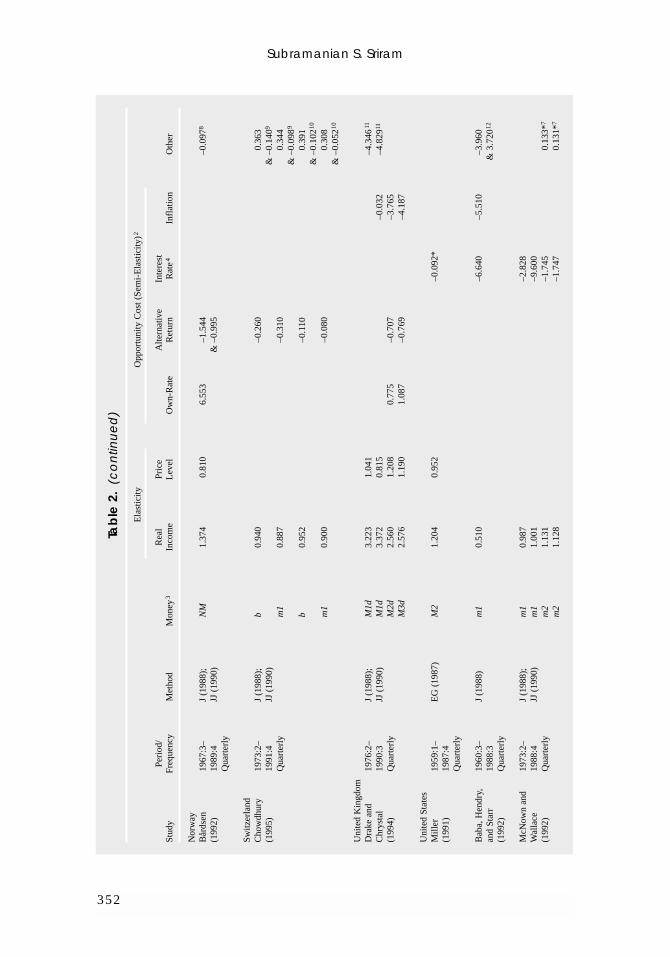
Subramanian S. Sriram
352
Tab
le 2
.(c
on
tinu
ed
)
Ela
stic
ityO
ppor
tuni
ty C
ost (
Sem
i-E
last
icity
)2
Peri
od/
Rea
lPr
ice
Alte
rnat
ive
Inte
rest
Stud
yFr
eque
ncy
Met
hod
Mon
ey3
Inco
me
Lev
elO
wn-
Rat
eR
etur
nR
ate4
Infl
atio
nO
ther
Nor
way
Bår
dsen
1967
:3–
J (1
988)
;N
M1.
374
0.81
06.
553
–1.5
44–0
.097
8
(199
2)19
89:4
JJ (
1990
)&
–0.
995
Qua
rter
ly
Switz
erla
ndC
how
dhur
y19
73:2
–J
(198
8);
b0.
940
–0.2
600.
363
(199
5)19
91:4
JJ (
1990
)&
–0.
1409
Qua
rter
lym
10.
887
–0.3
100.
344
& –
0.09
89
b0.
952
–0.1
100.
391
& –
0.10
210
m1
0.90
0–0
.080
0.30
8&
–0.
0521
0
Uni
ted
Kin
gdom
Dra
ke a
nd19
76:2
–J
(198
8);
M1d
3.22
31.
041
–4.3
4611
Chr
ysta
l19
90:3
JJ (
1990
)M
1d3.
372
0.81
5–0
.032
–4.8
2911
(199
4)Q
uart
erly
M2d
2.56
01.
208
0.77
5–0
.707
–3.7
65M
3d2.
576
1.19
01.
087
–0.7
69–4
.187
Uni
ted
Stat
esM
iller
1959
:1–
EG
(19
87)
M2
1.20
40.
952
–0.0
92*
(199
1)19
87:4
Qua
rter
ly
Bab
a, H
endr
y,19
60:3
–J
(198
8)m
10.
510
–6.6
40–5
.510
–3.9
60an
d St
arr
1988
:3&
3.7
2012
(199
2)Q
uart
erly
McN
own
and
1973
:2–
J (1
988)
;m
10.
987
–2.8
28W
alla
ce19
88:4
JJ (
1990
)m
11.
001
–9.6
00(1
992)
Qua
rter
lym
21.
131
–1.7
450.
133*
7
m2
1.12
8–1
.747
0.13
1*7
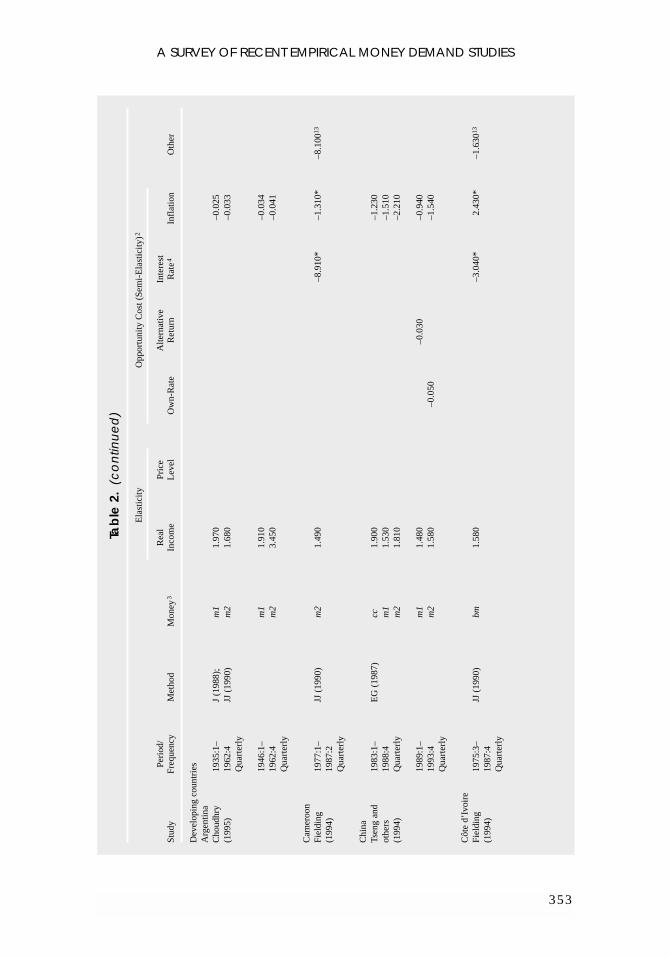
A SURVEY OF RECENT EMPIRICAL MONEY DEMAND STUDIES
353
Tab
le 2
.(c
on
tinu
ed
)
Ela
stic
ityO
ppor
tuni
ty C
ost (
Sem
i-E
last
icity
)2
Peri
od/
Rea
lPr
ice
Alte
rnat
ive
Inte
rest
Stud
yFr
eque
ncy
Met
hod
Mon
ey3
Inco
me
Lev
elO
wn-
Rat
eR
etur
nR
ate4
Infl
atio
nO
ther
Dev
elop
ing
coun
trie
sA
rgen
tina
Cho
udhr
y19
35:1
–J
(198
8);
m1
1.97
0–0
.025
(199
5)19
62:4
JJ (
1990
)m
21.
680
–0.0
33Q
uart
erly
1946
:1–
m1
1.91
0–0
.034
1962
:4m
23.
450
–0.0
41Q
uart
erly
Cam
eroo
nFi
eldi
ng
1977
:1–
JJ (
1990
)m
21.
490
–8.9
10*
–1.3
10*
–8.1
0013
(199
4)19
87:2
Qua
rter
ly
Chi
naTs
eng
and
1983
:1–
EG
(19
87)
cc1.
900
–1.2
30ot
hers
1988
:4m
11.
530
–1.5
10(1
994)
Qua
rter
lym
21.
810
–2.2
10
1989
:1–
m1
1.48
0–0
.030
–0.9
4019
93:4
m2
1.58
0–0
.050
–1.5
40Q
uart
erly
Côt
e d’
Ivoi
reFi
eldi
ng19
75:3
–JJ
(19
90)
bm1.
580
–3.0
40*
2.43
0*–1
.630
13
(199
4)19
87:4
Qua
rter
ly
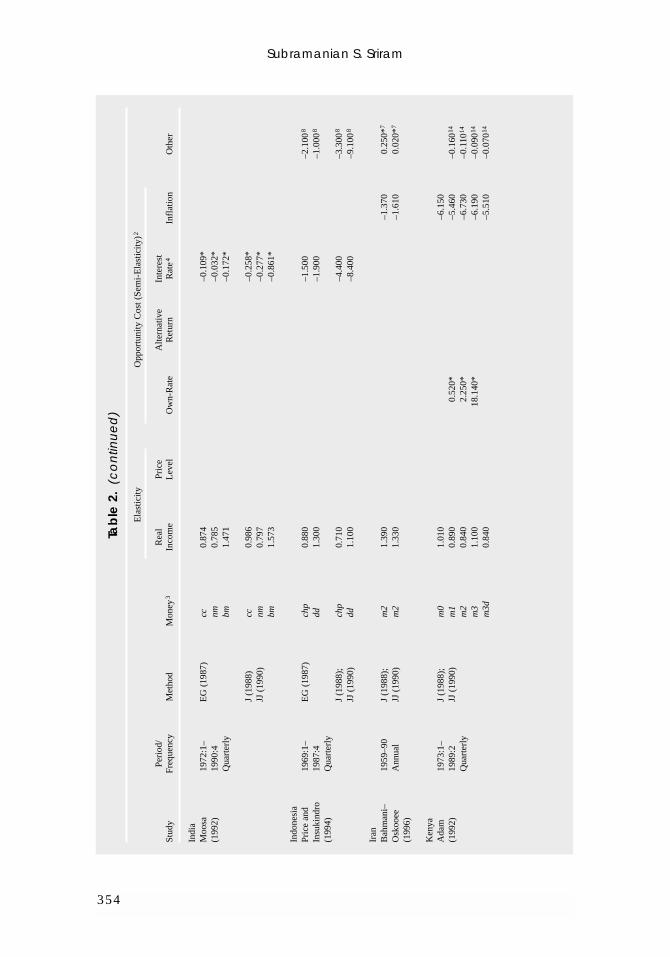
Subramanian S. Sriram
354
Tab
le 2
.(c
on
tinu
ed
)
Ela
stic
ityO
ppor
tuni
ty C
ost (
Sem
i-E
last
icity
)2
Peri
od/
Rea
lPr
ice
Alte
rnat
ive
Inte
rest
Stud
yFr
eque
ncy
Met
hod
Mon
ey3
Inco
me
Lev
elO
wn-
Rat
eR
etur
nR
ate4
Infl
atio
nO
ther
Indi
aM
oosa
1972
:1–
EG
(19
87)
cc0.
874
–0.1
09*
(199
2)19
90:4
nm0.
785
–0.0
32*
Qua
rter
lybm
1.47
1–0
.172
*
J (1
988)
cc0.
986
–0.2
58*
JJ (
1990
)nm
0.79
7–0
.277
*bm
1.57
3–0
.861
*
Indo
nesi
aPr
ice
and
1969
:1–
EG
(19
87)
chp
0.88
0–1
.500
–2.1
008
Insu
kind
ro19
87:4
dd1.
300
–1.9
00–1
.000
8
(199
4)Q
uart
erly
J (1
988)
;ch
p0.
710
–4.4
00–3
.300
8
JJ (
1990
)dd
1.10
0–8
.400
–9.1
008
Iran
Bah
man
i–19
59–9
0J
(198
8);
m2
1.39
0–1
.370
0.25
0*7
Osk
ooee
Ann
ual
JJ (
1990
)m
21.
330
–1.6
100.
020*
7
(199
6)
Ken
yaA
dam
19
73:1
–J
(198
8);
m0
1.01
0–6
.150
(199
2)19
89:2
JJ (
1990
)m
10.
890
0.52
0*–5
.460
–0.1
6014
Qua
rter
lym
20.
840
2.25
0*–6
.730
–0.1
1014
m3
1.10
018
.140
*–6
.190
–0.0
9014
m3d
0.84
0–5
.510
–0.0
7014
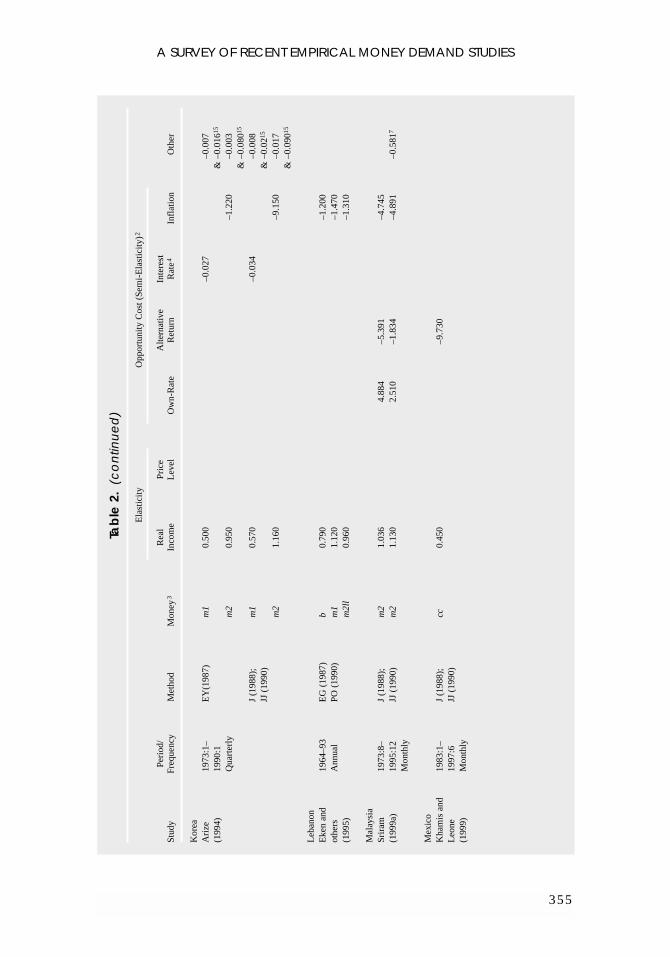
A SURVEY OF RECENT EMPIRICAL MONEY DEMAND STUDIES
355
Tab
le 2
.(c
on
tinu
ed
)
Ela
stic
ityO
ppor
tuni
ty C
ost (
Sem
i-E
last
icity
)2
Peri
od/
Rea
lPr
ice
Alte
rnat
ive
Inte
rest
Stud
yFr
eque
ncy
Met
hod
Mon
ey3
Inco
me
Lev
elO
wn-
Rat
eR
etur
nR
ate4
Infl
atio
nO
ther
Kor
eaA
rize
1973
:1–
EY
(198
7)m
10.
500
–0.0
27–0
.007
(199
4)19
90:1
& –
0.01
615
Qua
rter
lym
20.
950
–1.2
20–0
.003
& –
0.08
015
J (1
988)
;m
10.
570
–0.0
34–0
.008
JJ (
1990
)&
–0.
0215
m2
1.16
0–9
.150
–0.0
17&
–0.
0901
5
Leb
anon
Eke
n an
d19
64–9
3E
G (
1987
)b
0.79
0–1
.200
othe
rsA
nnua
lPO
(19
90)
m1
1.12
0–1
.470
(199
5)m
2ll
0.96
0–1
.310
Mal
aysi
aSr
iram
1973
:8–
J (1
988)
;m
21.
036
4.88
4–5
.391
–4.7
45(1
999a
)19
95:1
2JJ
(19
90)
m2
1.13
02.
510
–1.8
34–4
.891
–0.5
817
Mon
thly
Mex
ico
Kha
mis
and
1983
:1–
J (1
988)
;cc
0.45
0–9
.730
Leo
ne19
97:6
JJ (
1990
)(1
999)
Mon
thly
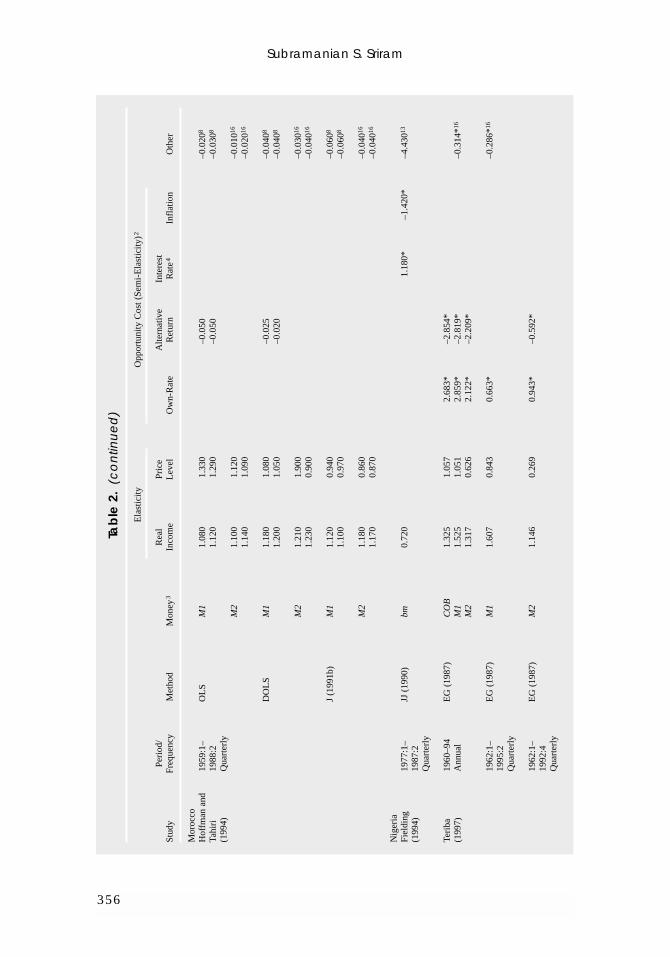
Subramanian S. Sriram
356
Tab
le 2
.(c
on
tinu
ed
)
Ela
stic
ityO
ppor
tuni
ty C
ost (
Sem
i-E
last
icity
)2
Peri
od/
Rea
lPr
ice
Alte
rnat
ive
Inte
rest
Stud
yFr
eque
ncy
Met
hod
Mon
ey3
Inco
me
Lev
elO
wn-
Rat
eR
etur
nR
ate4
Infl
atio
nO
ther
Mor
occo
Hof
fman
and
1959
:1–
OL
SM
11.
080
1.33
0–0
.050
–0.0
208
Tahi
ri19
88:2
1.12
01.
290
–0.0
50–0
.030
8
(199
4)Q
uart
erly
M2
1.10
01.
120
–0.0
1016
1.14
01.
090
–0.0
2016
DO
LS
M1
1.18
01.
080
–0.0
25–0
.040
8
1.20
01.
050
–0.0
20–0
.040
8
M2
1.21
01.
900
–0.0
3016
1.23
00.
900
–0.0
4016
J (1
991b
)M
11.
120
0.94
0–0
.060
8
1.10
00.
970
–0.0
608
M2
1.18
00.
860
–0.0
4016
1.17
00.
870
–0.0
4016
Nig
eria
Fiel
ding
1977
:1–
JJ (
1990
)bm
0.72
01.
180*
–1.4
20*
–4.4
3013
(199
4)19
87:2
Qua
rter
ly
Teri
ba19
60–9
4E
G (
1987
)C
OB
1.32
51.
057
2.68
3*–2
.854
*(1
997)
Ann
ual
M1
1.52
51.
051
2.85
9*–2
.819
*–0
.314
*16
M2
1.31
70.
626
2.12
2*–2
.209
*
1962
:1–
EG
(19
87)
M1
1.60
70.
843
0.66
3*–0
.286
*16
1995
:2Q
uart
erly
1962
:1–
EG
(19
87)
M2
1.14
60.
269
0.94
3*–0
.592
*19
92:4
Qua
rter
ly
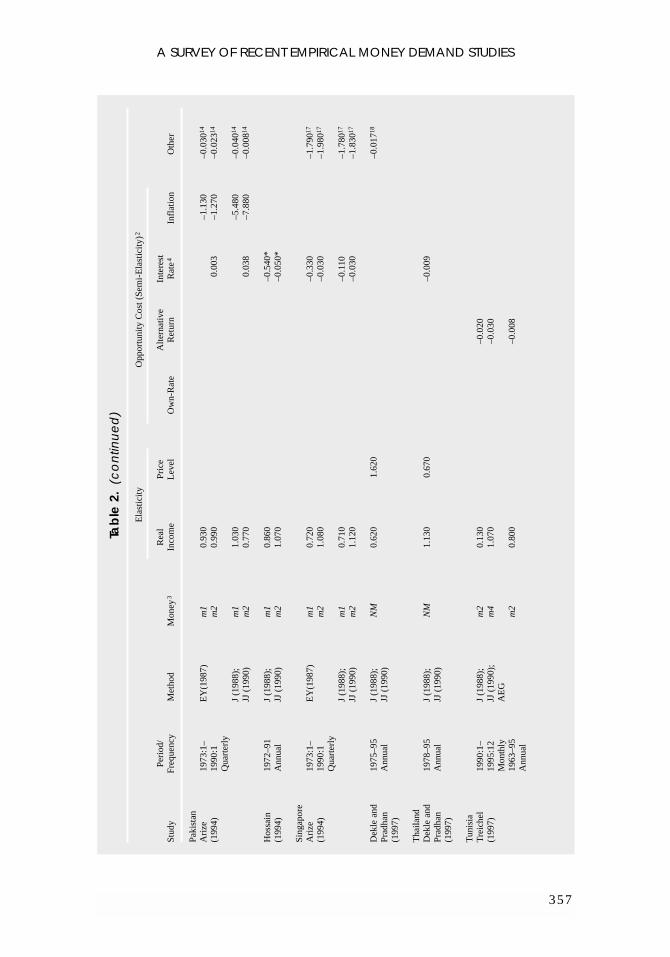
A SURVEY OF RECENT EMPIRICAL MONEY DEMAND STUDIES
357
Tab
le 2
.(c
on
tinu
ed
)
Ela
stic
ityO
ppor
tuni
ty C
ost (
Sem
i-E
last
icity
)2
Peri
od/
Rea
lPr
ice
Alte
rnat
ive
Inte
rest
Stud
yFr
eque
ncy
Met
hod
Mon
ey3
Inco
me
Lev
elO
wn-
Rat
eR
etur
nR
ate4
Infl
atio
nO
ther
Paki
stan
Ari
ze19
73:1
–E
Y(1
987)
m1
0.93
0–1
.130
–0.0
3014
(199
4)19
90:1
m2
0.99
00.
003
–1.2
70–0
.023
14
Qua
rter
lyJ
(198
8);
m1
1.03
0–5
.480
–0.0
4014
JJ (
1990
)m
20.
770
0.03
8–7
.880
–0.0
0814
Hos
sain
1972
–91
J (1
988)
;m
10.
860
–0.5
40*
(199
4)A
nnua
lJJ
(19
90)
m2
1.07
0–0
.050
*
Sing
apor
eA
rize
1973
:1–
EY
(198
7)m
10.
720
–0.3
30–1
.790
17
(199
4)19
90:1
m2
1.08
0–0
.030
–1.9
8017
Qua
rter
lyJ
(198
8);
m1
0.71
0–0
.110
–1.7
8017
JJ (
1990
)m
21.
120
–0.0
30–1
.830
17
Dek
le a
nd19
75–9
5J
(198
8);
NM
0.62
01.
620
–0.0
1718
Prad
han
Ann
ual
JJ (
1990
)(1
997)
Tha
iland
Dek
le a
nd19
78–9
5J
(198
8);
NM
1.13
00.
670
–0.0
09Pr
adha
nA
nnua
lJJ
(19
90)
(199
7)
Tun
isia
Tre
iche
l19
90:1
–J
(198
8);
m2
0.13
0–0
.020
(199
7)19
95:1
2JJ
(19
90);
m4
1.07
0–0
.030
Mon
thly
AE
G19
63–9
5m
20.
800
–0.0
08A
nnua
l
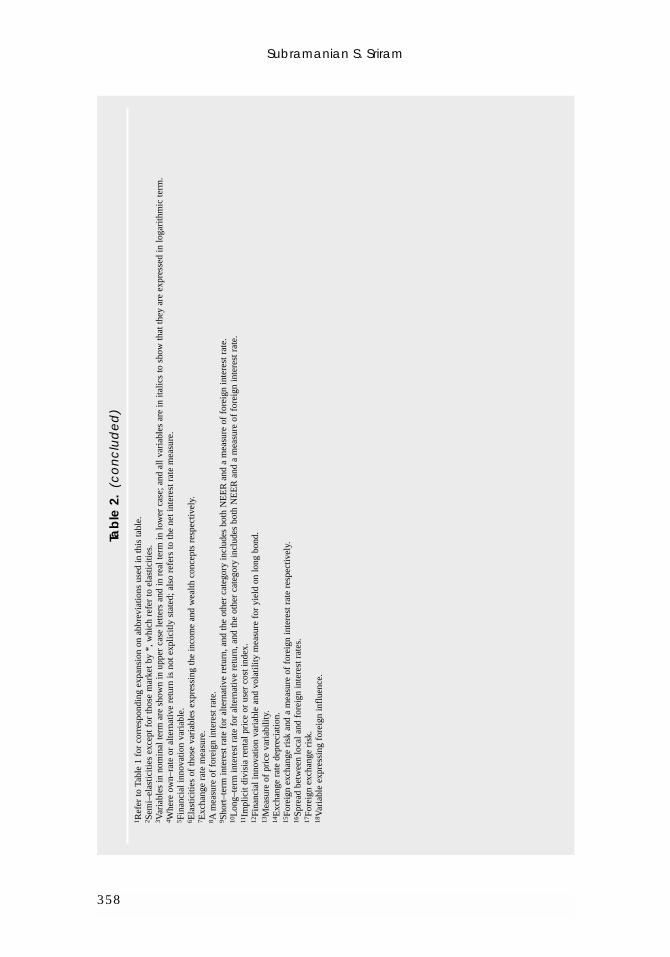
Subramanian S. Sriram
358
Tab
le 2
.(c
on
clu
de
d)
1 Ref
er to
Tab
le 1
for
cor
resp
ondi
ng e
xpan
sion
on
abbr
evia
tions
use
d in
this
tabl
e.2 S
emi–
elas
ticiti
es e
xcep
t for
thos
e m
arke
t by
*, w
hich
ref
er to
ela
stic
ities
.3 V
aria
bles
in n
omin
al te
rm a
re s
how
n in
upp
er c
ase
lette
rs a
nd in
rea
l ter
m in
low
er c
ase;
and
all
vari
able
s ar
e in
ital
ics
to s
how
that
they
are
exp
ress
ed in
loga
rith
mic
term
.4 W
here
ow
n–ra
te o
r al
tern
ativ
e re
turn
is n
ot e
xplic
itly
stat
ed; a
lso
refe
rs to
the
net i
nter
est r
ate
mea
sure
.5 F
inan
cial
inno
vatio
n va
riab
le.
6 Ela
stic
ities
of
thos
e va
riab
les
expr
essi
ng th
e in
com
e an
d w
ealth
con
cept
s re
spec
tivel
y.7 E
xcha
nge
rate
mea
sure
.8 A
mea
sure
of
fore
ign
inte
rest
rat
e.9 S
hort
–ter
m in
tere
st r
ate
for
alte
rnat
ive
retu
rn, a
nd th
e ot
her
cate
gory
incl
udes
bot
h N
EE
R a
nd a
mea
sure
of
fore
ign
inte
rest
rat
e.10
Lon
g–te
rm in
tere
st r
ate
for
alte
rnat
ive
retu
rn, a
nd th
e ot
her
cate
gory
incl
udes
bot
h N
EE
R a
nd a
mea
sure
of
fore
ign
inte
rest
rat
e.11
Impl
icit
divi
sia
rent
al p
rice
or
user
cos
t ind
ex.
12Fi
nanc
ial i
nnov
atio
n va
riab
le a
nd v
olat
ility
mea
sure
for
yie
ld o
n lo
ng b
ond.
13M
easu
re o
f pr
ice
vari
abili
ty.
14E
xcha
nge
rate
dep
reci
atio
n.15
Fore
ign
exch
ange
ris
k an
d a
mea
sure
of
fore
ign
inte
rest
rat
e re
spec
tivel
y.16
Spre
ad b
etw
een
loca
l and
for
eign
inte
rest
rat
es.
17Fo
reig
n ex
chan
ge r
isk.
18V
aria
ble
expr
essi
ng f
orei
gn in
flue
nce.
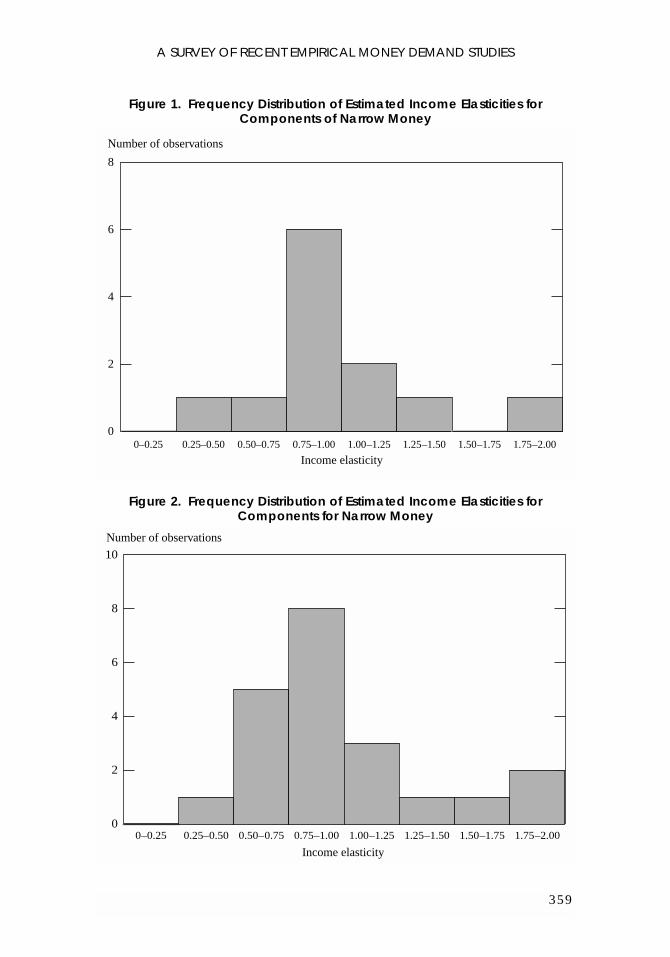
A SURVEY OF RECENT EMPIRICAL MONEY DEMAND STUDIES
359
Income elasticity
0
2
4
6
8
1.75–2.001.50–1.751.25–1.501.00–1.250.75–1.000.50–0.750.25–0.500–0.25
Number of observations
Figure 1. Frequency Distribution of Estimated Income Elasticities forComponents of Narrow Money
Income elasticity
0
2
4
6
8
10
1.75–2.001.50–1.751.25–1.501.00–1.250.75–1.000.50–0.750.25–0.500–0.25
Number of observations
Figure 2. Frequency Distribution of Estimated Income Elasticities forComponents for Narrow Money
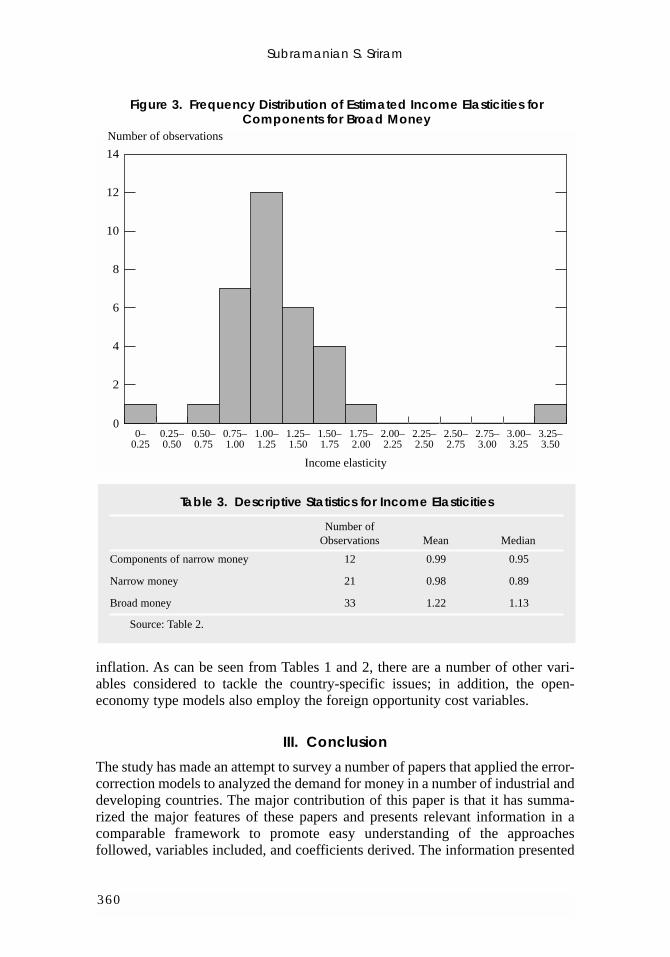
inflation. As can be seen from Tables 1 and 2, there are a number of other vari-ables considered to tackle the country-specific issues; in addition, the open-economy type models also employ the foreign opportunity cost variables.
III. Conclusion
The study has made an attempt to survey a number of papers that applied the error-correction models to analyzed the demand for money in a number of industrial anddeveloping countries. The major contribution of this paper is that it has summa-rized the major features of these papers and presents relevant information in acomparable framework to promote easy understanding of the approachesfollowed, variables included, and coefficients derived. The information presented
Subramanian S. Sriram
360
Table 3. Descriptive Statistics for Income Elasticities
Number ofObservations Mean Median
Components of narrow money 12 0.99 0.95
Narrow money 21 0.98 0.89
Broad money 33 1.22 1.13
Source: Table 2.
Income elasticity
0
2
4
6
8
10
12
14
3.25–3.50
3.00–3.25
2.75–3.00
2.50–2.75
2.25–2.50
2.00–2.25
1.75–2.00
1.50–1.75
1.25–1.50
1.00–1.25
0.75–1.00
0.50–0.75
0.25–0.50
0–0.25
Number of observations
Figure 3. Frequency Distribution of Estimated Income Elasticities forComponents for Broad Money
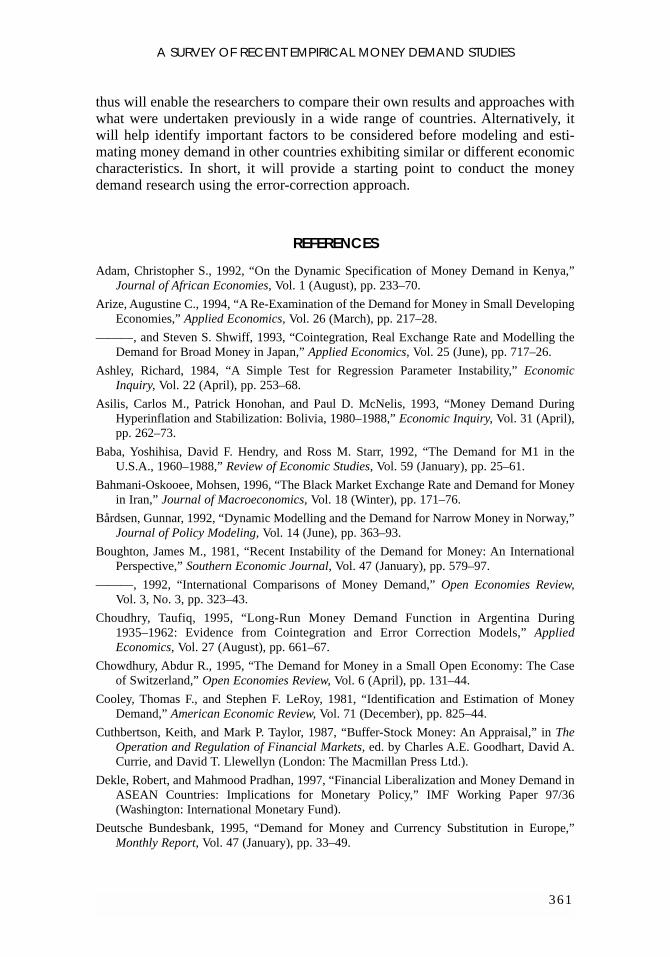
A SURVEY OF RECENT EMPIRICAL MONEY DEMAND STUDIES
361
thus will enable the researchers to compare their own results and approaches withwhat were undertaken previously in a wide range of countries. Alternatively, itwill help identify important factors to be considered before modeling and esti-mating money demand in other countries exhibiting similar or different economiccharacteristics. In short, it will provide a starting point to conduct the moneydemand research using the error-correction approach.
REFERENCES
Adam, Christopher S., 1992, “On the Dynamic Specification of Money Demand in Kenya,”Journal of African Economies, Vol. 1 (August), pp. 233–70.
Arize, Augustine C., 1994, “A Re-Examination of the Demand for Money in Small DevelopingEconomies,” Applied Economics, Vol. 26 (March), pp. 217–28.
———, and Steven S. Shwiff, 1993, “Cointegration, Real Exchange Rate and Modelling theDemand for Broad Money in Japan,” Applied Economics, Vol. 25 (June), pp. 717–26.
Ashley, Richard, 1984, “A Simple Test for Regression Parameter Instability,” EconomicInquiry, Vol. 22 (April), pp. 253–68.
Asilis, Carlos M., Patrick Honohan, and Paul D. McNelis, 1993, “Money Demand DuringHyperinflation and Stabilization: Bolivia, 1980–1988,” Economic Inquiry, Vol. 31 (April),pp. 262–73.
Baba, Yoshihisa, David F. Hendry, and Ross M. Starr, 1992, “The Demand for M1 in theU.S.A., 1960–1988,” Review of Economic Studies, Vol. 59 (January), pp. 25–61.
Bahmani-Oskooee, Mohsen, 1996, “The Black Market Exchange Rate and Demand for Moneyin Iran,” Journal of Macroeconomics, Vol. 18 (Winter), pp. 171–76.
Bårdsen, Gunnar, 1992, “Dynamic Modelling and the Demand for Narrow Money in Norway,”Journal of Policy Modeling, Vol. 14 (June), pp. 363–93.
Boughton, James M., 1981, “Recent Instability of the Demand for Money: An InternationalPerspective,” Southern Economic Journal, Vol. 47 (January), pp. 579–97.
———, 1992, “International Comparisons of Money Demand,” Open Economies Review,Vol. 3, No. 3, pp. 323–43.
Choudhry, Taufiq, 1995, “Long-Run Money Demand Function in Argentina During1935–1962: Evidence from Cointegration and Error Correction Models,” AppliedEconomics, Vol. 27 (August), pp. 661–67.
Chowdhury, Abdur R., 1995, “The Demand for Money in a Small Open Economy: The Caseof Switzerland,” Open Economies Review, Vol. 6 (April), pp. 131–44.
Cooley, Thomas F., and Stephen F. LeRoy, 1981, “Identification and Estimation of MoneyDemand,” American Economic Review, Vol. 71 (December), pp. 825–44.
Cuthbertson, Keith, and Mark P. Taylor, 1987, “Buffer-Stock Money: An Appraisal,” in TheOperation and Regulation of Financial Markets, ed. by Charles A.E. Goodhart, David A.Currie, and David T. Llewellyn (London: The Macmillan Press Ltd.).
Dekle, Robert, and Mahmood Pradhan, 1997, “Financial Liberalization and Money Demand inASEAN Countries: Implications for Monetary Policy,” IMF Working Paper 97/36(Washington: International Monetary Fund).
Deutsche Bundesbank, 1995, “Demand for Money and Currency Substitution in Europe,”Monthly Report, Vol. 47 (January), pp. 33–49.
Drake, Leigh, and K. Alec Chrystal, 1994, “Company-Sector Money Demand: New Evidenceon the Existence of a Stable Long-Run Relationship for the United Kingdom,” Journal ofMoney, Credit, and Banking, Vol. 26 (August, Part 1), pp. 479–94.
Eken, Sena, Paul Cashin, S. Nuri Erbas, Jose Martelino, and Adnan Mazarei, 1995, EconomicDislocation and Recovery in Lebanon, IMF Occasional Paper No. 120 (Washington:International Monetary Fund).
Engle, Robert F., and C.W.J. Granger, 1987, “Co-Integration and Error Correction:Representation, Estimation, and Testing,” Econometrica, Vol. 55 (March), pp. 251–76.
Engle, Robert F., and Byung Sam Yoo, 1987, “Forecasting and Testing in Co-IntegratedSystems,” Journal of Econometrics, Vol. 35 (May), pp. 143–59.
Ericsson, Neil R., 1998, “Empirical Modeling of Money Demand,” Empirical Economics,Vol. 23, No. 3, pp. 295–315.
Ericsson, Neil R., and Sunil Sharma, 1998, “Broad Money Demand and FinancialLiberalization in Greece,” Empirical Economics, Vol. 23, No. 3, pp. 417–36.
Fielding, David, 1994, “Money Demand in Four African Countries,” Journal of EconomicStudies, Vol. 21, No. 2, pp. 3–37.
Goldfeld, Stephen M., and Daniel E. Sichel, 1990, “The Demand for Money,” in Handbook ofMonetary Economics, Volume I, ed. by Benjamin M. Friedman and Frank H. Hahn (NewYork: North-Holland), pp. 300–56.
Goodfriend, Marvin, 1985, “Reinterpreting Money Demand Regressions,” Carnegie-RochesterConference Series on Public Policy, Vol. 22, pp. 207–42.
Granger, C.W.J., 1983, “Cointegrated Variables and Error Correction Models,” DiscussionPaper No. 83-13, Department of Economics (San Diego: University of California at SanDiego).
———, 1986, “Developments in the Study of Cointegrated Economic Variables,” OxfordBulletin of Economics and Statistics, Vol. 48 (August), pp. 213–28.
Hafer, R.W., and A.M. Kutan, 1994, “Economic Reforms and Long-Run Money Demand inChina: Implications for Monetary Policy,” Southern Economic Journal, Vol. 60 (April),pp. 936–45.
Hansen, Bruce E., 1992, “Tests for Parameter Instability in Regressions with I(1) Processes,”Journal of Business & Economic Statistics, Vol. 10 (July), pp. 321–35.
Hansen, Henrik, and Søren Johansen, 1993, “Recursive Estimation in Cointegrated VAR-Models,” Institute of Economics Discussion Papers No. 92 (Copenhagen: University ofCopenhagen).
Hasza, D., and W. Fuller, 1982, “Testing for Nonstationary Parameter Specifications inSeasonal Time Series Model,” The Annals of Statistics, Vol. 19, pp. 1209–16.
Haug, Alfred A., and Robert F. Lucas, 1996, “Long-Term Money Demand in Canada: In Searchof Stability,” The Review of Economics and Statistics, Vol. 78 (May), pp. 345–48.
Hendry, David F., 1979, “Predictive Failure and Econometric Modelling in Macroeconomics:The Transactions Demand for Money,” in Economic Modelling: Current Issues andProblems in Macroeconomic Modelling in the UK and the US, ed. by Paul Ormerod(London: Heinemann Education Books), pp. 217–42.
———, 1985, “Monetary Economic Myth and Econometric Reality,” Oxford Review ofEconomic Policy, Vol. 1 (Spring), pp. 72–84.
———, and G. Mizon, 1978, “Serial Correlation as a Convenient Simplification, Not aNuisance: A Comment on a Study of the Demand by the Bank of England,” The EconomicJournal (September), pp. 549–63.
Subramanian S. Sriram
362
Hendry, David F., Adrian R. Pagan, and J. Denis Sargan, 1984, “Dynamic Specification,”Chapter 18 in Handbook of Econometrics, Vol. 1, ed. by Zvi Griliches and Michael D.Intriligator (New York: North-Holland, 2nd ed.), pp. 1023–1100.
Hoffman, Dennis L., and Chakib Tahiri, 1994, “Money Demand in Morocco: Estimating Long-Run Elasticities for a Developing Country,” Oxford Bulletin of Economics and Statistics,Vol. 56 (August), pp. 305–24.
Hossain, Akhtar, 1994, “The Search for a Stable Money Demand Function for Pakistan: AnApplication of the Method of Cointegration,” Pakistan Development Review, Vol. 33(Winter), pp. 969–81.
Hylleberg, S., R.F. Engle, C.W.J. Granger, and B.S. Yoo, 1990, “Seasonal Integration andCointegration,” Journal of Econometrics, Vol. 44 (April–May), pp. 215–38.
Johansen, Søren, 1988, “Statistical Analysis of Cointegration Vectors,” Journal of EconomicDynamics and Control, Vol. 12 (June–September), pp. 231–54.
———, 1991a, “Estimation and Hypothesis Testing of Cointegration Vectors in GaussianVector Autoregressive Models,” Econometrica, Vol. 59 (November), pp. 1551–80.
———, 1991b, “The Role of the Constant Term in Cointegration Analysis of NonstationaryVariables,” Working Paper, Institute of Mathematical Statistics (Copenhagen: University ofCopenhagen, July).
———, 1992a, “Cointegration in Partial Systems and the Efficiency of Single-EquationAnalysis,” Journal of Econometrics, Vol. 52 (June), pp. 389–402.
———, 1992b, “Testing Weak Exogeneity and the Order of Cointegration in UK MoneyDemand Data,” Journal of Policy Modeling, Vol. 14 (June), pp. 313–34.
———, and Katarina Juselius, 1990, “Maximum Likelihood Estimation and Inference onCointegration, With Applications to the Demand for Money,” Oxford Bulletin of Economicsand Statistics, Vol. 52 (May), pp. 169–210.
Judd, John P., and John L. Scadding, 1982, “The Search for a Stable Money Demand Function:A Survey of the Post-1973 Literature,” Journal of Economic Literature, Vol. 20(September), pp. 993–1023.
Jusoh, Mansor, 1987, “Inflationary Expectations and the Demand for Money in ModerateInflation: Malaysian Evidence,” Jurnal Ekonomi Malaysia, Vol. 15 (June), pp. 3–14.
Khamis, May Y., and Alfredo M. Leone, 1999, “Can Currency Demand Be Stable Under aFinancial Crisis? The Case of Mexico,” IMF Working Paper 99/53 (Washington:International Monetary Fund).
Kumah, Emmanuel O., 1989, “Monetary Concepts and Definitions,” IMF Working Paper 89/92(Washington: International Monetary Fund).
Kwiatkowski, Denis, Peter C.B. Phillips, Peter Schmidt, and Yongcheol Shin, 1992, “Testingthe Null Hypothesis of Stationarity Against the Alternative of a Unit Root: How Sure AreWe That Economic Time Series Have a Unit Root?” Journal of Econometrics, Vol. 54(October–December), pp. 159–78.
Laidler, David E.W., 1984, “The ‘Buffer Stock’ Notion in Monetary Economics,” TheEconomic Journal: The Journal of the Royal Economic Society, Vol. 94 (Supplement),pp. 17–34.
———, 1993, The Demand for Money: Theories, Evidence, and Problems (New York:HarperCollins College Publishers, 4th ed.).
Lim, G.C., 1993, “The Demand for the Components of Broad Money: Error-Correction andGeneralised Asset Adjustment Systems,” Applied Economics, Vol. 25 (August),pp. 995–1004.
A SURVEY OF RECENT EMPIRICAL MONEY DEMAND STUDIES
363
McNown, Robert, and Myles S. Wallace, 1992, “Cointegration Tests of a Long-Run RelationBetween Money Demand and the Effective Exchange Rate,” Journal of InternationalMoney and Finance, Vol. 11 (February), pp. 107–14.
Mehra, Yash P., 1993, “The Stability of the M2 Demand Function: Evidence from an Error-Correction Model,” Journal of Money, Credit, and Banking, Vol. 25, Part 1 (August),pp. 455–60.
Milbourne, Ross, 1988, “Disequilibrium Buffer Stock Models: A Survey,” Journal of EconomicSurveys, Vol. 2, No. 3, pp. 187–208.
Miller, Stephen M., 1991, “Monetary Dynamics: An Application of Cointegration and Error-Correction Modeling,” Journal of Money, Credit, and Banking, Vol. 23 (May), pp. 139–54.
Moosa, Imad A., 1992, “The Demand for Money in India: A Cointegration Approach,” IndianEconomic Journal, Vol. 40 (July–September), pp. 101–15.
Muscatelli, Vito A., and Luca Papi, 1990, “Cointegration, Financial Innovation, and Modellingthe Demand for Money in Italy,” Manchester School of Economic and Social Studies,Vol. 58 (September), pp. 242–59.
Orden, David, and Lance A. Fisher, 1993, “Financial Deregulation and the Dynamics ofMoney, Prices, and Output in New Zealand and Australia,” Journal of Money, Credit, andBanking, Vol. 25 (May), pp. 273–92.
Osborn, Denise R., 1990, “A Survey of Seasonality in UK Macroeconomic Variables,”International Journal of Forecasting, Vol. 6 (October), pp. 327–36.
Perron, Pierre, 1988, “Trends and Random Walks in Macroeconomics Time Series: FurtherEvidence from a New Approach,” Journal of Economic Dynamics and Control(June–September), pp. 297–332.
———, 1989, “The Great Crash, the Oil Price Shock, and the Unit Root Hypothesis,”Econometrica, Vol. 57 (November), pp. 1361–1401.
Phillips, Peter C.B., 1987, “Time Series Regression with a Unit Root,” Econometrica, Vol. 55(March), pp. 277–301.
———, and Bruce E. Hansen, 1990, “Statistical Inference in Instrumental Variables Regressionwith I(1) Processes,” Review of Economic Studies, Vol. 57 (January), pp. 99–125.
Phillips, Peter C.B., and S. Ouliaris, 1990, “Asymptotic Properties of Residual Based Tests forCointegration,” Econometrica, Vol. 58 (January), pp. 165–93.
Phillips, Peter C.B., and Pierre Perron, 1988, “Testing for a Unit Root in Time SeriesRegression,” Biometrika, Vol. 75 (June), pp. 335–46.
Price, Simon, and Insukindro, 1994, “The Demand for Indonesian Narrow Money: Long-RunEquilibrium, Error Correction and Forward-Looking Behaviour,” Journal of InternationalTrade and Economic Development, Vol. 3 (July), pp. 147–63.
Salkever, David S., 1976, “The Use of Dummy Variables to Compute Predictions, PredictionErrors and Confidence Intervals,” Journal of Econometrics, Vol. 4 (November), pp.393–97.
Sriram, Subramanian S., 1999a, “Demand for M2 in an Emerging-Market Economy: An Error-Correction Model for Malaysia,” IMF Working Paper 99/173 (Washington: InternationalMonetary Fund).
———, 1999b, “Demand for M2 in Malaysia” (Ph.D. dissertation; Washington: GeorgeWashington University).
———, 1999c, “Survey of Literature on Demand for Money: Theoretical and Empirical Workwith Special Reference to Error-Correction Models,” IMF Working Paper 99/64(Washington: International Monetary Fund).
Subramanian S. Sriram
364
———, 2000, The Demand for Money in Malaysia: A Study of M2 (Bangalore, India: SouthernEconomist).
Stock, James H., and Mark W. Watson, 1993, “A Simple Estimator of Cointegrating Vectors inHigher Order Integrated Systems,” Econometrica, Vol. 61 (July), pp. 783–820.
Tan, Eu Chye, 1997, “Money Demand Amid Financial Sector Developments in Malaysia,”Applied Economics, Vol. 29 (September), pp. 1201–15.
Teriba, Ayodele Olalekan, 1997, “Demand for Money in Nigeria: New Evidence from Annual(1960–94) and Quarterly (1962I–1995II) Data,” IMF Seminar Series No. 1997-25a, July 1(Washington: International Monetary Fund).
Treichel, Volker, 1997, “Broad Money Demand and Monetary Policy in Tunisia,” IMF WorkingPaper 97/22 (Washington: International Monetary Fund).
Tseng, Wanda, and Robert Corker, 1991, Financial Liberalization, Money Demand, andMonetary Policy in Asian Countries, IMF Occasional Paper No. 84 (Washington:International Monetary Fund).
Tseng, Wanda, Hoe Ee Khor, Kalpana Kochhar, Dubravko Mihaljek, and David Burton, 1994,Economic Reforms in China: A New Phase, IMF Occasional Paper No. 114 (Washington:International Monetary Fund).
Zarembka, Paul, 1968, “Functional Form in the Demand for Money,” Journal of AmericanStatistical Association, Vol. 63 (June), pp. 502–11.
A SURVEY OF RECENT EMPIRICAL MONEY DEMAND STUDIES
365