Embed Size (px)
Citation preview
A Survey of Salt Importers, Producers and Traders in the Philippines: an Evaluation of Internal and External Quality Assurance and Control
Nutrition Center of the Philippines December 2010
TABLE OF CONTENTS
EXECUTIVE SUMMARY i LIST OF TABLES vi LIST OF FIGURES vii
INTRODUCTION…………………………………………………………………. 1 Background……………………………………………………………………… 1
General objectives………………………………………………………………. 3
METHODS………………………………………………………………………… 3 Social preparation………………………………………………………………... 3
Development and pre-testing of interview schedules and audit protocol……….. 3
Recruitment and training of Field Interviewers…………………………………. 4
Provincial survey of salt producers and importers/traders………………………. 4
Data processing and analysis………………………………….…………………. 5
RESULTS………………………………………………………………………….. 6 I. Salt Producers..………………………………………………………………... 6
Respondents’ profile ………………………………………………………... 6
Salt production process……………………………………………………… 10
Storage and packaging practices…………………………………………… 13
Selling practices………………….………………………………………… 14
Distribution of salt……………….…………………………………………. 16
Iodization of salt……………….…………………………………………… 17
II. Salt Importers/Traders……………….……………………………………….. 18
Respondents’ profile……………….………………………………………. 18
Purchasing practices……………….………………………………………. 20
Storage and packaging practices……………….…………………………... 23
Marketing and distribution……………….………………………………… 25
Iodization of salt……………….…………………………………………… 27
III. Quality Assurance/Quality Control……………….…………………………… 28
Respondents’ profile…………….………………………………………….. 28
Information on guidelines for salt iodization…………….………………… 30
Receipt of raw materials for salt iodization…………….…………………... 32
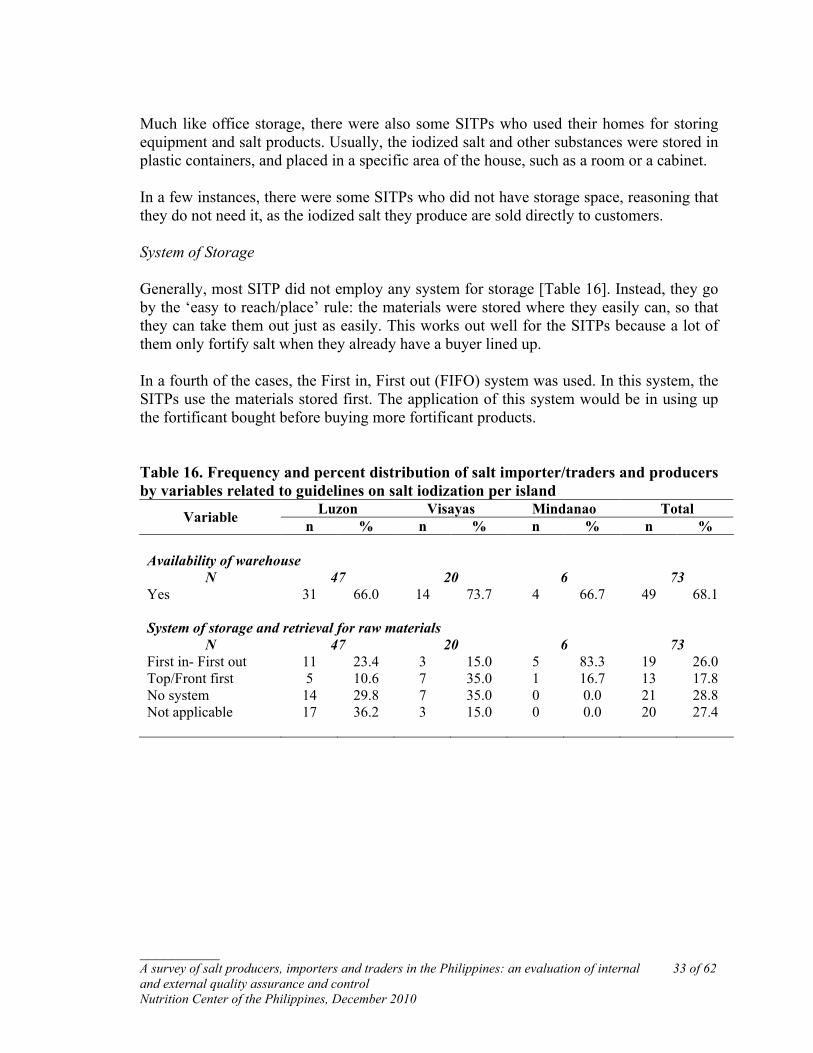
Storage practices for raw materials used during salt iodization…………….. 32
Salt iodization………………………………………………………………. 34
Iodine level in iodized salt.…………………………………………………. 38
Salt iodization method..…….………………………………………………. 41
Use of iodized salt…………….…………………………………………….. 42
Quality control…………….………………………………………………… 43
Packaging of iodized salt.…………….……………………………………... 44
Sanitation and safety system…………….………………………………….. 46
Storage, handling and distribution…………….……………………………. 48
Recordkeeping…………….………………………………………………… 49
IV. Needs Assessment…………….……………………………………………….. 50 IV. Mapping the location of Salt Importers/Traders and Producers using the Global Positioning System ……………………………………………………. 53
DISCUSSIONS AND RECOMMENDATIONS……………………………….. 55
List of Annexes
i
EXECUTIVE SUMMARY The 2010 Salt Survey was conducted among selected salt importers, traders and producers located in Metro Manila, Ilocos Norte, Ilocos Sur, La Union, Bulacan, Pangasinan, Occidental Mindoro, Batangas, Iloilo, Guimaras, Negros Occidental, Negros Oriental, Cebu, Misamis Oriental, Davao, General Santos City and Zamboanga. The objectives of the study are to validate the registry of salt importers, traders and producers and to evaluate the existing quality assurance and quality control systems and practices of the salt industry. Salt producers Of 384 producers approached, 375 agreed to be interviewed (2.3%). A total of 375 salt producers were interviewed, of whom, 70% were from Luzon with Pangasinan and Occidental Mindoro contributing the most number of respondents. About 27% of the salt producers interviewed were from Visayas while 2.7% were from Mindanao. More than one-third (35%) of the salt producers interviewed have been operational for 10 years or less. Only 6% of the respondents were able to show documentation on business registration while only 1% showed their License to Operate from the Food and Drug Authority. Most salt producers use solar evaporation to produce coarse salt. Salt producers from Ilocos Sur, Ilocos Norte, La Union and one-third of producers from Pangasinan use the cooking method to produce fine salt. More than half (56%) of the respondents have greater than 1 to less than or equal to 10 hectares of land area allotted for salt production. Salt producers from Luzon provinces used ceramics as salt beds. On the other hand, majority of the salt producers from Visayas and Mindanao use plastic sheets. Among the 346 respondents who reported their salt production in the previous year, 9.5% produced salt not exceeding 2 MT (subsistence producers), 72% produced salt ranging from more than 2 MT to 300 MT (small-scale producers), 17.3% produced salt ranging from more than 300 MT to 2,000 MT (medium-scale producers) and 1.2% produced salt exceeding 2,000 MT (large-scale producers). Ninety-one percent (91%) of the respondents produced salt for human/commercial, 75% produced salt for food processing, 27% produced salt for animal consumption while 7% produced salt for industrial use. A fourth (25.3%) of the respondents did not have a warehouse to store harvested salt. Regardless of the presence of a warehouse, most producers store salt by directly dumping the harvested raw salt on the ground, either lined with canvas, plastic sheets, woven bamboo mats, used sack or rice hull or not lined at all. Almost all (99%) respondents sold salt in bulk, usually packed in second-hand sacks. Most packaging used when selling salt had no labeling or information on the company name, manufacturers’ name and date of production Refined salt was more expensive than coarse salt, selling as much as PhP 15.00 per kg.
ii
The usual selling price of commercial salt was between PhP 1.00 to 3.00 per kg (55%). Among those who reported (83% of the 375) the quantity of salt sold in the previous year, 44.4% reported selling between 10 to less than 100 MT of salt the previous year. When the respondents were asked if they iodize the salt they produce, only 15% answered positively. No respondents from Bulacan, Cebu, Misamis Oriental and Zamboanga iodize their salt. Most of those (60.4%) iodizing salt were small-scale salt producers, producing between 2 to less than or equal to 300 MT of non-iodized salt. Three out of the 4 large-scale salt producers are iodizing their non-iodized salt. Salt importers/traders A total of 39 (60%) of the 65 salt importers/traders who were approached to join the survey participated. Almost half (46%) of the respondents have been operational for not more than 10 years. However, only 33% were able to show the documents on business registration while only 13% were able to show their LTO from the FDA. The respondents purchased either raw or non-iodized, iodized or both types of salt. A third of them (33%) purchased iodized salt only while 41% purchased non-iodized salt only. Non-iodized salt were usually purchased from local salt producers (72%) while imported non-iodized salt came from Australia, China and Thailand. Majority of the respondents (86%) purchased iodized salt from the large-scale local traders. Only 85% reported the quantity of non-iodized purchased, 50% of whom purchased more than 300 MT last year. Out of the 21 importers/traders of iodized salt who gave information on the quantity of iodized salt purchased last year, half (52%) reported purchasing between 2 to less than or equal to 300 MT. Of the total salt purchased, 55% of the non-iodized salt and 87% of the iodized salt are allotted for human consumption. Warehouses used for the storage of salt are available for 76% of the respondents. Most of the respondents (73.1%) store non-iodized salt in sacks while all iodized salt is packed in sacks. The sacks used were usually made from woven polypropylene that was either brand new or second-hand. Majority of the respondents (73%) usually sold iodized salt in bulk packed in sacks. Iodized salt (46%) was also repacked into transparent polyethylene bag. Majority of the respondents (64%) who reported selling non-iodized salt do not have the information label on the packaging used on packed non-iodized salt. Only 79% of the respondents who were selling non-iodized salt answered the question on the quantity of non-iodized salt sold the previous year. Among them, 47% reportedly sold more than 500 MT of non-iodized the previous year. More than half (62.5%) reported selling non-iodized salt not more than PhP5.00 per 1 kilogram while 48% sold iodized salt at much higher price, from more than PhP5.00 to as much as PhP20.00 per 1 kilogram. Importers/Traders from Luzon sold their non-iodized salt to traders from Ilocos provinces,
iii
Cagayan Valley, Isabela and Nueva Ecija; respondents from Visayas would sell their salt to buyers from Iloilo, Guimaras, Samar, Leyte and Negros Oriental; respondents from Mindanao would sell their salt to Cotabato, Surigao, Sultan Kudarat and Davao. Among the traders/importers who reported purchasing and iodizing non-iodized salt, only 65% claimed to iodize the non-iodized salt they purchased. Among those who claimed to iodize their non-iodized salt, only 24% were able to show their LTO document. Quality Assessment / Quality Control Most of those (74%) interviewed using the Quality Control/Quality Assurance system were salt producers. Only 3% were able to show their operations manual. Eighty-four percent (84%) reported familiarity with the salt iodization guidelines. Majority of the respondents (89%) cited the government as their source of information while 13% cited their own company as their source of information. The information known by the salt importers, traders and producers (SITPs) on iodization can be classified into rules and regulations, technical and beneficial knowledge. With regards to raw materials used for salt iodization, visual check of non-iodized salt and potassium iodate is used. Most of the respondents (68%) have warehouses to store the raw materials. However, most SITP did not employ any system for storage of the raw materials. Instead, they go by the ‘easy to reach/place’ rule because a lot of them only fortify salt when they already have a buyer lined up. The SITPs (92%) do not have all utilities required in the production area allotted for salt iodization and packaging. Most of the SITPs (63%) used plastic sprayer (pressurized garden sprayer or plastic hand spray bottle) in spraying the fortificant solution during salt iodization. Only ¼ of the SITPs had iodization machines, which may either be a continuous type blender (28%), ribbon blender (20%) or cement mixer (16%), while the rest had improvised machines. Iodized salt was mostly produced manually with almost all of the SITPs (96%) producing iodized salt for human or household consumption The recommended iodization level in the Philippines is between 20 to 70 ppm iodine based on 2007 revised Implementing Rules and Regulations of the ASIN Law. Among the 31 who reported their target minimum iodine level, only 26% targeted a minimum iodine level that was within the standard while 82% reported a maximum iodine level above the standard, between 75 to 100 ppm. Only 75% provided answers on both the amount of fortificant and the quantity of salt iodized. Among those who gave the information, 37% used a solution that would yield iodine levels below the 2007 standard. However, based on the old standards (between 70 to 150 ppm at manufacturer’s level), only 1 respondent was iodizing using a fortificant solution below standards. To conduct quality control on their iodized salt, all of the respondents used a Rapid Test Kit (RTK) usually given by the Sanitary Inspectors of the local government unit. However, among those who were able to show the complete set of the RTK, 76% were
iv
using RTKs past the expiration date indicated on the label of the box. Iodized salt were usually packed in sacks and stored in a warehouse using a pallet. However, there are some who store iodized salt by dumping directly on the warehouse floor or packed in sack but not elevated from the floor. Further, almost all respondents (99%) do not comply with the required labeling requirement of packed iodized salt. Also, only 41% followed the first-in, first-out (FIFO) system. To ensure safety and sanitation during salt iodization protective clothing/uniform for the workers should be available. However, only 5% of the respondents have complete available protective clothing for workers. In addition, only 15% reported to have first-aid kits available in the area in case of accidents or emergencies. Fumigation of the premises was not regularly conducted in the production area. Eleven percent (11%) claimed to have a system being followed when complaints about their products are received. The usual complaints of customers were high moisture content of the iodized salt or improper sealing of the packages. The product is retrieved and replaced. However, 55% do not keep a record or any documentation related to the manufacturing of iodized salt. Those who claimed to have a system of record keeping (37%) would usually show either a notebook or a ledger to keep track of records such as results of machine maintenance, daily activities and others. Needs assessment The study also probed into the possible ways that assistance can be given to the salt manufacturers by asking an open-ended question: What assistance do you need to help improve your business?. Their response can be summarized as follows: financial support for additional capital to purchase equipment for salt production and iodization; additional training and equipment to improve product quality; government assistance in law implementation, price control and salt importation. The survey showed that there has been a change in the profile of the salt industry in the country when compared with the results of our last nationwide survey in the 1990s. We estimate that at least 30% of the salt producers who were included in the 1990 surveys have closed. However, there were also young players who have cropped-up in the salt industry as shown by the survey where a third of the salt producers interviewed reported operating for less than or equal to 10 years. There was also a change in the materials used as salt beds, from using broken ceramics to using plastic sheets. In the production process of salt, dissolving coarse salt in seawater to produced concentrated brine to be cooked to produce fine grain salt has become more common. Several issues related to the monitoring of quality assurance and quality control have also been observed. First, there is lack of updated or available registry of salt importers, traders and producers from the local government units, which can be used to support the monitoring efforts of concerned agencies. Also, salt iodization using salt iodization machine was generally limited to large-scale salt manufacturers. Medium to subsistence

v
manufacturers generally iodize manually with no standardized procedures or guidelines being followed. All salt manufacturers use RTKs to determine if the salt is iodized. However, most of the RTKs being used when inspected were expired. It was also observed that most of the SITPs do not collect salt samples from the heap but instead drop the test solution directly on the top of the iodized salt heap, usually at one area only. Ideally one to two spoonfuls of salt samples should be collected from random areas (i.e. top, middle, bottom) of the heap, each salt samples should be placed in a test plate and separately tested for presence of iodine by dropping one to two drops of test solution onto the salt sample. Packaging and labeling requirements of packed iodized salt based on the BFAD Administrative Order No. 88-B series of 1988 are rarely followed by the SITPs and if followed are limited to large-scale SITPs. Lastly, guidelines required that iodized salt should be kept palletized in a cool and dry storage area where it is protected from dust and other contaminants. However, several SITPs do not have suitable warehouse construction allotted for storing iodized salt. It is evident that there were several changes in the profile of the salt industry in the country. Various issues on the salt industry and the salt iodization process have also been raised and discussed in this report. It is best to address several technical, administrative and logistical issues in order for the Universal Salt Iodization Program to continue an effective and efficient implementation.
vi
LIST OF TABLES
No. Title 1 Provinces in Luzon, Visayas and Mindanao included in the survey…………. 4
2 Frequency and percent distribution of salt producers by interview status per province………………………………………………………………………. 7
3 Frequency and percent distribution of salt producers by respondents’ profile per island……………………………………………………………………… 9
4 Frequency and percent distribution of salt producers by variables related to production of non-iodized salt per island…………………………………….. 12
5 Frequency and percent distribution of salt producers by variables related to storage and packaging practices of non-iodized salt per island……………… 13
6 Frequency and percent distribution of salt producers by variables related to selling practices of non-iodized salt per island………………………………. 15
7 Frequency and percent distribution of salt producers by practice of iodizing salt per area…………………………………………………………………… 16
8 Frequency and percent distribution of salt importers/traders by interview status per area………………………………………………………………… 18
9 Frequency and percent distribution of salt importers/traders by respondents’ profile per island……………………………………………………………… 19
10 Frequency and percent distribution of salt importers/traders by variables related to purchasing practices of salt per island……………………………... 21
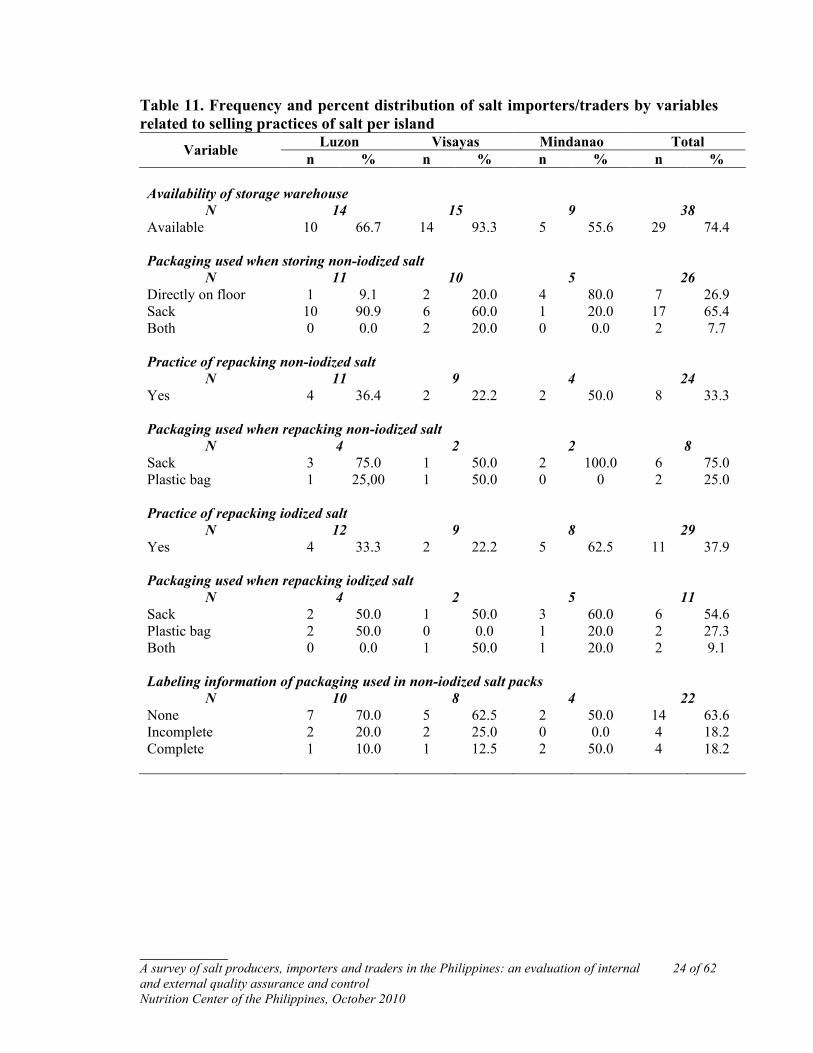
11 Frequency and percent distribution of salt importers/traders by variables related to selling practices of salt per island………………………………….. 24
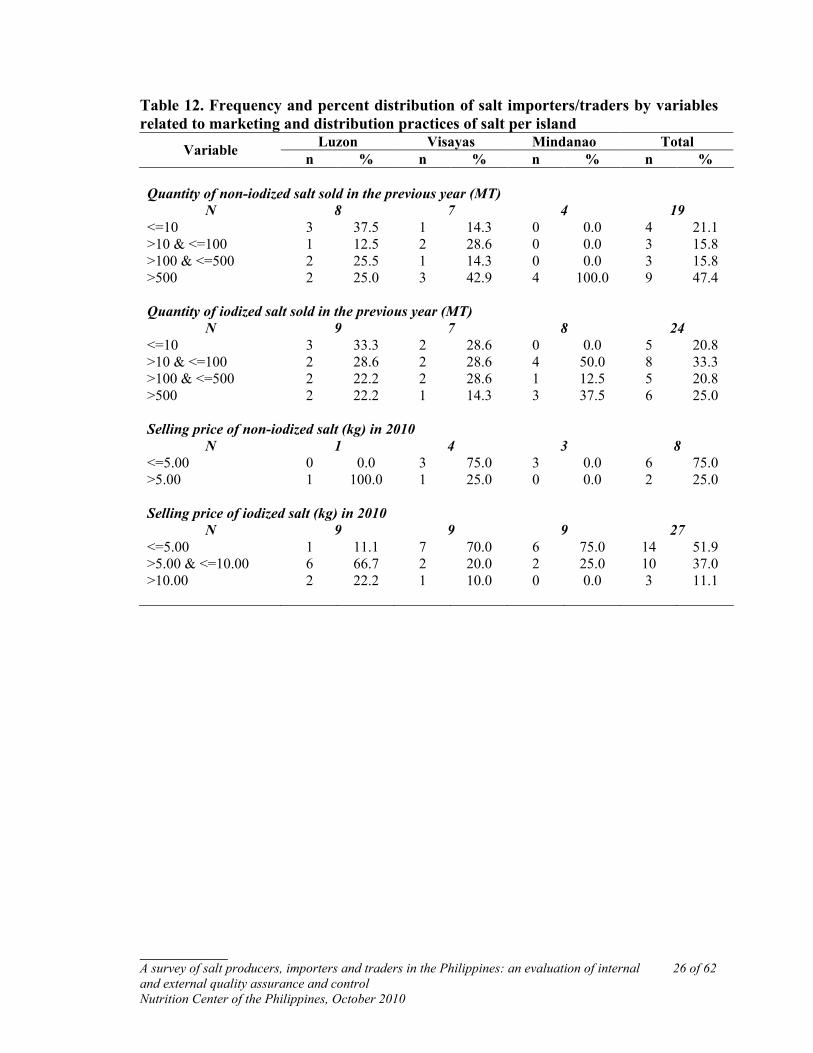
12 Frequency and percent distribution of salt importers/traders by variables related to marketing and distribution practices of salt per island.……………. 26
13 Frequency and percent distribution of salt importers/traders by practice of iodizing non-iodized salt per area…………………………………………….. 27
14 Frequency and percent distribution of salt importer/traders and producers by respondents’ profile per island………………………………………………... 29
15 Frequency and percent distribution of salt importer/traders and producers by variables related to guidelines on salt iodization per island………………….. 31
16 Frequency and percent distribution of salt importer/traders and producers by variables related to guidelines on salt iodization per island………………….. 33
17 Frequency and percent distribution of salt importer/traders and producers by variables related to equipment used during salt iodization per island………... 37
18 Frequency and percent distribution of salt importer/traders and producers by 39

vii
No. Title variables related to iodine levels during salt iodization per island……………
19 Frequency and percent distribution of salt importer/traders and producers by method of salt iodization and reported use of iodized salt per island………… 42
20 Frequency and percent distribution of salt importer/traders and producers by method used in testing iodized salt during production per island…………….. 43
21 Frequency and percent distribution of salt importer/traders and producers by packaging material used when re/packing iodized salt per island…………... 44
22 Frequency and percent distribution of salt importer/traders and producers by availability of first-aid facility per island…………………………………….. 46
23 Frequency and percent distribution of salt importer/traders and producers by variables related to storage, handling and distribution of iodized salt per island………………………………………………………………………….. 48
24 Frequency and percent distribution of salt importer/traders and producers by availability of forms for record keeping per island…………………………… 49
viii
LIST OF FIGURES
No. Title
1 Proportion of salt importer/traders and producers with incomplete facilities by presence of the specified facilities needed in the production area………………………………………………………………………… 36
2a Proportion of salt importer/traders and producers interviewed by classification of computed iodine levels (ppm) using the revised IRR......... 40
2b Proportion of salt importer/traders and producers interviewed by classification of computed iodine levels (ppm) using the old IRR…........... 40
3 Proportion of non-compliant salt importer/traders and producers whose packaging has the required specified information………………………… 45
4 Proportion of salt importer/traders and producers who have the specific protective clothing for use during salt iodization………………………….. 47
A Survey of Salt Importers, Producers and Traders in the Philippines: an Evaluation of Internal and External Quality Assurance and Control
INTRODUCTION Background A comprehensive survey on the salt industry in the Philippines was conducted by the Nutrition Center of the Philippines (NCP) in collaboration with the then Nutrition Service of the Department of Health, with funding assistance from UNICEF. The survey was conducted in 1993 among the salt producers from selected provinces in Luzon [Solon et al., 1994 and Solon et al., 1995], Visayas and Mindanao [Solon et al., 1994]. Salt traders from Visayas and Mindanao were also included in the survey. Salt producers were interviewed on their production, storage, and marketing practices. Salt traders were also asked on their purchasing practices. The survey also included questions on their willingness to iodize the raw salt they produced or purchased. Data obtained from the survey were used in the planning and formulation of the National Salt Iodization Program (NSIP) in the country. The NSIP is the primary approach of the country in battling iodine deficiency disorder in our population. Included herewith is the drafting of the Republic Act 8172 or An Act for Salt Iodization Nationwide (ASIN) Law in 1995 [Congress of the Philippines, 1996]. The ASIN Law has been in effect since 1996, guided by its implementing rules and regulations (IRR). The IRR has been revised in 2007 to strengthen support and fast track the implementation of the law [NNC Governing Board, 2007]. As a continuing support to the NSIP, several studies have been conducted by NCP to provide evidenced-based support to the program. A case study by NCP described the manpower, production, storage, packaging and conduct of quality checks of an iodization plant to its product [Solon et al., 1997]. Several stability studies of iodine in iodized salt sold through the traditional “takal” method were also conducted by NCP [Solon et al., 1998 and Maramag et al., 2007]. A survey done among the salt retailers in the public market and sari-sari stores in selected provinces in Luzon, Visayas and Mindanao also gave a comprehensive description of the Philippine salt industry at the retail level [Solon et al., 1999]. The National Nutrition Surveys conducted by the Food and Nutrition Institute (FNRI) every 5 years from 1998 to 2008 used urinary iodine excretion (UIE) levels to assess severity of iodine deficiency disorder (IDD). Median UIE levels showed improvement among the 6 to 12 year old children [FNRI, 2001, 2006 and 2008]. From 71 µg/L in 1998 (insufficient iodine intake) to 201 µg/L (above requirements) in 2003 to 132 µg/L (adequate iodine intake) in 2008 was observed. However, comparing the median UIE per region from the 2008 data showed a wide range of UIE levels, from an insufficient intake of 68 µg/L (Davao region) reflecting mild iodine deficiency to as high as 233 µg/L (Cagayan Valley region), may pose a slight risk for iodine intake in the overall population
______________________ A survey of salt producers, importers and traders in the Philippines: an evaluation of internal 2 of 62 and external quality assurance and control Nutrition Center of the Philippines, December 2010
[WHO/UNICEF/ICCIDD, 2007]. The median UIE of lactating and pregnant women was inadequate at 81 µg/L and 105 µg/L [FNRI, 2010]. Using the rapid test kit (RTK), 81% of the total household salt surveyed in 2008 contained potassium iodate [FNRI, 2008]. This was an increase of 25% from 2003. Based on the WHO 2007 guidelines, 90% of household should be using iodized salt with an iodine level of >15 to <40 ppm to indicate that there is sustainable elimination of iodine deficiency [WHO/UNICEF/ICCIDD, 2007]. However, when iodine level in a subsample of the iodized salt collected from households was determined using the WYD Iodine checker, the median iodine value of household’s iodized salts for the entire Philippines was 5.3 ppm with only 25.2% of household salts having an iodine level of >15 ppm. The data showed that there was poor correlation between the proportion of households with salt that tested positive for potassium iodate using RTK and the UIE levels. For instance, Davao was found to have a low median UIE level of 50 µg/L among lactating women but with high proportion of households with salt that tested positive for potassium iodate using RTK (96.3%). The same patterns can be observed in Eastern Visayas, Northern Mindanao and CARAGA regions. The wide range of UIE levels and the lack of correlation of UIE levels with iodized salt usage may imply gaps in the distribution of iodized salt and variability in the implementation of quality assurance and quality control on produced and imported iodized salt. These would, in turn, result in a wide variability in the iodine content of the iodized salt available in the market. There is thus a need to validate the supply of salt produced locally and imported into the country and document the quality assurance (QA) and quality control (QC) systems being practiced by the salt industry. This is to determine if the set of processes designed to ensure that the concentration of iodine in salt are effective and are being implemented by the iodized salt producers. We need to establish the degree of implementation, or the lack of it, of the recommended QA and QC systems especially among medium to large- scale salt producers and importers who have the monopoly of the market. Further, we have to ascertain if the set of standards set by the guidelines on salt iodization on the quality of iodized salt that are available in the market are being met. Documentation of these practices will inform policy-makers as to the state of the salt industry’s QA and QC system and therefore guide them in the determination, assessment and formulation of the assistance needed by the salt industry to further improve the salt iodization program in the country.

______________________ A survey of salt producers, importers and traders in the Philippines: an evaluation of internal 3 of 62 and external quality assurance and control Nutrition Center of the Philippines, December 2010
General Objective 1. To validate the registry of large and medium-sized salt producers, importers and traders 2. To evaluate existing quality assurance / control systems and practices of the salt industry. Specific Objectives 1. To describe the location, distribution, size and scale of production of salt importers and producers; 2. To document external quality assurance and control systems and practices; 3. To document and evaluate the internal quality assurance control systems and practices of salt producers and importers. 4. To plot the coordinates of location and estimated boundaries of existing salt producers. METHODS Field interview and evaluation of quality assurance and quality control systems were conducted from May 4, 2010 to July 09, 2010. For each site, data on salt production and quality assurance and control were simultaneously collected. Social Preparation Officials from the 1) Food and Drug Administration (FDA); 2) Association of Salt Producers, Traders and Allied Industries, Inc. (ASPTAI, Inc); 3) Department of Health (DOH); and 4) National Nutrition Council (NNC) were met to orient them about the study, to request assistance and to request for the registry of salt producers and importers/traders, if there is any. Local government units such as the regional offices of FDA and the Department of Trade and Industry (DTI) were also contacted to inform them of the survey and to request for a registry of salt producers and importers/traders. The registry of salt producers and importers/traders obtained from the FDA, local government units and from the previous surveys conducted by the NCP in the 1990s were consolidated and was used during the fieldwork. Development and pre-testing of interview schedules and audit protocol Interview schedules were developed for this study. The information to be obtained included: a) company profile, b) procedures on production, storage, packaging, marketing and distribution, c) purchasing practices, and d) salt iodization practices. Based on the guidelines on quality assurance of salt1, an audit checklist was created by the
1The Sub-committee on Standardization of the Salt Iodization Program. Guidelines on quality assurance for salt iodization. December 1997.
______________________ A survey of salt producers, importers and traders in the Philippines: an evaluation of internal 4 of 62 and external quality assurance and control Nutrition Center of the Philippines, December 2010
team. The checklist covered knowledge on the guidelines on salt iodization and the requirements regarding personnel, facilities, safety and sanitation, and different phases of the salt iodization process. Particular to the iodization process, the study evaluated the procedures for the following: 1) receiving and storage of raw materials (salt and fortificant); 2) facilities requirement; 3) quality assurance system for each type of iodization process; 4) packaging; 5) labeling; and 6) handling and distribution. The interview schedules [Annexes 1 to 3] and the audit protocol were pre-tested prior to the actual data gathering activity to assure clarity of the questions to the respondent and to minimize errors in the recording of responses. Each was pre-tested among purposively selected salt producers and salt importer/trader. Recruitment and training of Field Interviewers Field interviewers were hired and trained on the accomplishment of the Interview Schedules and on the editing and validation of responses. They were also trained on how to conduct quality auditing by a certified auditor and on the use of the Garmin GPSMAP 76Cx and GPSMAP 60CSx (Garmin Ltd., Kansas City, USA), equipment used to plot the location of the survey respondents or their salt manufacturing area. Provincial survey of salt producers and importers/traders The survey was carried out in selected provinces in Luzon, Visayas and Mindanao [Table 1]. Table 1. Provinces in Luzon, Visayas and Mindanao included in the survey
Luzon Visayas Mindanao
Ilocos Sur Iloilo Misamis Oriental
Ilocos Norte Guimaras General Santos City, Cotabato
La Union Negros Occidental Davao
Pangasinan Negros Oriental Zamboanga
Bulacan Cebu
Occidental Mindoro
Batangas Prior to the actual interview, the field interviewers conducted courtesy calls to the Provincial Health Officers and Municipal Health Officers in the target areas. The local government units were informed of the survey and were asked to validate the consolidated list. Medium- to large-scale salt producers and importers (>300 MT) were visited and interviewed. In addition, subsistence and small-scale salt producers that are
______________________ A survey of salt producers, importers and traders in the Philippines: an evaluation of internal 5 of 62 and external quality assurance and control Nutrition Center of the Philippines, December 2010
geographically close to each other were included in the survey. The key informants of the survey were the owner or the caretaker of salt producers/importers/traders operating in the selected provinces. Prior to the interview, each key informant was asked to sign a confidentiality letter [Annex 4]. The coordinates of each salt producer and importer were also obtained using a GPS unit (GPSMAP 76Cx or GPSMAP 60CSx) Data processing and analysis Data was entered using FileMaker Pro 10.0 v3 software (FileMaker, Inc., California, USA). Data processing and quantitative analysis was done using Stata v9.2 (StataCorp, Texas, USA). Dominant themes were determined using qualitative analysis of respondent’s answers on open-ended questions. Maps were generated using Garmin BaseCamp (Garmin Ltd., Kansas City, USA).
______________________ A survey of salt producers, importers and traders in the Philippines: an evaluation of internal 6 of 62 and external quality assurance and control Nutrition Center of the Philippines, December 2010
RESULTS The consolidation of existing lists of salt producers, traders and importers from the FDA, local government units and previous NCP surveys resulted in a total of 510 producers, and 114 traders/importers identified as target respondents. However, during the field survey it was determined that the listings and the classifications of salt manufacturers to producers, traders/importers or retailers were not accurate. For instance, several respondents listed as salt producers from Negros Oriental have already stopped salt production and have instead shifted to repacking and retailing salt. Several salt manufacturers in Pangasinan listed as producers/refiners from the official government list were salt repackers and retailers. The list of salt manufacturers from FDA also was not updated, i.e. establishments included in the lists have already been non-operational for several years. I. Salt Producers Respondent’s profile A salt producer in this survey is defined as those producing raw or non-iodized salt. Detailed results of the survey among salt producers are in Annex 5. A total of 375 salt producers were interviewed during the field visits [Table 2] with the provinces of Pangasinan and Occidental Mindoro having the most number of salt producers interviewed. Based on the consolidated lists from various agencies, 17% were already closed while about 15% cannot be located. The names of salt producers listed on the consolidated lists who were not found were unknown in the area. Thus, nearly 1/3 of those in the existing lists were probably no longer operating. Majority of the producers that could not be located were in Pangasinan, Bulacan and Iloilo. Majority of producers that closed were in Occidental Mindoro, Zamboanga, Bulacan and Pangasinan. Nine respondents refused to join the survey citing the following reasons: 1) no permission from the owner of the salt farm to answer the questions; or 2) busy doing work. Thus, 97.6% among the 384 salt producers that we approached participated in the survey.

______________________ A survey of salt producers, importers and traders in the Philippines: an evaluation of internal 7 of 62 and external quality assurance and control Nutrition Center of the Philippines, December 2010
Table 2. Frequency and percent distribution of salt producers by interview status per province
Interviewed Refused Closed Cannot be located Province
n % n % n % n % Total
Luzon Ilocos Sur 23 100.0 0 0 0 0 0 0 23 Ilocos Norte 22 78.6 0 0 6 21.4 0 0 28 La Union 3 60.0 0 0 0 0 2 40.0 5 Pangasinan 101 65.6 3 1.9 10 6.5 40 26.0 154 Bulacan 21 47.7 2 4.5 11 25.0 10 22.7 44 Occidental Mindoro 93 69.4 3 2.2 36 26.9 2 1.5 134 Visayas Iloilo 30 52.6 0 0 2 3.5 25 43.9 57 Guimaras 44 93.6 0 0 0 0 3 6.4 47 Negros Occidental 17 94.4 1 5.6 0 0 0 0 18 Negros Oriental 6 60.0 0 0 4 40.0 0 0 10 Cebu 5 31.2 0 0 9 56.3 2 12.5 16 Mindanao Misamis Oriental 6 75.0 0 0 2 25.0 0 0 8 General Santos City 1 100.0 0 0 0 0 0 0 1 Zamboanga 3 15.0 0 0 14 70.0 3 15.0 20
Total 375 66.4 9 1.6 94 16.6 87 15.4 565
______________________ A survey of salt producers, importers and traders in the Philippines: an evaluation of internal 8 of 62 and external quality assurance and control Nutrition Center of the Philippines, December 2010
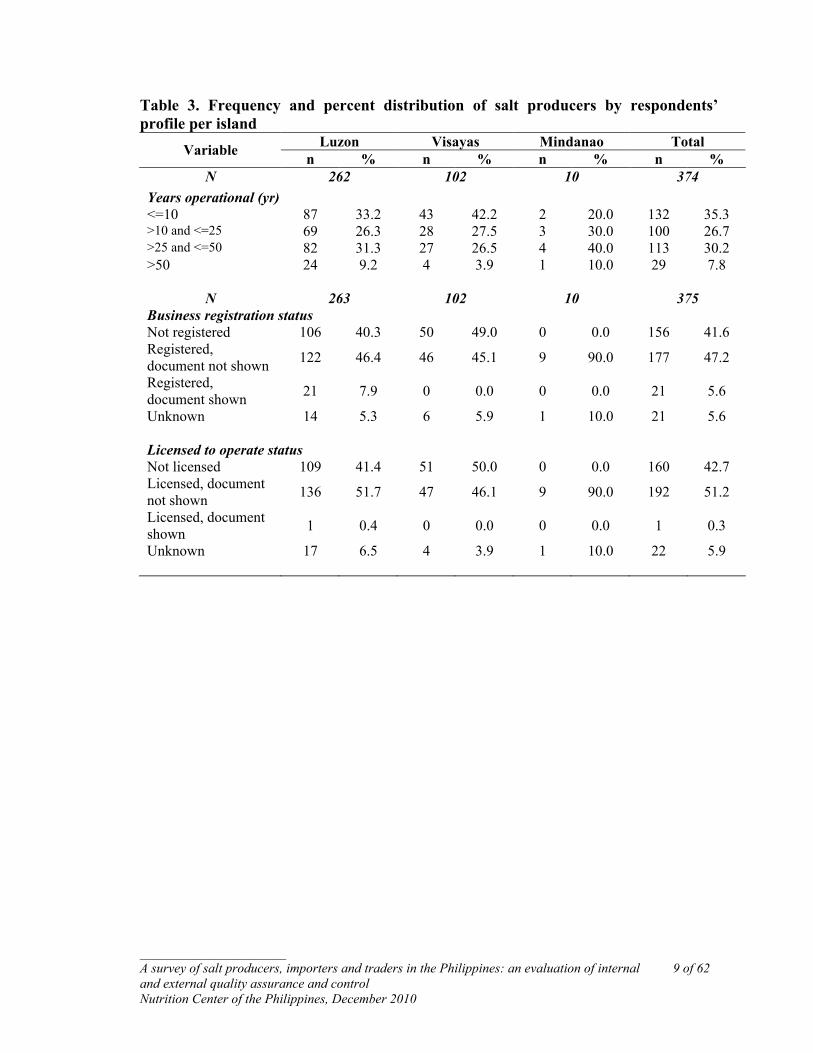
More than one-third of the salt producers interviewed have been operational for 10 years or less [Table 3]. There are a few producers (8%) who have been producing salt for more than 50 years. Availability of business permits and licensed to operate Six percent (6%) of respondents were able to show documentation of business registration [Table 3]. The documents shown were either the Mayor’s permit issued by the municipality and/or a business permit issued by the DTI or/and the Bureau of Internal Revenue (BIR). Almost half of the respondents (47%) claimed they registered their business as salt producers, but were unable to show the registration documents. The reasons cited for failure to show documentation were that the papers are at home or with the owner or another person or the papers were still being processed. A significant proportion (42%) admitted not registering their business with any government agency. Some reasons given for not registering their business are the following: seasonal operation, small-scale operation or expensive to register. A similar trend was seen when respondents were asked if they have a license to operate issued by the FDA, 51% claimed they had a license but failed to show this [Table 3]. A significant proportion (43%) also did not have a license to operate.
______________________ A survey of salt producers, importers and traders in the Philippines: an evaluation of internal 9 of 62 and external quality assurance and control Nutrition Center of the Philippines, December 2010
Table 3. Frequency and percent distribution of salt producers by respondents’ profile per island
Luzon Visayas Mindanao Total Variable n % n % n % n % N 262 102 10 374
Years operational (yr) <=10 87 33.2 43 42.2 2 20.0 132 35.3 >10 and <=25 69 26.3 28 27.5 3 30.0 100 26.7 >25 and <=50 82 31.3 27 26.5 4 40.0 113 30.2 >50 24 9.2 4 3.9 1 10.0 29 7.8
N 263 102 10 375
Business registration status Not registered 106 40.3 50 49.0 0 0.0 156 41.6 Registered, document not shown 122 46.4 46 45.1 9 90.0 177 47.2
Registered, document shown 21 7.9 0 0.0 0 0.0 21 5.6
Unknown 14 5.3 6 5.9 1 10.0 21 5.6 Licensed to operate status Not licensed 109 41.4 51 50.0 0 0.0 160 42.7 Licensed, document not shown 136 51.7 47 46.1 9 90.0 192 51.2
Licensed, document shown 1 0.4 0 0.0 0 0.0 1 0.3
Unknown 17 6.5 4 3.9 1 10.0 22 5.9
______________________ A survey of salt producers, importers and traders in the Philippines: an evaluation of internal 10 of 62 and external quality assurance and control Nutrition Center of the Philippines, December 2010
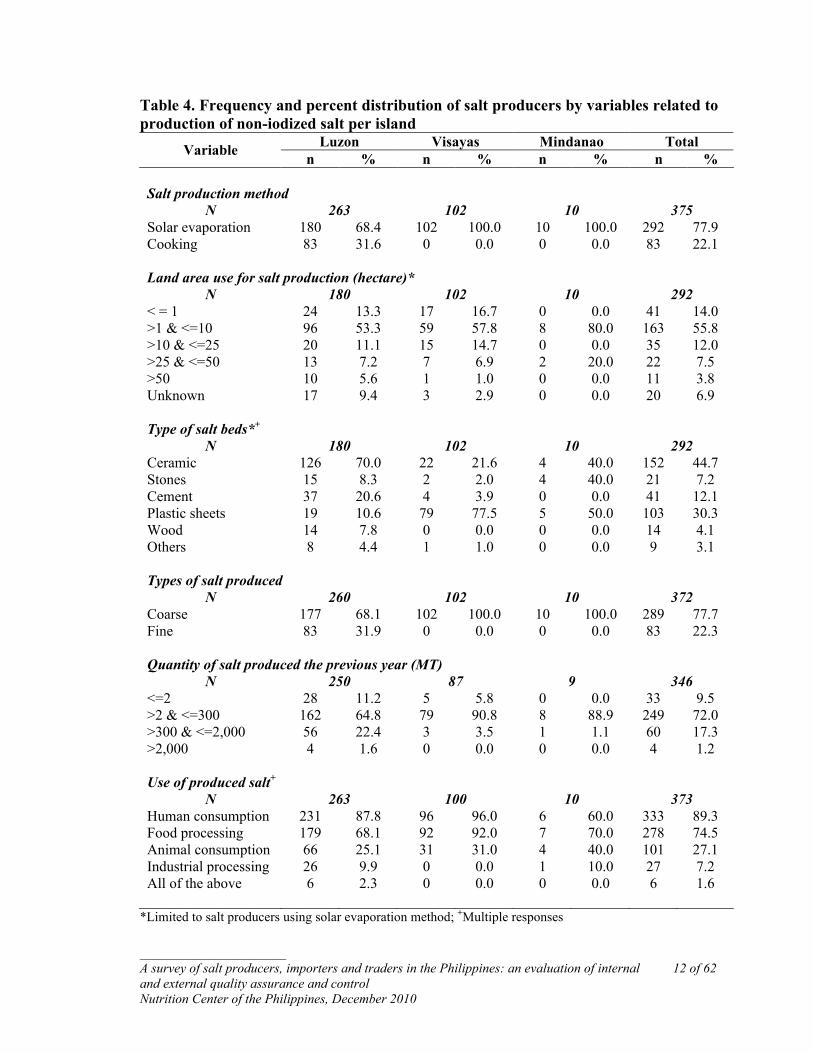
Salt production process Salt production methods There are two methods of producing salt: solar evaporation and cooking [Table 4]. In the solar evaporation method, water is removed by exposing the concentrated brine under the sun while in the cooking method water is removed by exposing open pans containing the concentrated brine to heat. Both methods produce salt with the solar evaporation method producing coarse salt while the cooking method produces finer granules of salt. Detailed description of the salt production methods is in Annex 6. Most salt producers use solar evaporation to produce salt. Salt producers from Ilocos Sur, Ilocos Norte, La Union and one-third of producers from Pangasinan use the cooking method in salt production. Land area for salt production The land area used for salt production was categorized according to reported area in hectares, namely, less than or equal to 1, greater than 1 to less than or equal to 10, greater than 10 to less than 25, greater than 25 to less than or equal to 50 and to greater than 50 hectares [Table 4]. More than half (56%) of the respondents have greater than 1 to less than or equal to 10 hectares of land area allotted for salt production. Almost all of the large–scale salt producers, located in Luzon provinces, have more than 50 hectares of land area used for salt production. Type of salt beds Salt producers from Luzon provinces used ceramics, which may either, be broken red ceramic tiles or jars like “burnay”, as salt beds [Table 4]. On the other hand, majority of the salt producers from Visayas and Mindanao use plastic sheets. About 20% of the salt producers from Occidental Mindoro are also using plastic sheets while about 40% are using cement, sometimes mixed with “apog”, as salt beds. Type of salt produced As expected, salt produced by all salt producers from Ilocos Sur, Ilocos Norte, La Union and 1/3 of salt producers from Pangasinan is fine salt because salt is produced using the cooking method. The salt producers from Bulacan, Visayas and Mindanao provinces produce only coarse salt. Quantity of salt produced The information was obtained in response to the question “how much is your total salt production last year?”. It was usual for the respondents to give the estimated number of sacks produced last year. A follow-up question, “what is the weight of the salt per sack?” will then be asked. Based on this information, the total amount of produced raw salt will
______________________ A survey of salt producers, importers and traders in the Philippines: an evaluation of internal 11 of 62 and external quality assurance and control Nutrition Center of the Philippines, December 2010
be derived by multiplying the number of sacks by the weight per sack. The resulting amount was converted to metric tons (MT) to standardize the unit of measurement for the purpose of this report. Only 346 of 375 (92%) of respondents have information on the quantity of salt produced in the previous year (2009). Three respondents did not produce salt last year while 26 respondents either refused to answer the question or did not know the answer. Among the 346 respondents who answered the question, 9.5% produced salt not exceeding 2 MT (subsistence producers), 72% produced salt ranging from more than 2 MT to 300 MT (small-scale producers), 17.3% produced salt ranging from more than 300 MT to 2,000 MT (medium-scale producers) and 1.2% produced salt exceeding 2,000 MT (large-scale producers) [Table 4]. Use of salt produced Salt is produced for human consumption, food processing, industrial use and animal consumption. Salt for human consumption are known to salt producers as commercial salt since this is the one that is available in the market and usually bought by consumers in retail packs either through “takal” or as repacked. In the “takal” retail system, salt is displayed in open heap where salt is only repacked in plastic bag upon purchase of customers. Salt used for food processing, as used in this survey, is salt used for processing of food such as fish sauce (“patis”), fish or shrimp paste (“bagoong”), canned or cured meats, ice or ice cream. Salt used for tanning or curing leather was classified as industrial salt. Salt used for animal consumption are those salt mixed with animal feeds. Salt licks are also produced (i.e. “tedted” from Ilocos region). Salt licks are salt deposits or hardened formed salt given to animals such as cattle and horses for them to lick as a source of minerals. About 91% of the respondents produced salt for human/commercial (salt sold at the market), 75% produced salt for food processing and 27% produced salt for animal consumption [Table 4]. Only 7% of the respondents reportedly produce salt for industrial use. In the IRR of ASIN Law, only industrial salt, salt meant for treatment, processing and/or manufacturing of non-food products, are exempted from salt iodization.
______________________ A survey of salt producers, importers and traders in the Philippines: an evaluation of internal 12 of 62 and external quality assurance and control Nutrition Center of the Philippines, December 2010
Table 4. Frequency and percent distribution of salt producers by variables related to production of non-iodized salt per island
Luzon Visayas Mindanao Total Variable n % n % n % n % Salt production method
N 263 102 10 375 Solar evaporation 180 68.4 102 100.0 10 100.0 292 77.9 Cooking 83 31.6 0 0.0 0 0.0 83 22.1 Land area use for salt production (hectare)*
N 180 102 10 292 < = 1 24 13.3 17 16.7 0 0.0 41 14.0 >1 & <=10 96 53.3 59 57.8 8 80.0 163 55.8 >10 & <=25 20 11.1 15 14.7 0 0.0 35 12.0 >25 & <=50 13 7.2 7 6.9 2 20.0 22 7.5 >50 10 5.6 1 1.0 0 0.0 11 3.8 Unknown 17 9.4 3 2.9 0 0.0 20 6.9 Type of salt beds*+
N 180 102 10 292 Ceramic 126 70.0 22 21.6 4 40.0 152 44.7 Stones 15 8.3 2 2.0 4 40.0 21 7.2 Cement 37 20.6 4 3.9 0 0.0 41 12.1 Plastic sheets 19 10.6 79 77.5 5 50.0 103 30.3 Wood 14 7.8 0 0.0 0 0.0 14 4.1 Others 8 4.4 1 1.0 0 0.0 9 3.1 Types of salt produced
N 260 102 10 372 Coarse 177 68.1 102 100.0 10 100.0 289 77.7 Fine 83 31.9 0 0.0 0 0.0 83 22.3 Quantity of salt produced the previous year (MT)
N 250 87 9 346 <=2 28 11.2 5 5.8 0 0.0 33 9.5 >2 & <=300 162 64.8 79 90.8 8 88.9 249 72.0 >300 & <=2,000 56 22.4 3 3.5 1 1.1 60 17.3 >2,000 4 1.6 0 0.0 0 0.0 4 1.2 Use of produced salt+
N 263 100 10 373 Human consumption 231 87.8 96 96.0 6 60.0 333 89.3 Food processing 179 68.1 92 92.0 7 70.0 278 74.5 Animal consumption 66 25.1 31 31.0 4 40.0 101 27.1 Industrial processing 26 9.9 0 0.0 1 10.0 27 7.2 All of the above 6 2.3 0 0.0 0 0.0 6 1.6
*Limited to salt producers using solar evaporation method; +Multiple responses
______________________ A survey of salt producers, importers and traders in the Philippines: an evaluation of internal 13 of 62 and external quality assurance and control Nutrition Center of the Philippines, December 2010
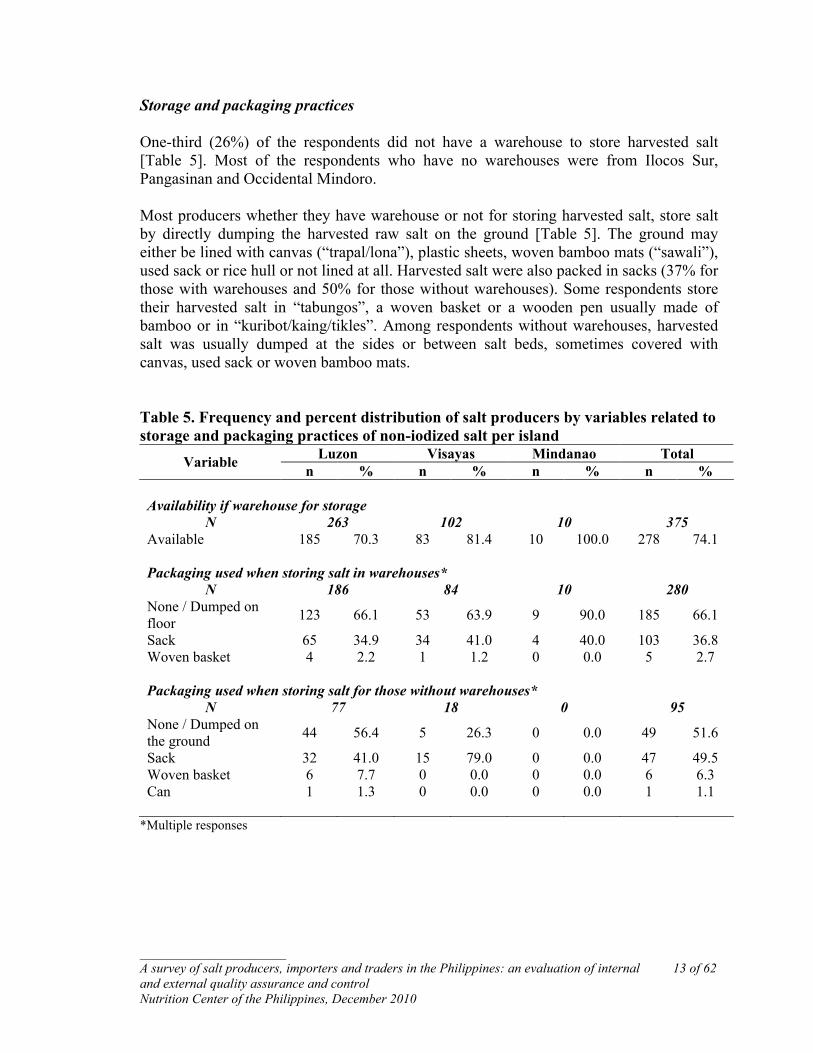
Storage and packaging practices One-third (26%) of the respondents did not have a warehouse to store harvested salt [Table 5]. Most of the respondents who have no warehouses were from Ilocos Sur, Pangasinan and Occidental Mindoro. Most producers whether they have warehouse or not for storing harvested salt, store salt by directly dumping the harvested raw salt on the ground [Table 5]. The ground may either be lined with canvas (“trapal/lona”), plastic sheets, woven bamboo mats (“sawali”), used sack or rice hull or not lined at all. Harvested salt were also packed in sacks (37% for those with warehouses and 50% for those without warehouses). Some respondents store their harvested salt in “tabungos”, a woven basket or a wooden pen usually made of bamboo or in “kuribot/kaing/tikles”. Among respondents without warehouses, harvested salt was usually dumped at the sides or between salt beds, sometimes covered with canvas, used sack or woven bamboo mats. Table 5. Frequency and percent distribution of salt producers by variables related to storage and packaging practices of non-iodized salt per island
Luzon Visayas Mindanao Total Variable n % n % n % n % Availability if warehouse for storage
N 263 102 10 375 Available 185 70.3 83 81.4 10 100.0 278 74.1 Packaging used when storing salt in warehouses*
N 186 84 10 280 None / Dumped on floor 123 66.1 53 63.9 9 90.0 185 66.1
Sack 65 34.9 34 41.0 4 40.0 103 36.8 Woven basket 4 2.2 1 1.2 0 0.0 5 2.7 Packaging used when storing salt for those without warehouses*
N 77 18 0 95 None / Dumped on the ground 44 56.4 5 26.3 0 0.0 49 51.6
Sack 32 41.0 15 79.0 0 0.0 47 49.5 Woven basket 6 7.7 0 0.0 0 0.0 6 6.3 Can 1 1.3 0 0.0 0 0.0 1 1.1
*Multiple responses
______________________ A survey of salt producers, importers and traders in the Philippines: an evaluation of internal 14 of 62 and external quality assurance and control Nutrition Center of the Philippines, December 2010
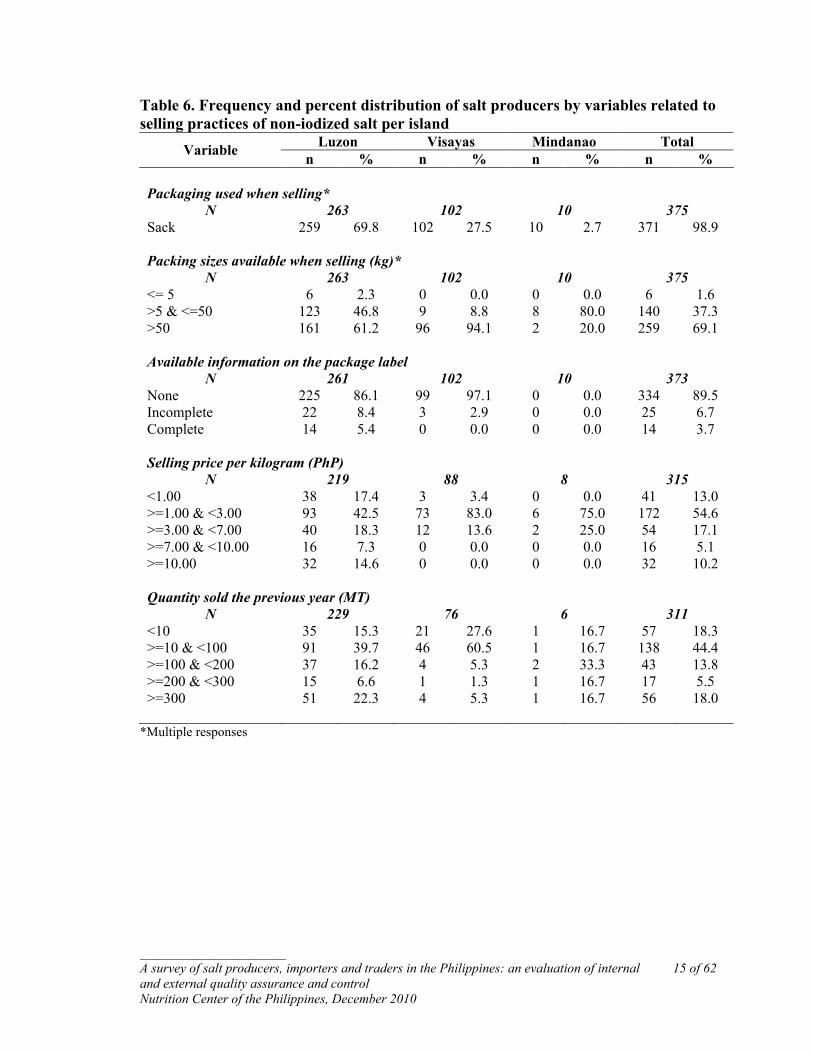
Selling practices Packaging material used when selling salt Almost all (99%) respondents sold salt in sacks [Table 6]. These sacks were usually second-hand, previously used to pack rice, sugar, flour or fertilizer. The salt is usually sold in bulk (69%), weighing more than 50 kgs per sack [Table 6]. Most packaging used when selling salt had no labeling or information on the company name, manufacturers’ name and date of production [Table 6]. Price of salt per kilogram The type of salt produced influenced the wide ranged of prices of salt [Table 6]. Refined salt was more expensive than coarse salt, selling as much as PhP 15.00 per kg. The usual selling price of commercial salt was between PhP 1.00 to 3.00 per kg (55%). However, almost half (48%) of respondents from Occidental Mindoro sell salt to as low as PhP 0.40 per kg. Subsistence respondents from Ilocos region trade their salt for rice, usually trading 6 sacks of salt to 1 sack of rice. Quantity of salt sold the previous year Only 83% answered the question on the quantity of salt sold in the previous year. Three of the respondents did not produce salt in the previous year while 61 either did not know the answer or refused to answer the question. Among those who responded, 44.4% reported selling between 10 to less than 100 MT of salt the previous year [Table 6]. Respondents from Bulacan, Pangasinan, Occidental Mindoro, Iloilo, Guimaras and General Santos City reported selling more than 300 MT of salt.
______________________ A survey of salt producers, importers and traders in the Philippines: an evaluation of internal 15 of 62 and external quality assurance and control Nutrition Center of the Philippines, December 2010
Table 6. Frequency and percent distribution of salt producers by variables related to selling practices of non-iodized salt per island
Luzon Visayas Mindanao Total Variable n % n % n % n % Packaging used when selling*
N 263 102 10 375 Sack 259 69.8 102 27.5 10 2.7 371 98.9 Packing sizes available when selling (kg)*
N 263 102 10 375 <= 5 6 2.3 0 0.0 0 0.0 6 1.6 >5 & <=50 123 46.8 9 8.8 8 80.0 140 37.3 >50 161 61.2 96 94.1 2 20.0 259 69.1 Available information on the package label
N 261 102 10 373 None 225 86.1 99 97.1 0 0.0 334 89.5 Incomplete 22 8.4 3 2.9 0 0.0 25 6.7 Complete 14 5.4 0 0.0 0 0.0 14 3.7 Selling price per kilogram (PhP)
N 219 88 8 315 <1.00 38 17.4 3 3.4 0 0.0 41 13.0 >=1.00 & <3.00 93 42.5 73 83.0 6 75.0 172 54.6 >=3.00 & <7.00 40 18.3 12 13.6 2 25.0 54 17.1 >=7.00 & <10.00 16 7.3 0 0.0 0 0.0 16 5.1 >=10.00 32 14.6 0 0.0 0 0.0 32 10.2 Quantity sold the previous year (MT)
N 229 76 6 311 <10 35 15.3 21 27.6 1 16.7 57 18.3 >=10 & <100 91 39.7 46 60.5 1 16.7 138 44.4 >=100 & <200 37 16.2 4 5.3 2 33.3 43 13.8 >=200 & <300 15 6.6 1 1.3 1 16.7 17 5.5 >=300 51 22.3 4 5.3 1 16.7 56 18.0
*Multiple responses
______________________ A survey of salt producers, importers and traders in the Philippines: an evaluation of internal 16 of 62 and external quality assurance and control Nutrition Center of the Philippines, December 2010
Distribution of salt Difficulties were encountered when the question “where is the usual destination of raw salt sold?” was asked among the respondents because most respondents claim that they are not familiar where their salt are being sold, from where their buyers come from or where their buyers brought their salt. Nevertheless, almost half of the respondents (44.1%) reported that their salt is sold within their provinces. Some respondents from Luzon (18.9%) assumed their salt reaches Metro Manila since the traders buying their salt have warehouses in Malabon. Salt from Ilocos, Pangasinan and Bulacan is brought to other Luzon provinces such as Kalinga Apayao, Cagayan Valley, Abra, Isabela, Bicol, Nueva Ecija, Baguio, Bataan, Nueva Vizcaya, Zambales, Quezon and Laguna. Salt from Occidental Mindoro reportedly reaches other provinces in Luzon such as Palawan, Marinduque and Batangas; the provinces in the Visayas such as Iloilo, Aklan, Samar, Leyte and Cebu, and; the provinces in Mindanao, such as Zamboanga and Davao. On the other hand, most respondents from the Visayas reported that their salt reaches nearby provinces such as Aklan, Masbate and Palawan. All respondents from Mindanao reported that their salt is only sold within their provinces.
______________________ A survey of salt producers, importers and traders in the Philippines: an evaluation of internal 17 of 62 and external quality assurance and control Nutrition Center of the Philippines, December 2010
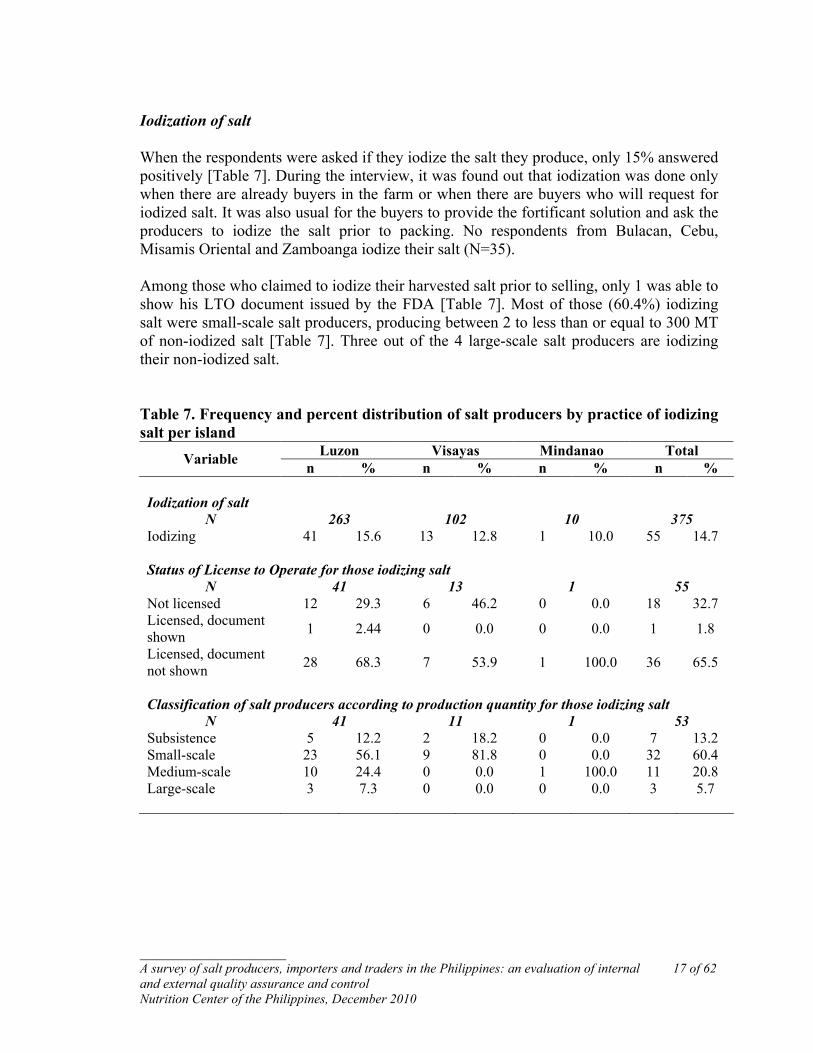
Iodization of salt When the respondents were asked if they iodize the salt they produce, only 15% answered positively [Table 7]. During the interview, it was found out that iodization was done only when there are already buyers in the farm or when there are buyers who will request for iodized salt. It was also usual for the buyers to provide the fortificant solution and ask the producers to iodize the salt prior to packing. No respondents from Bulacan, Cebu, Misamis Oriental and Zamboanga iodize their salt (N=35). Among those who claimed to iodize their harvested salt prior to selling, only 1 was able to show his LTO document issued by the FDA [Table 7]. Most of those (60.4%) iodizing salt were small-scale salt producers, producing between 2 to less than or equal to 300 MT of non-iodized salt [Table 7]. Three out of the 4 large-scale salt producers are iodizing their non-iodized salt. Table 7. Frequency and percent distribution of salt producers by practice of iodizing salt per island
Luzon Visayas Mindanao Total Variable n % n % n % n % Iodization of salt
N 263 102 10 375 Iodizing 41 15.6 13 12.8 1 10.0 55 14.7 Status of License to Operate for those iodizing salt
N 41 13 1 55 Not licensed 12 29.3 6 46.2 0 0.0 18 32.7 Licensed, document shown 1 2.44 0 0.0 0 0.0 1 1.8
Licensed, document not shown 28 68.3 7 53.9 1 100.0 36 65.5
Classification of salt producers according to production quantity for those iodizing salt
N 41 11 1 53 Subsistence 5 12.2 2 18.2 0 0.0 7 13.2 Small-scale 23 56.1 9 81.8 0 0.0 32 60.4 Medium-scale 10 24.4 0 0.0 1 100.0 11 20.8 Large-scale 3 7.3 0 0.0 0 0.0 3 5.7

___________ A survey of salt producers, importers and traders in the Philippines: an evaluation of internal 18 of 62 and external quality assurance and control Nutrition Center of the Philippines, October 2010
II. Salt Importers/Traders Respondents’ profile Salt importers/traders in this survey are those buying and selling raw or non-iodized salt, iodized salt or both. Detailed results of the survey among salt importers/traders are in Annex 7. One hundred fourteen (114) importers/traders were targeted for the survey based on the consolidated list. Of the 114, 15 (13%) were already closed while 24 (21%) cannot be located. Thus, only 65 respondent importers and traders were requested to participate. Only 39 of 65 (60%) participated while the rest (40%) refused to participate. [Table 8]. Those who refused to participate cited the following reason: 1) they are not the owner of the business; 2) busy at work; 3) they do not accept interviews, or 4) the owner is not available for an interview. Getting the consent of traders to participate in the survey took time, as they would usually require formal request letter, endorsement letters from relevant agency and/or permissions from the company head. Majority of refusals came from Metro Manila companies. Table 8. Frequency and percent distribution of salt importers/traders by interview status per area
Almost half (46%) of the respondents have been operational for not more than 10 years [Table 9]. Some respondents (21.6%) have been trading salt between 25 to 50 years.
Interviewed Refused Closed Cannot be located Province
N % n % n % n % Total
Luzon 15 30.0 14 28.0 10 20.0 11 22.0 50 La Union 1 100.0 0 0.0 0 0.0 0 0.0 1 Pangasinan 5 35.7 0 0.0 1 7.2 8 57.1 14 Batangas 2 66.7 1 33.3 0 0.0 0 0.0 3 Occidental Mindoro 4 66.7 2 33.3 0 0.0 0 0.0 6 Metro Manila 3 11.5 11 42.3 9 34.6 3 11.5 26 Visayas 15 44.1 6 17.6 2 5.9 11 32.4 34 Iloilo 2 20.0 2 20.0 0 0.0 6 60.0 10 Guimaras 3 50.0 0 0.0 0 0.0 3 50.0 6 Negros Occidental 6 66.7 1 11.1 1 11.1 1 11.1 9 Cebu 4 44.4 3 33.3 1 11.1 1 11.1 9 Mindanao 9 45.0 6 30.0 3 15.0 2 10.0 20 Misamis Oriental 2 66.7 1 33.3 0 0.0 0 0.0 3 Davao 3 60.0 1 20.0 1 20.0 0 0.0 5 General Santos City 1 33.3 2 66.7 0 0.0 0 0.0 3 Zamboanga 3 33.3 2 22.2 2 22.2 2 22.2 9
TOTAL 39 34.2 26 22.8 15 13.2 24 21.1 114

___________ A survey of salt producers, importers and traders in the Philippines: an evaluation of internal 19 of 62 and external quality assurance and control Nutrition Center of the Philippines, October 2010
Availability of business permits and licensed to operate Almost all of the respondents (89%) reported that they had a business registration [Table 9]. However, only 33% were able to show the documents for registration. The documents were either Mayor’s permit or a business registration from the DTI. The documents were not shown either because: 1) the registration documents are with another office or with the owner of the company; or 2) are still being renewed. When respondents were asked if they have a license to operate from the FDA, 72% answered yes but only 13% of the respondents were able to show the document [Table 9]. Table 9. Frequency and percent distribution of salt importers/traders by respondents’ profile per island
Luzon Visayas Mindanao Total Variable n % n % N % n %
Years operational (yr) N 14 15 8 37
<=10 7 50.0 5 33.3 5 62.5 17 46.0 >10 and <=25 3 21.4 7 46.7 2 25.0 12 32.4 >25 and <=50 4 28.6 3 20.0 1 12.5 8 21.6 Registration of business permit
N 15 15 9 39 Not registered 2 13.3 1 6.7 1 11.1 4 10.3 Registered, document not shown 7 46.7 10 66.7 5 55.6 22 56.4
Registered, document shown 6 40.0 4 26.7 3 33.3 13 33.3
Availability of licensed to operate
N 15 15 9 39 Not licensed 5 33.3 3 20.0 3 33.3 11 28.2 Licensed, document not shown 9 60.0 10 66.7 4 44.4 23 59.0
Licensed, document shown 1 6.7 2 13.3 2 22.2 5 12.8
___________ A survey of salt producers, importers and traders in the Philippines: an evaluation of internal 20 of 62 and external quality assurance and control Nutrition Center of the Philippines, October 2010
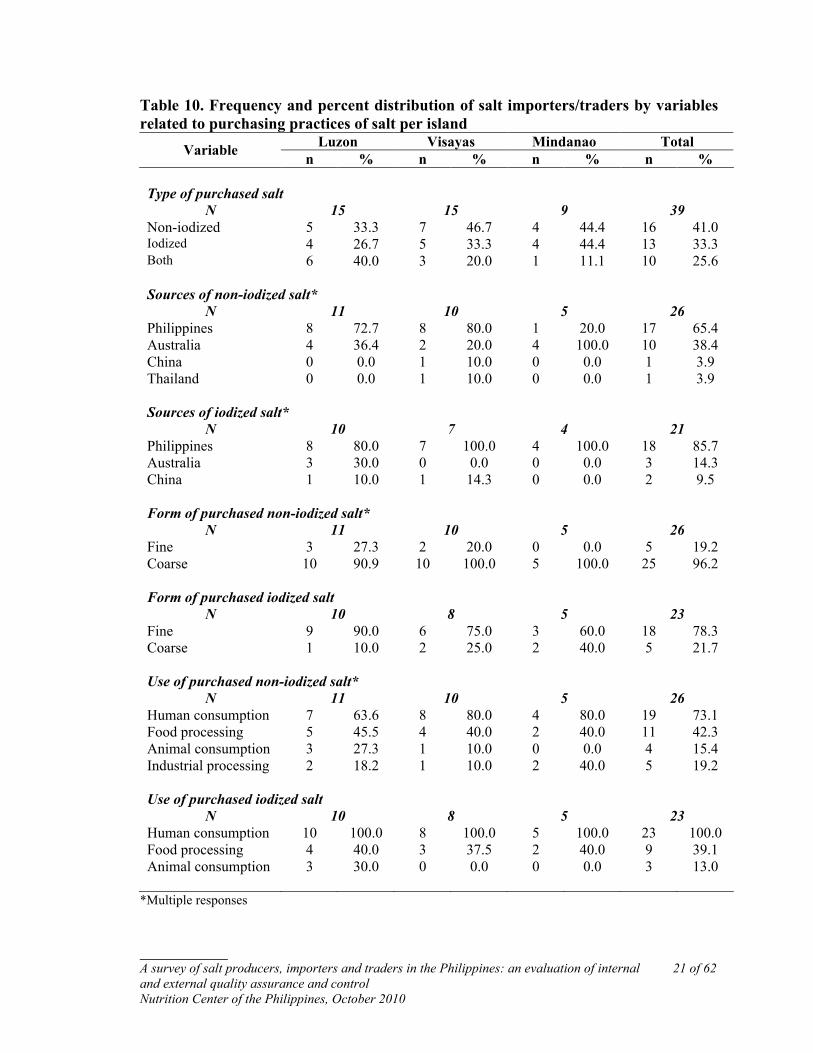
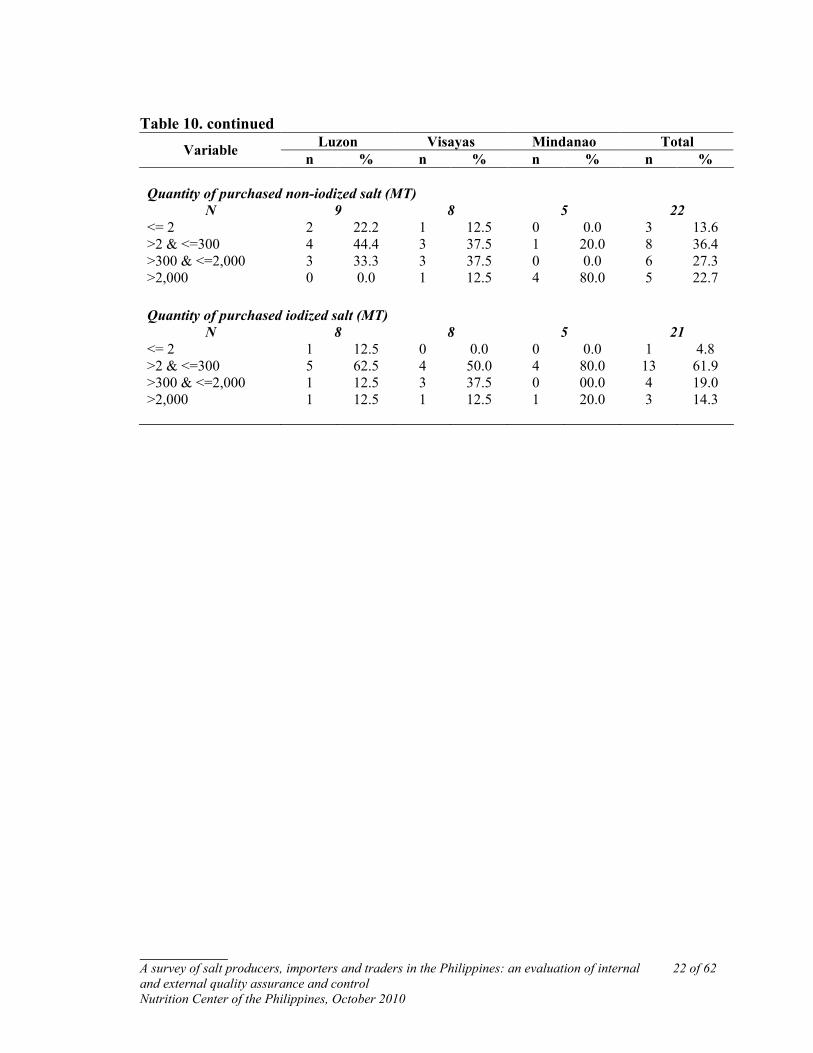
Purchasing practices Type of salt The respondents purchased either non-iodized, iodized or both types of salt [Table 10]. A third of them (33%) purchased iodized salt only while 41% purchased non-iodized salt only. Sources of salt Non-iodized salt were usually purchased from local salt producers (72%). These producers were usually from Bulacan, Occidental Mindoro, Pangasinan and from producers within their provinces. Australia was the usual source of imported non-iodized salt. Other sources of imported non-iodized salt were China and Thailand. Majority of the respondents (86%) purchased iodized salt from local companies. The large or major salt local importers were the usual sources of the other respondents. Iodized salt were also imported from Australia and China. Form of salt Almost all of the respondents (96.2%) purchased non-iodized salt in coarse form [Table 10]. Coarse salt comes in 2 kinds, small granule-size salt and rock salt, the latter was described by the traders as imported bigger sized-granulated non-iodized salt. Rock coarse salt is either refined by the traders and iodized before selling or sold to salt producers from Luzon provinces as the raw ingredient in cooking the fine salt. Half of the respondents (50%) who purchased coarse salt purchased rock salt. On the other hand, iodized salt purchased are usually (78.3%) in the refine/fine form [Table 10]. Use of salt Majority of the purchased non-iodized (55%) and iodized (87%) salt are for human consumption [Table 10]. Other use of salt is for industrial processes, food-manufacturing and animal consumption. Quantity of salt purchased Only 22 out of the 26 traders/importers of non-iodized salt (85%) answered the question “what was your total salt purchases last year?”. Half of the respondents (50%) reported purchasing more than 300 MT of non-iodized salt last year. Out of the 21 importers/traders of iodized salt who gave information on the quantity of iodized salt purchased last year, half (52%) reported purchasing between 2 to less than or equal to 300 MT [Table 10]. Thirty-eight percent (38%) purchased more than 300 MT of iodized salt the previous year.
___________ A survey of salt producers, importers and traders in the Philippines: an evaluation of internal 21 of 62 and external quality assurance and control Nutrition Center of the Philippines, October 2010
Table 10. Frequency and percent distribution of salt importers/traders by variables related to purchasing practices of salt per island
Luzon Visayas Mindanao Total Variable n % n % n % n %
Type of purchased salt N 15 15 9 39
Non-iodized 5 33.3 7 46.7 4 44.4 16 41.0 Iodized 4 26.7 5 33.3 4 44.4 13 33.3 Both 6 40.0 3 20.0 1 11.1 10 25.6 Sources of non-iodized salt*
N 11 10 5 26 Philippines 8 72.7 8 80.0 1 20.0 17 65.4 Australia 4 36.4 2 20.0 4 100.0 10 38.4 China 0 0.0 1 10.0 0 0.0 1 3.9 Thailand 0 0.0 1 10.0 0 0.0 1 3.9 Sources of iodized salt*
N 10 7 4 21 Philippines 8 80.0 7 100.0 4 100.0 18 85.7 Australia 3 30.0 0 0.0 0 0.0 3 14.3 China 1 10.0 1 14.3 0 0.0 2 9.5 Form of purchased non-iodized salt*
N 11 10 5 26 Fine 3 27.3 2 20.0 0 0.0 5 19.2 Coarse 10 90.9 10 100.0 5 100.0 25 96.2 Form of purchased iodized salt
N 10 8 5 23 Fine 9 90.0 6 75.0 3 60.0 18 78.3 Coarse 1 10.0 2 25.0 2 40.0 5 21.7 Use of purchased non-iodized salt*
N 11 10 5 26 Human consumption 7 63.6 8 80.0 4 80.0 19 73.1 Food processing 5 45.5 4 40.0 2 40.0 11 42.3 Animal consumption 3 27.3 1 10.0 0 0.0 4 15.4 Industrial processing 2 18.2 1 10.0 2 40.0 5 19.2 Use of purchased iodized salt
N 10 8 5 23 Human consumption 10 100.0 8 100.0 5 100.0 23 100.0 Food processing 4 40.0 3 37.5 2 40.0 9 39.1 Animal consumption 3 30.0 0 0.0 0 0.0 3 13.0
*Multiple responses
___________ A survey of salt producers, importers and traders in the Philippines: an evaluation of internal 22 of 62 and external quality assurance and control Nutrition Center of the Philippines, October 2010
Table 10. continued
Luzon Visayas Mindanao Total Variable n % n % n % n %
Quantity of purchased non-iodized salt (MT) N 9 8 5 22
<= 2 2 22.2 1 12.5 0 0.0 3 13.6 >2 & <=300 4 44.4 3 37.5 1 20.0 8 36.4 >300 & <=2,000 3 33.3 3 37.5 0 0.0 6 27.3 >2,000 0 0.0 1 12.5 4 80.0 5 22.7 Quantity of purchased iodized salt (MT)
N 8 8 5 21 <= 2 1 12.5 0 0.0 0 0.0 1 4.8 >2 & <=300 5 62.5 4 50.0 4 80.0 13 61.9 >300 & <=2,000 1 12.5 3 37.5 0 00.0 4 19.0 >2,000 1 12.5 1 12.5 1 20.0 3 14.3
___________ A survey of salt producers, importers and traders in the Philippines: an evaluation of internal 23 of 62 and external quality assurance and control Nutrition Center of the Philippines, October 2010
Storage and packaging practices Warehouses used for the storage of salt are available for 76% of the respondents [Table 11]. Most of the respondents (74.4%) store non-iodized salt in sacks. However, some traders/importers do not have warehouses or lack warehouses to keep salt in covered storage. Non-iodized salt is dumped directly on the ground or cemented floor, lined with a canvass, rice hull, sack, wood or woven bamboo mats. Salt dumped outside the warehouse is usually covered with a canvass to protect from rain and other contaminants. All iodized salt are packed in sacks. The sacks used were usually made from woven polypropylene that was either brand new or second-hand. Practice of repacking salt before selling It was usual for the traders/importers to sell the salt in their original packaging or in the packaging container used during storage [Table 11]. Most of the respondents (55%) who repacked iodized salt prior to selling were those who iodize the non-iodized salt they purchased and those who sell iodized salt at smaller packs. Packaging material used for repacking salt prior to selling Of the 8 traders/importers who repacked non-iodized salt prior to selling, 6 of them (75%) repacked the non-iodized salt in sacks [Table 11]. Iodized salt was usually sold in bulk thus, majority of the respondents (73%) repacked iodized salt in sacks [Table 11]. Iodized salt (46%) was also repacked into transparent polyethylene bag. Labeling information on packaging material Majority of the respondents (64%) who reported selling non-iodized salt do not have the information label on the packaging used on packed non-iodized salt [Table 11]. The packaging label of non-iodized salt should include at least the company or manufacturer’s name, company address and manufacturing date.
___________ A survey of salt producers, importers and traders in the Philippines: an evaluation of internal 24 of 62 and external quality assurance and control Nutrition Center of the Philippines, October 2010
Table 11. Frequency and percent distribution of salt importers/traders by variables related to selling practices of salt per island
Luzon Visayas Mindanao Total Variable n % n % n % n %
Availability of storage warehouse N 14 15 9 38
Available 10 66.7 14 93.3 5 55.6 29 74.4 Packaging used when storing non-iodized salt
N 11 10 5 26 Directly on floor 1 9.1 2 20.0 4 80.0 7 26.9 Sack 10 90.9 6 60.0 1 20.0 17 65.4 Both 0 0.0 2 20.0 0 0.0 2 7.7 Practice of repacking non-iodized salt
N 11 9 4 24 Yes 4 36.4 2 22.2 2 50.0 8 33.3 Packaging used when repacking non-iodized salt
N 4 2 2 8 Sack 3 75.0 1 50.0 2 100.0 6 75.0 Plastic bag 1 25,00 1 50.0 0 0 2 25.0 Practice of repacking iodized salt
N 12 9 8 29 Yes 4 33.3 2 22.2 5 62.5 11 37.9 Packaging used when repacking iodized salt
N 4 2 5 11 Sack 2 50.0 1 50.0 3 60.0 6 54.6 Plastic bag 2 50.0 0 0.0 1 20.0 2 27.3 Both 0 0.0 1 50.0 1 20.0 2 9.1 Labeling information of packaging used in non-iodized salt packs
N 10 8 4 22 None 7 70.0 5 62.5 2 50.0 14 63.6 Incomplete 2 20.0 2 25.0 0 0.0 4 18.2 Complete 1 10.0 1 12.5 2 50.0 4 18.2
___________ A survey of salt producers, importers and traders in the Philippines: an evaluation of internal 25 of 62 and external quality assurance and control Nutrition Center of the Philippines, October 2010
Marketing and distribution Quantity of salt sold in MT Only 79% of the respondents who were selling non-iodized salt answered the question on the quantity of non-iodized salt sold the previous year. Among them, 47% reportedly sold more than 500 MT of non-iodized the previous year [Table 12]. All respondents from Mindanao sold more than 500 MT of non-iodized salt. A third of the respondents were able to sell more than 10 but not exceeding 100 MT of their iodized salt the previous year [Table 12]. Selling price of salt Only 8 out of the 24 importers/traders (33%) who reported selling non-iodized salt answered the question “What is the current selling price of commercial raw salt?” [Table 12]. Among those who answered, more than half (75.0%) reported selling non-iodized salt not more than PhP5.00 per 1 kilogram. On the other hand, half of the respondents who gave their selling price of iodized salt last year (48%) sold iodized salt at much higher price, from more than PhP5.00 to as much as PhP20.00 per 1 kilogram [Table 12]. Distribution of salt More than a third of the respondents (38%) sold their non-iodized salt within their area. Importers/Traders would usually sell their salt to buyers from nearby provinces. For instance, respondents from Luzon sold their non-iodized salt to traders from Ilocos provinces, Cagayan Valley, Isabela and Nueva Ecija; respondents from Visayas would sell their salt to buyers from Iloilo, Guimaras, Samar, Leyte and Negros Oriental; respondents from Mindanao would sell their salt to Cotabato, Surigao, Sultan Kudarat and Davao. Similarly, majority of the respondents (69%) sold iodized salt to buyers who are from within their area.
___________ A survey of salt producers, importers and traders in the Philippines: an evaluation of internal 26 of 62 and external quality assurance and control Nutrition Center of the Philippines, October 2010
Table 12. Frequency and percent distribution of salt importers/traders by variables related to marketing and distribution practices of salt per island
Luzon Visayas Mindanao Total Variable n % n % n % n %
Quantity of non-iodized salt sold in the previous year (MT) N 8 7 4 19
<=10 3 37.5 1 14.3 0 0.0 4 21.1 >10 & <=100 1 12.5 2 28.6 0 0.0 3 15.8 >100 & <=500 2 25.5 1 14.3 0 0.0 3 15.8 >500 2 25.0 3 42.9 4 100.0 9 47.4 Quantity of iodized salt sold in the previous year (MT)
N 9 7 8 24 <=10 3 33.3 2 28.6 0 0.0 5 20.8 >10 & <=100 2 28.6 2 28.6 4 50.0 8 33.3 >100 & <=500 2 22.2 2 28.6 1 12.5 5 20.8 >500 2 22.2 1 14.3 3 37.5 6 25.0 Selling price of non-iodized salt (kg) in 2010
N 1 4 3 8 <=5.00 0 0.0 3 75.0 3 0.0 6 75.0 >5.00 1 100.0 1 25.0 0 0.0 2 25.0 Selling price of iodized salt (kg) in 2010
N 9 9 9 27 <=5.00 1 11.1 7 70.0 6 75.0 14 51.9 >5.00 & <=10.00 6 66.7 2 20.0 2 25.0 10 37.0 >10.00 2 22.2 1 10.0 0 0.0 3 11.1
___________ A survey of salt producers, importers and traders in the Philippines: an evaluation of internal 27 of 62 and external quality assurance and control Nutrition Center of the Philippines, October 2010
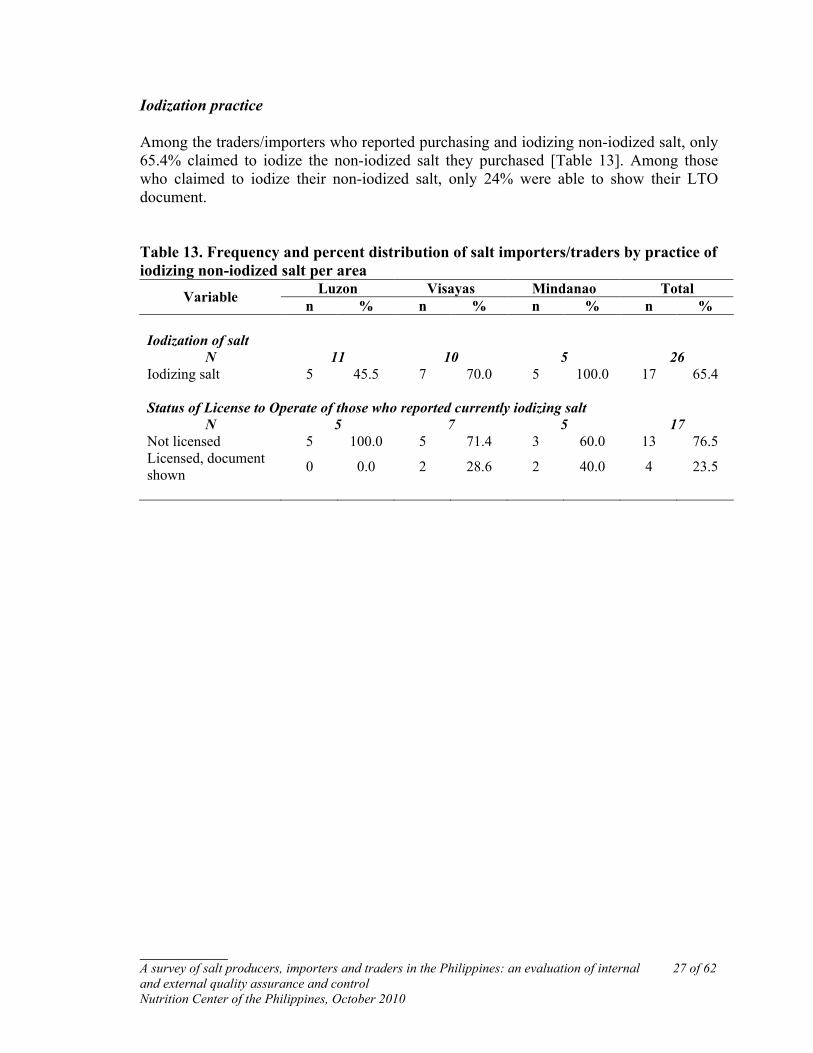
Iodization practice Among the traders/importers who reported purchasing and iodizing non-iodized salt, only 65.4% claimed to iodize the non-iodized salt they purchased [Table 13]. Among those who claimed to iodize their non-iodized salt, only 24% were able to show their LTO document. Table 13. Frequency and percent distribution of salt importers/traders by practice of iodizing non-iodized salt per area
Luzon Visayas Mindanao Total Variable n % n % n % n %
Iodization of salt N 11 10 5 26
Iodizing salt 5 45.5 7 70.0 5 100.0 17 65.4 Status of License to Operate of those who reported currently iodizing salt
N 5 7 5 17 Not licensed 5 100.0 5 71.4 3 60.0 13 76.5 Licensed, document shown 0 0.0 2 28.6 2 40.0 4 23.5
__________ A survey of salt producers, importers and traders in the Philippines: an evaluation of internal 28 of 62 and external quality assurance and control Nutrition Center of the Philippines, December 2010
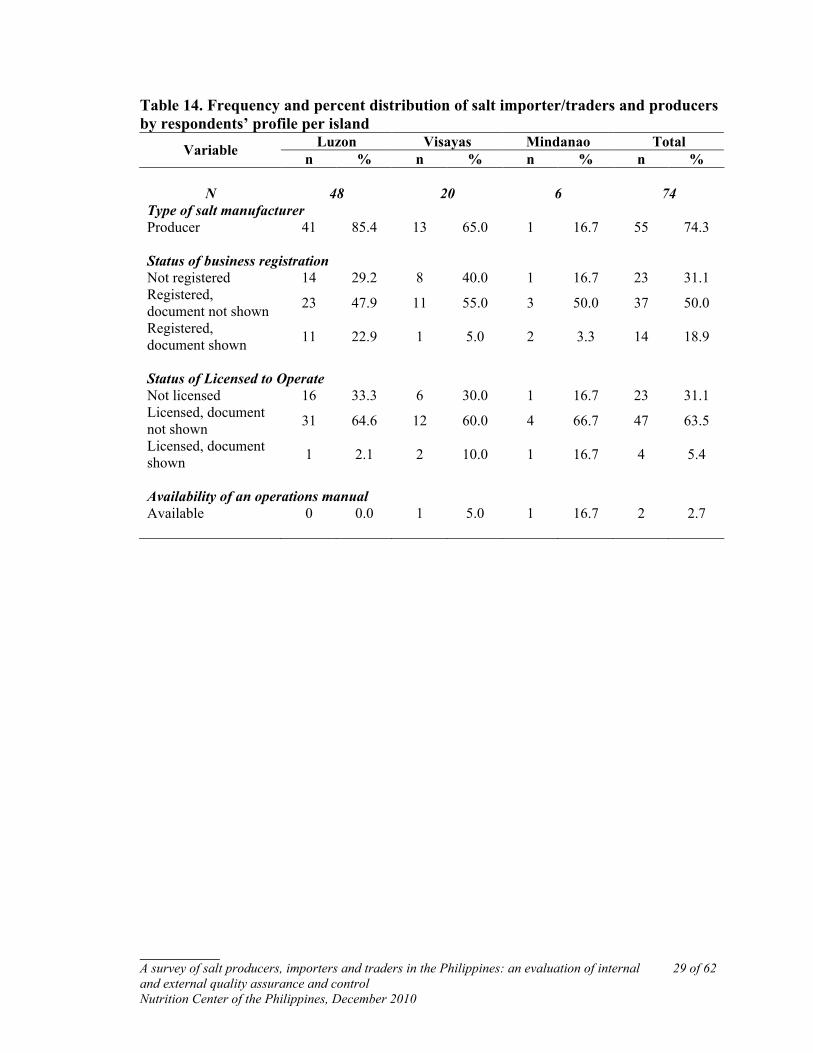
III. Quality Assurance/Quality Control Producers and traders who reported to be presently iodizing raw salt and/or trading iodized salt were interviewed using the Quality Control/Quality Assurance Interview Schedule. This questionnaire was based on the Guidelines on Quality Assurance for Salt Iodization developed by The Sub-committee on Standardization of the Salt Iodization Program and released in 1997. Detailed results of this survey are in Annex 8. Respondent profile Most of those (74%) interviewed using the Quality Control/Quality Assurance system were salt producers [Table 14]. Only 19% of those interviewed were able to show business registration documents for 2010 while only 5% were able to show the license to operate document issued by the FDA for 2010. Documentation requirements Only 15% of the respondents reported that they have an Operations Manual [Table 14]. However, only two respondents (3%) were able to show their operations manual. The two operation manuals shown contained detailed information on the following: job description of personnel, manufacturing process, good manufacturing process, quality control plan, sanitation and safety procedure and flowchart of manufacturing process. Almost all respondents have incomplete or no documents to serve as a manual or guide for manufacturing of iodized salt. Respondents who reported having the documents but were not able to show the actual documents during the time of the survey were re-categorized under no Operations Manual. The reasons given by the respondent’s failure to show the actual documents were either because: documents are at the head office or with someone else or the documents are being revised.
__________ A survey of salt producers, importers and traders in the Philippines: an evaluation of internal 29 of 62 and external quality assurance and control Nutrition Center of the Philippines, December 2010
Table 14. Frequency and percent distribution of salt importer/traders and producers by respondents’ profile per island
Luzon Visayas Mindanao Total Variable n % n % n % n %
N 48 20 6 74 Type of salt manufacturer Producer 41 85.4 13 65.0 1 16.7 55 74.3 Status of business registration Not registered 14 29.2 8 40.0 1 16.7 23 31.1 Registered, document not shown 23 47.9 11 55.0 3 50.0 37 50.0
Registered, document shown 11 22.9 1 5.0 2 3.3 14 18.9
Status of Licensed to Operate Not licensed 16 33.3 6 30.0 1 16.7 23 31.1 Licensed, document not shown 31 64.6 12 60.0 4 66.7 47 63.5
Licensed, document shown 1 2.1 2 10.0 1 16.7 4 5.4
Availability of an operations manual Available 0 0.0 1 5.0 1 16.7 2 2.7
__________ A survey of salt producers, importers and traders in the Philippines: an evaluation of internal 30 of 62 and external quality assurance and control Nutrition Center of the Philippines, December 2010
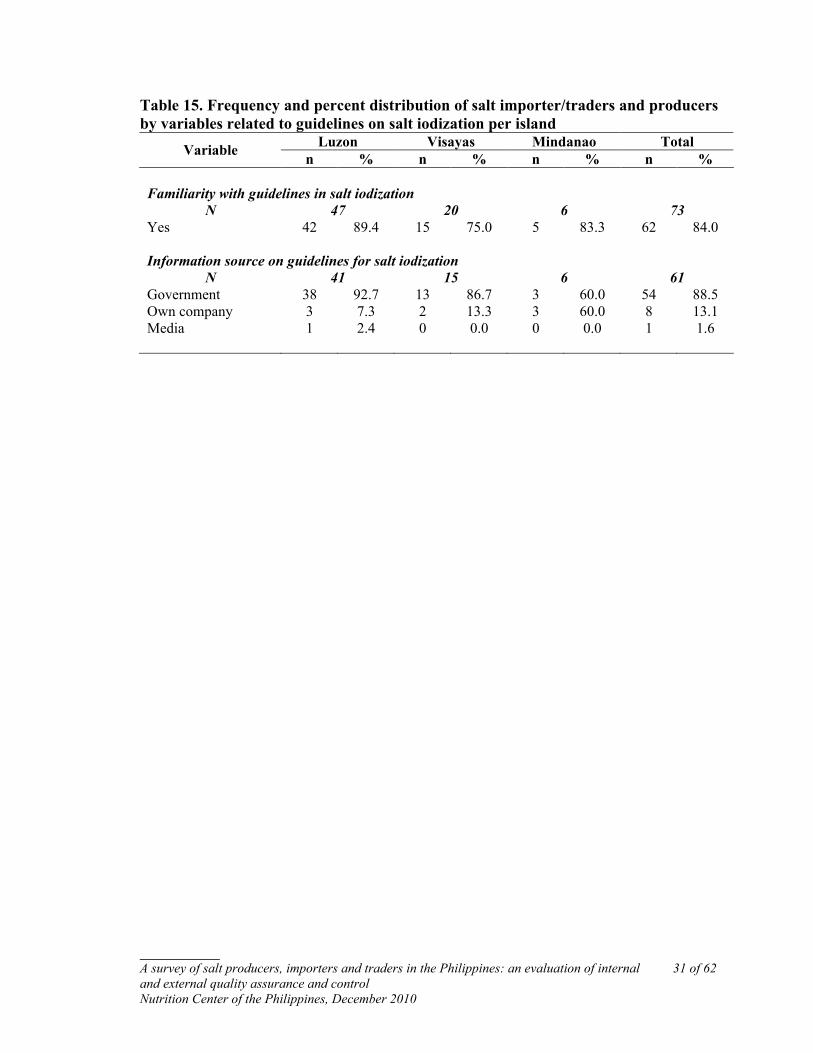
Information on guidelines for salt iodization The respondents were asked about their knowledge of the guidelines regarding salt iodization (Are you familiar with the guidelines on salt iodization?). However, no actual manual or document on salt iodization was shown to the respondents. Eighty-four percent (84%) of respondents who answered this question reported familiarity with the salt iodization guidelines [Table 15]. Majority of the respondents (89%) who reported familiarity with the guidelines cited the government as their source of information. Information was usually from seminars conducted either by the then Bureau of Food and Drug or by the Municipal Sanitary Inspectors [Table 15]. Some (13%) respondents cited their own company as their source of information; there are companies who conducted seminars on salt iodization among their personnel. The information known by the salt importers, traders and producers (SITPs) on iodization can be classified into rules and regulations, technical and beneficial knowledge. Legal knowledge comes from the Act for Salt Iodization Nationwide (ASIN) law, and from seminars given by government officials. Technical knowledge is about the specific process of iodization, as well as the instructions given to them by the owners of the salt farm. Beneficial knowledge details the benefits of iodizing salt. Regarding legal information, the SITPs seem to have some awareness of the requirements of the ASIN Law. This awareness is combined with seminars and training given by local government officials. Basically, their knowledge is more practical, in that salt must be iodized, before it can be sold. Most also say that salt must be iodized because it is the law. As to technical knowledge, this consists of instructions on iodization received from owner on the process itself. Interestingly, most of these consist of measurements and ratios needed in the process of iodization. With beneficial knowledge, some of the respondents offer several benefits of iodized salt, such as disease prevention and improvement of cognitive development. It is interesting to note that most of this information seems to be external to the SITPs: though they are aware of the benefits and regulations regarding salt iodization, they do not seem to connect it to their own business.
__________ A survey of salt producers, importers and traders in the Philippines: an evaluation of internal 31 of 62 and external quality assurance and control Nutrition Center of the Philippines, December 2010
Table 15. Frequency and percent distribution of salt importer/traders and producers by variables related to guidelines on salt iodization per island
Luzon Visayas Mindanao Total Variable n % n % n % n %
Familiarity with guidelines in salt iodization N 47 20 6 73
Yes 42 89.4 15 75.0 5 83.3 62 84.0 Information source on guidelines for salt iodization
N 41 15 6 61 Government 38 92.7 13 86.7 3 60.0 54 88.5 Own company 3 7.3 2 13.3 3 60.0 8 13.1 Media 1 2.4 0 0.0 0 0.0 1 1.6

__________ A survey of salt producers, importers and traders in the Philippines: an evaluation of internal 32 of 62 and external quality assurance and control Nutrition Center of the Philippines, December 2010
Receipt raw materials for salt iodization Receipt of raw materials Questions on how non-iodized salt and iodine fortificant were being received were asked. Generally, in receiving non-iodized salt, visual check is employed [63%]. Through visual check, the SITPs identify, and clean, if the salt has dirt or other materials in it. In some instances, additional inspection in the form of weight and moisture content checks is done, along with an analysis certificate. In other cases, no inspection is done by the SITPs. This is because they reason that they produced the non-iodized salt, so they do not need to inspect it anymore. With regard to potassium iodate supply, there are three sources for the SITPS: large salt producers (e.g., Salinas Foods), government workers (e.g. sanitary inspectors, barangay health workers) and purchasing by tingi or small packets (i.e. iodate packaged in ice candy plastic bags and sold per piece) from different organizations. An example is the areas of Iloilo and Guimaras, where there is an organization of differently-abled workers who sell potassium iodate. Most do not perform any inspection on the iodate they buy, reasoning that the iodate is from someone they trust, such as the owner of the salt farm, a fellow salt producer, or government workers. In cases of inspection, the SITPs employ visual checks, as well as checking of the certificate of analysis and the expiration of the iodate. Storage practices for raw materials used during salt iodization Questions on describing their warehouse (Is there an available warehouse for storage of raw salt and other equipment for iodization?), and system of storage (What system of storage and use of raw materials is being followed?) were also asked. Warehouse Most of the respondents (68%) have warehouses to store the raw materials [Table 16]. Generally, there were three types of storage areas: a warehouse, an office area and the house of the SITP. Typically, a warehouse is constructed of galvanized iron sheets for a roof, cement walls and wood flooring. Ventilation was provided through slats in the walls, such as windows, or in some cases, an electric fan. In a few cases, the warehouse was described as a nipa hut type of structure. There were also some SITPs who used their office spaces for storage purposes. In these cases, there were areas inside the office reserved for the salt products, while the potassium iodate solutions, stored in plastic water bottles, were kept in cabinets.
__________ A survey of salt producers, importers and traders in the Philippines: an evaluation of internal 33 of 62 and external quality assurance and control Nutrition Center of the Philippines, December 2010
Much like office storage, there were also some SITPs who used their homes for storing equipment and salt products. Usually, the iodized salt and other substances were stored in plastic containers, and placed in a specific area of the house, such as a room or a cabinet. In a few instances, there were some SITPs who did not have storage space, reasoning that they do not need it, as the iodized salt they produce are sold directly to customers. System of Storage Generally, most SITP did not employ any system for storage [Table 16]. Instead, they go by the ‘easy to reach/place’ rule: the materials were stored where they easily can, so that they can take them out just as easily. This works out well for the SITPs because a lot of them only fortify salt when they already have a buyer lined up. In a fourth of the cases, the First in, First out (FIFO) system was used. In this system, the SITPs use the materials stored first. The application of this system would be in using up the fortificant bought before buying more fortificant products. Table 16. Frequency and percent distribution of salt importer/traders and producers by variables related to guidelines on salt iodization per island
Luzon Visayas Mindanao Total Variable n % n % n % n %
Availability of warehouse N 47 20 6 73
Yes 31 66.0 14 73.7 4 66.7 49 68.1 System of storage and retrieval for raw materials
N 47 20 6 73 First in- First out 11 23.4 3 15.0 5 83.3 19 26.0 Top/Front first 5 10.6 7 35.0 1 16.7 13 17.8 No system 14 29.8 7 35.0 0 0.0 21 28.8 Not applicable 17 36.2 3 15.0 0 0.0 20 27.4
__________ A survey of salt producers, importers and traders in the Philippines: an evaluation of internal 34 of 62 and external quality assurance and control Nutrition Center of the Philippines, December 2010
Salt iodization This section describes the utilities required in salt iodization and the methods and processes done by the SITPs in iodizing salt. Utilities for salt iodization The SITPs (92%) do not have all utilities required in the production area allotted for salt iodization and packaging. The following utilities that should be adequately provided and were observed if present were as follows: a) potable and sufficient water supply, b) hand-washing facilities conveniently located and with soap provided, c) closed door toilet facilities, d) sewage disposal, e) properly installed plumbing, f) floor drainage, g) garbage disposal, h) adequate lighting, and i) adequate ventilation. Respondents who were observed to have all the utilities mentioned were classified as having complete utilities, if one utility is missing respondent was classified as having incomplete utilities. Three of the SITPs who have complete utilities reported selling more than 500 MT of iodized salt in the previous year. Most of the respondents (84-86%) who have incomplete utilities were lacking in floor drainage, installed plumbing and proper sewage disposal [Figure 1]. It was observed that most of those with no or incomplete utilities were the respondents who iodized their own harvested salt manually and within the premises of their own house, backyard, side of the salt beds or outside of the warehouses. Production equipment for salt iodization Most of the SITPs (63%) used plastic sprayer in spraying the fortificant solution during salt iodization [Table 17]. These sprayers are of two types: a) pressurized garden sprayer where a pump handle is pumped before spraying to introduce pressure into the container, and b) a plastic hand spray bottle. Both sprayers have nozzle spray setting that can be adjusted to control the liquid flow rate. Others (16%) used a compressor type sprayer that is usually attached to a salt iodization machine. A few used knapsack spray pump (13%) made of stainless steel. It is important to note that there were SITPs who used improvised sprayers such as perforated plastic bottle, plastic bottle with perforated bottle cap, water garden sprinkle or nozzle put on top of a bottle. When the respondents who reported using pressurized sprayer whether it be manual or compressor operated, were asked, “how frequent does the iodine sprayer undergo routine maintenance?”, a third (34%) reported maintenance was done every week [Table 17]. Others (23%) reported checking the sprayer before and/or after it was used. It is important to note that 25% of the SITPs do not conduct maintenance check on their sprayer. One-fourth of the SITPs had iodization machines [Table 17]. The type of machine varied. Among those who had a machine (N=18), 9 had a continuous type blender (50%), 6 had a ribbon type blender (33.3%) and 2 used a cement mixer (11.1%) while the rest had improvised machines.
__________ A survey of salt producers, importers and traders in the Philippines: an evaluation of internal 35 of 62 and external quality assurance and control Nutrition Center of the Philippines, December 2010
Among SITPs who uses iodization machines, 40% reported conducting maintenance check-up on their machine everyday, presumably because production is done everyday [Table 17]. Others (27%) reported doing maintenance checks before every production. Overall, most SITPs who have sprayers and salt iodization machines have well-maintained equipment: the tools and machines are kept clean, and functional. It is usual that the person who last used them cleans the tools and materials before and after every use. In some instances, there are warehouse checkers, whose job is to maintain the equipment. However, there are still some cases where tools and equipment are not maintained properly: some do not immediately clean their equipment after use, while some do not repair malfunctioning equipment.
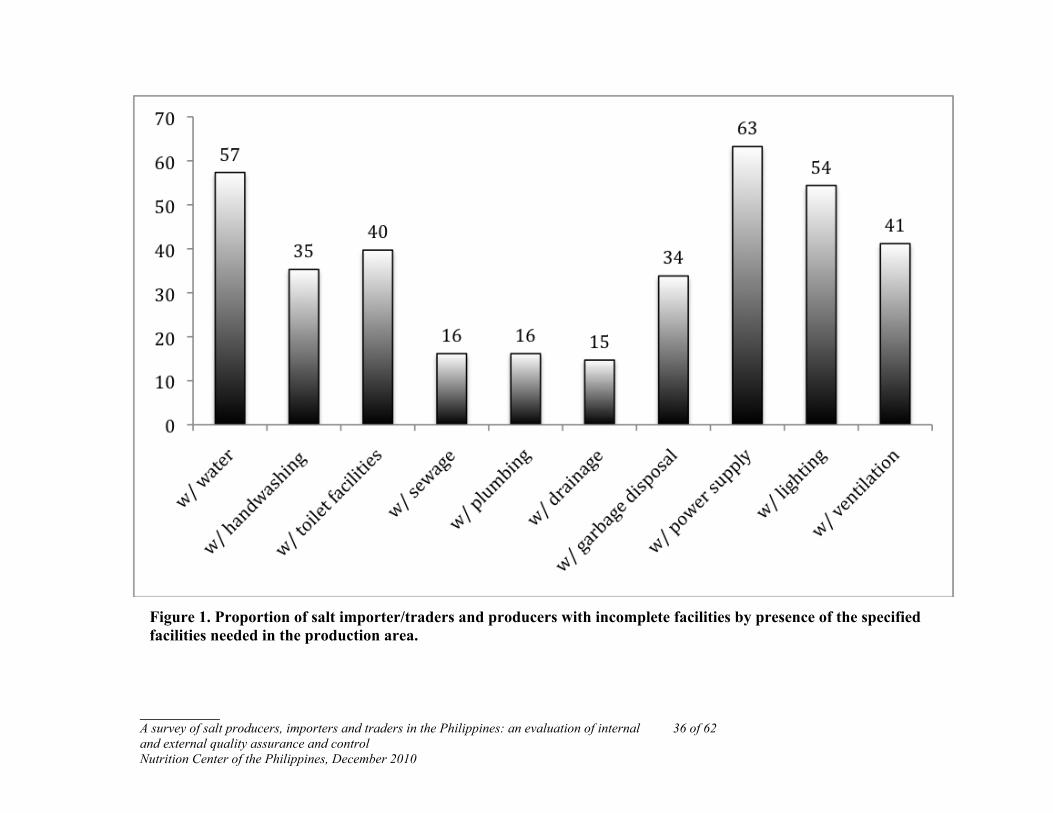
__________ A survey of salt producers, importers and traders in the Philippines: an evaluation of internal 36 of 62 and external quality assurance and control Nutrition Center of the Philippines, December 2010
Figure 1. Proportion of salt importer/traders and producers with incomplete facilities by presence of the specified facilities needed in the production area.

__________ A survey of salt producers, importers and traders in the Philippines: an evaluation of internal 37 of 62 and external quality assurance and control Nutrition Center of the Philippines, December 2010
Table 17. Frequency and percent distribution of salt importer/traders and producers by variables related to equipment used during salt iodization per island
Luzon Visayas Mindanao Total Variable n % n % n % n %
Type of iodine sprayer used N 45 20 6 71
Plastic, manual 35 77.8 9 45.0 1 16.7 45 63.4 Compressor-machine 5 11.1 2 10.0 4 66.7 11 15.5 Stainless steel, manual 3 6.7 5 25.0 1 16.7 9 12.7
Improvised 2 4.4 4 20.0 0 0.0 6 8.5 Frequency of maintenance of iodine sprayer
N 43 16 5 64 Every use 11 25.6 3 18.8 1 20.0 15 23.4 Every 30 minutes 1 2.3 1 6.3 0 0.0 2 3.1 Everyday 4 9.3 1 6.3 2 40.0 7 10.9 Every week 14 32.6 7 43.8 1 20.0 22 34.3 Once a month 1 2.3 0 0.0 1 20.0 2 3.1 No maintenance 12 27.9 4 25.0 0 0.0 16 25.0 Type of iodization machine used
N 48 19 6 73 No machine 41 85.4 14 73.7 0 0.0 55 75.3 Continuous-type 3 6.3 2 10.5 4 66.7 9 12.3 Ribbon blender 4 8.3 1 5.3 1 16.7 6 8.2 Cement mixer 0 0.0 2 10.5 0 0.0 2 2.7 Improvised 0 0.0 0 0.0 1 20.0 1 1.4 Frequency of maintenance of iodization machine
N 5 5 5 15 Every use 1 20.0 3 60.0 0 0.0 4 26.7 Everyday 2 40.0 2 40.0 2 40.0 6 40.0 Every week 1 20.02 0 0.0 2 40.0 3 20.0 Every month 1 20.0 0 0.0 1 20.0 2 13.3
__________ A survey of salt producers, importers and traders in the Philippines: an evaluation of internal 38 of 62 and external quality assurance and control Nutrition Center of the Philippines, December 2010
Iodine level in iodized salt To validate if the SITPs know the recommended iodine level in iodized salt they were asked what is their minimum and maximum targeted iodine level during salt iodization. Based on the FDA guidelines, the standard iodine content of iodized salt should be 20 to 70 ppm across distribution channel, whether in bulk or retail, imported or local. Only 31 (42%) out of the 74 respondents answered the question on the minimum iodine level [Table 18]. Among the 31 who responded, only 26% reported their minimum iodine level to be within the standard. Majority reported the minimum iodine level that was either below (6%) or above (68%) the standard. On the other hand, 33 (45%) of the 74 respondents answered the question on the maximum iodine level of iodized salt [Table 18]. Among those who responded, 82% reported a maximum iodine level above the standard, between 75 to 100 ppm. More than half of the respondents do not know the recommended iodine levels for iodized salt with majority overestimating both the minimum and maximum levels. Further, those who are familiar with the recommended levels seemed to know the old standards not the new standards that were released in 2007 and supposed to be disseminated to all salt manufacturers. If we compare the respondents’ answer on the minimum and maximum iodine level to the old standards, 60 to 150 ppm iodine level at manufacturer’s site, 70% of the respondents’ minimum iodine level were within the standard while 91% of their maximum level were also within the standard. There was a significant increase in the proportion of producers with correct minimum and maximum target levels using the old standards. To further validate the information on the iodine level, the iodine level of the fortificant solution being used by the SITPs during salt iodization was computed. Information on the weight of the fortificant used (potassium iodate) and quantity of non-iodized salt to be iodized was obtained. From this information, the iodine level during actual iodization was estimated, compared to the standard and classified to either within, below or above the standard [Table 18]. Only 55 (75%) of the 73 respondents who iodize their salt provided answers on both the amount of fortificant and the quantity of salt iodized. Most cannot give the actual quantity of salt to be iodized or that of the fortificant because they only estimate the quantity (i.e. 2 milk scoops or 2 spoons of fortificant in 4 or 5 liters of water). Among those who gave the information, 37% used a solution that would yield iodine levels below the 2007 standard [Figure 2a]. Most (61%) of the respondents whose iodine levels were below standard were from Luzon. When the computed iodine levels were compared to the old standard, only 1 respondent was iodizing above the maximum iodine level [Figure 2b]. Most respondents (85.5%) were using an iodate solution that will yield an iodine level below 70 ppm.
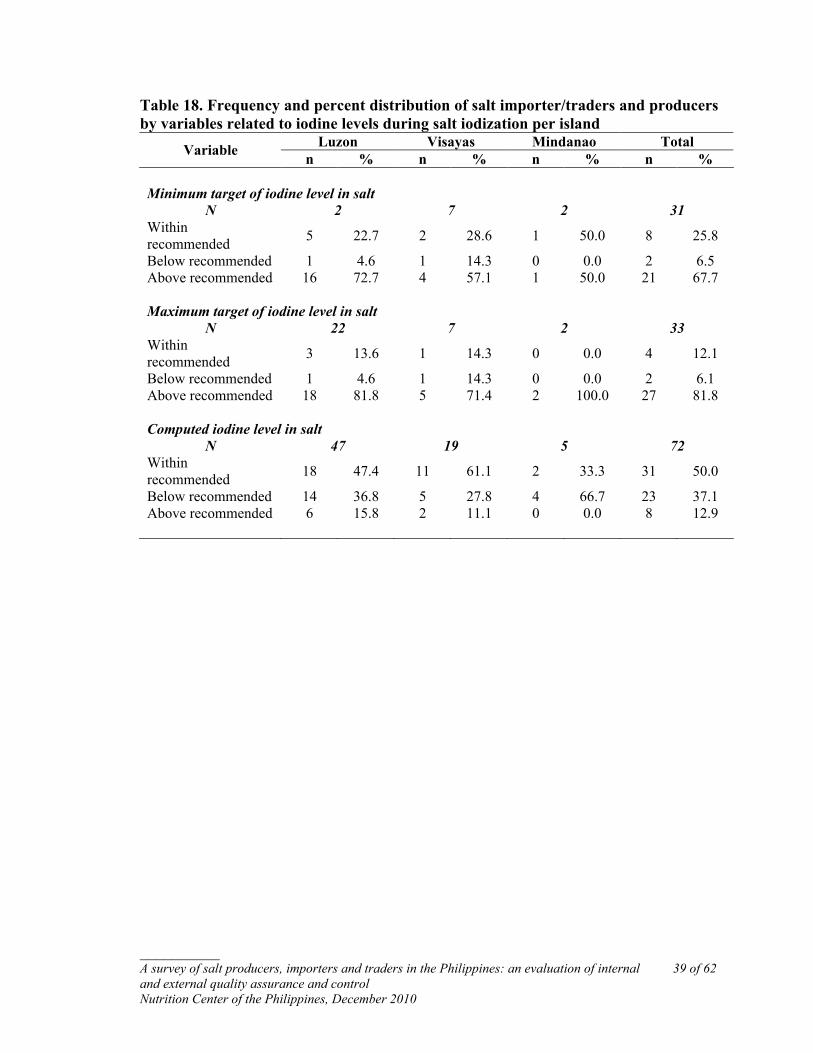
__________ A survey of salt producers, importers and traders in the Philippines: an evaluation of internal 39 of 62 and external quality assurance and control Nutrition Center of the Philippines, December 2010
Table 18. Frequency and percent distribution of salt importer/traders and producers by variables related to iodine levels during salt iodization per island
Luzon Visayas Mindanao Total Variable n % n % n % n %
Minimum target of iodine level in salt N 2 7 2 31
Within recommended 5 22.7 2 28.6 1 50.0 8 25.8
Below recommended 1 4.6 1 14.3 0 0.0 2 6.5 Above recommended 16 72.7 4 57.1 1 50.0 21 67.7 Maximum target of iodine level in salt
N 22 7 2 33 Within recommended 3 13.6 1 14.3 0 0.0 4 12.1
Below recommended 1 4.6 1 14.3 0 0.0 2 6.1 Above recommended 18 81.8 5 71.4 2 100.0 27 81.8 Computed iodine level in salt
N 47 19 5 72 Within recommended 18 47.4 11 61.1 2 33.3 31 50.0
Below recommended 14 36.8 5 27.8 4 66.7 23 37.1 Above recommended 6 15.8 2 11.1 0 0.0 8 12.9
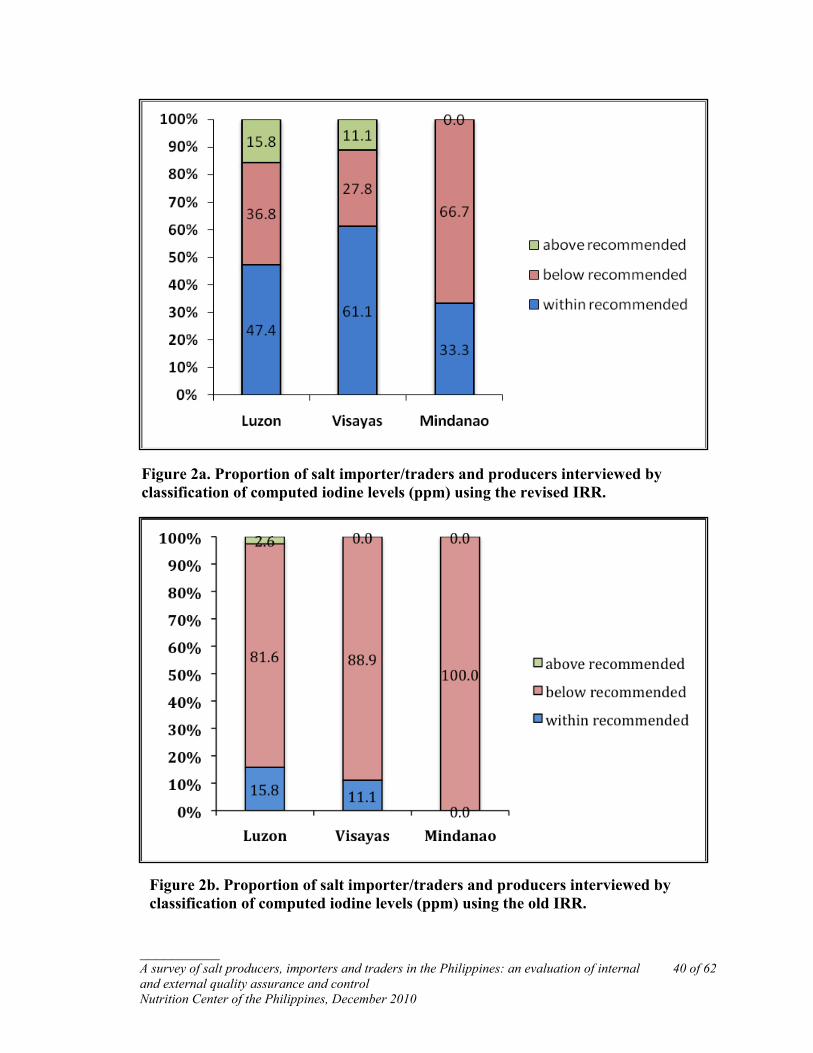
__________ A survey of salt producers, importers and traders in the Philippines: an evaluation of internal 40 of 62 and external quality assurance and control Nutrition Center of the Philippines, December 2010
Figure 2a. Proportion of salt importer/traders and producers interviewed by classification of computed iodine levels (ppm) using the revised IRR.
Figure 2b. Proportion of salt importer/traders and producers interviewed by classification of computed iodine levels (ppm) using the old IRR.
__________ A survey of salt producers, importers and traders in the Philippines: an evaluation of internal 41 of 62 and external quality assurance and control Nutrition Center of the Philippines, December 2010
Salt iodization method Similarities can be seen in the way SITPs approach salt iodization. First, most only iodize when it is needed, such as when there is a customer who wants to buy iodized salt. They also have similar sources of potassium iodate: government workers, large salt producers, and piecemeal from organizations. Inspection of raw materials for iodization is done visually, with most SITPs relying on an honor system with their suppliers. There are two ways of salt iodization: manual iodization, and machine iodization [Table 19]. Most (73%) of the respondents iodize their salt manually. Among the respondents iodizing salt manually, 28 (53%) were able to give information on how much iodized salt were produced the previous year [Table 19]. Most of the respondents (64.3%) produced between 2 to 300 MT of iodized salt. Machine iodization is limited to large-scale SITPs. Manual Salt Iodization Manual salt iodization involves the use of a shovel, and a pressurized sprayer or a garden hose/sprinkler. In some instances, the SITPs also utilize their hands. First, raw salt is spread on a flat surface, or poured into a wide container, such as a bucket. Then, potassium iodate is dissolved into a container of water. This iodate solution is then loaded into a pressurized sprayer or garden hose. After this, the iodate solution is sprayed on the spread salt, and then mixing is done. A shovel is used to help aid in evening out the mix of raw salt and iodate solution. In some cases, mixing by hand is done. Mixing time varies among respondents: some mix using the shovel as their guide (one instance describes it as three sets of shovel turns), while some set a time period to follow, such as five minutes. There are also some who use a test to determine the iodine content of the salt. In these cases, salt is continuously mixed until it satisfies the test (i.e. as one respondent explained, turns to the appropriate color). Machine Salt Iodization There are two types of iodization machines used by the respondents for salt iodization: some use a continuous-type iodization machine, while others use a batch-type machine (ribbon blender, cement mixer). In the continuous-type iodization machine the salt is ground before being iodized. First, salt is poured directly into the machine. The machine has a conveyor belt type that takes the salt from process to process. In addition, the machine also continuously mixes the salt. After a set amount of time (this varies with respect to respondent), the iodate solution is sprayed to the mix. The salt is then mixed continuously, to ensure even distribution of the iodate solution. As

__________ A survey of salt producers, importers and traders in the Philippines: an evaluation of internal 42 of 62 and external quality assurance and control Nutrition Center of the Philippines, December 2010
with manual iodization, the time for the process depends on the respondents. There are some who set a time for it, while others also use a test to determine when to stop the mixing process. On the other hand, in a batch type of iodization machine, coarse salt is grounded in a separate machine; the refined salt is then transferred to the iodizing machine for iodization. There are also a few instances where the SITPs involve the iodization process in the actual production of the salt. In these cases, the respondents add the fortificant solution while they are cooking the salt during production. One respondent adds the fortificant solution while the salt is being cooked. Another respondent said that the fortificant solution is sprayed to the salt prior to grinding into finer salt. Use of iodized salt Almost all of the SITPs (96%) reported producing iodized salt for human or household consumption [Table 16]. The other uses of iodized salt were for food processing and for animal consumption. Bakeries, fish canning industries, biscuits manufacturers and animal feeds manufacturers were cited as regular clients. Table 19. Frequency and percent distribution of salt importer/traders and producers by method of salt iodization and reported use of iodized salt per island
Luzon Visayas Mindanao Total Variable n % N % n % n %
Method of salt iodization N 47 20 6 73
Machine 8 17.0 7 25.0 5 83.3 20 27.4 Manual 39 83.0 13 65.0 1 16.7 53 72.6 Quantity of iodized salt produced using the manual method (MT)
N 18 9 1 28 <=2 2 11.1 2 22.2 0 0.0 4 14.3 >2 to <=300 12 66.7 6 66.7 0 0.0 18 64.3 >300 to <=2000 4 22.2 1 11.1 1 100.0 6 21.4 Use of iodized salt*
N 44 20 6 70 Human consumption 43 97.7 19 95.0 5 83.3 67 95.7 Food processing 6 13.6 2 10.0 1 16.7 9 12.9 Animal consumption 0 0.0 1 5.0 2 33.3 3 4.3
*Multiple responses

__________ A survey of salt producers, importers and traders in the Philippines: an evaluation of internal 43 of 62 and external quality assurance and control Nutrition Center of the Philippines, December 2010
Quality Control The method used by all of the respondents who conduct quality control on their iodized salt was spot testing using a Rapid Test Kit (RTK) usually given by the Sanitary Inspectors of the local government unit [Table 20]. The respondents were asked to show the RTK boxes. Among those who were able to show the complete set of the RTK, 76% were using RTKs past the expiration date indicated on the label of the box. One of the RTK shown had an expiration date of August 2005. Spot testing is usually done by dropping the solution on the top of the heap of the iodized salt prior to packing. If the salt tested did not changed to the desired color, the heap will be sprayed again with the fortificant solution, mixed and tested again. The procedure is repeated until the desired color change on the tested salt is attained. There were also those (28%) who do not conduct any quality control testing during iodization. They usually rely on the testing conducted by the Sanitary Inspectors in the market during market day or when they conduct occasional site visits because they were not provided their own test kits. Only 1 respondent, a large-scale SITP from Luzon, conducts an onsite test using the titration method. Table 20. Frequency and percent distribution of salt importer/traders and producers by method used in testing iodized salt during production per island
Luzon Visayas Mindanao Total Variable n % n % n % n %
N 47 19 6 72 RTK 29 36.2 16 84.2 6 100.0 51 70.8 None 17 36.2 3 15.8 0 0.0 20 27.8 Titration & RTK 1 2.1 0 0.0 0 0.0 1 1.4
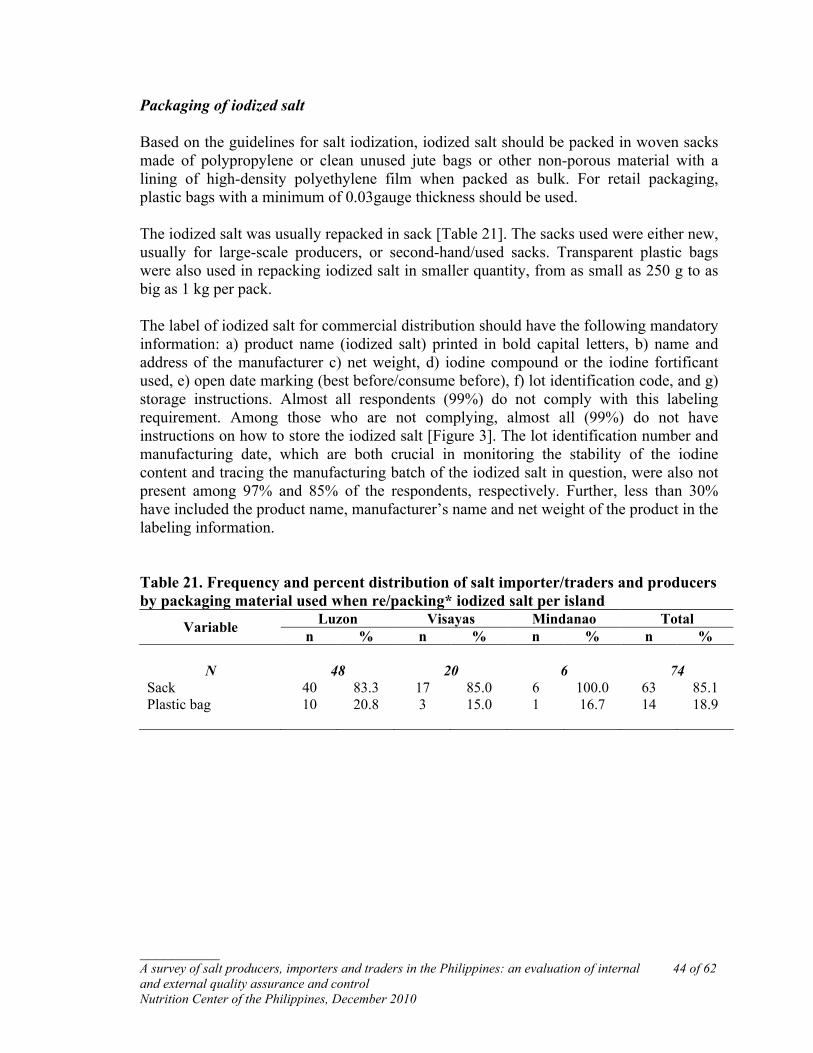
__________ A survey of salt producers, importers and traders in the Philippines: an evaluation of internal 44 of 62 and external quality assurance and control Nutrition Center of the Philippines, December 2010
Packaging of iodized salt Based on the guidelines for salt iodization, iodized salt should be packed in woven sacks made of polypropylene or clean unused jute bags or other non-porous material with a lining of high-density polyethylene film when packed as bulk. For retail packaging, plastic bags with a minimum of 0.03gauge thickness should be used. The iodized salt was usually repacked in sack [Table 21]. The sacks used were either new, usually for large-scale producers, or second-hand/used sacks. Transparent plastic bags were also used in repacking iodized salt in smaller quantity, from as small as 250 g to as big as 1 kg per pack. The label of iodized salt for commercial distribution should have the following mandatory information: a) product name (iodized salt) printed in bold capital letters, b) name and address of the manufacturer c) net weight, d) iodine compound or the iodine fortificant used, e) open date marking (best before/consume before), f) lot identification code, and g) storage instructions. Almost all respondents (99%) do not comply with this labeling requirement. Among those who are not complying, almost all (99%) do not have instructions on how to store the iodized salt [Figure 3]. The lot identification number and manufacturing date, which are both crucial in monitoring the stability of the iodine content and tracing the manufacturing batch of the iodized salt in question, were also not present among 97% and 85% of the respondents, respectively. Further, less than 30% have included the product name, manufacturer’s name and net weight of the product in the labeling information. Table 21. Frequency and percent distribution of salt importer/traders and producers by packaging material used when re/packing* iodized salt per island
Luzon Visayas Mindanao Total Variable n % n % n % n %
N 48 20 6 74 Sack 40 83.3 17 85.0 6 100.0 63 85.1 Plastic bag 10 20.8 3 15.0 1 16.7 14 18.9
__________ A survey of salt producers, importers and traders in the Philippines: an evaluation of internal 45 of 62 and external quality assurance and control Nutrition Center of the Philippines, December 2010
Figure 3. Proportion of non-compliant salt importer/traders and producers whose packaging has the required specified information.
__________ A survey of salt producers, importers and traders in the Philippines: an evaluation of internal 46 of 62 and external quality assurance and control Nutrition Center of the Philippines, December 2010
Sanitation and safety system The availability of protective clothing/uniform for the workers of the SITPs was observed. The observation of protective clothing was limited to the availability of hair caps, hairnets, apron, rubber boots and gloves for all workers. Only 5% of the respondents have complete available protective clothing for workers. Among those with incomplete protective clothing, rubber boots seemed to be the most commonly available, with 20% reportedly having it [Figure 4]. Only 15% reported to have first-aid kits available in the area in case of accidents or emergencies [Table 22]. Generally, fumigation of the premises was not regularly conducted in the production area. Those who claimed to conduct fumigation reportedly do it once a month or have done only the fumigation once. Table 22. Frequency and percent distribution of salt importer/traders and producers by availability of first-aid facility per island
Luzon Visayas Mindanao Total Variable n % n % n % n %
N 48 20 6 74 Available 5 10.9 4 20.0 2 33.3 11 15.3

__________ A survey of salt producers, importers and traders in the Philippines: an evaluation of internal 47 of 62 and external quality assurance and control Nutrition Center of the Philippines, December 2010
Figure 4. Proportion of salt importer/traders and producers who have the specific protective clothing for use during salt iodization
__________ A survey of salt producers, importers and traders in the Philippines: an evaluation of internal 48 of 62 and external quality assurance and control Nutrition Center of the Philippines, December 2010
Storage, handling and distribution Iodized salt were usually packed in sacks and stored in a warehouse. The packed salt would either be stacked horizontally, on top of one another, or stored upright. The packed iodized salt were stored elevated from the floor using a pallet. However, there are some who store iodized salt by dumping directly on the warehouse floor or packed in sack but not elevated from the floor. The floor is usually cemented or lined with plastic, woven bamboo mats, canvas or rice hull. The storage area of the iodized salt usually has a roof either made of woven bamboo mats, aluminum or woven cogon grass. Storage areas without roofing material would usually cover the stored iodized salt with canvas. There were respondents who do not store iodized salt because salt iodization is done only upon order of a buyer thus iodized salt is immediately delivered or picked-up. Among respondents who reported storing iodized salt, only 41% followed the first-in, first-out (FIFO) system [Table 23]. Most (60%) respondents either retrieve the top-most or front-most stocks or whichever pack is nearby. Thirteen percent (13%) claimed to have a system being followed when complaints about their products are received [Table 23]. The usual complaints of customers were high moisture content of the iodized salt or improper sealing of the packages. The product is retrieved and replaced. One respondent reported having assigned personnel in the market to monitor their products. Table 23. Frequency and percent distribution of salt importer/traders and producers by variables related to storage, handling and distribution of iodized salt per island
Luzon Visayas Mindanao Total Variable n % n % n % n %
Storage and retrieval system of iodized salt N 25 14 4 44
First in, First out 10 40.0 3 21.4 5 100.0 18 40.9 Top/Front salt first 6 24.0 10 71.4 0 0.0 16 36.4 No system of storage/retrieval 9 36.0 1 7.1 0 0.0 10 22.7
Availability of product recall system
N 42 16 5 63 Available 5 11.9 2 12.5 1 20.0 8 12.7
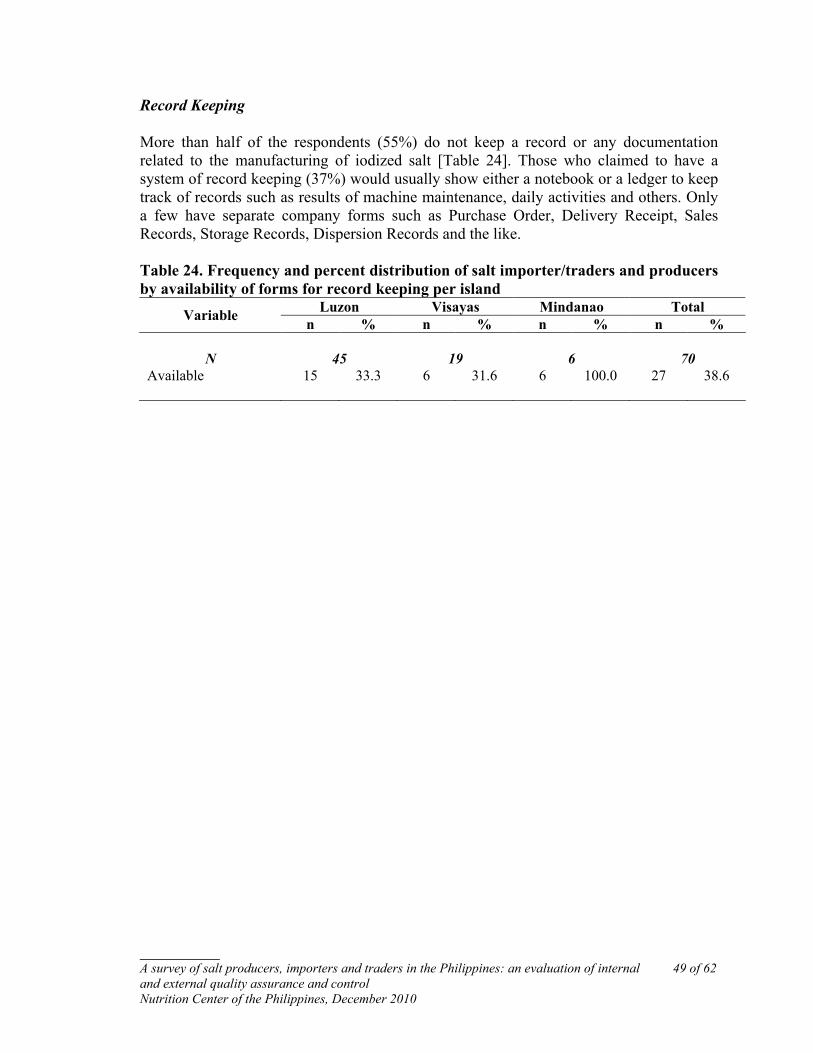
__________ A survey of salt producers, importers and traders in the Philippines: an evaluation of internal 49 of 62 and external quality assurance and control Nutrition Center of the Philippines, December 2010
Record Keeping More than half of the respondents (55%) do not keep a record or any documentation related to the manufacturing of iodized salt [Table 24]. Those who claimed to have a system of record keeping (37%) would usually show either a notebook or a ledger to keep track of records such as results of machine maintenance, daily activities and others. Only a few have separate company forms such as Purchase Order, Delivery Receipt, Sales Records, Storage Records, Dispersion Records and the like. Table 24. Frequency and percent distribution of salt importer/traders and producers by availability of forms for record keeping per island
Luzon Visayas Mindanao Total Variable n % n % n % n %
N 45 19 6 70 Available 15 33.3 6 31.6 6 100.0 27 38.6
__________ A survey of salt producers, importers and traders in the Philippines: an evaluation of internal 50 of 62 and external quality assurance and control Nutrition Center of the Philippines, December 2010
IV. Needs Assessment The study also probed into the possible ways that assistance can be given to salt importer/traders and producers (SITPs) by asking an open-ended question: “What assistance do you need to help improve your business?”. The purpose of this question in relation to the objective was to identify any needs relevant to quality control. The common themes among traders and producers are summarized. Common concerns of both producers and traders are financial concerns, product quality, government assistance, and the iodization of salt. Financial Matters SITPs seek support for finances, such as funds for capital. In the case of the salt importers/traders, funds are needed for the purchase or maintenance of new machines. The salt producers seek support primarily for upgrading equipment, as well as for the upkeep of old ones. In addition, capital is also needed for further training of the producers, and in one case, for the repair of salt beds after a typhoon. Increasing sale of locally produced salt is also a main financial concern. In connection with this, some SITPs also stated the need to regulate, or eradicate salt importation. The salt producers also raised the issue on the low selling price of local salt and if it can be regulated so that salt traders cannot dictate it. Product Quality The quality of local salt is also a main concern. Salt importers/traders seek assistance in producing better quality salt, through innovative salt production strategies. Meanwhile, additional training, proper equipment and proper packaging practices are areas of interest to the salt producers. These practices will help monitor the quality of salt produced. In addition, salt importers/traders also call for raising support for the local salt industry, which can be achieved through marketing assistance, as well as the regulation of imported salt. Government Assistance SITPs seek government assistance for price control, salt importation, and law implementation. Price control seems to be a particularly thorny issue:

__________ A survey of salt producers, importers and traders in the Philippines: an evaluation of internal 51 of 62 and external quality assurance and control Nutrition Center of the Philippines, December 2010
“Masyadong binabarat ng mga buyer ang presyo ng asin” (The prices of salt are being lowered too much by the buyers)
Thus, respondents seek government intervention in the pricing of salt. Their aim is to standardize the prices of salt, so as to prevent losses. For salt importation, the traders wish to regulate it, as it competes with the local salt market. Respondents feel that the government should take steps to show their support the local salt industry. Law implementation, especially with regard to iodization, should be given due attention by the government. In particular, the salt traders seek government assistance primarily for salt importation, as well as in abolishing the ASIN Law. There were also some comments for a revision of the ASIN Law from salt producers. However, no specific recommendations for revisions were given. Iodization of Salt With regard to the iodization of salt, generally, SITPs seem to have accepted the practice, with a few reservations. Specifically, the traders and producers need assistance for information, iodization equipment and law implementation. First, they seek information on the process. As stated by one respondent:
“Proper dissemination on how to use iodized salt, on what iodized salt is and its importance.”
Salt producers also want access to training seminars on iodization. This way, the importance of salt iodization is properly explained to them. Second, SITPs seek assistance in procuring the tools for iodization. As put by one respondent:
“If kailangan iodized yung asin, dapat magbigay daw ng machine; at magkaroon ng training.” (If the salt needs to be iodized, they should provide us with machines and with training.)
Lastly, the salt traders also wish for government assistance in implementing the laws on iodization. This is because in their experience, there are some who do not follow these rules, but still manage to stay in business:
“Mas maging mahigpit yung gov’t kasi sila nagcocomply sila pero yung iba hindi, nakakapag-operate pa din sila.” (The government should be more strict, because some comply but there are others who do not, yet they
__________ A survey of salt producers, importers and traders in the Philippines: an evaluation of internal 52 of 62 and external quality assurance and control Nutrition Center of the Philippines, December 2010
continue to operate.) Specific Concerns of Producers Salt producers also have concerns specific to the nature of their work. These are on equipment and labor costs. Most producers cited the need of a proper storage facility, such as a warehouse, and for purchase of equipment such as water pumps. Some respondents also indicated the need for a boat, in hauling and storing salt. The producers also raised issues on labor wages. In particular, the need for establishing a cooperative for the salt producers was a recurrent theme. Several respondents also said that salt laborers or tenants should be given equal rights as that of the landowners. This probably refers to the sharing system being practiced between the landowner and tenants on how much of the profit gained from selling salt is divided. Summary of Concerns In summary, the concerns of SITPs can be classified into four main issues: these are financial concerns, product quality concerns, the need for government assistance, and the iodization of salt. Their main financial concern is for additional capital to purchase equipment for salt production and iodization. For product quality, support for acquiring new salt production strategies, through additional training and equipment, is needed. Government assistance is needed in law implementation, price control and salt importation. For the iodization of salt, assistance for information, iodization equipment and law implementation is needed.
__________ A survey of salt producers, importers and traders in the Philippines: an evaluation of internal 53 of 62 and external quality assurance and control Nutrition Center of the Philippines, December 2010
IV. Mapping the location of Salt Importers/Traders and Producers using the Global Positioning System Global Positioning System (GPS) mapping was conducted using either a GPSMAP 60CSx or GPSMAP 76Cx. The location of the salt farm of the salt producers or the warehouses, in the case of salt traders/importers, were recorded and stored in a map database by the FAs. The locations were captured automatically by pressing the “Mark” key on the device. Each location was labeled with either the company name or the salt farm owner whichever is applicable. Each map database was transferred and consolidated using BaseCamp version 3.0.2 software (Garmin Ltd., Kansas, USA). The following map databases were prepared: a. producers interviewed.GPX - limited to salt producers who were interviewed b. producers with destination.GPX - limited to salt producers who were interviewed; includes track points of provinces where the salt produce are usually traded as reported by the respondents c. traders interviewed.GPX - limited to salt importers/traders who were interviewed d. traders with destination.GPX - limited to salt importers/traders who were interviewed; includes track points of provinces where the salt produce are usually traded as reported by the respondents e. producers and traders interviewed.GPX - limited to salt producers and importers/traders who were interviewed and not interviewed; the SITPs were distinguished as follow: red flag are salt producers who were not interviewed, blue flag are salt producers who were interviewed, red pin are salt importers/traders who were not interviewed, and blue pin are salt importers/traders who were interviewed. f.. Luzon producers with destination.GPX - limited to salt producers located in Luzon; includes track points of provinces where the salt produce are usually traded as reported by the respondents g. Ilocos Norte, Ilocos Sur and La Union.GPX - limited to salt producers located in Ilocos Norte, Ilocos Sur and La Union; includes track points of provinces where the salt produce are usually traded as reported by the respondents h. Pangasinan producers..GPX - limited to salt producers located in Occidental Mindoro; includes track points of provinces where the salt produce are usually traded as reported by the respondents
__________ A survey of salt producers, importers and traders in the Philippines: an evaluation of internal 54 of 62 and external quality assurance and control Nutrition Center of the Philippines, December 2010
i. Bulacan producers.GPX - limited to salt producers located in Bulacan; includes track points of provinces where the salt produce are usually traded as reported by the respondents j. Mindoro producers.GPX - limited to salt producers located in Occidental Mindoro; includes track points of provinces where the salt produce are usually traded as reported by the respondents k. Visayas producers with destination.GPX - limited to salt producers located in Visayas; includes track points of provinces where the salt produce are usually traded as reported by the respondents l. Mindanao producers with destination.GPX - limited to salt producers located in Mindanao; includes track points of provinces where the salt produce are usually traded as reported by the respondents The maps can be viewed using the BaseCamp or the Google Earth software. Both software can be downloaded for free from their website and have versions available for both Macintosh and Windows operating system. Follow installation procedures after downloading the appropriate installer. The gpx files can be open either by double-clicking the file or by opening the file using your preferred installed software from the software interface window.
__________ A survey of salt producers, importers and traders in the Philippines: an evaluation of internal 55 of 62 and external quality assurance and control Nutrition Center of the Philippines, December 2010
DISCUSSIONS AND RECOMMENDATIONS The survey shows that there has been a change in the profile of the salt importers, traders and producers in the country when compared with the results of our last nationwide survey in the 1990s. In the 2010 salt survey, we estimate that at least 30% of the salt producers who were included in the 1990 surveys have closed. This estimate does not include salt producers who were not included in our consolidated list. Thus, there is a possibility of underestimation. Several salt farms were either non-operational or have been converted to residential or commercial lots. The reasons for these are financial losses or the inability of the landowners to maintain the salt farm. For instance, several salt farms in Iloilo were either not operational or not fully operational because of damages in their salt beds caused by typhoons in the previous years. There were also other producers who have shifted to repacking iodized salt because it is less costly. Although there were several salt producers who have closed down they were also young players who have cropped-up in the salt industry. A third of the salt producers interviewed reported operating for less than or equal to 10 years. Changes on how types of salt beds being used to produce solar salt were also evident. Salt producers from Occidental Mindoro, who previously were not using plastic sheets as salt beds, were now either shifting to using plastic sheets only or using both plastic sheets and broken ceramics. The shift to plastic sheets as salt beds is presumably to produce solar salt of better quality. Further, salt producers have commented that sourcing broken ceramics for use in repairing their salt beds is more expensive because ceramics has become less available. In the production process of salt, the use of rock salt, a type of coarse salt that is of bigger granules, in producing fine grain salt through cooking has become more common. Traditionally, the concentrated brine cooked to produce fine salt came from the seawater that passed through sun-dried sand. Using this type of brine produces fine salt in small amount with a less white color. Cooking concentrated brine produced from dissolving coarse salt in seawater produced greater amount of fine salt that has whiter color compared with the fine salt produced using concentrated brine from seawater alone. The coarse salt used as an ingredient for fine salt is imported and is usually supplied by large-scale salt importers.
__________ A survey of salt producers, importers and traders in the Philippines: an evaluation of internal 56 of 62 and external quality assurance and control Nutrition Center of the Philippines, December 2010
Status of registry of salt importers, traders and producers It was stated in the Revised Implementing Rules and Regulations 2007 (IRR 2007) that a list of salt producers, importers and distributors in their respective territorial jurisdiction should be established and maintained by the LGU. A list of registered salt producers, importers and distributors in every province should be submitted to the FDA 6 months from the effectivity of the revised IRR. The list should reflect the following information: name and address of the company and/or owner/producer/importer or distributor; location of salt production site or warehouse; annual production capacity or importation; types of salt produce/traded; and distribution channels (i.e. direct consumers, traders, food manufacturers). The list should be updated annually. The revised IRR has been in effect since 2007. In preparing for this survey, list of SITPs were requested from several government agencies, both local and national. Only a few were able to provide a listing. When these lists were checked and validated before and during the field survey, the team found the following findings: a) inclusion of several SITPs in the list even if the company has been closed for several years; b) misclassification, i.e. listed as producers but have presently shifted to repacking and retailing c) unavailability of required information that by law should be included in the database; d) non-inclusion of several SITPs in the list; e) inaccurate company names, i.e. company names have been changed but not reflected in the list. This initial preparatory step revealed issues that might be worth looking into. Several LGUs do not have a list of SITPs in their jurisdiction and if they have a list, it is not regularly and accurately updated. It was also observed that LGU personnel are familiar with who are the SITPs operating in their jurisdiction, whether or not they have business permits and LTO and whether they are included or not in their official registry. Those without permits or LTO are freely operating. The team observed that there seems to be no fixed agency or department who is responsible for the salt industry, at least at the LGU level. The survey groups were referred to the DTI, Sanitary Inspectors, Municipal Agriculturist or Nutritionist-Dietitian depending on who has the list of SITPs. Status of License to Operate It is evident that almost all of the salt producers interviewed were not registered business entities nor do they have LTOs. It seemed to be an accepted practice among the industry and even among their governing LGUs. The reasons of the salt manufacturers on their failure to register their business and in turn avail of a LTO from the FDA have already been previously mentioned in this report. Among the salt producers who either do not have or have failed to show their LTO during the interview, 72% were small-scale producers while among the salt importers/traders, half (52%) were small-scale importers/traders of iodized salt. Cross-tabulating for LTO status and category of computed iodine level (ppm) used during salt iodization showed
__________ A survey of salt producers, importers and traders in the Philippines: an evaluation of internal 57 of 62 and external quality assurance and control Nutrition Center of the Philippines, December 2010
that 93.5% either do not have or have failed to show their LTO. Among the 93.5%, 36% were using an iodine solution that would yield an iodine level below the standard while 14% were using an iodine solution that would yield an iodine level above the standard. One of the provisions of the ASIN Law is that all salt manufacturers who are iodizing salt should be registered for purposes of compliance and quality assurance and quality control monitoring. This would help the government regulatory body to check the iodized salt production and assure the consumers that the iodized salt they are buying and using are of standard quality. However, as shown in the survey, 95% of iodized salt manufacturers do not have their LTO and thus are not governed and sanctioned by the FDA. This is an opportunity for the salt manufacturers to produce, market and distribute iodized salt of low or poor quality. Salt iodization process Salt iodization using manual sprayers and manual mixing, either using bare hands or shovels, are much more common than using motor iodine sprayers and iodization machines. The use of motor iodine sprayers and iodization machines are limited to large-scale importers/traders who can afford the cost of maintenance and operation. There were a few respondents who have iodization machines that were left in storage for various reasons. The machines were either broken or costly to set up and use. In some instances, no one knows how to operate the machine, and in others the salt to be iodized is minimal. Local salt producers and traders, in their need to comply with the requirement of trading only iodized salt and thus avoid confiscation of their product and other penalties, would iodize the salt manually. However, iodization did not follow specific procedures or guidelines. In general, the procedure is as follows: spray the fortificant solution on to the salt heap; mix the heap; if the SITP has RTK, drop RTK solution on the mixed salt; if tested salt turned purple, the iodized salt is pack in sacks. Both the amount of the sprayed fortificant solution and the amount of salt in the heap is unknown. In addition to the unguided iodization technique, there were areas where the preparation of the fortificant solution is questionable. It was observed from several respondents in Luzon who iodize their own salt that different scoopers (milk scooper or plastic spoons) are used when adding potassium iodate in 4 or 5 liters of water kept in clear plastic bottle. Again, the weight of the added fortificant is not known. The SITPs performing the practices above claimed to have attended training seminars conducted either by LGU officials or FDA on salt iodization. Few respondents were able to state correctly the recommended iodine level of iodized salt. Some would cite the old standard of iodine level in iodized salt. Large-scale SITPs are also not immune to practices that will most likely result to poor quality iodized salt. When the fortification concentration was computed based on the amount of fortificant used and the quantity of salt to be iodized, 12 SITPs were using
__________ A survey of salt producers, importers and traders in the Philippines: an evaluation of internal 58 of 62 and external quality assurance and control Nutrition Center of the Philippines, December 2010
iodine levels below the standard (2 of these were large-scale SITPs). It was further observed that there were different non-standardized techniques of salt iodization among subsistence to small-scale producers. There was a producer who iodizes salt by adding the fortificant powder directly on the salt heap then manually mixes the heap. Another iodizes salt by dissolving the fortificant in a glass of water then manually sprinkles the fortificant solution. One producer sprinkles the fortificant powder to the concentrated brine while being cooked. Another respondent would spray the fortificant solution to coarse salt then grind the iodized salt into finer granules. The efforts of these producers to comply with the law are commendable but the absence of standard procedures makes it difficult to improve the quality of iodized salt available in the local market. These techniques pose a threat in the effort of authorities to improve the quality of locally produced iodized salt. The situations above seem to indicate that whatever training received by the SITPs has not translated into proper practice. Many SITPs when probed on what they know about salt iodization gave unsure answers. They cannot remember specific benefits of iodized salt and the technical details of salt iodization. Both of these are crucial in sustaining the USI program and assuring at least the level of iodine in iodized salt is within the standards. Lack of information on the revised IRR of the ASIN Law was also evident. The new iodine standards seem to be familiar only among large-scale SITPs. Hands-on training seminars should be conducted especially among new players in the industry to orient and train them on salt iodization. Old SITPs players should still be included to check their extent of knowledge on the USI program and to retrain as needed. If possible, a manual on salt iodization should be provided. No approved standardized guidelines on manual iodization are available, yet these are the most common methods used to iodize salt. This is probably the result of early advocacies in salt iodization where advocates would demonstrate manual salt iodization to show that iodization is simple, easy and possible notwithstanding the probability of producing inhomogeneous product. It might be better that instead of forcing the use and maintenance of iodization machines we can look into the possibility of developing a procedure that will make use of the simplest equipment (i.e. manual garden sprayer and shovel) during salt iodization. The procedure should look into how much fortificant solution should be sprayed on the salt heap, the amount of salt to be iodized, and the mixing frequency. In addressing the inaccuracies in the amount of fortificant powder to be added during fortificant solution preparation, it is suggested that pre-packing the fortificant powder in amounts needed for each batch of iodization be done or to develop a standardized scooper to be made available to all. Quality assurance /Quality control system in salt iodization There are several issues concerning the quality assurance / quality control of iodized salt: 1) in plant iodine content testing, 2) iodized salt sampling, 3) storage and 4) packing of
__________ A survey of salt producers, importers and traders in the Philippines: an evaluation of internal 59 of 62 and external quality assurance and control Nutrition Center of the Philippines, December 2010
iodized salt. To check if iodized salt contains iodine that are meeting the standards, iodine content testing is required at the manufacturer’s level. This can be done using a Rapid Test Kit (RTK), a WYD iodine checker or the standard titration method. Based on the survey, almost all of the SITPs who are producing or trading iodized salt are using RTKs. They either have their own RTKs on site or Sanitary Inspectors (SIs) check their salt using RTKs. However, the quality of the RTKs being used is in question. Upon inspection of the actual RTKs being used by the SITPs, it was observed that most RTKs are expired, as indicated in the labels. This observation does not include the RTKs being used by the SIs. It is important to note, however, that the SIs supplied almost all in-plant RTKs. When asked about using expired RTKs for testing, respondents said that they were assured that the kits can still be used since it is producing the desired effect (color change of iodized salt). Respondents also reasoned that they are still using the expired RTKs because they do not have an alternate testing method, laboratory testing is expensive and that they were not supplied new RTKs despite repeatedly requesting from the SIs. Adding to this problem is the salt sampling method done (or not done) by the SITPs when testing the iodized salt. Ideally one to two spoonfuls of salt samples should be collected from random areas (i.e. top, middle, bottom) of the heap, each salt samples should be placed in a test plate and separately tested for presence of iodine by dropping one to two drops of test solution onto the salt sample. However, it was observed that most of the SITPs do not collect salt samples from the heap but instead drop the test solution directly on the top of the iodized salt heap, usually at one area only. This practice of sampling and testing does not assure that salt heap was completely nor homogeneously iodized. Further, keeping of iodized salt samples for each lot or batch of salt that was iodized for monitoring of iodine level is rarely done. Ideally iodized salt should be packed in clean, unused woven sacks for bulk packing or in plastic bags for retail packing. Both packaging should conform to the prescribed labeling requirements in accordance with the BFAD Administrative Order No. 88-B series of 1988. However, these packaging and labeling requirements are rarely followed by the SITPs and if followed are limited to large-scale SITPs. However, even large-scale SITPs do not completely adhere to labeling requirements. The survey only encountered one SITP who was able to conform to all labeling requirements. Guidelines further required that iodized salt should be kept palletized in a cool and dry storage area where it is protected from dust and other contaminants. Several SITPs do not have suitable warehouse construction allotted for storing iodized salt. There were SITPs who packed iodized salt in sacks, kept it in open yards, topped with either galvanized iron as roof or covered with canvass. All of the above issues reflect the different levels of quality assurance/quality control of SITPs regardless of classification. As included in the guideline, compliance by SITPs on the standards set for iodized salt
__________ A survey of salt producers, importers and traders in the Philippines: an evaluation of internal 60 of 62 and external quality assurance and control Nutrition Center of the Philippines, December 2010
should be externally monitored by the government sector through FDA and the LGU. External monitoring includes checking of the quality assurance and quality control system and practices and the collection of iodized salt samples for confirmatory testing of iodine content. External monitoring should be done at least once a year. The purpose of external monitoring is to assess the compliance of the SITPs to the standards specified in the guidelines. However, several respondents when asked if visited by the FDA or LGU would reply negatively. Some would report that they were visited but not given any feedback on the results of the visit of the external monitoring team and thus assumed that they are meeting the standards because they are allowed to operate. Needs assessment The needs of the SITPs can be categorized in two: technical training and capital investment. Technical training includes training on salt iodization, quality testing and product marketing. Capital investment refers to both financial and logistical such as equipment and materials for salt iodization. Ideally, these needs were anticipated, addressed and made available to the salt industry when the government approved the law. Included in the revised IRR of the ASIN Law is a section on the role of different government agencies in support of the iodization program. For instance, the Department of Science and Technology shall provide technical assistance in the design, maintenance and operation of salt iodization machines; the Technology and Livelihood Resource Center shall provide funding assistance to qualified small producers and develop a program of training entrepreneurs in setting up micro/cottage/small business enterprises; the Department of Trade and Industry shall assist and support local salt producers in upgrading their production technologies by helping them obtain soft loans and financial assistance for the procurement of salt iodization machines, packaging equipment, technology and fortificants. However, in reality, not all in the salt industry are knowledgeable of the assistance that should be provided to them nor are they familiar with what agencies should provide these. There is a need first to establish if each agency is informed of their roles and whether there are operational guidelines to implement their roles. It would also be very useful if in the last 10 years accomplishments related to the USI program have been documented and reported by the respective agencies. This evaluation would provide a clear picture on the respective agencies’ involvement in the USI program, any duplication of functions, and the resources and coordination needed for the agencies’ to fulfill their roles After this evaluation, the salt industry must be informed in a formal gathering the concrete assistance available to them. Results of the survey could be summed up into the following: the current actual operational practices of the salt manufacturers; the quality of information known in relation to salt iodization; the coping mechanisms done in the effort to produce iodized salt; the assistance needed; and the status of the support mechanism supposedly implemented by the different government agencies to the SITPs. The information gathered in each of these aspects could be used primarily as a guide in the development of
__________ A survey of salt producers, importers and traders in the Philippines: an evaluation of internal 61 of 62 and external quality assurance and control Nutrition Center of the Philippines, December 2010
advocacy program among SITPs. The survey is also an indirect evaluation of the effectiveness of the implementation of the USI program in the country. Thus, results of the survey might also be used as a support to a critical assessment of the USI program implementation.
__________ A survey of salt producers, importers and traders in the Philippines: an evaluation of internal 62 of 62 and external quality assurance and control Nutrition Center of the Philippines, December 2010
REFERENCES
Congress of the Philippines (1995). Republic Act NO. 8172: An Act Promoting Salt Iodization Nationwide and Related Purposes (ASIN Law) and its Implementing Rules and Regulations S. no. 1122 H. no. 45. Manila: Philippines Food and Nutrition Research Institute, (2001). Philippine Nutrition Facts and Figures. United Nations Children’s Fund Food and Nutrition Research Institute, (2006). Philippine Nutrition Facts and Figures 2003. Food and Nutrition Research Institute-Department of Science and Technology.
Food and Nutrition Research Institute, (2010). The Seventh National Nutrition Survey: Philippines, 2008..Food and Nutrition Research Institute-Department of Science and Technology. Maramag, C. C., Tengco, L. W., Rayco-Solon, P., & Solon, F. S. (2007). Stability of iodine in iodized aged salt and iodized newly harvested salt exposed in simulated market conditions. Food and Nutrition Bulletin, 28, 412-418. National Nutrition Governing Board (2007). Revised Implementing Rules and Regulations of Republic Act No. 8172 "An Act Promoting Salt Iodization Nationwide and for Related Purposes". Solon, F. S., Nano, T.C., & Sanchez, L. E. (1994). The Salt Industry in Pangasinan, Bulacan and Occidental Mindoro. Solon, F. S., Nano, T. C., Aran, M. V. J., Limson, M. E. R. P., Isleta, M. F., & Sanchez, L. E. (1994). The Salt Industry in Visayas and Mindanao. Solon, F. S., Nano, T. C., Aran, M. V. J., & Wambangco, L. S. (1997). Quality assurance system if a salt iodization plant in the Philippines: A case study. Solon, F. S., Nano, T. C., & Sanchez, L. E. (1995). The Salt Industry in the Provinces of Cavite, Ilocos Sur and Zambales. Solon, F. S., Sanchez-Fermin, L., & Pastores, M. C. F. (1998). Stability of iodine in iodized salt sold through the "takal" system at Amadeo, Cavite. Solon, F. S., Sanchez-Fermin, L., Pastores, M. C. F., & Cristobal, C. C. (1999). A Survey of Salt Retailers in Luzon, Visayas and Mindanao. WHO/UNICEF/ICCIDD (2007) Assessment of iodine deficiency disorders and monitoring their elimination: a guide for programme managers. 3rd ed. Geneva: Switzerland.

LIST OF ANNEXES
1 Salt producer interview schedule 2 Salt importer/trader interview schedule 3 Quality assurance/Quality control interview schedule 4 Consent/Confidentiality letter 5 Detailed results of the survey among salt producers 6 Methods of salt production 7 Detailed results of the survey among salt importers/traders 8 Detailed results of survey on Quality Assurance / Quality Control
practices on salt iodization
______________________ Annex 1. Salt Producer Interview Schedule 1 of 9
Annex 1. Salt producer interview schedule Salt Producer Interview Schedule
A Survey of Salt Importers, Producers and Traders in the Philippines: an Evaluation of Internal and External Quality Assurance and Control
IDENTIFICATION: __________________
Interviewer: ___________________________________________________
Interview Date : __ __ / __ __/ __ __
A. COMPANY PROFILE
CODE
Name of company (Pangalan ng kumpanya): ___________________________________________________ COMPANY
Name of owner: __________________________________________________________________________ OWNER
Respondent’s name: _______________________________________________________________________ RESPOND
Designation: ______________________________________________ DESIGN
Office address: __________________________________________________________________________ OFFICE
__________________________________________________________________________
Telephone no: ________________________ ________________________ _______________________ OFCTEL
Website: ________________________________________ WEBSITE
Email address: _______________________________________________ EMAIL
Site address: ____________________________________________________________________________ SITE
____________________________________________________________________________
Telephone no: ________________________ ________________________ _______________________ SITETEL
Start of operation: _______________________ Years operational: ___________________ START
YEARS
Registered Company: YES NO REGISTER
Registration No: ___________________________ Agency: ______________________________ REGNO1
Registration No: ___________________________ Agency: ______________________________ REGNO2
Licensed to Operate: YES NO LICENSE
License No: _________________________________________________________________ LICNO
______________________ Annex 1. Salt Producer Interview Schedule 2 of 9
EMPLOYEE PROFILE CODE
1. Total number of employees including company head/owner: ______________________ EMPLOYEE
2. Indicate total number of employees per category then ask for the information below:
Executive: ___________ POSITION
Position Employed Qualification Employment duration
NEEDED
___________________________ _____ ________________________________ ___________ EMPLOYED
___________________________ _____ ________________________________ ___________ QLFICATION
___________________________ _____ ________________________________ ___________ DURATION
___________________________ _____ ________________________________ ___________
___________________________ _____ ________________________________ ___________
___________________________ _____ ________________________________ ___________
___________________________ _____ ________________________________ ___________
___________________________ _____ ________________________________ ___________
___________________________ _____ ________________________________ ___________
___________________________ _____ ________________________________ ___________
___________________________ _____ ________________________________ ___________
___________________________ _____ ________________________________ ___________
Remarks on Employment Profile
_________________________________________________________________________________________
_________________________________________________________________________________________
_________________________________________________________________________________________
_________________________________________________________________________________________
_________________________________________________________________________________________
_________________________________________________________________________________________
_________________________________________________________________________________________
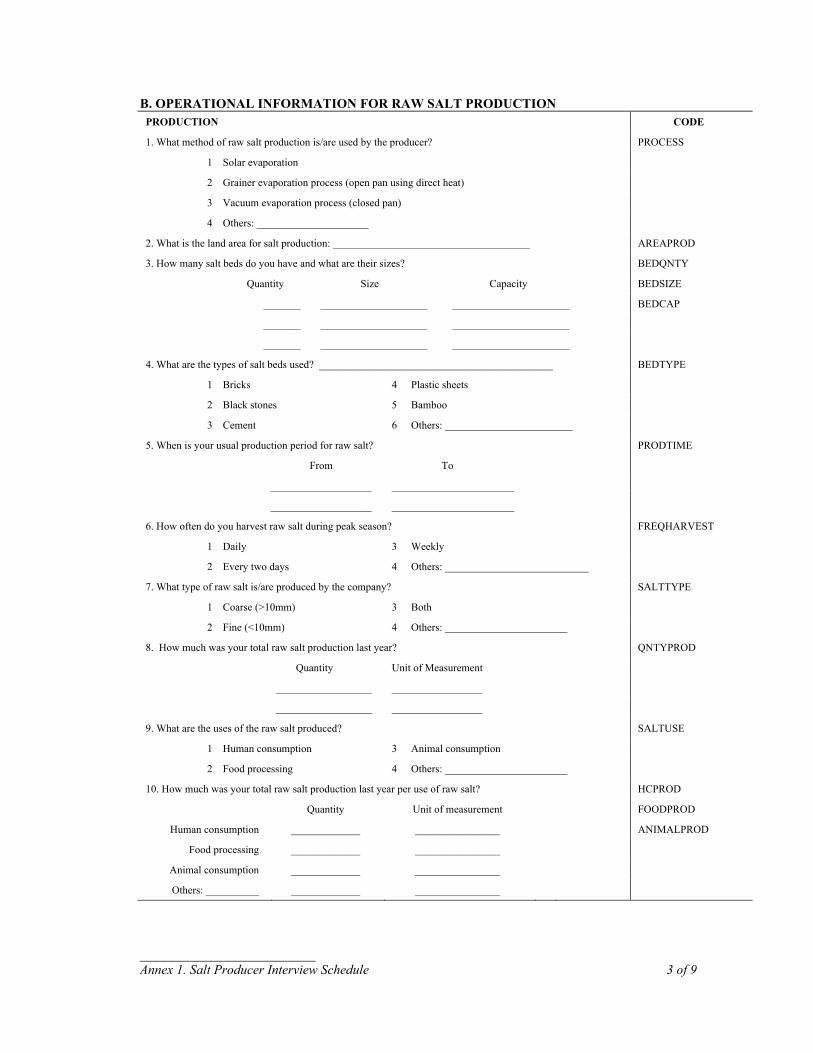
______________________ Annex 1. Salt Producer Interview Schedule 3 of 9
B. OPERATIONAL INFORMATION FOR RAW SALT PRODUCTION PRODUCTION CODE
1. What method of raw salt production is/are used by the producer? PROCESS
1 Solar evaporation
2 Grainer evaporation process (open pan using direct heat)
3 Vacuum evaporation process (closed pan)
4 Others: _____________________
2. What is the land area for salt production: _____________________________________ AREAPROD
3. How many salt beds do you have and what are their sizes? BEDQNTY
Quantity Size Capacity BEDSIZE
_______ ____________________ ______________________ BEDCAP
_______ ____________________ ______________________
_______ ____________________ ______________________
4. What are the types of salt beds used? ____________________________________________ BEDTYPE
1 Bricks 4 Plastic sheets
2 Black stones 5 Bamboo
3 Cement 6 Others: ________________________
5. When is your usual production period for raw salt? PRODTIME
From To
___________________ _______________________
___________________ _______________________
6. How often do you harvest raw salt during peak season? FREQHARVEST
1 Daily 3 Weekly
2 Every two days 4 Others: ___________________________
7. What type of raw salt is/are produced by the company? SALTTYPE
1 Coarse (>10mm) 3 Both
2 Fine (<10mm) 4 Others: _______________________
8. How much was your total raw salt production last year? QNTYPROD
Quantity Unit of Measurement
__________________ _________________
__________________ _________________
9. What are the uses of the raw salt produced? SALTUSE
1 Human consumption 3 Animal consumption
2 Food processing 4 Others: _______________________
10. How much was your total raw salt production last year per use of raw salt? HCPROD
Quantity Unit of measurement FOODPROD
Human consumption _____________ ________________ ANIMALPROD
Food processing _____________ ________________
Animal consumption _____________ ________________
Others: __________ _____________ ________________
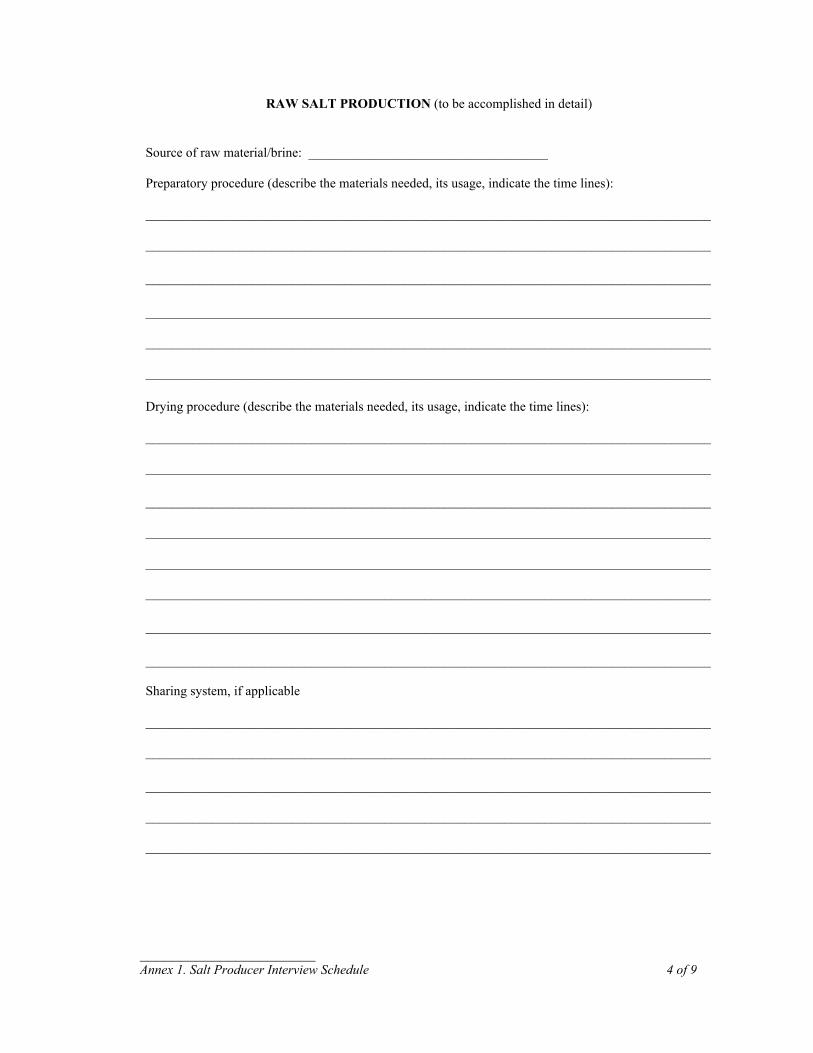
______________________ Annex 1. Salt Producer Interview Schedule 4 of 9
RAW SALT PRODUCTION (to be accomplished in detail) Source of raw material/brine: ____________________________________ Preparatory procedure (describe the materials needed, its usage, indicate the time lines): _____________________________________________________________________________________ _____________________________________________________________________________________ _____________________________________________________________________________________ _____________________________________________________________________________________ _____________________________________________________________________________________ _____________________________________________________________________________________
Drying procedure (describe the materials needed, its usage, indicate the time lines): _____________________________________________________________________________________ _____________________________________________________________________________________ _____________________________________________________________________________________ _____________________________________________________________________________________ _____________________________________________________________________________________ _____________________________________________________________________________________ _____________________________________________________________________________________ _____________________________________________________________________________________ Sharing system, if applicable _____________________________________________________________________________________ _____________________________________________________________________________________ _____________________________________________________________________________________ _____________________________________________________________________________________ _____________________________________________________________________________________
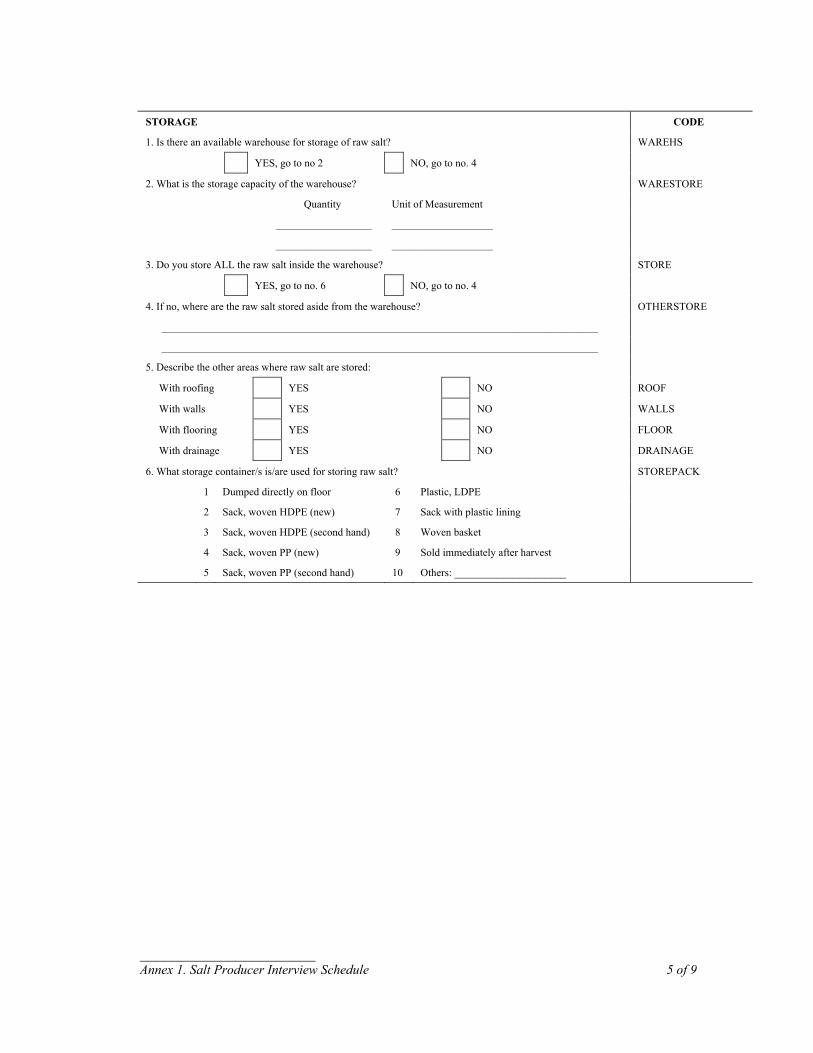
______________________ Annex 1. Salt Producer Interview Schedule 5 of 9
STORAGE CODE
1. Is there an available warehouse for storage of raw salt? WAREHS
YES, go to no 2 NO, go to no. 4
2. What is the storage capacity of the warehouse? WARESTORE
Quantity Unit of Measurement
__________________ ___________________
__________________ ___________________
3. Do you store ALL the raw salt inside the warehouse? STORE
YES, go to no. 6 NO, go to no. 4
4. If no, where are the raw salt stored aside from the warehouse? OTHERSTORE
__________________________________________________________________________________
__________________________________________________________________________________
5. Describe the other areas where raw salt are stored:
With roofing YES NO ROOF
With walls YES NO WALLS
With flooring YES NO FLOOR
With drainage YES NO DRAINAGE
6. What storage container/s is/are used for storing raw salt? STOREPACK
1 Dumped directly on floor 6 Plastic, LDPE
2 Sack, woven HDPE (new) 7 Sack with plastic lining
3 Sack, woven HDPE (second hand) 8 Woven basket
4 Sack, woven PP (new) 9 Sold immediately after harvest
5 Sack, woven PP (second hand) 10 Others: _____________________
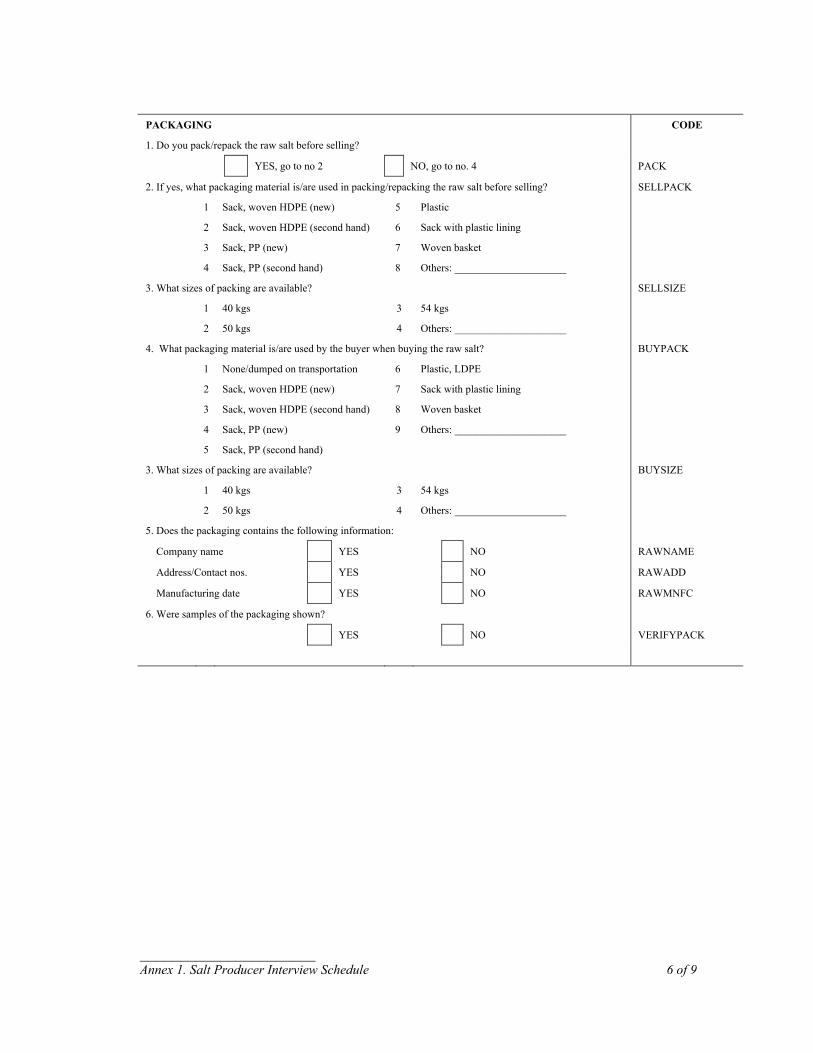
______________________ Annex 1. Salt Producer Interview Schedule 6 of 9
PACKAGING CODE
1. Do you pack/repack the raw salt before selling?
YES, go to no 2 NO, go to no. 4 PACK
2. If yes, what packaging material is/are used in packing/repacking the raw salt before selling? SELLPACK
1 Sack, woven HDPE (new) 5 Plastic
2 Sack, woven HDPE (second hand) 6 Sack with plastic lining
3 Sack, PP (new) 7 Woven basket
4 Sack, PP (second hand) 8 Others: _____________________
3. What sizes of packing are available? SELLSIZE
1 40 kgs 3 54 kgs
2 50 kgs 4 Others: _____________________
4. What packaging material is/are used by the buyer when buying the raw salt? BUYPACK
1 None/dumped on transportation 6 Plastic, LDPE
2 Sack, woven HDPE (new) 7 Sack with plastic lining
3 Sack, woven HDPE (second hand) 8 Woven basket
4 Sack, PP (new) 9 Others: _____________________
5 Sack, PP (second hand)
3. What sizes of packing are available? BUYSIZE
1 40 kgs 3 54 kgs
2 50 kgs 4 Others: _____________________
5. Does the packaging contains the following information:
Company name YES NO RAWNAME
Address/Contact nos. YES NO RAWADD
Manufacturing date YES NO RAWMNFC
6. Were samples of the packaging shown?
YES NO VERIFYPACK
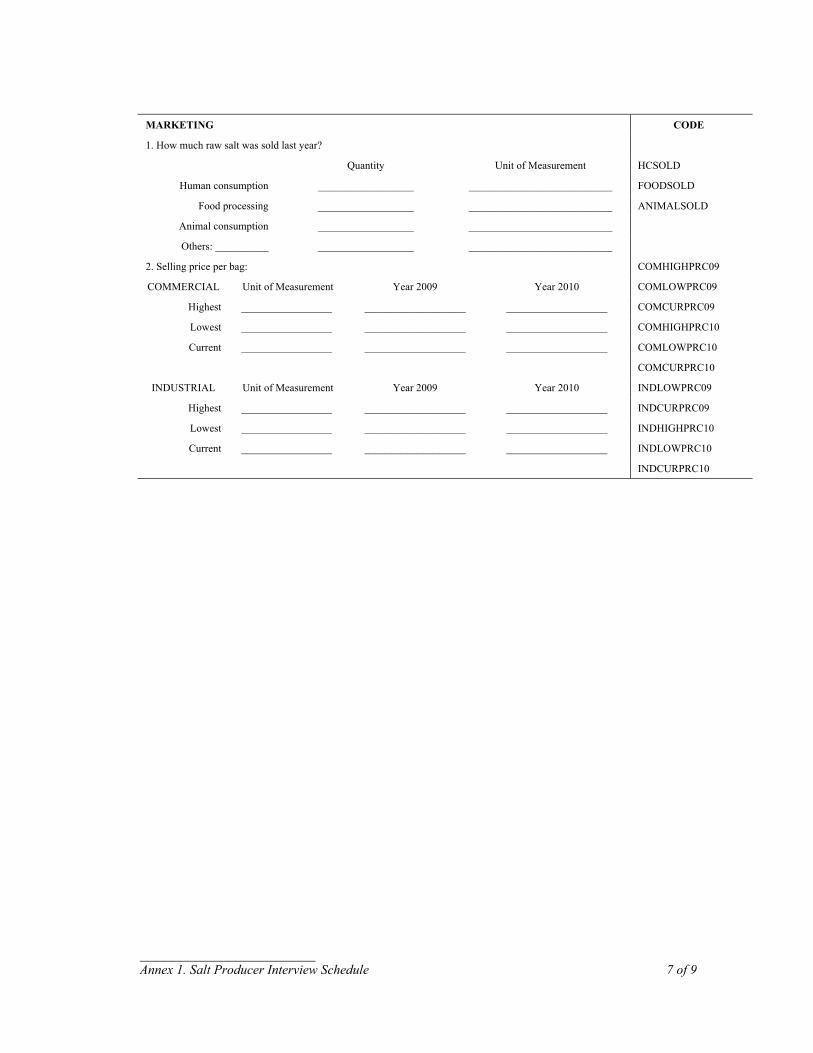
______________________ Annex 1. Salt Producer Interview Schedule 7 of 9
MARKETING CODE
1. How much raw salt was sold last year?
Quantity Unit of Measurement HCSOLD
Human consumption __________________ ___________________________ FOODSOLD
Food processing __________________ ___________________________ ANIMALSOLD
Animal consumption __________________ ___________________________
Others: __________ __________________ ___________________________
2. Selling price per bag: COMHIGHPRC09
COMMERCIAL Unit of Measurement Year 2009 Year 2010 COMLOWPRC09
Highest _________________ ___________________ ___________________ COMCURPRC09
Lowest _________________ ___________________ ___________________ COMHIGHPRC10
Current _________________ ___________________ ___________________ COMLOWPRC10
COMCURPRC10
INDUSTRIAL Unit of Measurement Year 2009 Year 2010 INDLOWPRC09
Highest _________________ ___________________ ___________________ INDCURPRC09
Lowest _________________ ___________________ ___________________ INDHIGHPRC10
Current _________________ ___________________ ___________________ INDLOWPRC10
INDCURPRC10
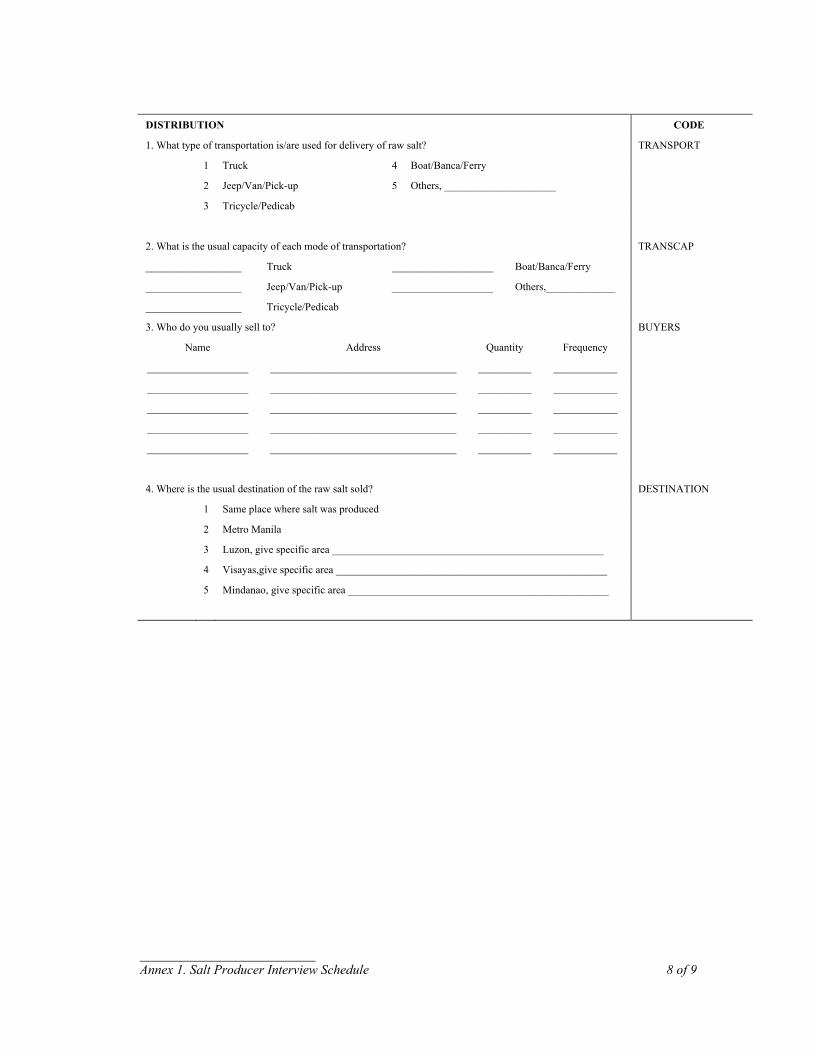
______________________ Annex 1. Salt Producer Interview Schedule 8 of 9
DISTRIBUTION CODE
1. What type of transportation is/are used for delivery of raw salt? TRANSPORT
1 Truck 4 Boat/Banca/Ferry
2 Jeep/Van/Pick-up 5 Others, _____________________
3 Tricycle/Pedicab
2. What is the usual capacity of each mode of transportation? TRANSCAP
__________________ Truck ___________________ Boat/Banca/Ferry
__________________ Jeep/Van/Pick-up ___________________ Others,_____________
__________________ Tricycle/Pedicab
3. Who do you usually sell to? BUYERS
Name Address Quantity Frequency
___________________ ___________________________________ __________ ____________
___________________ ___________________________________ __________ ____________
___________________ ___________________________________ __________ ____________
___________________ ___________________________________ __________ ____________
___________________ ___________________________________ __________ ____________
4. Where is the usual destination of the raw salt sold? DESTINATION
1 Same place where salt was produced
2 Metro Manila
3 Luzon, give specific area ___________________________________________________
4 Visayas,give specific area ___________________________________________________
5 Mindanao, give specific area _________________________________________________

______________________ Annex 1. Salt Producer Interview Schedule 9 of 9
C. SALT IODIZATION PRACTICES CODE
1. Do you iodize raw salt?
YES, go to no. 2 NO, go to no 6. IODIZED
2. What year did the company start iodizing raw salt? _______________________ YEARIS
3. Are you still iodizing raw salt?
YES, go to no. 4 NO, go to no. 5 PRODIS
4. If yes, how long has the company been iodizing raw salt? _______________________ LONGIS
Ask the reason if there is gap between the start year of iodization and current year. Write reason below.
________________________________________________________________________________________
________________________________________________________________________________________
________________________________________________________________________________________
5. If no, what year did you stop iodizing raw salt? ______________________________ LENGTH
6. If no, who does the iodization of the raw salt? OUTSIDEIS
Name Address
___________________________ ___________________________________________________________
___________________________ ___________________________________________________________
___________________________ ___________________________________________________________
___________________________ ___________________________________________________________
Proceed to QA/QC Questionnaire if presently iodizing raw salt or selling iodized salt. If not iodizing
raw salt or selling iodized salt, proceed to the NEEDS ASSESSMENT question below.
NEEDS ASSESSMENT CODE
1. What assistance do you need to help improve your business? ASSISTANCE
(ie, assistance with marketing, training acquisition, financing consultancy and product development)
________________________________________________________________________________________
________________________________________________________________________________________
________________________________________________________________________________________
------------------------------------- END OF INTERVIEW ----------------------------------------
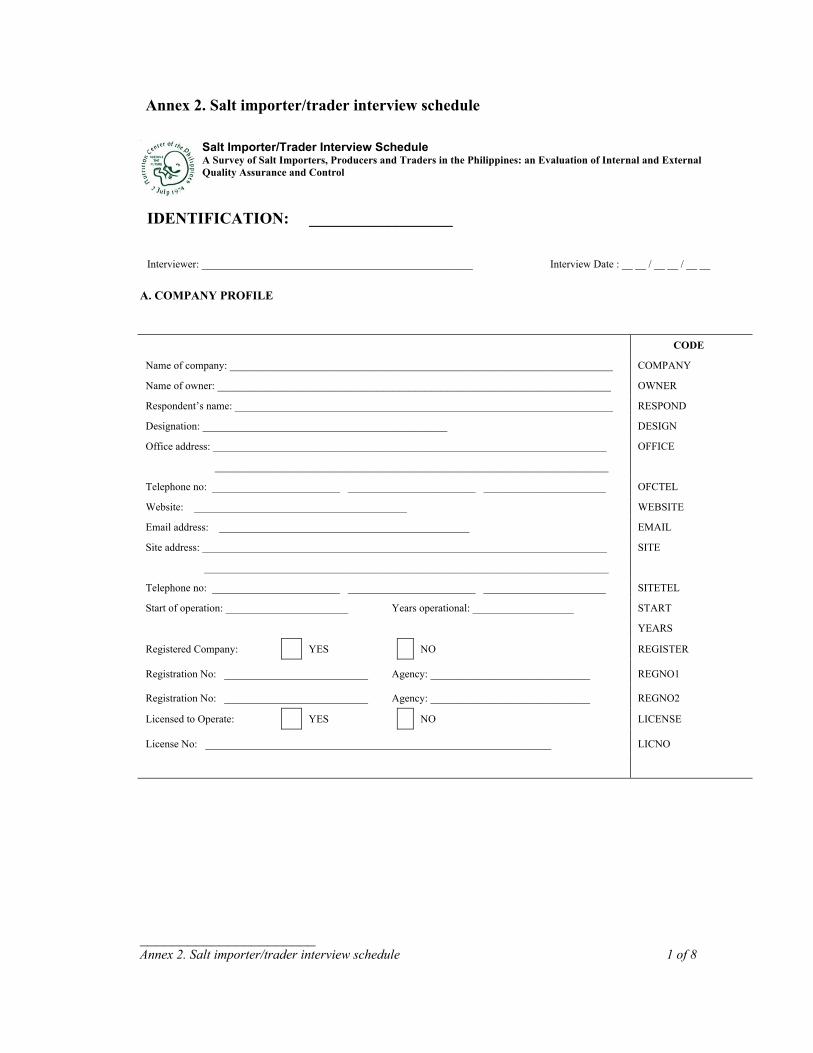
______________________ Annex 2. Salt importer/trader interview schedule 1 of 8
Annex 2. Salt importer/trader interview schedule Salt Importer/Trader Interview Schedule
A Survey of Salt Importers, Producers and Traders in the Philippines: an Evaluation of Internal and External Quality Assurance and Control
IDENTIFICATION: __________________
Interviewer: ___________________________________________________
Interview Date : __ __ / __ __ / __ __
A. COMPANY PROFILE
CODE
Name of company: ________________________________________________________________________ COMPANY
Name of owner: __________________________________________________________________________ OWNER
Respondent’s name: _______________________________________________________________________ RESPOND
Designation: ______________________________________________ DESIGN
Office address: __________________________________________________________________________ OFFICE
__________________________________________________________________________
Telephone no: ________________________ ________________________ _______________________ OFCTEL
Website: ________________________________________ WEBSITE
Email address: _______________________________________________ EMAIL
Site address: ____________________________________________________________________________ SITE
____________________________________________________________________________
Telephone no: ________________________ ________________________ _______________________ SITETEL
Start of operation: _______________________ Years operational: ___________________ START
YEARS
Registered Company: YES NO REGISTER
Registration No: ___________________________ Agency: ______________________________ REGNO1
Registration No: ___________________________ Agency: ______________________________ REGNO2
Licensed to Operate: YES NO LICENSE
License No: _________________________________________________________________ LICNO

______________________ Annex 2. Salt importer/trader interview schedule 2 of 8
EMPLOYEE PROFILE CODE
1. Total number of employees including company head/owner: ______________________ EMPLOYEE
2. Indicate total number of employees per category then ask for the information below:
Executive: ___________ POSITION
Position Employed Qualification Employment duration
NEEDED
___________________________ _____ ________________________________ ___________ EMPLOYED
___________________________ _____ ________________________________ ___________ QLFICATION
___________________________ _____ ________________________________ ___________ DURATION
___________________________ _____ ________________________________ ___________
___________________________ _____ ________________________________ ___________
___________________________ _____ ________________________________ ___________
___________________________ _____ ________________________________ ___________
___________________________ _____ ________________________________ ___________
___________________________ _____ ________________________________ ___________
___________________________ _____ ________________________________ ___________
___________________________ _____ ________________________________ ___________
___________________________ _____ ________________________________ ___________
Remarks on Employment Profile
_________________________________________________________________________________________
_________________________________________________________________________________________
_________________________________________________________________________________________
_________________________________________________________________________________________
_________________________________________________________________________________________
_________________________________________________________________________________________
_________________________________________________________________________________________
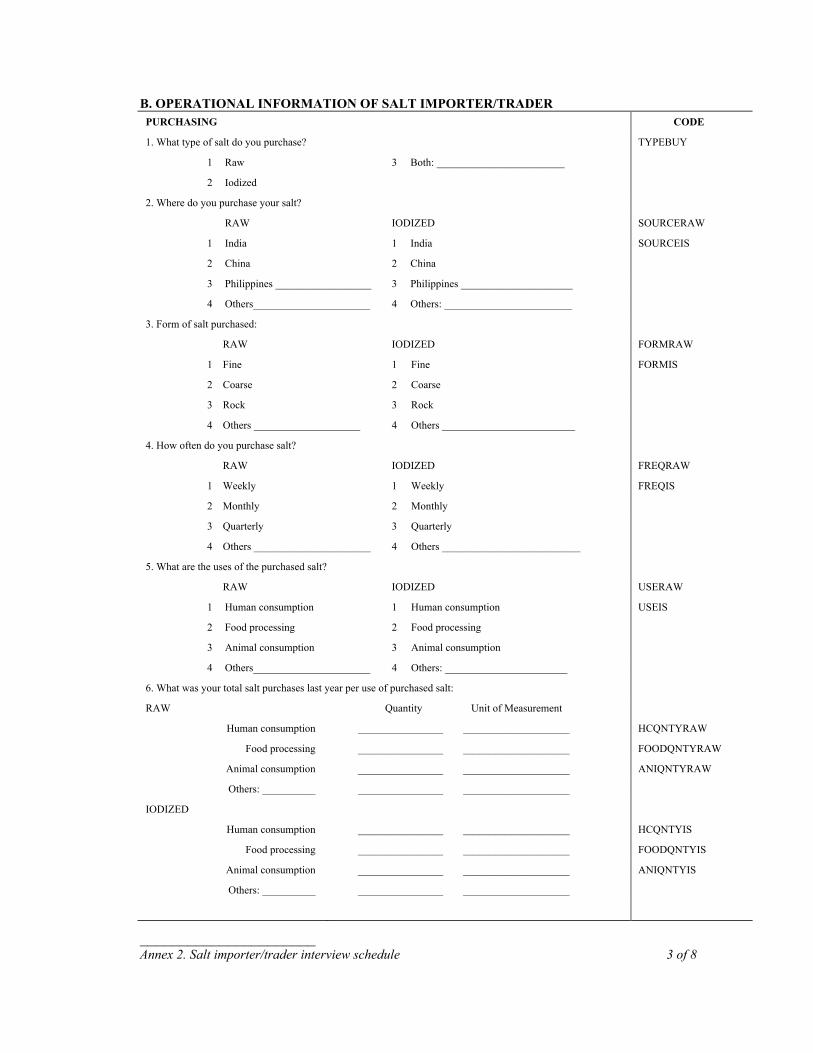
______________________ Annex 2. Salt importer/trader interview schedule 3 of 8
B. OPERATIONAL INFORMATION OF SALT IMPORTER/TRADER PURCHASING CODE
1. What type of salt do you purchase? TYPEBUY
1 Raw 3 Both: ________________________
2 Iodized
2. Where do you purchase your salt?
RAW IODIZED SOURCERAW
1 India 1 India SOURCEIS
2 China 2 China
3 Philippines __________________ 3 Philippines _____________________
4 Others______________________ 4 Others: ________________________
3. Form of salt purchased:
RAW IODIZED FORMRAW
1 Fine 1 Fine FORMIS
2 Coarse 2 Coarse
3 Rock 3 Rock
4 Others ____________________ 4 Others _________________________
4. How often do you purchase salt?
RAW IODIZED FREQRAW
1 Weekly 1 Weekly FREQIS
2 Monthly 2 Monthly
3 Quarterly 3 Quarterly
4 Others ______________________ 4 Others __________________________
5. What are the uses of the purchased salt?
RAW IODIZED USERAW
1 Human consumption 1 Human consumption USEIS
2 Food processing 2 Food processing
3 Animal consumption 3 Animal consumption
4 Others______________________ 4 Others: _______________________
6. What was your total salt purchases last year per use of purchased salt:
RAW Quantity Unit of Measurement
Human consumption ________________ ____________________ HCQNTYRAW
Food processing ________________ ____________________ FOODQNTYRAW
Animal consumption ________________ ____________________ ANIQNTYRAW
Others: __________ ________________ ____________________
IODIZED
Human consumption ________________ ____________________ HCQNTYIS
Food processing ________________ ____________________ FOODQNTYIS
Animal consumption ________________ ____________________ ANIQNTYIS
Others: __________ ________________ ____________________
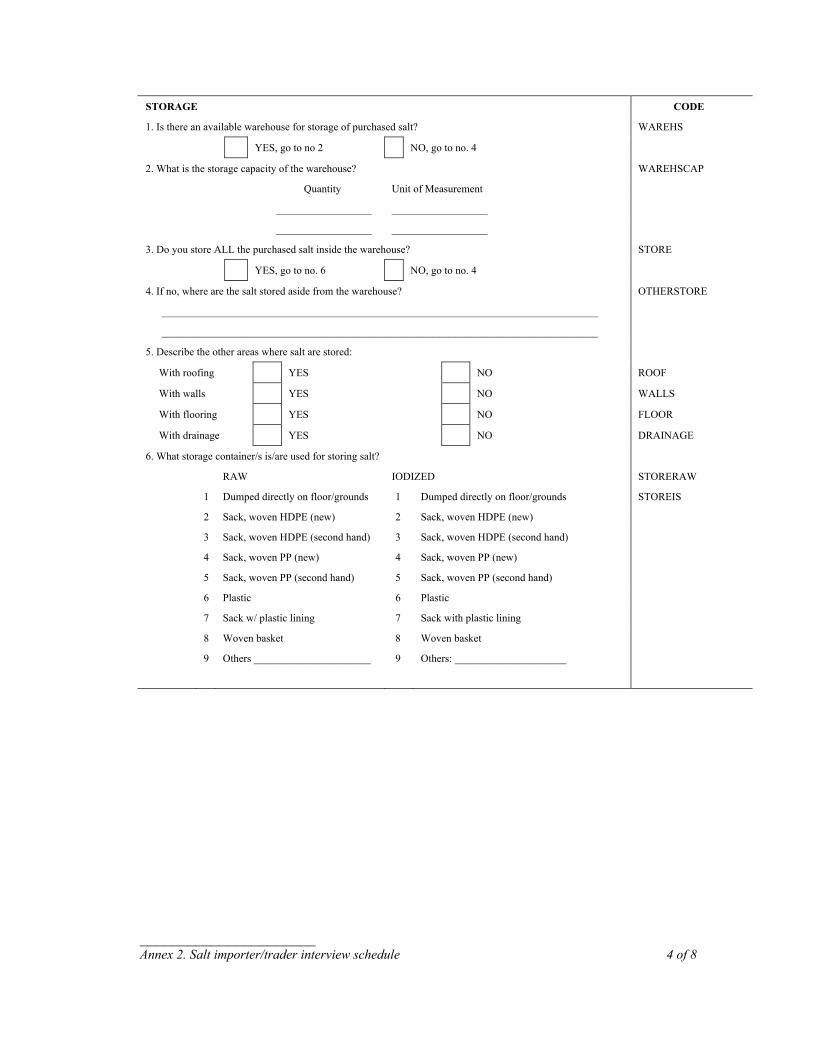
______________________ Annex 2. Salt importer/trader interview schedule 4 of 8
STORAGE CODE
1. Is there an available warehouse for storage of purchased salt? WAREHS
YES, go to no 2 NO, go to no. 4
2. What is the storage capacity of the warehouse? WAREHSCAP
Quantity Unit of Measurement
__________________ __________________
__________________ __________________
3. Do you store ALL the purchased salt inside the warehouse? STORE
YES, go to no. 6 NO, go to no. 4
4. If no, where are the salt stored aside from the warehouse? OTHERSTORE
__________________________________________________________________________________
__________________________________________________________________________________
5. Describe the other areas where salt are stored:
With roofing YES NO ROOF
With walls YES NO WALLS
With flooring YES NO FLOOR
With drainage YES NO DRAINAGE
6. What storage container/s is/are used for storing salt?
RAW IODIZED STORERAW
1 Dumped directly on floor/grounds 1 Dumped directly on floor/grounds STOREIS
2 Sack, woven HDPE (new) 2 Sack, woven HDPE (new)
3 Sack, woven HDPE (second hand) 3 Sack, woven HDPE (second hand)
4 Sack, woven PP (new) 4 Sack, woven PP (new)
5 Sack, woven PP (second hand) 5 Sack, woven PP (second hand)
6 Plastic 6 Plastic
7 Sack w/ plastic lining 7 Sack with plastic lining
8 Woven basket 8 Woven basket
9 Others ______________________ 9 Others: _____________________
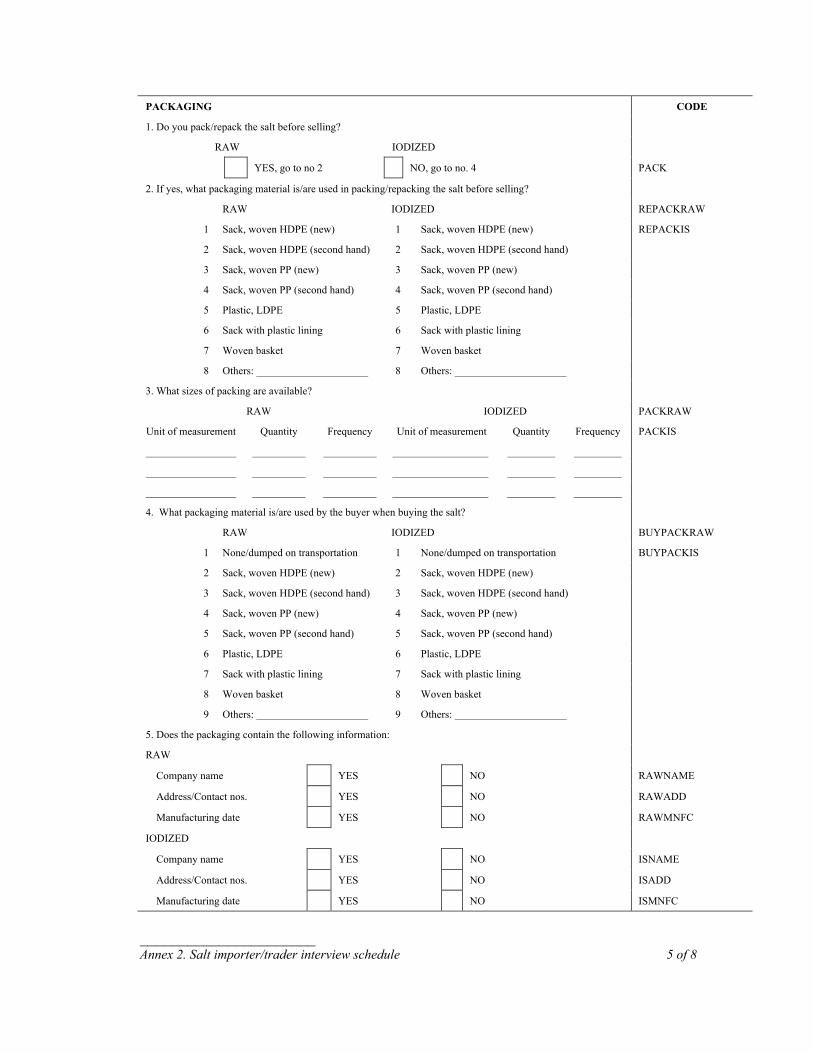
______________________ Annex 2. Salt importer/trader interview schedule 5 of 8
PACKAGING CODE
1. Do you pack/repack the salt before selling?
RAW IODIZED
YES, go to no 2 NO, go to no. 4 PACK
2. If yes, what packaging material is/are used in packing/repacking the salt before selling?
RAW IODIZED REPACKRAW
1 Sack, woven HDPE (new) 1 Sack, woven HDPE (new) REPACKIS
2 Sack, woven HDPE (second hand) 2 Sack, woven HDPE (second hand)
3 Sack, woven PP (new) 3 Sack, woven PP (new)
4 Sack, woven PP (second hand) 4 Sack, woven PP (second hand)
5 Plastic, LDPE 5 Plastic, LDPE
6 Sack with plastic lining 6 Sack with plastic lining
7 Woven basket 7 Woven basket
8 Others: _____________________ 8 Others: _____________________
3. What sizes of packing are available?
RAW IODIZED PACKRAW
Unit of measurement Quantity Frequency Unit of measurement Quantity Frequency PACKIS
_________________ __________ __________ __________________ _________ _________
_________________ __________ __________ __________________ _________ _________
_________________ __________ __________ __________________ _________ _________
4. What packaging material is/are used by the buyer when buying the salt?
RAW IODIZED BUYPACKRAW
1 None/dumped on transportation 1 None/dumped on transportation BUYPACKIS
2 Sack, woven HDPE (new) 2 Sack, woven HDPE (new)
3 Sack, woven HDPE (second hand) 3 Sack, woven HDPE (second hand)
4 Sack, woven PP (new) 4 Sack, woven PP (new)
5 Sack, woven PP (second hand) 5 Sack, woven PP (second hand)
6 Plastic, LDPE 6 Plastic, LDPE
7 Sack with plastic lining 7 Sack with plastic lining
8 Woven basket 8 Woven basket
9 Others: _____________________ 9 Others: _____________________
5. Does the packaging contain the following information:
RAW
Company name YES NO RAWNAME
Address/Contact nos. YES NO RAWADD
Manufacturing date YES NO RAWMNFC
IODIZED
Company name YES NO ISNAME
Address/Contact nos. YES NO ISADD
Manufacturing date YES NO ISMNFC

______________________ Annex 2. Salt importer/trader interview schedule 6 of 8
MARKETING CODE
1. Quantity of purchased salt sold last year:
RAW Quantity Unit of Measurement
Human consumption ________________ ____________________ SOLDRAWHC
Food processing ________________ ____________________ SOLDRAWFOOD
Animal consumption ________________ ____________________ SOLDRAWANIMAL
Others: __________ ________________ ____________________
IODIZED
Human consumption ________________ ____________________ SOLDISHC
Food processing ________________ ____________________ SOLDISFOOD
Animal consumption ________________ ____________________ SOLDISANIMAL
Others: __________ ________________ ____________________
2. Selling price per bag/pack:
RAW HIGHPRCRAW
COMMERCIAL Unit of Measurement Year 2009 Year 2010 LOWPRICERAW
Highest _________________ ___________________ ___________________ CURPRICERAW
Lowest _________________ ___________________ ___________________
Current _________________ ___________________ ___________________
INDUSTRIAL Unit of Measurement Year 2009 Year 2010
Highest _________________ ___________________ ___________________
Lowest _________________ ___________________ ___________________
Current _________________ ___________________ ___________________
IODIZED
Unit of Measurement Year 2009 Year 2010 HIGHPRICEIS
Highest _________________ ___________________ ___________________ LOWPRICEIS
Lowest _________________ ___________________ ___________________ CURPRICEIS
Current _________________ ___________________ ___________________
Unit of Measurement Year 2009 Year 2010
Highest _________________ ___________________ ___________________
Lowest _________________ ___________________ ___________________
Current _________________ ___________________ ___________________
Unit of Measurement Year 2009 Year 2010
Highest _________________ ___________________ ___________________
Lowest _________________ ___________________ ___________________
Current _________________ ___________________ ___________________
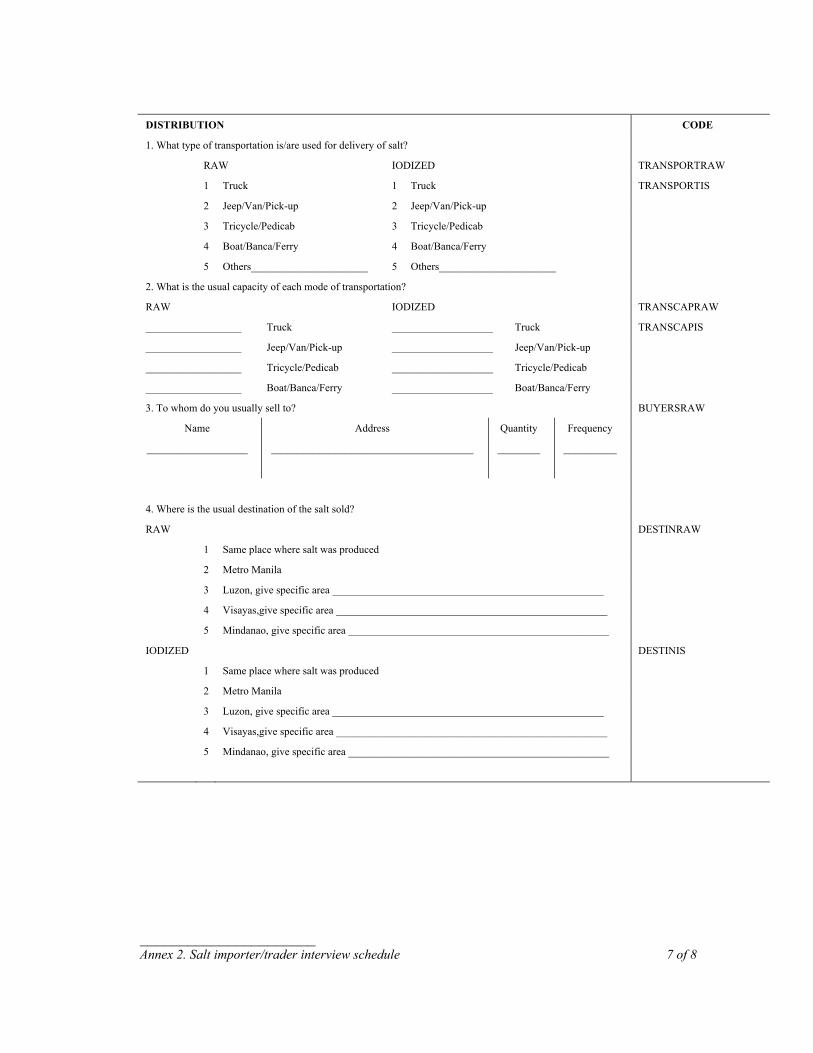
______________________ Annex 2. Salt importer/trader interview schedule 7 of 8
DISTRIBUTION CODE
1. What type of transportation is/are used for delivery of salt?
RAW IODIZED TRANSPORTRAW
1 Truck 1 Truck TRANSPORTIS
2 Jeep/Van/Pick-up 2 Jeep/Van/Pick-up
3 Tricycle/Pedicab 3 Tricycle/Pedicab
4 Boat/Banca/Ferry 4 Boat/Banca/Ferry
5 Others______________________ 5 Others______________________
2. What is the usual capacity of each mode of transportation?
RAW IODIZED TRANSCAPRAW
__________________ Truck ___________________ Truck TRANSCAPIS
__________________ Jeep/Van/Pick-up ___________________ Jeep/Van/Pick-up
__________________ Tricycle/Pedicab ___________________ Tricycle/Pedicab
__________________ Boat/Banca/Ferry ___________________ Boat/Banca/Ferry
3. To whom do you usually sell to? BUYERSRAW
Name Address Quantity Frequency
___________________ ______________________________________ ________ __________
4. Where is the usual destination of the salt sold?
RAW DESTINRAW
1 Same place where salt was produced
2 Metro Manila
3 Luzon, give specific area ___________________________________________________
4 Visayas,give specific area ___________________________________________________
5 Mindanao, give specific area _________________________________________________
IODIZED DESTINIS
1 Same place where salt was produced
2 Metro Manila
3 Luzon, give specific area ___________________________________________________
4 Visayas,give specific area ___________________________________________________
5 Mindanao, give specific area _________________________________________________
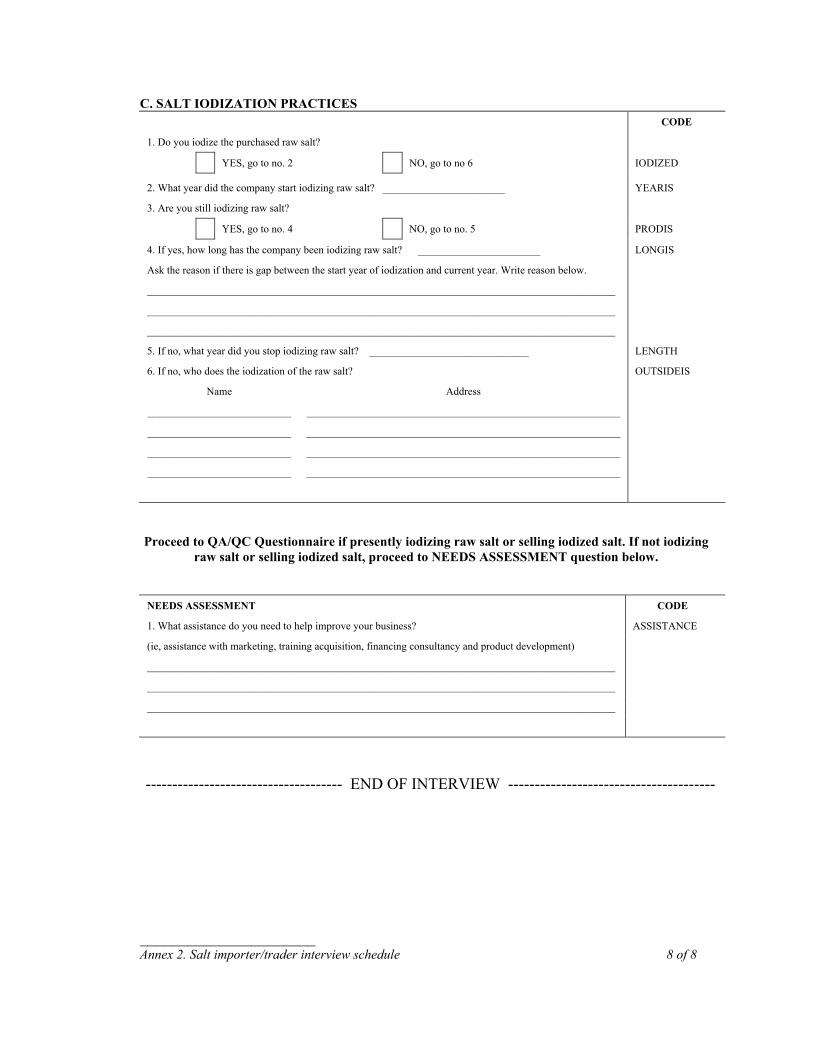
______________________ Annex 2. Salt importer/trader interview schedule 8 of 8
C. SALT IODIZATION PRACTICES CODE
1. Do you iodize the purchased raw salt?
YES, go to no. 2 NO, go to no 6 IODIZED
2. What year did the company start iodizing raw salt? _______________________ YEARIS
3. Are you still iodizing raw salt?
YES, go to no. 4 NO, go to no. 5 PRODIS
4. If yes, how long has the company been iodizing raw salt? _______________________ LONGIS
Ask the reason if there is gap between the start year of iodization and current year. Write reason below.
________________________________________________________________________________________
________________________________________________________________________________________
________________________________________________________________________________________
5. If no, what year did you stop iodizing raw salt? ______________________________ LENGTH
6. If no, who does the iodization of the raw salt? OUTSIDEIS
Name Address
___________________________ ___________________________________________________________
___________________________ ___________________________________________________________
___________________________ ___________________________________________________________
___________________________ ___________________________________________________________
Proceed to QA/QC Questionnaire if presently iodizing raw salt or selling iodized salt. If not iodizing
raw salt or selling iodized salt, proceed to NEEDS ASSESSMENT question below. NEEDS ASSESSMENT CODE
1. What assistance do you need to help improve your business? ASSISTANCE
(ie, assistance with marketing, training acquisition, financing consultancy and product development)
________________________________________________________________________________________
________________________________________________________________________________________
________________________________________________________________________________________
------------------------------------- END OF INTERVIEW ---------------------------------------
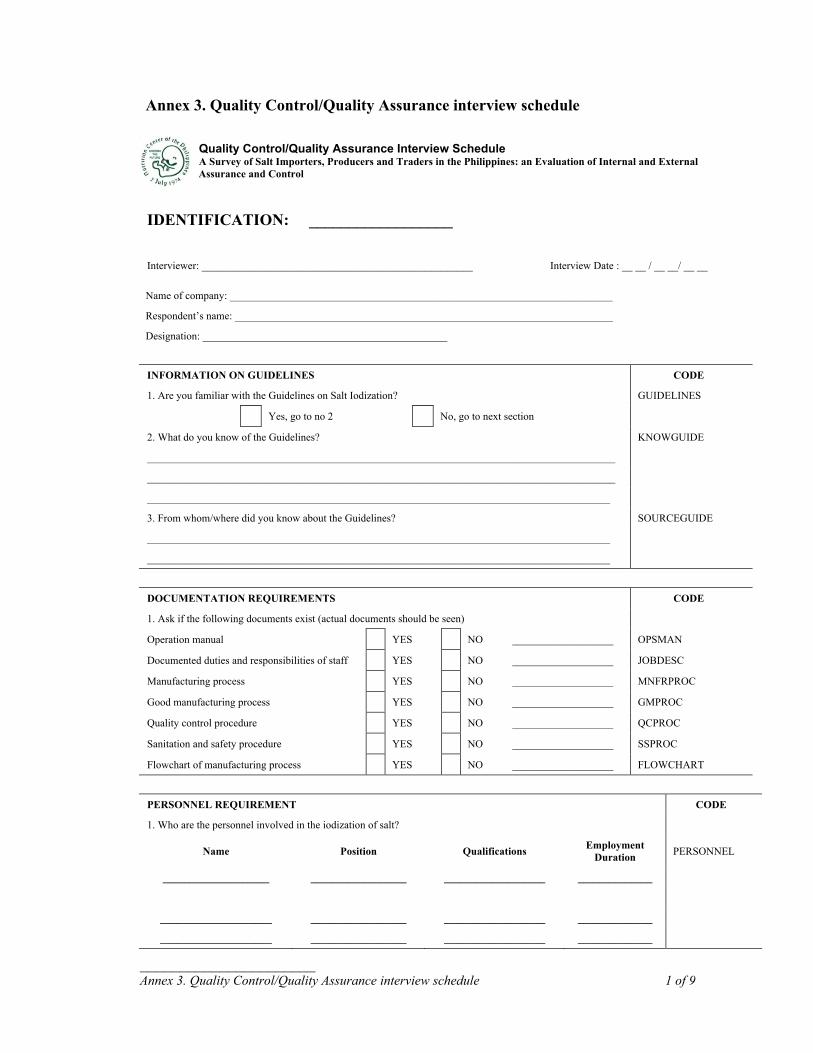
______________________ Annex 3. Quality Control/Quality Assurance interview schedule 1 of 9
Annex 3. Quality Control/Quality Assurance interview schedule Quality Control/Quality Assurance Interview Schedule A Survey of Salt Importers, Producers and Traders in the Philippines: an Evaluation of Internal and External Quality Assurance and Control
IDENTIFICATION: __________________
Interviewer: ___________________________________________________
Interview Date : __ __ / __ __/ __ __
Name of company: ________________________________________________________________________
Respondent’s name: _______________________________________________________________________
Designation: ______________________________________________
INFORMATION ON GUIDELINES CODE
1. Are you familiar with the Guidelines on Salt Iodization? GUIDELINES
Yes, go to no 2 No, go to next section
2. What do you know of the Guidelines? KNOWGUIDE
________________________________________________________________________________________
________________________________________________________________________________________
_______________________________________________________________________________________
3. From whom/where did you know about the Guidelines? SOURCEGUIDE
_______________________________________________________________________________________
_______________________________________________________________________________________
DOCUMENTATION REQUIREMENTS CODE
1. Ask if the following documents exist (actual documents should be seen)
Operation manual YES NO ___________________ OPSMAN
Documented duties and responsibilities of staff YES NO ___________________ JOBDESC
Manufacturing process YES NO ___________________ MNFRPROC
Good manufacturing process YES NO ___________________ GMPROC
Quality control procedure YES NO ___________________ QCPROC
Sanitation and safety procedure YES NO ___________________ SSPROC
Flowchart of manufacturing process YES NO ___________________ FLOWCHART
PERSONNEL REQUIREMENT CODE
1. Who are the personnel involved in the iodization of salt?
Name Position Qualifications Employment Duration PERSONNEL
____________________ __________________ ___________________ ______________
_____________________ __________________ ___________________ ______________
_____________________ __________________ ___________________ ______________
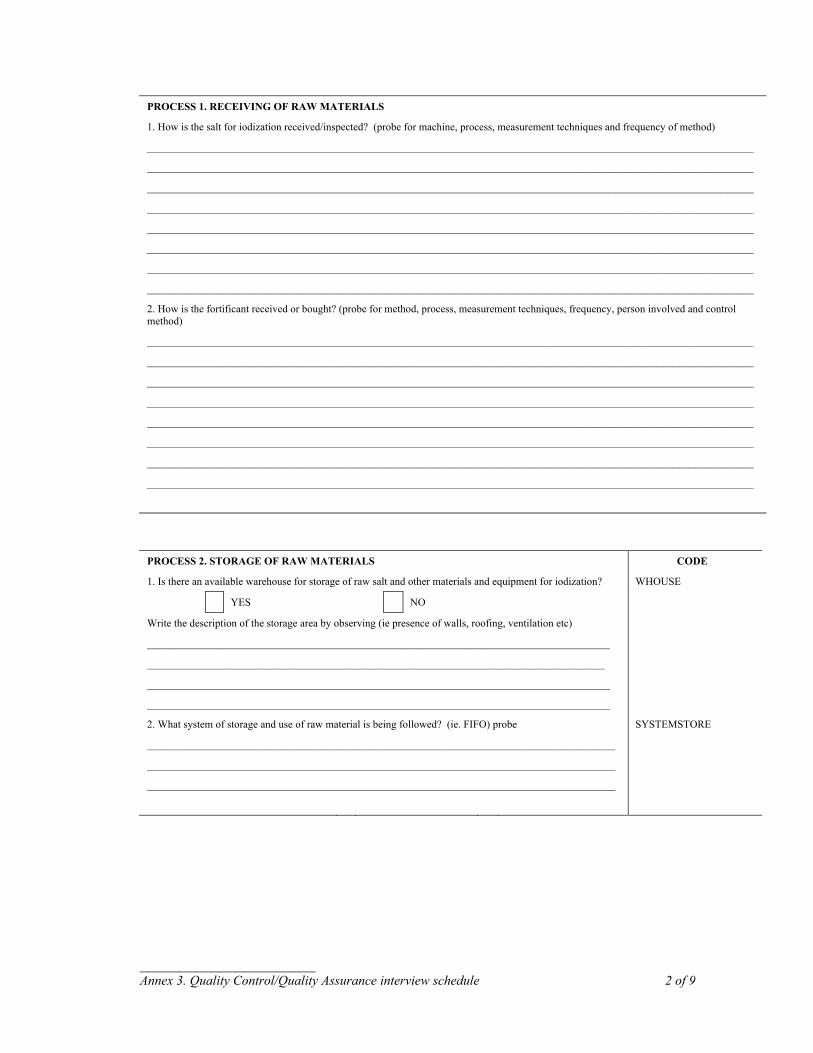
______________________ Annex 3. Quality Control/Quality Assurance interview schedule 2 of 9
PROCESS 1. RECEIVING OF RAW MATERIALS
1. How is the salt for iodization received/inspected? (probe for machine, process, measurement techniques and frequency of method)
__________________________________________________________________________________________________________________
__________________________________________________________________________________________________________________
__________________________________________________________________________________________________________________
__________________________________________________________________________________________________________________
__________________________________________________________________________________________________________________
__________________________________________________________________________________________________________________
__________________________________________________________________________________________________________________
__________________________________________________________________________________________________________________
2. How is the fortificant received or bought? (probe for method, process, measurement techniques, frequency, person involved and control method)
__________________________________________________________________________________________________________________
__________________________________________________________________________________________________________________
__________________________________________________________________________________________________________________
__________________________________________________________________________________________________________________
__________________________________________________________________________________________________________________
__________________________________________________________________________________________________________________
__________________________________________________________________________________________________________________
__________________________________________________________________________________________________________________
PROCESS 2. STORAGE OF RAW MATERIALS CODE
1. Is there an available warehouse for storage of raw salt and other materials and equipment for iodization? WHOUSE
YES NO
Write the description of the storage area by observing (ie presence of walls, roofing, ventilation etc)
_______________________________________________________________________________________
______________________________________________________________________________________
_______________________________________________________________________________________
_______________________________________________________________________________________
2. What system of storage and use of raw material is being followed? (ie. FIFO) probe SYSTEMSTORE
________________________________________________________________________________________
________________________________________________________________________________________
________________________________________________________________________________________
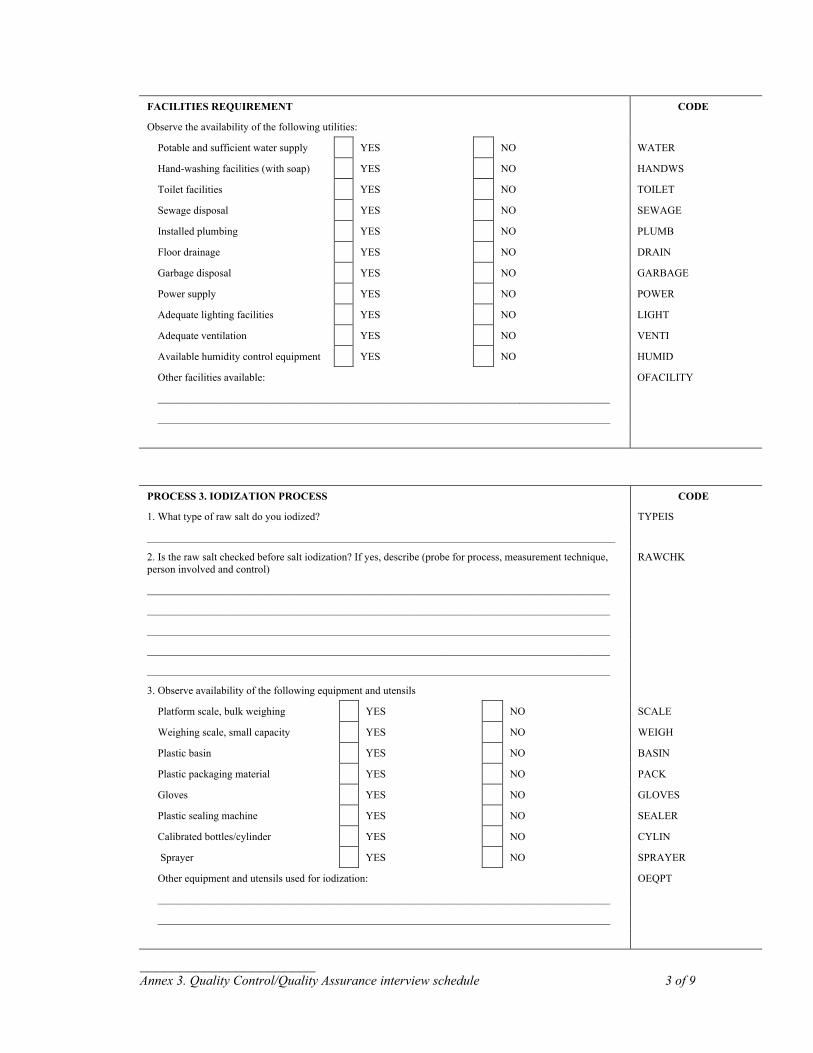
______________________ Annex 3. Quality Control/Quality Assurance interview schedule 3 of 9
FACILITIES REQUIREMENT CODE
Observe the availability of the following utilities:
Potable and sufficient water supply YES NO WATER
Hand-washing facilities (with soap) YES NO HANDWS
Toilet facilities YES NO TOILET
Sewage disposal YES NO SEWAGE
Installed plumbing YES NO PLUMB
Floor drainage YES NO DRAIN
Garbage disposal YES NO GARBAGE
Power supply YES NO POWER
Adequate lighting facilities YES NO LIGHT
Adequate ventilation YES NO VENTI
Available humidity control equipment YES NO HUMID
Other facilities available: OFACILITY
_____________________________________________________________________________________
_____________________________________________________________________________________
PROCESS 3. IODIZATION PROCESS CODE
1. What type of raw salt do you iodized? TYPEIS
________________________________________________________________________________________
2. Is the raw salt checked before salt iodization? If yes, describe (probe for process, measurement technique, person involved and control)
RAWCHK
_______________________________________________________________________________________
_______________________________________________________________________________________
_______________________________________________________________________________________
_______________________________________________________________________________________
_______________________________________________________________________________________
3. Observe availability of the following equipment and utensils
Platform scale, bulk weighing YES NO SCALE
Weighing scale, small capacity YES NO WEIGH
Plastic basin YES NO BASIN
Plastic packaging material YES NO PACK
Gloves YES NO GLOVES
Plastic sealing machine YES NO SEALER
Calibrated bottles/cylinder YES NO CYLIN
Sprayer YES NO SPRAYER
Other equipment and utensils used for iodization: OEQPT
_____________________________________________________________________________________
_____________________________________________________________________________________
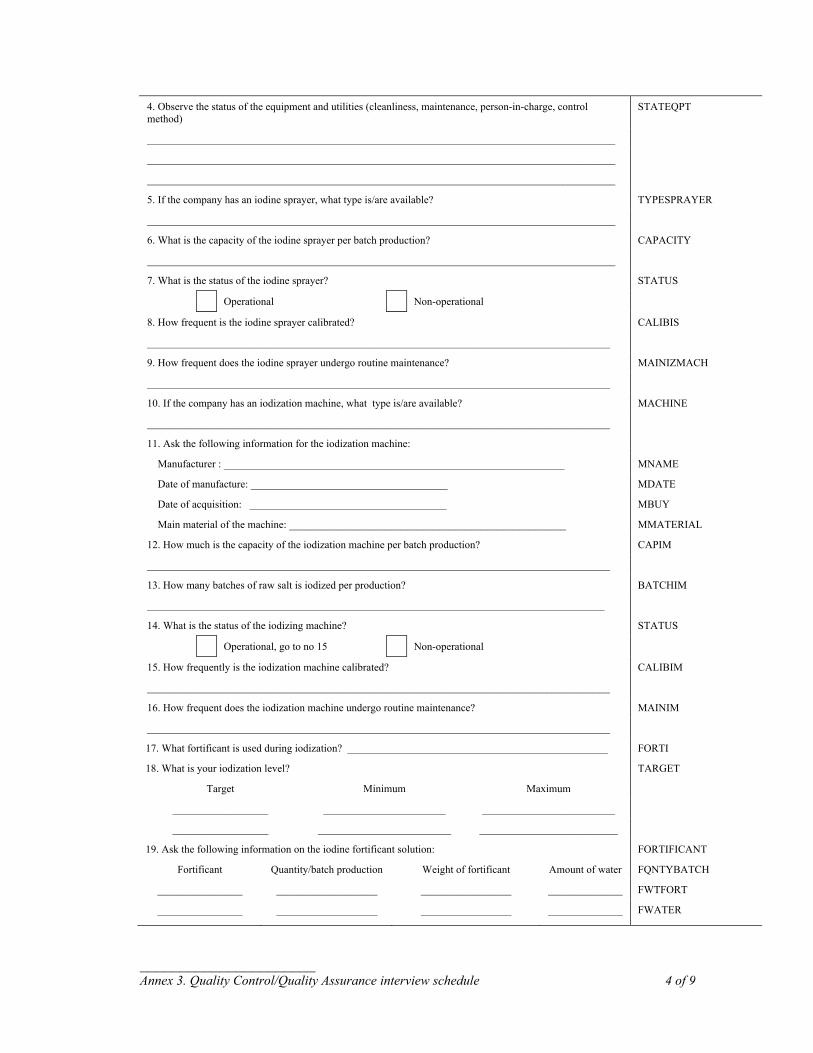
______________________ Annex 3. Quality Control/Quality Assurance interview schedule 4 of 9
4. Observe the status of the equipment and utilities (cleanliness, maintenance, person-in-charge, control method)
STATEQPT
________________________________________________________________________________________
________________________________________________________________________________________
________________________________________________________________________________________
5. If the company has an iodine sprayer, what type is/are available? TYPESPRAYER
________________________________________________________________________________________
6. What is the capacity of the iodine sprayer per batch production? CAPACITY
________________________________________________________________________________________
7. What is the status of the iodine sprayer? STATUS
Operational Non-operational
8. How frequent is the iodine sprayer calibrated? CALIBIS
_______________________________________________________________________________________
9. How frequent does the iodine sprayer undergo routine maintenance? MAINIZMACH
_______________________________________________________________________________________
10. If the company has an iodization machine, what type is/are available? MACHINE
_______________________________________________________________________________________
11. Ask the following information for the iodization machine:
Manufacturer : ________________________________________________________________ MNAME
Date of manufacture: _____________________________________ MDATE
Date of acquisition: _____________________________________ MBUY
Main material of the machine: ____________________________________________________ MMATERIAL
12. How much is the capacity of the iodization machine per batch production? CAPIM
_______________________________________________________________________________________
13. How many batches of raw salt is iodized per production? BATCHIM
______________________________________________________________________________________
14. What is the status of the iodizing machine? STATUS
Operational, go to no 15 Non-operational
15. How frequently is the iodization machine calibrated? CALIBIM
_______________________________________________________________________________________
16. How frequent does the iodization machine undergo routine maintenance? MAINIM
_______________________________________________________________________________________
17. What fortificant is used during iodization? _________________________________________________ FORTI
18. What is your iodization level? TARGET
Target Minimum Maximum
__________________ _______________________ _________________________
__________________ _________________________ __________________________
19. Ask the following information on the iodine fortificant solution: FORTIFICANT
Fortificant Quantity/batch production Weight of fortificant Amount of water FQNTYBATCH
________________ ___________________ _________________ ______________ FWTFORT
________________ ___________________ _________________ ______________ FWATER
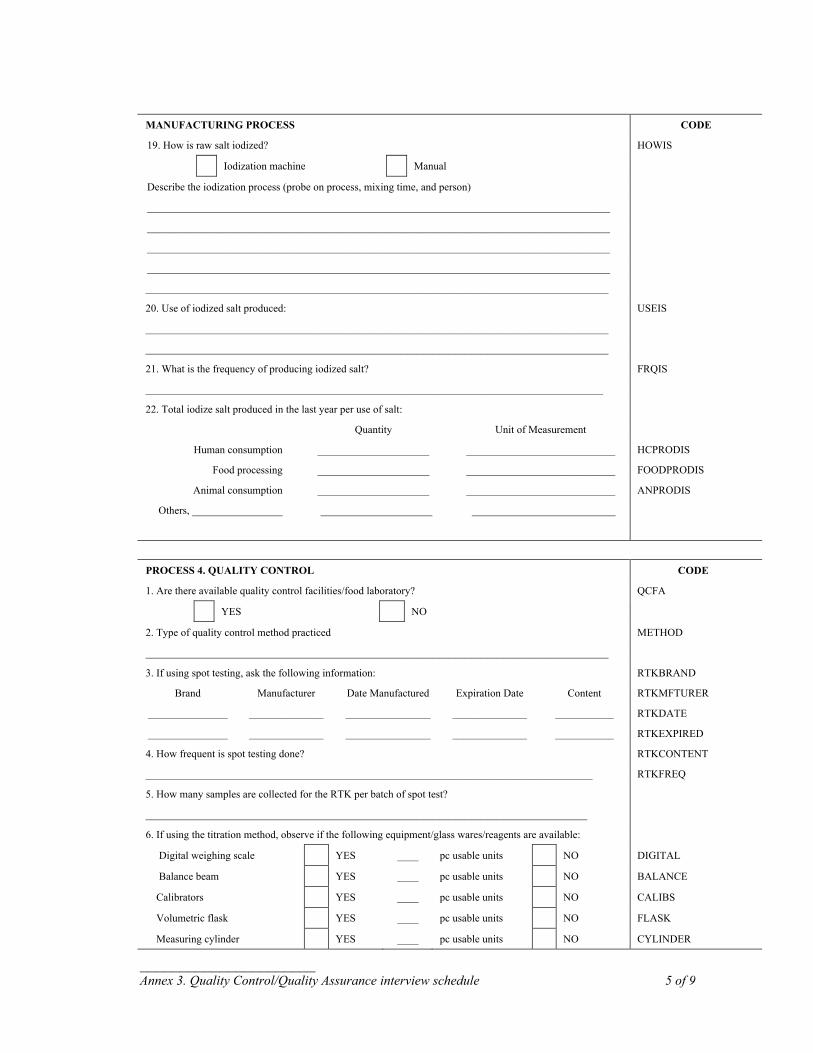
______________________ Annex 3. Quality Control/Quality Assurance interview schedule 5 of 9
MANUFACTURING PROCESS CODE
19. How is raw salt iodized? HOWIS
Iodization machine Manual
Describe the iodization process (probe on process, mixing time, and person)
_______________________________________________________________________________________
_______________________________________________________________________________________
_______________________________________________________________________________________
_______________________________________________________________________________________
_______________________________________________________________________________________
20. Use of iodized salt produced: USEIS
_______________________________________________________________________________________
_______________________________________________________________________________________
21. What is the frequency of producing iodized salt? FRQIS
______________________________________________________________________________________
22. Total iodize salt produced in the last year per use of salt:
Quantity Unit of Measurement
Human consumption _____________________ ____________________________ HCPRODIS
Food processing _____________________ ____________________________ FOODPRODIS
Animal consumption _____________________ ____________________________ ANPRODIS
Others, _________________ _____________________ ___________________________
PROCESS 4. QUALITY CONTROL CODE
1. Are there available quality control facilities/food laboratory? QCFA
YES NO
2. Type of quality control method practiced METHOD
_______________________________________________________________________________________
3. If using spot testing, ask the following information: RTKBRAND
Brand Manufacturer Date Manufactured Expiration Date Content RTKMFTURER
_______________ ______________ ________________ ______________ ___________ RTKDATE
_______________ ______________ ________________ ______________ ___________ RTKEXPIRED
4. How frequent is spot testing done? RTKCONTENT
____________________________________________________________________________________ RTKFREQ
5. How many samples are collected for the RTK per batch of spot test?
___________________________________________________________________________________
6. If using the titration method, observe if the following equipment/glass wares/reagents are available:
Digital weighing scale YES ____ pc usable units NO DIGITAL
Balance beam YES ____ pc usable units NO BALANCE
Calibrators YES ____ pc usable units NO CALIBS
Volumetric flask YES ____ pc usable units NO FLASK
Measuring cylinder YES ____ pc usable units NO CYLINDER
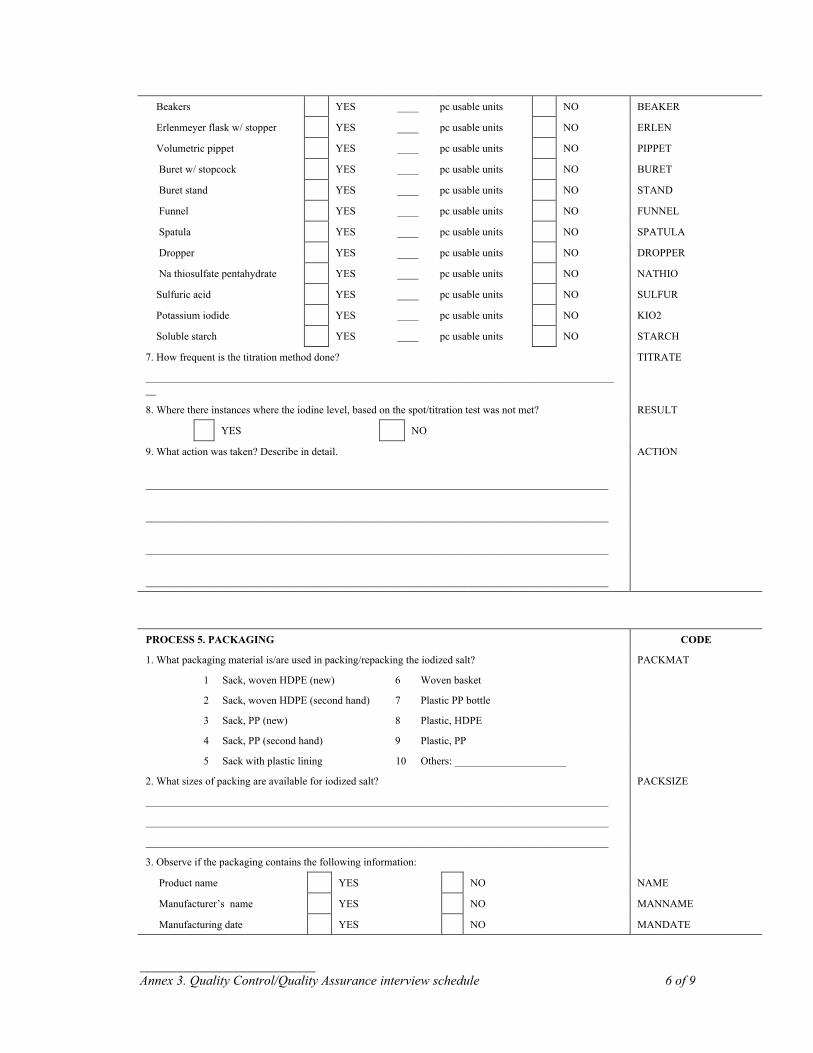
______________________ Annex 3. Quality Control/Quality Assurance interview schedule 6 of 9
Beakers YES ____ pc usable units NO BEAKER
Erlenmeyer flask w/ stopper YES ____ pc usable units NO ERLEN
Volumetric pippet YES ____ pc usable units NO PIPPET
Buret w/ stopcock YES ____ pc usable units NO BURET
Buret stand YES ____ pc usable units NO STAND
Funnel YES ____ pc usable units NO FUNNEL
Spatula YES ____ pc usable units NO SPATULA
Dropper YES ____ pc usable units NO DROPPER
Na thiosulfate pentahydrate YES ____ pc usable units NO NATHIO
Sulfuric acid YES ____ pc usable units NO SULFUR
Potassium iodide YES ____ pc usable units NO KIO2
Soluble starch YES ____ pc usable units NO STARCH
7. How frequent is the titration method done? TITRATE
__________________________________________________________________________________________
8. Where there instances where the iodine level, based on the spot/titration test was not met? RESULT
YES NO
9. What action was taken? Describe in detail. ACTION
_______________________________________________________________________________________
_______________________________________________________________________________________
_______________________________________________________________________________________
_______________________________________________________________________________________
PROCESS 5. PACKAGING CODE
1. What packaging material is/are used in packing/repacking the iodized salt? PACKMAT
1 Sack, woven HDPE (new) 6 Woven basket
2 Sack, woven HDPE (second hand) 7 Plastic PP bottle
3 Sack, PP (new) 8 Plastic, HDPE
4 Sack, PP (second hand) 9 Plastic, PP
5 Sack with plastic lining 10 Others: _____________________
2. What sizes of packing are available for iodized salt? PACKSIZE
_______________________________________________________________________________________
_______________________________________________________________________________________
_______________________________________________________________________________________
3. Observe if the packaging contains the following information:
Product name YES NO NAME
Manufacturer’s name YES NO MANNAME
Manufacturing date YES NO MANDATE
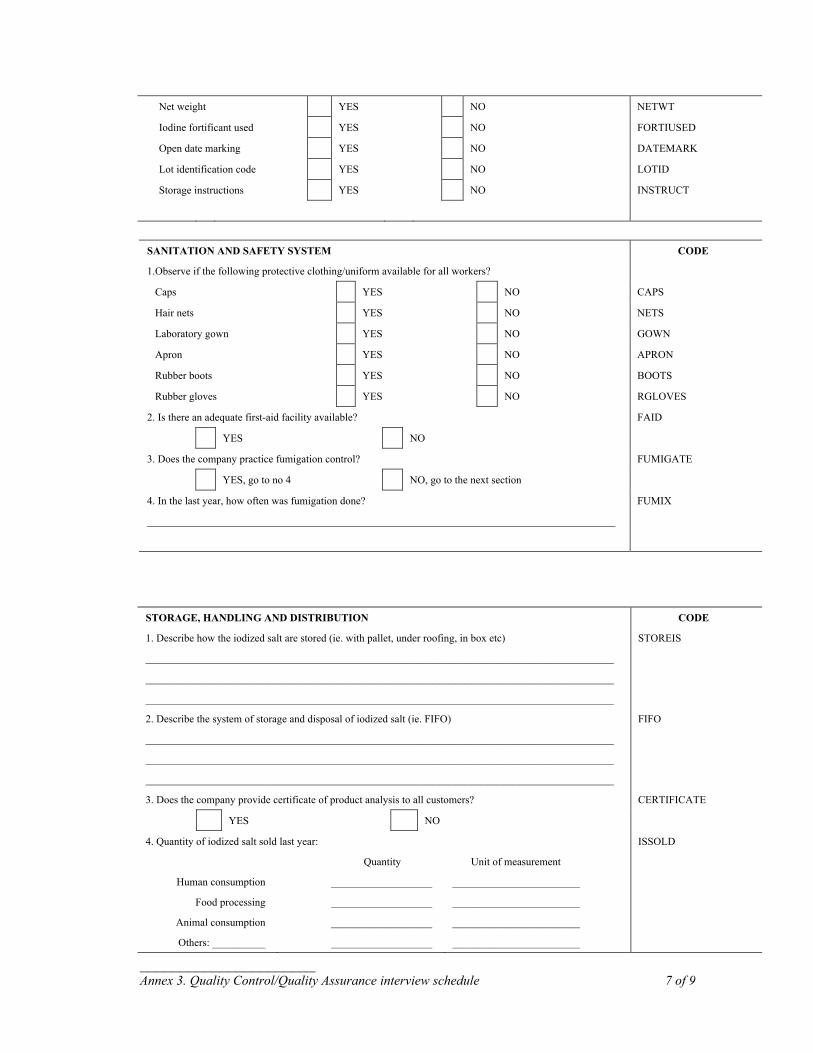
______________________ Annex 3. Quality Control/Quality Assurance interview schedule 7 of 9
Net weight YES NO NETWT
Iodine fortificant used YES NO FORTIUSED
Open date marking YES NO DATEMARK
Lot identification code YES NO LOTID
Storage instructions YES NO INSTRUCT
SANITATION AND SAFETY SYSTEM CODE
1.Observe if the following protective clothing/uniform available for all workers?
Caps YES NO CAPS
Hair nets YES NO NETS
Laboratory gown YES NO GOWN
Apron YES NO APRON
Rubber boots YES NO BOOTS
Rubber gloves YES NO RGLOVES
2. Is there an adequate first-aid facility available? FAID
YES NO
3. Does the company practice fumigation control? FUMIGATE
YES, go to no 4 NO, go to the next section
4. In the last year, how often was fumigation done? FUMIX
________________________________________________________________________________________
STORAGE, HANDLING AND DISTRIBUTION CODE
1. Describe how the iodized salt are stored (ie. with pallet, under roofing, in box etc) STOREIS
________________________________________________________________________________________
________________________________________________________________________________________
________________________________________________________________________________________
2. Describe the system of storage and disposal of iodized salt (ie. FIFO) FIFO
________________________________________________________________________________________
________________________________________________________________________________________
________________________________________________________________________________________
3. Does the company provide certificate of product analysis to all customers? CERTIFICATE
YES NO
4. Quantity of iodized salt sold last year: ISSOLD
Quantity Unit of measurement
Human consumption ___________________ ________________________
Food processing ___________________ ________________________
Animal consumption ___________________ ________________________
Others: __________ ___________________ ________________________
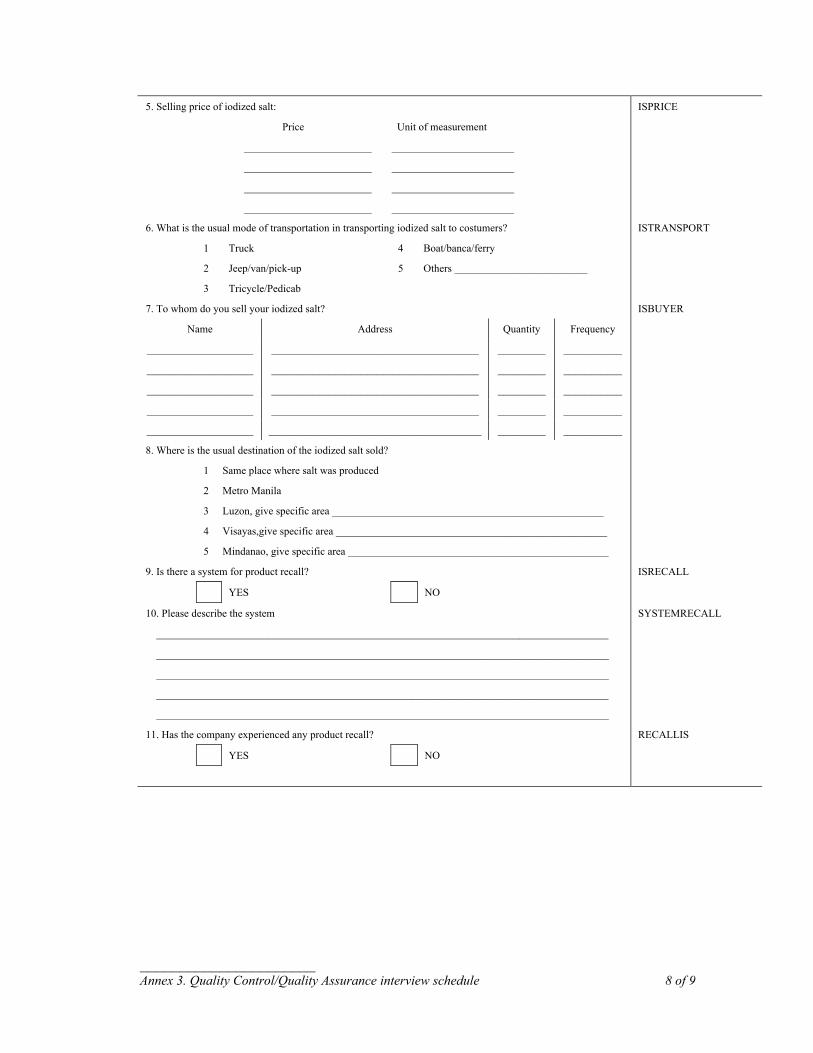
______________________ Annex 3. Quality Control/Quality Assurance interview schedule 8 of 9
5. Selling price of iodized salt: ISPRICE
Price Unit of measurement
________________________ _______________________
________________________ _______________________
________________________ _______________________
________________________ _______________________
6. What is the usual mode of transportation in transporting iodized salt to costumers? ISTRANSPORT
1 Truck 4 Boat/banca/ferry
2 Jeep/van/pick-up 5 Others _________________________
3 Tricycle/Pedicab
7. To whom do you sell your iodized salt? ISBUYER
Name Address Quantity Frequency
____________________ _______________________________________ _________ ___________
____________________ _______________________________________ _________ ___________
____________________ _______________________________________ _________ ___________
____________________ _______________________________________ _________ ___________
____________________ ________________________________________ _________ ___________
8. Where is the usual destination of the iodized salt sold?
1 Same place where salt was produced
2 Metro Manila
3 Luzon, give specific area ___________________________________________________
4 Visayas,give specific area ___________________________________________________
5 Mindanao, give specific area _________________________________________________
9. Is there a system for product recall? ISRECALL
YES NO
10. Please describe the system SYSTEMRECALL
_____________________________________________________________________________________
_____________________________________________________________________________________
_____________________________________________________________________________________
_____________________________________________________________________________________
_____________________________________________________________________________________
11. Has the company experienced any product recall? RECALLIS
YES NO
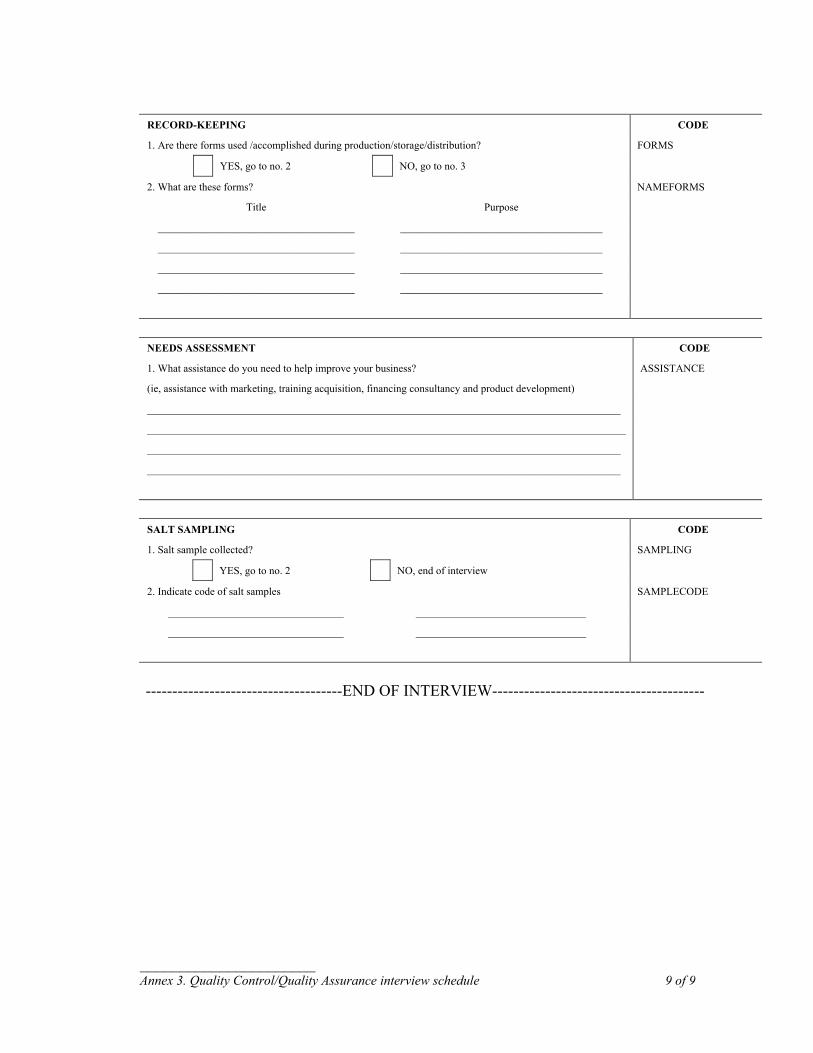
______________________ Annex 3. Quality Control/Quality Assurance interview schedule 9 of 9
RECORD-KEEPING CODE
1. Are there forms used /accomplished during production/storage/distribution? FORMS
YES, go to no. 2 NO, go to no. 3
2. What are these forms? NAMEFORMS
Title Purpose
_____________________________________ ______________________________________
_____________________________________ ______________________________________
_____________________________________ ______________________________________
_____________________________________ ______________________________________
NEEDS ASSESSMENT CODE
1. What assistance do you need to help improve your business? ASSISTANCE
(ie, assistance with marketing, training acquisition, financing consultancy and product development)
_________________________________________________________________________________________
__________________________________________________________________________________________
_________________________________________________________________________________________
_________________________________________________________________________________________
SALT SAMPLING CODE
1. Salt sample collected? SAMPLING
YES, go to no. 2 NO, end of interview
2. Indicate code of salt samples SAMPLECODE
_________________________________ ________________________________
_________________________________ ________________________________
-------------------------------------END OF INTERVIEW----------------------------------------
________________ Annex 4. Consent/Confidentiality letter 1 of 1
Annex 4. Consent/Confidentiality letter _______________ Dear Sir/Madam: Good Day! We are from the Nutrition Center of the Philippines (NCP), a private, non-stock, non-profit organization involved in public health nutrition. We were commissioned by the Global Alliance for Improved Nutrition (GAIN) to conduct a survey among salt producers/manufacturers, importers and traders in selected prov-inces in Luzon, Visayas and Mindanao. The survey aims to describe the location, distribution, size and scale of production of salt importers and producers; to plot the coordinates of location and estimated boundaries of existing salt producers, and to document and evaluate the quality assurance and control systems and prac-tices of salt producers and importers.
In this regard, may we request for your participation in our survey? Rest assured that your participation in our survey will be confidential and all information you will give or any information that we have obtained will not be disclosed to any person except to those specifically authorized by us. Further, we guarantee that details of information will not be given to any regulatory agencies. Thank you very much. Respectfully yours, CHERRY C. MARAMAG Researcher/Project Leader DR. JUAN ANTONIO A. SOLON Executive Director
This is to certify that I have read and understood the content of this letter and that I have _____ agreed /
_____ disagreed to participate in the survey.
Respondent: Witness: __________________________________ ____________________________________ Name and Signature Name and Signature
Position: ___________________________ Position: ___________________________
Date: ______________________________ Date: ______________________________
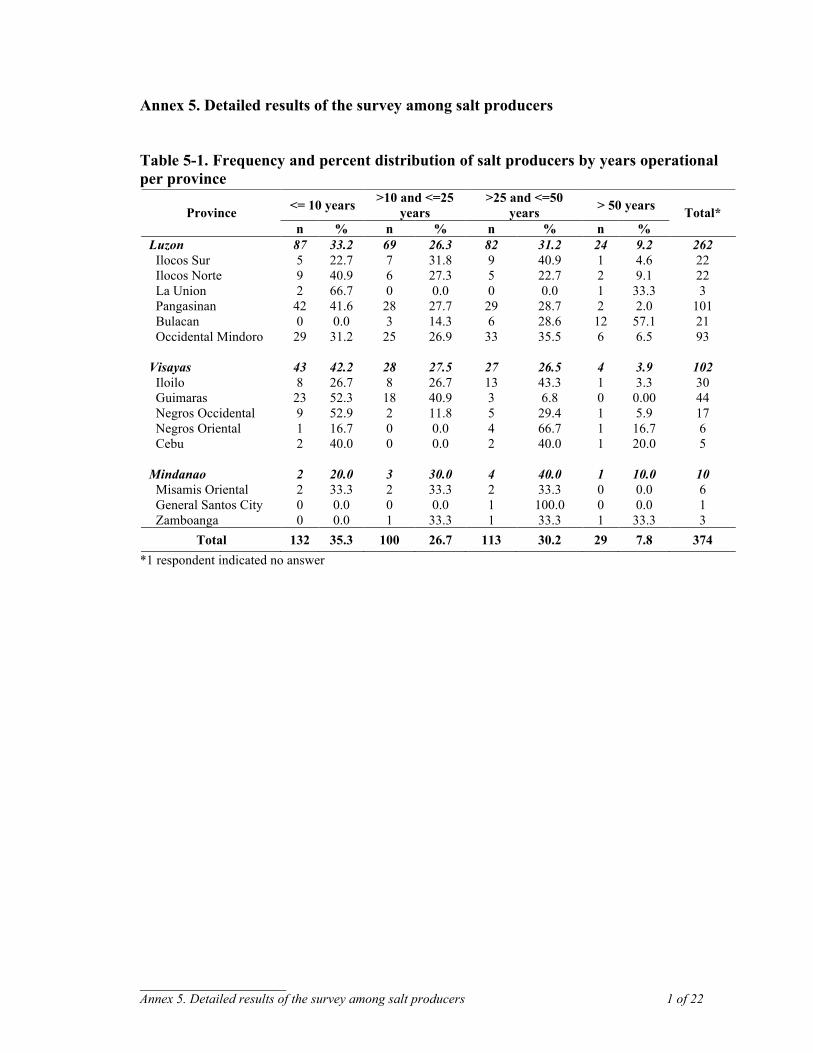
______________________ Annex 5. Detailed results of the survey among salt producers 1 of 22
Annex 5. Detailed results of the survey among salt producers Table 5-1. Frequency and percent distribution of salt producers by years operational per province
*1 respondent indicated no answer
<= 10 years >10 and <=25 years
>25 and <=50 years > 50 years Province
n % n % n % n % Total*
Luzon 87 33.2 69 26.3 82 31.2 24 9.2 262 Ilocos Sur 5 22.7 7 31.8 9 40.9 1 4.6 22 Ilocos Norte 9 40.9 6 27.3 5 22.7 2 9.1 22 La Union 2 66.7 0 0.0 0 0.0 1 33.3 3 Pangasinan 42 41.6 28 27.7 29 28.7 2 2.0 101 Bulacan 0 0.0 3 14.3 6 28.6 12 57.1 21 Occidental Mindoro 29 31.2 25 26.9 33 35.5 6 6.5 93 Visayas 43 42.2 28 27.5 27 26.5 4 3.9 102 Iloilo 8 26.7 8 26.7 13 43.3 1 3.3 30 Guimaras 23 52.3 18 40.9 3 6.8 0 0.00 44 Negros Occidental 9 52.9 2 11.8 5 29.4 1 5.9 17 Negros Oriental 1 16.7 0 0.0 4 66.7 1 16.7 6 Cebu 2 40.0 0 0.0 2 40.0 1 20.0 5 Mindanao 2 20.0 3 30.0 4 40.0 1 10.0 10 Misamis Oriental 2 33.3 2 33.3 2 33.3 0 0.0 6 General Santos City 0 0.0 0 0.0 1 100.0 0 0.0 1 Zamboanga 0 0.0 1 33.3 1 33.3 1 33.3 3
Total 132 35.3 100 26.7 113 30.2 29 7.8 374
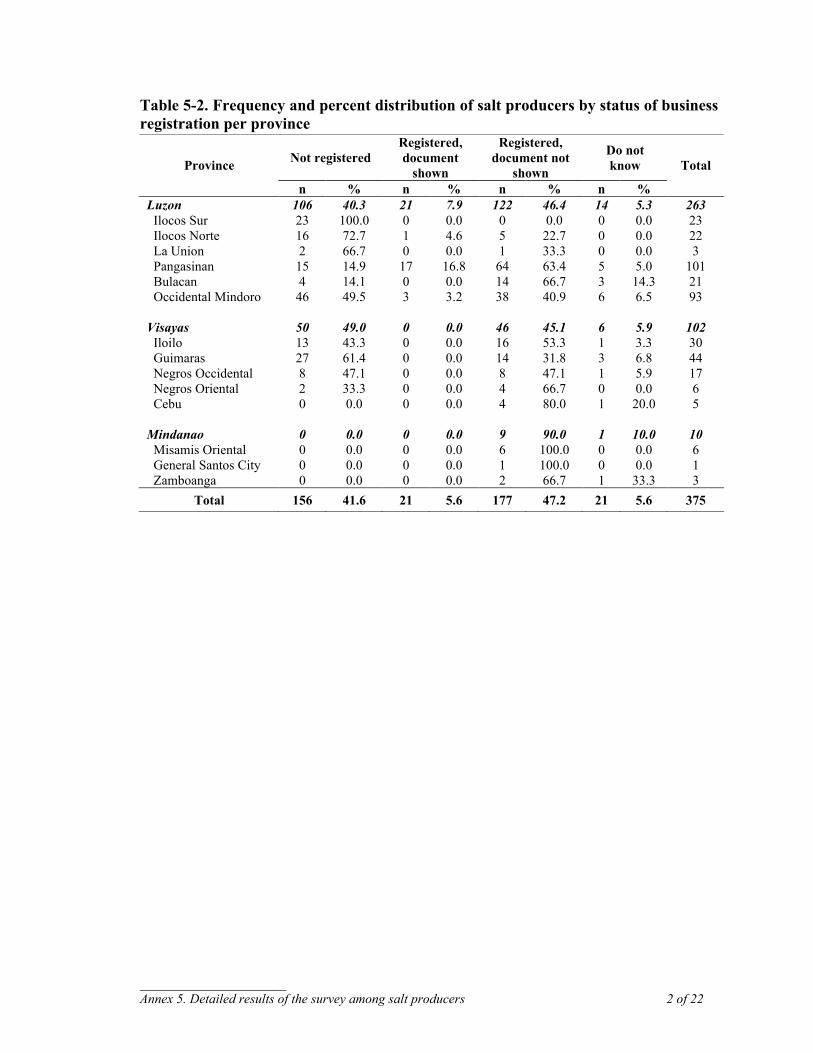
______________________ Annex 5. Detailed results of the survey among salt producers 2 of 22
Table 5-2. Frequency and percent distribution of salt producers by status of business registration per province
Not registered Registered, document
shown
Registered, document not
shown
Do not know Province
n % n % n % n %
Total
Luzon 106 40.3 21 7.9 122 46.4 14 5.3 263 Ilocos Sur 23 100.0 0 0.0 0 0.0 0 0.0 23 Ilocos Norte 16 72.7 1 4.6 5 22.7 0 0.0 22 La Union 2 66.7 0 0.0 1 33.3 0 0.0 3 Pangasinan 15 14.9 17 16.8 64 63.4 5 5.0 101 Bulacan 4 14.1 0 0.0 14 66.7 3 14.3 21 Occidental Mindoro 46 49.5 3 3.2 38 40.9 6 6.5 93 Visayas 50 49.0 0 0.0 46 45.1 6 5.9 102 Iloilo 13 43.3 0 0.0 16 53.3 1 3.3 30 Guimaras 27 61.4 0 0.0 14 31.8 3 6.8 44 Negros Occidental 8 47.1 0 0.0 8 47.1 1 5.9 17 Negros Oriental 2 33.3 0 0.0 4 66.7 0 0.0 6 Cebu 0 0.0 0 0.0 4 80.0 1 20.0 5 Mindanao 0 0.0 0 0.0 9 90.0 1 10.0 10 Misamis Oriental 0 0.0 0 0.0 6 100.0 0 0.0 6 General Santos City 0 0.0 0 0.0 1 100.0 0 0.0 1 Zamboanga 0 0.0 0 0.0 2 66.7 1 33.3 3
Total 156 41.6 21 5.6 177 47.2 21 5.6 375
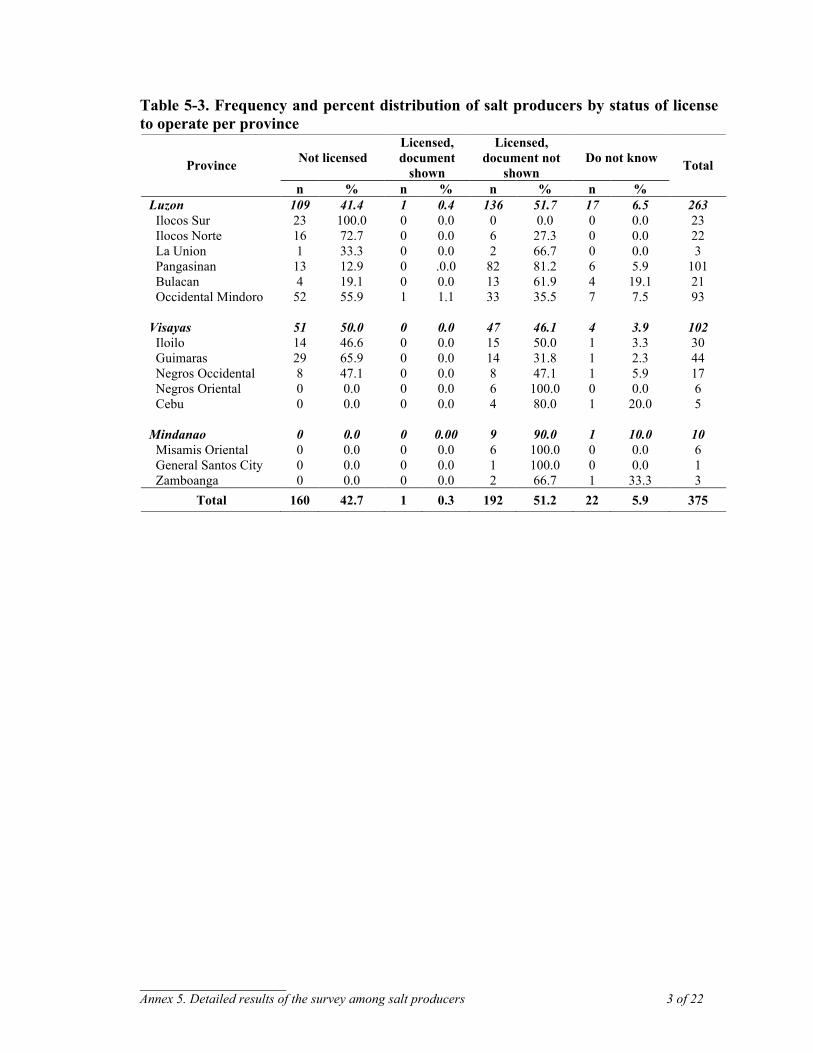
______________________ Annex 5. Detailed results of the survey among salt producers 3 of 22
Table 5-3. Frequency and percent distribution of salt producers by status of license to operate per province
Not licensed Licensed, document
shown
Licensed, document not
shown Do not know Province
n % n % n % n %
Total
Luzon 109 41.4 1 0.4 136 51.7 17 6.5 263 Ilocos Sur 23 100.0 0 0.0 0 0.0 0 0.0 23 Ilocos Norte 16 72.7 0 0.0 6 27.3 0 0.0 22 La Union 1 33.3 0 0.0 2 66.7 0 0.0 3 Pangasinan 13 12.9 0 .0.0 82 81.2 6 5.9 101 Bulacan 4 19.1 0 0.0 13 61.9 4 19.1 21 Occidental Mindoro 52 55.9 1 1.1 33 35.5 7 7.5 93 Visayas 51 50.0 0 0.0 47 46.1 4 3.9 102 Iloilo 14 46.6 0 0.0 15 50.0 1 3.3 30 Guimaras 29 65.9 0 0.0 14 31.8 1 2.3 44 Negros Occidental 8 47.1 0 0.0 8 47.1 1 5.9 17 Negros Oriental 0 0.0 0 0.0 6 100.0 0 0.0 6 Cebu 0 0.0 0 0.0 4 80.0 1 20.0 5 Mindanao 0 0.0 0 0.00 9 90.0 1 10.0 10 Misamis Oriental 0 0.0 0 0.0 6 100.0 0 0.0 6 General Santos City 0 0.0 0 0.0 1 100.0 0 0.0 1 Zamboanga 0 0.0 0 0.0 2 66.7 1 33.3 3
Total 160 42.7 1 0.3 192 51.2 22 5.9 375
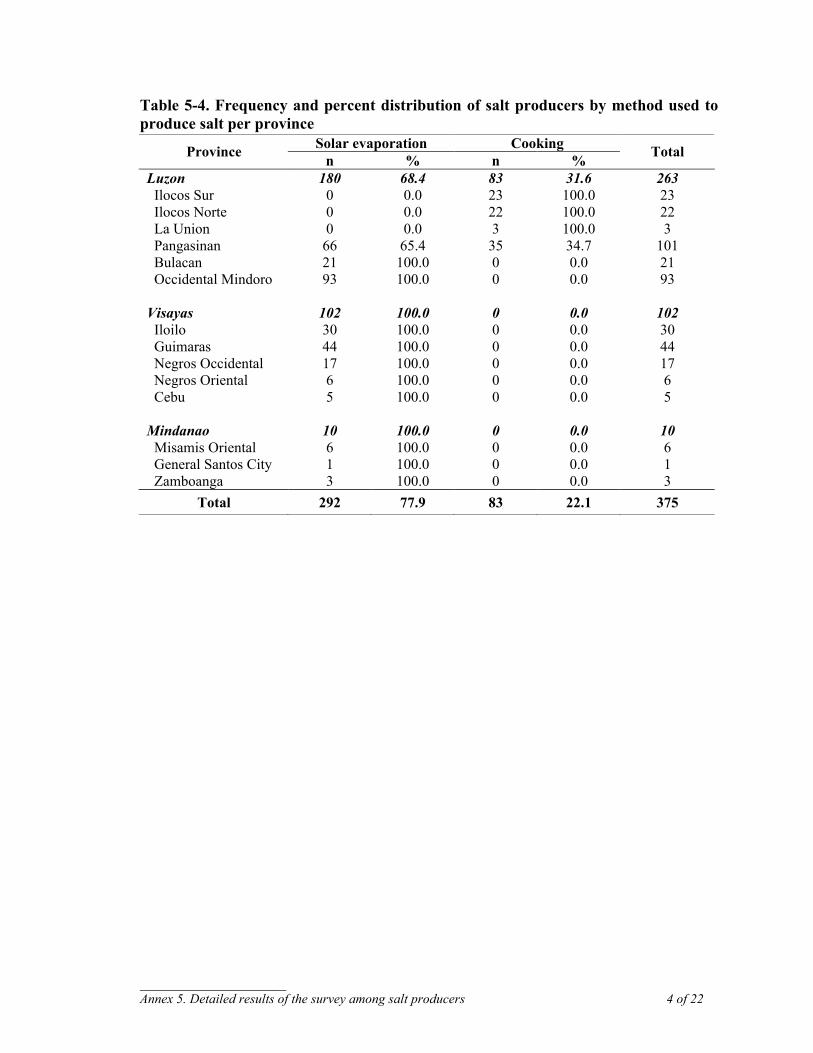
______________________ Annex 5. Detailed results of the survey among salt producers 4 of 22
Table 5-4. Frequency and percent distribution of salt producers by method used to produce salt per province
Solar evaporation Cooking Province n % n % Total
Luzon 180 68.4 83 31.6 263 Ilocos Sur 0 0.0 23 100.0 23 Ilocos Norte 0 0.0 22 100.0 22 La Union 0 0.0 3 100.0 3 Pangasinan 66 65.4 35 34.7 101 Bulacan 21 100.0 0 0.0 21 Occidental Mindoro 93 100.0 0 0.0 93 Visayas 102 100.0 0 0.0 102 Iloilo 30 100.0 0 0.0 30 Guimaras 44 100.0 0 0.0 44 Negros Occidental 17 100.0 0 0.0 17 Negros Oriental 6 100.0 0 0.0 6 Cebu 5 100.0 0 0.0 5 Mindanao 10 100.0 0 0.0 10 Misamis Oriental 6 100.0 0 0.0 6 General Santos City 1 100.0 0 0.0 1 Zamboanga 3 100.0 0 0.0 3
Total 292 77.9 83 22.1 375
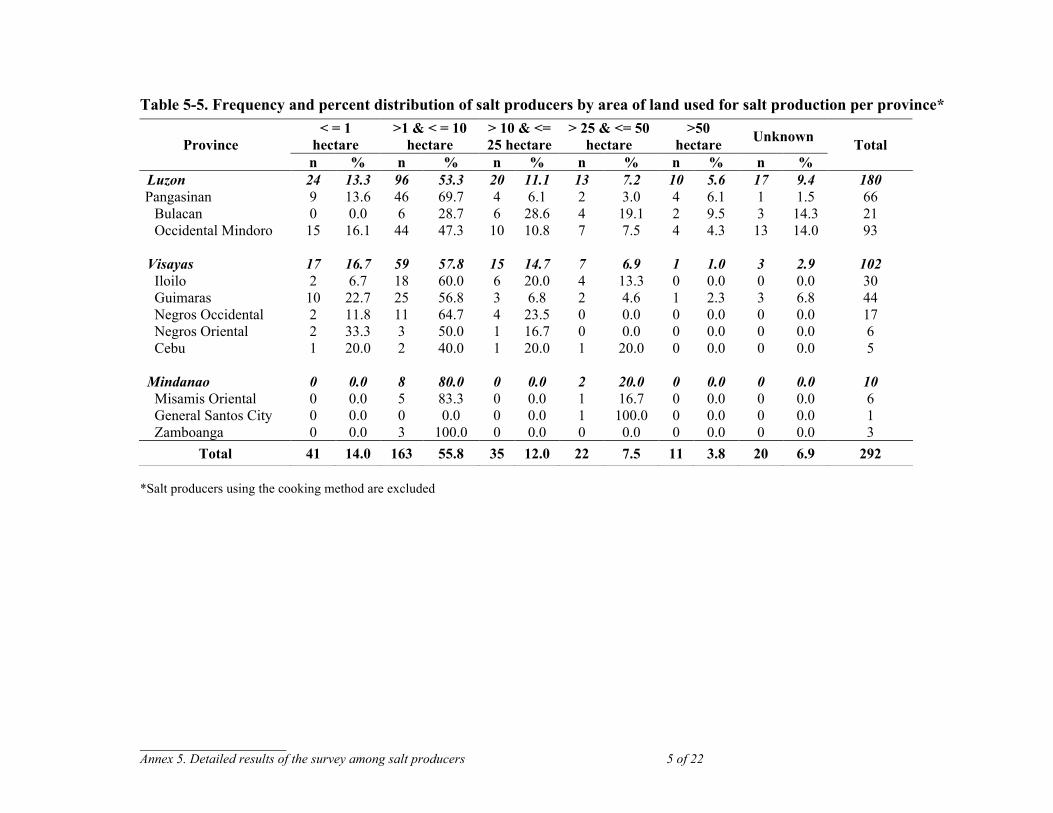
______________________ Annex 5. Detailed results of the survey among salt producers 5 of 22
Table 5-5. Frequency and percent distribution of salt producers by area of land used for salt production per province*
*Salt producers using the cooking method are excluded
< = 1 hectare
>1 & < = 10 hectare
> 10 & <= 25 hectare
> 25 & <= 50 hectare
>50 hectare Unknown Province
n % n % n % n % n % n % Total
Luzon 24 13.3 96 53.3 20 11.1 13 7.2 10 5.6 17 9.4 180 Pangasinan 9 13.6 46 69.7 4 6.1 2 3.0 4 6.1 1 1.5 66
Bulacan 0 0.0 6 28.7 6 28.6 4 19.1 2 9.5 3 14.3 21 Occidental Mindoro 15 16.1 44 47.3 10 10.8 7 7.5 4 4.3 13 14.0 93 Visayas 17 16.7 59 57.8 15 14.7 7 6.9 1 1.0 3 2.9 102 Iloilo 2 6.7 18 60.0 6 20.0 4 13.3 0 0.0 0 0.0 30 Guimaras 10 22.7 25 56.8 3 6.8 2 4.6 1 2.3 3 6.8 44 Negros Occidental 2 11.8 11 64.7 4 23.5 0 0.0 0 0.0 0 0.0 17 Negros Oriental 2 33.3 3 50.0 1 16.7 0 0.0 0 0.0 0 0.0 6 Cebu 1 20.0 2 40.0 1 20.0 1 20.0 0 0.0 0 0.0 5 Mindanao 0 0.0 8 80.0 0 0.0 2 20.0 0 0.0 0 0.0 10 Misamis Oriental 0 0.0 5 83.3 0 0.0 1 16.7 0 0.0 0 0.0 6 General Santos City 0 0.0 0 0.0 0 0.0 1 100.0 0 0.0 0 0.0 1 Zamboanga 0 0.0 3 100.0 0 0.0 0 0.0 0 0.0 0 0.0 3
Total 41 14.0 163 55.8 35 12.0 22 7.5 11 3.8 20 6.9 292
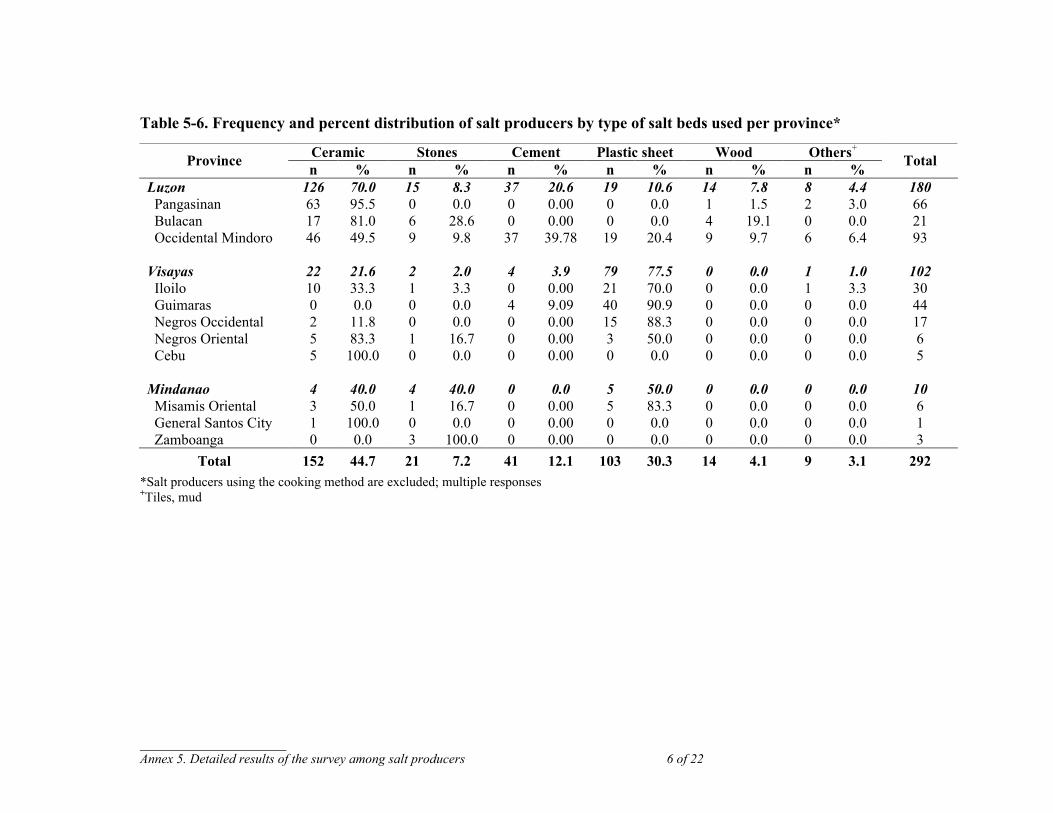
______________________ Annex 5. Detailed results of the survey among salt producers 6 of 22
Table 5-6. Frequency and percent distribution of salt producers by type of salt beds used per province*
*Salt producers using the cooking method are excluded; multiple responses +Tiles, mud
Ceramic Stones Cement Plastic sheet Wood Others+ Province n % n % n % n % n % n % Total
Luzon 126 70.0 15 8.3 37 20.6 19 10.6 14 7.8 8 4.4 180 Pangasinan 63 95.5 0 0.0 0 0.00 0 0.0 1 1.5 2 3.0 66 Bulacan 17 81.0 6 28.6 0 0.00 0 0.0 4 19.1 0 0.0 21 Occidental Mindoro 46 49.5 9 9.8 37 39.78 19 20.4 9 9.7 6 6.4 93 Visayas 22 21.6 2 2.0 4 3.9 79 77.5 0 0.0 1 1.0 102 Iloilo 10 33.3 1 3.3 0 0.00 21 70.0 0 0.0 1 3.3 30 Guimaras 0 0.0 0 0.0 4 9.09 40 90.9 0 0.0 0 0.0 44 Negros Occidental 2 11.8 0 0.0 0 0.00 15 88.3 0 0.0 0 0.0 17 Negros Oriental 5 83.3 1 16.7 0 0.00 3 50.0 0 0.0 0 0.0 6 Cebu 5 100.0 0 0.0 0 0.00 0 0.0 0 0.0 0 0.0 5 Mindanao 4 40.0 4 40.0 0 0.0 5 50.0 0 0.0 0 0.0 10 Misamis Oriental 3 50.0 1 16.7 0 0.00 5 83.3 0 0.0 0 0.0 6 General Santos City 1 100.0 0 0.0 0 0.00 0 0.0 0 0.0 0 0.0 1 Zamboanga 0 0.0 3 100.0 0 0.00 0 0.0 0 0.0 0 0.0 3
Total 152 44.7 21 7.2 41 12.1 103 30.3 14 4.1 9 3.1 292
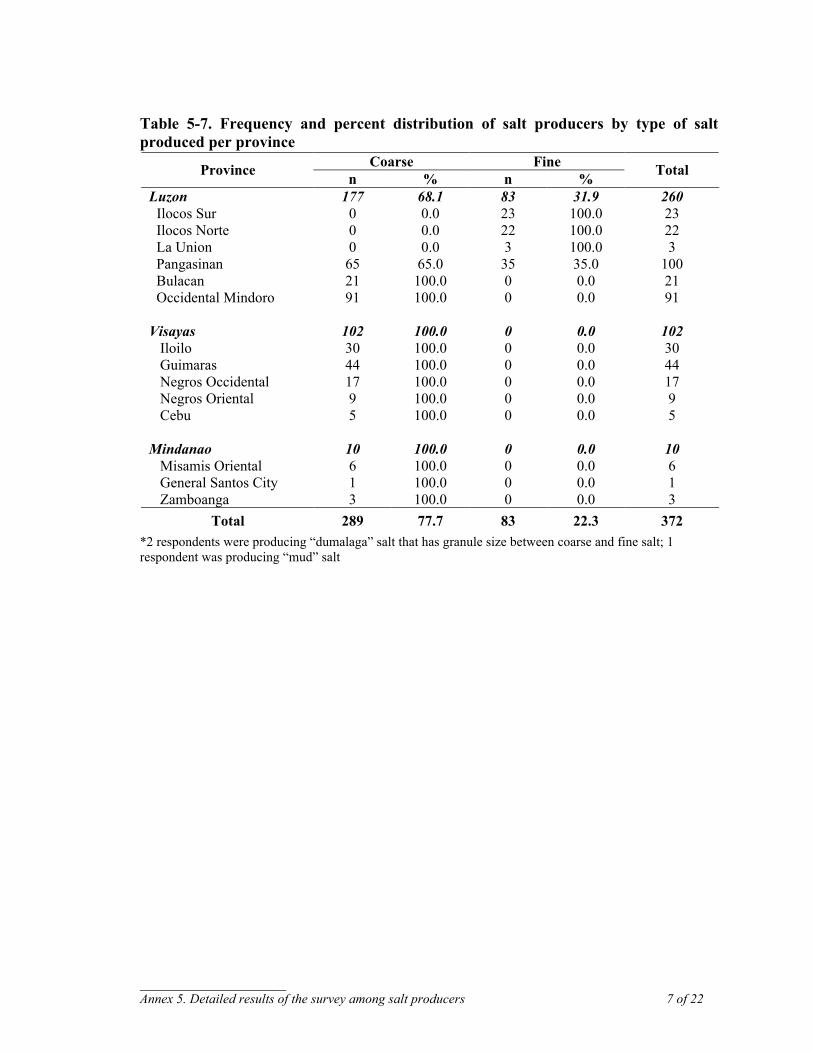
______________________ Annex 5. Detailed results of the survey among salt producers 7 of 22
Table 5-7. Frequency and percent distribution of salt producers by type of salt produced per province
*2 respondents were producing “dumalaga” salt that has granule size between coarse and fine salt; 1 respondent was producing “mud” salt
Coarse Fine Province n % n % Total
Luzon 177 68.1 83 31.9 260 Ilocos Sur 0 0.0 23 100.0 23
Ilocos Norte 0 0.0 22 100.0 22 La Union 0 0.0 3 100.0 3 Pangasinan 65 65.0 35 35.0 100 Bulacan 21 100.0 0 0.0 21 Occidental Mindoro 91 100.0 0 0.0 91 Visayas 102 100.0 0 0.0 102 Iloilo 30 100.0 0 0.0 30 Guimaras 44 100.0 0 0.0 44 Negros Occidental 17 100.0 0 0.0 17 Negros Oriental 9 100.0 0 0.0 9 Cebu 5 100.0 0 0.0 5 Mindanao 10 100.0 0 0.0 10 Misamis Oriental 6 100.0 0 0.0 6 General Santos City 1 100.0 0 0.0 1 Zamboanga 3 100.0 0 0.0 3
Total 289 77.7 83 22.3 372
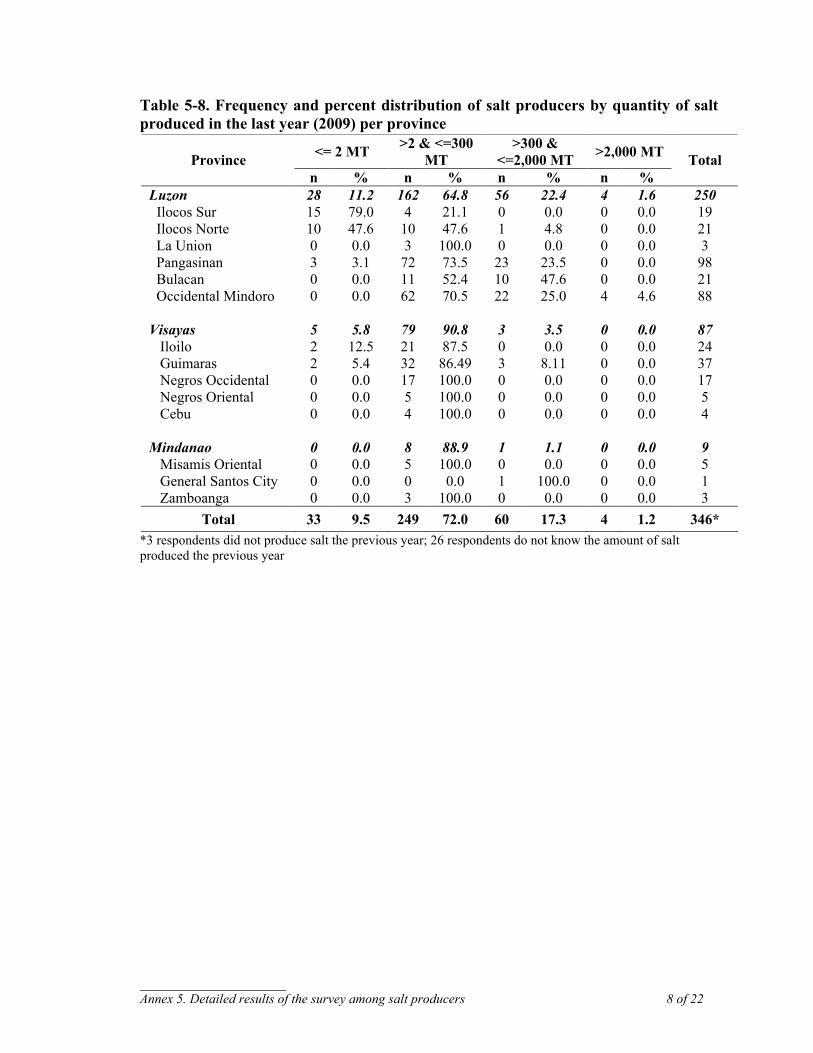
______________________ Annex 5. Detailed results of the survey among salt producers 8 of 22
Table 5-8. Frequency and percent distribution of salt producers by quantity of salt produced in the last year (2009) per province
*3 respondents did not produce salt the previous year; 26 respondents do not know the amount of salt produced the previous year
<= 2 MT >2 & <=300 MT
>300 & <=2,000 MT >2,000 MT Province
n % n % n % n % Total
Luzon 28 11.2 162 64.8 56 22.4 4 1.6 250 Ilocos Sur 15 79.0 4 21.1 0 0.0 0 0.0 19
Ilocos Norte 10 47.6 10 47.6 1 4.8 0 0.0 21 La Union 0 0.0 3 100.0 0 0.0 0 0.0 3 Pangasinan 3 3.1 72 73.5 23 23.5 0 0.0 98 Bulacan 0 0.0 11 52.4 10 47.6 0 0.0 21 Occidental Mindoro 0 0.0 62 70.5 22 25.0 4 4.6 88 Visayas 5 5.8 79 90.8 3 3.5 0 0.0 87 Iloilo 2 12.5 21 87.5 0 0.0 0 0.0 24 Guimaras 2 5.4 32 86.49 3 8.11 0 0.0 37 Negros Occidental 0 0.0 17 100.0 0 0.0 0 0.0 17 Negros Oriental 0 0.0 5 100.0 0 0.0 0 0.0 5 Cebu 0 0.0 4 100.0 0 0.0 0 0.0 4 Mindanao 0 0.0 8 88.9 1 1.1 0 0.0 9 Misamis Oriental 0 0.0 5 100.0 0 0.0 0 0.0 5 General Santos City 0 0.0 0 0.0 1 100.0 0 0.0 1 Zamboanga 0 0.0 3 100.0 0 0.0 0 0.0 3
Total 33 9.5 249 72.0 60 17.3 4 1.2 346*
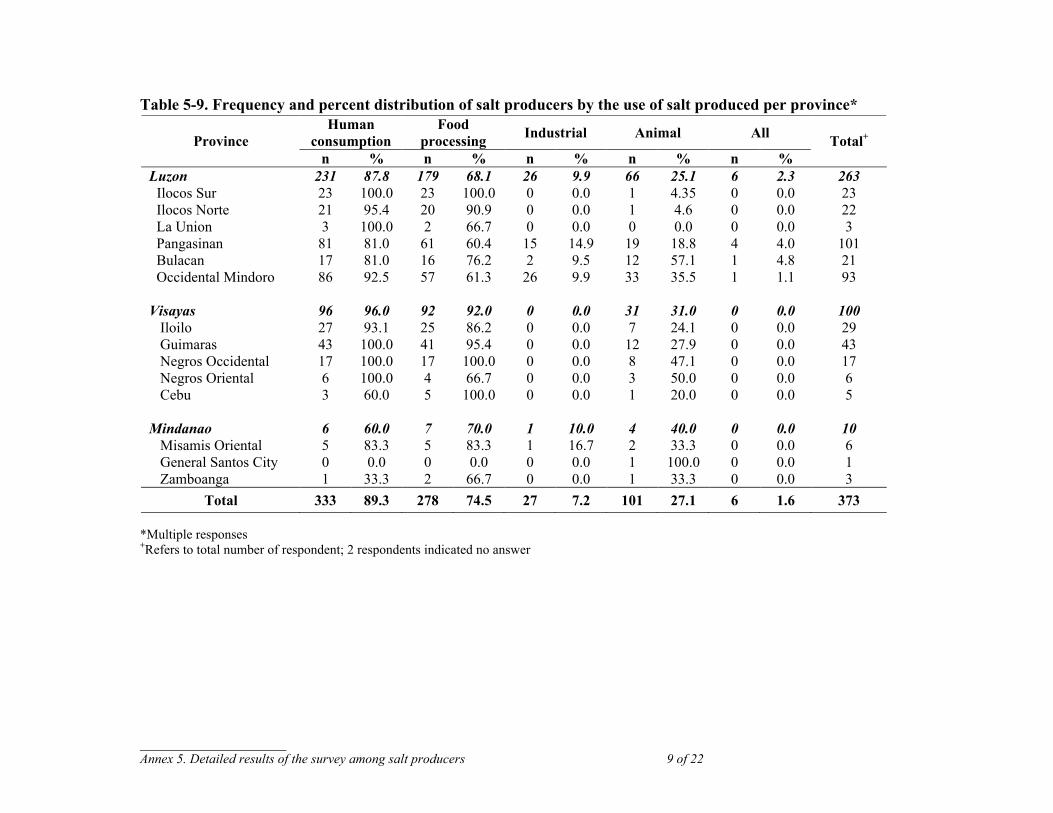
______________________ Annex 5. Detailed results of the survey among salt producers 9 of 22
Table 5-9. Frequency and percent distribution of salt producers by the use of salt produced per province*
*Multiple responses +Refers to total number of respondent; 2 respondents indicated no answer
Human consumption
Food processing Industrial Animal All Province
n % n % n % n % n % Total+
Luzon 231 87.8 179 68.1 26 9.9 66 25.1 6 2.3 263 Ilocos Sur 23 100.0 23 100.0 0 0.0 1 4.35 0 0.0 23
Ilocos Norte 21 95.4 20 90.9 0 0.0 1 4.6 0 0.0 22 La Union 3 100.0 2 66.7 0 0.0 0 0.0 0 0.0 3 Pangasinan 81 81.0 61 60.4 15 14.9 19 18.8 4 4.0 101 Bulacan 17 81.0 16 76.2 2 9.5 12 57.1 1 4.8 21 Occidental Mindoro 86 92.5 57 61.3 26 9.9 33 35.5 1 1.1 93 Visayas 96 96.0 92 92.0 0 0.0 31 31.0 0 0.0 100 Iloilo 27 93.1 25 86.2 0 0.0 7 24.1 0 0.0 29 Guimaras 43 100.0 41 95.4 0 0.0 12 27.9 0 0.0 43 Negros Occidental 17 100.0 17 100.0 0 0.0 8 47.1 0 0.0 17 Negros Oriental 6 100.0 4 66.7 0 0.0 3 50.0 0 0.0 6 Cebu 3 60.0 5 100.0 0 0.0 1 20.0 0 0.0 5 Mindanao 6 60.0 7 70.0 1 10.0 4 40.0 0 0.0 10 Misamis Oriental 5 83.3 5 83.3 1 16.7 2 33.3 0 0.0 6 General Santos City 0 0.0 0 0.0 0 0.0 1 100.0 0 0.0 1 Zamboanga 1 33.3 2 66.7 0 0.0 1 33.3 0 0.0 3
Total 333 89.3 278 74.5 27 7.2 101 27.1 6 1.6 373
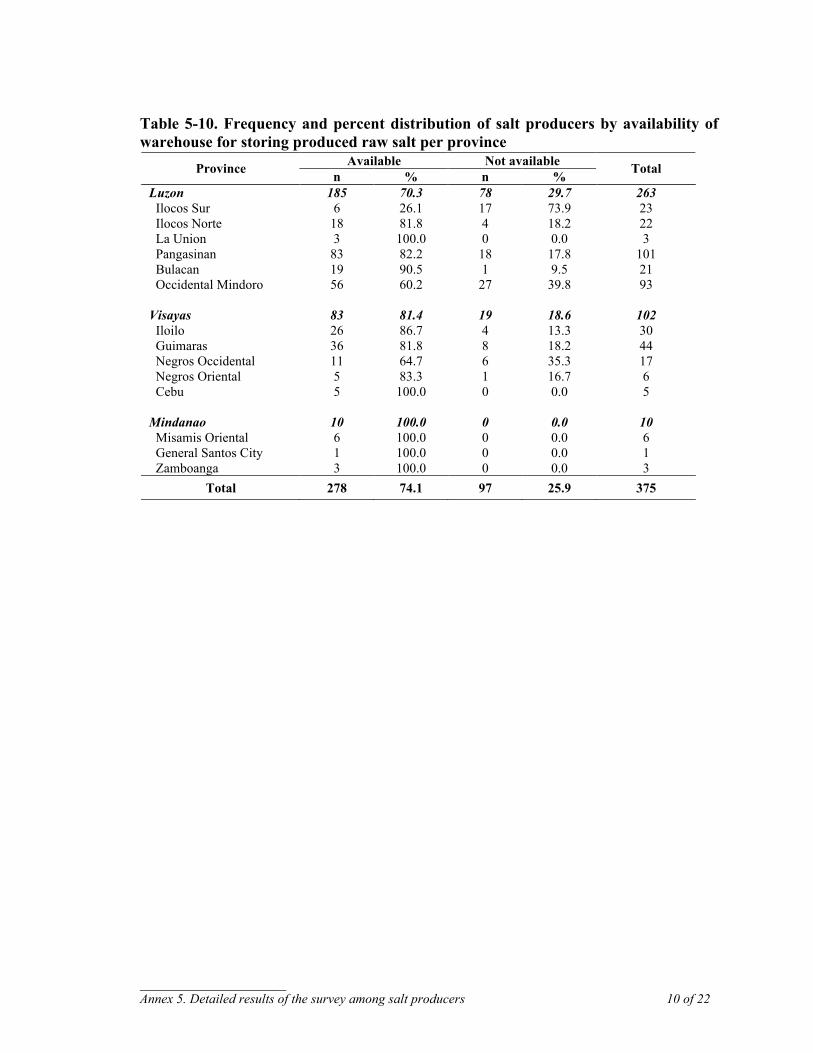
______________________ Annex 5. Detailed results of the survey among salt producers 10 of 22
Table 5-10. Frequency and percent distribution of salt producers by availability of warehouse for storing produced raw salt per province
Available Not available Province n % n % Total
Luzon 185 70.3 78 29.7 263 Ilocos Sur 6 26.1 17 73.9 23 Ilocos Norte 18 81.8 4 18.2 22 La Union 3 100.0 0 0.0 3 Pangasinan 83 82.2 18 17.8 101 Bulacan 19 90.5 1 9.5 21 Occidental Mindoro 56 60.2 27 39.8 93 Visayas 83 81.4 19 18.6 102 Iloilo 26 86.7 4 13.3 30 Guimaras 36 81.8 8 18.2 44 Negros Occidental 11 64.7 6 35.3 17 Negros Oriental 5 83.3 1 16.7 6 Cebu 5 100.0 0 0.0 5 Mindanao 10 100.0 0 0.0 10 Misamis Oriental 6 100.0 0 0.0 6 General Santos City 1 100.0 0 0.0 1 Zamboanga 3 100.0 0 0.0 3
Total 278 74.1 97 25.9 375
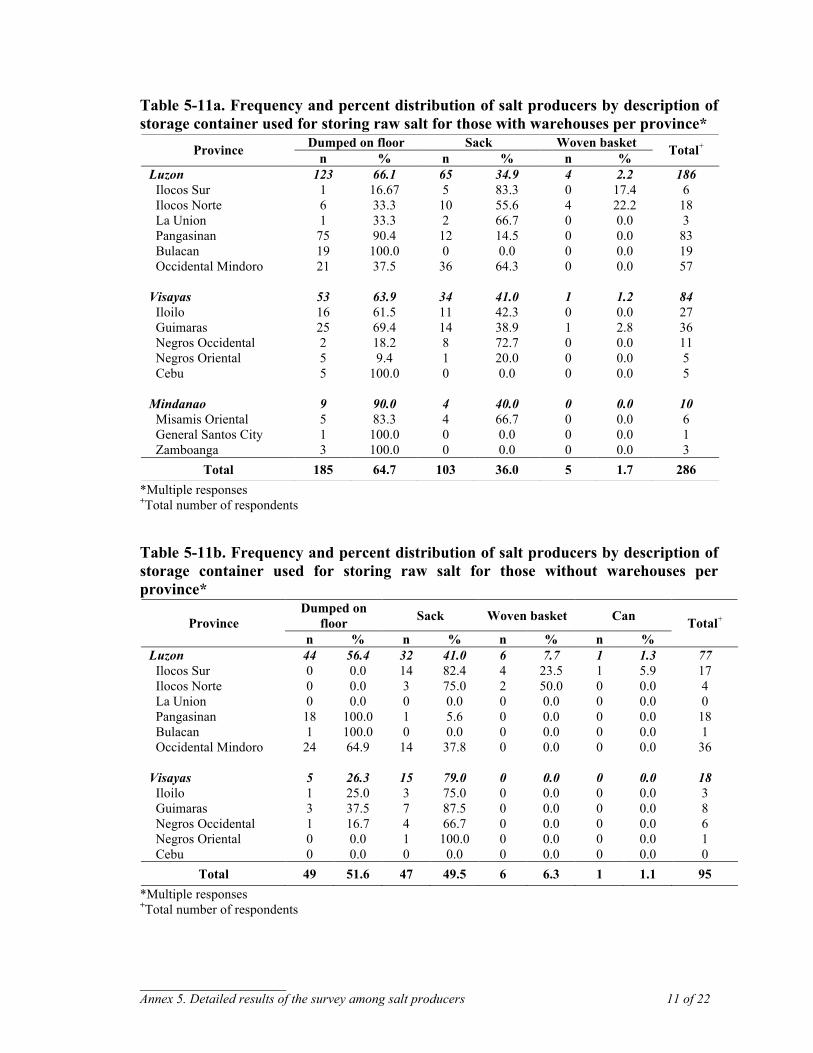
______________________ Annex 5. Detailed results of the survey among salt producers 11 of 22
Table 5-11a. Frequency and percent distribution of salt producers by description of storage container used for storing raw salt for those with warehouses per province*
*Multiple responses +Total number of respondents Table 5-11b. Frequency and percent distribution of salt producers by description of storage container used for storing raw salt for those without warehouses per province*
*Multiple responses +Total number of respondents
Dumped on floor Sack Woven basket Province n % n % n % Total+
Luzon 123 66.1 65 34.9 4 2.2 186 Ilocos Sur 1 16.67 5 83.3 0 17.4 6 Ilocos Norte 6 33.3 10 55.6 4 22.2 18 La Union 1 33.3 2 66.7 0 0.0 3 Pangasinan 75 90.4 12 14.5 0 0.0 83 Bulacan 19 100.0 0 0.0 0 0.0 19 Occidental Mindoro 21 37.5 36 64.3 0 0.0 57 Visayas 53 63.9 34 41.0 1 1.2 84 Iloilo 16 61.5 11 42.3 0 0.0 27 Guimaras 25 69.4 14 38.9 1 2.8 36 Negros Occidental 2 18.2 8 72.7 0 0.0 11 Negros Oriental 5 9.4 1 20.0 0 0.0 5 Cebu 5 100.0 0 0.0 0 0.0 5 Mindanao 9 90.0 4 40.0 0 0.0 10 Misamis Oriental 5 83.3 4 66.7 0 0.0 6 General Santos City 1 100.0 0 0.0 0 0.0 1 Zamboanga 3 100.0 0 0.0 0 0.0 3
Total 185 64.7 103 36.0 5 1.7 286
Dumped on floor Sack Woven basket Can Province
n % n % n % n % Total+
Luzon 44 56.4 32 41.0 6 7.7 1 1.3 77 Ilocos Sur 0 0.0 14 82.4 4 23.5 1 5.9 17 Ilocos Norte 0 0.0 3 75.0 2 50.0 0 0.0 4 La Union 0 0.0 0 0.0 0 0.0 0 0.0 0 Pangasinan 18 100.0 1 5.6 0 0.0 0 0.0 18 Bulacan 1 100.0 0 0.0 0 0.0 0 0.0 1 Occidental Mindoro 24 64.9 14 37.8 0 0.0 0 0.0 36 Visayas 5 26.3 15 79.0 0 0.0 0 0.0 18 Iloilo 1 25.0 3 75.0 0 0.0 0 0.0 3 Guimaras 3 37.5 7 87.5 0 0.0 0 0.0 8 Negros Occidental 1 16.7 4 66.7 0 0.0 0 0.0 6 Negros Oriental 0 0.0 1 100.0 0 0.0 0 0.0 1 Cebu 0 0.0 0 0.0 0 0.0 0 0.0 0
Total 49 51.6 47 49.5 6 6.3 1 1.1 95
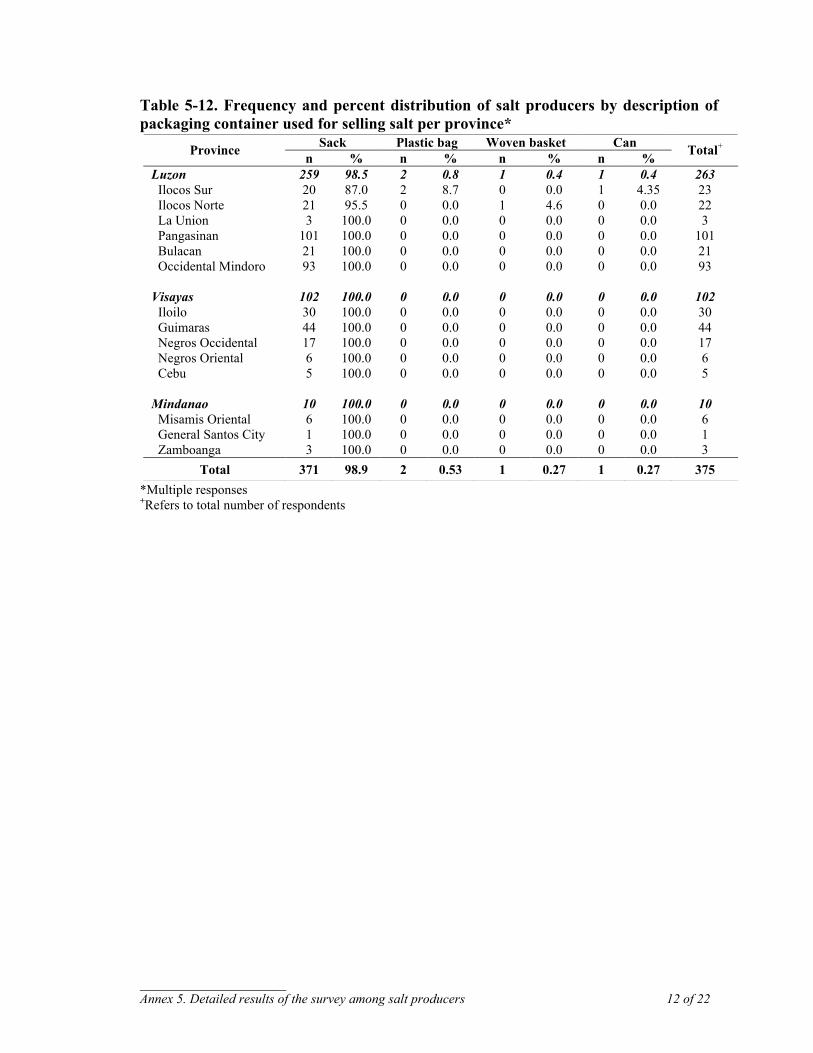
______________________ Annex 5. Detailed results of the survey among salt producers 12 of 22
Table 5-12. Frequency and percent distribution of salt producers by description of packaging container used for selling salt per province*
*Multiple responses +Refers to total number of respondents
Sack Plastic bag Woven basket Can Province n % n % n % n % Total+
Luzon 259 98.5 2 0.8 1 0.4 1 0.4 263 Ilocos Sur 20 87.0 2 8.7 0 0.0 1 4.35 23 Ilocos Norte 21 95.5 0 0.0 1 4.6 0 0.0 22 La Union 3 100.0 0 0.0 0 0.0 0 0.0 3 Pangasinan 101 100.0 0 0.0 0 0.0 0 0.0 101 Bulacan 21 100.0 0 0.0 0 0.0 0 0.0 21 Occidental Mindoro 93 100.0 0 0.0 0 0.0 0 0.0 93 Visayas 102 100.0 0 0.0 0 0.0 0 0.0 102 Iloilo 30 100.0 0 0.0 0 0.0 0 0.0 30 Guimaras 44 100.0 0 0.0 0 0.0 0 0.0 44 Negros Occidental 17 100.0 0 0.0 0 0.0 0 0.0 17 Negros Oriental 6 100.0 0 0.0 0 0.0 0 0.0 6 Cebu 5 100.0 0 0.0 0 0.0 0 0.0 5 Mindanao 10 100.0 0 0.0 0 0.0 0 0.0 10 Misamis Oriental 6 100.0 0 0.0 0 0.0 0 0.0 6 General Santos City 1 100.0 0 0.0 0 0.0 0 0.0 1 Zamboanga 3 100.0 0 0.0 0 0.0 0 0.0 3
Total 371 98.9 2 0.53 1 0.27 1 0.27 375
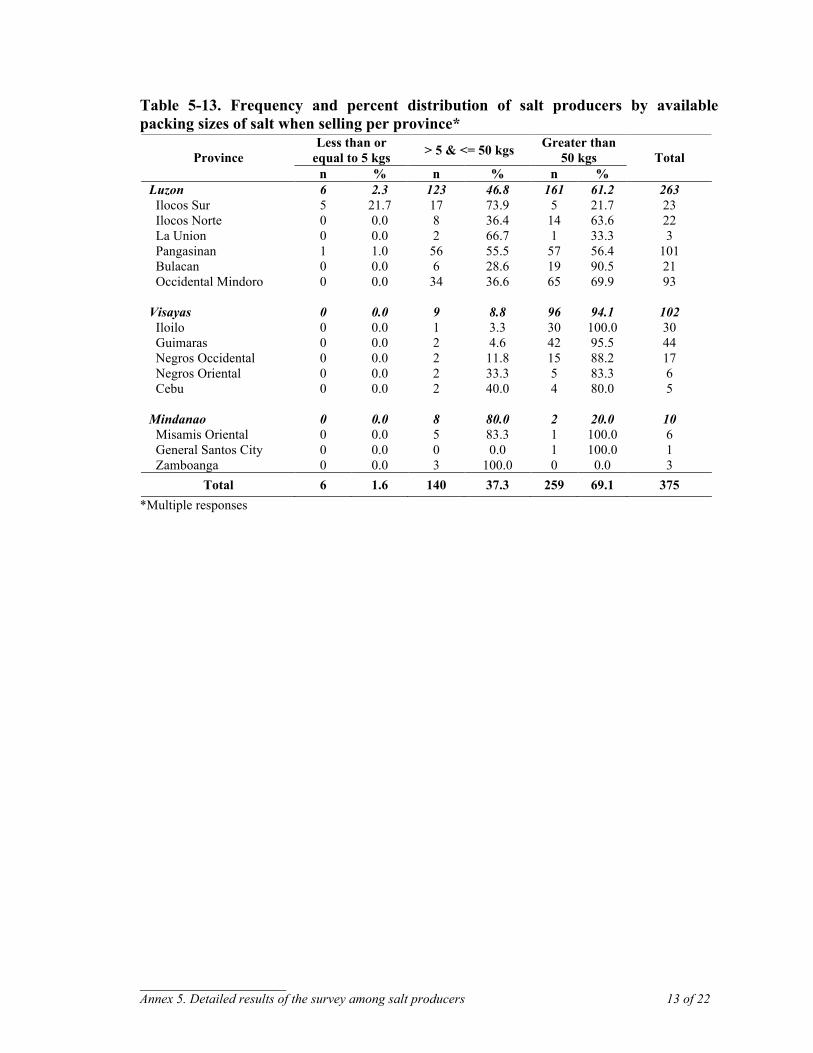
______________________ Annex 5. Detailed results of the survey among salt producers 13 of 22
Table 5-13. Frequency and percent distribution of salt producers by available packing sizes of salt when selling per province*
*Multiple responses
Less than or equal to 5 kgs > 5 & <= 50 kgs Greater than
50 kgs Province n % n % n %
Total
Luzon 6 2.3 123 46.8 161 61.2 263 Ilocos Sur 5 21.7 17 73.9 5 21.7 23 Ilocos Norte 0 0.0 8 36.4 14 63.6 22 La Union 0 0.0 2 66.7 1 33.3 3 Pangasinan 1 1.0 56 55.5 57 56.4 101 Bulacan 0 0.0 6 28.6 19 90.5 21 Occidental Mindoro 0 0.0 34 36.6 65 69.9 93 Visayas 0 0.0 9 8.8 96 94.1 102 Iloilo 0 0.0 1 3.3 30 100.0 30 Guimaras 0 0.0 2 4.6 42 95.5 44 Negros Occidental 0 0.0 2 11.8 15 88.2 17 Negros Oriental 0 0.0 2 33.3 5 83.3 6 Cebu 0 0.0 2 40.0 4 80.0 5 Mindanao 0 0.0 8 80.0 2 20.0 10 Misamis Oriental 0 0.0 5 83.3 1 100.0 6 General Santos City 0 0.0 0 0.0 1 100.0 1 Zamboanga 0 0.0 3 100.0 0 0.0 3
Total 6 1.6 140 37.3 259 69.1 375
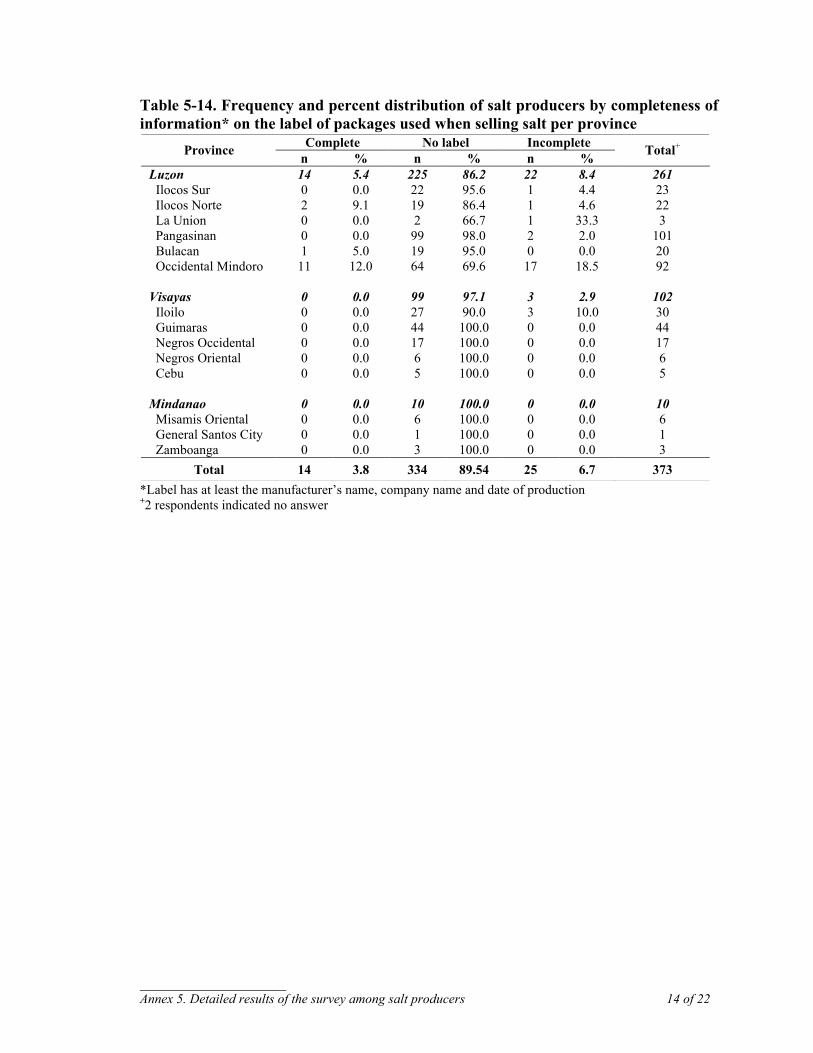
______________________ Annex 5. Detailed results of the survey among salt producers 14 of 22
Table 5-14. Frequency and percent distribution of salt producers by completeness of information* on the label of packages used when selling salt per province
*Label has at least the manufacturer’s name, company name and date of production +2 respondents indicated no answer
Complete No label Incomplete Province n % n % n % Total+
Luzon 14 5.4 225 86.2 22 8.4 261 Ilocos Sur 0 0.0 22 95.6 1 4.4 23 Ilocos Norte 2 9.1 19 86.4 1 4.6 22 La Union 0 0.0 2 66.7 1 33.3 3 Pangasinan 0 0.0 99 98.0 2 2.0 101 Bulacan 1 5.0 19 95.0 0 0.0 20 Occidental Mindoro 11 12.0 64 69.6 17 18.5 92 Visayas 0 0.0 99 97.1 3 2.9 102 Iloilo 0 0.0 27 90.0 3 10.0 30 Guimaras 0 0.0 44 100.0 0 0.0 44 Negros Occidental 0 0.0 17 100.0 0 0.0 17 Negros Oriental 0 0.0 6 100.0 0 0.0 6 Cebu 0 0.0 5 100.0 0 0.0 5 Mindanao 0 0.0 10 100.0 0 0.0 10 Misamis Oriental 0 0.0 6 100.0 0 0.0 6 General Santos City 0 0.0 1 100.0 0 0.0 1 Zamboanga 0 0.0 3 100.0 0 0.0 3
Total 14 3.8 334 89.54 25 6.7 373
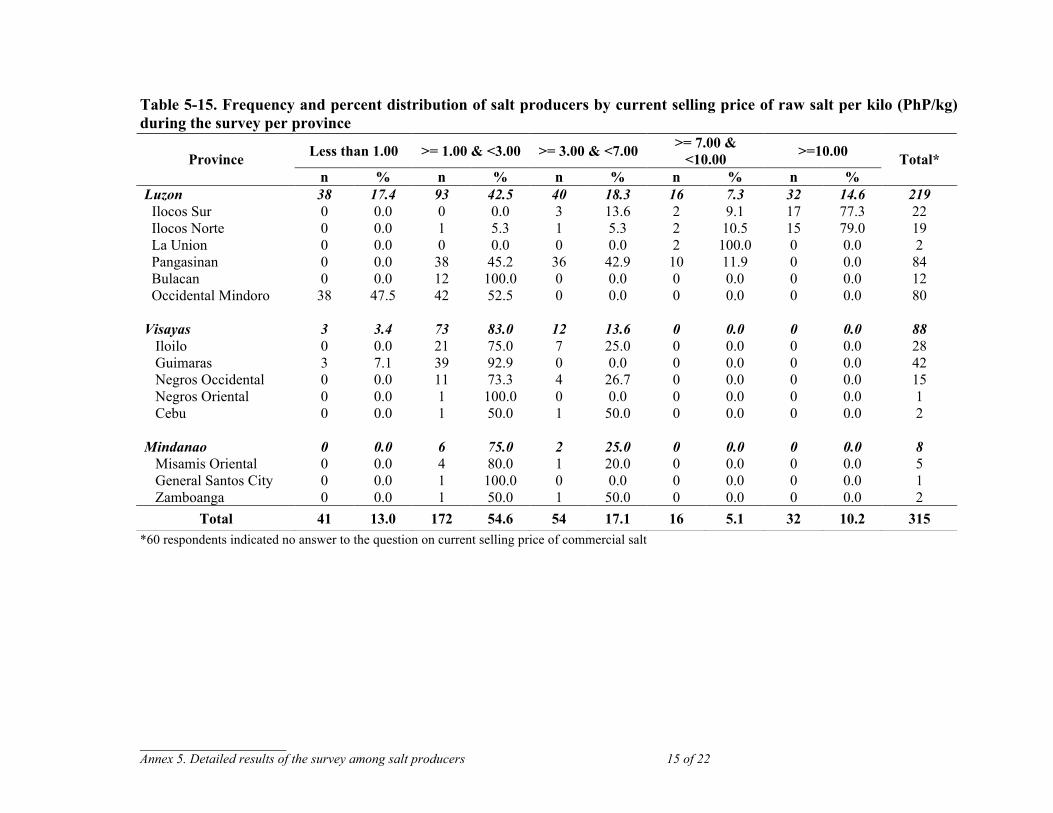
______________________ Annex 5. Detailed results of the survey among salt producers 15 of 22
Table 5-15. Frequency and percent distribution of salt producers by current selling price of raw salt per kilo (PhP/kg) during the survey per province
*60 respondents indicated no answer to the question on current selling price of commercial salt
Less than 1.00 >= 1.00 & <3.00 >= 3.00 & <7.00 >= 7.00 & <10.00 >=10.00 Province
n % n % n % n % n % Total*
Luzon 38 17.4 93 42.5 40 18.3 16 7.3 32 14.6 219 Ilocos Sur 0 0.0 0 0.0 3 13.6 2 9.1 17 77.3 22
Ilocos Norte 0 0.0 1 5.3 1 5.3 2 10.5 15 79.0 19 La Union 0 0.0 0 0.0 0 0.0 2 100.0 0 0.0 2 Pangasinan 0 0.0 38 45.2 36 42.9 10 11.9 0 0.0 84 Bulacan 0 0.0 12 100.0 0 0.0 0 0.0 0 0.0 12 Occidental Mindoro 38 47.5 42 52.5 0 0.0 0 0.0 0 0.0 80 Visayas 3 3.4 73 83.0 12 13.6 0 0.0 0 0.0 88 Iloilo 0 0.0 21 75.0 7 25.0 0 0.0 0 0.0 28 Guimaras 3 7.1 39 92.9 0 0.0 0 0.0 0 0.0 42 Negros Occidental 0 0.0 11 73.3 4 26.7 0 0.0 0 0.0 15 Negros Oriental 0 0.0 1 100.0 0 0.0 0 0.0 0 0.0 1 Cebu 0 0.0 1 50.0 1 50.0 0 0.0 0 0.0 2 Mindanao 0 0.0 6 75.0 2 25.0 0 0.0 0 0.0 8 Misamis Oriental 0 0.0 4 80.0 1 20.0 0 0.0 0 0.0 5 General Santos City 0 0.0 1 100.0 0 0.0 0 0.0 0 0.0 1 Zamboanga 0 0.0 1 50.0 1 50.0 0 0.0 0 0.0 2
Total 41 13.0 172 54.6 54 17.1 16 5.1 32 10.2 315
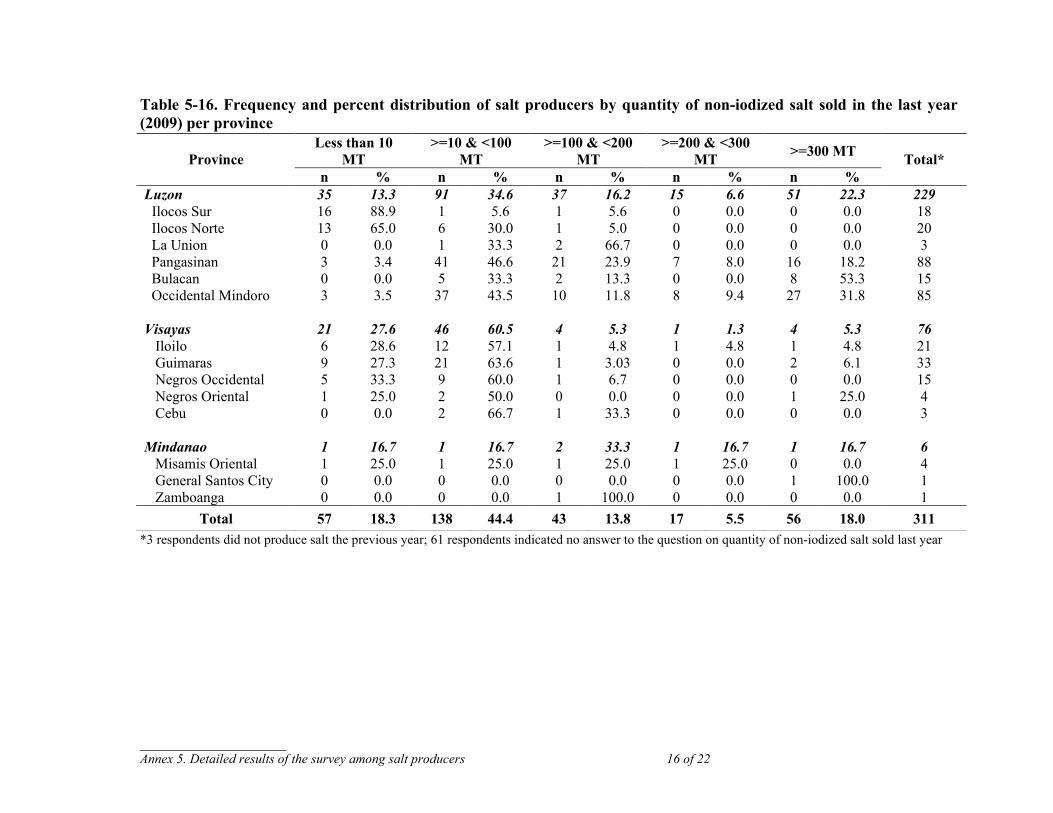
______________________ Annex 5. Detailed results of the survey among salt producers 16 of 22
Table 5-16. Frequency and percent distribution of salt producers by quantity of non-iodized salt sold in the last year (2009) per province
*3 respondents did not produce salt the previous year; 61 respondents indicated no answer to the question on quantity of non-iodized salt sold last year
Less than 10 MT
>=10 & <100 MT
>=100 & <200 MT
>=200 & <300 MT >=300 MT Province
n % n % n % n % n % Total*
Luzon 35 13.3 91 34.6 37 16.2 15 6.6 51 22.3 229 Ilocos Sur 16 88.9 1 5.6 1 5.6 0 0.0 0 0.0 18
Ilocos Norte 13 65.0 6 30.0 1 5.0 0 0.0 0 0.0 20 La Union 0 0.0 1 33.3 2 66.7 0 0.0 0 0.0 3 Pangasinan 3 3.4 41 46.6 21 23.9 7 8.0 16 18.2 88 Bulacan 0 0.0 5 33.3 2 13.3 0 0.0 8 53.3 15 Occidental Mindoro 3 3.5 37 43.5 10 11.8 8 9.4 27 31.8 85 Visayas 21 27.6 46 60.5 4 5.3 1 1.3 4 5.3 76 Iloilo 6 28.6 12 57.1 1 4.8 1 4.8 1 4.8 21 Guimaras 9 27.3 21 63.6 1 3.03 0 0.0 2 6.1 33 Negros Occidental 5 33.3 9 60.0 1 6.7 0 0.0 0 0.0 15 Negros Oriental 1 25.0 2 50.0 0 0.0 0 0.0 1 25.0 4 Cebu 0 0.0 2 66.7 1 33.3 0 0.0 0 0.0 3 Mindanao 1 16.7 1 16.7 2 33.3 1 16.7 1 16.7 6 Misamis Oriental 1 25.0 1 25.0 1 25.0 1 25.0 0 0.0 4 General Santos City 0 0.0 0 0.0 0 0.0 0 0.0 1 100.0 1 Zamboanga 0 0.0 0 0.0 1 100.0 0 0.0 0 0.0 1
Total 57 18.3 138 44.4 43 13.8 17 5.5 56 18.0 311
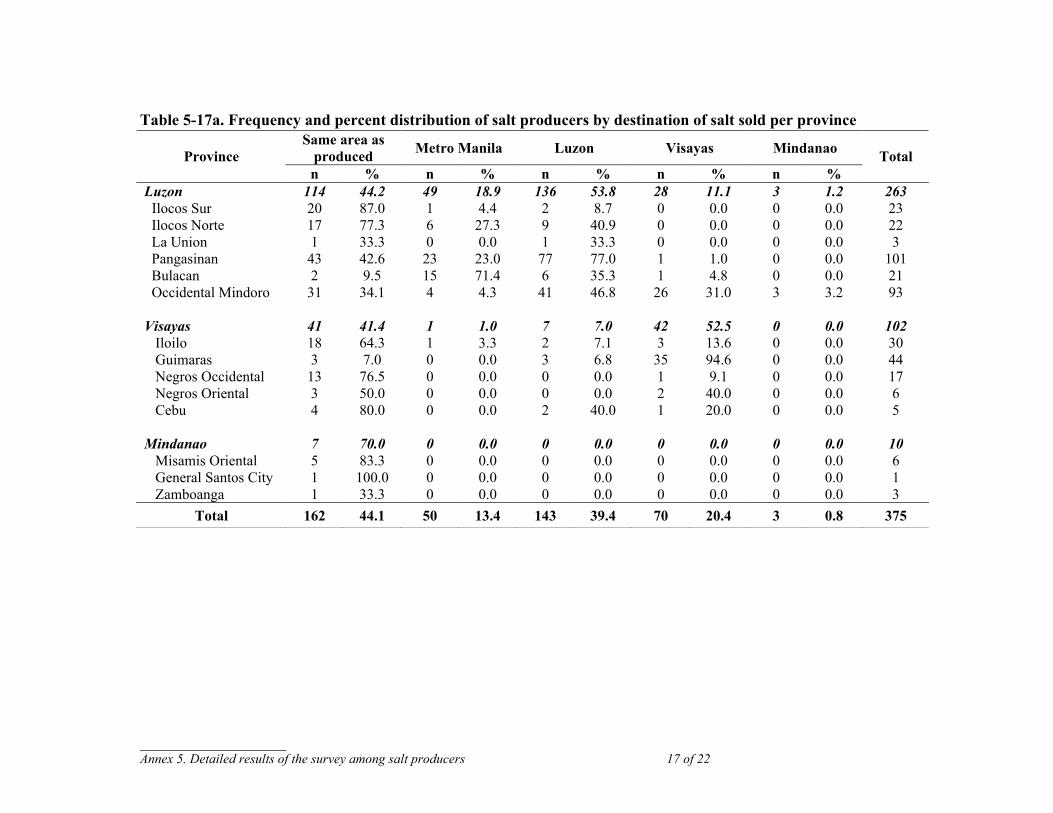
______________________ Annex 5. Detailed results of the survey among salt producers 17 of 22
Table 5-17a. Frequency and percent distribution of salt producers by destination of salt sold per province
Same area as produced Metro Manila Luzon Visayas Mindanao Province n % n % n % n % n %
Total
Luzon 114 44.2 49 18.9 136 53.8 28 11.1 3 1.2 263 Ilocos Sur 20 87.0 1 4.4 2 8.7 0 0.0 0 0.0 23
Ilocos Norte 17 77.3 6 27.3 9 40.9 0 0.0 0 0.0 22 La Union 1 33.3 0 0.0 1 33.3 0 0.0 0 0.0 3 Pangasinan 43 42.6 23 23.0 77 77.0 1 1.0 0 0.0 101 Bulacan 2 9.5 15 71.4 6 35.3 1 4.8 0 0.0 21 Occidental Mindoro 31 34.1 4 4.3 41 46.8 26 31.0 3 3.2 93 Visayas 41 41.4 1 1.0 7 7.0 42 52.5 0 0.0 102 Iloilo 18 64.3 1 3.3 2 7.1 3 13.6 0 0.0 30 Guimaras 3 7.0 0 0.0 3 6.8 35 94.6 0 0.0 44 Negros Occidental 13 76.5 0 0.0 0 0.0 1 9.1 0 0.0 17 Negros Oriental 3 50.0 0 0.0 0 0.0 2 40.0 0 0.0 6 Cebu 4 80.0 0 0.0 2 40.0 1 20.0 0 0.0 5 Mindanao 7 70.0 0 0.0 0 0.0 0 0.0 0 0.0 10 Misamis Oriental 5 83.3 0 0.0 0 0.0 0 0.0 0 0.0 6 General Santos City 1 100.0 0 0.0 0 0.0 0 0.0 0 0.0 1 Zamboanga 1 33.3 0 0.0 0 0.0 0 0.0 0 0.0 3
Total 162 44.1 50 13.4 143 39.4 70 20.4 3 0.8 375
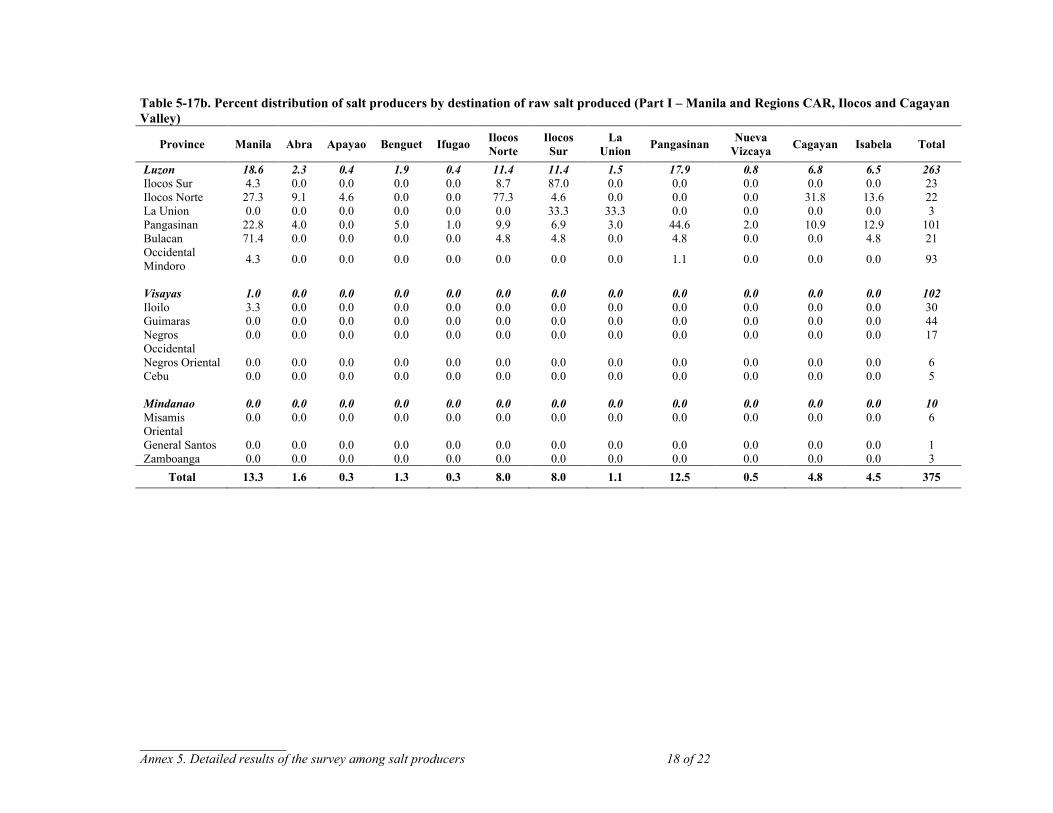
______________________ Annex 5. Detailed results of the survey among salt producers 18 of 22
Table 5-17b. Percent distribution of salt producers by destination of raw salt produced (Part I – Manila and Regions CAR, Ilocos and Cagayan Valley)
Province Manila Abra Apayao Benguet Ifugao Ilocos Norte
Ilocos Sur
La Union Pangasinan Nueva
Vizcaya Cagayan Isabela Total
Luzon 18.6 2.3 0.4 1.9 0.4 11.4 11.4 1.5 17.9 0.8 6.8 6.5 263 Ilocos Sur 4.3 0.0 0.0 0.0 0.0 8.7 87.0 0.0 0.0 0.0 0.0 0.0 23 Ilocos Norte 27.3 9.1 4.6 0.0 0.0 77.3 4.6 0.0 0.0 0.0 31.8 13.6 22 La Union 0.0 0.0 0.0 0.0 0.0 0.0 33.3 33.3 0.0 0.0 0.0 0.0 3 Pangasinan 22.8 4.0 0.0 5.0 1.0 9.9 6.9 3.0 44.6 2.0 10.9 12.9 101 Bulacan 71.4 0.0 0.0 0.0 0.0 4.8 4.8 0.0 4.8 0.0 0.0 4.8 21 Occidental Mindoro 4.3 0.0 0.0 0.0 0.0 0.0 0.0 0.0 1.1 0.0 0.0 0.0 93
Visayas 1.0 0.0 0.0 0.0 0.0 0.0 0.0 0.0 0.0 0.0 0.0 0.0 102 Iloilo 3.3 0.0 0.0 0.0 0.0 0.0 0.0 0.0 0.0 0.0 0.0 0.0 30 Guimaras 0.0 0.0 0.0 0.0 0.0 0.0 0.0 0.0 0.0 0.0 0.0 0.0 44 Negros Occidental
0.0 0.0 0.0 0.0 0.0 0.0 0.0 0.0 0.0 0.0 0.0 0.0 17
Negros Oriental 0.0 0.0 0.0 0.0 0.0 0.0 0.0 0.0 0.0 0.0 0.0 0.0 6 Cebu 0.0 0.0 0.0 0.0 0.0 0.0 0.0 0.0 0.0 0.0 0.0 0.0 5 Mindanao 0.0 0.0 0.0 0.0 0.0 0.0 0.0 0.0 0.0 0.0 0.0 0.0 10 Misamis Oriental
0.0 0.0 0.0 0.0 0.0 0.0 0.0 0.0 0.0 0.0 0.0 0.0 6
General Santos 0.0 0.0 0.0 0.0 0.0 0.0 0.0 0.0 0.0 0.0 0.0 0.0 1 Zamboanga 0.0 0.0 0.0 0.0 0.0 0.0 0.0 0.0 0.0 0.0 0.0 0.0 3
Total 13.3 1.6 0.3 1.3 0.3 8.0 8.0 1.1 12.5 0.5 4.8 4.5 375
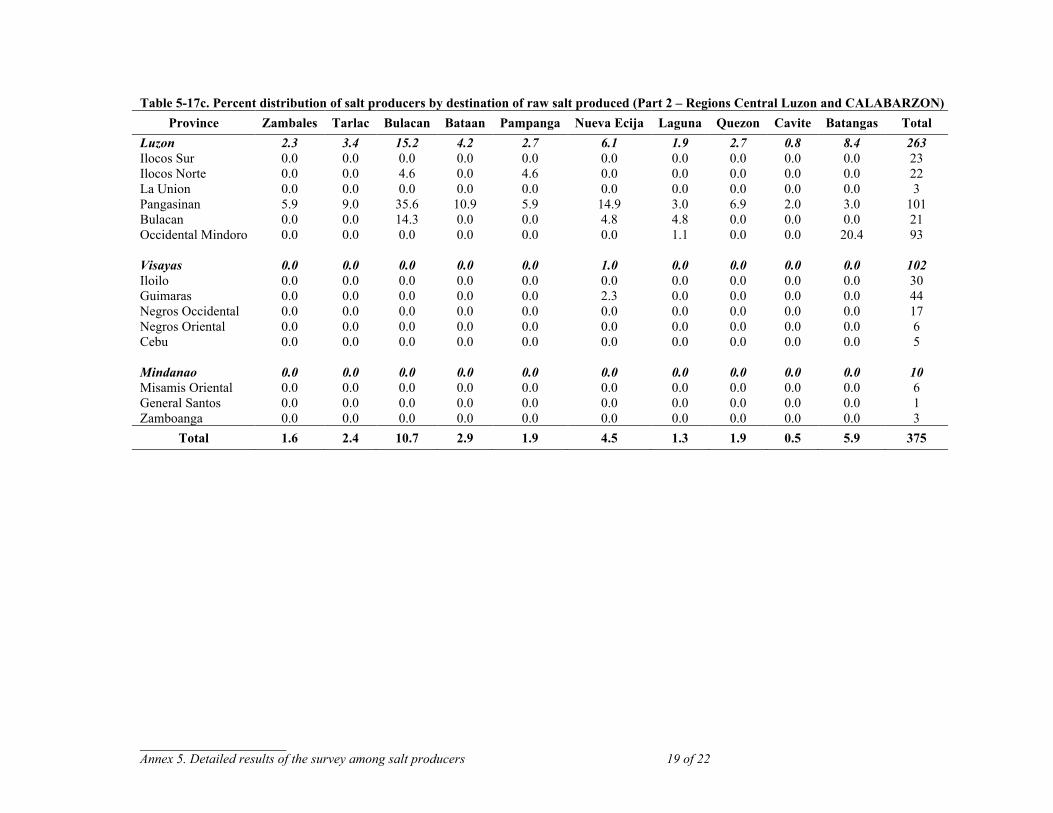
______________________ Annex 5. Detailed results of the survey among salt producers 19 of 22
Table 5-17c. Percent distribution of salt producers by destination of raw salt produced (Part 2 – Regions Central Luzon and CALABARZON) Province Zambales Tarlac Bulacan Bataan Pampanga Nueva Ecija Laguna Quezon Cavite Batangas Total
Luzon 2.3 3.4 15.2 4.2 2.7 6.1 1.9 2.7 0.8 8.4 263 Ilocos Sur 0.0 0.0 0.0 0.0 0.0 0.0 0.0 0.0 0.0 0.0 23 Ilocos Norte 0.0 0.0 4.6 0.0 4.6 0.0 0.0 0.0 0.0 0.0 22 La Union 0.0 0.0 0.0 0.0 0.0 0.0 0.0 0.0 0.0 0.0 3 Pangasinan 5.9 9.0 35.6 10.9 5.9 14.9 3.0 6.9 2.0 3.0 101 Bulacan 0.0 0.0 14.3 0.0 0.0 4.8 4.8 0.0 0.0 0.0 21 Occidental Mindoro 0.0 0.0 0.0 0.0 0.0 0.0 1.1 0.0 0.0 20.4 93 Visayas 0.0 0.0 0.0 0.0 0.0 1.0 0.0 0.0 0.0 0.0 102 Iloilo 0.0 0.0 0.0 0.0 0.0 0.0 0.0 0.0 0.0 0.0 30 Guimaras 0.0 0.0 0.0 0.0 0.0 2.3 0.0 0.0 0.0 0.0 44 Negros Occidental 0.0 0.0 0.0 0.0 0.0 0.0 0.0 0.0 0.0 0.0 17 Negros Oriental 0.0 0.0 0.0 0.0 0.0 0.0 0.0 0.0 0.0 0.0 6 Cebu 0.0 0.0 0.0 0.0 0.0 0.0 0.0 0.0 0.0 0.0 5 Mindanao 0.0 0.0 0.0 0.0 0.0 0.0 0.0 0.0 0.0 0.0 10 Misamis Oriental 0.0 0.0 0.0 0.0 0.0 0.0 0.0 0.0 0.0 0.0 6 General Santos 0.0 0.0 0.0 0.0 0.0 0.0 0.0 0.0 0.0 0.0 1 Zamboanga 0.0 0.0 0.0 0.0 0.0 0.0 0.0 0.0 0.0 0.0 3
Total 1.6 2.4 10.7 2.9 1.9 4.5 1.3 1.9 0.5 5.9 375
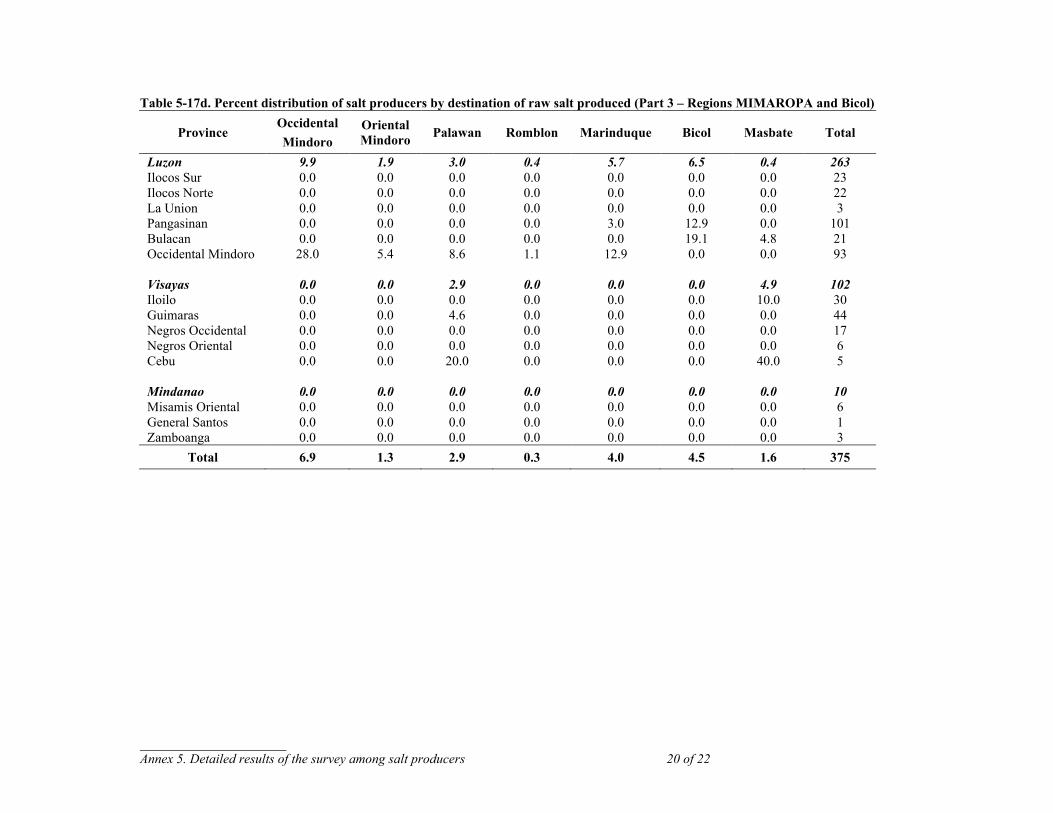
______________________ Annex 5. Detailed results of the survey among salt producers 20 of 22
Table 5-17d. Percent distribution of salt producers by destination of raw salt produced (Part 3 – Regions MIMAROPA and Bicol)
Province Occidental Mindoro
Oriental Mindoro Palawan Romblon Marinduque Bicol Masbate Total
Luzon 9.9 1.9 3.0 0.4 5.7 6.5 0.4 263 Ilocos Sur 0.0 0.0 0.0 0.0 0.0 0.0 0.0 23 Ilocos Norte 0.0 0.0 0.0 0.0 0.0 0.0 0.0 22 La Union 0.0 0.0 0.0 0.0 0.0 0.0 0.0 3 Pangasinan 0.0 0.0 0.0 0.0 3.0 12.9 0.0 101 Bulacan 0.0 0.0 0.0 0.0 0.0 19.1 4.8 21 Occidental Mindoro 28.0 5.4 8.6 1.1 12.9 0.0 0.0 93 Visayas 0.0 0.0 2.9 0.0 0.0 0.0 4.9 102 Iloilo 0.0 0.0 0.0 0.0 0.0 0.0 10.0 30 Guimaras 0.0 0.0 4.6 0.0 0.0 0.0 0.0 44 Negros Occidental 0.0 0.0 0.0 0.0 0.0 0.0 0.0 17 Negros Oriental 0.0 0.0 0.0 0.0 0.0 0.0 0.0 6 Cebu 0.0 0.0 20.0 0.0 0.0 0.0 40.0 5 Mindanao 0.0 0.0 0.0 0.0 0.0 0.0 0.0 10 Misamis Oriental 0.0 0.0 0.0 0.0 0.0 0.0 0.0 6 General Santos 0.0 0.0 0.0 0.0 0.0 0.0 0.0 1 Zamboanga 0.0 0.0 0.0 0.0 0.0 0.0 0.0 3
Total 6.9 1.3 2.9 0.3 4.0 4.5 1.6 375
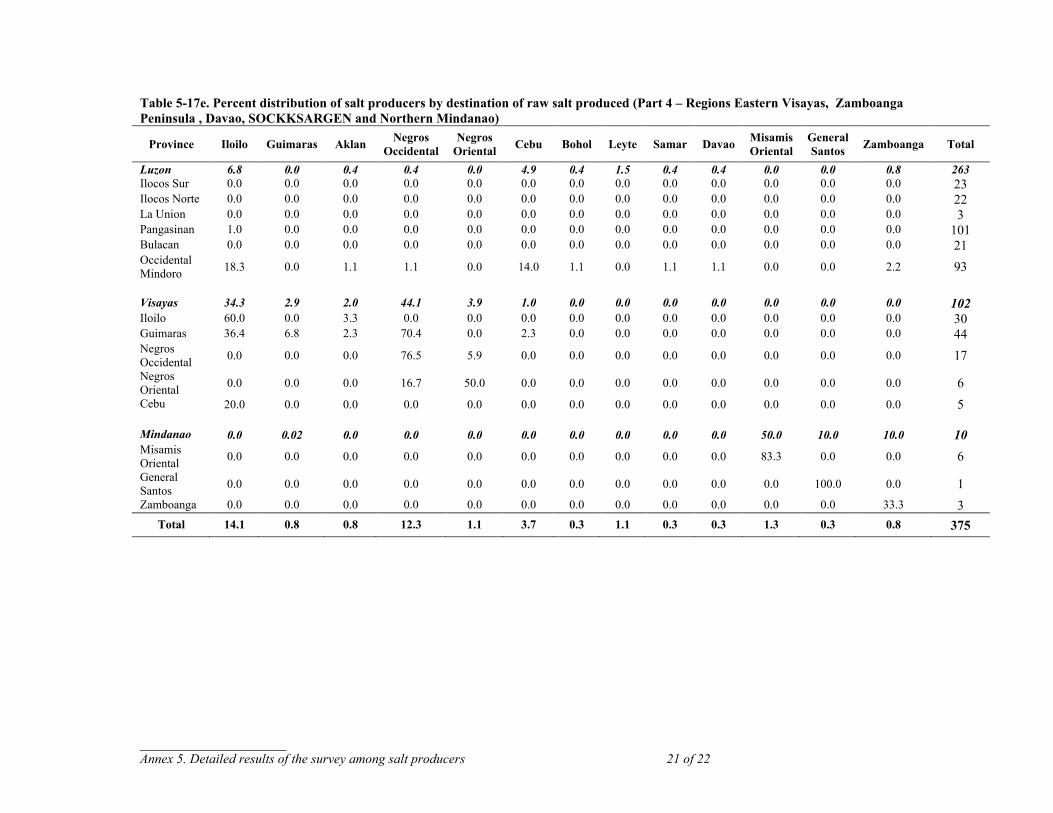
______________________ Annex 5. Detailed results of the survey among salt producers 21 of 22
Table 5-17e. Percent distribution of salt producers by destination of raw salt produced (Part 4 – Regions Eastern Visayas, Zamboanga Peninsula , Davao, SOCKKSARGEN and Northern Mindanao)
Province Iloilo Guimaras Aklan Negros Occidental
Negros Oriental Cebu Bohol Leyte Samar Davao Misamis
Oriental General Santos Zamboanga Total
Luzon 6.8 0.0 0.4 0.4 0.0 4.9 0.4 1.5 0.4 0.4 0.0 0.0 0.8 263 Ilocos Sur 0.0 0.0 0.0 0.0 0.0 0.0 0.0 0.0 0.0 0.0 0.0 0.0 0.0 23 Ilocos Norte 0.0 0.0 0.0 0.0 0.0 0.0 0.0 0.0 0.0 0.0 0.0 0.0 0.0 22 La Union 0.0 0.0 0.0 0.0 0.0 0.0 0.0 0.0 0.0 0.0 0.0 0.0 0.0 3 Pangasinan 1.0 0.0 0.0 0.0 0.0 0.0 0.0 0.0 0.0 0.0 0.0 0.0 0.0 101 Bulacan 0.0 0.0 0.0 0.0 0.0 0.0 0.0 0.0 0.0 0.0 0.0 0.0 0.0 21 Occidental Mindoro 18.3 0.0 1.1 1.1 0.0 14.0 1.1 0.0 1.1 1.1 0.0 0.0 2.2 93 Visayas 34.3 2.9 2.0 44.1 3.9 1.0 0.0 0.0 0.0 0.0 0.0 0.0 0.0 102 Iloilo 60.0 0.0 3.3 0.0 0.0 0.0 0.0 0.0 0.0 0.0 0.0 0.0 0.0 30 Guimaras 36.4 6.8 2.3 70.4 0.0 2.3 0.0 0.0 0.0 0.0 0.0 0.0 0.0 44 Negros Occidental 0.0 0.0 0.0 76.5 5.9 0.0 0.0 0.0 0.0 0.0 0.0 0.0 0.0 17 Negros Oriental 0.0 0.0 0.0 16.7 50.0 0.0 0.0 0.0 0.0 0.0 0.0 0.0 0.0 6 Cebu 20.0 0.0 0.0 0.0 0.0 0.0 0.0 0.0 0.0 0.0 0.0 0.0 0.0 5 Mindanao 0.0 0.02 0.0 0.0 0.0 0.0 0.0 0.0 0.0 0.0 50.0 10.0 10.0 10 Misamis Oriental 0.0 0.0 0.0 0.0 0.0 0.0 0.0 0.0 0.0 0.0 83.3 0.0 0.0 6 General Santos 0.0 0.0 0.0 0.0 0.0 0.0 0.0 0.0 0.0 0.0 0.0 100.0 0.0 1 Zamboanga 0.0 0.0 0.0 0.0 0.0 0.0 0.0 0.0 0.0 0.0 0.0 0.0 33.3 3
Total 14.1 0.8 0.8 12.3 1.1 3.7 0.3 1.1 0.3 0.3 1.3 0.3 0.8 375
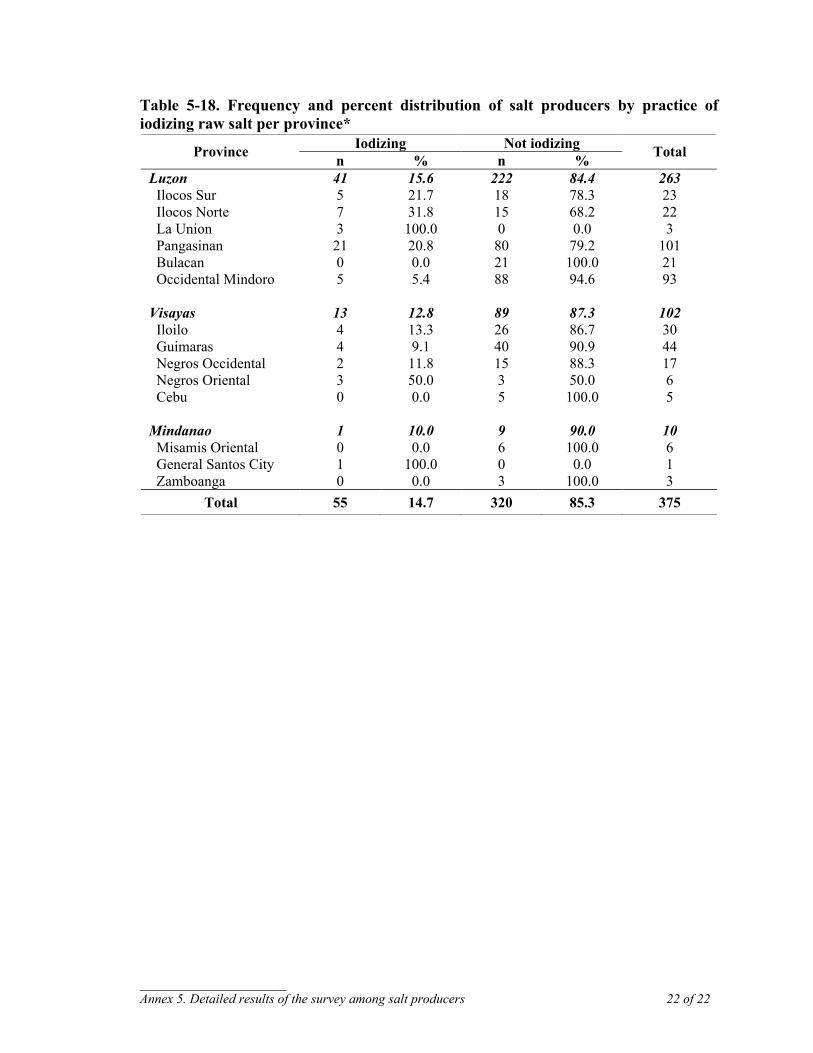
______________________ Annex 5. Detailed results of the survey among salt producers 22 of 22
Table 5-18. Frequency and percent distribution of salt producers by practice of iodizing raw salt per province*
Iodizing Not iodizing Province n % n % Total
Luzon 41 15.6 222 84.4 263 Ilocos Sur 5 21.7 18 78.3 23 Ilocos Norte 7 31.8 15 68.2 22 La Union 3 100.0 0 0.0 3 Pangasinan 21 20.8 80 79.2 101 Bulacan 0 0.0 21 100.0 21 Occidental Mindoro 5 5.4 88 94.6 93 Visayas 13 12.8 89 87.3 102 Iloilo 4 13.3 26 86.7 30 Guimaras 4 9.1 40 90.9 44 Negros Occidental 2 11.8 15 88.3 17 Negros Oriental 3 50.0 3 50.0 6 Cebu 0 0.0 5 100.0 5 Mindanao 1 10.0 9 90.0 10 Misamis Oriental 0 0.0 6 100.0 6 General Santos City 1 100.0 0 0.0 1 Zamboanga 0 0.0 3 100.0 3
Total 55 14.7 320 85.3 375
_____________ Annex 6. Raw salt production 1 of 2
Annex 6. Methods of salt production Solar Evaporation Method Production starts as early as November and usually ends at May or whenever the wet season comes. The farm is divided into water reservoir, concentrating/evaporating ponds and crystallizing ponds or salt beds. Seawater is pumped into the water reservoir for storage for at least 1 week to 1 month for preliminary evaporation. While waiting for the water to achieve salinity, the salt beds are prepared by thoroughly cleaning and leveling the land because prior to the salt harvest season the salt beds are usually used as fishponds. When needed the salt beds are repaired by compacting the soil, leveling the land then spreading a layer of coarse sand. In some provinces, the sand is mixed with cement and/or “apog” to make the base stronger. Then the salt beds are covered with either broken red ceramic tiles, black stones, broken jars or plastic sheets. The tiles are pounded lightly to set and level it off the coarse sand while the plastic sheets are held together by wood. From the water reservoir, the partially concentrated brine is transferred into the concentrating pond to allow further concentration. The brine is stored in the concentrating pond for at least 3 days to at most 2 weeks depending on the rate of evaporation. Next, it is transferred to another concentrating pond to allow evaporating for at least 1 to 2 days. The process is repeated (transfer of brine to concentrating ponds) until the water reaches the bailing wells or supply canals in between the salt beds. This process of transferring brine from one concentrating pond to another usually last from 4 days to 2 weeks depending on the number of concentrating ponds and salinity of the brine. The concentrated brine is stored in the bailing wells/supply canals until it is transferred to the salt beds to dry. The brine is moved from one pond to another using either a water pump or gravitational movement (the water gate is opened to allow the brine to flow). From the bailing wells or supply canals, the concentrated brine is transferred into the salt beds either by opening the water gate or by pouring the brine into the salt beds. During peak season, salt is harvested daily, usually from 3 pm onwards, using either a wooden scraper, pvc pipes cut lengthwise, rubber slippers, coconut shell and other improvised non-metal material. The harvested salt are either placed in a woven basket/box or dumped directly on the side of the salt beds to allow further drying. The salt beds are immediately refilled with the concentrated brine after each harvest for the next day. Cooking method This method can be classified into two: the traditional method that is often used by the subsistence or small-scale producers and the modernized method that is the production process used by the medium to large scale producers. The process starts with the preparation of the sand as filter for seawater to collect concentrated brine. First, sand from nearby bay is cleaned and leveled. Then seawater will be sprinkled on the sand for 2 to 6 days and then allowed to dry. The sun-dried sand will be collected and then transported to the production area. Other salt producers collect the
_____________ Annex 6. Raw salt production 2 of 2
hardened soil of dry fishponds or from the crust of the salty sands left by the receding tide at nearby bay. The sand is transferred either into a wooden box called “kalungkong” or a man-made shallow well made from cement with catchments of either plastic basin, clay (“burnay”) or metal container underneath to catch the dripping brine. Seawater, either previously stored in a man-made well or fetched directly from the nearby sea, is repeatedly poured on the sand filter until enough brine is collected for cooking. The brine is poured into a “kawa” or a steel drum cut into two then cooked using a stove made from hardened soil and clay and firewood as fuel. In the modified method, no soil is used as filter. Seawater is collected from the nearby sea and stored in a square-shaped water reservoir made of cement. An improvised net is used to filter dirt and other matter from the seawater being transferred to the water reservoir. Rock salt, purchased from salt traders, is dissolved in the water reservoir. The prepared brine is either pumped or transferred manually on steel pans for cooking. Rice husks or “ipa” is use as fuel. When the heated brine starts to boil, the scum forming on top are scraped using either a fish net or a coconut shell with handle. This is done to rid the brine of dirt and thus produce a cleaner salt. Cooking of the brine usually lasts for 5 to 20 hours, depending on the quantity of the brine in the pans and the heat from the used fuel. The cooked salt is then transferred into a basket or “tiklis/kuribot” and allowed to drip. For salt producers who still use the traditional method of brine concentration, production usually starts on January and ends on May. On the other hand, salt producers using imported rock salt produces salt the whole year. Salt producers from La Union and Pangasinan also use fresh water (“tubig tabang”) to dissolve the rock salt. Water is pumped to a water reservoir then rock salt is added, dissolved and allowed to stand for at most 1 day.

___________ Annex 7. Detailed results of survey among salt importers/traders 1 of 25
Annex 7. Detailed results of the survey among salt importers/traders
Table 7-1. Frequency and percent distribution of salt importers/traders by years operational per province
*2 respondents indicated unknown
<= 10 years >10 and <=25 years
>25 and <=50 years Province
n % n % n % Total
Luzon 7 50.0 3 21.4 4 28.6 14 La Union 1 100.0 0 0.0 0 0.0 1 Pangasinan 1 20.0 3 60.0 1 20.0 5 Batangas 2 100.0 0 0.0 0 0.0 2 Occidental Mindoro 2 66.7 0 0.0 1 33.3 3 Metro Manila 1 33.3 0 0.0 2 66.7 3 Visayas 5 33.3 7 46.7 3 20.0 15 Iloilo 0 0.0 1 50.0 1 50.0 2 Guimaras 0 0.0 3 100.0 0 0.0 3 Negros Occidental 3 50.0 2 33.3 1 16.7 6 Cebu 2 50.0 1 25.0 1 25.0 4 Mindanao 5 62.5 2 25.0 1 12.5 8 Misamis Oriental 1 50.0 1 50.0 0 0.0 2 Davao 1 33.3 1 33.3 1 33.3 3 General Santos City 1 100.0 0 0.0 0 0.0 1 Zamboanga 2 100.0 0 0.0 0 0.0 3
TOTAL 17 46.0 12 32.4 8 21.6 37*
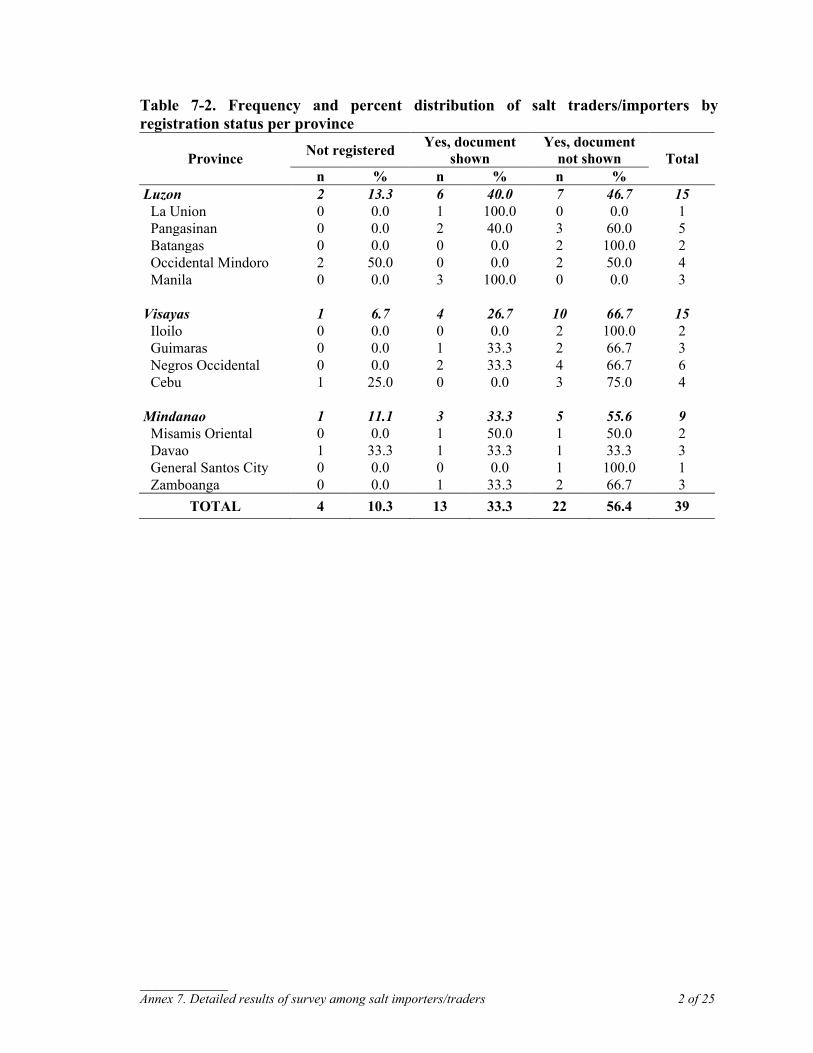
___________ Annex 7. Detailed results of survey among salt importers/traders 2 of 25
Table 7-2. Frequency and percent distribution of salt traders/importers by registration status per province
Not registered Yes, document shown
Yes, document not shown Province
n % n % n % Total
Luzon 2 13.3 6 40.0 7 46.7 15 La Union 0 0.0 1 100.0 0 0.0 1 Pangasinan 0 0.0 2 40.0 3 60.0 5 Batangas 0 0.0 0 0.0 2 100.0 2 Occidental Mindoro 2 50.0 0 0.0 2 50.0 4 Manila 0 0.0 3 100.0 0 0.0 3 Visayas 1 6.7 4 26.7 10 66.7 15 Iloilo 0 0.0 0 0.0 2 100.0 2 Guimaras 0 0.0 1 33.3 2 66.7 3 Negros Occidental 0 0.0 2 33.3 4 66.7 6 Cebu 1 25.0 0 0.0 3 75.0 4 Mindanao 1 11.1 3 33.3 5 55.6 9 Misamis Oriental 0 0.0 1 50.0 1 50.0 2 Davao 1 33.3 1 33.3 1 33.3 3 General Santos City 0 0.0 0 0.0 1 100.0 1 Zamboanga 0 0.0 1 33.3 2 66.7 3
TOTAL 4 10.3 13 33.3 22 56.4 39
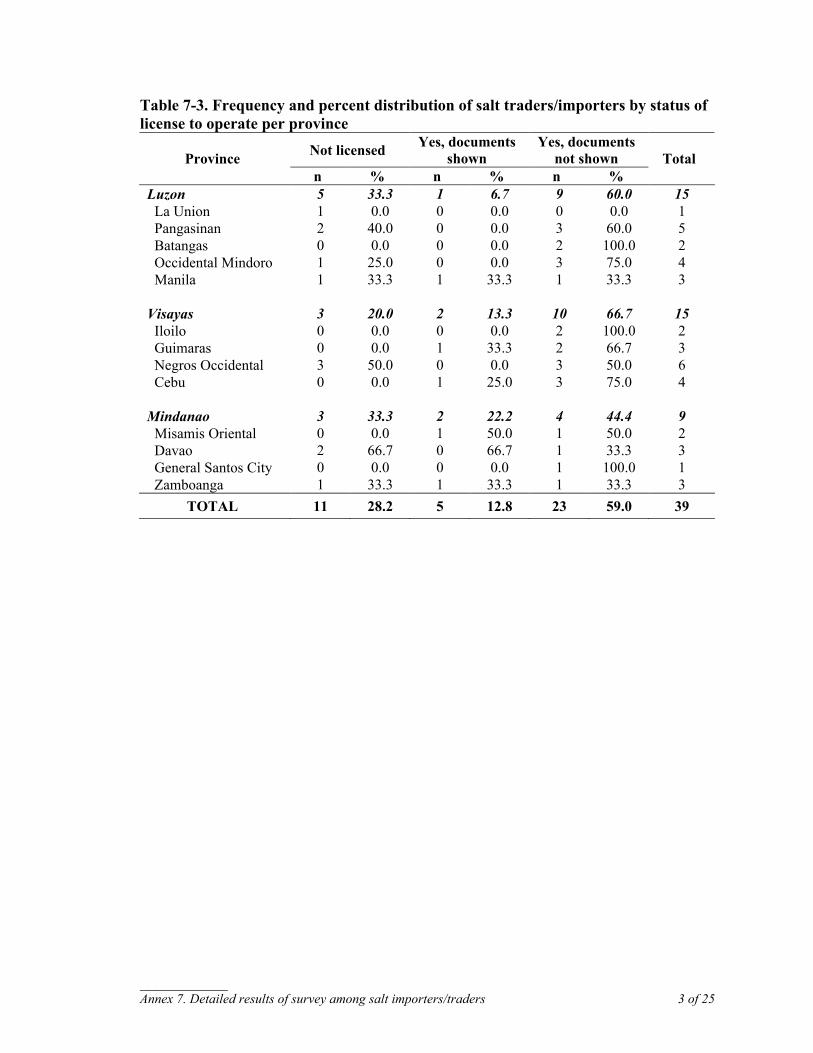
___________ Annex 7. Detailed results of survey among salt importers/traders 3 of 25
Table 7-3. Frequency and percent distribution of salt traders/importers by status of license to operate per province
Not licensed Yes, documents shown
Yes, documents not shown Province
n % n % n % Total
Luzon 5 33.3 1 6.7 9 60.0 15 La Union 1 0.0 0 0.0 0 0.0 1 Pangasinan 2 40.0 0 0.0 3 60.0 5 Batangas 0 0.0 0 0.0 2 100.0 2 Occidental Mindoro 1 25.0 0 0.0 3 75.0 4 Manila 1 33.3 1 33.3 1 33.3 3 Visayas 3 20.0 2 13.3 10 66.7 15 Iloilo 0 0.0 0 0.0 2 100.0 2 Guimaras 0 0.0 1 33.3 2 66.7 3 Negros Occidental 3 50.0 0 0.0 3 50.0 6 Cebu 0 0.0 1 25.0 3 75.0 4 Mindanao 3 33.3 2 22.2 4 44.4 9 Misamis Oriental 0 0.0 1 50.0 1 50.0 2 Davao 2 66.7 0 66.7 1 33.3 3 General Santos City 0 0.0 0 0.0 1 100.0 1 Zamboanga 1 33.3 1 33.3 1 33.3 3
TOTAL 11 28.2 5 12.8 23 59.0 39
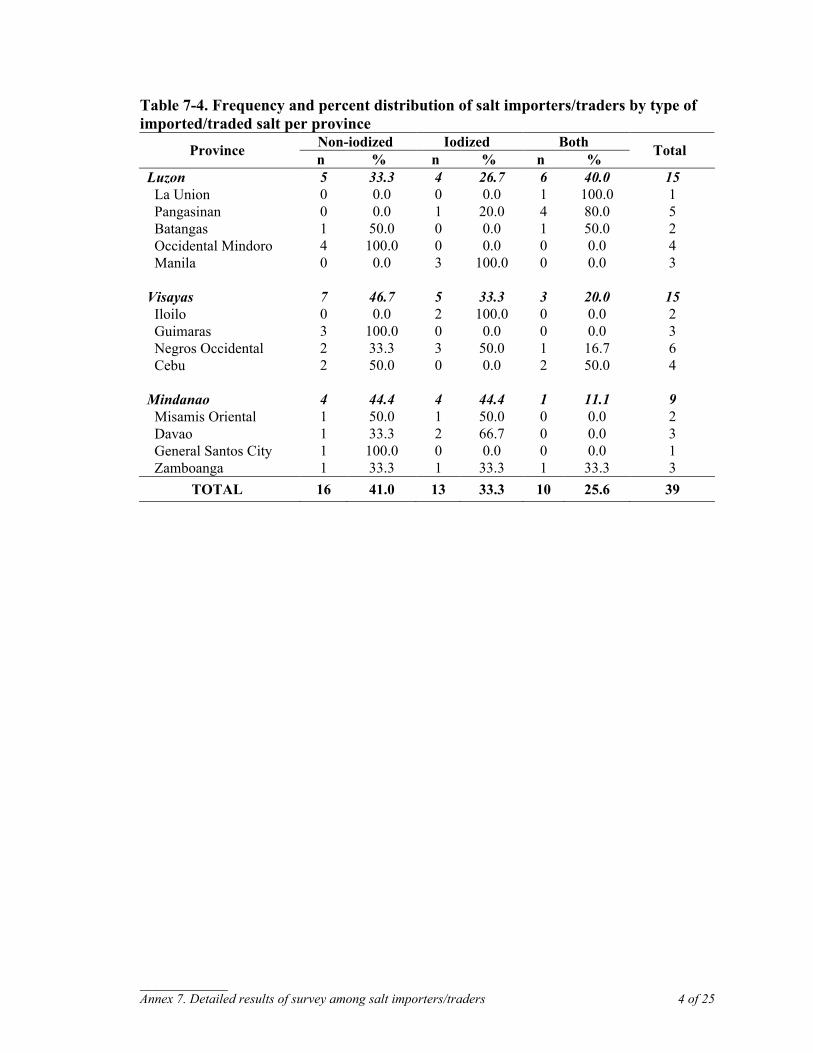
___________ Annex 7. Detailed results of survey among salt importers/traders 4 of 25
Table 7-4. Frequency and percent distribution of salt importers/traders by type of imported/traded salt per province
Non-iodized Iodized Both Province n % n % n % Total
Luzon 5 33.3 4 26.7 6 40.0 15 La Union 0 0.0 0 0.0 1 100.0 1 Pangasinan 0 0.0 1 20.0 4 80.0 5 Batangas 1 50.0 0 0.0 1 50.0 2 Occidental Mindoro 4 100.0 0 0.0 0 0.0 4 Manila 0 0.0 3 100.0 0 0.0 3 Visayas 7 46.7 5 33.3 3 20.0 15 Iloilo 0 0.0 2 100.0 0 0.0 2 Guimaras 3 100.0 0 0.0 0 0.0 3 Negros Occidental 2 33.3 3 50.0 1 16.7 6 Cebu 2 50.0 0 0.0 2 50.0 4 Mindanao 4 44.4 4 44.4 1 11.1 9 Misamis Oriental 1 50.0 1 50.0 0 0.0 2 Davao 1 33.3 2 66.7 0 0.0 3 General Santos City 1 100.0 0 0.0 0 0.0 1 Zamboanga 1 33.3 1 33.3 1 33.3 3
TOTAL 16 41.0 13 33.3 10 25.6 39
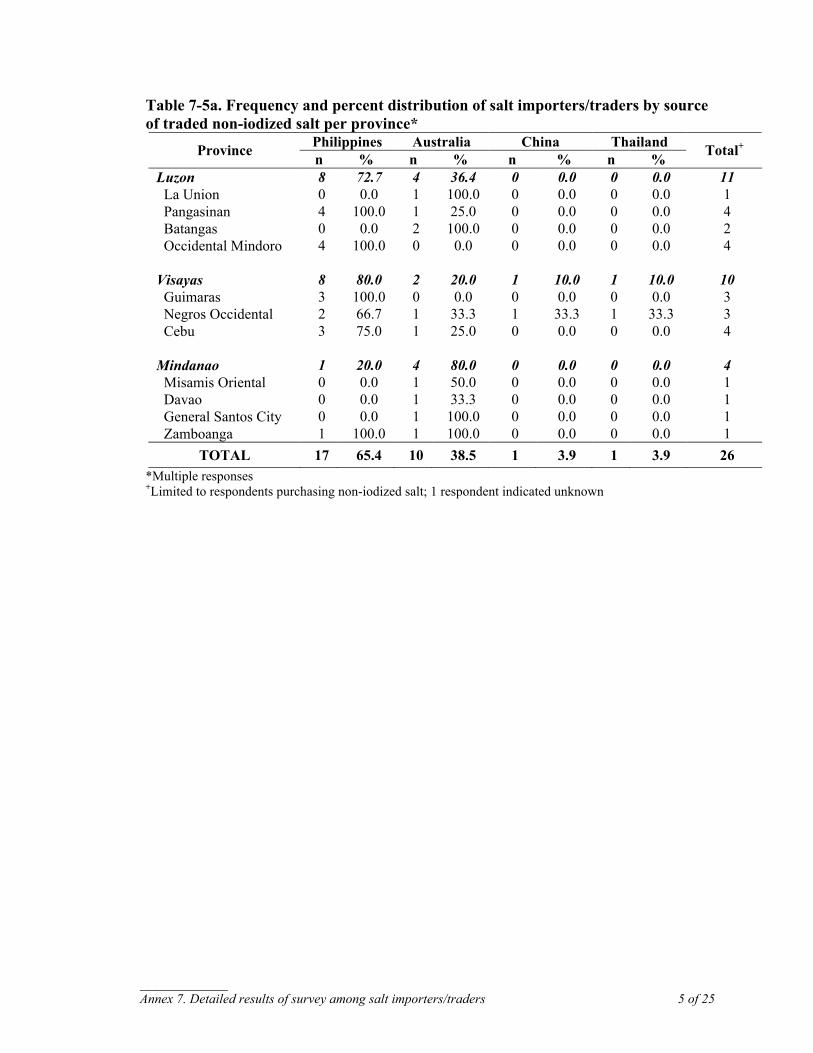
___________ Annex 7. Detailed results of survey among salt importers/traders 5 of 25
Table 7-5a. Frequency and percent distribution of salt importers/traders by source of traded non-iodized salt per province*
Philippines Australia China Thailand Province n % n % n % n % Total+
Luzon 8 72.7 4 36.4 0 0.0 0 0.0 11 La Union 0 0.0 1 100.0 0 0.0 0 0.0 1 Pangasinan 4 100.0 1 25.0 0 0.0 0 0.0 4 Batangas 0 0.0 2 100.0 0 0.0 0 0.0 2 Occidental Mindoro 4 100.0 0 0.0 0 0.0 0 0.0 4 Visayas 8 80.0 2 20.0 1 10.0 1 10.0 10 Guimaras 3 100.0 0 0.0 0 0.0 0 0.0 3 Negros Occidental 2 66.7 1 33.3 1 33.3 1 33.3 3 Cebu 3 75.0 1 25.0 0 0.0 0 0.0 4 Mindanao 1 20.0 4 80.0 0 0.0 0 0.0 4 Misamis Oriental 0 0.0 1 50.0 0 0.0 0 0.0 1 Davao 0 0.0 1 33.3 0 0.0 0 0.0 1 General Santos City 0 0.0 1 100.0 0 0.0 0 0.0 1 Zamboanga 1 100.0 1 100.0 0 0.0 0 0.0 1
TOTAL 17 65.4 10 38.5 1 3.9 1 3.9 26 *Multiple responses +Limited to respondents purchasing non-iodized salt; 1 respondent indicated unknown
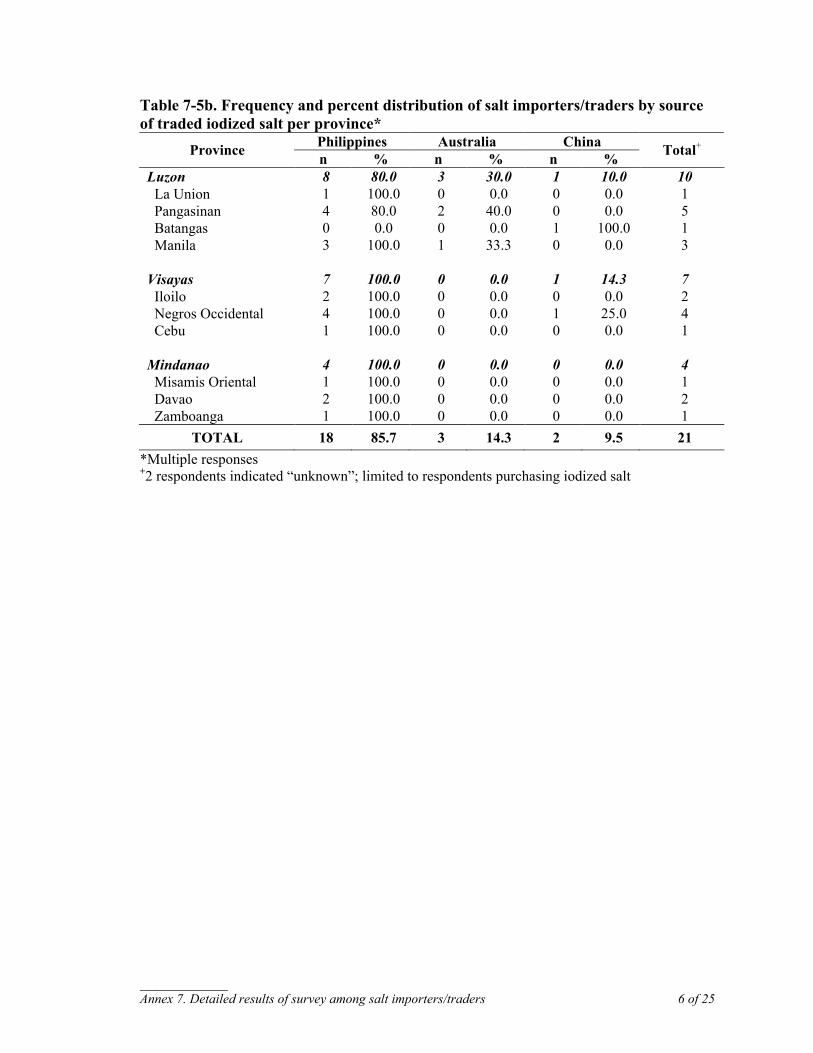
___________ Annex 7. Detailed results of survey among salt importers/traders 6 of 25
Table 7-5b. Frequency and percent distribution of salt importers/traders by source of traded iodized salt per province*
Philippines Australia China Province n % n % n % Total+
Luzon 8 80.0 3 30.0 1 10.0 10 La Union 1 100.0 0 0.0 0 0.0 1 Pangasinan 4 80.0 2 40.0 0 0.0 5 Batangas 0 0.0 0 0.0 1 100.0 1 Manila 3 100.0 1 33.3 0 0.0 3 Visayas 7 100.0 0 0.0 1 14.3 7 Iloilo 2 100.0 0 0.0 0 0.0 2 Negros Occidental 4 100.0 0 0.0 1 25.0 4 Cebu 1 100.0 0 0.0 0 0.0 1 Mindanao 4 100.0 0 0.0 0 0.0 4 Misamis Oriental 1 100.0 0 0.0 0 0.0 1 Davao 2 100.0 0 0.0 0 0.0 2 Zamboanga 1 100.0 0 0.0 0 0.0 1
TOTAL 18 85.7 3 14.3 2 9.5 21 *Multiple responses +2 respondents indicated “unknown”; limited to respondents purchasing iodized salt
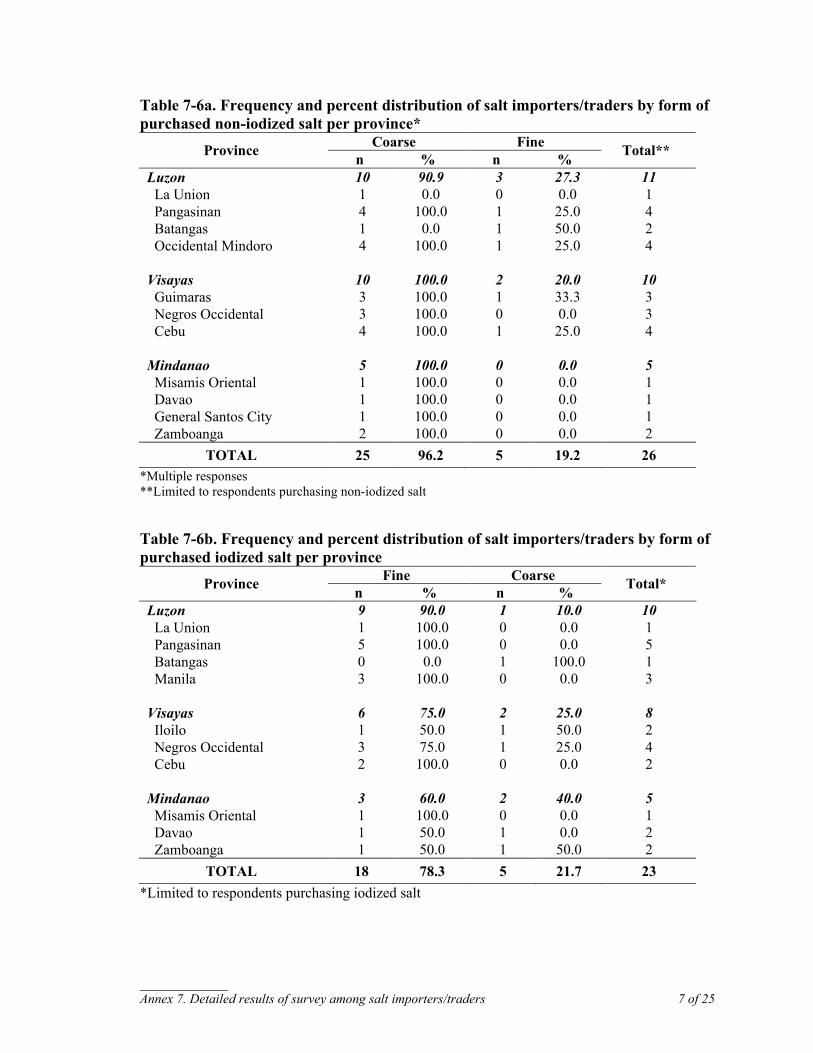
___________ Annex 7. Detailed results of survey among salt importers/traders 7 of 25
Table 7-6a. Frequency and percent distribution of salt importers/traders by form of purchased non-iodized salt per province*
Coarse Fine Province n % n % Total**
Luzon 10 90.9 3 27.3 11 La Union 1 0.0 0 0.0 1 Pangasinan 4 100.0 1 25.0 4 Batangas 1 0.0 1 50.0 2 Occidental Mindoro 4 100.0 1 25.0 4 Visayas 10 100.0 2 20.0 10 Guimaras 3 100.0 1 33.3 3 Negros Occidental 3 100.0 0 0.0 3 Cebu 4 100.0 1 25.0 4 Mindanao 5 100.0 0 0.0 5 Misamis Oriental 1 100.0 0 0.0 1 Davao 1 100.0 0 0.0 1 General Santos City 1 100.0 0 0.0 1 Zamboanga 2 100.0 0 0.0 2
TOTAL 25 96.2 5 19.2 26 *Multiple responses **Limited to respondents purchasing non-iodized salt
Table 7-6b. Frequency and percent distribution of salt importers/traders by form of purchased iodized salt per province
Fine Coarse Province n % n % Total*
Luzon 9 90.0 1 10.0 10 La Union 1 100.0 0 0.0 1 Pangasinan 5 100.0 0 0.0 5 Batangas 0 0.0 1 100.0 1 Manila 3 100.0 0 0.0 3 Visayas 6 75.0 2 25.0 8 Iloilo 1 50.0 1 50.0 2 Negros Occidental 3 75.0 1 25.0 4 Cebu 2 100.0 0 0.0 2 Mindanao 3 60.0 2 40.0 5 Misamis Oriental 1 100.0 0 0.0 1 Davao 1 50.0 1 0.0 2 Zamboanga 1 50.0 1 50.0 2
TOTAL 18 78.3 5 21.7 23 *Limited to respondents purchasing iodized salt

___________ Annex 7. Detailed results of survey among salt importers/traders 8 of 25
Table 7-7a. Frequency and percent distribution of salt importers/traders by use of traded non-iodized salt per province*
Human consumption
Food processing Industrial Animal Province
n % n % n % n % Total+
Luzon 7 63.6 5 45.5 2 18.2 3 27.3 11 La Union 0 0.0 0 0.0 1 100.0 0 0.0 1 Pangasinan 3 75.0 2 50.0 0 0.0 1 25.0 4 Batangas 1 50.0 1 50.0 1 50.0 1 50.0 2 Occidental Mindoro 3 75.0 2 50.0 0 0.0 1 25.0 3 Visayas 8 80.0 4 40.0 1 10.0 1 10.0 10 Guimaras 3 100.0 2 66.7 0 0.0 0 0.0 3 Negros Occidental 3 100.0 0 0.0 1 33.3 0 0.0 3 Cebu 2 50.0 2 50.0 0 0.0 1 25.0 4 Mindanao 4 80.0 2 40.0 2 40.0 0 0.0 5 Misamis Oriental 0 0.0 1 100.0 0 0.0 0 0.0 1 Davao 1 100.0 1 100.0 0 0.0 0 0.0 1 General Santos City 1 100.0 0 0.0 1 100.0 0 0.0 1 Zamboanga 2 100.0 0 0.0 1 50.0 0 0.0 2
TOTAL 19 73.1 11 42.3 5 19.2 4 15.4 26 *Multiple responses +Limited to respondents trading non-iodized salt
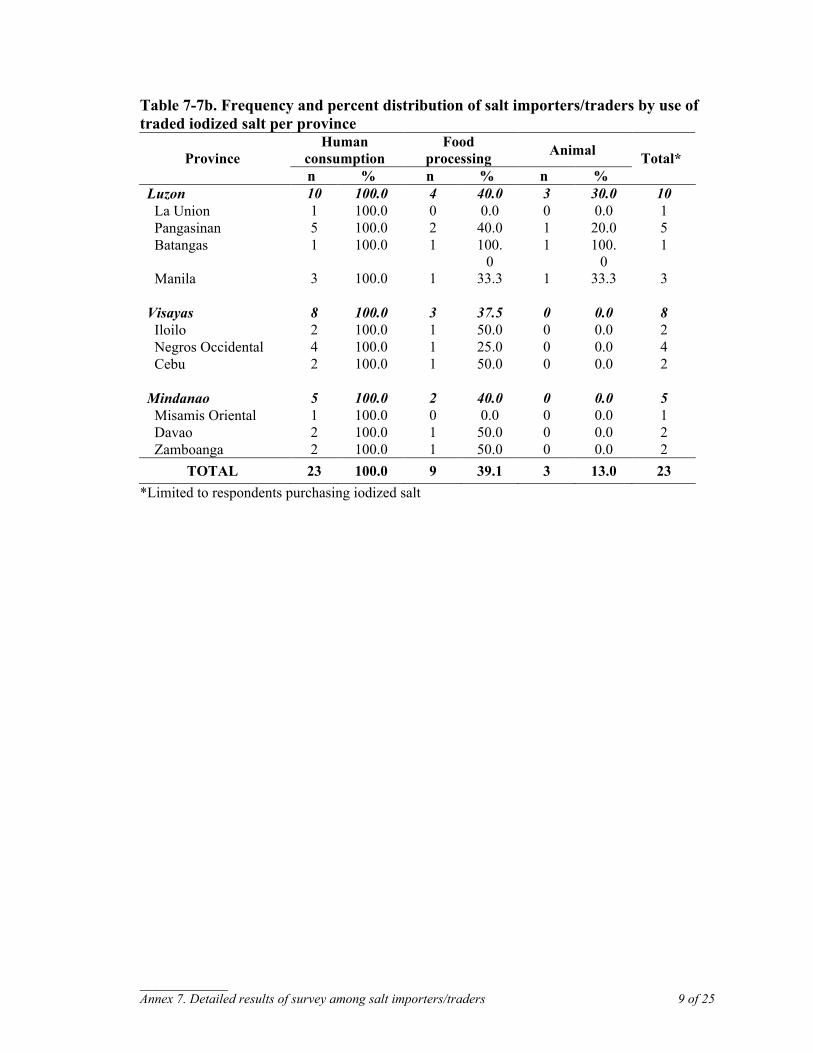
___________ Annex 7. Detailed results of survey among salt importers/traders 9 of 25
Table 7-7b. Frequency and percent distribution of salt importers/traders by use of traded iodized salt per province
Human consumption
Food processing Animal Province
n % n % n % Total*
Luzon 10 100.0 4 40.0 3 30.0 10 La Union 1 100.0 0 0.0 0 0.0 1 Pangasinan 5 100.0 2 40.0 1 20.0 5 Batangas 1 100.0 1 100.
0 1 100.
0 1
Manila 3 100.0 1 33.3 1 33.3 3 Visayas 8 100.0 3 37.5 0 0.0 8 Iloilo 2 100.0 1 50.0 0 0.0 2 Negros Occidental 4 100.0 1 25.0 0 0.0 4 Cebu 2 100.0 1 50.0 0 0.0 2 Mindanao 5 100.0 2 40.0 0 0.0 5 Misamis Oriental 1 100.0 0 0.0 0 0.0 1 Davao 2 100.0 1 50.0 0 0.0 2 Zamboanga 2 100.0 1 50.0 0 0.0 2
TOTAL 23 100.0 9 39.1 3 13.0 23 *Limited to respondents purchasing iodized salt
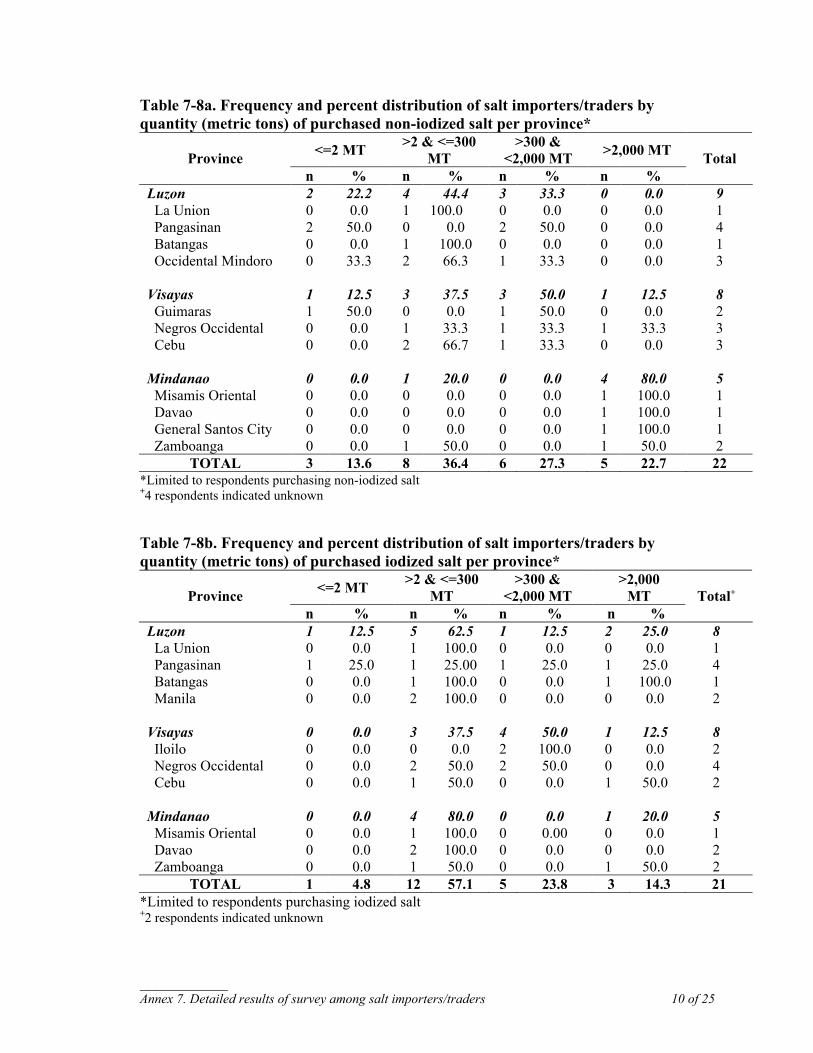
___________ Annex 7. Detailed results of survey among salt importers/traders 10 of 25
Table 7-8a. Frequency and percent distribution of salt importers/traders by quantity (metric tons) of purchased non-iodized salt per province*
<=2 MT >2 & <=300 MT
>300 & <2,000 MT >2,000 MT Province
n % n % n % n % Total
Luzon 2 22.2 4 44.4 3 33.3 0 0.0 9 La Union 0 0.0 1 100.0 0 0.0 0 0.0 1 Pangasinan 2 50.0 0 0.0 2 50.0 0 0.0 4 Batangas 0 0.0 1 100.0 0 0.0 0 0.0 1 Occidental Mindoro 0 33.3 2 66.3 1 33.3 0 0.0 3 Visayas 1 12.5 3 37.5 3 50.0 1 12.5 8 Guimaras 1 50.0 0 0.0 1 50.0 0 0.0 2 Negros Occidental 0 0.0 1 33.3 1 33.3 1 33.3 3 Cebu 0 0.0 2 66.7 1 33.3 0 0.0 3 Mindanao 0 0.0 1 20.0 0 0.0 4 80.0 5 Misamis Oriental 0 0.0 0 0.0 0 0.0 1 100.0 1 Davao 0 0.0 0 0.0 0 0.0 1 100.0 1 General Santos City 0 0.0 0 0.0 0 0.0 1 100.0 1 Zamboanga 0 0.0 1 50.0 0 0.0 1 50.0 2
TOTAL 3 13.6 8 36.4 6 27.3 5 22.7 22 *Limited to respondents purchasing non-iodized salt +4 respondents indicated unknown
Table 7-8b. Frequency and percent distribution of salt importers/traders by quantity (metric tons) of purchased iodized salt per province*
<=2 MT >2 & <=300 MT
>300 & <2,000 MT
>2,000 MT Province
n % n % n % n % Total+
Luzon 1 12.5 5 62.5 1 12.5 2 25.0 8 La Union 0 0.0 1 100.0 0 0.0 0 0.0 1 Pangasinan 1 25.0 1 25.00 1 25.0 1 25.0 4 Batangas 0 0.0 1 100.0 0 0.0 1 100.0 1 Manila 0 0.0 2 100.0 0 0.0 0 0.0 2 Visayas 0 0.0 3 37.5 4 50.0 1 12.5 8 Iloilo 0 0.0 0 0.0 2 100.0 0 0.0 2 Negros Occidental 0 0.0 2 50.0 2 50.0 0 0.0 4 Cebu 0 0.0 1 50.0 0 0.0 1 50.0 2 Mindanao 0 0.0 4 80.0 0 0.0 1 20.0 5 Misamis Oriental 0 0.0 1 100.0 0 0.00 0 0.0 1 Davao 0 0.0 2 100.0 0 0.0 0 0.0 2 Zamboanga 0 0.0 1 50.0 0 0.0 1 50.0 2
TOTAL 1 4.8 12 57.1 5 23.8 3 14.3 21 *Limited to respondents purchasing iodized salt +2 respondents indicated unknown
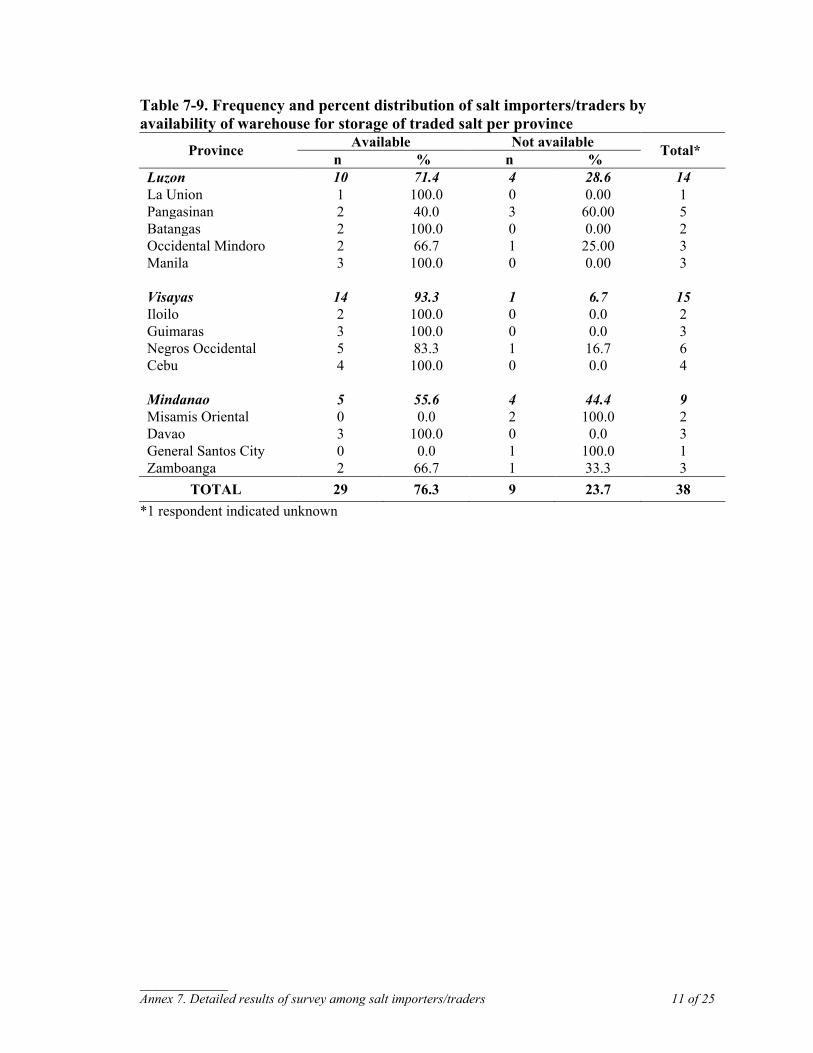
___________ Annex 7. Detailed results of survey among salt importers/traders 11 of 25
Table 7-9. Frequency and percent distribution of salt importers/traders by availability of warehouse for storage of traded salt per province
Available Not available Province n % n % Total*
Luzon 10 71.4 4 28.6 14 La Union 1 100.0 0 0.00 1 Pangasinan 2 40.0 3 60.00 5 Batangas 2 100.0 0 0.00 2 Occidental Mindoro 2 66.7 1 25.00 3 Manila 3 100.0 0 0.00 3 Visayas 14 93.3 1 6.7 15 Iloilo 2 100.0 0 0.0 2 Guimaras 3 100.0 0 0.0 3 Negros Occidental 5 83.3 1 16.7 6 Cebu 4 100.0 0 0.0 4 Mindanao 5 55.6 4 44.4 9 Misamis Oriental 0 0.0 2 100.0 2 Davao 3 100.0 0 0.0 3 General Santos City 0 0.0 1 100.0 1 Zamboanga 2 66.7 1 33.3 3
TOTAL 29 76.3 9 23.7 38 *1 respondent indicated unknown
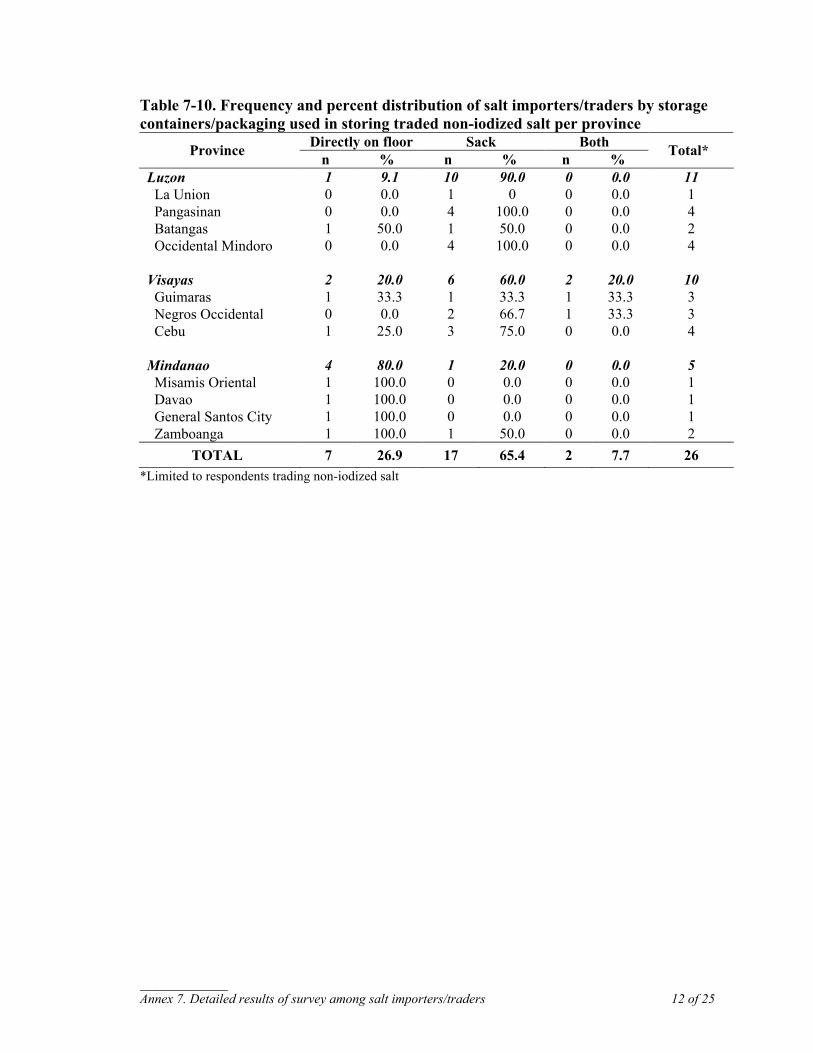
___________ Annex 7. Detailed results of survey among salt importers/traders 12 of 25
Table 7-10. Frequency and percent distribution of salt importers/traders by storage containers/packaging used in storing traded non-iodized salt per province
Directly on floor Sack Both Province n % n % n % Total*
Luzon 1 9.1 10 90.0 0 0.0 11 La Union 0 0.0 1 0 0 0.0 1 Pangasinan 0 0.0 4 100.0 0 0.0 4 Batangas 1 50.0 1 50.0 0 0.0 2 Occidental Mindoro 0 0.0 4 100.0 0 0.0 4 Visayas 2 20.0 6 60.0 2 20.0 10 Guimaras 1 33.3 1 33.3 1 33.3 3 Negros Occidental 0 0.0 2 66.7 1 33.3 3 Cebu 1 25.0 3 75.0 0 0.0 4 Mindanao 4 80.0 1 20.0 0 0.0 5 Misamis Oriental 1 100.0 0 0.0 0 0.0 1 Davao 1 100.0 0 0.0 0 0.0 1 General Santos City 1 100.0 0 0.0 0 0.0 1 Zamboanga 1 100.0 1 50.0 0 0.0 2
TOTAL 7 26.9 17 65.4 2 7.7 26 *Limited to respondents trading non-iodized salt
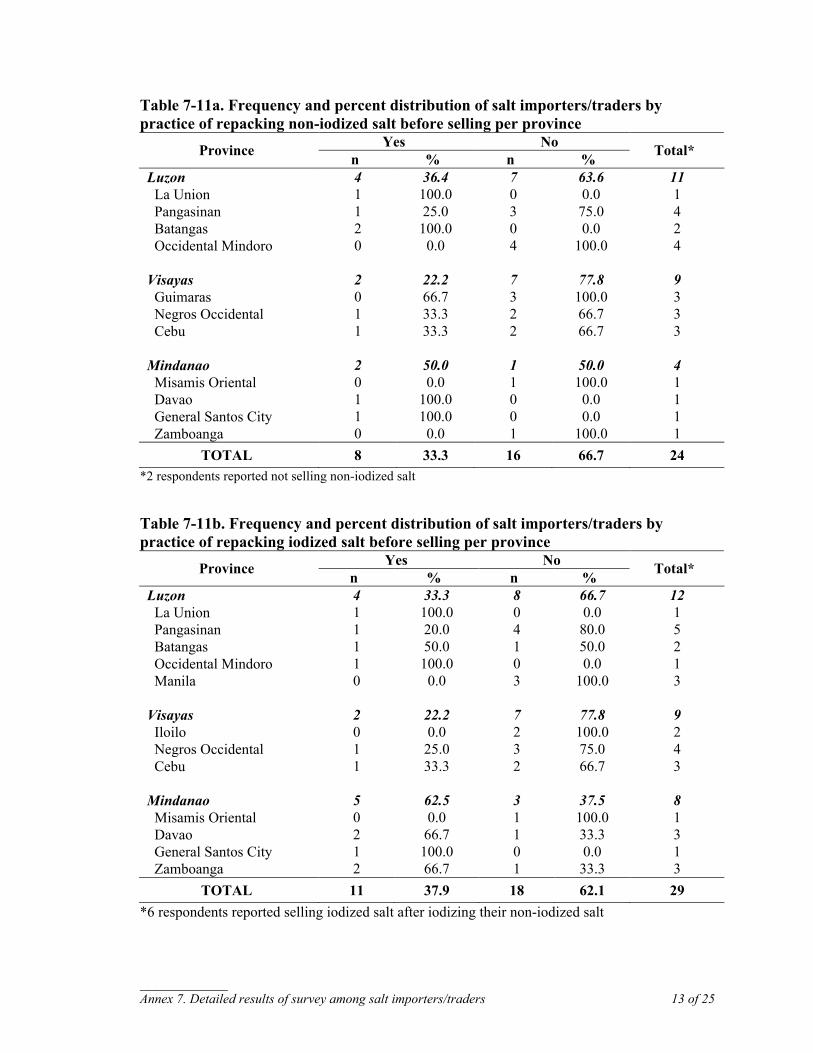
___________ Annex 7. Detailed results of survey among salt importers/traders 13 of 25
Table 7-11a. Frequency and percent distribution of salt importers/traders by practice of repacking non-iodized salt before selling per province
Yes No Province n % n % Total*
Luzon 4 36.4 7 63.6 11 La Union 1 100.0 0 0.0 1 Pangasinan 1 25.0 3 75.0 4 Batangas 2 100.0 0 0.0 2 Occidental Mindoro 0 0.0 4 100.0 4 Visayas 2 22.2 7 77.8 9 Guimaras 0 66.7 3 100.0 3 Negros Occidental 1 33.3 2 66.7 3 Cebu 1 33.3 2 66.7 3 Mindanao 2 50.0 1 50.0 4 Misamis Oriental 0 0.0 1 100.0 1 Davao 1 100.0 0 0.0 1 General Santos City 1 100.0 0 0.0 1 Zamboanga 0 0.0 1 100.0 1
TOTAL 8 33.3 16 66.7 24 *2 respondents reported not selling non-iodized salt
Table 7-11b. Frequency and percent distribution of salt importers/traders by practice of repacking iodized salt before selling per province
Yes No Province n % n % Total*
Luzon 4 33.3 8 66.7 12 La Union 1 100.0 0 0.0 1 Pangasinan 1 20.0 4 80.0 5 Batangas 1 50.0 1 50.0 2 Occidental Mindoro 1 100.0 0 0.0 1 Manila 0 0.0 3 100.0 3 Visayas 2 22.2 7 77.8 9 Iloilo 0 0.0 2 100.0 2 Negros Occidental 1 25.0 3 75.0 4 Cebu 1 33.3 2 66.7 3 Mindanao 5 62.5 3 37.5 8 Misamis Oriental 0 0.0 1 100.0 1 Davao 2 66.7 1 33.3 3 General Santos City 1 100.0 0 0.0 1 Zamboanga 2 66.7 1 33.3 3
TOTAL 11 37.9 18 62.1 29 *6 respondents reported selling iodized salt after iodizing their non-iodized salt
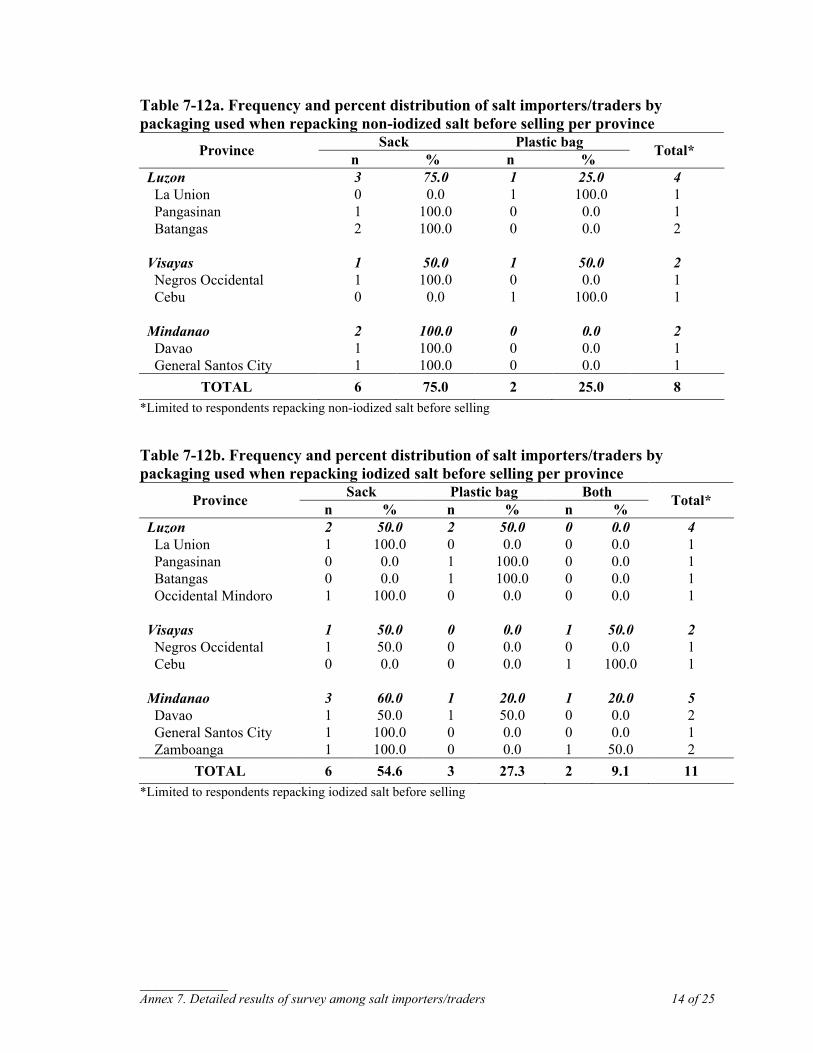
___________ Annex 7. Detailed results of survey among salt importers/traders 14 of 25
Table 7-12a. Frequency and percent distribution of salt importers/traders by packaging used when repacking non-iodized salt before selling per province
Sack Plastic bag Province n % n % Total*
Luzon 3 75.0 1 25.0 4 La Union 0 0.0 1 100.0 1 Pangasinan 1 100.0 0 0.0 1 Batangas 2 100.0 0 0.0 2 Visayas 1 50.0 1 50.0 2 Negros Occidental 1 100.0 0 0.0 1 Cebu 0 0.0 1 100.0 1 Mindanao 2 100.0 0 0.0 2 Davao 1 100.0 0 0.0 1 General Santos City 1 100.0 0 0.0 1
TOTAL 6 75.0 2 25.0 8 *Limited to respondents repacking non-iodized salt before selling
Table 7-12b. Frequency and percent distribution of salt importers/traders by packaging used when repacking iodized salt before selling per province
Sack Plastic bag Both Province n % n % n % Total*
Luzon 2 50.0 2 50.0 0 0.0 4 La Union 1 100.0 0 0.0 0 0.0 1 Pangasinan 0 0.0 1 100.0 0 0.0 1 Batangas 0 0.0 1 100.0 0 0.0 1 Occidental Mindoro 1 100.0 0 0.0 0 0.0 1 Visayas 1 50.0 0 0.0 1 50.0 2 Negros Occidental 1 50.0 0 0.0 0 0.0 1 Cebu 0 0.0 0 0.0 1 100.0 1 Mindanao 3 60.0 1 20.0 1 20.0 5 Davao 1 50.0 1 50.0 0 0.0 2 General Santos City 1 100.0 0 0.0 0 0.0 1 Zamboanga 1 100.0 0 0.0 1 50.0 2
TOTAL 6 54.6 3 27.3 2 9.1 11 *Limited to respondents repacking iodized salt before selling
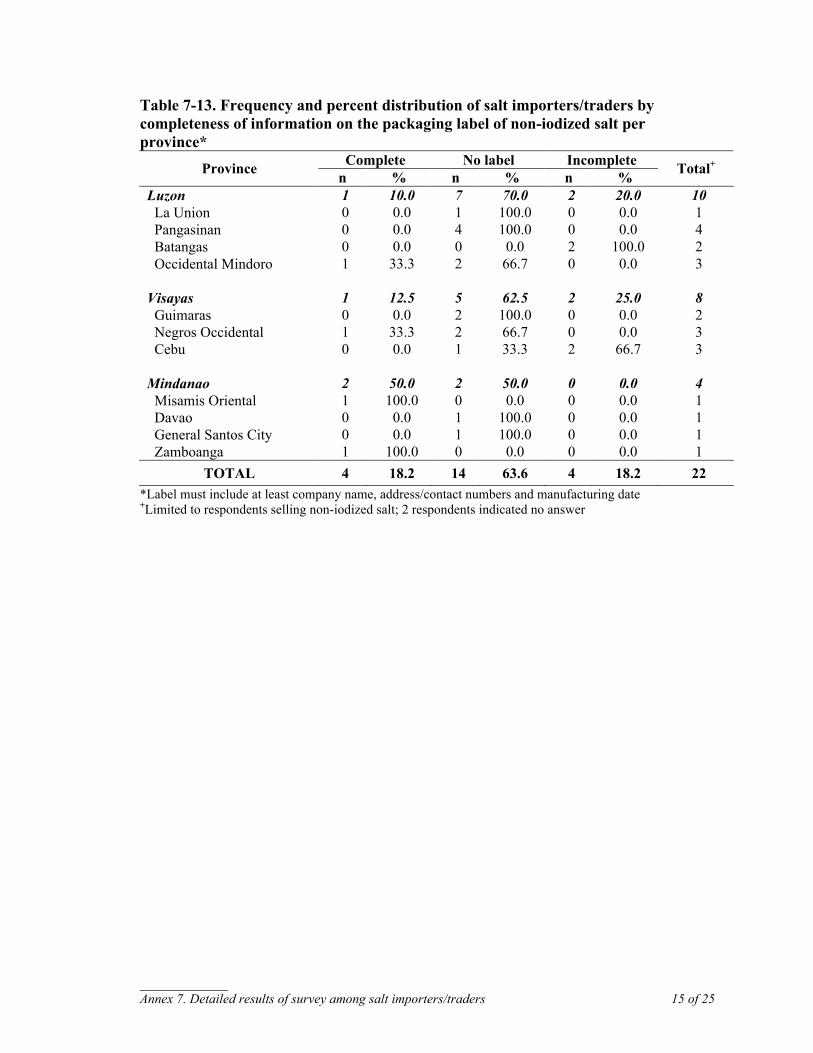
___________ Annex 7. Detailed results of survey among salt importers/traders 15 of 25
Table 7-13. Frequency and percent distribution of salt importers/traders by completeness of information on the packaging label of non-iodized salt per province*
Complete No label Incomplete Province n % n % n % Total+
Luzon 1 10.0 7 70.0 2 20.0 10 La Union 0 0.0 1 100.0 0 0.0 1 Pangasinan 0 0.0 4 100.0 0 0.0 4 Batangas 0 0.0 0 0.0 2 100.0 2 Occidental Mindoro 1 33.3 2 66.7 0 0.0 3 Visayas 1 12.5 5 62.5 2 25.0 8 Guimaras 0 0.0 2 100.0 0 0.0 2 Negros Occidental 1 33.3 2 66.7 0 0.0 3 Cebu 0 0.0 1 33.3 2 66.7 3 Mindanao 2 50.0 2 50.0 0 0.0 4 Misamis Oriental 1 100.0 0 0.0 0 0.0 1 Davao 0 0.0 1 100.0 0 0.0 1 General Santos City 0 0.0 1 100.0 0 0.0 1 Zamboanga 1 100.0 0 0.0 0 0.0 1
TOTAL 4 18.2 14 63.6 4 18.2 22 *Label must include at least company name, address/contact numbers and manufacturing date +Limited to respondents selling non-iodized salt; 2 respondents indicated no answer
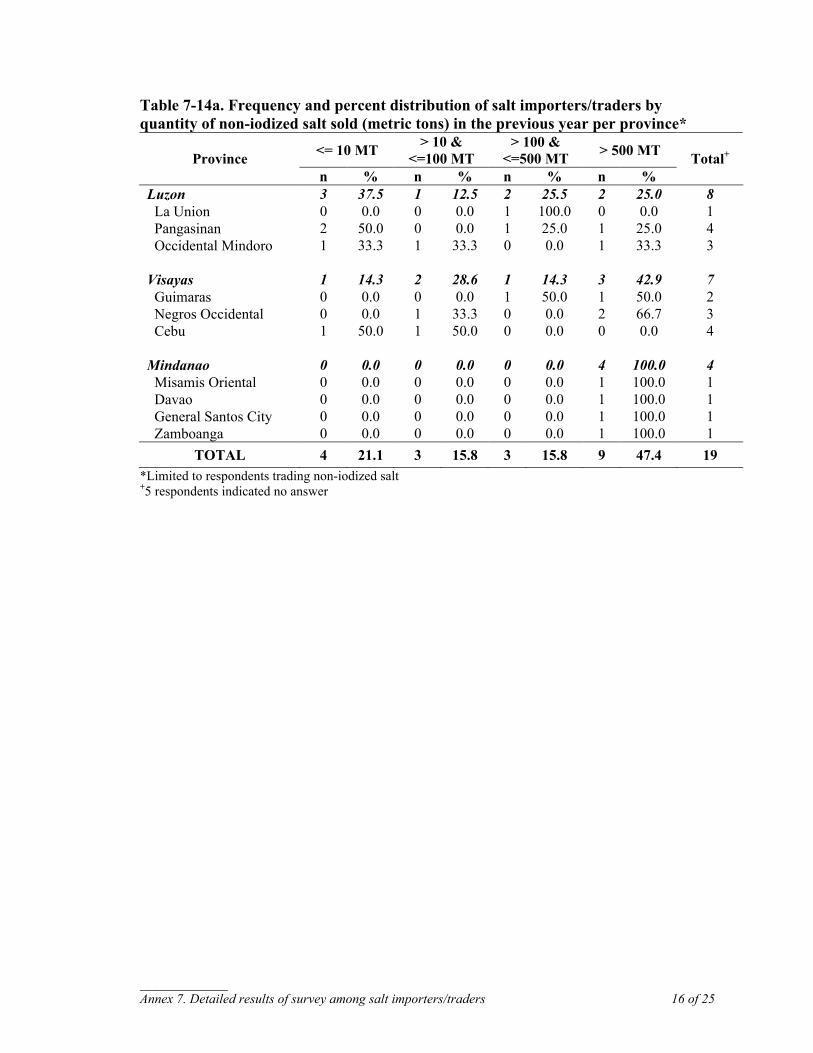
___________ Annex 7. Detailed results of survey among salt importers/traders 16 of 25
Table 7-14a. Frequency and percent distribution of salt importers/traders by quantity of non-iodized salt sold (metric tons) in the previous year per province*
<= 10 MT > 10 & <=100 MT
> 100 & <=500 MT > 500 MT Province
n % n % n % n % Total+
Luzon 3 37.5 1 12.5 2 25.5 2 25.0 8 La Union 0 0.0 0 0.0 1 100.0 0 0.0 1 Pangasinan 2 50.0 0 0.0 1 25.0 1 25.0 4 Occidental Mindoro 1 33.3 1 33.3 0 0.0 1 33.3 3 Visayas 1 14.3 2 28.6 1 14.3 3 42.9 7 Guimaras 0 0.0 0 0.0 1 50.0 1 50.0 2 Negros Occidental 0 0.0 1 33.3 0 0.0 2 66.7 3 Cebu 1 50.0 1 50.0 0 0.0 0 0.0 4 Mindanao 0 0.0 0 0.0 0 0.0 4 100.0 4 Misamis Oriental 0 0.0 0 0.0 0 0.0 1 100.0 1 Davao 0 0.0 0 0.0 0 0.0 1 100.0 1 General Santos City 0 0.0 0 0.0 0 0.0 1 100.0 1 Zamboanga 0 0.0 0 0.0 0 0.0 1 100.0 1
TOTAL 4 21.1 3 15.8 3 15.8 9 47.4 19 *Limited to respondents trading non-iodized salt +5 respondents indicated no answer
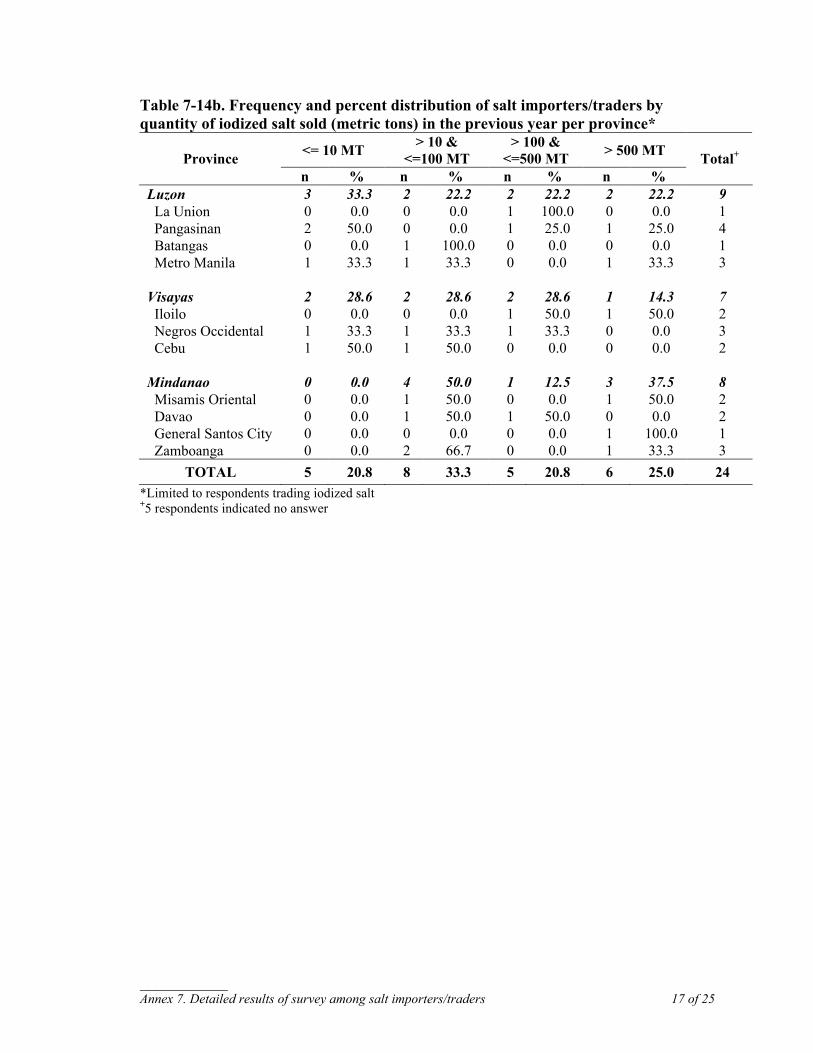
___________ Annex 7. Detailed results of survey among salt importers/traders 17 of 25
Table 7-14b. Frequency and percent distribution of salt importers/traders by quantity of iodized salt sold (metric tons) in the previous year per province*
<= 10 MT > 10 & <=100 MT
> 100 & <=500 MT > 500 MT Province
n % n % n % n % Total+
Luzon 3 33.3 2 22.2 2 22.2 2 22.2 9 La Union 0 0.0 0 0.0 1 100.0 0 0.0 1 Pangasinan 2 50.0 0 0.0 1 25.0 1 25.0 4 Batangas 0 0.0 1 100.0 0 0.0 0 0.0 1 Metro Manila 1 33.3 1 33.3 0 0.0 1 33.3 3 Visayas 2 28.6 2 28.6 2 28.6 1 14.3 7 Iloilo 0 0.0 0 0.0 1 50.0 1 50.0 2 Negros Occidental 1 33.3 1 33.3 1 33.3 0 0.0 3 Cebu 1 50.0 1 50.0 0 0.0 0 0.0 2 Mindanao 0 0.0 4 50.0 1 12.5 3 37.5 8 Misamis Oriental 0 0.0 1 50.0 0 0.0 1 50.0 2 Davao 0 0.0 1 50.0 1 50.0 0 0.0 2 General Santos City 0 0.0 0 0.0 0 0.0 1 100.0 1 Zamboanga 0 0.0 2 66.7 0 0.0 1 33.3 3
TOTAL 5 20.8 8 33.3 5 20.8 6 25.0 24 *Limited to respondents trading iodized salt +5 respondents indicated no answer

___________ Annex 7. Detailed results of survey among salt importers/traders 18 of 25
Table 7-15a. Frequency and percent distribution of salt importers/traders by selling price of non-iodized salt per kilo (as computed) salt during the survey per province*
<=5.00 / kg > 5.00 / kg Province n % n % Total+
Luzon 0 0.0 1 100.0 1 Pangasinan 0 0.0 1 100.0 1 Visayas 3 75.0 1 25.0 4 Guimaras 1 100.0 0 0.0 1 Cebu 2 66.7 1 33.3 3 Mindanao 3 100.0 0 0.0 3 Misamis Oriental 1 100.0 0 0.0 1 Davao 1 100.0 0 0.0 1 General Santos 1 100.0 0 0.0 1
TOTAL 6 75.0 2 25.0 8 *Limited to respondents selling non-iodized salt +16 respondents indicated no answer Table 7-15b. Frequency and percent distribution of salt importers/traders by selling price of iodized salt per kilo (as computed) salt during the survey per province*
<=5.00 / kg > 5 to <= 10.00 /kg > 10.00 / kg Province
n % n % n % Total+
Luzon 1 11.1 6 66.7 2 22.2 9 Pangasinan 0 0.0 5 100.0 0 0.0 5 Occidental Mindoro 0 0.0 0 0.0 1 100.0 1 Manila 1 33.3 1 33.3 1 33.3 3 Visayas 7 70.0 2 20.0 1 10.0 9 Iloilo 2 100.0 0 0.0 0 0.0 2 Negros Occidental 3 60.0 2 40.0 0 0.0 5 Cebu 2 66.7 0 0.0 1 33.3 3 Mindanao 6 75.0 2 25.0 0 0.0 9 Misamis Oriental 2 100.0 0 0.0 0 0.0 2 Davao 3 100.0 0 0.0 0 0.0 3 General Santos City 1 100.0 0 0.0 0 0.0 1 Zamboanga 0 0.0 2 100.0 0 0.0 2
TOTAL 14 51.9 10 37.0 3 11.1 27 *Limited to respondents selling iodized salt +2 respondents indicated no answer
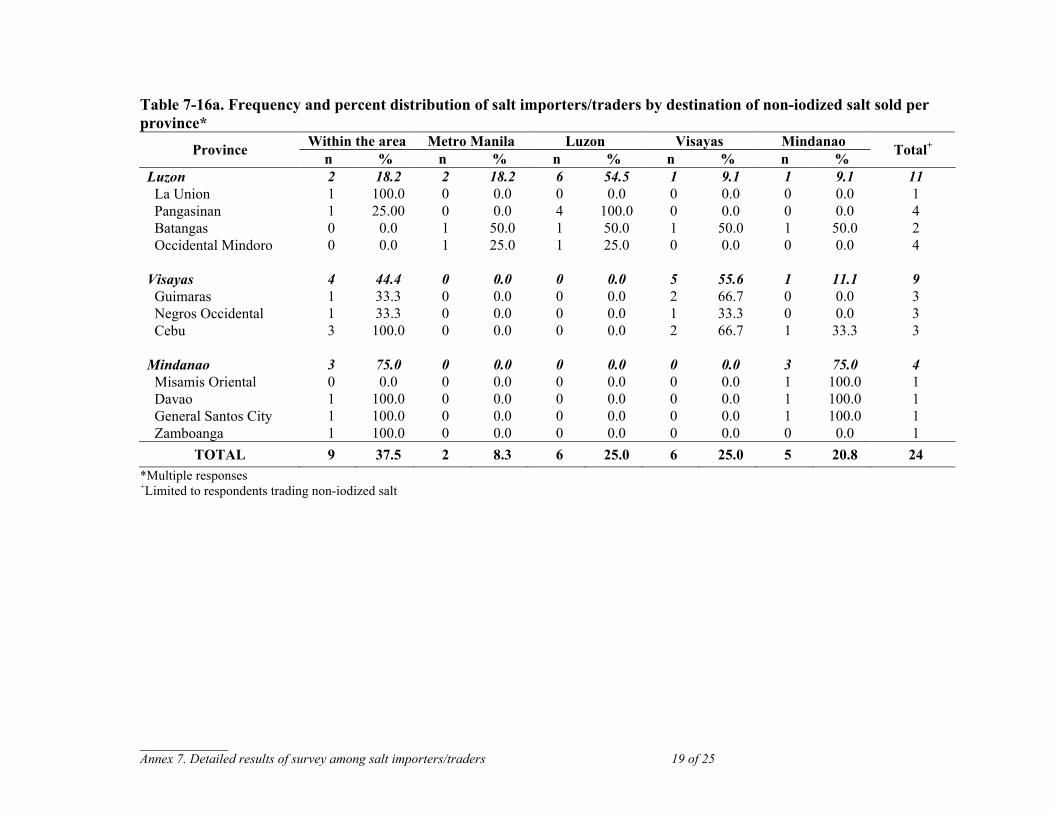
___________ Annex 7. Detailed results of survey among salt importers/traders 19 of 25
Table 7-16a. Frequency and percent distribution of salt importers/traders by destination of non-iodized salt sold per province*
Within the area Metro Manila Luzon Visayas Mindanao Province n % n % n % n % n % Total+
Luzon 2 18.2 2 18.2 6 54.5 1 9.1 1 9.1 11 La Union 1 100.0 0 0.0 0 0.0 0 0.0 0 0.0 1 Pangasinan 1 25.00 0 0.0 4 100.0 0 0.0 0 0.0 4 Batangas 0 0.0 1 50.0 1 50.0 1 50.0 1 50.0 2 Occidental Mindoro 0 0.0 1 25.0 1 25.0 0 0.0 0 0.0 4 Visayas 4 44.4 0 0.0 0 0.0 5 55.6 1 11.1 9 Guimaras 1 33.3 0 0.0 0 0.0 2 66.7 0 0.0 3 Negros Occidental 1 33.3 0 0.0 0 0.0 1 33.3 0 0.0 3 Cebu 3 100.0 0 0.0 0 0.0 2 66.7 1 33.3 3 Mindanao 3 75.0 0 0.0 0 0.0 0 0.0 3 75.0 4 Misamis Oriental 0 0.0 0 0.0 0 0.0 0 0.0 1 100.0 1 Davao 1 100.0 0 0.0 0 0.0 0 0.0 1 100.0 1 General Santos City 1 100.0 0 0.0 0 0.0 0 0.0 1 100.0 1 Zamboanga 1 100.0 0 0.0 0 0.0 0 0.0 0 0.0 1
TOTAL 9 37.5 2 8.3 6 25.0 6 25.0 5 20.8 24 *Multiple responses +Limited to respondents trading non-iodized salt
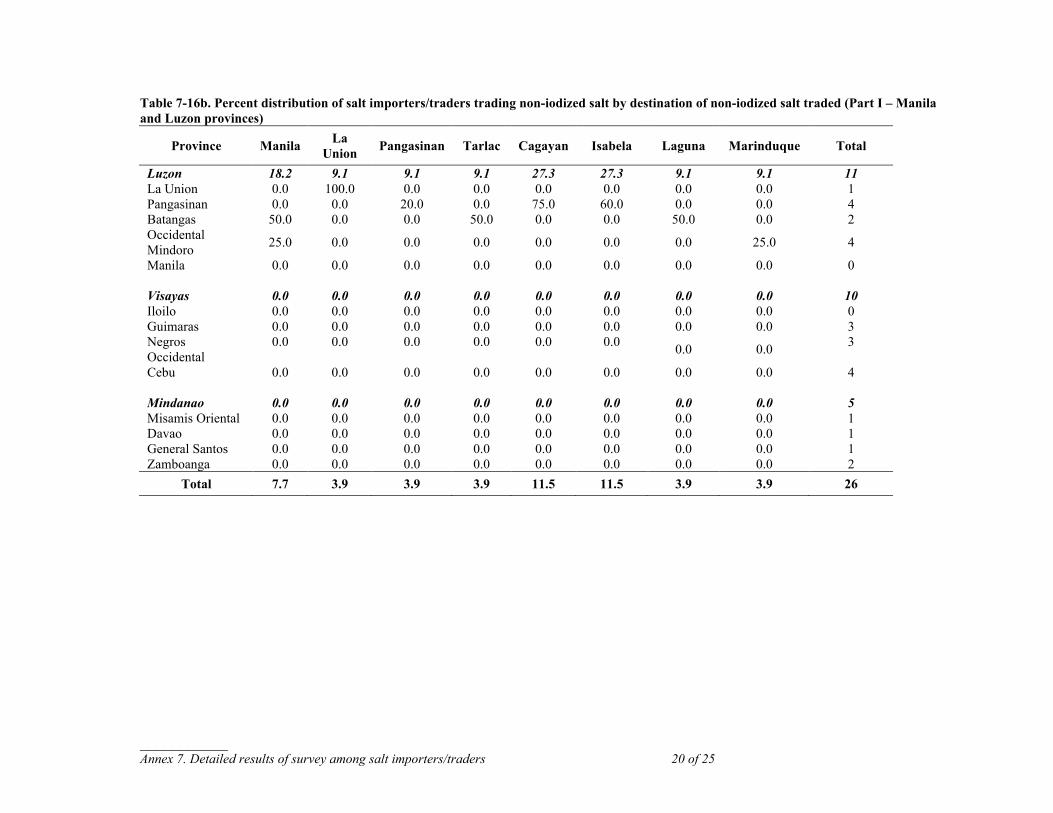
___________ Annex 7. Detailed results of survey among salt importers/traders 20 of 25
Table 7-16b. Percent distribution of salt importers/traders trading non-iodized salt by destination of non-iodized salt traded (Part I – Manila and Luzon provinces)
Province Manila La Union Pangasinan Tarlac Cagayan Isabela Laguna Marinduque Total
Luzon 18.2 9.1 9.1 9.1 27.3 27.3 9.1 9.1 11 La Union 0.0 100.0 0.0 0.0 0.0 0.0 0.0 0.0 1 Pangasinan 0.0 0.0 20.0 0.0 75.0 60.0 0.0 0.0 4 Batangas 50.0 0.0 0.0 50.0 0.0 0.0 50.0 0.0 2 Occidental Mindoro 25.0 0.0 0.0 0.0 0.0 0.0 0.0 25.0 4
Manila 0.0 0.0 0.0 0.0 0.0 0.0 0.0 0.0 0 Visayas 0.0 0.0 0.0 0.0 0.0 0.0 0.0 0.0 10 Iloilo 0.0 0.0 0.0 0.0 0.0 0.0 0.0 0.0 0 Guimaras 0.0 0.0 0.0 0.0 0.0 0.0 0.0 0.0 3 Negros Occidental
0.0 0.0 0.0 0.0 0.0 0.0 0.0 0.0 3
Cebu 0.0 0.0 0.0 0.0 0.0 0.0 0.0 0.0 4 Mindanao 0.0 0.0 0.0 0.0 0.0 0.0 0.0 0.0 5 Misamis Oriental 0.0 0.0 0.0 0.0 0.0 0.0 0.0 0.0 1 Davao 0.0 0.0 0.0 0.0 0.0 0.0 0.0 0.0 1 General Santos 0.0 0.0 0.0 0.0 0.0 0.0 0.0 0.0 1 Zamboanga 0.0 0.0 0.0 0.0 0.0 0.0 0.0 0.0 2
Total 7.7 3.9 3.9 3.9 11.5 11.5 3.9 3.9 26
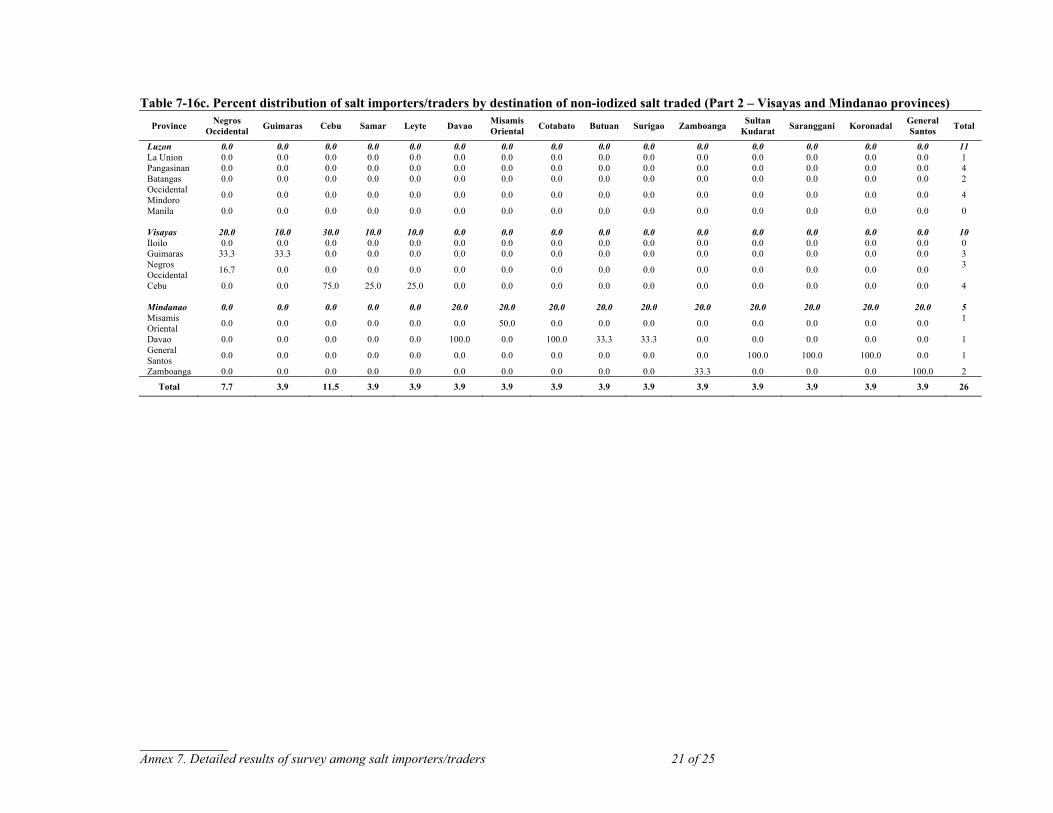
___________ Annex 7. Detailed results of survey among salt importers/traders 21 of 25
Table 7-16c. Percent distribution of salt importers/traders by destination of non-iodized salt traded (Part 2 – Visayas and Mindanao provinces) Province Negros
Occidental Guimaras Cebu Samar Leyte Davao Misamis Oriental Cotabato Butuan Surigao Zamboanga Sultan
Kudarat Saranggani Koronadal General Santos Total
Luzon 0.0 0.0 0.0 0.0 0.0 0.0 0.0 0.0 0.0 0.0 0.0 0.0 0.0 0.0 0.0 11 La Union 0.0 0.0 0.0 0.0 0.0 0.0 0.0 0.0 0.0 0.0 0.0 0.0 0.0 0.0 0.0 1 Pangasinan 0.0 0.0 0.0 0.0 0.0 0.0 0.0 0.0 0.0 0.0 0.0 0.0 0.0 0.0 0.0 4 Batangas 0.0 0.0 0.0 0.0 0.0 0.0 0.0 0.0 0.0 0.0 0.0 0.0 0.0 0.0 0.0 2 Occidental Mindoro 0.0 0.0 0.0 0.0 0.0 0.0 0.0 0.0 0.0 0.0 0.0 0.0 0.0 0.0 0.0 4
Manila 0.0 0.0 0.0 0.0 0.0 0.0 0.0 0.0 0.0 0.0 0.0 0.0 0.0 0.0 0.0 0 Visayas 20.0 10.0 30.0 10.0 10.0 0.0 0.0 0.0 0.0 0.0 0.0 0.0 0.0 0.0 0.0 10 Iloilo 0.0 0.0 0.0 0.0 0.0 0.0 0.0 0.0 0.0 0.0 0.0 0.0 0.0 0.0 0.0 0 Guimaras 33.3 33.3 0.0 0.0 0.0 0.0 0.0 0.0 0.0 0.0 0.0 0.0 0.0 0.0 0.0 3 Negros Occidental 16.7 0.0 0.0 0.0 0.0 0.0 0.0 0.0 0.0 0.0 0.0 0.0 0.0 0.0 0.0 3
Cebu 0.0 0.0 75.0 25.0 25.0 0.0 0.0 0.0 0.0 0.0 0.0 0.0 0.0 0.0 0.0 4 Mindanao 0.0 0.0 0.0 0.0 0.0 20.0 20.0 20.0 20.0 20.0 20.0 20.0 20.0 20.0 20.0 5 Misamis Oriental 0.0 0.0 0.0 0.0 0.0 0.0 50.0 0.0 0.0 0.0 0.0 0.0 0.0 0.0 0.0 1
Davao 0.0 0.0 0.0 0.0 0.0 100.0 0.0 100.0 33.3 33.3 0.0 0.0 0.0 0.0 0.0 1 General Santos 0.0 0.0 0.0 0.0 0.0 0.0 0.0 0.0 0.0 0.0 0.0 100.0 100.0 100.0 0.0 1
Zamboanga 0.0 0.0 0.0 0.0 0.0 0.0 0.0 0.0 0.0 0.0 33.3 0.0 0.0 0.0 100.0 2
Total 7.7 3.9 11.5 3.9 3.9 3.9 3.9 3.9 3.9 3.9 3.9 3.9 3.9 3.9 3.9 26

___________ Annex 7. Detailed results of survey among salt importers/traders 22 of 25
Table 7-16d. Frequency and percent distribution of salt importers/traders by destination of iodized salt sold per province*
Within the area Luzon Visayas Mindanao Province n % n % n % n % Total+
Luzon 6 50.0 6 50.0 1 8.3 1 8.3 12 La Union 1 100.0 0 0.0 0 0.0 0 0.0 1 Pangasinan 1 20.0 4 80.0 0 0.0 0 0.0 5 Batangas 0 0.0 2 100.0 1 50.0 1 50.0 2 Occidental Mindoro 1 100.0 0 0.0 0 0.0 0 0.0 1 Metro Manila 3 100.0 0 0.0 0 0.0 0 0.0 3 Visayas 7 77.8 2 22.2 2 22.2 0 0.0 9 Iloilo 2 100.0 1 50.0 0 0.0 0 0.0 2 Negros Occidental 2 50.0 1 25.0 2 50.0 0 0.0 4 Cebu 3 100.0 0 0.0 0 0.0 0 0.0 3 Mindanao 7 87.5 0 0.0 0 0.0 2 25.0 8 Misamis Oriental 1 100.0 0 0.0 0 0.0 1 100.0 1 Davao 2 66.7 0 0.0 0 0.0 1 33.3 3 General Santos City 1 100.0 0 0.0 0 0.0 0 0.0 1 Zamboanga 3 100.0 0 0.0 0 0.0 0 0.0 3
TOTAL 20 69.0 8 27.6 3 10.3 3 10.3 29 *Multiple responses +Limited to respondents trading iodized salt
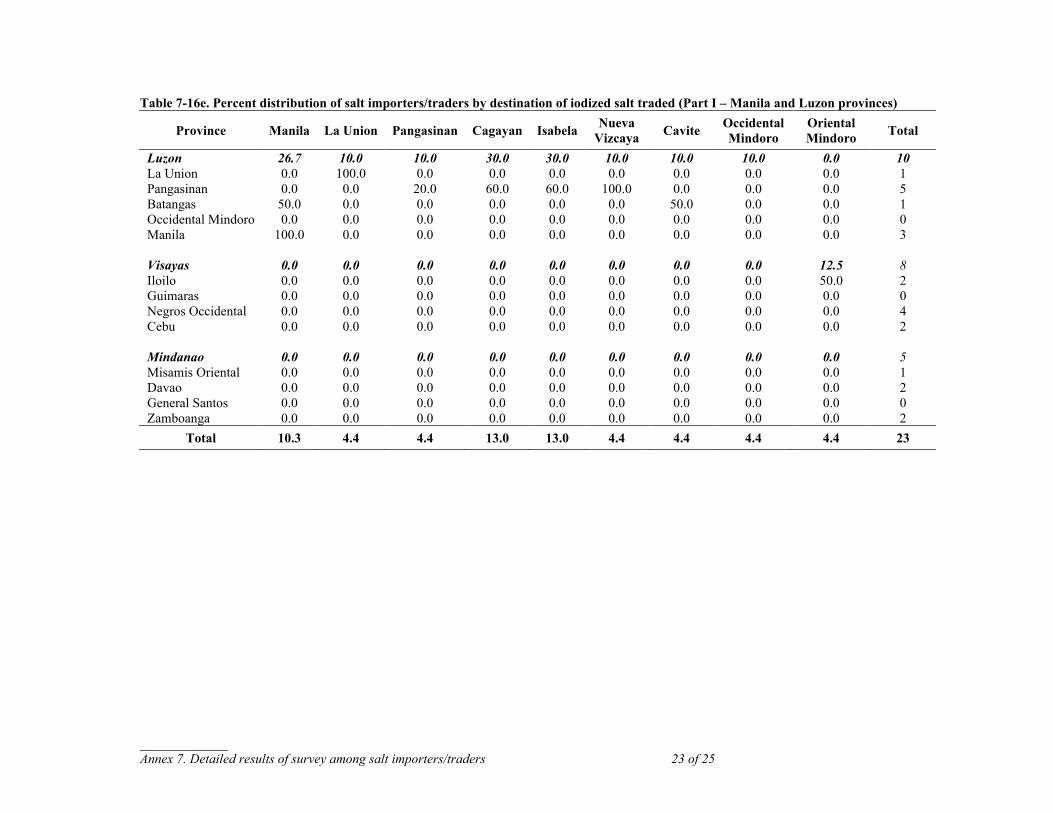
___________ Annex 7. Detailed results of survey among salt importers/traders 23 of 25
Table 7-16e. Percent distribution of salt importers/traders by destination of iodized salt traded (Part I – Manila and Luzon provinces)
Province Manila La Union Pangasinan Cagayan Isabela Nueva Vizcaya Cavite Occidental
Mindoro Oriental Mindoro Total
Luzon 26.7 10.0 10.0 30.0 30.0 10.0 10.0 10.0 0.0 10 La Union 0.0 100.0 0.0 0.0 0.0 0.0 0.0 0.0 0.0 1 Pangasinan 0.0 0.0 20.0 60.0 60.0 100.0 0.0 0.0 0.0 5 Batangas 50.0 0.0 0.0 0.0 0.0 0.0 50.0 0.0 0.0 1 Occidental Mindoro 0.0 0.0 0.0 0.0 0.0 0.0 0.0 0.0 0.0 0 Manila 100.0 0.0 0.0 0.0 0.0 0.0 0.0 0.0 0.0 3 Visayas 0.0 0.0 0.0 0.0 0.0 0.0 0.0 0.0 12.5 8 Iloilo 0.0 0.0 0.0 0.0 0.0 0.0 0.0 0.0 50.0 2 Guimaras 0.0 0.0 0.0 0.0 0.0 0.0 0.0 0.0 0.0 0 Negros Occidental 0.0 0.0 0.0 0.0 0.0 0.0 0.0 0.0 0.0 4 Cebu 0.0 0.0 0.0 0.0 0.0 0.0 0.0 0.0 0.0 2 Mindanao 0.0 0.0 0.0 0.0 0.0 0.0 0.0 0.0 0.0 5 Misamis Oriental 0.0 0.0 0.0 0.0 0.0 0.0 0.0 0.0 0.0 1 Davao 0.0 0.0 0.0 0.0 0.0 0.0 0.0 0.0 0.0 2 General Santos 0.0 0.0 0.0 0.0 0.0 0.0 0.0 0.0 0.0 0 Zamboanga 0.0 0.0 0.0 0.0 0.0 0.0 0.0 0.0 0.0 2
Total 10.3 4.4 4.4 13.0 13.0 4.4 4.4 4.4 4.4 23
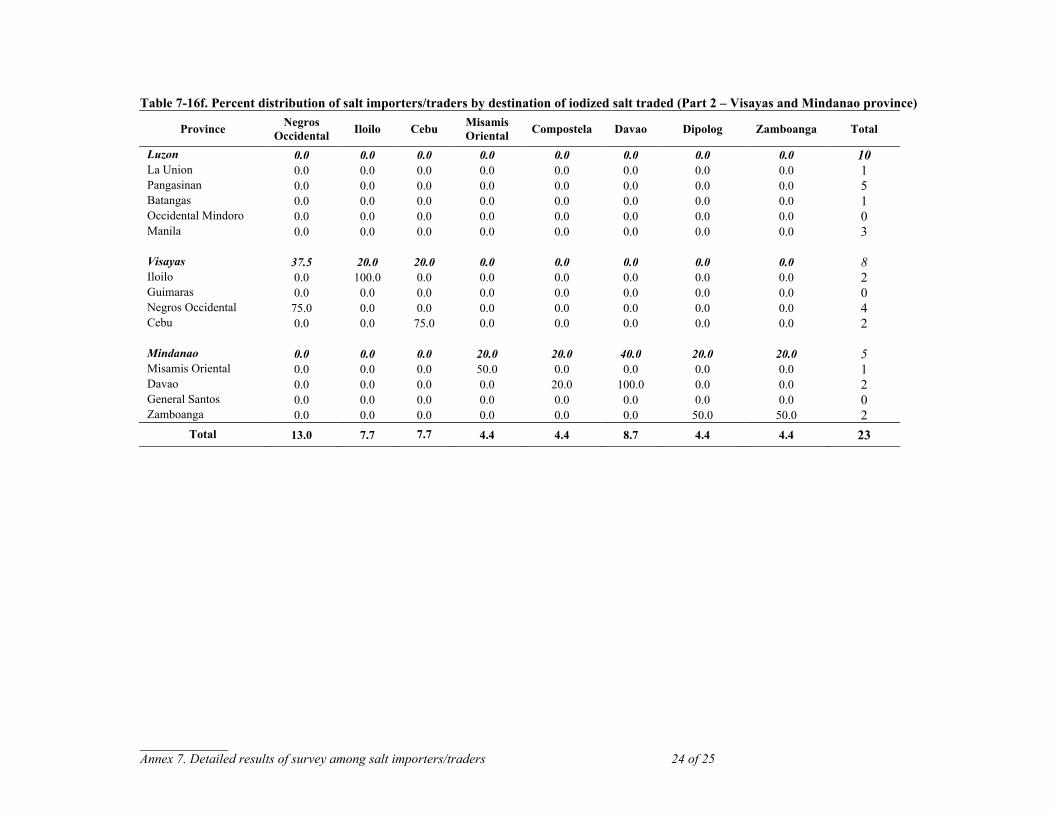
___________ Annex 7. Detailed results of survey among salt importers/traders 24 of 25
Table 7-16f. Percent distribution of salt importers/traders by destination of iodized salt traded (Part 2 – Visayas and Mindanao province)
Province Negros Occidental Iloilo Cebu Misamis
Oriental Compostela Davao Dipolog Zamboanga Total
Luzon 0.0 0.0 0.0 0.0 0.0 0.0 0.0 0.0 10 La Union 0.0 0.0 0.0 0.0 0.0 0.0 0.0 0.0 1 Pangasinan 0.0 0.0 0.0 0.0 0.0 0.0 0.0 0.0 5 Batangas 0.0 0.0 0.0 0.0 0.0 0.0 0.0 0.0 1 Occidental Mindoro 0.0 0.0 0.0 0.0 0.0 0.0 0.0 0.0 0 Manila 0.0 0.0 0.0 0.0 0.0 0.0 0.0 0.0 3 Visayas 37.5 20.0 20.0 0.0 0.0 0.0 0.0 0.0 8 Iloilo 0.0 100.0 0.0 0.0 0.0 0.0 0.0 0.0 2 Guimaras 0.0 0.0 0.0 0.0 0.0 0.0 0.0 0.0 0 Negros Occidental 75.0 0.0 0.0 0.0 0.0 0.0 0.0 0.0 4 Cebu 0.0 0.0 75.0 0.0 0.0 0.0 0.0 0.0 2 Mindanao 0.0 0.0 0.0 20.0 20.0 40.0 20.0 20.0 5 Misamis Oriental 0.0 0.0 0.0 50.0 0.0 0.0 0.0 0.0 1 Davao 0.0 0.0 0.0 0.0 20.0 100.0 0.0 0.0 2 General Santos 0.0 0.0 0.0 0.0 0.0 0.0 0.0 0.0 0 Zamboanga 0.0 0.0 0.0 0.0 0.0 0.0 50.0 50.0 2
Total 13.0 7.7 7.7 4.4 4.4 8.7 4.4 4.4 23
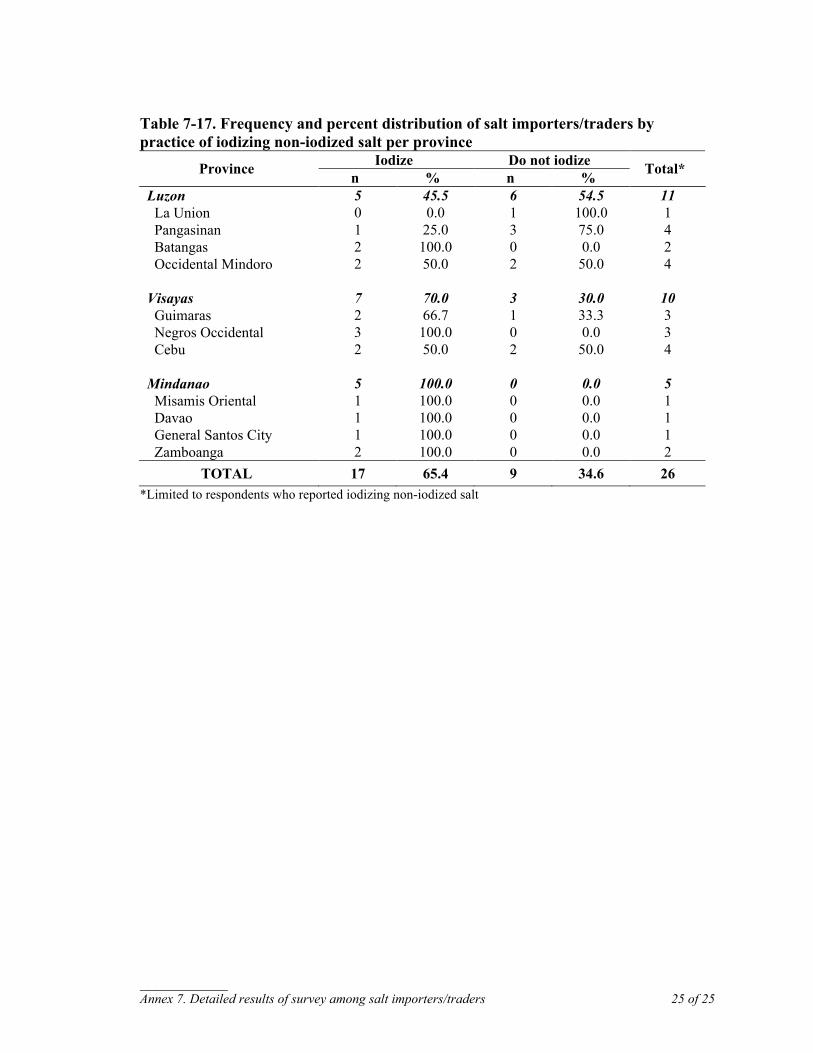
___________ Annex 7. Detailed results of survey among salt importers/traders 25 of 25
Table 7-17. Frequency and percent distribution of salt importers/traders by practice of iodizing non-iodized salt per province
Iodize Do not iodize Province n % n % Total*
Luzon 5 45.5 6 54.5 11 La Union 0 0.0 1 100.0 1 Pangasinan 1 25.0 3 75.0 4 Batangas 2 100.0 0 0.0 2 Occidental Mindoro 2 50.0 2 50.0 4 Visayas 7 70.0 3 30.0 10 Guimaras 2 66.7 1 33.3 3 Negros Occidental 3 100.0 0 0.0 3 Cebu 2 50.0 2 50.0 4 Mindanao 5 100.0 0 0.0 5 Misamis Oriental 1 100.0 0 0.0 1 Davao 1 100.0 0 0.0 1 General Santos City 1 100.0 0 0.0 1 Zamboanga 2 100.0 0 0.0 2
TOTAL 17 65.4 9 34.6 26 *Limited to respondents who reported iodizing non-iodized salt
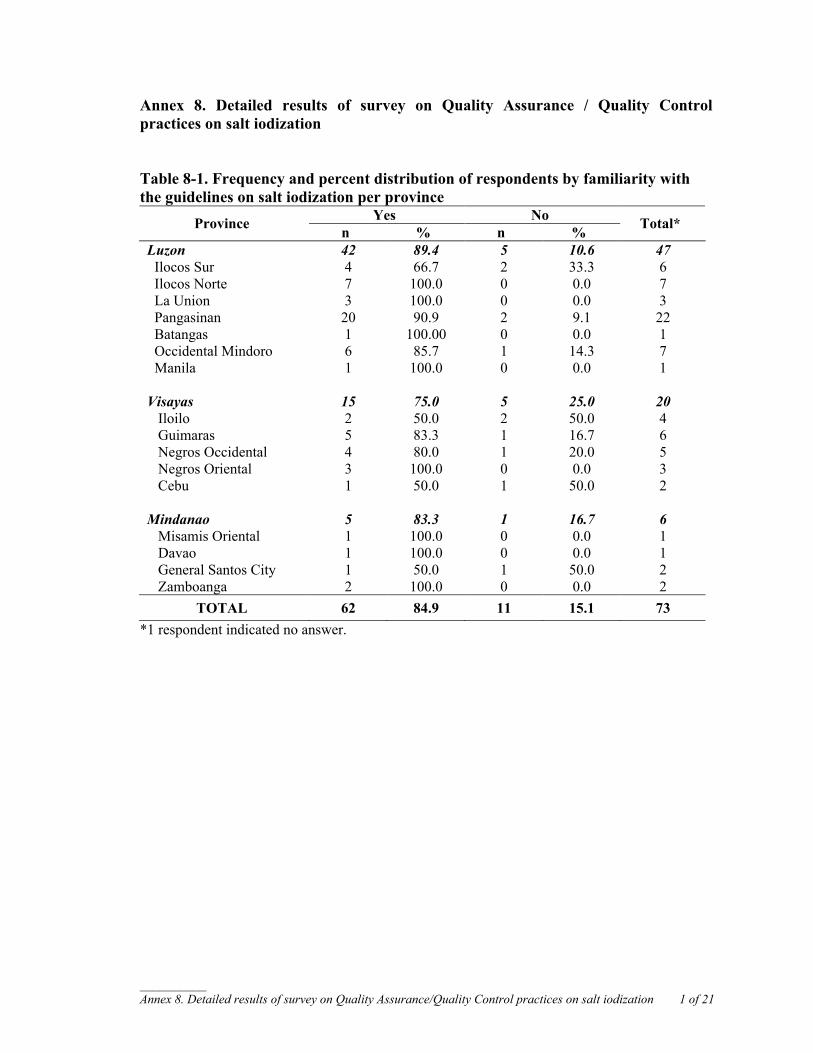
__________ Annex 8. Detailed results of survey on Quality Assurance/Quality Control practices on salt iodization 1 of 21
Annex 8. Detailed results of survey on Quality Assurance / Quality Control practices on salt iodization Table 8-1. Frequency and percent distribution of respondents by familiarity with the guidelines on salt iodization per province
Yes No Province n % n % Total*
Luzon 42 89.4 5 10.6 47 Ilocos Sur 4 66.7 2 33.3 6 Ilocos Norte 7 100.0 0 0.0 7 La Union 3 100.0 0 0.0 3 Pangasinan 20 90.9 2 9.1 22 Batangas 1 100.00 0 0.0 1 Occidental Mindoro 6 85.7 1 14.3 7 Manila 1 100.0 0 0.0 1 Visayas 15 75.0 5 25.0 20 Iloilo 2 50.0 2 50.0 4 Guimaras 5 83.3 1 16.7 6 Negros Occidental 4 80.0 1 20.0 5 Negros Oriental 3 100.0 0 0.0 3 Cebu 1 50.0 1 50.0 2 Mindanao 5 83.3 1 16.7 6 Misamis Oriental 1 100.0 0 0.0 1 Davao 1 100.0 0 0.0 1 General Santos City 1 50.0 1 50.0 2 Zamboanga 2 100.0 0 0.0 2
TOTAL 62 84.9 11 15.1 73 *1 respondent indicated no answer.
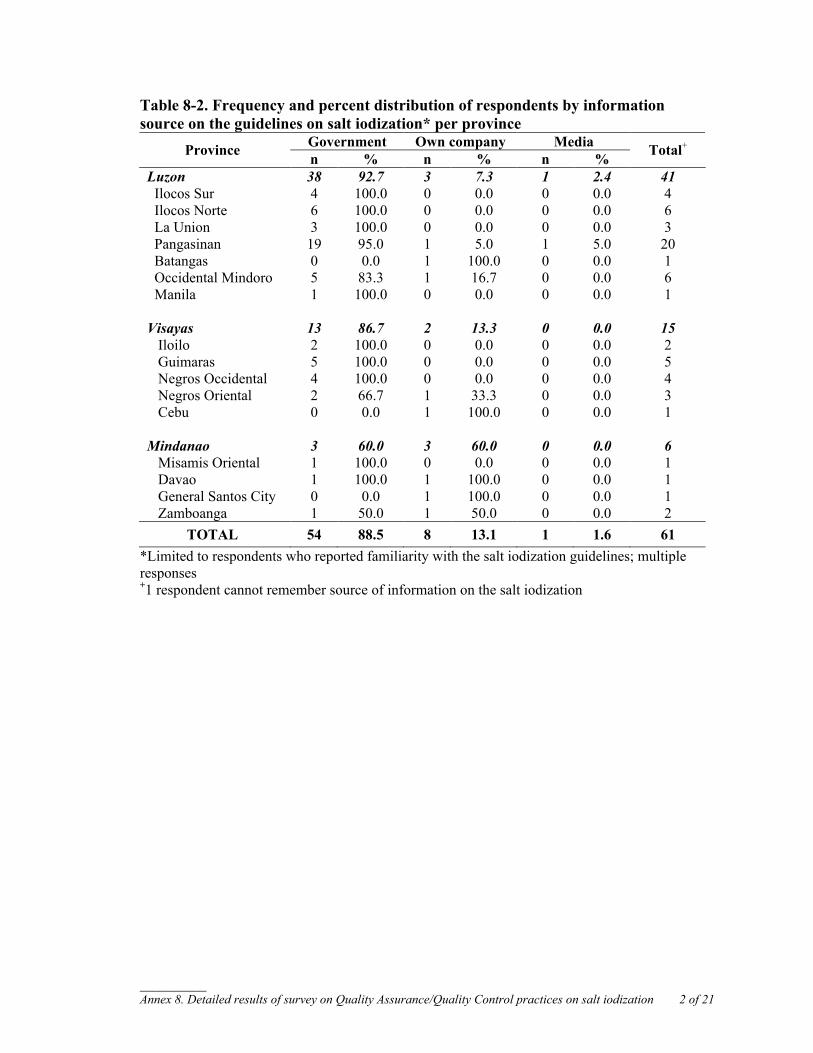
__________ Annex 8. Detailed results of survey on Quality Assurance/Quality Control practices on salt iodization 2 of 21
Table 8-2. Frequency and percent distribution of respondents by information source on the guidelines on salt iodization* per province
Government Own company Media Province n % n % n % Total+
Luzon 38 92.7 3 7.3 1 2.4 41 Ilocos Sur 4 100.0 0 0.0 0 0.0 4 Ilocos Norte 6 100.0 0 0.0 0 0.0 6 La Union 3 100.0 0 0.0 0 0.0 3 Pangasinan 19 95.0 1 5.0 1 5.0 20 Batangas 0 0.0 1 100.0 0 0.0 1 Occidental Mindoro 5 83.3 1 16.7 0 0.0 6 Manila 1 100.0 0 0.0 0 0.0 1 Visayas 13 86.7 2 13.3 0 0.0 15 Iloilo 2 100.0 0 0.0 0 0.0 2 Guimaras 5 100.0 0 0.0 0 0.0 5 Negros Occidental 4 100.0 0 0.0 0 0.0 4 Negros Oriental 2 66.7 1 33.3 0 0.0 3 Cebu 0 0.0 1 100.0 0 0.0 1 Mindanao 3 60.0 3 60.0 0 0.0 6 Misamis Oriental 1 100.0 0 0.0 0 0.0 1 Davao 1 100.0 1 100.0 0 0.0 1 General Santos City 0 0.0 1 100.0 0 0.0 1 Zamboanga 1 50.0 1 50.0 0 0.0 2
TOTAL 54 88.5 8 13.1 1 1.6 61 *Limited to respondents who reported familiarity with the salt iodization guidelines; multiple responses +1 respondent cannot remember source of information on the salt iodization
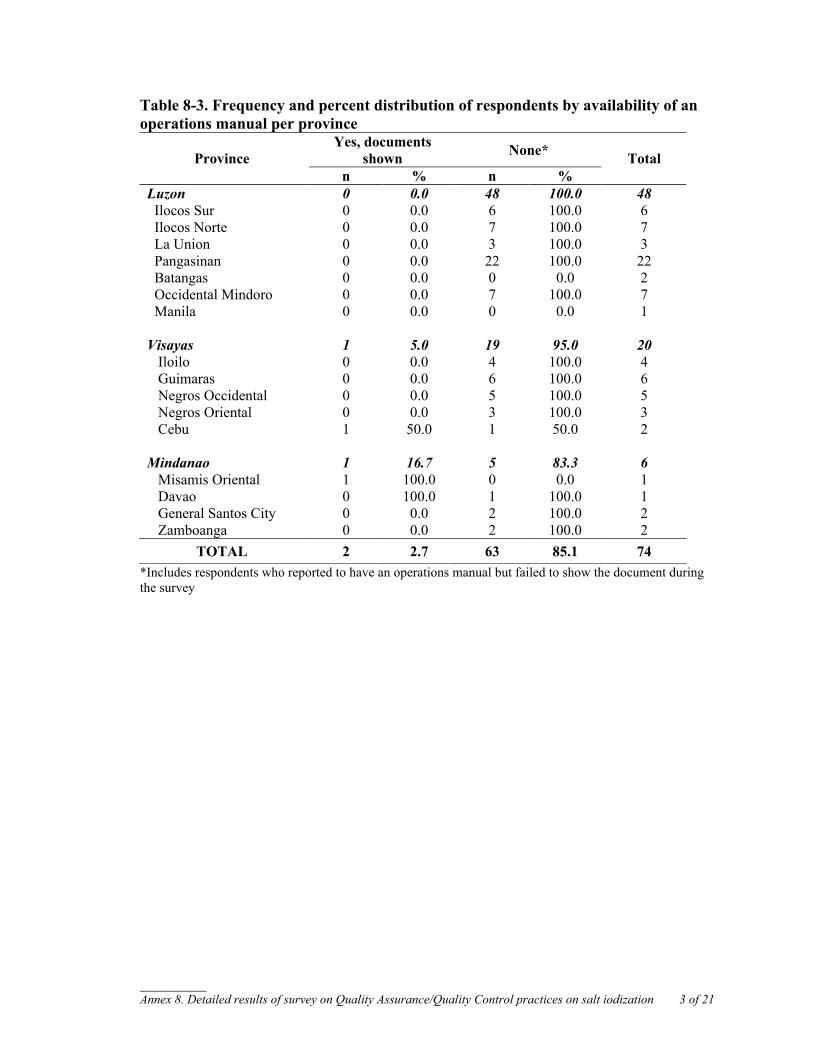
__________ Annex 8. Detailed results of survey on Quality Assurance/Quality Control practices on salt iodization 3 of 21
Table 8-3. Frequency and percent distribution of respondents by availability of an operations manual per province
*Includes respondents who reported to have an operations manual but failed to show the document during the survey
Yes, documents shown None* Province
n % n % Total
Luzon 0 0.0 48 100.0 48 Ilocos Sur 0 0.0 6 100.0 6 Ilocos Norte 0 0.0 7 100.0 7 La Union 0 0.0 3 100.0 3 Pangasinan 0 0.0 22 100.0 22 Batangas 0 0.0 0 0.0 2 Occidental Mindoro 0 0.0 7 100.0 7 Manila 0 0.0 0 0.0 1 Visayas 1 5.0 19 95.0 20 Iloilo 0 0.0 4 100.0 4 Guimaras 0 0.0 6 100.0 6 Negros Occidental 0 0.0 5 100.0 5 Negros Oriental 0 0.0 3 100.0 3 Cebu 1 50.0 1 50.0 2 Mindanao 1 16.7 5 83.3 6 Misamis Oriental 1 100.0 0 0.0 1 Davao 0 100.0 1 100.0 1 General Santos City 0 0.0 2 100.0 2 Zamboanga 0 0.0 2 100.0 2
TOTAL 2 2.7 63 85.1 74
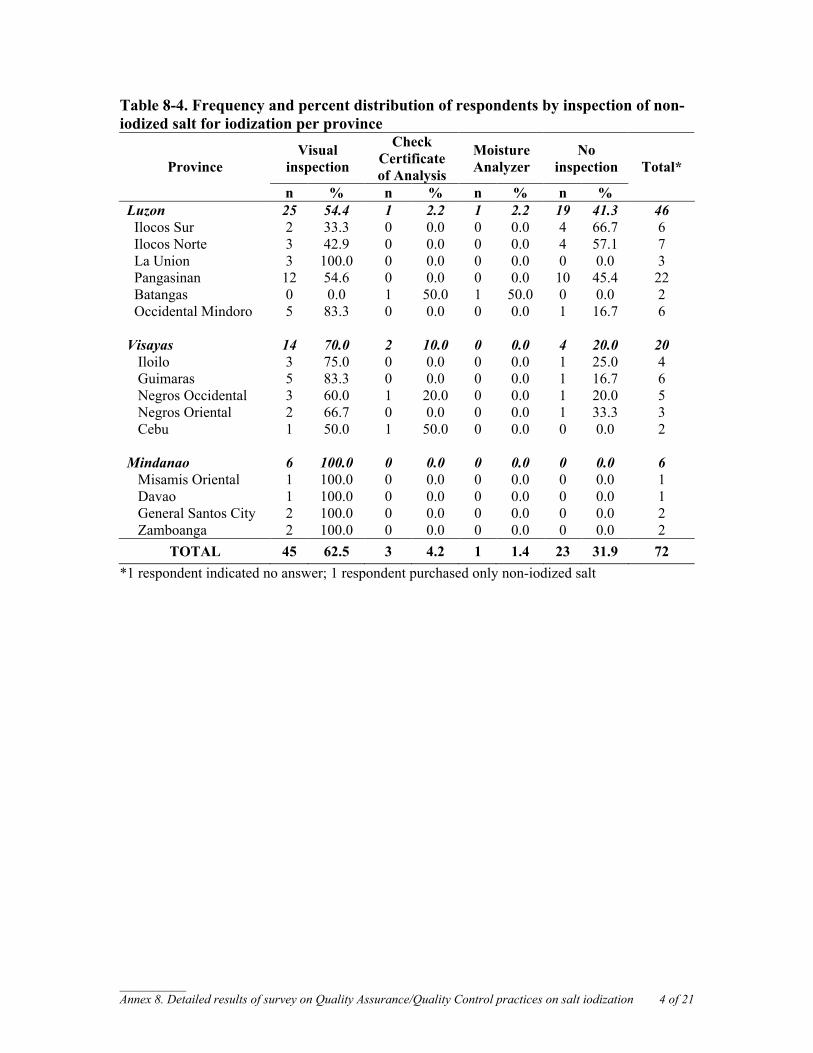
__________ Annex 8. Detailed results of survey on Quality Assurance/Quality Control practices on salt iodization 4 of 21
Table 8-4. Frequency and percent distribution of respondents by inspection of non-iodized salt for iodization per province
Visual inspection
Check Certificate of Analysis
Moisture Analyzer
No inspection Province
n % n % n % n %
Total*
Luzon 25 54.4 1 2.2 1 2.2 19 41.3 46 Ilocos Sur 2 33.3 0 0.0 0 0.0 4 66.7 6 Ilocos Norte 3 42.9 0 0.0 0 0.0 4 57.1 7 La Union 3 100.0 0 0.0 0 0.0 0 0.0 3 Pangasinan 12 54.6 0 0.0 0 0.0 10 45.4 22 Batangas 0 0.0 1 50.0 1 50.0 0 0.0 2 Occidental Mindoro 5 83.3 0 0.0 0 0.0 1 16.7 6 Visayas 14 70.0 2 10.0 0 0.0 4 20.0 20 Iloilo 3 75.0 0 0.0 0 0.0 1 25.0 4 Guimaras 5 83.3 0 0.0 0 0.0 1 16.7 6 Negros Occidental 3 60.0 1 20.0 0 0.0 1 20.0 5 Negros Oriental 2 66.7 0 0.0 0 0.0 1 33.3 3 Cebu 1 50.0 1 50.0 0 0.0 0 0.0 2 Mindanao 6 100.0 0 0.0 0 0.0 0 0.0 6 Misamis Oriental 1 100.0 0 0.0 0 0.0 0 0.0 1 Davao 1 100.0 0 0.0 0 0.0 0 0.0 1 General Santos City 2 100.0 0 0.0 0 0.0 0 0.0 2 Zamboanga 2 100.0 0 0.0 0 0.0 0 0.0 2
TOTAL 45 62.5 3 4.2 1 1.4 23 31.9 72 *1 respondent indicated no answer; 1 respondent purchased only non-iodized salt
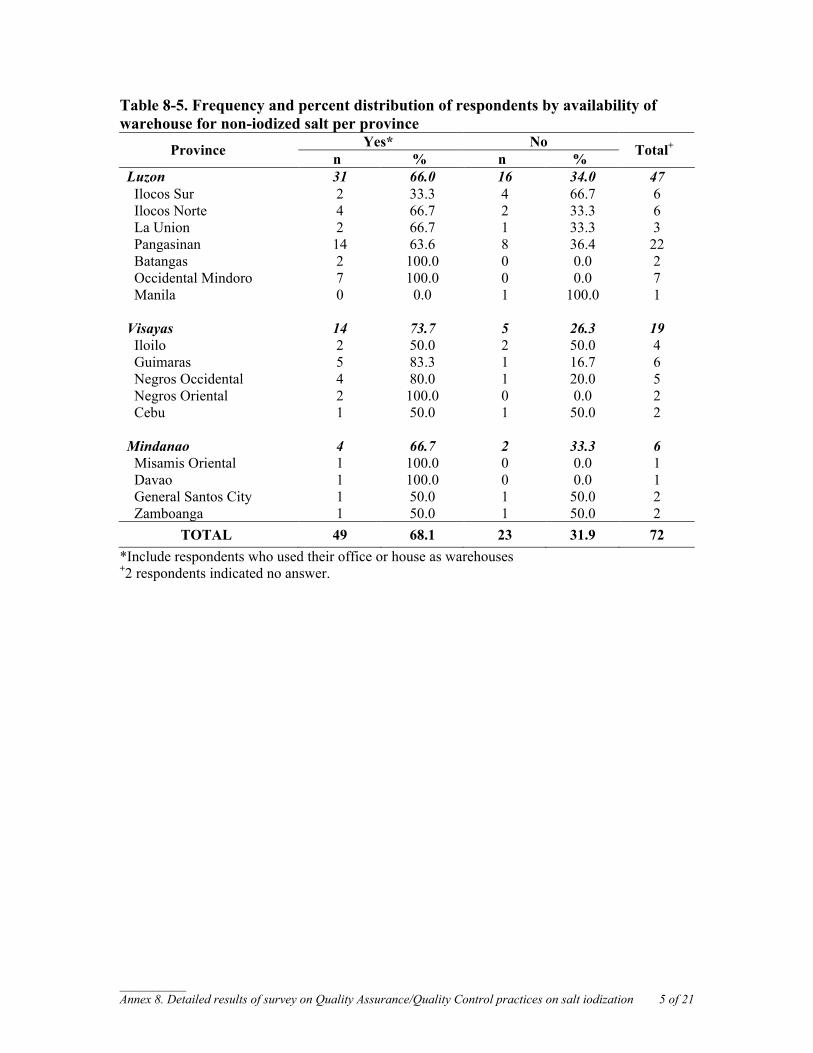
__________ Annex 8. Detailed results of survey on Quality Assurance/Quality Control practices on salt iodization 5 of 21
Table 8-5. Frequency and percent distribution of respondents by availability of warehouse for non-iodized salt per province
Yes* No Province n % n % Total+
Luzon 31 66.0 16 34.0 47 Ilocos Sur 2 33.3 4 66.7 6 Ilocos Norte 4 66.7 2 33.3 6 La Union 2 66.7 1 33.3 3 Pangasinan 14 63.6 8 36.4 22 Batangas 2 100.0 0 0.0 2 Occidental Mindoro 7 100.0 0 0.0 7 Manila 0 0.0 1 100.0 1 Visayas 14 73.7 5 26.3 19 Iloilo 2 50.0 2 50.0 4 Guimaras 5 83.3 1 16.7 6 Negros Occidental 4 80.0 1 20.0 5 Negros Oriental 2 100.0 0 0.0 2 Cebu 1 50.0 1 50.0 2 Mindanao 4 66.7 2 33.3 6 Misamis Oriental 1 100.0 0 0.0 1 Davao 1 100.0 0 0.0 1 General Santos City 1 50.0 1 50.0 2 Zamboanga 1 50.0 1 50.0 2
TOTAL 49 68.1 23 31.9 72 *Include respondents who used their office or house as warehouses +2 respondents indicated no answer.
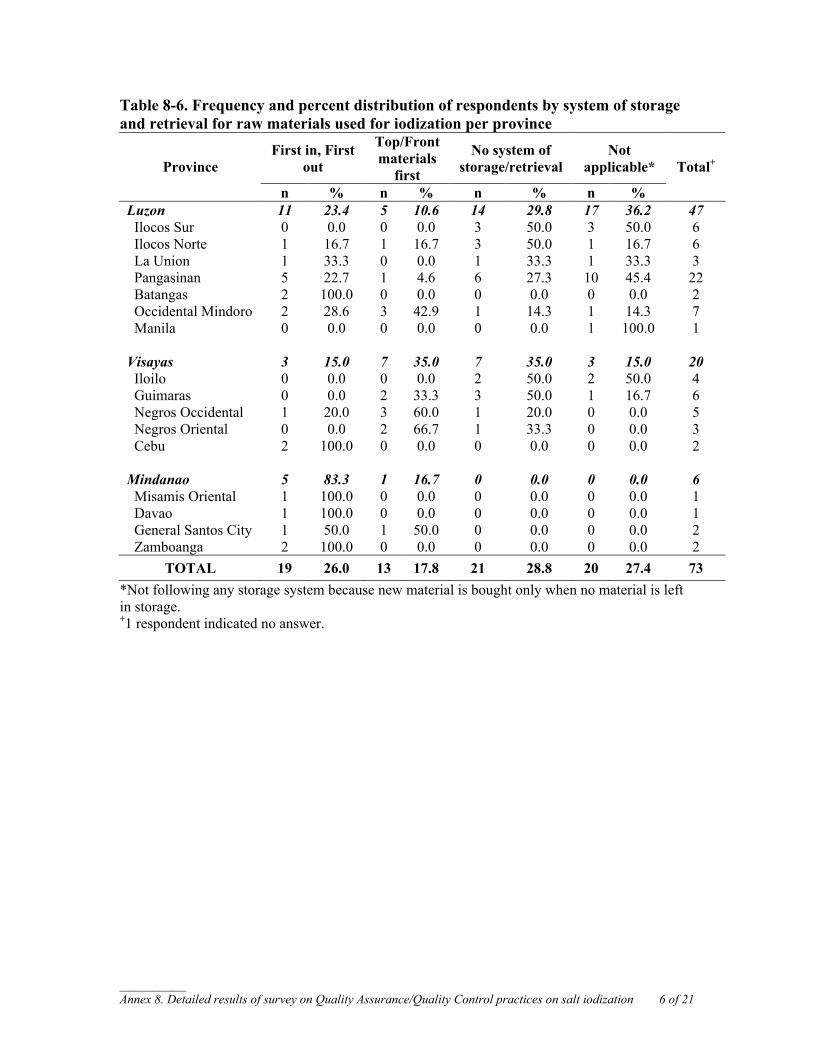
__________ Annex 8. Detailed results of survey on Quality Assurance/Quality Control practices on salt iodization 6 of 21
Table 8-6. Frequency and percent distribution of respondents by system of storage and retrieval for raw materials used for iodization per province
First in, First out
Top/Front materials
first
No system of storage/retrieval
Not applicable* Province
n % n % n % n %
Total+
Luzon 11 23.4 5 10.6 14 29.8 17 36.2 47 Ilocos Sur 0 0.0 0 0.0 3 50.0 3 50.0 6 Ilocos Norte 1 16.7 1 16.7 3 50.0 1 16.7 6 La Union 1 33.3 0 0.0 1 33.3 1 33.3 3 Pangasinan 5 22.7 1 4.6 6 27.3 10 45.4 22 Batangas 2 100.0 0 0.0 0 0.0 0 0.0 2 Occidental Mindoro 2 28.6 3 42.9 1 14.3 1 14.3 7 Manila 0 0.0 0 0.0 0 0.0 1 100.0 1 Visayas 3 15.0 7 35.0 7 35.0 3 15.0 20 Iloilo 0 0.0 0 0.0 2 50.0 2 50.0 4 Guimaras 0 0.0 2 33.3 3 50.0 1 16.7 6 Negros Occidental 1 20.0 3 60.0 1 20.0 0 0.0 5 Negros Oriental 0 0.0 2 66.7 1 33.3 0 0.0 3 Cebu 2 100.0 0 0.0 0 0.0 0 0.0 2 Mindanao 5 83.3 1 16.7 0 0.0 0 0.0 6 Misamis Oriental 1 100.0 0 0.0 0 0.0 0 0.0 1 Davao 1 100.0 0 0.0 0 0.0 0 0.0 1 General Santos City 1 50.0 1 50.0 0 0.0 0 0.0 2 Zamboanga 2 100.0 0 0.0 0 0.0 0 0.0 2
TOTAL 19 26.0 13 17.8 21 28.8 20 27.4 73 *Not following any storage system because new material is bought only when no material is left in storage. +1 respondent indicated no answer.
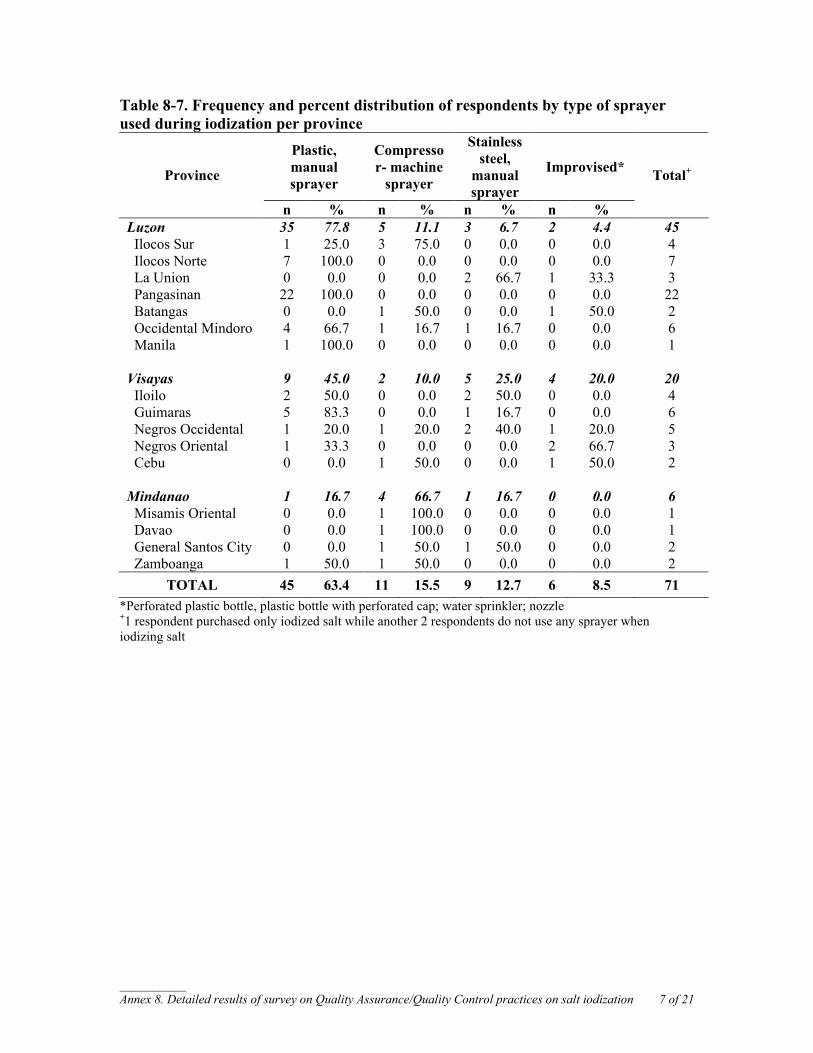
__________ Annex 8. Detailed results of survey on Quality Assurance/Quality Control practices on salt iodization 7 of 21
Table 8-7. Frequency and percent distribution of respondents by type of sprayer used during iodization per province
Plastic, manual sprayer
Compressor- machine
sprayer
Stainless steel,
manual sprayer
Improvised* Province
n % n % n % n %
Total+
Luzon 35 77.8 5 11.1 3 6.7 2 4.4 45 Ilocos Sur 1 25.0 3 75.0 0 0.0 0 0.0 4 Ilocos Norte 7 100.0 0 0.0 0 0.0 0 0.0 7 La Union 0 0.0 0 0.0 2 66.7 1 33.3 3 Pangasinan 22 100.0 0 0.0 0 0.0 0 0.0 22 Batangas 0 0.0 1 50.0 0 0.0 1 50.0 2 Occidental Mindoro 4 66.7 1 16.7 1 16.7 0 0.0 6 Manila 1 100.0 0 0.0 0 0.0 0 0.0 1 Visayas 9 45.0 2 10.0 5 25.0 4 20.0 20 Iloilo 2 50.0 0 0.0 2 50.0 0 0.0 4 Guimaras 5 83.3 0 0.0 1 16.7 0 0.0 6 Negros Occidental 1 20.0 1 20.0 2 40.0 1 20.0 5 Negros Oriental 1 33.3 0 0.0 0 0.0 2 66.7 3 Cebu 0 0.0 1 50.0 0 0.0 1 50.0 2 Mindanao 1 16.7 4 66.7 1 16.7 0 0.0 6 Misamis Oriental 0 0.0 1 100.0 0 0.0 0 0.0 1 Davao 0 0.0 1 100.0 0 0.0 0 0.0 1 General Santos City 0 0.0 1 50.0 1 50.0 0 0.0 2 Zamboanga 1 50.0 1 50.0 0 0.0 0 0.0 2
TOTAL 45 63.4 11 15.5 9 12.7 6 8.5 71 *Perforated plastic bottle, plastic bottle with perforated cap; water sprinkler; nozzle +1 respondent purchased only iodized salt while another 2 respondents do not use any sprayer when iodizing salt
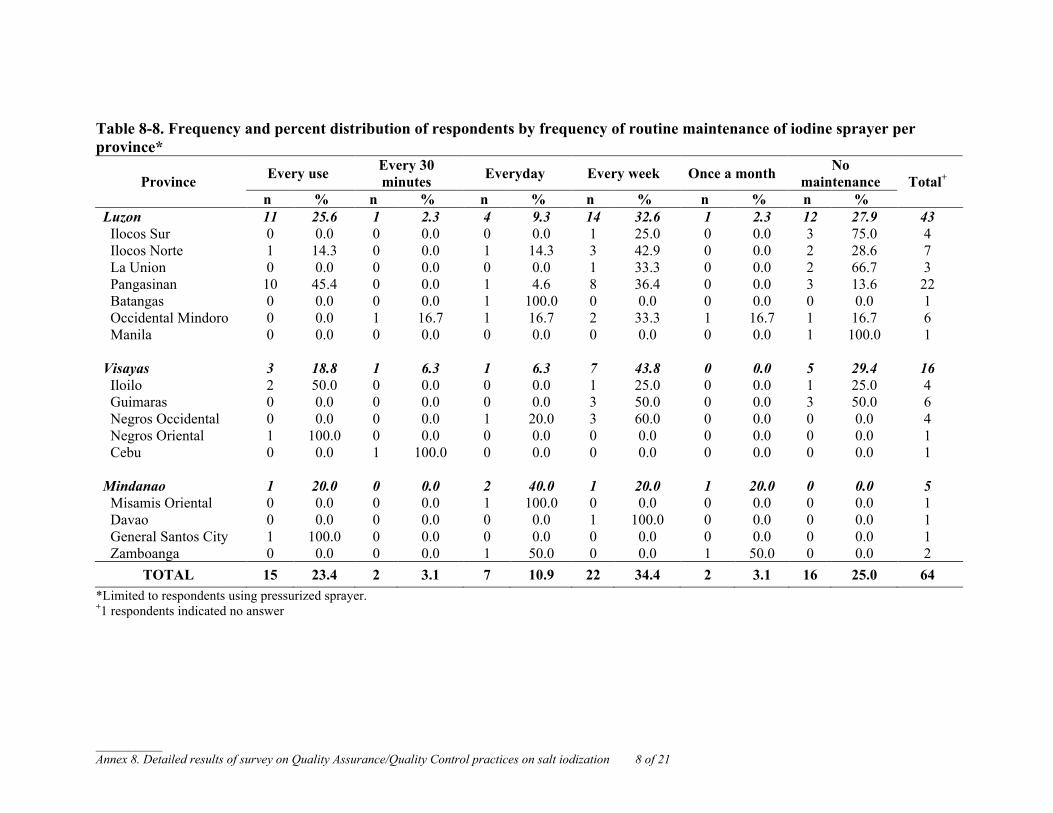
__________ Annex 8. Detailed results of survey on Quality Assurance/Quality Control practices on salt iodization 8 of 21
Table 8-8. Frequency and percent distribution of respondents by frequency of routine maintenance of iodine sprayer per province*
Every use Every 30 minutes Everyday Every week Once a month No
maintenance Province n % n % n % n % n % n %
Total+
Luzon 11 25.6 1 2.3 4 9.3 14 32.6 1 2.3 12 27.9 43 Ilocos Sur 0 0.0 0 0.0 0 0.0 1 25.0 0 0.0 3 75.0 4 Ilocos Norte 1 14.3 0 0.0 1 14.3 3 42.9 0 0.0 2 28.6 7 La Union 0 0.0 0 0.0 0 0.0 1 33.3 0 0.0 2 66.7 3 Pangasinan 10 45.4 0 0.0 1 4.6 8 36.4 0 0.0 3 13.6 22 Batangas 0 0.0 0 0.0 1 100.0 0 0.0 0 0.0 0 0.0 1 Occidental Mindoro 0 0.0 1 16.7 1 16.7 2 33.3 1 16.7 1 16.7 6 Manila 0 0.0 0 0.0 0 0.0 0 0.0 0 0.0 1 100.0 1 Visayas 3 18.8 1 6.3 1 6.3 7 43.8 0 0.0 5 29.4 16 Iloilo 2 50.0 0 0.0 0 0.0 1 25.0 0 0.0 1 25.0 4 Guimaras 0 0.0 0 0.0 0 0.0 3 50.0 0 0.0 3 50.0 6 Negros Occidental 0 0.0 0 0.0 1 20.0 3 60.0 0 0.0 0 0.0 4 Negros Oriental 1 100.0 0 0.0 0 0.0 0 0.0 0 0.0 0 0.0 1 Cebu 0 0.0 1 100.0 0 0.0 0 0.0 0 0.0 0 0.0 1 Mindanao 1 20.0 0 0.0 2 40.0 1 20.0 1 20.0 0 0.0 5 Misamis Oriental 0 0.0 0 0.0 1 100.0 0 0.0 0 0.0 0 0.0 1 Davao 0 0.0 0 0.0 0 0.0 1 100.0 0 0.0 0 0.0 1 General Santos City 1 100.0 0 0.0 0 0.0 0 0.0 0 0.0 0 0.0 1 Zamboanga 0 0.0 0 0.0 1 50.0 0 0.0 1 50.0 0 0.0 2
TOTAL 15 23.4 2 3.1 7 10.9 22 34.4 2 3.1 16 25.0 64 *Limited to respondents using pressurized sprayer. +1 respondents indicated no answer
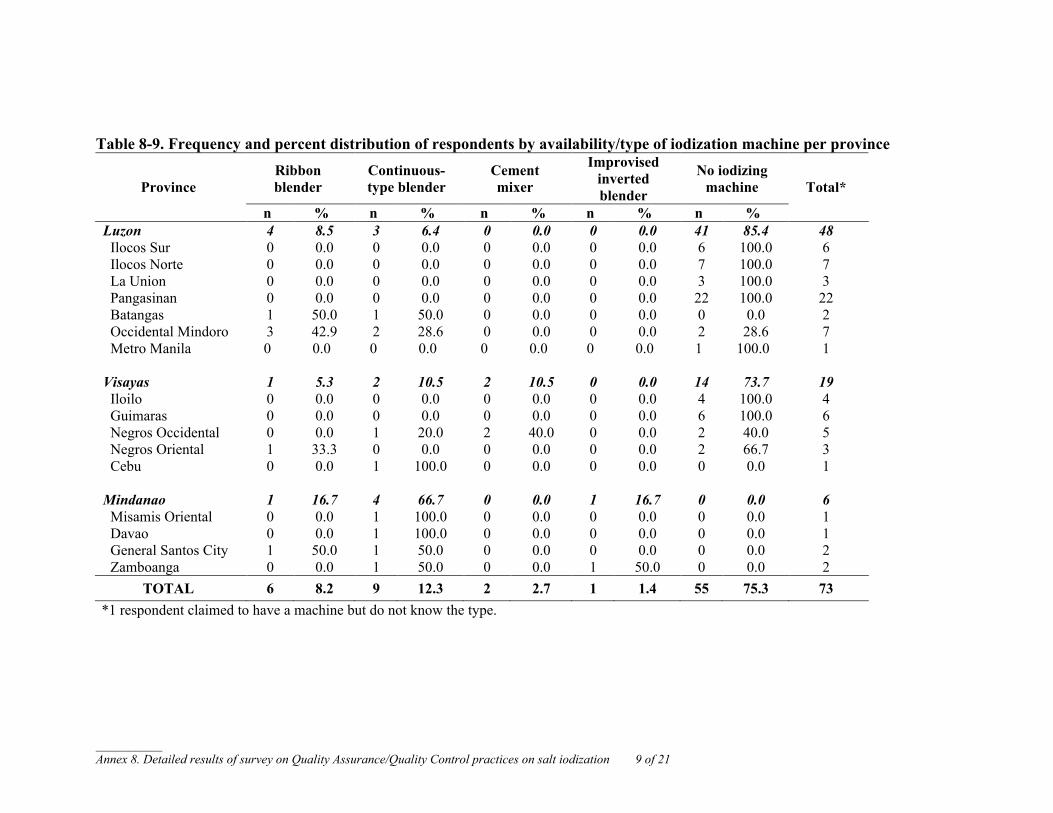
__________ Annex 8. Detailed results of survey on Quality Assurance/Quality Control practices on salt iodization 9 of 21
Table 8-9. Frequency and percent distribution of respondents by availability/type of iodization machine per province
Ribbon blender
Continuous-type blender
Cement mixer
Improvised inverted blender
No iodizing machine Province
n % n % n % n % n %
Total*
Luzon 4 8.5 3 6.4 0 0.0 0 0.0 41 85.4 48 Ilocos Sur 0 0.0 0 0.0 0 0.0 0 0.0 6 100.0 6 Ilocos Norte 0 0.0 0 0.0 0 0.0 0 0.0 7 100.0 7 La Union 0 0.0 0 0.0 0 0.0 0 0.0 3 100.0 3 Pangasinan 0 0.0 0 0.0 0 0.0 0 0.0 22 100.0 22 Batangas 1 50.0 1 50.0 0 0.0 0 0.0 0 0.0 2 Occidental Mindoro 3 42.9 2 28.6 0 0.0 0 0.0 2 28.6 7 Metro Manila 0 0.0 0 0.0 0 0.0 0 0.0 1 100.0 1 Visayas 1 5.3 2 10.5 2 10.5 0 0.0 14 73.7 19 Iloilo 0 0.0 0 0.0 0 0.0 0 0.0 4 100.0 4 Guimaras 0 0.0 0 0.0 0 0.0 0 0.0 6 100.0 6 Negros Occidental 0 0.0 1 20.0 2 40.0 0 0.0 2 40.0 5 Negros Oriental 1 33.3 0 0.0 0 0.0 0 0.0 2 66.7 3 Cebu 0 0.0 1 100.0 0 0.0 0 0.0 0 0.0 1 Mindanao 1 16.7 4 66.7 0 0.0 1 16.7 0 0.0 6 Misamis Oriental 0 0.0 1 100.0 0 0.0 0 0.0 0 0.0 1 Davao 0 0.0 1 100.0 0 0.0 0 0.0 0 0.0 1 General Santos City 1 50.0 1 50.0 0 0.0 0 0.0 0 0.0 2 Zamboanga 0 0.0 1 50.0 0 0.0 1 50.0 0 0.0 2
TOTAL 6 8.2 9 12.3 2 2.7 1 1.4 55 75.3 73 *1 respondent claimed to have a machine but do not know the type.
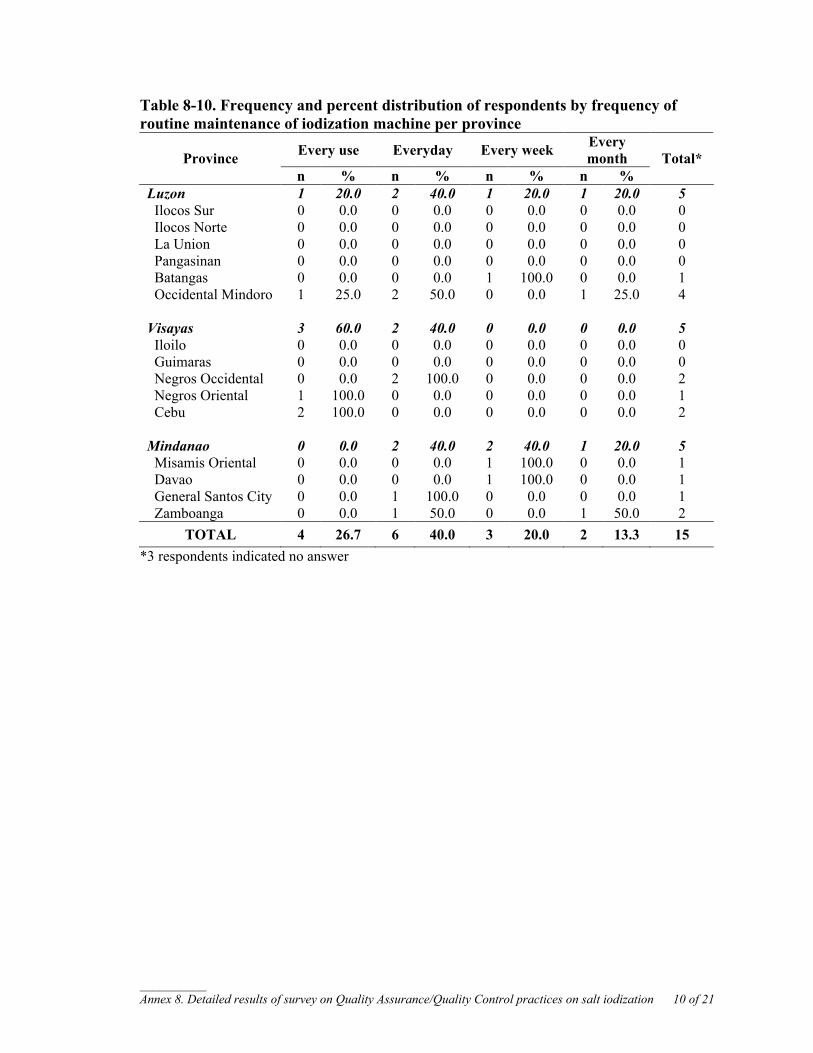
__________ Annex 8. Detailed results of survey on Quality Assurance/Quality Control practices on salt iodization 10 of 21
Table 8-10. Frequency and percent distribution of respondents by frequency of routine maintenance of iodization machine per province
Every use Everyday Every week Every month Province
n % n % n % n % Total*
Luzon 1 20.0 2 40.0 1 20.0 1 20.0 5 Ilocos Sur 0 0.0 0 0.0 0 0.0 0 0.0 0 Ilocos Norte 0 0.0 0 0.0 0 0.0 0 0.0 0 La Union 0 0.0 0 0.0 0 0.0 0 0.0 0 Pangasinan 0 0.0 0 0.0 0 0.0 0 0.0 0 Batangas 0 0.0 0 0.0 1 100.0 0 0.0 1 Occidental Mindoro 1 25.0 2 50.0 0 0.0 1 25.0 4 Visayas 3 60.0 2 40.0 0 0.0 0 0.0 5 Iloilo 0 0.0 0 0.0 0 0.0 0 0.0 0 Guimaras 0 0.0 0 0.0 0 0.0 0 0.0 0 Negros Occidental 0 0.0 2 100.0 0 0.0 0 0.0 2 Negros Oriental 1 100.0 0 0.0 0 0.0 0 0.0 1 Cebu 2 100.0 0 0.0 0 0.0 0 0.0 2 Mindanao 0 0.0 2 40.0 2 40.0 1 20.0 5 Misamis Oriental 0 0.0 0 0.0 1 100.0 0 0.0 1 Davao 0 0.0 0 0.0 1 100.0 0 0.0 1 General Santos City 0 0.0 1 100.0 0 0.0 0 0.0 1 Zamboanga 0 0.0 1 50.0 0 0.0 1 50.0 2
TOTAL 4 26.7 6 40.0 3 20.0 2 13.3 15 *3 respondents indicated no answer
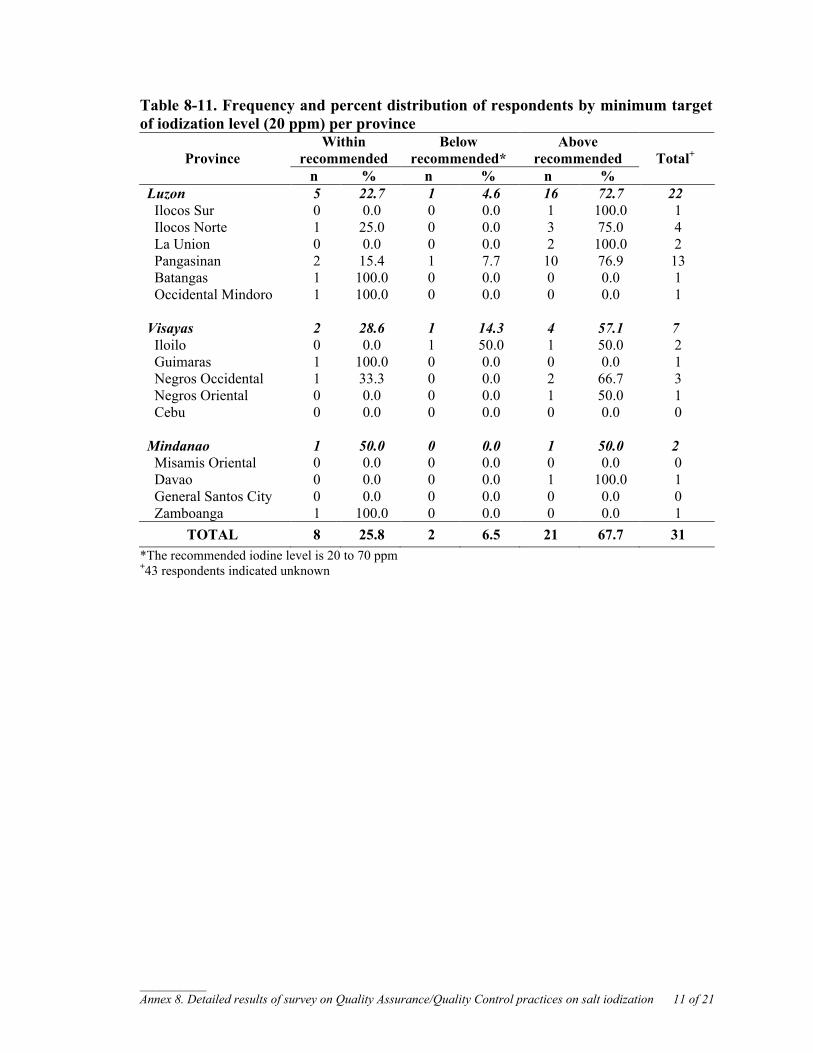
__________ Annex 8. Detailed results of survey on Quality Assurance/Quality Control practices on salt iodization 11 of 21
Table 8-11. Frequency and percent distribution of respondents by minimum target of iodization level (20 ppm) per province
Within recommended
Below recommended*
Above recommended Province
n % n % n % Total+
Luzon 5 22.7 1 4.6 16 72.7 22 Ilocos Sur 0 0.0 0 0.0 1 100.0 1 Ilocos Norte 1 25.0 0 0.0 3 75.0 4 La Union 0 0.0 0 0.0 2 100.0 2 Pangasinan 2 15.4 1 7.7 10 76.9 13 Batangas 1 100.0 0 0.0 0 0.0 1 Occidental Mindoro 1 100.0 0 0.0 0 0.0 1 Visayas 2 28.6 1 14.3 4 57.1 7 Iloilo 0 0.0 1 50.0 1 50.0 2 Guimaras 1 100.0 0 0.0 0 0.0 1 Negros Occidental 1 33.3 0 0.0 2 66.7 3 Negros Oriental 0 0.0 0 0.0 1 50.0 1 Cebu 0 0.0 0 0.0 0 0.0 0 Mindanao 1 50.0 0 0.0 1 50.0 2 Misamis Oriental 0 0.0 0 0.0 0 0.0 0 Davao 0 0.0 0 0.0 1 100.0 1 General Santos City 0 0.0 0 0.0 0 0.0 0 Zamboanga 1 100.0 0 0.0 0 0.0 1
TOTAL 8 25.8 2 6.5 21 67.7 31 *The recommended iodine level is 20 to 70 ppm +43 respondents indicated unknown

__________ Annex 8. Detailed results of survey on Quality Assurance/Quality Control practices on salt iodization 12 of 21
Table 8-12. Frequency and percent distribution of respondents by maximum target of iodization level (70 ppm) per province
Within recommended
Below recommended*
Above recommended Province
n % n % n % Total+
Luzon 3 13.6 1 4.6 18 81.8 22 Ilocos Sur 0 0.0 0 0.0 1 100.0 1 Ilocos Norte 0 0.0 0 0.0 4 100.0 4 La Union 0 0.0 0 0.0 2 100.0 2 Pangasinan 1 7.7 1 7.7 11 84.6 13 Batangas 1 100.0 0 0.0 0 0.0 1 Occidental Mindoro 1 100.0 0 0.0 0 0.0 1 Visayas 1 14.3 1 14.3 5 71.4 7 Iloilo 0 0.0 1 50.0 1 50.0 2 Guimaras 0 0.0 0 0.0 1 100.0 1 Negros Occidental 1 33.3 0 0.0 2 66.7 3 Negros Oriental 0 0.0 0 0.0 1 100.0 1 Cebu 0 0.0 0 0.0 0 0.0 0 Mindanao 0 0.0 0 0.0 2 100.0 2 Misamis Oriental 0 0.0 0 0.0 0 0.0 0 Davao 0 0.0 0 0.0 1 100.0 1 General Santos City 0 0.0 0 0.0 0 0.0 0 Zamboanga 0 0.0 0 0.0 1 100.0 1
TOTAL 4 12.1 2 6.1 27 81.8 33 *The recommended iodine level is 20 to 70 ppm +41 respondents indicated unknown
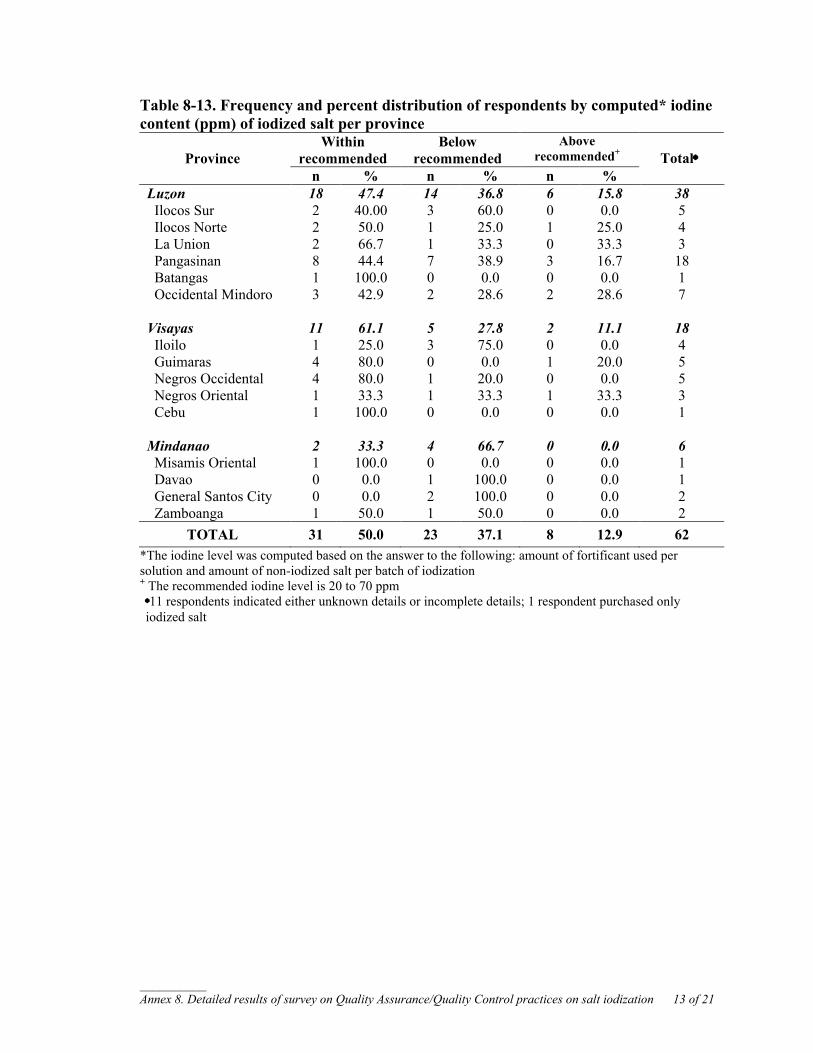
__________ Annex 8. Detailed results of survey on Quality Assurance/Quality Control practices on salt iodization 13 of 21
Table 8-13. Frequency and percent distribution of respondents by computed* iodine content (ppm) of iodized salt per province
Within recommended
Below recommended
Above recommended+ Province
n % n % n % Total⧧
Luzon 18 47.4 14 36.8 6 15.8 38 Ilocos Sur 2 40.00 3 60.0 0 0.0 5 Ilocos Norte 2 50.0 1 25.0 1 25.0 4 La Union 2 66.7 1 33.3 0 33.3 3 Pangasinan 8 44.4 7 38.9 3 16.7 18 Batangas 1 100.0 0 0.0 0 0.0 1 Occidental Mindoro 3 42.9 2 28.6 2 28.6 7 Visayas 11 61.1 5 27.8 2 11.1 18 Iloilo 1 25.0 3 75.0 0 0.0 4 Guimaras 4 80.0 0 0.0 1 20.0 5 Negros Occidental 4 80.0 1 20.0 0 0.0 5 Negros Oriental 1 33.3 1 33.3 1 33.3 3 Cebu 1 100.0 0 0.0 0 0.0 1 Mindanao 2 33.3 4 66.7 0 0.0 6 Misamis Oriental 1 100.0 0 0.0 0 0.0 1 Davao 0 0.0 1 100.0 0 0.0 1 General Santos City 0 0.0 2 100.0 0 0.0 2 Zamboanga 1 50.0 1 50.0 0 0.0 2
TOTAL 31 50.0 23 37.1 8 12.9 62 *The iodine level was computed based on the answer to the following: amount of fortificant used per solution and amount of non-iodized salt per batch of iodization + The recommended iodine level is 20 to 70 ppm
⧧11 respondents indicated either unknown details or incomplete details; 1 respondent purchased only iodized salt
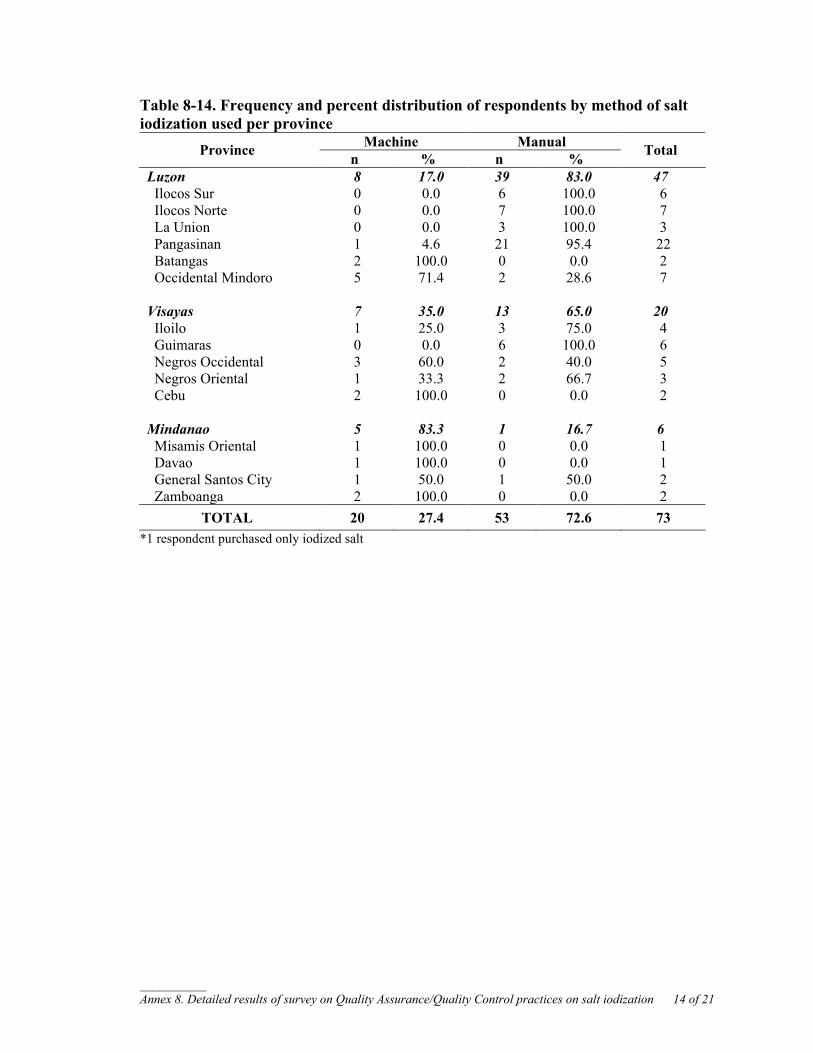
__________ Annex 8. Detailed results of survey on Quality Assurance/Quality Control practices on salt iodization 14 of 21
Table 8-14. Frequency and percent distribution of respondents by method of salt iodization used per province
Machine Manual Province n % n % Total
Luzon 8 17.0 39 83.0 47 Ilocos Sur 0 0.0 6 100.0 6 Ilocos Norte 0 0.0 7 100.0 7 La Union 0 0.0 3 100.0 3 Pangasinan 1 4.6 21 95.4 22 Batangas 2 100.0 0 0.0 2 Occidental Mindoro 5 71.4 2 28.6 7 Visayas 7 35.0 13 65.0 20 Iloilo 1 25.0 3 75.0 4 Guimaras 0 0.0 6 100.0 6 Negros Occidental 3 60.0 2 40.0 5 Negros Oriental 1 33.3 2 66.7 3 Cebu 2 100.0 0 0.0 2 Mindanao 5 83.3 1 16.7 6 Misamis Oriental 1 100.0 0 0.0 1 Davao 1 100.0 0 0.0 1 General Santos City 1 50.0 1 50.0 2 Zamboanga 2 100.0 0 0.0 2
TOTAL 20 27.4 53 72.6 73 *1 respondent purchased only iodized salt
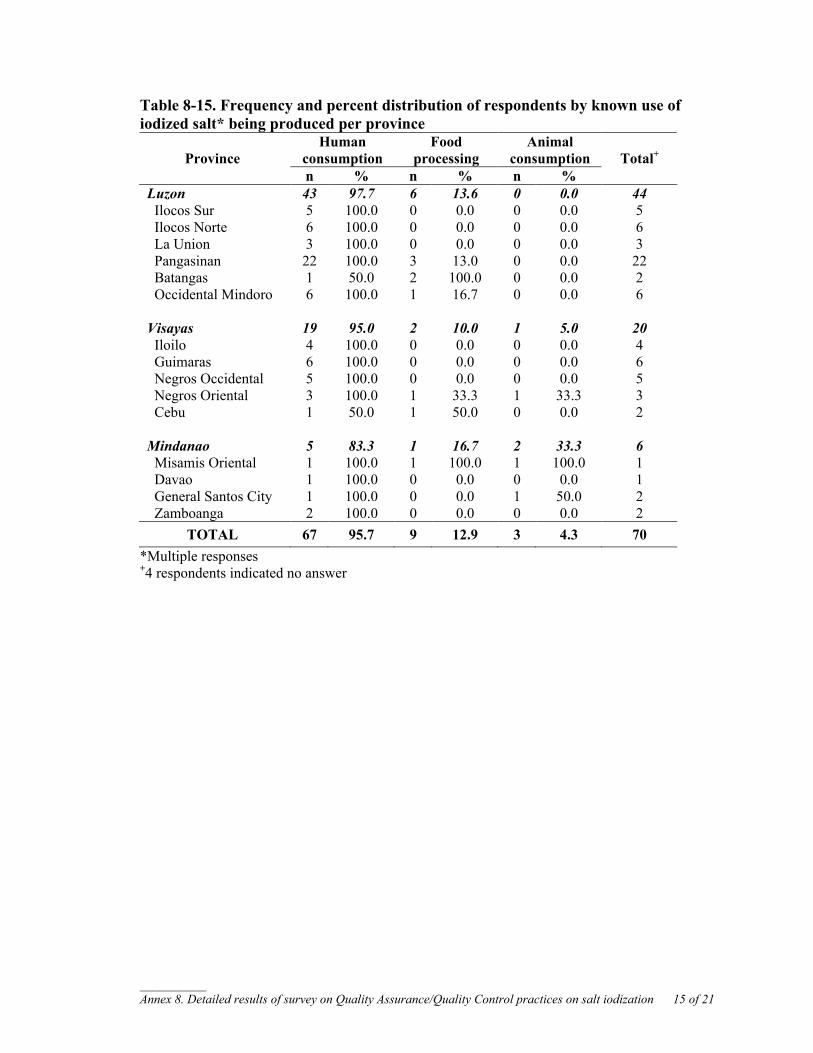
__________ Annex 8. Detailed results of survey on Quality Assurance/Quality Control practices on salt iodization 15 of 21
Table 8-15. Frequency and percent distribution of respondents by known use of iodized salt* being produced per province
Human consumption
Food processing
Animal consumption Province
n % n % n % Total+
Luzon 43 97.7 6 13.6 0 0.0 44 Ilocos Sur 5 100.0 0 0.0 0 0.0 5 Ilocos Norte 6 100.0 0 0.0 0 0.0 6 La Union 3 100.0 0 0.0 0 0.0 3 Pangasinan 22 100.0 3 13.0 0 0.0 22 Batangas 1 50.0 2 100.0 0 0.0 2 Occidental Mindoro 6 100.0 1 16.7 0 0.0 6 Visayas 19 95.0 2 10.0 1 5.0 20 Iloilo 4 100.0 0 0.0 0 0.0 4 Guimaras 6 100.0 0 0.0 0 0.0 6 Negros Occidental 5 100.0 0 0.0 0 0.0 5 Negros Oriental 3 100.0 1 33.3 1 33.3 3 Cebu 1 50.0 1 50.0 0 0.0 2 Mindanao 5 83.3 1 16.7 2 33.3 6 Misamis Oriental 1 100.0 1 100.0 1 100.0 1 Davao 1 100.0 0 0.0 0 0.0 1 General Santos City 1 100.0 0 0.0 1 50.0 2 Zamboanga 2 100.0 0 0.0 0 0.0 2
TOTAL 67 95.7 9 12.9 3 4.3 70 *Multiple responses +4 respondents indicated no answer
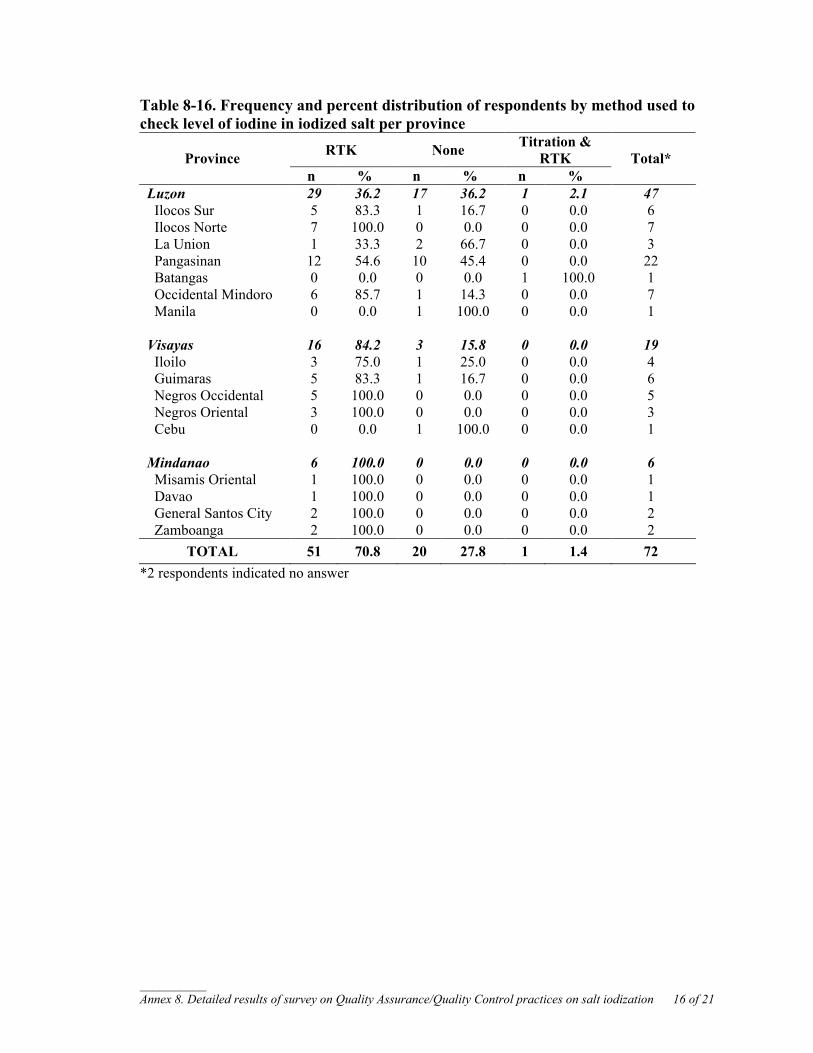
__________ Annex 8. Detailed results of survey on Quality Assurance/Quality Control practices on salt iodization 16 of 21
Table 8-16. Frequency and percent distribution of respondents by method used to check level of iodine in iodized salt per province
RTK None Titration & RTK Province
n % n % n % Total*
Luzon 29 36.2 17 36.2 1 2.1 47 Ilocos Sur 5 83.3 1 16.7 0 0.0 6 Ilocos Norte 7 100.0 0 0.0 0 0.0 7 La Union 1 33.3 2 66.7 0 0.0 3 Pangasinan 12 54.6 10 45.4 0 0.0 22 Batangas 0 0.0 0 0.0 1 100.0 1 Occidental Mindoro 6 85.7 1 14.3 0 0.0 7 Manila 0 0.0 1 100.0 0 0.0 1 Visayas 16 84.2 3 15.8 0 0.0 19 Iloilo 3 75.0 1 25.0 0 0.0 4 Guimaras 5 83.3 1 16.7 0 0.0 6 Negros Occidental 5 100.0 0 0.0 0 0.0 5 Negros Oriental 3 100.0 0 0.0 0 0.0 3 Cebu 0 0.0 1 100.0 0 0.0 1 Mindanao 6 100.0 0 0.0 0 0.0 6 Misamis Oriental 1 100.0 0 0.0 0 0.0 1 Davao 1 100.0 0 0.0 0 0.0 1 General Santos City 2 100.0 0 0.0 0 0.0 2 Zamboanga 2 100.0 0 0.0 0 0.0 2
TOTAL 51 70.8 20 27.8 1 1.4 72 *2 respondents indicated no answer

__________ Annex 8. Detailed results of survey on Quality Assurance/Quality Control practices on salt iodization 17 of 21
Table 8-17. Frequency and percent distribution of respondents by method used to check level of iodine in iodized salt per province
RTK None Titration & RTK Province
n % n % n % Total*
Luzon 29 36.2 17 36.2 1 2.1 47 Ilocos Sur 5 83.3 1 16.7 0 0.0 6 Ilocos Norte 7 100.0 0 0.0 0 0.0 7 La Union 1 33.3 2 66.7 0 0.0 3 Pangasinan 12 54.6 10 45.4 0 0.0 22 Batangas 0 0.0 0 0.0 1 100.0 1 Occidental Mindoro 6 85.7 1 14.3 0 0.0 7 Manila 0 0.0 1 100.0 0 0.0 1 Visayas 16 84.2 3 15.8 0 0.0 19 Iloilo 3 75.0 1 25.0 0 0.0 4 Guimaras 5 83.3 1 16.7 0 0.0 6 Negros Occidental 5 100.0 0 0.0 0 0.0 5 Negros Oriental 3 100.0 0 0.0 0 0.0 3 Cebu 0 0.0 1 100.0 0 0.0 1 Mindanao 6 100.0 0 0.0 0 0.0 6 Misamis Oriental 1 100.0 0 0.0 0 0.0 1 Davao 1 100.0 0 0.0 0 0.0 1 General Santos City 2 100.0 0 0.0 0 0.0 2 Zamboanga 2 100.0 0 0.0 0 0.0 2
TOTAL 51 70.8 20 27.8 1 1.4 72 *2 respondents indicated no answer
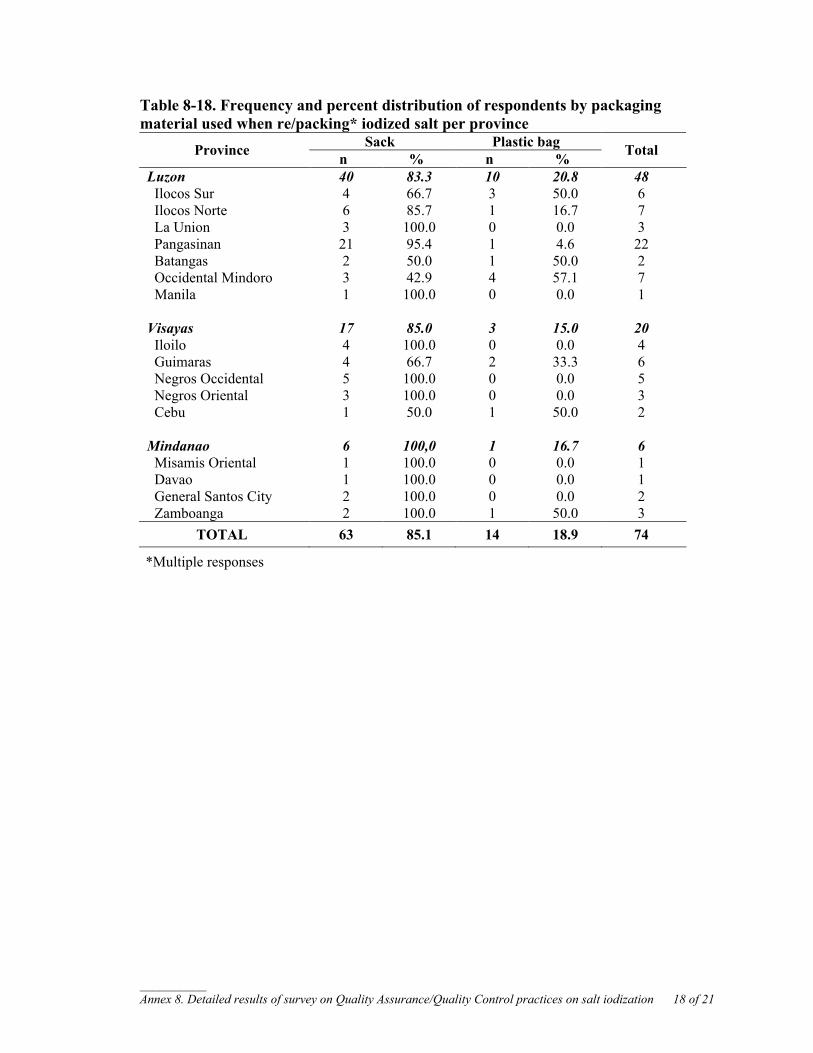
__________ Annex 8. Detailed results of survey on Quality Assurance/Quality Control practices on salt iodization 18 of 21
Table 8-18. Frequency and percent distribution of respondents by packaging material used when re/packing* iodized salt per province
Sack Plastic bag Province n % n % Total
Luzon 40 83.3 10 20.8 48 Ilocos Sur 4 66.7 3 50.0 6 Ilocos Norte 6 85.7 1 16.7 7 La Union 3 100.0 0 0.0 3 Pangasinan 21 95.4 1 4.6 22 Batangas 2 50.0 1 50.0 2 Occidental Mindoro 3 42.9 4 57.1 7 Manila 1 100.0 0 0.0 1 Visayas 17 85.0 3 15.0 20 Iloilo 4 100.0 0 0.0 4 Guimaras 4 66.7 2 33.3 6 Negros Occidental 5 100.0 0 0.0 5 Negros Oriental 3 100.0 0 0.0 3 Cebu 1 50.0 1 50.0 2 Mindanao 6 100,0 1 16.7 6 Misamis Oriental 1 100.0 0 0.0 1 Davao 1 100.0 0 0.0 1 General Santos City 2 100.0 0 0.0 2 Zamboanga 2 100.0 1 50.0 3
TOTAL 63 85.1 14 18.9 74
*Multiple responses
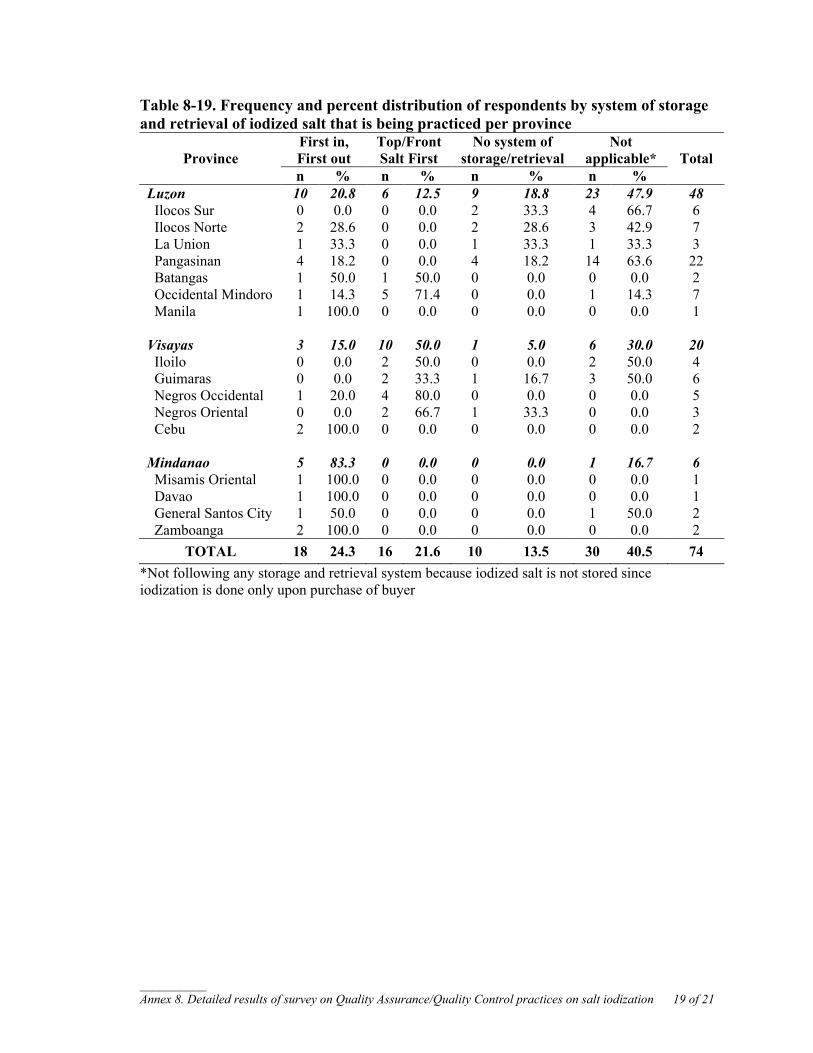
__________ Annex 8. Detailed results of survey on Quality Assurance/Quality Control practices on salt iodization 19 of 21
Table 8-19. Frequency and percent distribution of respondents by system of storage and retrieval of iodized salt that is being practiced per province
First in, First out
Top/Front Salt First
No system of storage/retrieval
Not applicable* Province
n % n % n % n % Total
Luzon 10 20.8 6 12.5 9 18.8 23 47.9 48 Ilocos Sur 0 0.0 0 0.0 2 33.3 4 66.7 6 Ilocos Norte 2 28.6 0 0.0 2 28.6 3 42.9 7 La Union 1 33.3 0 0.0 1 33.3 1 33.3 3 Pangasinan 4 18.2 0 0.0 4 18.2 14 63.6 22 Batangas 1 50.0 1 50.0 0 0.0 0 0.0 2 Occidental Mindoro 1 14.3 5 71.4 0 0.0 1 14.3 7 Manila 1 100.0 0 0.0 0 0.0 0 0.0 1 Visayas 3 15.0 10 50.0 1 5.0 6 30.0 20 Iloilo 0 0.0 2 50.0 0 0.0 2 50.0 4 Guimaras 0 0.0 2 33.3 1 16.7 3 50.0 6 Negros Occidental 1 20.0 4 80.0 0 0.0 0 0.0 5 Negros Oriental 0 0.0 2 66.7 1 33.3 0 0.0 3 Cebu 2 100.0 0 0.0 0 0.0 0 0.0 2 Mindanao 5 83.3 0 0.0 0 0.0 1 16.7 6 Misamis Oriental 1 100.0 0 0.0 0 0.0 0 0.0 1 Davao 1 100.0 0 0.0 0 0.0 0 0.0 1 General Santos City 1 50.0 0 0.0 0 0.0 1 50.0 2 Zamboanga 2 100.0 0 0.0 0 0.0 0 0.0 2
TOTAL 18 24.3 16 21.6 10 13.5 30 40.5 74 *Not following any storage and retrieval system because iodized salt is not stored since iodization is done only upon purchase of buyer
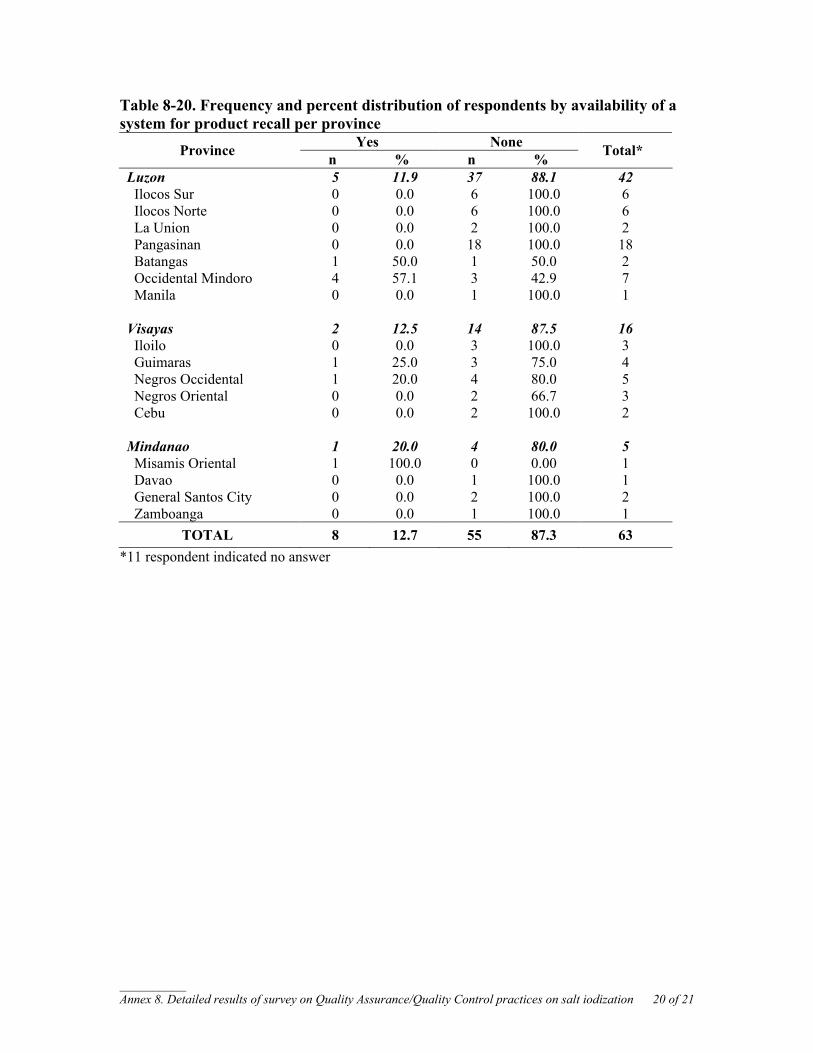
__________ Annex 8. Detailed results of survey on Quality Assurance/Quality Control practices on salt iodization 20 of 21
Table 8-20. Frequency and percent distribution of respondents by availability of a system for product recall per province
Yes None Province n % n % Total*
Luzon 5 11.9 37 88.1 42 Ilocos Sur 0 0.0 6 100.0 6 Ilocos Norte 0 0.0 6 100.0 6 La Union 0 0.0 2 100.0 2 Pangasinan 0 0.0 18 100.0 18 Batangas 1 50.0 1 50.0 2 Occidental Mindoro 4 57.1 3 42.9 7 Manila 0 0.0 1 100.0 1 Visayas 2 12.5 14 87.5 16 Iloilo 0 0.0 3 100.0 3 Guimaras 1 25.0 3 75.0 4 Negros Occidental 1 20.0 4 80.0 5 Negros Oriental 0 0.0 2 66.7 3 Cebu 0 0.0 2 100.0 2 Mindanao 1 20.0 4 80.0 5 Misamis Oriental 1 100.0 0 0.00 1 Davao 0 0.0 1 100.0 1 General Santos City 0 0.0 2 100.0 2 Zamboanga 0 0.0 1 100.0 1
TOTAL 8 12.7 55 87.3 63 *11 respondent indicated no answer
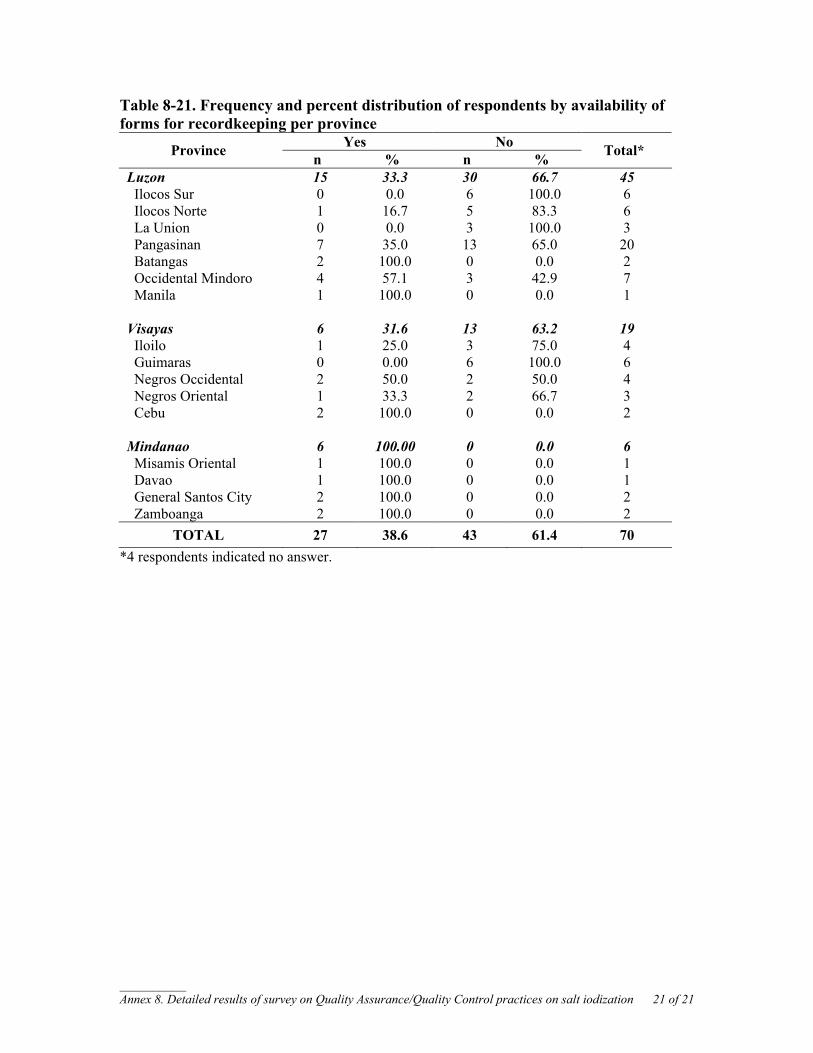
__________ Annex 8. Detailed results of survey on Quality Assurance/Quality Control practices on salt iodization 21 of 21
Table 8-21. Frequency and percent distribution of respondents by availability of forms for recordkeeping per province
Yes No Province n % n % Total*
Luzon 15 33.3 30 66.7 45 Ilocos Sur 0 0.0 6 100.0 6 Ilocos Norte 1 16.7 5 83.3 6 La Union 0 0.0 3 100.0 3 Pangasinan 7 35.0 13 65.0 20 Batangas 2 100.0 0 0.0 2 Occidental Mindoro 4 57.1 3 42.9 7 Manila 1 100.0 0 0.0 1 Visayas 6 31.6 13 63.2 19 Iloilo 1 25.0 3 75.0 4 Guimaras 0 0.00 6 100.0 6 Negros Occidental 2 50.0 2 50.0 4 Negros Oriental 1 33.3 2 66.7 3 Cebu 2 100.0 0 0.0 2 Mindanao 6 100.00 0 0.0 6 Misamis Oriental 1 100.0 0 0.0 1 Davao 1 100.0 0 0.0 1 General Santos City 2 100.0 0 0.0 2 Zamboanga 2 100.0 0 0.0 2
TOTAL 27 38.6 43 61.4 70 *4 respondents indicated no answer.