Embed Size (px)
Citation preview

A Survey of Tennessee State Park Rangers: Their Attitudes Toward and
Participation in Wildlife Related Activities
A Research Paper Presented for the Master of Science
in Agriculture and Natural Resources Degree
The University of Tennessee, Martin
Melissa F. Urick May 2013

------- -------
Author's Limited-use Agreement
In presenting this completed paper in partial fulfillment of the requirements for anacademic degree, I represent that it is an original Work and therefore assert the rights ofan Author under Title 17 of the United States Code (copyright). I understand theUniversity maintains one or more copies ofthe Work in its institutional archive as thepermanent record of the Work's acceptance toward the degree, with the understandingthat the University will maintain archival copies of the Work in such forms as bestensures its permanent preservation and continued public accessibility.
Notwithstanding the retention of copyright and all other rights to this Work, I recognizethe University of Tennessee as the effective publisher ofthis paper and grant irrevocablyto the University the following limited use of the Work in perpetuity:
a) representing the University, UTM University Archives may duplicate and distributecopies of the Work on the following terms, without recovering royalty payments or otherconsiderations for the Author:
i) the archival copy will be publicly accessible upon deposit and acceptance of thedegree, and an electronic version of the Work will be posted for public accessibilityand distribution on an institutional repository as an archival document, which maybe downloaded by users without charge;
ii) the UTM University Archives may duplicate copies of the Work as requested forthe holdings of other academic libraries, so long as reproduction costs amount onlyto a sum required to recover actual duplication costs and shipping; however, thelimited uses granted here do not transfer to other institutions holding copies of thework;
b) in the event that the Author or their heirs cannot be located after a documented good-faith effort is made by a user,
i) the Author's lead graduate-committee professor shall have authority to grantpermission for extensive quotation from the Work during the term of copyright, butnot for publication of the Work;
ii) in the professor's absence, University Archives shall have authority to grantpermission for extensive quotation in its function as archival custodian forUniversity theses and papers, but not for publication or performance of the work;
iii) the University shall have authority to grant publication or performance permissionto the Work as it stands in the deposit copy, provided the use is determined to beprimarily scholarly or for demonstration, and non-commercial;
c) any duplication or use of the Work for financial gain ofa user, except as stated here, isprohibited and duplication may be refused.
Author: ~ -t ·-i/tA:r..KDate: 5~ I / L~
I' 7
- ----------- ----

ii
ACKNOWLEDGEMENTS
I would like to thank several individuals who have helped me over the course of this
project and throughout this graduate program. All of my professors have been so helpful in
providing me with a well-rounded and applicable education; for this I am very grateful. A special
thank you to Dr. Barb Darroch, who has been an excellent mentor during my time in this
program and someone I would consider a friend. I would also like to thank her for working with
me on this project, providing me with statistical guidance. Another thank you is extended for Dr.
Philip Smartt, who has been an excellent help in developing this project and carrying it through
to completion. I am extremely grateful to my husband for giving me the understanding, support,
and encouragement throughout my time as a graduate student.

iii
ABSTRACT
State park rangers play a vital role in increasing public awareness and appreciation of
wildlife and wildlife management, through ranger led programs using a variety of interpretive
tools. Because park rangers are so involved in disseminating wildlife information, it is important
to gather information on their values and attitudes toward wildlife, as they can influence public
acknowledgement of wildlife values and management policy. This project was developed to help
shed light on the values and attitudes toward wildlife that are held by Tennessee State Park
Rangers and determine what attitude and value orientation is most common among these
individuals. In addition, the study also examined participation in wildlife-related recreation.
A 29-question survey was created to identify attitudes and values held by Tennessee State
Park Rangers related to the use of wildlife, including their participation in the use of wildlife.
Out of 209 potential respondents, 132 Tennessee State Park Rangers responded to the survey for
an overall response rate of 63%. Chi-square and Fisher’s exact tests were used to determine if
attitudes toward wildlife or participation in wildlife-related recreation were related to gender,
education level, or location of childhood residence.
The majority of survey respondents hold very positive attitudes toward the acceptability
of legal hunting and fishing, wildlife watching, the baiting and calling of wildlife, and the use of
live wildlife or non-living wildlife items in interpretive programs. While differences among
demographic groups (rural vs. urban, gender, education) were observed with respect to wildlife
attitudes and wildlife-related recreation participation, there were only two demographic
characteristics in this study that showed significant relationships. Respondents’ gender was often
predictive of wildlife attitudes and wildlife-related recreation participation (P ≤ 0.10). More
females than males participate in non-consumptive wildlife-related recreation such as

iv
birdwatching and other wildlife watching. Fewer females than males hunt. A higher percentage
of females than males regarded fishing or hunting for meat as only sometimes acceptable. Also,
attitudes toward the acceptability of trophy hunting were significantly (P < 0.0001) related to
rural vs. urban childhood residence. Respondents who grew up in a rural location were more
acceptable of trophy hunting than those that grew up in an urban location.
v
TABLE OF CONTENTS
CHAPTER 1. INTRODUCTION ....................................................................................................1
SIGNIFICANCE OF THE STUDY ........................................................................................................1 OBJECTIVES OF THE STUDY ............................................................................................................2
CHAPTER 2. LITERATURE REVIEW .........................................................................................3
VALUES AND ATTITUDES................................................................................................................3 TYPES OF WILDLIFE VALUE ORIENTATIONS ....................................................................................5
Utilitarian .................................................................................................................................6 Mutualist ...................................................................................................................................6 Pluralist ....................................................................................................................................6
NATIONAL WILDLIFE USE AND VALUE TRENDS ..............................................................................7 Fishing and Hunting .................................................................................................................7 Wildlife Watching ...................................................................................................................11
STATE PARK VISITATION TRENDS ...............................................................................................13 TENNESSEE ATTITUDES TOWARD WILDLIFE .................................................................................14 RURAL-URBAN INFLUENCES ON WILDLIFE ATTITUDES AND USE ...................................................14 GENDER AND EDUCATION LEVEL INFLUENCES ON WILDLIFE ATTITUDES AND USE .......................16
CHAPTER 3. METHODOLOGY .................................................................................................17
SURVEY PROCEDURES ..................................................................................................................17 STUDY POPULATION .....................................................................................................................17 DATA COLLECTION ......................................................................................................................17 DATA ANALYSIS ...........................................................................................................................18
CHAPTER 4. RESULTS ...............................................................................................................19
SOCIO-DEMOGRAPHICS OF RESPONDENTS ....................................................................................19 SURVEY RESULTS BASED ON RESEARCH OBJECTIVES ...................................................................19
Objective 1 ..............................................................................................................................19 Objective 2 ..............................................................................................................................23 Objective 3 ..............................................................................................................................26 Objective 4 ..............................................................................................................................30
vi
CHAPTER 5. DISCUSSION .........................................................................................................47
CHAPTER 6. CONCLUSION.......................................................................................................50
LITERATURE CITED ..................................................................................................................51
APPENDIX A: IRB LETTER FROM THE UNIVERSITY OF TENNESSEE AT MARTIN ....54
APPENDIX B: SURVEY QUESTIONS .......................................................................................55
vii
LIST OF TABLES
Table 1: Total wildlife-related recreation from the 2011 National Survey of Fishing, Hunting, and Wildlife-Associated Recreation. .............................................................................................. 8
Table 2: Fastest-growing U.S. nature-based outdoor activities in 2000-2007 according to the 2005-2008 National Survey on Recreation and the Environment ................................................ 10
Table 3: Demographics of Tennessee State Park Rangers survey respondents ........................... 20
Table 4: Comparison of P-values from Chi-square or Fisher’s exact test analysis to determine relationships to wildlife attitudes and wildlife-related recreation participation among gender, childhood residence (rural vs. urban), and education attained by respondents. ........................... 29

viii
LIST OF FIGURES
Figure 1: Respondents’ attitudes toward the always, sometimes, or never acceptability of legal hunting types. ................................................................................................................................ 21
Figure 2: Respondents’ attitudes toward the always, sometimes, or never acceptability of legal fishing types. ................................................................................................................................. 21
Figure 3: Respondents’ top choice in personal participation of wildlife-related recreation.... ..... 24
Figure 4: Respondents’ primary motivation for hunting, if they hunt, based on four different hunting motives... .......................................................................................................................... 24
Figure 5: Respondents’ primary motivation for fishing, if they fish, based on four different fishing motives... ........................................................................................................................... 25
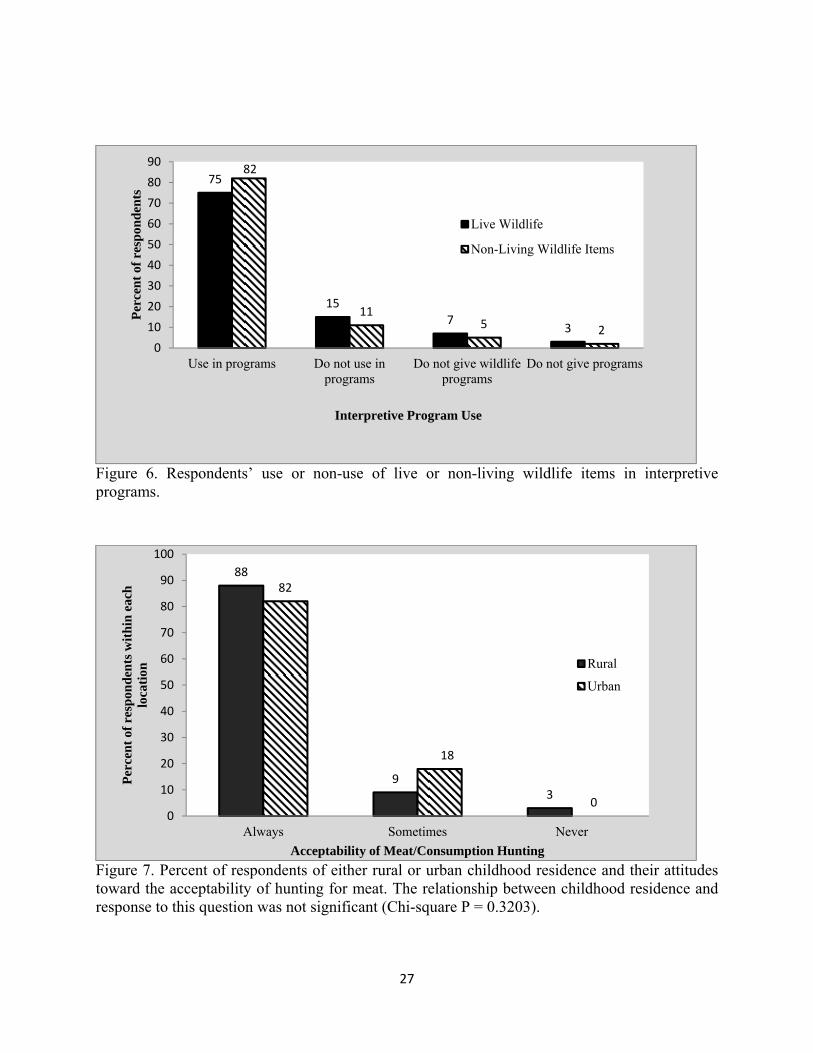
Figure 6: Respondents’ use or non-use of live or non-living wildlife items in interpretive programs... .................................................................................................................................... 27
Figure 7: Percent of respondents of either rural or urban childhood residence and their attitudes toward the acceptability of hunting for meat... ............................................................... 27
Figure 8: Percent of respondents of either rural or urban childhood residence and their attitudes toward the acceptability of fishing for meat. .................................................................. 28
Figure 9 : Percent of respondents of either rural or urban childhood residence and their attitudes toward the acceptability of hunting for sport…. ............................................................ 31
Figure 10: Percent of respondents of either rural or urban childhood residence and their attitudes toward the acceptability of trophy hunting.. ................................................................... 31
Figure 11: Percent of respondents of either rural or urban childhood residence and their attitudes toward the acceptability of fishing for sport. ................................................................. 32
ix
Figure 12: Percent of respondents of either rural or urban childhood residence and their attitudes toward the acceptability of trophy fishing. ..................................................................... 32
Figure 13: Percent of respondents of either rural or urban childhood residence and their primary wildlife-related recreation use, consumptive or non-consumptive. ................................ 33
Figure 14: Percent of respondents of either rural or urban childhood residence and their primary choice of participation in wildlife-related recreation . .................................................... 33
Figure 15: Percent of respondents of either rural or urban childhood residence and their participation in hunting. ................................................................................................................ 34
Figure 16: Percent of respondents of either rural or urban childhood residence and their participation in fishing.... .............................................................................................................. 34
Figure 17: Percent of male and female respondents and their attitudes toward the acceptability of hunting for meat. ................................................................................................. 35
Figure 18: Percent of male and female respondents and their attitudes toward the acceptability of hunting for sport.. ................................................................................................ 35
Figure 19: Percent of male and female respondents and their attitudes toward the acceptability of fishing for meat. .................................................................................................. 36
Figure 20: Percent of male and female respondents and their attitudes toward the acceptability of fishing for sport. .................................................................................................. 36
Figure 21: Percent of male and female respondents and their attitudes toward the acceptability of trophy hunting.. ................................................................................................... 37
Figure 22: Percent of male and female respondents and their attitudes toward the acceptability of trophy fishing. ..................................................................................................... 37

x
Figure 23: Percent of male and female respondents and their primary choice of participation in wildlife-related recreation.... ................................................................................ 39
Figure 24: Percent of male and female respondents and their primary wildlife-related recreation use, consumptive or non-consumptive. ........................................................................ 39
Figure 25: Percent of male and female respondents and their participation in hunting.. ............. 40
Figure 26: Percent of male and female respondents and their participation in fishing.. ............... 40
Figure 27: Percent of respondents within each education level and their attitudes toward the acceptability of hunting for meat... ............................................................................................... 41
Figure 28: Percent of respondents within each education level and their attitudes toward the acceptability of fishing for meat.. ................................................................................................. 41
Figure 29: Percent of respondents within each education level and their attitudes toward the acceptability of fishing for sport. .................................................................................................. 42
Figure 30: Percent of respondents within each education level and their attitudes toward the acceptability of hunting for sport. ................................................................................................. 42
Figure 31: Percent of respondents within each education level and their attitudes toward the acceptability of trophy fishing. ..................................................................................................... 44
Figure 32: Percent of respondents within each education level and their attitudes toward the acceptability of trophy hunting ..................................................................................................... 44
Figure 33: Percent of respondents within each education level and their primary choice of participation in wildlife-related recreation. ................................................................................... 45
Figure 34: Percent of respondents within each education level and their primary wildlife-related recreation use, consumptive or non-consumptive. .............................................. 45

xi
Figure 35: Percent of respondents within each education level and their participation in hunting. ......................................................................................................................................... 46 Figure 36: Percent of respondents within each education level and their participation in fishing.... ....................................................................................................................................... 46

xii
1
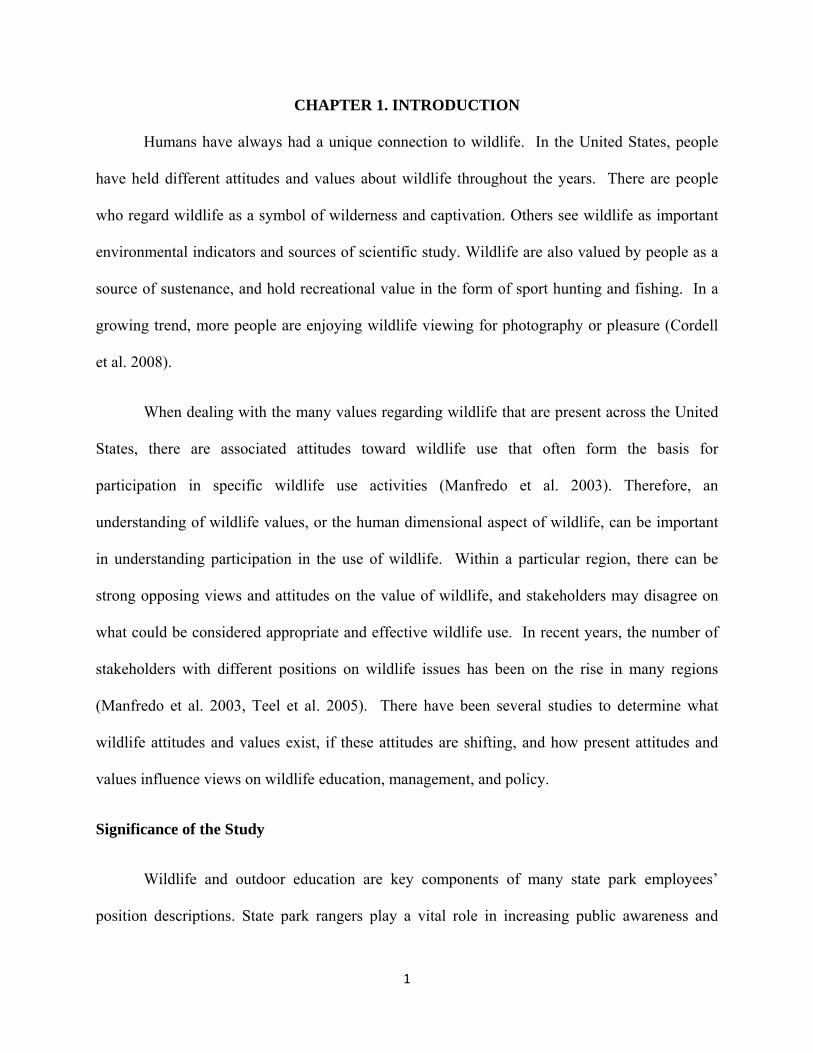
CHAPTER 1. INTRODUCTION
Humans have always had a unique connection to wildlife. In the United States, people
have held different attitudes and values about wildlife throughout the years. There are people
who regard wildlife as a symbol of wilderness and captivation. Others see wildlife as important
environmental indicators and sources of scientific study. Wildlife are also valued by people as a
source of sustenance, and hold recreational value in the form of sport hunting and fishing. In a
growing trend, more people are enjoying wildlife viewing for photography or pleasure (Cordell
et al. 2008).
When dealing with the many values regarding wildlife that are present across the United
States, there are associated attitudes toward wildlife use that often form the basis for
participation in specific wildlife use activities (Manfredo et al. 2003). Therefore, an
understanding of wildlife values, or the human dimensional aspect of wildlife, can be important
in understanding participation in the use of wildlife. Within a particular region, there can be
strong opposing views and attitudes on the value of wildlife, and stakeholders may disagree on
what could be considered appropriate and effective wildlife use. In recent years, the number of
stakeholders with different positions on wildlife issues has been on the rise in many regions
(Manfredo et al. 2003, Teel et al. 2005). There have been several studies to determine what
wildlife attitudes and values exist, if these attitudes are shifting, and how present attitudes and
values influence views on wildlife education, management, and policy.
Significance of the Study
Wildlife and outdoor education are key components of many state park employees’
position descriptions. State park rangers play a vital role in increasing public awareness and
2
appreciation of wildlife and wildlife management, through ranger led programs using a variety of
interpretive tools. Wildlife management agencies are becoming increasingly aware of the
important role people and wildlife education have in wildlife management. Managers realize
that knowledge of public understanding of wildlife policy through education and outreach is
necessary to reach policy agreement and understanding among differing stakeholders (Siemer et
al. 1991). Because park rangers are so involved in disseminating wildlife information, it is
important to gather information on their values and attitudes toward wildlife, as they can
influence public acknowledgement of wildlife values and management policy. This project was
developed to help shed light on the values and attitudes toward wildlife that are held by
Tennessee State Park Rangers and determine what attitude and value orientation is most common
among these individuals.
Objectives of the Study
The purpose of this study was to identify attitudes toward wildlife use held by Tennessee
State Park Rangers, and to gain knowledge of their wildlife use participation. The following
objectives were identified:
1. To determine what attitudes and value orientations toward wildlife use are present
among Tennessee State Park Rangers;
2. To determine what wildlife use activities Tennessee State Park Rangers participate in;
3. To determine if rural vs. urban childhood residence among Tennessee State Park
Rangers is related to attitudes toward wildlife and wildlife use participation;
4. To determine if gender and education level among Tennessee State Park Rangers is
related to attitudes toward wildlife and wildlife use participation.

3
CHAPTER 2. LITERATURE REVIEW
Values and Attitudes
To more fully understand values and attitudes toward wildlife, one must explore how
values and attitudes are developed and can be altered. Values are a powerful and complex
influence on attitudes, human behavior, and motivation. A person’s values are influenced by
their immediate social foundations such as family and friends and to a lesser degree by more
external influences such as the media (Homer & Kahle 1988, Kollmuss & Agyeman 2002).
Values are considered to be the basis for differences in attitudes toward wildlife and for
predicting wildlife use participation (Fulton et al. 1996).
Values are considered a basic social cognition and are the foundation of attitude
development. According to Fulton et al. (1996, p. 25), values are defined as “fundamental,
enduring beliefs or mental constructs that are used to evaluate the desirability of specific modes
of conduct or the ends achieved through such conduct.” It is important to note that values are
generally established early in a person’s life, during childhood (Zinn et al. 2002). Research has
shown that values can be difficult and at times impossible to change as they are deeply ingrained
(Teel et al. 2005).
Attitudes are like values in that they are used as cues in one’s environment to allow for
adaptation to the environmental situation (Homer & Kahle 1988). Attitudes are defined as a
“summary evaluation of objects…ranging from positive to negative” (Petty et al. 1997, p. 611).
It has been theorized that knowledge and values influence one’s attitudes and, ultimately,
behavior choices. A study of natural food shopping behavior by Homer and Kahle (1988) found
that attitudes were the bridge between knowledge of nutrition, values toward natural food, and,
4
ultimately, natural food shopping behavior. However, when looking at this hierarchy through the
framework of pro-environment (wildlife included) behavior, this did not prove to be the case.
More often than not, environment-related knowledge and values did not lead to pro-environment
behavior (Kollmuss & Agyeman 2002). There was an attitude gap. Ajzen & Fishbein (1977, p.
912), state that “a person’s attitude has a consistently strong relation with his or her behavior
when it is directed at the same target and when it involves the same action.” Behavior is not
always directly related to attitudes; instead attitudes can lead to behavioral intent and eventual
action (Kollmuss & Agyeman 2002, Petty et al. 1997).
Pro-environment value and attitude establishment are the result of a combination of
factors such as education, family environmental values, role-models, nature experiences as a
child, and the influence of nature or environmental organizations (Kollmuss & Agyeman 2002).
Ultimately, it is the combination of environmental knowledge, values, attitudes, and emotions
that can create nature awareness and lead to participation in nature-related activities.
Looking at values and attitudes toward wildlife, one must understand the difficulty that
can arise when trying to bring about attitude changes. State park rangers that provide wildlife
interpretation programs may need to rely heavily on persuasion to educate the public on the
importance of wildlife and wildlife management policy, ultimately influencing attitude.
Persuasion has been shown to be an excellent method for attitude change in a recipient of the
intended message. Studies have determined that real attitude change is often the result of central
and/or peripheral routes to persuasion (Petty et al. 1997). The central route requires the
recipient of the intended message to be highly motivated to listen to the message and also able to
effectively process the message. The peripheral route is best for individuals who lack the
motivation to listen to the message and are not readily able to process the message effectively

5
(Petty et al. 1997). Research has shown that the source of the message and the message itself are
critical to persuasive attitude change. For instance, if the message is not given at the best time to
be received, and the source does not appear to be credible, the recipient will likely not be
influenced by the message and no attitude change will occur (Petty et al. 1997).
It is important to realize the complexity of values and attitudes and the intricacies of
effectively bringing about attitude change in an individual. People and the values and attitudes
they possess are not so easy to comprehend or change/modify. State park rangers responsible for
wildlife and outdoor education programs may exhibit differences in personal values and attitudes
toward wildlife when compared to the general public.
Types of Wildlife Value Orientations
Values can help clarify differences among members of society with regard to wildlife issues
and likelihood and type of wildlife use recreation. Determining and defining wildlife value
orientations has been an important role in determining wildlife related attitudes. According to
Fulton et al. (1996), wildlife value orientations were directly related to survey respondents’
attitudes toward hunting, fishing, and wildlife watching. Similarly, respondents’ attitudes toward
fishing, hunting and wildlife watching were predictive of their participation in these activities.
Attitudes toward hunting and fishing and the intention to participate in these activities explained
75% of the variation. Twenty-five percent of the variation toward wildlife watching was also
explained by attitudes. Two wildlife value orientations have been described in research: the
utilitarian-consumptive value orientation and the mutualism-appreciation value orientation
(Fulton et al. 1996, Manfredo et al. 2003, Teel et al. 2005). Three types of wildlife value
orientations have been recognized: utilitarian, mutualist, and pluralist.
6
Utilitarian
The utilitarian, or “use”, wildlife value orientation is the view that wildlife is present for
human use and therefore must be managed for human gain. This is a very traditional value that
is still found in many societies around the world. It is considered to be a consumptive value.
People who hold this value generally favor hunting and fishing and believe that wildlife is
important for human use (Manfredo et al. 2003, Teel et al. 2005, Zinn et al. 2002).
Mutualist
The mutualist wildlife value is the opposite of the utilitarian value. Mutualists hold the view
that wildlife and humans need each other and benefit one another. This is a non-consumptive
value. Many people who hold this view draw on an emotional aspect of wildlife and believe they
are here to take care of and protect wildlife (Manfredo et al. 2003, Teel et al. 2005). They may
be more interested in wildlife watching, photography, and feeding.
Pluralist
The pluralist wildlife value orientation is a combination of both the utilitarian and mutualist
values. Teel et al. (2005), explains how this value is based on given circumstances within an
individual’s life. They provide an example of a woman whose husband hunts and she is
accepting of it. However, she would never hunt herself because she could not harm an animal,
even to provide food for her family. In this example, it is evident that she holds both utilitarian
and mutualist values.

7
National Wildlife Use and Value Trends
There are two national surveys that focus on outdoor recreation and wildlife related activities
across the nation: the National Survey on Recreation and the Environment (NSRE) and the
National Survey of Fishing, Hunting, and Wildlife-Associated Recreation (FHWAR). The NSRE
has been conducted periodically since 1960 to provide statistical information on outdoor
recreation and values in the United States (Interagency National Survey Consortium 2002). Prior
to 1994, the survey was called the Nationwide Recreation Survey (NRS). The latest completed
NSRE survey was in 2005-2008. The latest completed FHWAR survey was in 2011; it has been
conducted since 1955 to gather information on hunters, anglers, and wildlife watchers.
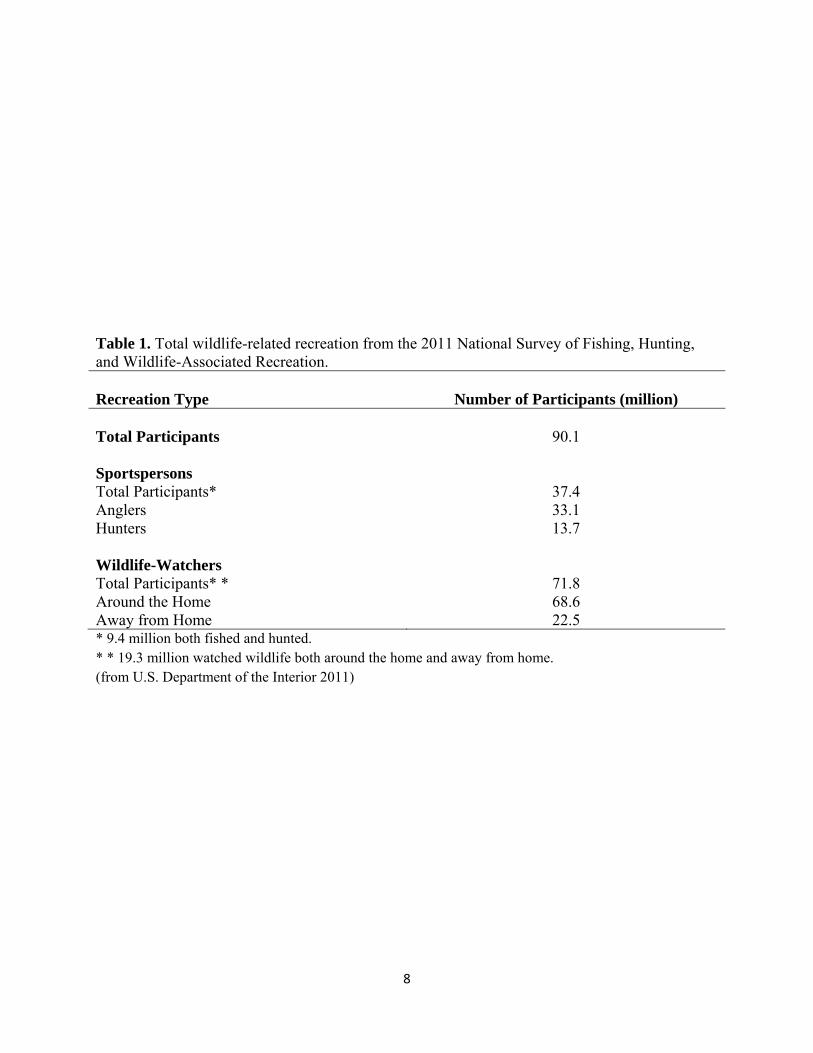
According to the 2011 FHWAR survey, 90 million people participated in some form of wildlife-
related activity in the United States (Table 1). People who watch wildlife make up the majority
of wildlife-related recreation participants according to the survey (Table 1). Comparisons with
previous survey information can be used to track trends in general outdoor recreation and
wildlife-associated recreation.
Fishing and Hunting
Fishing and hunting are considered consumptive use wildlife values. At the national level,
the NRS (1982-1983) reported that hunting participation around the country had remained fairly
stable since the 1960’s at around 12% (U.S. Department of the Interior 1986). According to the
2000-2002 NSRE, the percentage of people who hunt was 11% and the percentage who fish was
33% (Interagency National Survey Consortium 2002). In the most recent survey, the percentage
of people participating in hunting and fishing was 34% (Cordell 2012).
8
* 9.4 million both fished and hunted. * * 19.3 million watched wildlife both around the home and away from home. (from U.S. Department of the Interior 2011)
Table 1. Total wildlife-related recreation from the 2011 National Survey of Fishing, Hunting, and Wildlife-Associated Recreation. Recreation Type Number of Participants (million) Total Participants 90.1 Sportspersons Total Participants* 37.4 Anglers 33.1 Hunters 13.7 Wildlife-Watchers Total Participants* * 71.8 Around the Home 68.6 Away from Home 22.5

9
Big-game hunting was one of the top sixteen fastest-growing U.S. nature-based outdoor
activities in 2007, according to the 2005-2008 NRSE (Table 2). In general, survey respondents
who lived or grew up in rural areas were more likely to hunt and fish than their urban
counterparts (Interagency National Survey Consortium 2002). This was also confirmed in the
NSRE 2005-2008, showing a rural participation rate of 42.5% and an urban participation rate of
32.2% (Cordell 2012). Gender and education level are standard socio-demographic data
collected in the NRSE 2005-2008. Male participation rate in hunting and fishing was 46.1% and
the female participation rate was 22.8%. Participation rate in hunting and fishing was highest
among individuals who had graduated high school, had some college, or held a college degree
(Cordell 2012).
When looking at FHWAR statistics, in 2011, hunting and fishing participation was at
42%, with 37% participating in fishing and 15% participating in hunting activities. The national
participation rate for fishing was 14%, with the East South Central region (including the state of
Tennessee) at 17%. The national participation rate for hunting was 6%, with the East South
Central region at 11%. This region experienced a higher participation rate in both of these
activities when compared to the national average. Findings were similar to the NSRE 2005-2008,
which showed that the hunting and fishing participation rate increased with increasing rural
residence and decreased with urban residence. However, the majority of hunters and anglers
came from urban areas even though their participation rates in either activity were the lowest
(U.S. Department of the Interior 2011). The majority of hunters and anglers were male. Of those
who hunt, 89% were male; of those who fish 73% were male. The majority of hunters had either
graduated from high school, had some college, or a college degree; this finding was very similar

10
(from Cordell 2008)
Table 2. Fastest-growing U.S. nature-based outdoor activities in 2000-2007 according to the 2005-2008 National Survey on Recreation and the Environment.
Activity Total participants
(million), 2007
Percentage change in participants,
2000-2007 Viewing or photographing flowers and trees 118.4 25.8
Viewing or photographing natural scenery 145.5 14.1
Viewing or photographing other wildlife 114.8 21.3
Viewing or photographing birds 81.1 19.3
Visiting nature centers, etc. 127.4 5.0
Big-game hunting 20.2 12.8
Visiting wilderness 70.6 3.0
11
to the NSRE 2005-2008. Among anglers, all education levels had similar participation rates
(U.S. Department of the Interior 2011).
According to the FHWAR survey, between 1996 and 2006 there was a significant
decrease in the number of hunters and anglers; however, when comparing the years between
2006 and 2011, these numbers were up (Cordell et al. 2008). The total number of hunters went
up by 9% and anglers were up by 11%. The 9% increase in hunting puts 2011 participation equal
to that of 1991, which is considered the highest hunting rate for the past twenty years (U.S.
Department of the Interior 2011). According to the U.S. outdoor recreation participation
projections to 2060, based on the 2005-2008 NSRE, hunting participation is expected to increase
by 7 to 23% and fishing is expected to increase by 28 to 50% over the next fifty years (Cordell
2012).
Wildlife Watching
When looking at national trends in non-consumptive wildlife use values, it is apparent
that there has been an increase in this type of recreational pursuit. In the 1982-1983 NRS report,
49% of those surveyed participated in “non-consumptive wildlife-related recreation” such as
wildlife watching and photography. This percentage increased to 72% in the 2000-2002 NSRE
and 74% in the 2005-2008 NSRE. According to the 2006 FHWAR survey, the greatest
percentage (88%) of wildlife viewers enjoy watching birds (U.S. Department of the Interior
2006). The 2005-2008 NSRE found no significant difference between rural and urban
participation percentages for wildlife watching (Cordell 2012). This is evidence of a growing
trend in non-consumptive wildlife values in the United States. When comparing the wildlife
watching participation rate between males and females, the male participation rate was 73.5%

12
and the female participation rate was 74.8%. Participation rate in watching wildlife increased
with the level of education attained (Cordell 2012).
According to the 2011 FHWAR, participation in wildlife watching was 80% with around-
the-home (within 1 mile of home) participation at 76% and away-from-home participation (at
least 1 mile from home) at 25% of those surveyed. The same percentage (88%) of wildlife
watchers viewed birds in the 2011 survey and the 2006 survey. Of all wildlife watching
recreationists, 96% watched wildlife around the home, with 37% of those photographing
wildlife. Feeding wildlife in order to observe them was a common activity around the home with
95% feeding wild birds and 28% feeding other wildlife (U.S. Department of the Interior 2011).
More females (54%) than males participate in wildlife watching around the home. A similar
number of males (51%) and females (49%) watched wildlife away from home. Participation in
wildlife watching around the home and away from home increased with education level, with the
greatest percentage having completed 5 or more years of college (U.S. Department of Interior
2011). Similar to rural vs. urban participation in fishing and hunting, the largest number of
participants in both around and away from home wildlife watching was found in highly urban
areas, but the highest participation rate was located in rural areas.
From the 1996 to the 2006 FHWAR survey, the number of participants in wildlife
watching increased by 8.2% (Cordell et al. 2008). According to Table 2, viewing or
photographing wildlife or birds has been on the rise since 2000 and both are considered to be in
the top sixteen fastest-growing U.S. nature-based outdoor activities. Participation projections to
2060, based on the 2005-2008 NSRE, expect a 4-7% increase in birding and a 3% increase in
wildlife watching overall for the next fifty years (Cordell 2012).
13
These survey statistics offer evidence of national wildlife use and values from both ends
of the spectrum. If projections are met over the next fifty years, hunting and fishing utilitarian
use and wildlife watching mutualist use will increase. The number of participants and
participation rate for wildlife watching has been very high in recent years when compared to
hunting and fishing statistics. This may point to an increase in mutualist values as an indication
of what society in general is moving toward, with regard to wildlife use and management
(Clendenning et al. 2005, Manfredo et al. 2003, Zinn et al. 2002).
State Parks Visitation Trends
Visiting state and federal parks has been a popular pastime for Americans seeking public
natural areas for nature experiences including wildlife watching. Many state parks offer
interpretive programs geared toward natural themes, including wildlife, for park visitors. State
park visitation increased rapidly since the 1950’s, experiencing a peak in visitation in 2000
followed by decreasing numbers through 2006 (Cordell 2008, Cordell et al. 2008). Visitation
started to rise in 2007 and 2008 but then fell in 2009, corresponding with a strong U.S. recession
(Cordell 2012). According to the 2005-2008 NSRE, 67% of survey participants visited
interpretive sites (including state parks).
State parks are an excellent public area to watch wildlife, including birds. The 2006
FHWAR survey found that 80% of wildlife watchers traveled away from home to public areas to
watch birds and other wildlife (Cordell et al. 2008). In the 2011 FHWAR survey, there was a
17% participation rate in park visitation by all wildlife watchers. Over the next fifty years, it is
expected that visitation to interpretive sites will increase 5 to 9% and remain an important source
of wildlife watching (Cordell 2012).
14
Tennessee Attitudes Toward Wildlife
In 2005, Responsive Management conducted a public opinion survey of Tennessee
residents for the Southeastern Association of Fish and Wildlife Agencies regarding wildlife use,
management, and regard for the Tennessee Wildlife Resources Agency (TWRA). At the time of
this survey, respondents highly approved of legal hunting (85%) and legal fishing (91%) with
63% saying they had fished and 35% having hunted in the past 5 years (Responsive Management
2005). The top four outdoor recreation activities in order of preference were: feeding wildlife or
birds (58%), visiting a state or national park (55%), watching wildlife near home (43%), and
fishing (38%). A majority of respondents (47%) had traveled away from home to watch wildlife
in the past 12 months. When looking at wildlife values, hunting was ranked the lowest in
importance.
Knowledge of the Tennessee Wildlife Resources Agency was limited; 71% knew very
little or nothing about this agency, yet 63% said they were satisfied with it. When respondents
ranked TWRA programs, hunting safety education, enforcement of fish and game laws, and
conserving fish and wildlife habitat were the top three programs. Providing educational programs
on the state’s fish and wildlife fell in the middle and providing opportunities for legal hunting
was ranked last (Responsive Management 2005).
Rural-Urban Influences on Wildlife Attitudes and Use
Regardless of whether people come from urban areas or have lived in rural locations their
entire lives, they all share the commonality of having social and cultural life experiences, though
the experiences may be very different. It is through the context of their social and cultural
experiences that people define the meaning and importance of wildlife and therefore, their value

15
and attitudes toward wildlife (Eisenhauer et al. 2000). It is no surprise that someone from urban
America will bring the potential for very different attitudes toward wildlife than a long-term rural
resident might have. An urbanite has been surrounded by a different culture.
Research into values and attitudes held by urban and long-term rural residents has
produced different results. It has been believed that urban dwellers have more environmental
knowledge, as they are generally more educated, and therefore are more likely to value wildlife
preservation than a long-term rural resident (Vaske et al. 2001). While this has been evident, it is
not always the case. More researchers are finding that there are differences in the priority of
values and attitudes and that these values are not always in conflict between the urban and rural
residents (Eisenhauer et al. 2000, Hunter & Brehm 2004, Jones et al. 2003, Walton & Bailey
2005, Yung et al. 2008).
Whittaker et al. (2006) surveyed Alaska residents to compare wildlife values held by
individuals who grew up in rural and urban areas. They found that respondents who grew up in
rural locations were more favorable toward hunting and held a stronger utilitarian attitude when
compared to respondents who grew up in urban locations. It was concluded that this may be due
to the fact that many rural Americans have a stronger connection to the land for the purpose of
harvesting wildlife for consumption and this is seen in their more traditional views toward
wildlife.
In a study by Hunter & Brehm (2004), long-term rural residents of Utah were interviewed
to gather information on their attitudes toward wildlife and biodiversity. They found that both
mutualist and utilitarian values were present in the majority of interviewees. For example, an
avid hunter stated, “I’ve grown up…hunting and fishing…so I believe that I do have
16
environmental values. I might not be the animal activist…but I believe we need the wildlife, we
need the environment” (Hunter & Brehm 2004 p. 21). In their conclusion, they explained that
rural residents may not have such distinct attitude differences toward wildlife when compared
with their urban counterparts. It is apparent that although there are differences in values and
attitudes between urban and long-term rural residents, there are also similarities.
Gender and Education Level Influences on Wildlife Attitudes and Use
There are some socio-demographic variables that have often been predictors of wildlife
values and use: gender and education level. These factors tend to influence an individual’s values
about wildlife and how they relate to wildlife use. When looking at gender differences, a
common theme emerges. Historically, men have possessed a stronger interest in outdoor
recreation and have comprised the majority of hunters and anglers. In general, studies have
shown that females have a greater tendency to hold sentiment toward wildlife and possess more
emotional attachment, protectionist attitudes, and less support for consumptive use of wildlife,
while men hold less emotional attachment and show greater support for consumptive and
dominating use of wildlife (Butler et al. 2001, Kellert 1996, Manfredo et al. 2003, Zinn et al.
2002). Therefore, females generally hold more mutualist values and attitudes and men hold more
utilitarian values and attitudes.
Kellert (1996) found education level to be the strongest predictor of wildlife attitudes and
values. Findings suggest that as education level increases, especially to the completion of college
or post graduate education, there is a stronger leaning toward mutualist attitudes and values and
lower utilitarian views (Kellert 1996, Manfredo et al. 2003, Zinn et al. 2002). It is evident that
these socio-demographic variables can greatly influence wildlife attitudes and values.
17
CHAPTER 3. METHODOLOGY
Survey Procedures
A 29-question survey was created to address the objectives of this study (Appendix B).
Survey questions were developed to identify attitudes and values held by Tennessee State Park
Rangers related to the use of wildlife, including their participation in the use of wildlife, in order
to identify their use patterns toward wildlife. The survey contained both qualitative and
quantitative questions, with the last several questions containing socio-demographic information
including location of where they grew up (rural or urban), county in which they currently lived,
length of years they had resided in this county, highest level of education received, age, and
gender.
The initial page of the survey gave information on the survey objectives and design. It
stated that participation in the survey was completely voluntary, that it should only require 10 to
15 minutes to complete, and that participants may withdraw at any time. Prior to sending the
survey electronically to the study population, it was approved by the University of Tennessee at
Martin, Institutional Review Board (IRB 13-221-E05-4005/Uric, Mel; Appendix A).
Study Population
An email list of all Tennessee State Park Rangers was used for the survey. The list was
provided and distributed through Tennessee State Parks, Head of Interpretive Services. A total of
209 email addresses were notified with the survey link.
Data Collection
The survey was created and administered, and data were collected through
SurveyMonkey®. On March 11, 2013 the survey was emailed to all participants explaining the

18
study and requesting their participation. A follow-up reminder was sent with the survey link to
increase response rates eight days later. By March 20, 2013 there were a total of 98 respondents.
The survey was closed and completed on March 25, 2013 with a total of 132 respondents. At the
close of the survey, SurveyMonkey® results were saved and downloaded as a Microsoft Excel
spreadsheet and as a portable document format for analysis.
Data Analysis
The main objective of this study was to examine the relationship between wildlife values
and attitudes and the following socio-demographic characteristics: gender, education level, and
rural vs. urban childhood home location. SAS 9.2 statistical software (SAS Institute, Cary, NC)
was used to analyze the survey results. The chi-squared test was used where applicable to
determine relationships among the data. When appropriate for expected cell counts of less than 5,
Fisher’s exact test was used to determine significant relationships. A significance level of 0.10
was used to establish whether or not the relationships were statistically significant.

19
CHAPTER 4. RESULTS
Socio-Demographics of Respondents
Out of 209 potential respondents, the overall response rate to this survey was 63% (n =
132). Of the 123 respondents to the question of gender, 82% (101) were male and 18% (22) were
female (Table 3). The majority of respondents were between 31-35 years of age (20%), followed
closely by ages 26-30 (18%), and 12% in the 51-55 age category (Table 3). The highest level of
education attained among respondents varied widely from high school/GED (5%) to a master’s
degree (14%) (Table 3). The majority of respondents (80%) had a bachelor’s degree. Only 20%
grew up in urban areas while the other 80% had grown up in a rural area (Table 3).
Survey Results Based on Research Objectives
Objective 1: To determine what attitudes and value orientations toward wildlife use are
present among Tennessee State Park Rangers.
Hunting for meat/consumption (85%), animal population control (74%), or
recreation/sport (49%), were considered always acceptable by the majority of the 131
respondents (Figure 1). Trophy hunting was considered always acceptable by 27% of
respondents and sometimes acceptable by 50% of respondents. Attitudes toward fishing were
similar to hunting; fishing for meat/consumption (88%), fish population control (72%), or
recreation/sport (67%) were considered always acceptable by the majority of respondents (Figure
2). Only 40% felt that trophy fishing was always acceptable (Figure 2). Compared to hunting or
fishing attitudes, all respondents (100%) felt that wildlife watching (birdwatching, other wildlife
watching, and wildlife photography) was always acceptable.

20
Table 3. Demographics of Tennessee State Park Ranger survey respondents. Characteristic Number Percentage Gender
Male 101 82.1
Female 22 17.9
Age 20-25 5 4.1
26-30 22 18.2
31-35 24 19.8
36-40 14 11.6
41-45 12 9.9
46-50 6 5.0
51-55 15 12.4
56-60 14 11.6
61-65 8 6.6
65+ 1 0.8
Highest Level of Education
High School/GED 6 4.9
Associate’s Degree 2 1.6
Bachelor’s Degree 98 79.7
Master’s Degree 17 13.8
Childhood Residence Rural 98 80.3
Urban 24 19.7

21
Figure 1. Respondents’ attitudes toward the acceptability of legal hunting types.
Figure 2. Respondents’ attitudes toward the acceptability of legal fishing types.
85
74
49
27
13
24
42
50
2 2
11
24
0
10
20
30
40
50
60
70
80
90
Meat/Consumption Animal PopulationControl
Recreation/Sport Trophy
Per
cen
t of
res
pon
den
ts
Acceptable Legal Hunting Type
Always
Sometimes
Never
88
7267
40
11
2630
43
1 2 3
17
0
10
20
30
40
50
60
70
80
90
100
Meat/Consumption Fish PopulationControl
Recreation/Sport Trophy
Percent of
resp
ond
ents
Acceptable Legal Fishing Type
Always
Sometimes
Never

22
When asked about methods for attracting wildlife, such as baiting wildlife or using
wildlife calls, respondents had varied opinions. Still, the majority of respondents approve of both
of these actions toward wildlife, with 74% approving of baiting and 89% approving of the use of
calls. When asked, “Baiting of wildlife (bird feeders, deer salt licks, turkey corn feeders, etc.) for
the purpose of wildlife watching is acceptable.”, some respondents showed concern over this
issue. One respondent replied, “For non huntable birds yes, for animals that have a hunting
season no.” Another commented, “Depends on the location, private versus public land.”, “I
think it’s okay for wildlife observation. But to a point I think it could harm the target population
because it starts a dependency that may not be kept up by the baiter.” When asked, “Using calls
for the purpose of attracting wildlife to watch is acceptable.”, some felt that it was only
acceptable under certain circumstances. One respondent replied, “Occasional use perhaps, but
not if it disrupts territories or courtship. Particularly a problem with some songbirds…”
Another stated, “Depends on the wildlife (i.e. do not pish birds during mating seasons, call owls
when they are roosting, etc).”
Two questions focused on attitudes toward the use of wildlife, either living or non-living
wildlife items, for interpretive programs. A large majority of respondents (99%) felt that the use
of live wildlife or non-living wildlife items (pelts, skulls, etc.) in interpretive programs is
acceptable. Seven respondents replied that the use of live wildlife in programming is only
acceptable if the animal is non-releasable.
The majority (96%) of respondents is supportive of the current rules and regulations
regarding hunting and fishing in Tennessee as set in place by the Tennessee Wildlife Resources
Agency. The preferred source for fish and wildlife information are printed field guides/books
(30% of respondents) followed by the Tennessee Wildlife Resources Agency website (27% of
23
respondents). Ninety-four percent of respondents would like to see increased funding and/or
effort for fish and wildlife education programs in the state. When given the opportunity to
determine which education programming is most important for Tennessee, 81% felt that
educating youth about fish, wildlife, and habitat conservation was most important, followed by
10% for educating/informing the public on the state’s fish and wildlife, and 9% for training
youth to hunt and fish.
Objective 2: To determine what wildlife use activities Tennessee State Park Rangers
participate in.
Out of 132 respondents, 120 (93%) had participated in some form of wildlife-related
recreation in the past 12 months, including hunting, fishing, or wildlife viewing. On average,
individuals participated in 20 trips over the past 12 month period with the primary purpose of
participating in wildlife-related recreation. The greatest percentage of respondents (30%) stay
close to home, within an average of 0-4 miles while participating in wildlife-related recreation.
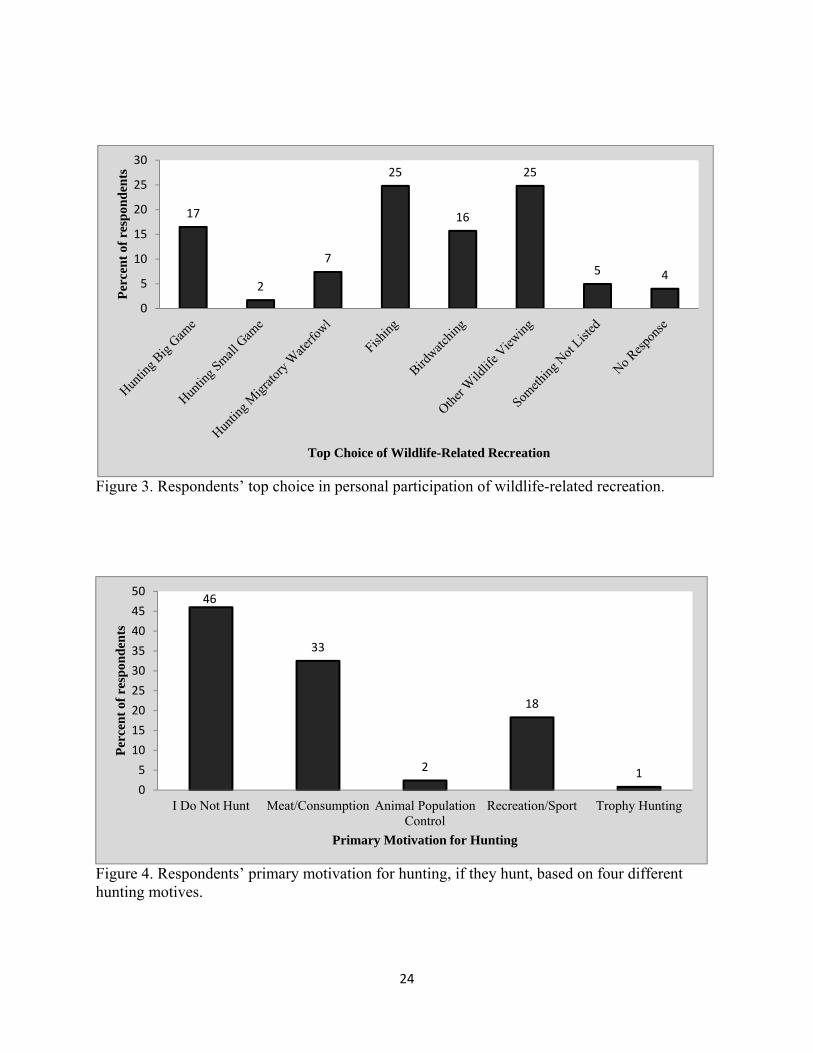
The top choice of wildlife-related recreation participation by percentage of respondents was
fishing and other wildlife viewing at 25% (Figure 3). Hunting small game ranked last as a top
choice at 2% (Figure 3).
Respondents were asked if they hunt and if so what their primary motivation was (meat,
animal population control, recreation/sport, or trophy hunting); the same question was asked
regarding fishing. Forty-six percent of respondents did not hunt but 33% of respondents hunt for
the primary purpose of obtaining meat (Figure 4). Only one respondent chose trophy hunting. A
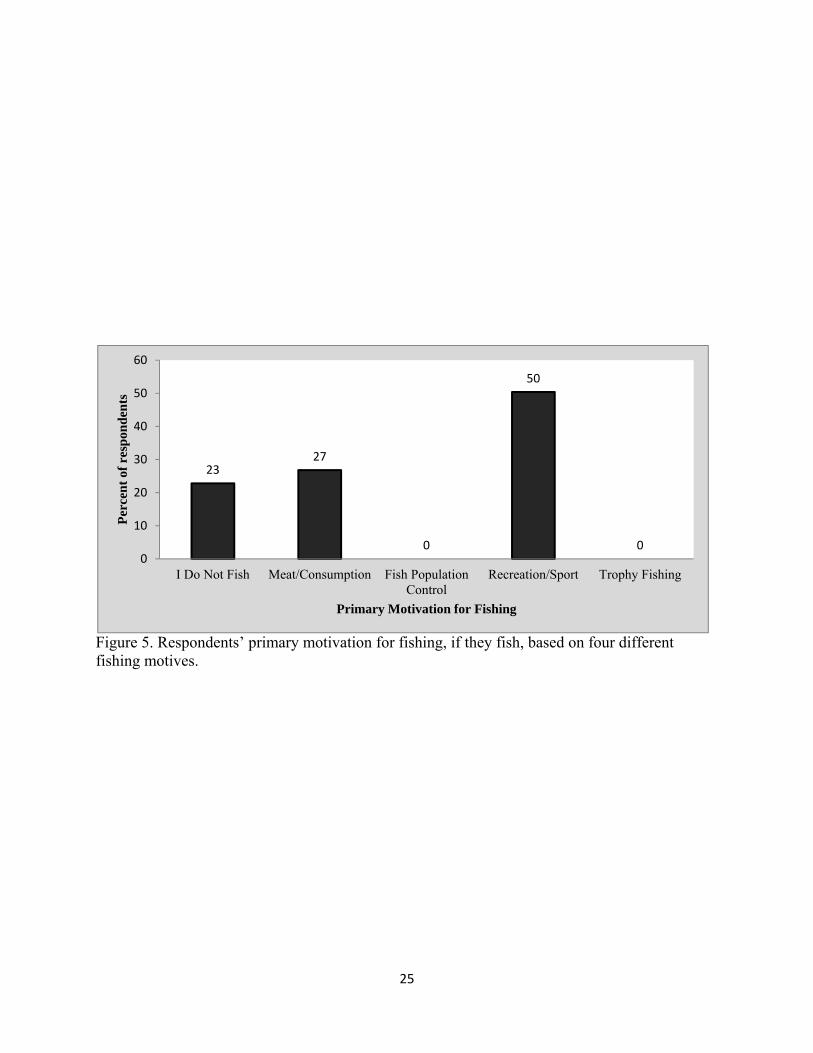
smaller percentage (23%) did not fish, and 50% of respondents selected recreation/sport as their
primary motivation to fish (Figure 5).
24
Figure 3. Respondents’ top choice in personal participation of wildlife-related recreation.
Figure 4. Respondents’ primary motivation for hunting, if they hunt, based on four different hunting motives.
17
2
7
25
16
25
5 4
0
5
10
15
20
25
30
Per
cen
t of
res
pon
den
ts
Top Choice of Wildlife-Related Recreation
46
33
2
18
10
5
10
15
20
25
30
35
40
45
50
I Do Not Hunt Meat/Consumption Animal PopulationControl
Recreation/Sport Trophy Hunting
Per
cen
t of
res
pon
den
ts
Primary Motivation for Hunting
25
Figure 5. Respondents’ primary motivation for fishing, if they fish, based on four different fishing motives.
2327
0
50
00
10
20
30
40
50
60
I Do Not Fish Meat/Consumption Fish PopulationControl
Recreation/Sport Trophy Fishing
Per
cen
t of
res
pon
den
ts
Primary Motivation for Fishing

26
Two questions asked respondents if they 1) bait wildlife (bird feeders, salt licks, corn
feeders, etc.) in order to watch wildlife and 2) use calls for the purpose of attracting wildlife to
watch. The results were close to a 50-50% yes or no for either question. Forty-eight percent
answered yes to baiting and 48% answered yes to using calls; this left 52% who did not use
these two wildlife attractants. Several respondents said that the baiting they used were bird
feeders. The primary reason given for using calls was as an aid in hunting.
Live wildlife were used by 75% of respondents in interpretive programs while 15% did
not use them; 7% conducted programs that do not involve wildlife, and 3% do not give
programs. Eighty-two percent of respondents use non-living wildlife items such as pelts, skulls,
etc. in interpretive programs, with 11% not using them; 5% did not give programs that involve
wildlife, and 2% do not give programs (Figure 6).
Objective 3. To determine if rural vs. urban childhood residence among Tennessee State Park Rangers is related to attitudes toward wildlife and wildlife use participation.
Respondents were asked if they grew up in an urban or rural location. A total of 98
respondents grew up in a rural location and 24 respondents grew up in an urban location. When
questioned on their attitudes toward the acceptability of legal hunting or fishing, differences
emerged based on the characteristic of rural vs. urban childhood residence. Those respondents
who described growing up in a rural location had slightly higher percentages than their urban
counterparts related to the attitude that legal hunting and/or fishing for meat is always acceptable
(Figures 7, 8), but the relationship between childhood residence and their attitude was not
significant (P = 0.3202 for hunting and P = 0.4827 for fishing; Table 4). The opposite was true
for those who held the attitude that legal hunting and/or fishing for sport or trophy is never
acceptable. Slightly higher respondent percentages for this attitude were seen for those who grew
27
Figure 6. Respondents’ use or non-use of live or non-living wildlife items in interpretive programs.
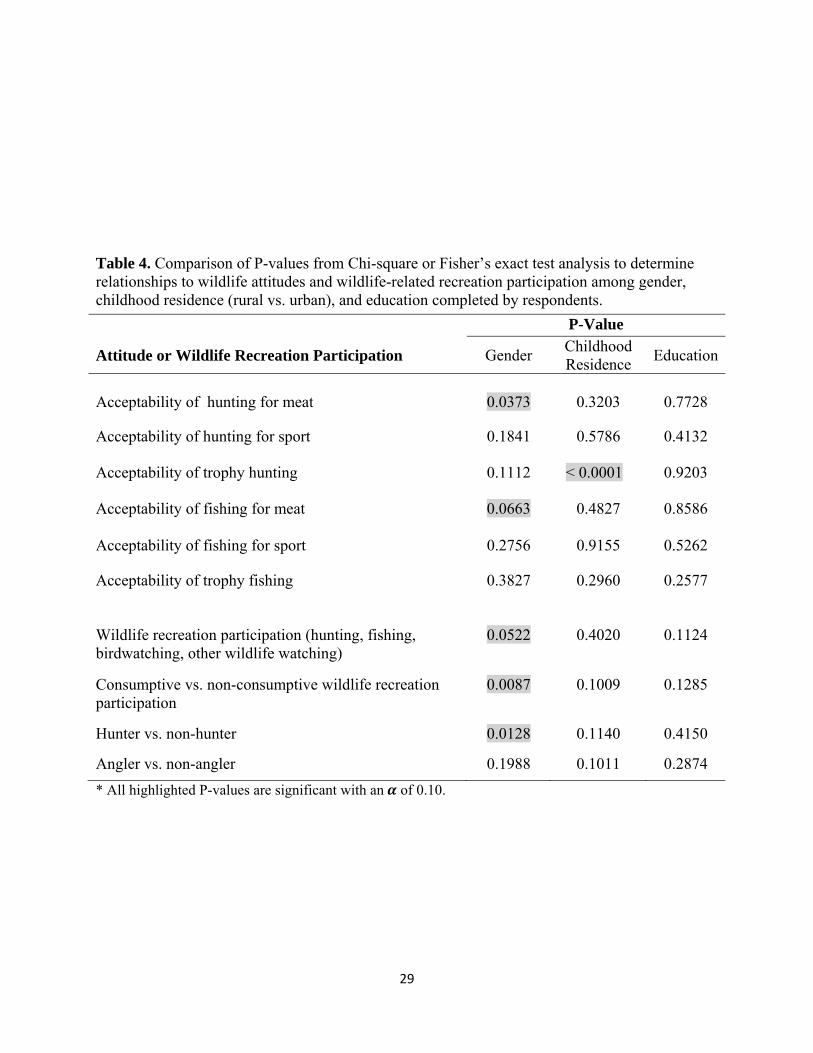
Figure 7. Percent of respondents of either rural or urban childhood residence and their attitudes toward the acceptability of hunting for meat. The relationship between childhood residence and response to this question was not significant (Chi-square P = 0.3203).
75
157
3
82
115 2
0
10
20
30
40
50
60
70
80
90
Use in programs Do not use inprograms
Do not give wildlifeprograms
Do not give programs
Per
cen
t of
res
pon
den
ts
Interpretive Program Use
Live Wildlife
Non-Living Wildlife Items
88
93
82
18
00
10
20
30
40
50
60
70
80
90
100
Always Sometimes Never
Per
cen
t of
res
pon
den
ts w
ith
in e
ach
lo
cati
on
Acceptability of Meat/Consumption Hunting
Rural
Urban

28
Figure 8. Percent of respondents of either rural or urban childhood residence and their attitudes toward the acceptability of fishing for meat. The relationship between childhood residence and response to this question was not significant (Chi-square P = 0.4827).
92
71
85
15
00
10
20
30
40
50
60
70
80
90
100
Always Sometimes Never
Per
cen
t of
res
pon
den
ts w
ith
in e
ach
lo
cati
on
Acceptability of Meat/Consumption Fishing
Rural
Urban
29
Table 4. Comparison of P-values from Chi-square or Fisher’s exact test analysis to determine relationships to wildlife attitudes and wildlife-related recreation participation among gender, childhood residence (rural vs. urban), and education completed by respondents.
* All highlighted P-values are significant with an of 0.10.
P-Value
Attitude or Wildlife Recreation Participation Gender Childhood Residence
Education
Acceptability of hunting for meat 0.0373 0.3203 0.7728
Acceptability of hunting for sport 0.1841 0.5786 0.4132
Acceptability of trophy hunting 0.1112 < 0.0001 0.9203
Acceptability of fishing for meat
0.0663 0.4827 0.8586
Acceptability of fishing for sport 0.2756 0.9155 0.5262
Acceptability of trophy fishing 0.3827 0.2960 0.2577
Wildlife recreation participation (hunting, fishing, birdwatching, other wildlife watching)
0.0522 0.4020 0.1124
Consumptive vs. non-consumptive wildlife recreation participation
0.0087 0.1009 0.1285
Hunter vs. non-hunter 0.0128 0.1140 0.4150
Angler vs. non-angler 0.1988 0.1011 0.2874

30
up in an urban location than those that grew up in a rural location (Figures 9, 10, 11, 12). Again,
the relationship between childhood residence and their response to these questions was not
significant (Table 4). However, Chi-square analysis did show a significant relationship between
childhood residence and the acceptability of trophy hunting (P < 0.0001; Table 4). This
relationship was significant because more respondents who grew up in a rural area indicated that
trophy hunting was always acceptable and more respondents who grew up in an urban area
indicated that trophy hunting was never acceptable (Figure 10).
When examining the relationship between childhood residence and wildlife use
participation there was no significant relationship according to Chi-square analysis (Table 4).
Individuals who grew up in rural locations did have a higher percentage (60%) of consumptive
(hunting or fishing) wildlife use behavior than those who grew up in an urban location (39%)
(Figure 13). Likewise, those who grew up in an urban location had a higher percentage (61%) of
non-consumptive (birdwatching or wildlife watching) wildlife-use behavior than rural childhood
residence respondents (40%) (Figure 14). Respondents who grew up in an urban location were
more likely to not hunt (80%) or fish (73%) than those who grew up in a rural location (Figures
15, 16).
Objective 4. To determine if gender and education level among Tennessee State Park Rangers is related to attitudes toward wildlife and wildlife use participation.
Of all survey respondents, 22 were female and 101 were male. When asked about their
attitudes toward legal hunting and fishing, a higher percentage of males compared to females
indicated that hunting or fishing for meat or sport is always acceptable (Figures 17, 18, 19, 20).
On the contrary, slightly higher percentages of females indicated that hunting and fishing for
sport or trophy is never acceptable (Figures 18, 21, 20, 22). Fisher’s exact test analysis did not

31
Figure 9. Percent of respondents of either rural or urban childhood residence and their attitudes toward the acceptability of hunting for sport. The relationship between childhood residence and response to this question was not significant (Chi-square P = 0.5786).
Figure 10. Percent of respondents of either rural or urban childhood residence and their attitudes toward the acceptability of trophy hunting. The relationship between childhood residence and the response to this question was significant (Chi-square P < 0.0001).
51
38
11
39
48
13
0
10
20
30
40
50
60
Always Sometimes Never
Per
cen
t of
res
pon
den
ts w
ith
in e
ach
loca
tion
Acceptability of Sport Hunting
Rural
Urban
35
63
2
10
57
33
0
10
20
30
40
50
60
70
Always Sometimes Never
Per
cen
t of
res
pon
den
ts w
ith
in e
ach
lo
cati
on
Acceptability of Trophy Hunting
Rural
Urban
32
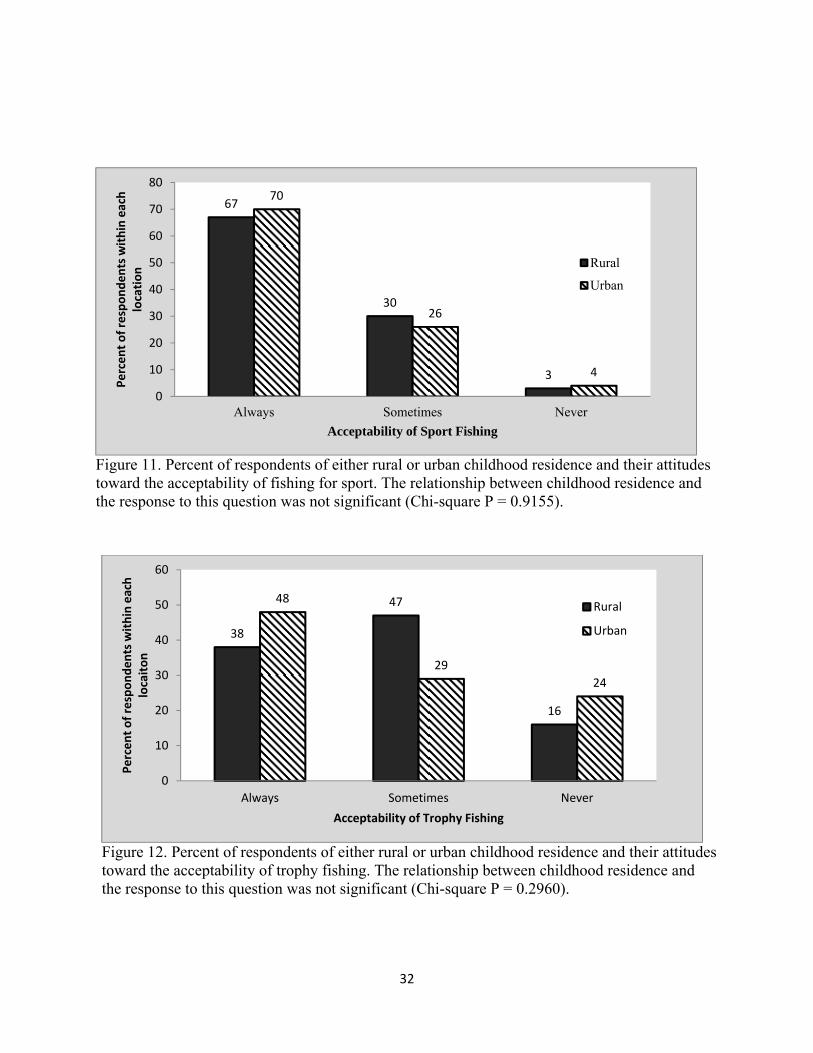
Figure 11. Percent of respondents of either rural or urban childhood residence and their attitudes toward the acceptability of fishing for sport. The relationship between childhood residence and the response to this question was not significant (Chi-square P = 0.9155).
Figure 12. Percent of respondents of either rural or urban childhood residence and their attitudes toward the acceptability of trophy fishing. The relationship between childhood residence and the response to this question was not significant (Chi-square P = 0.2960).
67
30
3
70
26
4
0
10
20
30
40
50
60
70
80
Always Sometimes Never
Percent of respondents within each
location
Acceptability of Sport Fishing
Rural
Urban
38
47
16
48
29
24
0
10
20
30
40
50
60
Always Sometimes Never
Percent of respondents within each
locaiton
Acceptability of Trophy Fishing
Rural
Urban

33
Figure 13. Percent of respondents of either rural or urban childhood residence and their primary wildlife-related recreation use, consumptive or non-consumptive. The relationship between childhood residence and the response to this question was not significant (Chi-square P = 0.1009).
Figure 14. Percent of respondents of either rural or urban childhood residence and their primary choice of participation in wildlife-related recreation. The relationship between childhood residence and the response to this question was not significant (Chi-square P = 0.4020).
60
4039
61
0
10
20
30
40
50
60
70
Consumptive Non‐Consumptive
Per
cen
t of
res
pon
den
ts w
ith
in e
ach
lo
cati
on
Primary Wildlife-Related Recreation Use
Rural
Urban
3129
15
2522
17
28
33
0
5
10
15
20
25
30
35
Hunting Fishing Birdwatching Other WildlifeViewing
Per
cen
t of
res
pon
den
ts w
ith
in e
ach
lo
cati
on
Primary Wildlife-Related Recreation Participation
Rural
Urban
34
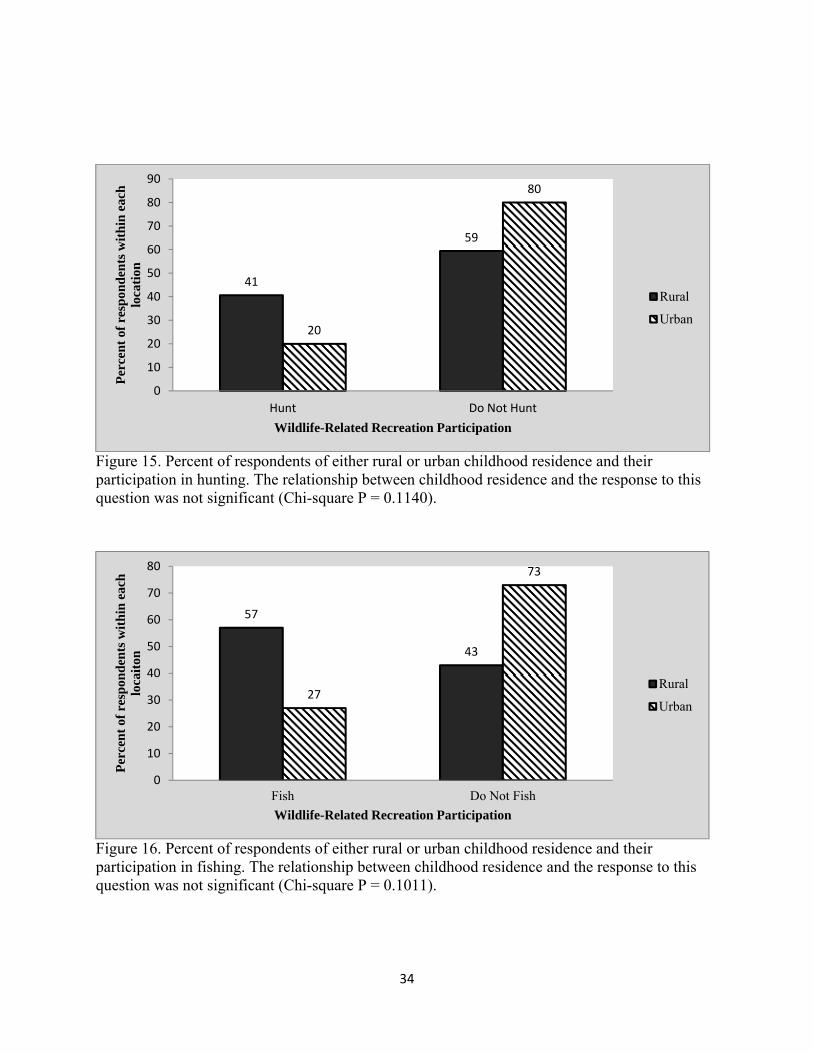
Figure 15. Percent of respondents of either rural or urban childhood residence and their participation in hunting. The relationship between childhood residence and the response to this question was not significant (Chi-square P = 0.1140).
Figure 16. Percent of respondents of either rural or urban childhood residence and their participation in fishing. The relationship between childhood residence and the response to this question was not significant (Chi-square P = 0.1011).
41
59
20
80
0
10
20
30
40
50
60
70
80
90
Hunt Do Not Hunt
Per
cen
t of
res
pon
den
ts w
ith
in e
ach
lo
cati
on
Wildlife-Related Recreation Participation
Rural
Urban
57
43
27
73
0
10
20
30
40
50
60
70
80
Fish Do Not Fish
Per
cen
t of
res
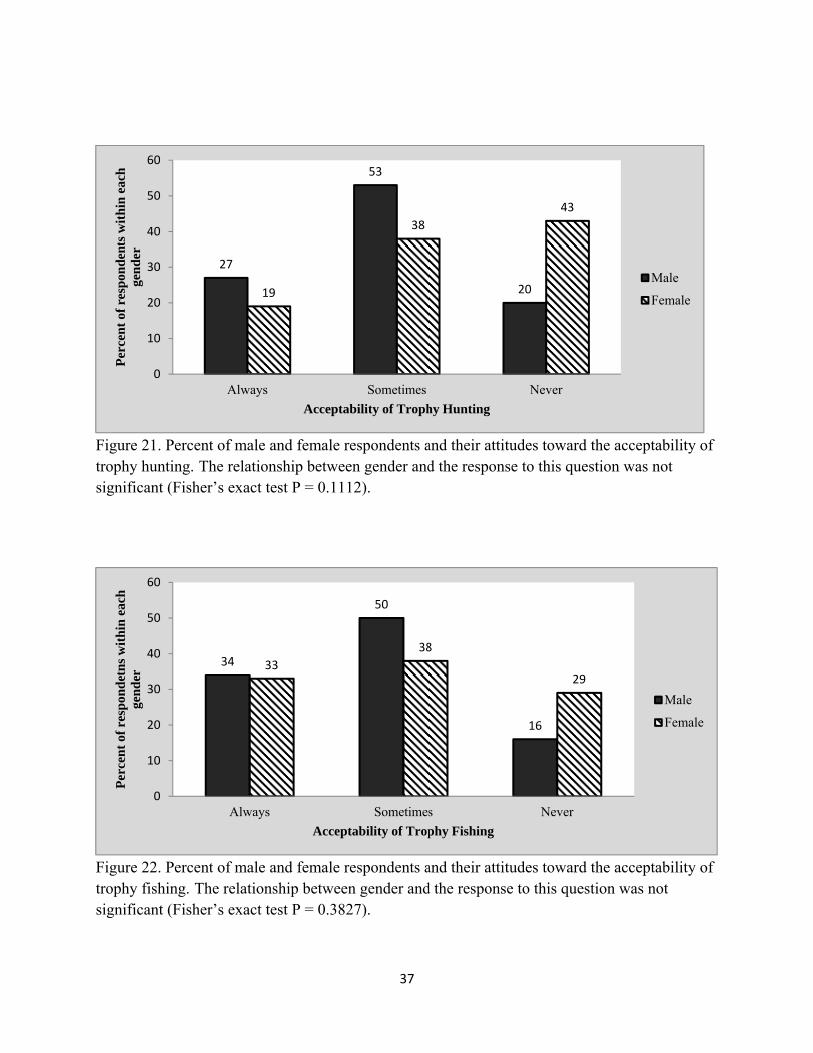
pon
den
ts w
ith
in e
ach
lo
cait
on
Wildlife-Related Recreation Participation
Rural
Urban

35
Figure 17. Percent of male and female respondents and their attitudes toward the acceptability of hunting for meat. The relationship between gender and the response to this question was significant (Fisher’s exact test P = 0.0373).
Figure 18. Percent of male and female respondents and their attitudes toward the acceptability of hunting for sport. The relationship between gender and the response to this question was not significant (Fisher’s exact test P = 0.1841).
89
83
71
29
00
10
20
30
40
50
60
70
80
90
100
Always Sometimes Never
Percent of respondents within each
gender
Acceptability of Meat/Consumption Hunting
Male
Female
52
38
10
32
50
18
0
10
20
30
40
50
60
Always Sometimes Never
Percent of espondents within each
gender
Acceptability of Sport Hunting
Male
Female

36
Figure 19. Percent of male and female respondents and their attitudes toward the acceptability of fishing for meat. The relationship between gender and the response to this question was significant (Fisher’s exact test P = 0.0663).
Figure 20. Percent of male and female respondents and their attitudes toward the acceptability of fishing for sport. The relationship between gender and the response to this question was not significant (Fisher’s exact test P = 0.2756).
92
71
76
24
00
10
20
30
40
50
60
70
80
90
100
Always Sometimes Never
Per
cen
t of
res
pon
den
ts w
ith
in e
ach
ge
nd
er
Acceptability of Meat/Consumption Fishing
Male
Female
72
25
3
56
38
6
0
10
20
30
40
50
60
70
80
Always Sometimes Never
Per
cen
t of
res
pon
den
ts w
ith
in e
ach
ge
nd
er
Acceptability of Sport Fishing
Male
Female
37
Figure 21. Percent of male and female respondents and their attitudes toward the acceptability of trophy hunting. The relationship between gender and the response to this question was not significant (Fisher’s exact test P = 0.1112).
Figure 22. Percent of male and female respondents and their attitudes toward the acceptability of trophy fishing. The relationship between gender and the response to this question was not significant (Fisher’s exact test P = 0.3827).
27
53
2019
38
43
0
10
20
30
40
50
60
Always Sometimes Never
Per
cen
t of
res
pon
den
ts w
ith
in e
ach
ge
nd
er
Acceptability of Trophy Hunting
Male
Female
34
50
16
33
38
29
0
10
20
30
40
50
60
Always Sometimes Never
Per
cen
t of
res
pon
det
ns
wit
hin
eac
h
gen
der
Acceptability of Trophy Fishing
Male
Female

38
show a significant relationship between gender and the acceptability of hunting or fishing, with
the exception of the acceptability of hunting or fishing for meat (P = 0.0373 for hunting and P =
0.0663 for fishing; Table 4). For those questions a higher percentage of women than men
indicated that hunting or fishing for meat is sometimes acceptable (Figures 17, 19).
A higher percentage of females than males participated in birdwatching and other wildlife
viewing, while a higher percentage of males participated in hunting and fishing (Figure 23).
Fisher’s exact test analysis showed a significant relationship (P = 0.0522) between gender and
type of wildlife recreation participation (Table 4.). A significant relationship (P = 0.0087)
between gender and consumptive (hunting and fishing) vs. non-consumptive (birdwatching and
wildlife viewing) use of wildlife was apparent using Fisher’s exact test (Table 4). Males had a
higher percentage than females in consumptive recreation use and females had a much higher
percentage than males in non-consumptive use (Figure 24). Females were more likely to not hunt
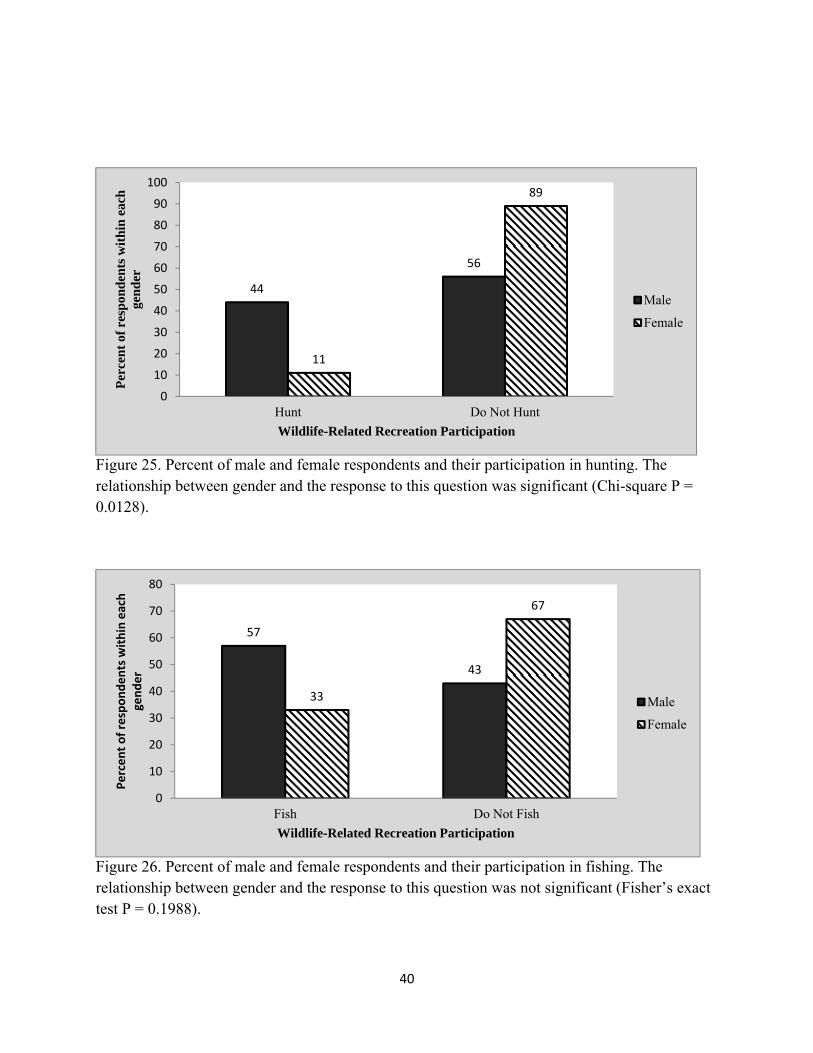
(89%) and fish (67%) than males (Figures 25, 26). Chi-square analysis showed a significant
relationship (P = 0.0128) between gender and whether a respondent was a hunter or a non-hunter
(Table 4).
When asked the highest level of education achieved, 98 respondents selected bachelor’s
degree, 17 respondents selected master’s degree, 2 respondents selected associate’s degree, and 6
respondents selected high school/GED. The large percentage with bachelor’s degrees would be
expected because the degree was likely required for their job positions. When asked about their
attitudes toward legal hunting and fishing, 100% of those with the least amount of education
(associate’s degree and high school/GED) indicated that hunting and fishing for meat is always
acceptable (Figures 27, 28). Respondents of all education levels were more acceptable of sport
fishing than of sport hunting (Figures 29, 30). Forty-three percent of respondents with a

39
Figure 23. Percent of male and female respondents and their primary choice of personal participation in wildlife-related recreation. The relationship between gender and the response to this question was significant (Fisher’s exact test P = 0.0522).
Figure 24. Percent male and female respondents and their primary wildlife-related recreation use, consumptive or non-consumptive. The relationship between gender and the response to this question was significant (Fisher’s exact test P = 0.0087).
33
29
14
24
10
20
30
40
0
5
10
15
20
25
30
35
40
45
Hunting Fishing Birdwatching Other WildlifeViewing
Percent of respondents within each
gender
Primary Wildlife-Related Recreation Participation
Male
Female
62
38
30
70
0
10
20
30
40
50
60
70
80
Consumptive Non-Consumptive
Per
cen
t of
res
pon
den
ts w
ith
in e
ach
ge
nd
er
Primary Wildlife-Related Recreation Use
Male
Female
40
Figure 25. Percent of male and female respondents and their participation in hunting. The relationship between gender and the response to this question was significant (Chi-square P = 0.0128).
Figure 26. Percent of male and female respondents and their participation in fishing. The relationship between gender and the response to this question was not significant (Fisher’s exact test P = 0.1988).
44
56
11
89
0
10
20
30
40
50
60
70
80
90
100
Hunt Do Not Hunt
Per
cen
t of
res
pon
den
ts w
ith
in e
ach
ge
nd
er
Wildlife-Related Recreation Participation
Male
Female
57
43
33
67
0
10
20
30
40
50
60
70
80
Fish Do Not Fish
Percent of respondents within each
gender
Wildlife-Related Recreation Participation
Male
Female
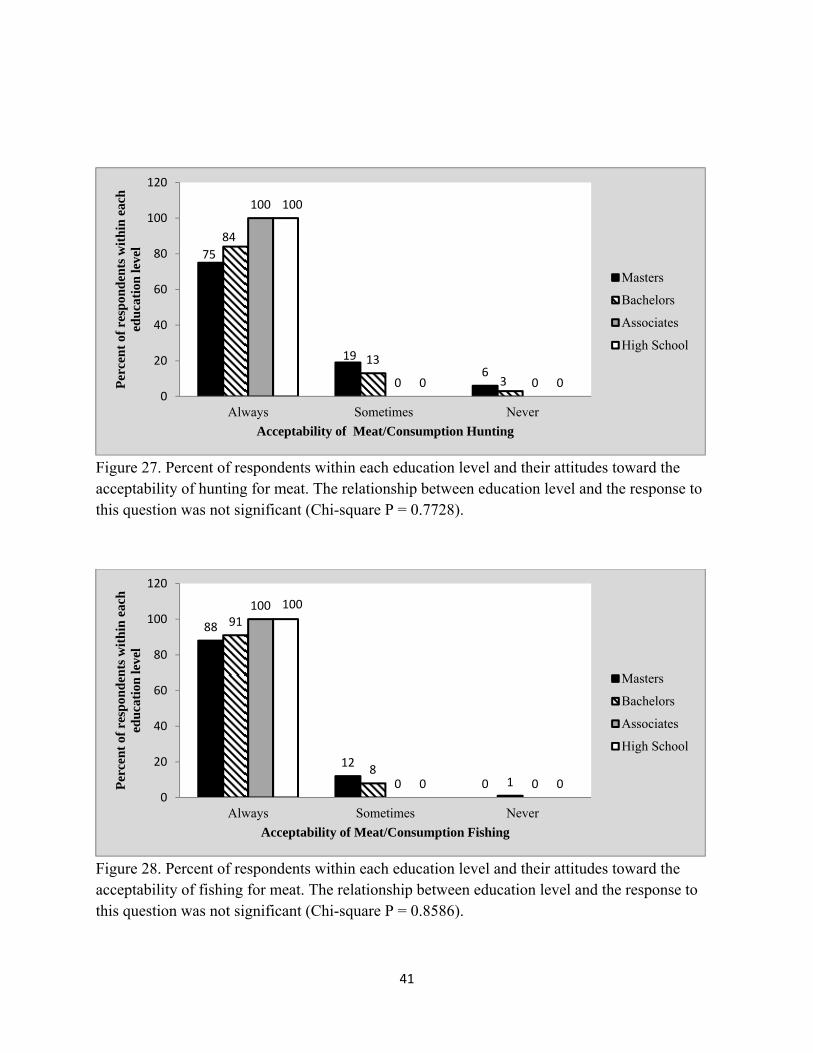
41
Figure 27. Percent of respondents within each education level and their attitudes toward the acceptability of hunting for meat. The relationship between education level and the response to this question was not significant (Chi-square P = 0.7728).
Figure 28. Percent of respondents within each education level and their attitudes toward the acceptability of fishing for meat. The relationship between education level and the response to this question was not significant (Chi-square P = 0.8586).
75
196
84
13
3
100
0 0
100
0 00
20
40
60
80
100
120
Always Sometimes Never
Per
cen
t of
res
pon
den
ts w
ith
in e
ach
ed
uca
tion
leve
l
Acceptability of Meat/Consumption Hunting
Masters
Bachelors
Associates
High School
88
12
0
91
81
100
0 0
100
0 00
20
40
60
80
100
120
Always Sometimes Never
Per
cen
t of
res
pon
den
ts w
ith
in e
ach
ed
uca
tion
leve
l
Acceptability of Meat/Consumption Fishing
Masters
Bachelors
Associates
High School
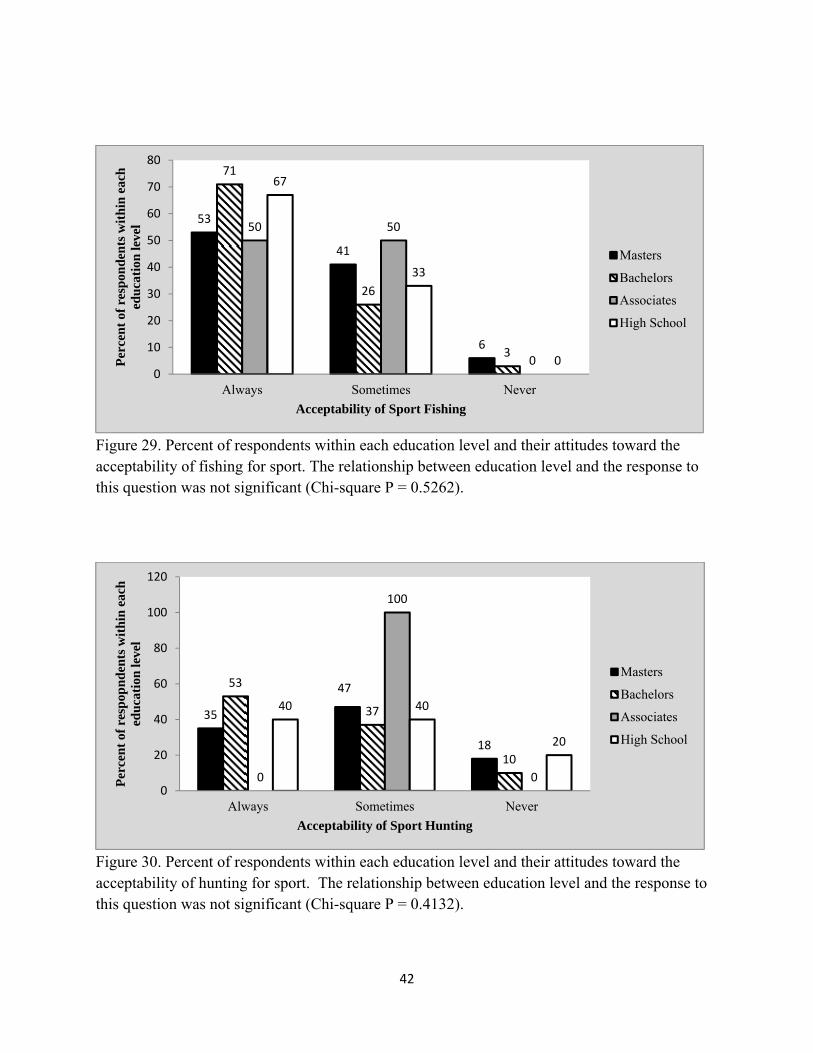
42
Figure 29. Percent of respondents within each education level and their attitudes toward the acceptability of fishing for sport. The relationship between education level and the response to this question was not significant (Chi-square P = 0.5262).
Figure 30. Percent of respondents within each education level and their attitudes toward the acceptability of hunting for sport. The relationship between education level and the response to this question was not significant (Chi-square P = 0.4132).
53
41
6
71
26
3
50 50
0
67
33
00
10
20
30
40
50
60
70
80
Always Sometimes Never
Per
cen
t of
res
pon
den
ts w
ith
in e
ach
ed
uca
tion
leve
l
Acceptability of Sport Fishing
Masters
Bachelors
Associates
High School
35
47
18
53
37
10
0
100
0
40 40
20
0
20
40
60
80
100
120
Always Sometimes Never
Per
cen
t of
res
pop
nd
ents
wit
hin
eac
h
edu
cati
on le
vel
Acceptability of Sport Hunting
Masters
Bachelors
Associates
High School
43
bachelor’s degree were always acceptable of trophy fishing and only 28% were always
acceptable of trophy hunting (Figures 31, 32). Those respondents with a high school education
had the greatest percentage for hunting at 50%, when looking at the results per education level
(Figure 33). Respondents with a bachelor’s degree had higher percentages for both hunting
(30%) and fishing (31%). This is likely because the majority of respondents held a bachelor’s
degree. Those with a master’s degree, associate’s degree, and high school education all had
higher percentages than those with a bachelor’s degree regarding non-consumptive wildlife-
related use, when looking at the results per education level (Figure 34). Both respondents with an
associate’s degree do not hunt or fish (Figures 35, 36). Chi-square analysis and Fisher’s exact
test did not show a significant relationship between education and the acceptability of hunting or
fishing and wildlife use participation (Table 4).

44
Figure 31. Percent of respondents within each education level and their attitudes toward the acceptability of trophy fishing. The relationship between education level and the response to this question was not significant (Chi-square P = 0.2577).
Figure 32. Percent of respondents within each education level and their attitudes toward the acceptability of trophy hunting. The relationship between education level and the response to this question was not significant (Chi-square P = 0.9203).
31
56
13
4339
18
0
50 50
17
83
00
10
20
30
40
50
60
70
80
90
Always Sometimes Never
Per
cen
t of
res
pon
den
ts w
ith
in e
ach
ed
uca
tion
leve
l
Acceptability of Trophy Fishing
Masters
Bachelors
Associates
High School
19
56
2528
49
23
0
50 50
17
50
33
0
10
20
30
40
50
60
Always Sometimes Never
Per
cen
t of
res
pon
den
ts w
ith
in e
ach
ed
uca
tion
leve
l
Acceptability of Trophy Hunting
Masters
Bachelors
Associates
High School

45
Figure 33. Percent of respondents within each education level and their primary choice of personal participation in wildlife-related recreation. The relationship between education level and the response to this question was not significant (Chi-square P = 0.1124).
Figure 34. Percent of respondents within each education level and their primary wildlife-related recreation use, consumptive or non-consumptive. The relationship between education level and the response to this question was not significant (Chi-square P = 0.1285).
15
23
31 3130 31
12
27
0 0
50 5050
0
50
00
10
20
30
40
50
60
Hunting Fishing Birdwatching Other WildlifeViewing
Per
cen
t of
res
pon
den
ts w
ith
in e
ach
ed
uca
tion
leve
l
Primary Wildlife-Related Recreation Participation
Masters
Bachelors
Associates
High School
38
6261
39
0
100
40
60
0
20
40
60
80
100
120
Consumptive Non-Consumptive
Per
cen
tage
of
Res
pon
den
ts
Primary Wildlife-Related Recreation Use
Masters
Bachelors
Associates
High School

46
Figure 35. Percent of respondents within each education level and their participation in hunting. The relationship between education level and the response to this question was not significant (Chi-square P = 0.4150).
Figure 36. Percent of respondents within each education level and their participation in fishing. The relationship between education level and the response to this question was not significant (Chi-square P = 0.2874).
17
83
39
61
0
100
40
60
0
20
40
60
80
100
120
Hunt Do Not Hunt
Per
cen
tage
of
Res
pon
det
ns
Wildlife-Related Recreation Participation
Masters
Bachelors
Associates
High School
43
5757
43
0
100
0
100
0
20
40
60
80
100
120
Fish Do Not Fish
Per
cen
t of
res
pon
den
ts w
ith
in e
ach
ed
uca
tion
leve
l
Wildlife-Related Recreation Participation
Masters
Bachelors
Associates
High School

47
CHAPTER 5. DISCUSSION
Collectively, the majority of survey respondents hold very positive attitudes toward the
acceptability of legal hunting and fishing, wildlife watching, the baiting and calling of wildlife,
and the use of live and non-living wildlife items in interpretive programs. They are also very
supportive of the current rules and regulations in place regarding wildlife in the state of
Tennessee. These findings are similar to the views found in the Responsive Management (2005)
survey of Tennessee values toward wildlife.
The majority of respondents would like to see increased funding for fish and wildlife
education and feel that educating youth on this topic is essential. As a group, Tennessee State
Park Rangers tend to hold both consumptive and non-consumptive wildlife use behavior as
acceptable and would likely be considered pluralists. Tennessee State Park Rangers are active
participants in wildlife-related recreation, both in consumptive and non-consumptive activities.
Many individuals participate in a variety of wildlife-related recreation pursuits, such as hunting
big game, birdwatching, and photographing wildlife.
Numerous studies have found significant relationships between rural vs. urban childhood
residence, gender, education, and corresponding wildlife attitudes, values, and recreation
participation (Eisenhauer et al. 2000, Hunter & Brehm 2004, Jones et al. 2003, Manfredo et al.
2003, Muth et al. 1998, Teel et al. 2005, Whittaker et al. 2006, Zinn et al. 2002). While
differences were present among the percentage of respondents in each of these demographic
characteristics (rural vs. urban, gender, education) regarding wildlife attitudes and wildlife-
related recreation participation, there were two demographic characteristics in this study that
showed significant relationships. Respondents’ gender was often predictive of wildlife attitudes
and wildlife-related recreation participation (P ≤ 0.10). Also, attitudes toward the acceptability of
48
trophy hunting were significantly (P < 0.0001) related to rural vs. urban childhood residence
(Table 4).
In general, a higher percentage of respondents who grew up in rural locations had
stronger consumptive wildlife use attitudes and were more likely to participate in consumptive
wildlife use than their urban counterparts, on a percentage basis. Respondents from rural
locations had higher hunting (41%) and fishing (57%) participation than those from urban
locations (hunting 20%, fishing 27%). These findings are similar to the findings in the NSRE
2005-2008 survey, where rural participation in hunting and fishing (43%) was higher than urban
participation (32%) in these consumptive use activities. The FHWAR 2011 survey also found
that the participation rate in hunting and fishing went up with rural residence compared to those
of urban residence. When comparing education levels among survey respondents, there was little
distinction among attitudes and use percentages, which could largely be due to the high number
(98) of individuals who had attained a bachelor’s degree and the less than 10 individuals with
lower levels of education.
Looking at gender among respondents, significant differences emerged. The strongest
predictor of wildlife attitudes, values, and wildlife-related recreation use was between males and
females. Females were significantly (P = 0.0087) more likely to participate in wildlife-related
recreation that was non-consumptive in nature. They were therefore more interested in
birdwatching or viewing other wildlife than in hunting or fishing when compared to males.
Males tended to be more supportive of consumptive use of wildlife than females. Similarly, both
national surveys (NSRE 2005-2008, FHWAR 2011) found higher percentages of males than
females who hunt and fish and higher percentages of females than males who participate in
birdwatching or other wildlife viewing. When separating respondents by gender, it is clear that
49
females in this study tend to hold mutualist wildlife value orientations and are less likely than
males to participate in consumptive wildlife recreation. Males, however, hold stronger utilitarian
wildlife value orientations and are more likely to participate in and are more supportive of
consumptive wildlife recreation. These findings of gender differences were also found in two
previous studies, described by Muth et al. 1998, looking at wildlife professionals. In one study,
females generally entered the field because of the influence of hiking and wildlife watching,
whereas, males entered the field due to the influence of hunting and fishing. The other study
found that males are generally more supportive of consumptive use than females.

50
CHAPTER 6. CONCLUSION
This study has shed light on the wildlife values, attitudes, and wildlife-related recreation
participation among Tennessee State Park Rangers. With an overall survey response rate of 63%,
these findings are an indication of this population. The majority of Tennessee State Park Rangers
are responsible for giving educational, interpretive programs often geared toward wildlife. They
have a responsibility to relate wildlife facts and perceptions for the general public to gain an
understanding of wildlife and its role in society.
It is important to recognize that this study is a brief overview of the current attitudes and
wildlife-related recreation participation present among Tennessee State Park Rangers. Attitudes
and values will change in the coming years. Gaining an understanding of what attitudes and
participation is present among Tennessee State Park Rangers is an important tool for designing
appropriate training materials and in the development of interpretive programs. This survey
population has a responsibility to educate the public on wildlife, and their views and
participation cannot be taken for granted. This study has shown that more research is needed to
determine to what extent wildlife attitudes, values, and recreation participation are predictive of
Tennessee State Park Ranger programming and the information exchange between rangers and
the general public on wildlife.
51
LITERATURE CITED
Ajzen, I. & M. Fishbein. 1977. Attitude-behavior relations: a theoretical analysis and review of empirical research. Psychological Bulletin. 84(5):888-918. Butler, J. S., J. E. Shanahan, & D. J. Decker. 2001. Wildlife attitudes and values: A trend analysis. Human Dimensions Research Unit Publication 01-4, Human Dimensions Research Unit, Department of Natural Resources, N. Y. S. College of Agriculture and Life Sciences, Cornell University, Ithaca, NY, USA. Clendenning, C., D. R. Field, & K. J. Knapp. 2005. A comparison of seasonal homeowners and permanent residents on their attitudes toward wildlife management on public lands. Human Dimensions of Wildlife. 10:3- 17. Cordell, K. 2008. The latest on trends in nature- based outdoor recreation. Forest History Today. Spring 4-10.
Cordell, K. 2012. Outdoor recreation trends and futures: A technical document supporting the Forest Service 2010 RPA Assessment. Gen. Tech. Rep. SRS-150. Ashville, NC: U.S. Department of Agriculture Forest Service, Southern Research Station, 167 p.
Cordell, K., C. Betz, & G. Green. 2008. Nature-based outdoor recreation trends and wilderness. International Journal of Wilderness. 14(2): 7-13.
Eisenhauer, B.W., R. S. Krannich, & D.J. Blahna. 2000. Attachments to special places on public lands: An analysis of activities, reason for attachments, and community connections. Society and Natural Resources. 13:421-441. Fulton, D., M. Manfredo, & J. Lipscomb. 1996. Wildlife value orientations: A conceptual and
measurement approach. Human Dimensions of Wildlife. 1(2): 24-47.
Homer, P.M. & L.R. Kahle. 1988. A structural equation test of the value-attitude-behavior hierarchy. Journal of Personality and Social Psychology. 54(4):638-646. Hunter, L.M. & J.M. Brehm. 2004. A qualitative examination of value orientations toward wildlife and biodiversity by rural residents of the intermountain region. Human Ecology Review. 11:13-26. Interagency National Survey Consortium. 2002. 2000-2002 National survey on recreation and the environment. U.S. Forest Service, Recreation, Wilderness, and Demographic Trends Research Group, Athens, Georgia, USA and Human Dimensions Research Lab, University of Tennessee, Knoxville, Tennessee USA.
Jones, E. R., J. Fly, J. Mark, J. Talley, & K. Cordell. 2003. Green migration into rural America: the new frontier of environmentalism? Society and Natural Resources. 16:221-238.
52
Kellert, S. R. 1996. The value of life: Biological diversity and human society. Island Press, Washington, D. C. USA. Kollmuss, A. & J. Agyeman. 2002. Mind the gap: Why do people act environmentally and what are the barriers to pro-environmental behavior? Environmental Education Research. 8(3):239-259. Manfredo, M. J., T. L. Teel, & A. D. Bright. 2003. Why are public values toward wildlife
changing? Human Dimensions of Wildlife. 8:287-306.
Muth, R.M., D.A. Hamilton, J.F. Orgon, D.J. Witter, M.E. Mather, J.J. Daigle. 1998. The future of wildlife and fisheries policy and management: Assessing the attitudes and values of wildlife and fisheries professionals. Trans-American 63rd North American Wildlife and Natural Resources Conference. 604-627.
Petty, R. E., D. T. Wegener, & L.R. Fabrigar. 1997. Attitudes and attitude change. Annual Review Psychology. 48:609-647.
Responsive Management. 2005. Public opinion on fish and wildlife management issues and the reputation and credibility of fish and wildlife agencies in the Southeast United States: Tennessee. For: Southeastern Association of Fish and Wildlife Agencies. Harrisonburg, VA, USA.
Siemer, W. F., T. L. Brown, P. P. Martin, & R. D. Stumvoll. 1991. Tapping the potential of the wildlife rehabilitation community for public education about wildlife damage management. Fifth Eastern Wildlife Damage Control Conference. Paper 34.
Teel, T. L., A. A. Dayer, M. J. Manfredo, & A. D. Bright. 2005. Regional results of wildlife values in the west. Western Association of Fish and Wildlife Agencies Project Report 58, Colorado State University, Human Dimensions in Natural Resources Unit, Fort Collins, Colorado, USA.
U. S. Department of the Interior. National Park Service. 1986. 1982-1983 Nationwide Recreation Survey. Washington, D.C., Department of the Interior.
U. S. Department of the Interior. Fish and Wildlife Service and U.S. Department of Commerce, U.S. Census Bureau. 2006. National Survey of Fishing, Hunting, and Wildlife- Associated Recreation. Washington, D.C., Department of the Interior. U.S. Department of the Interior, U.S. Fish and Wildlife Service, and U.S. Department of Commerce, U.S. Census Bureau. 2011. National Survey of Fishing, Hunting, and Wildlife-Associated Recreation. Washington D.C., Department of the Interior.
Vaske, J. J., M. P. Donnelly, D. R. Williams, & S. Jonker. 2001. Demographic influences on environmental value orientation and normative beliefs about national forest management. Society and Natural Resources. 14:761-776.
53
Walton, B. K. & C. Bailey. 2005. Framing wilderness: Populism and cultural heritage as organizing principles. Society and Natural Resources. 18:119-134. Whittaker, D., J. Vaske, & M. Manfredo. 2006. Specificity and the cognitive hierarchy: Value orientations and the acceptability of urban wildlife management actions. Society and Natural Resources. 19: 515-530.
Yung, L., W. Freimund, & J. Chandler-Pepelnjak. 2008. Wilderness politics in the American west. International Journal of Wilderness. 14(2):14-23. Zinn, H. C., M. J. Manfredo, & S. C. Barro. 2002. Patterns of wildlife value orientations in hunters’ families. Human Dimensions of Wildlife. 7:147-162.
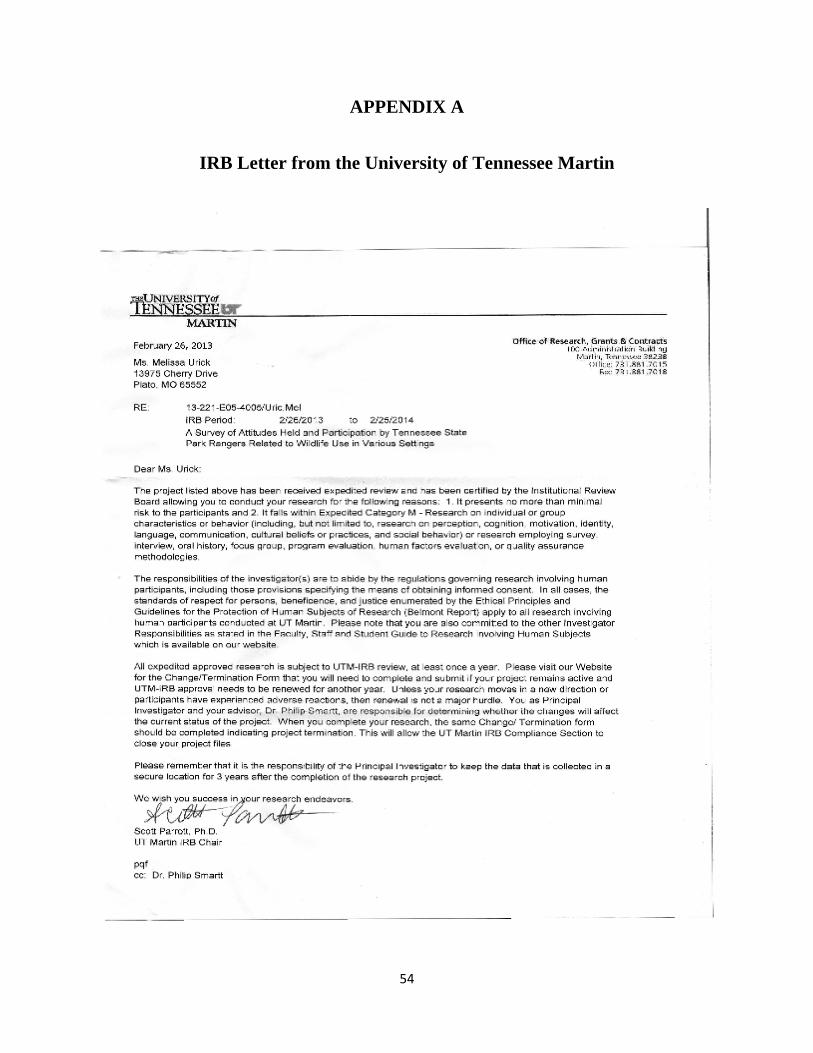
54
APPENDIX A
IRB Letter from the University of Tennessee Martin

55
APPENDIX B
Survey Questions

Greetings: I am requesting your participation in a research survey, “A Survey of Attitudes Held and Participation by Tennessee State Park Rangers Related to Wildlife Use in Various Settings,” approved by IRB Docket #13221E054005/Uric,Mel. The objectives of this project are to identify use patterns and attitudes as they relate to wildlife. This survey is part of a research project which is being conducted to fulfill requirements in the Master of Science in Agriculture and Natural Resources program at the University of Tennessee at Martin. Your Participation in this survey is voluntary. The survey should take no more than 10 to 15 minutes to complete. You may choose to exit the survey at any time; you may also refuse to answer any questions in the survey. Surveymonkey.com has been used to create and administer the survey. The data will be downloaded from the website as an Excel spreadsheet and as an Adobe file. No personal contact information will be collected. Thank you for your help with this research project. Sincerely, Melissa Urick Graduate Student Contact Information: If there are any questions at any time about the study or the procedures please contact the researcher, Melissa Urick, 13975 Cherry Drive, Plato, MO 65552, 4174581266, or [email protected]. If there are any questions about the applicant’s rights as a participant, contact the Compliance Section in the Office of Research, Grants, and Contracts, 100 Moody Hall Administration Building UT Martin, or by calling (731) 8817015. Click the "Next" button below if you are willing to participate.

3. Wildlife watching such as birdwatching, other wildlife watching, and wildlife photography is acceptable.
4. Baiting wildlife (bird feeders, deer salt licks, turkey corn feeders, etc.) for the purpose of wildlife watching is acceptable.
5. Using calls for the purpose of attracting wildlife to watch is acceptable.
1. Legal hunting is acceptable for the following reasons.Always Sometimes Never
Meat/Consumption gfedc gfedc gfedc
Animal Population Control gfedc gfedc gfedc
Recreation/Sport gfedc gfedc gfedc
Trophy Hunting gfedc gfedc gfedc
2. Legal fishing is acceptable for the following reasons.Always Sometimes Never
Meat/Consumption gfedc gfedc gfedc
Fish Population Control gfedc gfedc gfedc
Recreation/Sport gfedc gfedc gfedc
Trophy Fishing gfedc gfedc gfedc
Yes
nmlkj
No
nmlkj
Other (please specify)
Yes
nmlkj
No
nmlkj
Other (please specify)
Yes
nmlkj
No
nmlkj
Other (please specify)

6. Using live wildlife in interpretive programs is acceptable.
7. Using nonliving wildlife items (pelts, skulls, etc.) in interpretive programs is acceptable.
8. Do you do baiting of wildlife (bird feeders, deer salt licks, turkey corn feeders, etc.) for the purpose of wildlife watching?
9. Do you use calls for the purpose of attracting wildlife to watch?
10. Do you use live wildlife in interpretive programs?
Yes
nmlkj
No
nmlkj
Other (please specify)
Yes
nmlkj
No
nmlkj
Other (please specify)
Yes
nmlkj
No
nmlkj
Other (please specify)
Yes
nmlkj
No
nmlkj
Other (please specify)
Yes
nmlkj
No
nmlkj
I don't do programs that involve wildlife
nmlkj
I don't do programming
nmlkj
Other (please specify)

11. Do you use nonliving wildlife items (pelts, skulls, etc.) in interpretive programs?
Yes
nmlkj
No
nmlkj
I don't do programs that involve wildlife
nmlkj
I don't do programming
nmlkj
Other (please specify)

12. In the past 12 months have you participated in wildliferelated recreation such as hunting, fishing, or wildlife viewing?
13. How many trips have you gone on in the past 12 months with the primary purpose of participating in wildliferelated recreation?
15. How many miles do you generally travel from your residence to participate in wildliferelated recreation?
14. Rank your reasons for participation in wildliferelated recreation. Simply skip any item you do not participate in.
Top Choice 2nd 3rd 4th 5th 6th 7th
Hunting big game nmlkj nmlkj nmlkj nmlkj nmlkj nmlkj nmlkj
Hunting small game nmlkj nmlkj nmlkj nmlkj nmlkj nmlkj nmlkj
Hunting migratory waterfowl nmlkj nmlkj nmlkj nmlkj nmlkj nmlkj nmlkj
Fishing nmlkj nmlkj nmlkj nmlkj nmlkj nmlkj nmlkj
Birdwatching nmlkj nmlkj nmlkj nmlkj nmlkj nmlkj nmlkj
Other wildlife viewing nmlkj nmlkj nmlkj nmlkj nmlkj nmlkj nmlkj
Something Not Listed nmlkj nmlkj nmlkj nmlkj nmlkj nmlkj nmlkj
Yes
nmlkj
No
nmlkj
If you selected "Something Not Listed", what is it?
04
nmlkj
510
nmlkj
1120
nmlkj
2130
nmlkj
3140
nmlkj
4180
nmlkj
More than 80
nmlkj
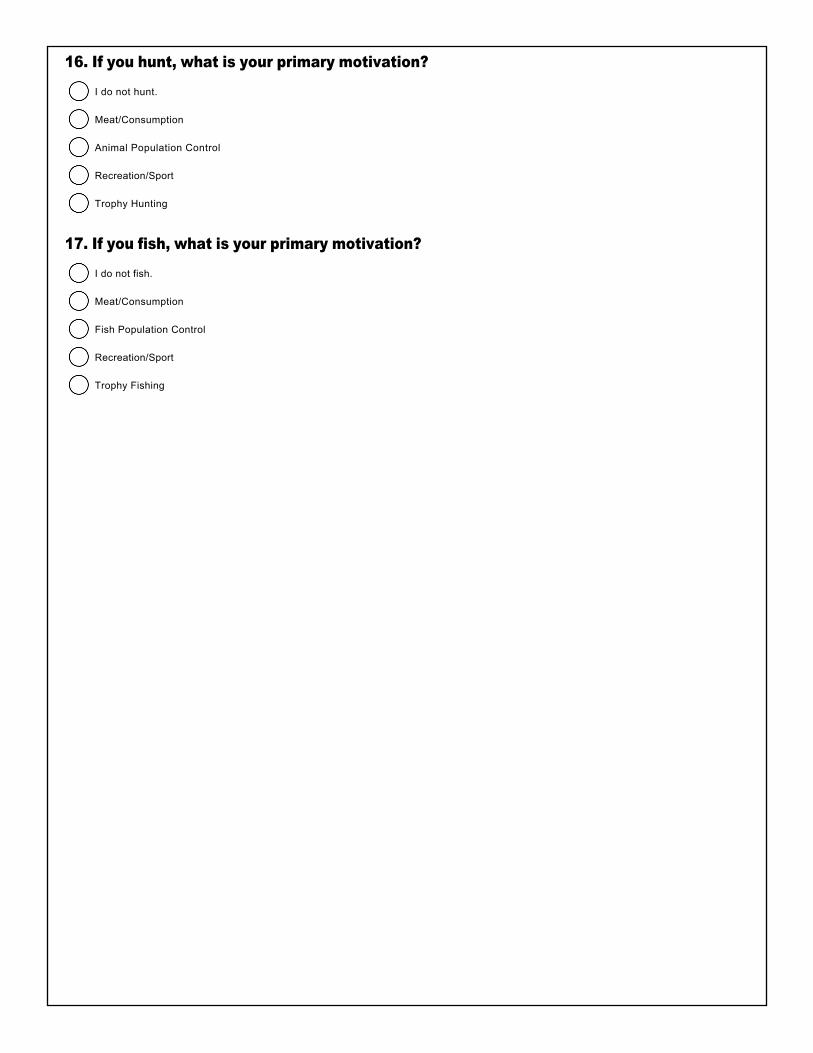
16. If you hunt, what is your primary motivation?
17. If you fish, what is your primary motivation?
I do not hunt.
nmlkj
Meat/Consumption
nmlkj
Animal Population Control
nmlkj
Recreation/Sport
nmlkj
Trophy Hunting
nmlkj
I do not fish.
nmlkj
Meat/Consumption
nmlkj
Fish Population Control
nmlkj
Recreation/Sport
nmlkj
Trophy Fishing
nmlkj

18. Are you supportive of current rules and regulations regarding hunting and/or fishing in Tennessee?
19. Would you like to see increased funding and/or effort for fish and wildlife education programs in Tennessee?
20. Which program area of the ones listed below do you think is the most important?
Yes
nmlkj
No
nmlkj
Other (please specify)
Yes
nmlkj
No
nmlkj
Other (please specify)
Training youth to hunt and fish
nmlkj
Educating youth about fish, wildlife, and habitat conservation
nmlkj
Educating/informing the public on the state’s fish and wildlife
nmlkj
Other (please specify)
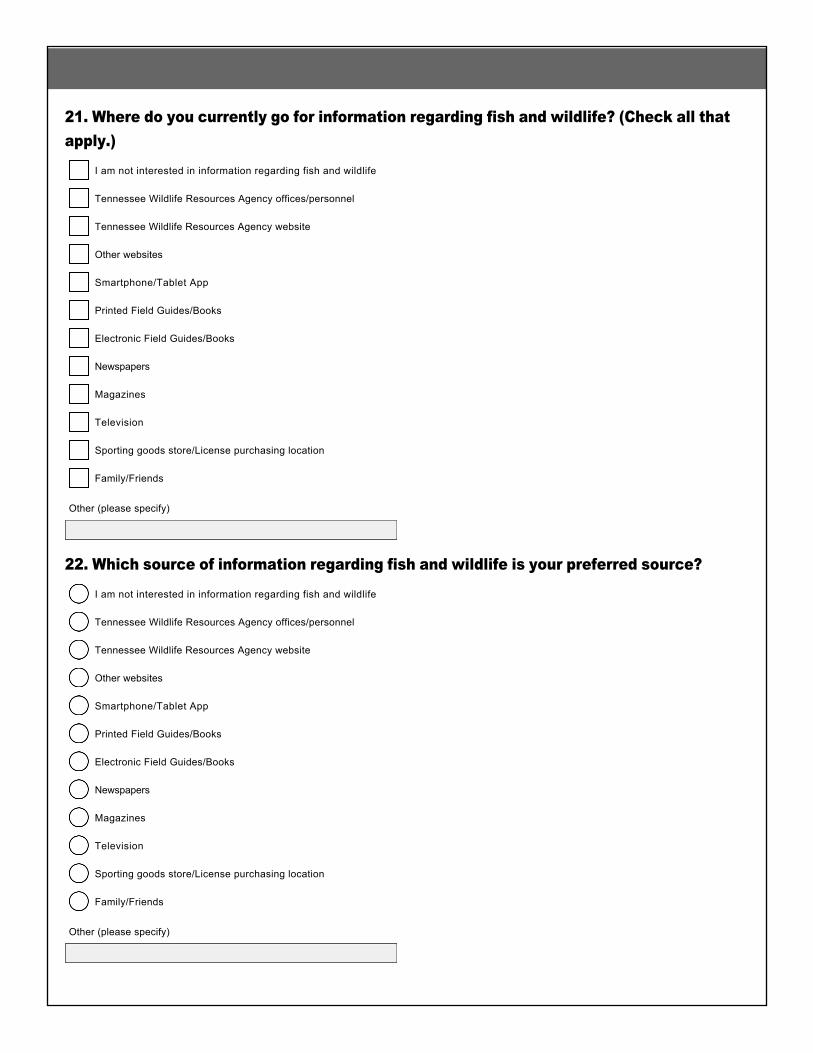
21. Where do you currently go for information regarding fish and wildlife? (Check all that apply.)
22. Which source of information regarding fish and wildlife is your preferred source?
I am not interested in information regarding fish and wildlife
gfedc
Tennessee Wildlife Resources Agency offices/personnel
gfedc
Tennessee Wildlife Resources Agency website
gfedc
Other websites
gfedc
Smartphone/Tablet App
gfedc
Printed Field Guides/Books
gfedc
Electronic Field Guides/Books
gfedc
Newspapers
gfedc
Magazines
gfedc
Television
gfedc
Sporting goods store/License purchasing location
gfedc
Family/Friends
gfedc
Other (please specify)
I am not interested in information regarding fish and wildlife
nmlkj
Tennessee Wildlife Resources Agency offices/personnel
nmlkj
Tennessee Wildlife Resources Agency website
nmlkj
Other websites
nmlkj
Smartphone/Tablet App
nmlkj
Printed Field Guides/Books
nmlkj
Electronic Field Guides/Books
nmlkj
Newspapers
nmlkj
Magazines
nmlkj
Television
nmlkj
Sporting goods store/License purchasing location
nmlkj
Family/Friends
nmlkj
Other (please specify)
23. How many years have you worked for Tennessee State Parks?
24. How would you describe the area in which you grew up?
25. In what county do you live?
26. How many years have you lived in this county?
27. What is your highest level of education?
28. What is your age?
Rural
nmlkj
Urban
nmlkj
Other (please specify)
High School/GED
nmlkj
Associates Degree
nmlkj
Bachelors Degree
nmlkj
Masters Degree
nmlkj
Professional Degree
nmlkj
Doctoral Degree
nmlkj
Other (please specify)
2025
nmlkj
2630
nmlkj
3135
nmlkj
3640
nmlkj
4145
nmlkj
4650
nmlkj
5155
nmlkj
5660
nmlkj
6165
nmlkj
65+
nmlkj

29. What is your gender?
Thank you!
Female
nmlkj
Male
nmlkj