Embed Size (px)
Citation preview

A Survivor’s Guide to New Media Business Intelligence
February 2004
Executive Summary The success of reality television provided broadcasters with a welcome diversion from the fiscal realities of television. But with the relentless erosion of the traditional broadcasting model, resulting from fragmentation to convergence and everything in between, broadcasters continue to face the harsh realities of these TV times. How can broadcasters attract new audiences and new revenues? What is the role of New Media broadcasting in this equation? Will broadcasters be able to forge an alliance with fans and advertisers based on high-quality programming and deep data-mining; or will they be voted off an island where they once reigned as content kings and sat on pots of gold?
“Interactive media helps us attract funding.” WGBH
For the majority of broadcasters, New Media television walks the tight rope between a necessary evil and a promotional opportunity. But in another circus ring altogether, brave broadcasters are creating interactive “destinations” to leverage direct revenue. As the traditional television business morphs and splinters, New Media is forcing the hands of these broadcasters to:
• Rethink the broadcast business model • Retool the broadcast delivery model • Recraft the TV show content model
Key Insights Our intent was to learn more about the value of TV show Web sites, including the return-on-investment for New Media broadcasting and advertising. Specifically we looked at the relationships between:
• Broadcasters’ on-air and online business models • Advertisers’ expectations and what broadcasters sell • Other sectors’ approaches to eBusiness and those of broadcasters • Business intelligence and data-gathering across the broadcast enterprise
Fiscal Reality Television - 2 -
Through a combination of interviews with senior executives and analyses of eBusiness strategies, a number of main themes emerged:
• Broadcasters generally lag behind other sectors when it comes to eBusiness, yet have perhaps the best original business model to exploit for eBusiness
• Most interactive broadcasting in North America happens on the Web; iTV and Mobile TV are a much smaller part of the interactive production market
“Interactive is very much treated like a new business for some purposes. However, our annual revenue targets are fixed.” CHUM
• TV Web sites are largely perceived as promotional vehicles for television as opposed to entertainment destinations for audiences
• Advertising remains hands-down the dominant revenue model for interactive broadcasting • The richer the interactive content the richer the advertising revenues; nevertheless most broadcasters don’t
invest in high-end content • While advertisers do spend money on interactive media buys, TV show Web sites play virtually no part in this
advertising mix and channel Web sites represent only a fraction of this interactive advertising spend • Broadcasters gather much more audience data than they sell or even use, while advertisers crave deeper data
and will even mine for it themselves • Broadcasters do not correlate interactive data with television data despite the advertising and other benefits
that would result Depending on your viewpoint, these observations may represent a paradox wrapped in a devilish conundrum or a golden opportunity tucked inside a fortune cookie. Fiscal Reality Television provides today’s leading perspectives on the business of interactive broadcasting, helping you come to grips with these ideas in formulating your strategy for survival.
Fiscal Reality Television - 3 -

Table of Contents Executive Summary ......................................................................................................................................................... 2 Introduction & Goal .......................................................................................................................................................... 5 Method & Participants...................................................................................................................................................... 6 Imperatives ...................................................................................................................................................................... 8 Models ........................................................................................................................................................................... 10
Content Models .......................................................................................................................................................... 10 Budget Models ........................................................................................................................................................... 13 Revenue Models ........................................................................................................................................................ 14
Advertising Models ................................................................................................................................................. 15 Advertiser Tracking & Expectations........................................................................................................................ 16 Ad Buying ............................................................................................................................................................... 17 Ad Copy & Copycat Ads ......................................................................................................................................... 18 Ad Sales ................................................................................................................................................................. 19
Business Intelligence: Lessons in Excellence................................................................................................................ 22 Web Analytics ................................................................................................................................................................ 26 Deepening the Bell Fund Role ....................................................................................................................................... 33 Acknowledgements........................................................................................................................................................ 34 About the Author ............................................................................................................................................................ 34 Appendix A – Executives Interviewed............................................................................................................................ 35 Appendix B – Company Profiles .................................................................................................................................... 36 Appendix C – Interview Questionnaire............................................................................. Error! Bookmark not defined. Appendix D – Presentation Given to Executives ............................................................. Error! Bookmark not defined. Appendix E – Broadcaster Web Metrics .......................................................................... Error! Bookmark not defined. Appendix F – Broadcaster Web Analytics Requirements ................................................ Error! Bookmark not defined. Appendix G – References................................................................................................ Error! Bookmark not defined.
Fiscal Reality Television - 4 -
Introduction & Goal Fiscal Reality Television – A Survivor’s Guide to New Media Business Intelligence provides an insider’s look at leading models and metrics for interactive broadcasting.
“Interactive media plays a role in as much as half our board discussions.” WGBH, speaking on the premium placed on New Media at the most senior levels “We would like to see more corporate CFOs involved in driving and benchmarking interactive ventures.” ELYTICS
Through in-depth interviews with leading industry executives coupled with eBusiness expertise from other sectors, this research:
• Illuminates best-practices in interactive broadcasting and the ways in which they support the traditional broadcast business model
• Highlights other industry approaches to eBusiness and their relevance to broadcasting • Features revenue models for interactive broadcasting, in particular advertising and sponsorship models for the
Web • Addresses metrics and return-on-investment for interactive broadcasting and advertising together with the
critical dependencies and competing interests of broadcasters and advertisers • Looks at the powerful relationship between business intelligence and data-gathering as a means of building
on-air and online revenues, as well as the tools and tactics used today This study is a joint initiative of Bell Canada and the Bell Broadcast and New Media Fund. Bell Canada, the national leader in communications, provides connectivity to customers with wired and wireless voice and data communications, phone services, high speed and wireless Internet access, e-business solutions and North America’s fastest-growing satellite television service. Through its satellite TV company Bell ExpressVu, the corporation supports the Canadian broadcasting system with contributions to the Bell Broadcast and New Media Fund. Now in its seventh year, the Bell Fund is the preeminent influence on the production of innovative interactive content for Canadian TV programming, with $27 million invested to date. In addition to supporting excellence in content creation for New Media and television, the Fund’s mission includes researching and exchanging industry information to benefit the Canadian broadcasting system. Fiscal Reality Television is another contribution to this end.
Fiscal Reality Television - 5 -

Method & Participants
Fiscal Reality Television is an extension of research undertaken earlier in 2003. The 39-page report Beyond Ratings, New Metrics for New Media – A Bell Fund Report for Broadcasters, Producers, Advertising Agencies and Everyone in the Business of Capitalizing on ’Net Assets for Television Properties is available free of charge from www.bellfund.ca. Our PowerPoint presentation based on this research appears in Appendix D. For the in-depth study here, we selected five participating companies from among the North American leaders in interactive broadcasting/production, advertising, promotions and analytics (Web metrics):
Industry Sector Company Name Company Logo
Public Broadcaster/Producer WGBH (PBS Affiliate)
Private Broadcaster/Specialty Channel/Producer CHUM
Advertising Agency/Direct Marketing/ Interactive Marketing/Sales Promotion TEQUILA\ (TBWA/CHIAT/DAY)
Mobile Promotions/Productions IMPACT MOBILE
Analytics/Business Intelligence Software ELYTICS
Please see Appendix A for participating executives, Appendix B for company descriptions and Appendix C for our interview questionnaire.
Fiscal Reality Television - 6 -

During the course of comprehensive, face-to-face interviews, participants generously contributed their insights and expertise, which served to illuminate the key issues in New Media television and eBusiness intelligence. The meetings were designed to be a two way street, conducted in an atmosphere of mutual trust and disclosure. Participants gained a first-hand look at the Bell Fund’s latest research, which set the stage for knowledge exchange. This background coupled with the executives’ hands-on perspectives provoked passionate discussion, the substance and spirit of which is intended to be captured here. And because various executives from each company participated in these interviews – contributing diverse opinions from sales, finance, production and management – the quotes from each company reflect a range of different executive voices. Any apparent contradictions represent the healthy dynamic of our emerging industry.
“The interactive story is a good one. The story is an extension of our mission.” WGBH, speaking on the value of New Media to sponsors and members
We also conducted telephone interviews with executives regarding iTV, including Microsoft, and games, including Sony, who provided additional important background on models and metrics relevant to New Media broadcasting. Beyond this valuable executive input, any industry observations and recommendations – for better or worse/for rich or poor – remain the author’s alone.
Fiscal Reality Television - 7 -

Imperatives Broadcasters face significant financial imperatives to respond to increased on-air and online competition. North American audiences expect their favorite television shows, channels and networks to have Web sites and broadcasters need to meet these expectations profitably, or at least without a loss. With video-on-demand, iTV and mobile technology soon part of the equation, audiences will only become more demanding and these demands need to be channeled into broadcast revenue streams. Television advertisers are also increasingly questioning the value of their media buys. The Web has increased expectations for true audience statistics vs ratings. Blue-chip advertisers now have a direct pipeline to their customers via the Web and SMS. And while TV is still the premier place to buy an ad, agencies are predicting this will change in the near future. Is television losing its clout? More people now visit a Web site that they learned about from a magazine than from television. One interpretation is that television’s influence is dwindling as a “call to action.” This could cause on-air advertising erosion down the road. New television technology is also chipping away at advertising share. US broadcasters face losing billions in annual advertising revenue as more people purchase cable boxes that permit skipping ads. Already, viewers in prime demographics are spending more time and money on interactive games and Web sites than on television. This also increases the expectation for rich media content and engaging interactivity – story-telling modes that are outside-the-box for traditional broadcasters. As a consequence of these tectonic shifts – and in order to future-proof their business – broadcasters must continually assess:
• Interactive strategies and assets • Customer expectations and relationships • Revenue models • Regulatory opportunities (such as direct revenue from SMS audiences) • Delivery channels (such as broadband and wireless)
Fiscal Reality Television - 8 -

One critical aspect of this assessment is the return-on-investment from New Media. Producers and broadcasters need to understand their own ROI for creating and delivering interactive media, as well as how this dovetails with television. Equally important, they need to understand the ROI for the advertisers who buy interactive and traditional media. New Media metrics are a key to these ROI equations and are not just for interactive business junkies. Ultimately, the broadcast “biosphere” is a self-contained system, including television and New Media assets and populated by audiences. Interactive data is part of a priceless feedback infrastructure – one that buttresses the core business of television itself: revenues and ratings.
Fiscal Reality Television - 9 -
Models Content Models The premier place for content is still TV. So the question remains, why aren’t broadcasters – the content kings – universally providing audiences with the highest quality in interactive programming? Why isn’t their online content steadfastly as “watchable” as their on-air shows? “Substance and
rich interactivity are the differentiators in whether a site’s audience grows over time and takes on a life of its own. When we build deep, rich websites in a ‘zone’ with essential information for high-school and college, we can leave them alone and they will grow like plants.” WGBH, speaking on the audience for TV show Web sites, which continues to thrive for years after any on-air broadcasts or promotions
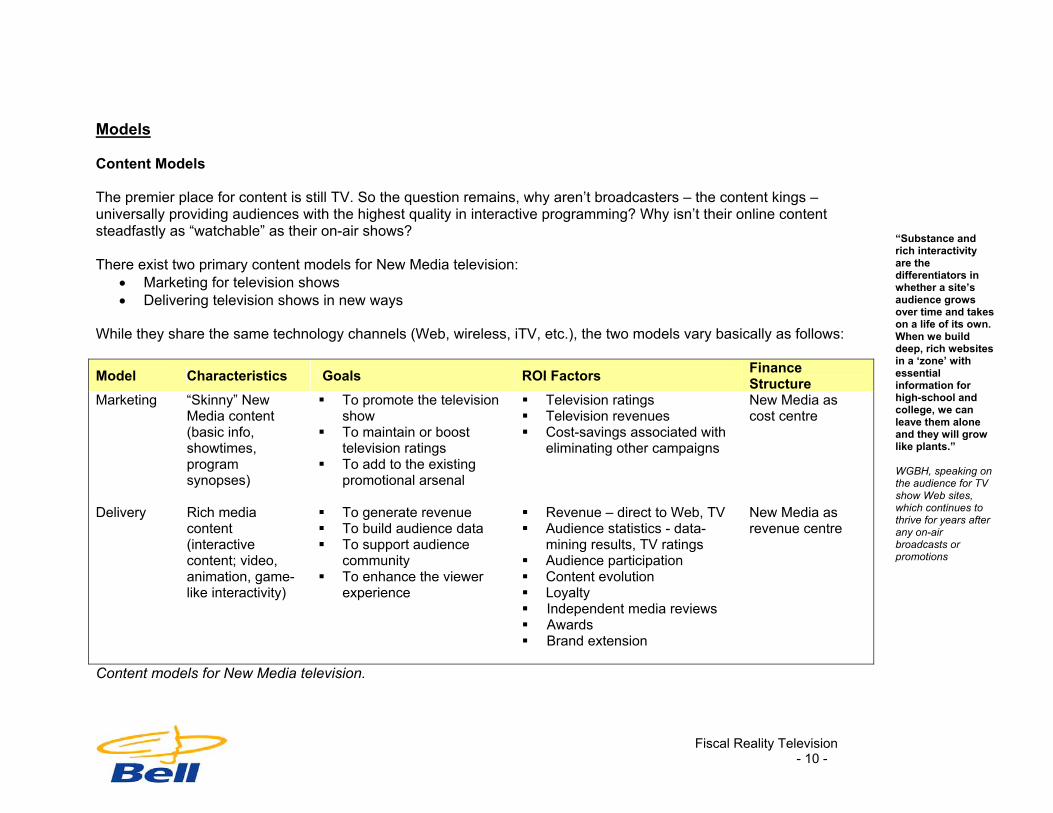
There exist two primary content models for New Media television:
• Marketing for television shows • Delivering television shows in new ways
While they share the same technology channels (Web, wireless, iTV, etc.), the two models vary basically as follows:
Model Characteristics Goals ROI Factors Finance Structure
Marketing “Skinny” NewMedia content (basic info, showtimes, program synopses)
To promote the television show
To maintain or boost television ratings
To add to the existing promotional arsenal
Television ratings Television revenues Cost-savings associated with
eliminating other campaigns
New Media as cost centre
Delivery Rich mediacontent (interactive content; video, animation, game-like interactivity)
To generate revenue To build audience data To support audience
community To enhance the viewer
experience
Revenue – direct to Web, TV Audience statistics - data-
mining results, TV ratings Audience participation Content evolution Loyalty Independent media reviews Awards Brand extension
New Media as revenue centre
Content models for New Media television.
Fiscal Reality Television - 10 -

It is critical that to both the broadcaster and New Media producer:
• Models are established up-front • Results are benchmarked against objectives • Everybody has the same expectation for returns
Broadcasters need to determine the cost-benefit ratio of mini-sites versus high-end rich media properties. Specifically, they need to pinpoint the return-on-investment for productions along this Web site continuum.
Audience StimulationCustomer Care
Rich Media SitesMini Sites
Promotion Destination
Setting expectations: establish the ROI according to a Web site’s key For CHUM Television Interactive, the equation is a simple one: the more riches a site brings in the richer the content. The corollary: the smaller the audience the fewer the interactivities. CHUM describes its content strategy as a balance between promotional/informational and rich media for each of its 20 Web sites, with its primary emphasis on “channels” versus “shows.” Its premier destination sites: MuchMusic, CityTV and Pulse24. For PBS affiliate WGBH, the strategy is 100 percent rich media. In other words, every TV show with a Web site is produced and positioned as a destination on-air as well as online. The result is more than cross-pollination between the TV show and the Web site. Great rich media Web sites also ensure a powerful legacy for television, with the potential for ongoing revenues and audience relationships well beyond the TV show’s finale. At least one-third of the most-visited adult show sites on PBS.org, are for TV programs that aired more than two years ago. Six of these sites are associated with TV shows that aired more than five years ago. By PBS’ own analysis, definitive sites in history and science have staying power, particularly with educators who make up 24 percent of the PBS online adult audience.
Fiscal Reality Television - 11 -

For outstanding children’s broadcasting, the Web offers an even more exceptional rate of return. Take the cartoon Arthur, for example. On-air since 1996, Arthur is currently the premier online brand for PBS. The Arthur Web site generates between 25M and 35M page-views per month, compared to 210M overall for PBS.org. This whopping online audience keeps coming back for more – despite the fact that WGBH produces only five to 10 new episodes of Arthur annually. And online audiences spend more time on the site than the show by about four minutes. Peak WGBH shows that are currently on-air and produced regularly generate seven to eight million page views per month. These programs, such as Nova and Frontline, pull an additional 25 percent of the on-air audience via the Web.
“The TV show site will never be the show. But if the objective is for the Web site to be compelling, then it must be rich. Mini sites are equivalent to ads, therefore they shouldn’t be any more rich than they have to. Don’t confuse the ROI with the wrong objective.” TEQUILA\
From cost-centre to revenue-centre: Interactive asset deployment. Uniting the marketing and delivery power of interactive assets.
Marketing Tool Cost
Centre
Delivery Channel Revenue
Delivery & Datamining EngineProfit Centre
The bottom line is that a rich media destination site will always market the TV show. But sites that are purely promotional will never build direct revenues or audience relationships. Certainly, to pull an audience, rich media Web sites need to be promoted just like anything else. Compared to the marketing of Web sites by other industries, and in spite of the availability of “free” TV for its own promotional use, most broadcasters are notorious for failing to drive traffic to their Web sites. Whatever the strategy, the Web can and should be used at least as much for market research as for marketing promotions. Ultimately, the Web audience is a powerful focus group, there for the tapping.
Fiscal Reality Television - 12 -

Budget Models The broadcaster goal is to build a Profit & Loss Statement for its interactive assets and divisions. For a private broadcaster, success is measured according to the New Media division’s:
• Ability at least to be self-supporting (with any revenue generating assets floating all non-revenue generating properties), if not profitable
• Increase in year-over-year advertising revenue attributable directly to New Media; for example, CHUM considers a 13.5 percent annual increase noteworthy, as cited in its recent Annual Report
• Overall contribution to the bottom line, specifically any measurable contribution to television revenue For a public broadcaster, success is measured according to the New Media division’s:
• Restricted Funding: ensuring that all aspects of a project (TV, New Media, Outreach, etc.) are fully funded with sponsorship financing.
• Discretionary Funding: ensuring that R&D and core infrastructure expenses are increasingly covered by sources other than the Foundation. These may include non-broadcast education projects and work-for-hire. In 2003 for instance, WGBH was able to reduce discretionary spending on core infrastructure and R&D related to New Media by 21 percent over the previous year.
Both private and public broadcasters continue to secure technology partnerships, with in-kind components, to offset costs. Furthermore, once the value of New Media is measured, broadcasters are in a better position to cut costs or reallocate resources. Specifically, New Media metrics can help broadcasters make staffing decisions within their interactive departments, weigh their outsourcing options for content creation and assess the value of their streaming expenses. New Media returns can also be used to overhaul promotional strategies and budgets. Right now, most official TV show sites exist to drive viewers to the television show. As such, they have the same basic goal as a listing in TV Guide, a display ad in a newspaper or a billboard that features a star’s face. The New Media metric for a promotional site is its contribution to TV ratings – tough to measure, but the value model exists.
Fiscal Reality Television - 13 -

For accounting and oversight purposes, interactive production budgets may be split between the television and New Media arms of the shop. For example, at WGBH the following budget models are in play:
Interactive Budget Television Show
Editorial Design Programming Technical
Arthur NM NM NM NM
Frontline TV TV TV TV
NOVA TV NM NM NM
American Experience TV NM NM NM
“A successful Web site can help ensure an on-air sponsor and underwriter.” WGBH
Who carries the interactive budget responsibility? (TV=Television division; NM=New Media division). At WGBH, this distributed structure is the result of the independent strategies employed by each program strand rather than a top-down management plan. In terms of achieving eBusiness success, this kind of matrix management makes sense. But it makes things challenging for independent New Media producers who need to appeal to multiple clients as well as secure multiple deal structures and sign-offs. Understanding a broadcaster’s budget structure is critical for interactive producers to create a compelling case for New Media partnerships and deliverables. Revenue Models
Broadcasters that use interactive technologies to deliver television content naturally expect to generate revenue as a result. But the revenue models remain in flux, with New Media producers continuing to experiment at their own expense as well as that of their broadcast partners. With varying degrees of success, broadcasters and producers are setting themselves up to make money through:
• Advertising and sponsorship • Promotions and contests for advertisers and sponsors • Third-party interactive development and production services (for advertisers, sponsors and even corporate
Web sites)
Fiscal Reality Television - 14 -

• Subscriptions for pay-per-view, video-on-demand and streaming video “The money from microtransactions is not yet regulated by the CRTC. It is just cash to broadcasters.” IMPACT MOBILE
• Ecommerce • Micropayments for mobile content (for example, Short Messaging Service “SMS” on cell phones) • Interactive content licensing agreements • Memberships and donations (for public broadcasting) • Merchandising cross promotions (for example, “selling” a TV show’s brand and URL to a soft drink company
for placement on its soda labels) The majority of New Media television is still delivered via the Web. And advertising, together with its public broadcasting equivalent “sponsorship,” remains hands-down the dominant revenue model. Advertising Models Free compelling programming with advertising to support it still rules the day with audiences. Internet broadcast consumers prefer advertising to a variety of subscription models by a wide margin, according to a new report by the research firm Arbitron. Nevertheless, most TV show sites still host no ads. Why? From an agency perspective, TV show sites exist to generate a single action – for the consumer to watch the television show. Therefore, to advertise on a show site would be like placing an ad within a vanity publication at best, or like placing an ad within an ad at worst. In general, more than one corporate logo together gets confusing and dilutes brand. There is also a problem with the perceived value of Web advertising. Most individual ad buys on TV Web sites go for mere thousands a pop, chump change compared to the hundreds of thousands spent on TV media buys. Therefore, even though the quality of leads generated from the Web may be superior to TV and the audience statistics more exact, advertisers and agencies want the primary association to the TV show and will pay accordingly. Some advertisers are willing to buy corresponding on-air and online spots. For example, if a retailer is sponsoring the sports play-of-the-day on air, then branding the same content online makes sense. But because in many broadcast organizations convergence hasn’t happened in the sales departments, television and interactive sales are still done separately, with different collateral materials and pitches, resulting in lost revenues.
Fiscal Reality Television - 15 -

As Web advertising evolves from banners to videos, and broadband wins out, sales convergence might happen. MSN is hoping to wed the impact of TV advertising with the immediacy of the Web by selling 15 seconds of commercial video time for every five to six minutes of streaming video content. This amounts to putting TV ads on the Web, something that a traditional TV sales rep may be more willing to do then get caught in the quagmire of pop-ups and clicks. Fueled by increasing broadband penetration, advertisers are wise to include Internet broadcasting in their media mix. In fact, broadband may just be the bridge that cojoins “audience” with “consumer.” Frequent users of high-bandwidth Internet audio and video are “very likely” to try new products and services, make purchases online and consume new forms of audio and video entertainment, according to Arbitron. “At what point do
sponsors care that rich media will grow an audience over time by as much as one-third, with no on-air presence or promotion.” WGBH
Advertiser Tracking & Expectations So what are advertisers tracking in terms of return on their modest interactive investment? What are their expectations when it comes to New Media pay offs? In a big picture sense, New Media ad placements are measured as part of an overall media campaign. Typically, an advertiser looks for a three-dollar rate of return. That is to say, three dollars achieved in revenue for every dollar spent on advertising. For the Web, what companies spend on advertising and what they expect back is still fuzzy. Despite the fact that the Web offers very detailed audience statistics and direct purchasing functionality, it is still sold as a vehicle for promoting awareness. Advertisers expectations are therefore low and strategic, much like with television. Specifically, television advertising is sold according to ratings and the Web is sold according to a comparable measure “impressions.” This is like selling a car as a comfortable place to sit, rather than a vehicle that moves people from place to place. But smart advertisers know exactly what they are buying when they buy the Web. They know many better ways to analyze the results of their campaigns and how to get beyond first impressions. Advertisers and their agencies look at popular measures, including:
• View through; a measure of people who see an ad on the Web and within 19 days return to the advertisement Advertising agency TEQUILA\ considers this to be the gold-standard interactive metric because it requires the consumer to take a concrete action, on her own time, driven by a particular purchasing interest.
Fiscal Reality Television - 16 -

Click through; a measure of people who click on an advertisement for more information • Sony advertises its Playstation games on rich media entertainment Web sites that match the game storyline, according to its agency TEQUILA\. The game “Twisted Metal:Black,” for example, was promoted on the “Battlebots” section of comedycentral.com and the “Fear” section of MTV.com, because of the content fit. The campaign objective was to create brand awareness, a strategic and hard-to-quantify goal. What Sony tracked was more specific: the click-through rates. In this case, the rates were more than 7 percent, easily surpassing the industry average of about 0.5 percent. “Sponsors believe
enough in the value of interactive. They don’t want to spend money to prove or disprove it. The return on measuring sponsorship is not there for them.” WGBH
• Cost-per-action and cost-per-click; a measure of ad spend per viewer • Contest entrants; one of many forms of registration that CHUM tracks for its advertisers • Time spent with advertiser’s promotion (for example, an online promotional game) and Trends on time within
the promotion: measures of campaign content efficacy and a campaign’s success in engaging customers If more broadcasters made a point of selling interactive advertising on these and other Web deliverables, they would be extracting more value from their interactive assets. Ad Buying New software could enable broadcasters to make this transition as the competition for quantifying the impact of interactive campaigns heats up. Google lets its advertisers copy a string of software code onto the advertiser’s own Web site to track the consumer’s online behaviour. This information is also used to set the price for the advertiser’s next ad purchase on Google. Google claims that its advertisers are increasing their advertising spend as a result. Indeed, the single thing that gives advertisers confidence to spend more online is positive firsthand experience and data, not generic clicks. Without question, interactive broadcasters could be in the ideal position to deliver this data intelligence. Similar services to Google’s are available from DoubleClick, LinkShare, CentrPort and CNET Networks, which broadcasters can also deploy to make money. Because of sophisticated online tracking, advertisers such as major consumer electronics and video game companies like Sony, Electronic Arts and Activision have increased online campaign spends from $20,000 to $200,000-$300,000. Average spending per campaign on GameSpot, a Web site for video game fans, has grown by threefold since it
Fiscal Reality Television - 17 -

launched extensive advertising tracking last spring; with the average spending per campaign increasing by 25 percent and the big spending by 50 percent. Certainly, the Canadian advertising market is brutally competitive. Overall, it is estimated at nine billion dollars annually, with the interactive advertising slice about $150 million. (Which, depending on your perspective, is either hugely promising or a rounding error.) The agency TEQUILA\ estimates that US advertisers are spending at most three percent of their annual budget on all interactive media placement. The amount of this spent on interactive broadcast sites (such as network portals) is negligible. The amount spent advertising on TV show sites is non-existent.
“The market for video ads online is very immature.” CHUM
Ad Copy & Copycat Ads Movie trailers and music videos are the most popular types of online videos, with 17 million monthly viewers in the US alone. The majority of online viewers say that they would watch a brief commercial before the video, representing a significant source of potential advertising revenue for Internet broadcasters, reports Arbitron. This is particularly interesting in light of the fact that movie trailers are themselves advertisements. In fact, broadcasters should aggressively adopt the movie industry approach to promoting their programs with compelling online trailers. (People who watch online trailers see far more movies than the average consumer, according to a 2003 Arbitron/Edison study.) These online TV show trailers would not only likely drive TV ratings, they could serve as a launch pad to rich media Web sites, online contests, fan communities and other revenue-driven interactive assets. On the flip side, some advertisers are themselves getting into the Web content production business and testing their ROI. With money that once went to traditional on-air advertising, big brand corporations are producing rich media “movies” or game-quality promotions that compete for eyeballs on the Web. This is ironic considering many broadcasters still question the value of rich media content. Some of CHUM’s interactive advertisers outsource the design and production of their promotions to CHUM’s interactive team. These production services are sold by CHUM as part of the advertising buy and often come through ad agencies. They agencies who outsource this kind of work to CHUM do so because the resulting campaigns are more likely to integrate tightly with the CHUM sites. The resulting promotions are rich media Web sites, which include contests, coupons and special offers. Advertisers are using this type of promotional content to directly engage consumers and collect data about customer’s behaviours, habits and opinions.
Fiscal Reality Television - 18 -

Ad Sales Interactive media broadcasting is entering the mainstream and the industry needs to reinvigorate advertising value propositions. Broadcast sales staff need brief-case ammunition to launch a sales offensive, including pitch materials with concrete Web audience data, featuring the value that individual consumers represent across both worlds of television and interactive.
“Interactive components are built into all promotions that we sell, and some – but not all –traditional TV advertising sales.” CHUM
Broadcasters need to better sell on audience segmentation, recognizing that their interactive broadcast consumers are tech savvy purchasers with tremendous value to big high-tech advertisers. Broadcasters would do well to sell in-stream advertising and promotions. They are increasingly acceptable to consumers and can’t be blocked with today’s anti-ad software.
Fiscal Reality Television - 19 -

Interactive Television – Thinking Inside the Box What are today’s other interactive adver-tising opportunities and how are they im- pacting the revenues of traditional broadcast television? Consider interactive television in all its guises: • Set-top box systems, Internet protocol
television, and other devices for: Enhanced television Video-on-demand, pay-per-view-
and subscription services Electronic program guides
• Digital video recorders and personal video recorders, such as TiVo
Today in the US, cable companies are bundling TiVo into cable boxes. About a million such systems are in homes now with a projected 20 million by 2006. This spells opportunity for interactive advertising but trouble for traditional TV ads. In fact, broadcasters are facing a 14 percent loss or 7 billion dollars in lost advertising revenue, since TiVo permits ad skipping. And because interactive television looks like television, in a way that the Web does not,
iTV has the power to change advertisers perceptions about the value proposition of broadcasting and the Nielsen Ratings. The metrics for iTV are directly attached to TV viewing habits. TV’s goal for advertising is to create desire and interest. What happens when interactive television, which allows TV viewers to act on these desires and interests, demonstrates that con- sumers have only limited interest in a particular ad or product placement? Finally, as they do on the Web, advertisers are leapfrogging ahead by creating their own iTV content, competing directly with television and building a one-to-one relationship with viewers. One car compa- ny, for instance, has used its advertising agency to produce a broadcast-quality interactive show that features nothing more than a high-speed drive through the streets of Prague. Conversely, at Canadian broadcaster CHUM, iTV content is produced by repurposing Web content not the television shows themselves, with their iTV programs considered more Web-like than TV-like because of current tech-nological limitations.
To monetize the business of iTV, broadcasters and others can buy access to the iTV network and to associated viewer data through OpenTV/WINK and others. Cable operators can purchase MicrosoftTV to control and monetize video-on-demand and program guides. But what corporate media executives need is a sales strategy to go with this business intelligence. The risks to broadcasters who don’t adapt for New Media delivery and advertising evolution are: • Advertisers who find other advertising
channels that consumers can’t bypass • Advertisers who cut back on their
traditional TV advertising and product placement, and who demand more direct payback from those television ads that they do place
• Advertisers who compete for viewers with high-quality interactive productions
Fiscal Reality Television - 20 -

MOBILE TV – SUP CW2CU (What’s up? Can’t wait to see you)
In the UK, the strategies for television, enhanced television and mobile text messaging are converging. SMS (short messaging service) provides the back-channel for audiences to interact with the broadcast and to play games, a trend not lost on advertisers. In Europe this year, as much as seven percent of all advertising dollars will be spent on mobile ads. Carriers stand to win big and have dropped WAP and Java initiatives to focus on SMS, a business which they essentially control and deliver. Without spending anything on additional infrastructure, European carriers are getting 21 percent of their revenues from SMS. And in Canada, the volume of SMS messages is growing by about 25 percent each quarter, with Rogers reporting 27 million SMS messages sent by subscribers each month. In general, SMSTV and SMS Marketing in- vite audiences to interact via text from their cell phones with a television show or mar- keting campaign. This invitation may origi- nate from television (for example,“Canadian Idol”), from a flashing billboard at a sports stadium or from a label on a pop can. Audiences key in a short code, essentially a URL of the cell phone, to initiate this interaction. In turn for voting, entering a contest or submitting a plot twist, participants might receive a coupon for a
product or get the chance to affect the outcome of a television show. In many cases individuals are willing to pay (typically between ten cents and a buck) and submit personal data as part of this interaction, offering companies the double-whammy of direct revenue and consumer data. The nascent business model is a revenue share between parties. For example, view- ers and advertisers spend money on SMS and the money is shared between the mobile agency/producer, the telco/carrier, and the broadcaster/TV producer. And any shared money generated from these micro transactions is cash to broadcasters since it isn’t regulated by the CRTC. The broadcaster CHUM for instance has a number of mobile initiatives built around a revenue-generating business model, which include pay-per-play content and games as well as advertiser promotions. AT&T Wireless’ “American Idol” promotion reported 7.5 million votes, with 33 percent of voters using SMS for the first time. For “Ca- nadian Idol”, the SMS response per capita was higher, perhaps because it was a cross-carrier campaign. Broadcasters and advertisers are going mobile because of the audience demographics. The promotions and production company ImpactMobile says SMS appeals to teens and young adults ages 14-24, who like its one-to-one feel; people who consider the phone to be “local/
me” compared to the “virtual/anonymous” Web. ImpactMobile charges clients about $30,000 for a typical SMS advertising campaign. The statistics they generate are very granular and may also change advertisers’ percep- tions of the value of traditional television ads. For example, SMS participants can key in a different short code depending on where they see a promotion. So, a single advertiser like the GAP can track the return from its billboards, print ads and television spots based on which codes consumers use for mobile interactions. With its proprietary technology JumpTXT, ImpactMobile tracks user behaviour (considered an objective measure) rather than user input (less valu- able because it is so commonly faked). Ad agency TEQUILA\ contends that SMS is fine tuning advertising efficiencies, not creating new advertising space. However, with the hall-of-mirrors-that-is-interactive, it is entirely possible that game-quality mobile promotions on cell phones will themselves be real estate for future advertisements. With respect to television content and SMS, things are more experimental. “Train 48” a show currently broadcast on Global Television, invites viewers to participate in spontaneous drama via SMS voting. But ImpactMobile, a partner in the venture, says that among its roles is to convince Global that viewers and advertisers will spend money on SMS.
“We view SMS as a natural extension of TV and every-thing that we do. We are watching European trends: by this time next year SMS will be fully-integrated into our interactive strategy, a part of business-as-usual. CHUM “Simple ‘voting’ is often used by TV producers who see mobile as an afterthought. With long-term strategy there are more creative ways to extend interactive revenue.” IMPACT MOBILE
Fiscal Reality Television - 21 -

Business Intelligence: Lessons in Excellence Clearly, the relationship between advertisers’ interactive metrics and broadcasters’ interactive metrics is symbiotic and one that broadcasters need to parse if they are going to succeed in New Media. And for broadcasters there is no better place to start than integrating their corporate and New Media goals. Public Broadcaster & Producer WGBH Private Broadcaster & Producer CHUM Corporate Key Metrics Corporate Key Metrics Ratings Revenue Sponsorship RatingsOverall Project Reach (TV/Radio/Print/Interactive) Profit Awards
Interactive Key Metrics Interactive Key Metrics Funding raised for Interactive; ecommerce and membership Profit for Interactive Division Web Traffic Web Traffic Reviews for Web sites Support for the TV brand On-time/On-budget Awards
Comparing key metrics – corporate-wide and interactive benchmarks for the two broadcast business models. To analyze the value of interactive media, eBusiness-savvy companies measure the big picture: the joint efficacy of offline and online activities. Are broadcasters doing the same? Scorecards that drive an understanding of ROI integrate Web data with enterprise-wide revenue data and cost-of-goods-sold. But even interactive broadcast leader CHUM says that the company has only recently started to formalize the process of overlaying TV times, trends and ratings with interactive data. And for most broadcasters, basic data from systems like DART – DoubleClick’s turnkey advertising delivery system for online content providers – are rarely integrated into Web performance reports, let alone TV reports. At the very least, broadcasters need to convince themselves that interactive properties are not cannibalizing their core business. According to WGBH for example, shows that do well on the Web tend to do well on DVD, and are therefore
Fiscal Reality Television - 22 -

not eroding sales. Yet for private broadcasters sales equals advertising. And while broadcasters would ideally like to be increasing their interactive advertising by taking ad revenues from their competitors, right now they are far more likely to be taking from their own television arm. But, notes CHUM, this all-in-the-family strategy is at least preferable to the alternative: being eaten by the competition. To migrate their business model to eBusiness, broadcasters don’t have to tread new ground. Other industries have paved this route successfully and offer excellent tactics for the taking. Typically, this migration involves the following:
• Establish an enterprise-wide eBusiness strategy lead by a senior corporate officer • Determine which products and services can be delivered electronically and which delivery channels will do the
best job for each • Set revenue targets and cost reduction objectives facilitated by eBusiness • Create an eBusiness Intelligence scorecard, that measures concrete metrics and integrates with financial data
and enterprise goals • Staff and budget for eBusiness, with an author-once, publish-many philosophy • Build a scalable technology plan and budget • Evaluate and adapt quarterly
When it comes to mining business intelligence, the health and finance sectors lead the way, technology corporations rank second and broadcasters/publishers are not yet in the running, according to the Web analytics company Elytics. Considering that broadcasting is the original eBusiness – in the pure sense that it delivers its products (TV shows) electronically (over the air-waves) – it is surprising that other industries have leapfrogged ahead.
Fiscal Reality Television - 23 -

Sector Key ROI Indicators for Web Finance Structure for Web
Health “Participants” and“Completions” for online drug diagnoses/patient self-tests
“Useability,” a soft measure that requires reworking online content
“Cost” for interactive media
Cost centre
Financial Services
“Profit” by customer and corporate client
“Transaction Amounts” and “Product/Asset Categories”
“Customer value,” “Attrition,” “Churn”
Revenue centre
Tech “Lead yield,”“Request,” Sale”
“Revenue,” with enterprise revenue correlated to Web revenue
“Cost” for interactive; “Value” of promotion
Cost centre
Telco “Call shedding” “Revenue” “Cost” for interactive media
Revenue centre
“Sophisticated companies employ a Marketing Information Strategist responsible for analyzing data for each brand. They compare analytics across all delivery channels, including interactive.” ELYTICS
A look at leading eBusiness intelligence factors by sector, with data from Elytics. As a rule, it can cost five to ten times more to acquire a new customer than to keep an existing one. Nevertheless, many businesses still overlook customer retention metrics, and broadcasters are no exception. “Fan relationships” represent the equivalent metric for broadcasters. Yet, many broadcasters leave fans to their own devices online, instead of cultivating them. Public broadcasters, music and sci-fi channels and shows are the exception with memberships, clubs and communities for their most loyal viewers. Good eBusinesses look at the hard costs they can eliminate as a consequence of having a Web site. For instance, “Call-shedding,” the decline in customer telephone calls to a call centre, can be interpreted as a function of a successful Web site. Broadcasters would benefit from a comparable approach. Specifically, cost centres such as “promotions” and “member services” need to off-load deliverables to the online division. The true currency of the Web will have value once New Media isn’t perceived as a net add to expenses.
Fiscal Reality Television - 24 -
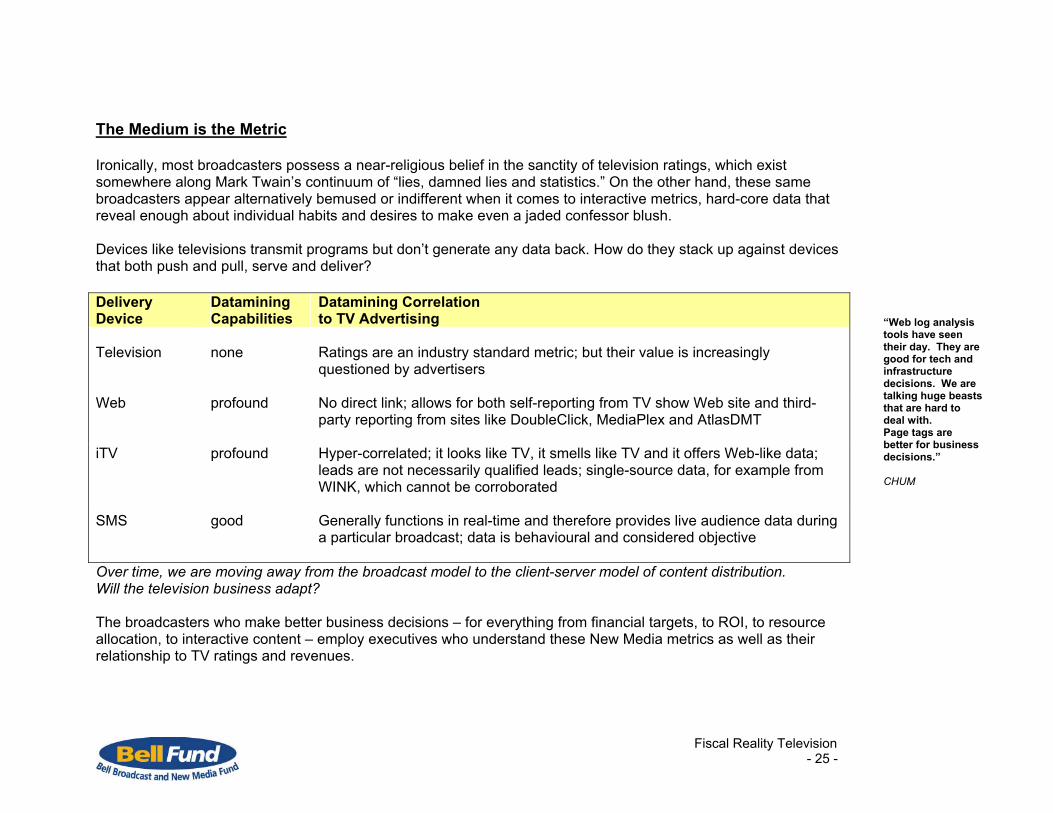
The Medium is the Metric Ironically, most broadcasters possess a near-religious belief in the sanctity of television ratings, which exist somewhere along Mark Twain’s continuum of “lies, damned lies and statistics.” On the other hand, these same broadcasters appear alternatively bemused or indifferent when it comes to interactive metrics, hard-core data that reveal enough about individual habits and desires to make even a jaded confessor blush. Devices like televisions transmit programs but don’t generate any data back. How do they stack up against devices that both push and pull, serve and deliver? Delivery Device
Datamining Capabilities
Datamining Correlation to TV Advertising
Television
none
Ratings are an industry standard metric; but their value is increasingly questioned by advertisers
Web profound No direct link; allows for both self-reporting from TV show Web site and third-party reporting from sites like DoubleClick, MediaPlex and AtlasDMT
iTV profound Hyper-correlated; it looks like TV, it smells like TV and it offers Web-like data; leads are not necessarily qualified leads; single-source data, for example from WINK, which cannot be corroborated
SMS good Generally functions in real-time and therefore provides live audience data during a particular broadcast; data is behavioural and considered objective
“Web log analysis tools have seen their day. They are good for tech and infrastructure decisions. We are talking huge beasts that are hard to deal with. Page tags are better for business decisions.” CHUM
Over time, we are moving away from the broadcast model to the client-server model of content distribution. Will the television business adapt? The broadcasters who make better business decisions – for everything from financial targets, to ROI, to resource allocation, to interactive content – employ executives who understand these New Media metrics as well as their relationship to TV ratings and revenues.
Fiscal Reality Television - 25 -

Web Analytics
“I’d love to have more datamining but I can’t cost-justify the more expensive tools against the need to create compelling content.” CHUM
As the FBI and the CIA recently learned the hard way, data-gathering and intelligence-gathering are two different beasts. But before broadcasters can extract the business metrics – the intelligence – from their New Media assets, they need basic Web metrics – meaningful categories for the relentless reams of data generated through interactivity. “Page views per month” are the current lingua franca for Web measurement, the New Media equivalent to television ratings. “Unique visitors” reflect the success or failure of rich media Web sites as destinations, according to CHUM. The broadcaster would rather see ten people visiting two times a month, than two people visiting ten times. Clearly, there exists a sweet spot. “Time on site” is increasing in importance, notes CHUM, a measure that wasn’t looked at so much in the past. Elytics recommends that broadcasters also consider:
• “Optimum visitor” behaviour; based on the percentage of visitors who performed certain online activities • “Customer loyalty” and “Customer churn”; where loyalty is defined by a broadcaster (as in “visits regularly over
three months”) • Interactive media points hit by users: for example, video, audio and FLASH
How exactly is this Web data gathered? As do many broadcasters, WGBH and CHUM use a combination of third-party products, proprietary tools and open source software to piece together reliable data. WGBH uses WebTrends and CHUM deploys DeepMetrix. Raw data comes from two basic sources “server log files” and “page tags.” They provide information about users, including ID, where people come from, how often they return and how they navigate through a site. Using “cookies” enables Webmasters to log even more detailed information about how individual users are accessing a site.
Fiscal Reality Television - 26 -

Broadcasters are only just beginning to go beyond collecting server log data to cookies and page tags. Sophisticated eBusinesses troll all three and correlate this information to offline financial and customer data – generally using high-end business intelligence software.
“What I’d be interested in looking at is whether the streamed chapters appear to add to the site use overall or simply divert traffic from other kinds of New Media features within the site.” WGBH
Live data analysis is one exciting development in the field of analytics. Real-time perspectives on how audiences interact with the Web, can give broadcasters and their advertisers the power to improve content on-the-fly. If, for example, an expensive section of a site is underused then producers can chose to cut it altogether, promote it better or make it easier to access.
Fiscal Reality Television - 27 -

Elytics software lets clients get a simple visual snapshot of live Web activity, with a “heat map” approach. Here clients get a colour-coded look at the popularity of various site sections with rolling updates.
“Thus far, there is no evidence that streaming is cannibalizing the TV audience. To the contrary, it appears to allow people to catch the program who otherwise wouldn’t.” WGBH
Elytics Customer Lens offers a colourful live perspective on Web data. The scorecard at the bottom of the page also includes key Web metrics: page views, average view time and the number of sessions that started and exited from this page. (Broadcaster mock-up, not real data.)
Fiscal Reality Television - 28 -

Additional Web data comes from the users themselves, who input personal information as part of entering contests, becoming members and participating in polls. This data is considered to be a double-edged sword: valuable, because it involved time and commitment on the part of the user; and unreliable, because it can’t be verified. Web data is even more valuable when it includes competitive intelligence. “Drilling down” becomes perilously close to navel gazing without any context. For broadcasters, companies like ComScore provide pan-Canadian comparative data. But while the ComScore offering is in theory the only way to go, broadcasters are critical of it in practice.
“Stats such as time-on-site provide an ‘Aha’ moment. I wouldn’t do away with all these stats, but as things stand now, they don’t help me sell sponsorships.” WGBH
Good Web analytic software combines business intelligence parameters with deep Web metrics. These solutions cost money.
Solution Broadcaster size Application Service Provider (leased by
Broadcaster, remote access from Elytics) Enterprise (owned by and installed at Broadcaster)
small / medium $50 K / year $120 K – one-time payment
large $200 K / year $1 M (approximately $250 K/CPU “seat”) – one-time payment
Typical rates for an Elytics solution (US Dollars). Companies like IBM and Sun, who no longer consider Web analytics to be an experiment, pay for the Elytics package out of their sales budgets. Elytics’ pharmaceutical and telecommunications clients, who still characterize Web analytics as experimental, pay for these tools from their marketing budgets. Broadcasters are not convinced they can justify the cost for even the most basic Web data. ComScore charges broadcasters about $30,000 annually, while offering multiple options at different price points. But with slim margins for interactive advertising, broadcasters ruthlessly scrutinize every interactive expense.
Fiscal Reality Television - 29 -

Traffic Analysis – Basic Broadcast Web Metrics
Page views = impressions May be divided by visitor type (internal, external, crawler); may be segmented by page type (content, entry, navigation); need comparable metric for each FLASH and other application Weekly unique visitors Most comparable to broadcast weekly reach numbers; in general, visitors can be categorized by visitor type (new, repeat) and established for a specific duration (for example, 90 days) Monthly unique visitors The Web gold standard and comparable to broadcast reach; in general, visitors can be categorized by visitor type (new, repeat) and established for a specific duration (for example, 90 days) Golden or dominant paths Where the audience goes online; a narrative snapshot of non-linear content; allows for shedding and bolstering content sections Average minutes per unique visitor (per session, week, month, etc.) Time consumed on site; can be compared to duration of TV episodes; uniformly addresses Flash, streaming and basic Web pages
Streaming Online video consumption; which videos files requested and played; no data available within the stream Ad click-through rate Percent of ads clicked by viewers; typically 0.5% for banners Forums and chat tracking Numerical tracking and “editorial” monitoring; the latter is outstanding for building fan relationships and for content development, focus groups, etc. Registrations Opt in; useful for list-building and fan/viewer relations; garbage-in-garbage-out problems; privacy considerations Transactions Calls-to-action to purchase or participate Visitor profile General audience data including geographical, language, browser and operating system
“Every time you generate a number, it has to be delivered with a huge caveat.” WGBH, speaking on the trustworthiness and uniformity of Web data “The Web offers a mountain of raw (web log) data with only a small hill of business value.” CHUM
See Appendix E and Appendix F for additional detail as well as resources on this subject.
Fiscal Reality Television - 30 -

Future Proof In order for broadcasters to capitalize on their strengths as leaders in both compelling media content and premier advertising space, they need to continue to integrate and leverage their New Media assets. The following strategies will help: Relationship & Revenues
• Extend television excellence to New Media with high-quality interactive storytelling, production and delivery Create “destination” sites as opposed to promotional sites
• Appeal to audience interests and by extension advertisers’ interests
Cultivate fan relationships and analyze fan preferences Mine for objective audience data and online “focus group” input
• Aggressively sell interactive media placement on the strength of superior programming and deep consumer
data Understand the interactive expectations and sophistication of advertisers, especially their ROI goals Bundle interactive audience data into all rate-cards to better sell both on-air and online advertisements Gather the specific, measurable audience statistics from these interactive assets and tout their superiority
to ratings alone eBusiness Strategy & ROI
• Think like an eBusiness; draw from other industries that do this well Exploit the natural advantage that broadcasting is the original eBusiness, providing its primary product to
consumers electronically Incorporate key metrics and business intelligence at the most strategic level; these objectives must be
established prior to engaging interactive partners and prior to interactive production and delivery Correlate New Media metrics with enterprise-wide metrics for a complete picture of interactive ROI Undertake an ROI analysis – including the upside potential and downside risk – as part of every interactive
venture
Fiscal Reality Television - 31 -

Analytics & Tools
• Staff for the analytic future. Analytics must be “owned” by a senior executive and form a part of various staff members’ jobs and performance appraisals
• Budget for analytics and make the software pay for itself with revenues that can be directly attributed to “data
driven” sales • Tools are only as useful as the people who use them. Therefore, staff must be trained to understand and drive
the analytic software
• Analytics are dynamic. Broadcasters need to push and pull from their tools on a regular basis, obtaining feedback from their staff and their advertisers as to the value of their data and analyses
Fiscal Reality Television - 32 -
Deepening the Bell Fund Role A number of common themes emerged regarding what the Bell Fund might do to provide support for this emerging industry. While some of these ideas may not dovetail with our mandate, they merit inclusion here nonetheless, providing insight into where the industry sees a need for investment and where it sits in terms of strategic and fund development. The Bell Fund would do well to consider grants for:
• Creating tools and content pieces that form part of a rich media show site • Developing business and product IP • Productizing interactive media • In-house production of broadcaster content
Finally, the Bell Fund has a vital role to play in knowledge-sharing. We can continue our leadership in this arena through:
• Identifying and illuminating best practices relevant to New Media and broadcasting • Supporting additional research on business benchmarks and other industry standards
Fiscal Reality Television - 33 -

Acknowledgements A profound thanks goes to the executives participating in this study, who graciously welcomed me inside their doors and took a great deal of time to provide thoughtful responses to demanding questions. You set me straight in a mixed media world and I appreciate it! I also value tremendously the support of Bell Canada’s Chief Regulatory Officer Sheridan Scott for championing this research from inception and Bell ExpressVu’s Senior Director of Regulatory and Government Affairs Chris Frank who joined her in making it happen. In addition to Sheridan and Chris, I remain grateful to our colleagues on the Bell Fund Board and to Executive Director Andra Sheffer and her team, who continue to value the merits of knowledge-exchange for the New Media industries and who sustained this initiative. Finally, I wish to commend the outstanding contribution of my research coordinator Hannah Payne, who gave this project her all, and did so with grace and enthusiasm, further adding to the pleasure of my work. About the Author Catherine Warren has led advances in mass media and new media since 1985, working in the United States, the United Kingdom, Western Europe and Canada. As a trusted advisor to Fortune 500 corporations, major media and telecommunications networks and world-class tourist attractions, she has helped companies to build new audiences and revenues through new technologies. The former Chief Operating Officer of enterprise software company Blue Zone, and European Bureau Chief of the computer magazine publishing house PCI, Catherine has contributed to raising the capital and the profile for significant new media initiatives. She has published more than 25 books and magazine series for children and adults on science and computing as well as produced 20 websites and interactive broadcast initiatives. Catherine also writes a satirical column and website (www.cathwarren.com) that exposes the world of finance and management for what it really is: nude illusion fabric draped over egos. Also published in a major Canadian newspaper, Catherine’s weekly column Managing Life combines business and humour to put the “moxie” back into “oxymoron.” Incredibly, she remains a strategist for the media and entertainment industries. Catherine is also a board member of the Bell Broadcast and New Media Fund and the Women in Media Foundation.
Fiscal Reality Television - 34 -

Appendix A – Executives Interviewed Company Company URL ExecutivesWGBH www.wgbh.org Howard Cutler, Executive Producer, WGBH Interactive Lance W. Ozier, VP, National Program Marketing and Board Affairs Jon Alper, Director of Technology, Research and Development Luke A. Crafton, Multimedia Producer Ronald LaRussa, Director CHUM www.chumlimited.com Roma Khanna, VP of Interactive Heather Gordon, Advertising Sales Manager Dale Fallon, Web Development Supervisor ELYTICS www.elytics.com Bhavan Suri, Co-Founder & VP of Corporate Strategy Matt Johnson, Business Development IMPACT MOBILE www.impactmobile.com Gary Schwartz, President John Leon, Business Management Tatjana Freger, Client Solutions TEQUILA\ www.tequila.com Jason Kuperman, Director of Operations The following executives provided valuable additional background information: Curtis Wong, NextMedia, Microsoft Paul Mitchell, iTV, Microsoft Tracy Swedlow, Interactive Television Today Manson Jones, Sony Picture ImageWorks Lucie Lalumiere, CBC-Radio Canada Hugh Dobbie, Insinc Anja Haman, Game Consultant
Fiscal Reality Television - 35 -

Appendix B – Company Profiles WGBH From www.wgbh.org WGBH is a premier producer of public television programs and is a PBS affiliate. The organization creates nearly a third of PBS’s prime-time TV and online lineups. WGBH Interactive has played an influential role in the development of the interactive media arts since 1985. Their Web sites, CD-ROMs, DVDs, and other interactive environments have repeatedly won critical acclaim from media, publishing, education, and design leaders throughout the world. Today, more than four million people a month visit the WGBH Interactive Web sites developed for public television, and thousands more explore their learning environments through educational portals, institutional sites, and stand-alone products. Their broad range of creative opportunities has attracted and held some of the most experienced and imaginative writers, designers, technologists, and Web developers in the industry. Few creative shops can match their collective experience and commitment to the craft. From CD-ROM and DVD to broadband Web and interactive television, their staff is passionate about their work and dedicated to uniting vision and technology to deliver the most appropriate solution for client and user alike. As a result, their reputation has grown beyond public television to attract publishers, foundations, educational institutions, medical professionals, museums, exhibit designers, and arts organizations to their services. Having cut their teeth on interactive media projects for some of the most respected television programs in the world, they now create projects for business clients and nonprofit organizations as well. Corporations, technology providers, and foundations all come to WGBH Interactive to transform rough ideas into fully realized interactive media environments of real value to their users.
Fiscal Reality Television - 36 -

CHUM Television Interactive From www.chumlimited.com/television/interactive.asp CHUM Limited, one of Canada’s leading media companies and content providers, owns and operates 28 radio stations, eight local television stations and 17 specialty channels, as well as an environmental music distribution division. In addition to its international licensing arrangements and joint ventures, the Company’s original content is seen in over 150 countries worldwide. CHUM content is also provided to online audiences on New Media platforms, including interactive television, wireless services and exclusive CHUM-branded Internet properties. CHUM Television Interactive delivers CHUM's well-known branded television content in news and information, music and entertainment, science fiction, science fact, lifestyle and education categories via New Media platforms including online, wireless devices and enhanced television.
They provide key information about CHUM Television programs and channels, and create opportunities for their viewers to interact with celebrities, their own homegrown TV personalities, as well as providing a vehicle for their viewers to contact producers and show creators directly. Their goal is to foster audience intimacy and build brand loyalty through the use of bulletin boards, chats, email newsletters, contests, polls, games and exclusive downloadable content.
Given the increased adoption of wireless devices and the growing use of SMS messaging, Interactive has developed games and wireless concepts that extend their brands truly into the palms of their fans.
CHUM Television Interactive is leading the charge in Interactive Television in Canada, developing enhanced content for four channels - MuchMusic, MuchMoreMusic, Citytv and Star! This will allow CHUM and its advertisers to actively engage their audiences in two-way communication, extending the reach of their brands and facilitating direct response from the comfort of one's couch.
Selected CHUM Television Interactive web properties
Fiscal Reality Television - 37 -
ELYTICS From www.elytics.com Elytics, Inc. was founded in Cambridge, MA in October, 1999 to revolutionize e-business by transforming the explosion of online data into vital business intelligence. This innovative solution enables online companies to understand and cater to customers, partners, and suppliers in ways previously impossible. With a vertically focused solution, Elytics offers a range of functionality from Web analytics to complex multi-channel business analytical solutions for the telecommunications, financial services, retail, high tech and healthcare industries. The Elytics solution provides insight into B2B, B2C, Intranet and Extranet applications and help organizations measure the effectiveness of their online applications. As a result, companies can analyze visitor behavior, identify significant patterns and opportunities, and convert relevant insights into action and ROI. Client businesses can immediately begin to measure and optimize online customer retention, targeted marketing initiatives, and the bottom line. The founders of Elytics are industry veterans with extensive experience in analytics and business intelligence. Their growing team includes seasoned professionals from a variety of backgrounds, ranging from startups to Fortune 500, from high-tech to consulting and finance, and from academic research to commercial shipping products. The team is drawn from leading enterprises such as Andersen Consulting, Answerthink, A.T. Kearney, Bell Labs, Bain, GE, Harvard, IBM, NetGenesis, Microsoft, Oracle, PlanetAll, and a number of area startups. They share a passionate belief that world-class, leading-edge e-intelligence will mean the difference between companies that succeed and those that fail. Elytics delivers the e-intelligence that businesses need to leverage the Web as a powerful online channel. Actionable metrics and compelling visualization make a winning combination.
Fiscal Reality Television - 38 -

IMPACT MOBILE From www.impactmobile.com
Launched in Canada in 2001, Impact Mobile is Canada's leading provider of mobile communication solutions to big brands and media companies. By exploiting the tremendous possibilities offered by SMS (text messaging) as a New Media channel, Impact Mobile offers:
• Personalized and targeted wireless marketing driving sales and footfall. • Premium-rate services for television and radio.
Impact Mobile is a one-stop shop for mobile communications in Canada. Emulating the success of mobile marketing and premium-rate television and radio in Europe and understand the wireless consumer behavior in Canada, their JumpTXT solution provides leading entertainment and consumer brands direct access to mobile users everywhere. Impact Mobile provides both customized and platform solutions allowing customers to grow with them from trial to full turn-key implementation: Customized Solutions They understand that their clients demand personalized solutions that differentiate themselves from their competitors and dovetail with their overall marketing strategy. Impact Mobile has a team of engineers, professional service professionals and mobile marketing experts that can provide personalized marketing solutions to any marketing campaign. The holy grail for effective marketing on mobile devices, is the ability to engage the user in a two-way dialogue. This combines the advantage of both 'push' and 'pull' campaigns, ensuring both retention and continued response. JumpTXT is a powerful marketing instrument to gain product recognition and customer interaction. Mobile entertainment is at the forefront of new technology to help companies improve their customer acquisition and long term loyalty. Platform Solutions Impact Mobile provides best-of-breed mobile platform solutions on an ASP or license basis for m-marketing, SMSTV and radio initiatives.
Fiscal Reality Television - 39 -

TEQUILA\ From www.tequila.com TEQUILA\ is now the sixth largest firm of its kind worldwide, with over $200 million in revenue in 38 countries. The agency is partnered worldwide with TBWA, one of the top 10 global advertising agency networks. TEQUILA\ is the type of agency that clients would create (and have helped them create). The company drives results in a fully accountable, media-agnostic way, while building brands through strong creative solutions (formerly an industry oxymoron). TEQUILA\ connects brands with consumers, uniquely marrying creativity, strategic prowess and information via CONNECTED\MARKETING – the latest in direct marketing (both acquisition and loyalty solutions), interactive and CRM. TEQUILA\ knows how to reach, connect and relate with consumers – with a banker’s focus on ROI, accountability and results; and a brand manager’s focus on brand equity.
Fiscal Reality Television - 40 -

Fiscal Reality Television - 41 -
Appendix C – Interview Questionnaire Interview Questionnaire Fiscal Reality Television Context: Metrics, models and tools are top of mind for broadcasters engaged in New Media. There exists a tremendous will and
common purpose to nail down the value-proposition for interactive properties. Hypotheses: New Media assets that accompany television programs provide added value to broadcasters. The return-on-investment for
these interactive properties is measurable. Objectives: To report on the emerging metrics, models and tools for TV-related interactive properties and related enterprises. BASICS
1. What are some of the key interactive properties that your company is involved with? 2. What are their objectives? 3. Of these interactive properties, which is the most successful, and why? 4. What are your top Corporate Goals/Imperatives for 2003/2004?
MODELS
5. Describe your company’s business model. 6. Describe your company’s interactive business model. 7. In your view, is interactive considered a cost center, a revenue center, or a profit center? 8. Is interactive media considered a distribution channel or a marketing channel? 9. Do you publish a prospectus / Offering Memorandum or equivalent with details on your interactive business? Request copy. 10. What revenue models and partnership models are in play?
STRATEGY
11. What is your strategy for building your customer base / audience? 12. How involved is the corporate CFO in driving and benchmarking interactive ventures? 13. How are corporate strategic goals for New Media operationalized, tracked financially and evaluated internally? 14. What is your senior staff’s perceived value of interactive ventures? 15. How are corporate strategies developed for interactive ventures? 16. How are high-risk, or experimental projects (eg. New Media) budgeted?
ROI
17. How do you currently measure Interactive Media ROI? 18. What is your (financial) ROI for interactive properties? 19. How is this measured? 20. What are the key elements of an e-business planning audit and metrics scorecard? 21. What is a reasonable upside potential vs. an acceptable downside risk? 22. What targets are set and attainable?

Fiscal Reality Television - 42 -
23. What metrics are you currently tracking?
a. Corporate-Wide b. Interactive specifically (may include the following examples – focus on interactive associated with TV shows)
Advertising Revenue Ecommerce Revenue Subscription Micropayments Ratings Demographics/Psychographics Community among audience Retention / Repeat Viewers / Fans New Viewers Cultivation (between primary property and interactive) CPM (cost per thousand) – impressions or subscribers Depth of Click-through Crossover Audience (eg. Viewer stats as correlated to TV schedule)
TOOLS
24. How do you measure the success of your interactive properties? 25. What tracking tools are you using today? Next year? 26. What measurement tools work, and why? 27. What constitutes credible data? 28. What tools don’t work, and why?
INTERACTIVE
29. What is the relevance of “traditional” web metrics for show sites? Metrics such as unique visits, time spent, peak period, visitor frequency, entry & exit points.
30. Do you track the number of hours of content streamed? 31. Do you corrolate this to streaming costs? 32. What do you spend annually on streaming? 33. What percentage of your show sites are micro-sites? What percentage are rich media sites? 34. What is the best payoff on the continuum of mini-sites to rich media sites?
CROSS POLLINATION
35. How is the television business model evolving as a result of New Media? (Considerations to include revenue and cost perspectives: i.e. micro-transactions, cost of site/visitors)
36. How is the show site model evolving as a result of the television business? Other eBusiness?

Fiscal Reality Television - 43 -
FANS 37. What is your strategy for your existing fan base? 38. How do you currently deepen your relationship with fans? 39. How would you like to deepen your relationship with fans in the future? 40. What, if anything, is your strategy with respect to fan-generated web sites? 41. What, if any, intelligence are you gathering from fan sites? 42. The top show sites are fan sites. How are you tracking / assessing these sites, if at all?
REVENUE
43. What are your annual revenues? 44. What are your revenues from your interactive business? 45. What is your annual revenue from interactive advertising? 46. What is your annual revenue from e-commerce? 47. From subscriptions? 48. From micro-transactions (eg SMS)? 49. From B-B?
ADVERTISING & E-COMMERCE
50. Is advertising incorporated into your business model? How? 51. Is e-commerce incorporated into your business model? How? 52. What is the approximate advertising annual spend of a single advertiser that you can directly attribute to interactive? 53. What percentage of this is placement on the interactive property itself? 54. Do your media cards / rate cards offer advertisers both on-air and interactive opportunities?
GENERAL
55. If there was one thing you could change about the interactive business, what would it be? 56. What, if anything, have you done about it? 57. What keeps you up at night about this business? 58. Where is your interactive business along your shareholder’s radar? 59. Where is your interactive business along your CEO’s radar? 60. Is there anything else that you would like to add to make our discussion more complete?
Thanks again for your contributions. It may be that we will need to follow up with you. If so, you will hear from us before the middle of October.

Fiscal Reality Television - 44 -
Appendix D – Presentation Given to Executives
“If the value-proposition for TV show websites isn’t yet a known quantity – a line
item – today it looks more like Fiscal Reality Television than Survivor. This
research articulates the first steps on this delicate trajectory.”
“Innovation needs to be applied to the business side of things as opposed to simply the interactive side of things."
Beyond Ratings – New Metrics for New Media
A Bell Fund report for Broadcasters, Producers, Advertising Agencies & Everyone in the Business of Capitalizingon Net Assets for Television Properties
Research Report Presentation - 2003
Intelligence Gathering
• Two-dozen corporate officers and senior m anagers from m edia in three countries contributed their latest business thinking during the course of in-depth interviews
• Executives stressed the im portance of conducting this research at this time. No one was aware of a sim ilar study
W e also analyzed 55 TV show websites to evaluate interactive treatm ents and revenue strategies. Ultim ately, the research com pares the realities of interactive execution to the best-laid corporate plans
Interactive Intelligence

Fiscal Reality Television - 45 -
Overview & Highlights
• The research aim s to help the industry at a strategic level to:- focus on return-on-investm ent and other top
priorities for TV show websites- create a business fram ework for capitalizing on
interactive assets
Findings
The Beyond Ratings research focused on TV show websites, specifically:
•The value that show sites bring to broadcasters
•The business m etrics used to define their worth, particularly the m onetary and m easurable benefits
Newsworthy
“Consider high-end web sites carefully for value, warns new media report”
“Broadcasters sitting on ratings potential, report says”
The Gazette “Better coordination between TV and W eb could improve profits: report”
“The Bell Fund has done more for the Canadian new media community than any public or private fund. It is praised, studied and emulated around the world. It is a vital national fund that bridges
across broadcast communities and is responsible for the creation of extraordinary projects.”
-CEO, Elizabeth McDonald, CFTPA, representing television, film and interactive production in
Canada

Fiscal Reality Television - 46 -
About the Bell Fund
In six years, the Bell Fund has invested m ore than $25 Million in 245 on-air & interactive shows.
As a result, the Bell Fund is now undertaking a m ore in-depth and exclusive look at leaders in this em erging field. W e have selected executives from five corporations, each representing a different interactive business, to:
• Gain first-hand knowledge of the trends and opportunities that cam e out of our original study
• Contribute your:-Vision and goals for interactive broadcasting-Approach to m easuring and achieving these goals in the year ahead
Today’s Research
"Networks’ interactive divisions have been tainted by the whole dot com bust. W e don't have the clout or the resources that we used to but we still manage to get some amazing things done."
- Broadcasting Executive, speaking on the morphing role of the in-house interactive division
“All it takes is one deal to come up with a new business model."
- W eb Executive, speaking on the early-stage evolution of the new media business
Key Insights
STRATEGIC LEADERSHIP•More executives expressed confidence in their convergence vision than in their convergence business model
•Broadcasters and new media producers agreed that one of the primary reasons for having a TV show website is strategic
• In the vast majority of their companies, the responsibility for W eb initiatives lies in the hands of senior managers and corporate officers
Through interviews with senior industry executives from three countries, the following m ain them es emerged:

Fiscal Reality Television - 47 -
Key Insights
AUDIENCE•Broadcasters, television producers, W eb producers, and industry analysts agree that TV show websites are important in meeting audience expectations
•At this time, the industry can learn a powerful lesson: today’s top sites are produced by fans
Key Insights
REVENUE•Broadcasters consider their interactive goals and their television goals to be “equally financially oriented”
• “Brand-building” and “cross-promotion” rank higher than “revenue” when it comes to key objectives for TV show websites
•Most TV show sites host no ads or e-commerce
“The holy grail would be to understand the consumer influence within a media mix, for example the relationship between television advertising, 1-800 numbers, online placement and their powers to leverage a sale.”
- Advertising Executive
“The W eb gives fine-tuned measures, so now we’re asking ‘what does TV offer?’ Gross Rating Points are not as valuable as reach and frequency metrics.”
- Advertising Executive
Key Insights
ADVERTISING•There is consensus that the W eb has redefined the value proposition for advertisers
•The W eb has also increased the advertisers’ expectations of television
•Advertisers no longer value things like the Nielsen’s in the same way - because they can have more:
- one-to-one- demographics- psychographics- purchasing habits
• Interactive assets associated with television properties are noteffectively integrated into the advertising m ix or pitch.

Fiscal Reality Television - 48 -
Key Insights
ROI & METRICS•The industry has yet to come to grips with the specific pay-offs, if any, associated with traditional W eb metrics, such as page views
•Broadcasters have yet to fully determine the cost-benefit ratio of m icro-sites versus high-end rich media properties
•Overall, the industry players remain committed to refining the models and metrics associated with TV show websites – as the new media business is definitely here for the long haul
AdvertisingPRW indow for TV showCross-promote TV & W ebM arketingAudience SatisfactionCommunity among audienceCultivation (betw een show & audience)Retention / Repeat view ers and fansAudienceBuild BrandStrategicContent RepurposingBackstoryEvolution of TV ContentAudience ParticipationContentMetricBusiness Goal
Top Metrics
• Demographics
• List Building
• E-commerce
• Increase TV viewers
Participants identified the following m etrics am ong their lowest priority:
Metrics Paradox
The next step is to track and m onitize these m etrics.
• W hat is being measured?
• W hy: Internal & External?
• W here is the data going?
• How is it measured?
Metrics Futures

Fiscal Reality Television - 49 -
“If a picture is worth a thousand words, a great website can
leave you speechless.”
Key Findings
The analysis of TV show websites revealed:• Broadcasters now universally offer some form of TV show information online. This ranges from show listings, to m icro-sites (episode, cast, character and other basics) to full-blown rich media websites
• Even when a rich media site exists, broadcasters do not link to it in almost half the cases
Key Findings
• Many popular shows have multiple official rich media sites, each with their own production and maintenance budgets
• W hen a third-party rich media site exists, broadcasters will still spend time and money to create their own rich media site
• The majority of official TV show websites include audience participation features such as forums and polls; these features are critical to engaging com munity. Community involvement is what makes TV show fan sites so enormously popular with television audiences
Opportunities
Aggregate every assetEntertainment companies can better capitalize on the constellation of interactive properties for each television show (rich media, m ini-sites and fan sites) by:
• Defining the m ix
• Measuring the results
• Bundling an offering
• Exploiting the whole (m ining for revenue & audience data)
Fan Sites
Mini Sites
Rich Media Sites Finding the sweet spot:
broadcasters can better unite show sites and exploit their convergence

Fiscal Reality Television - 50 -
OpportunitiesPrioritize the ROI
Broadcasters need to determine the cost-benefit ratio of building their own mini-sites versus high-end rich media properties. Specifically, they need to pinpoint the return-on-investment for productions along this continuum.
Mini-Sites Rich Media Sites
Customer Care Audience Stimulation
The TV show website presentation continuum
Opportunities
Unite the delivery & marketing power of interactive assets
Business m odels with concrete m etrics and ties into staff perform ance are critical to success.
Interactive asset deployment
DeliveryChannel
MarketingTool
Recommendations
• Capitalize on existing interactive properties
• Aggregate interactive assets
• Measure the marketing/delivery channel ROI
• Collaborate with advertisers and agencies for interactive tracking and pitch
• Deploy and push tools for meaningful data capture and metrics
• Cultivate fan culture, fan community, fan content
• Understand and track fan interests, fan buying habits
• Staff for the fan future

Fiscal Reality Television - 51 -
Appendix E – Broadcaster Web Metrics
Metrics Definition Example Limitation Should Broadcaster Use?
Hits (per day, week or month)
Number of files (text, image, or other) requested from server
A typical web page may contain between 5 and 50 files
Almost meaningless except as a raw measure of server volume
No – seldom used any longer
Page Views = Impressions (per day, week or month)
A single web page as presented to the end-user, whether on your site, partner site which included your content, or wireless unit
In a typical site visit, a visitor may visit 5 or 10 pages
Not meaningful for Flash, streaming or other applications
Yes – but must determine comparable metric for each Flash and other application
Visits = Sessions (per day, week or month)
An individual experience with the web site – typically reset following 30 minutes of inactivity
A typical moderately loyal visitor may visit a given site two or three times per month
Visitors may or may not absorb site content in a continuous session due to parallel computer activities or offline interruptions
No – although widely used, definitional problems are significant
Average Minutes Per Visit
Continuous minutes consumed during each visit
Typical visit might last ten minutes (or longer for streaming)
Same limitation as “visits”; users may not interact continuously with site
No – not if not using “visits” as a metric
Daily Unique Visitors
How many individuals came to the site in a given day
One person may visit a site twice daily, only counting for one unique visitor
Cannot be rolled directly into monthly unique visitors, since some daily unique visitors will visit again within the month
No – much too tempting to multiply by 30 days to get a month
Weekly Unique Visitors
How many individuals came to the site in a given week
One person may visit a site three times per week, only counting for one unique visitor
Still some temptation to multiply by four and roll into monthly unique visitors
Yes – this is perhaps most comparable to broadcast weekly reach numbers
Monthly Unique Visitors
How many individuals came to the site in given month
One person may visit a site five times per month, only counting for one unique visitor
The gold standard; only real limitation is in ensuring that measurement is as accurate as possible
Yes – this is web gold standard and comparable to broadcast reach
Continued on next page

Fiscal Reality Television - 52 -
Metrics Definition Example Limitation Should Broadcaster Use?
Special Events – Unique Visitors, Page Views and Time Spent
How many people came to site and how many pages and how much time spent
Will in some ways distort understanding of regular weekly or monthly reports (as events will fall across multiple weeks or months)
Yes – critical to understanding success of special event initiatives
Average Minutes Per Unique Visitor (per day or month)
Minutes consumed (whether continuous or not) by an individual visitor
One person may spend five to ten minutes per day on a site
Time spent on idle pages must be capped (typically at two minutes)
Yes – average minutes per unique visitor per month is immediately comparable across all applications, including Flash and streaming
Dominant Path What pages or applications visitors visited on site
Home page → news page → story page
Not readily metricized; must be individually analyzed
Yes – visual representation offers compelling analytic opportunities
Clicks-to-Content How quickly people got to the information they were looking for
Users may “bookmark” certain sections or zones, then click directly on a story
Have to define successful ending (e.g., spent one minute or more reading a story) versus frustrated truncation of session (e.g., went to a different site instead
Yes – while not an industry standard metric since commercial sites want people to load as many pages (and ads) as possible, this is very meaningful for broadcaster
Ad Click-Thru Rate
Percent of ads viewed which are clicked on
Typically 0.3% to 0.5% for banner ads
Doesn’t include sponsorship impressions
Yes – right now for sports only
Percent Broken Links
Percent of hyperlinks which do not lead to the intended target
In most complex sites, there are thousands of hyperlinks and over time some are inevitably out of date
Not relevant for Flash Yes – but may not be off-the-shelf feature of analytic package
Average Page Load Time
How many seconds pages took to load on average, using 28.8K dial-up connection
Web pages typically take between 3 and 30 seconds to load on 28.8 K
Less meaningful for Flash or streaming (except for load time of entire application)
Yes – key measure of user satisfaction
Reproduced with permission; anonymous source

Fiscal Reality Television - 53 -
Appendix F – Broadcaster Web Analytics Requirements Site Traffic Data Information Requirement Notes and challenges How many people came (“unique visitors”) Panel data from CMM and comparable information from analytic tool will never
exactly match What most people did (“dominant user path”) Analysts must understand approach to visual representation How long they stayed Defining difference between time spend reading a page and inactive time (e.g. if
visitors read a page for one minute then leave their computer, most systems count it until “timing out” at 20 or 30 minutes)
How many pages they viewed What do you use for Flash? Referring path (esp. for partners) Most packages can tell you which users came from where; few can tell you what they
did once they got to site All Flash activities (how many users, but also how long they stayed and what they did)
Always hard to compare Flash usage to usage of HTML pages; only comparable stat is time spent (not pages viewed)
Tracking of wireless content Even data tags don’t track what happened during interaction within a page (don’t usually support Javascript used by tags)
Tracking of forums & chat usage Has to be integrated with centralized registration system Streaming – which streams were consumed No indication of what happened once file was requested, and doesn’t work if file is
directly requested from an external supplier Streaming – pauses and termination (not required) Still cannot tell much about what happened within streaming player while stream was
playing Tracking usage of dynamic pages and customization capabilities of site
Management has to define what constitutes customization and what the degrees of customization are, otherwise clicking on local weather will be equated to full site customization
Click-thrus on newsletters Determining who clicked through from which newsletter required sophisticated use of cookies and integration with newsletter registration system
Reproduced with permission; anonymous source Knowledge of Each Visitor Information Requirement Challenge(s) Geographic origin Analytic tool cannot get this on its own from IP addresses or cookies;
must link to registration system and hope user provided data Pages viewed, and order (“user path”) Requires cookies Operating system and browser Few challenges – this is standard Language setting, screen resolution and other browser information Few challenges – this is standard for data tagging technology Registration information (e.g. e-mail address, name) Privacy issues Reproduced with permission; anonymous source

Fiscal Reality Television - 54 -
Appendix G – References Texts Bamboozled at the Revolution- How big media lost billions in the battle for the Internet, John Motavalli, Viking, 2002 Burn Rate – How I survived the gold rush years on the Internet, Michael Wolff, Simon & Schuster, 1998 E-Business, E-Business Transformation: Various Research Notes – GartnerGroup, 1999-2002 eCommerce: Formulation of Strategy, Robert Plant, Financial Times/Prentice Hall, 2000 e-Enterprise: Business Models, Architecture, and Components, Faisal Hoque, Cambridge University Press, 2000 e-Strategy Pure & Simple: Connecting your Internet Strategy to your Business Strategy, Michel Robert, Bernard Racine, McGraw-Hill, 2001 Interactive Corporation: Using Interactive Media and Intranets to Enhance Business Performance, Roger Fetterman, Random House, 1997 Mastering the Digital Marketplace: Practical Strategies for Competitiveness in the New Economy, Douglas F. Aldrich, John Wiley & Sons, 1999 Net Ready: Strategies for Success in the E-conomy, Amir Hartman, John Sifonis, John Kador, McGraw-Hill, 2000 Strategy Pure & Simple II: How Winning Companies Dominate Their Competitors, Michel Robert, McGraw-Hill, 1998 Video Economics, Bruce M. Owen, Steven S. Wildman, Harvard University Press, 1992 Articles Better Game Design through Data Mining, David Kennerly, Gamasutra, August 15, 2003; url: http://www.gamasutra.com/features/20030815/kennerly_01.shtml Common Web Traffic Metrics Standards Version 1.0, Treasury Board Secretariat, Web Traffic Definition Exercise- January – February 2003, March 10,2003 E-Commerce Report, by Bob Tedeschi, New advances mean that advertisers are able to quantify the impact of thier online marketing campaigns, New York Times, Monday, November 3, 2003

Fiscal Reality Television - 55 -
Web sites Arbitron Inc www.arbitron.com BBM Canada www.bbm.ca Bell Broadcast and New Media Fund www.bellfund.ca Bell Canada Enterprises www.bce.ca Center for Media Research www.mediapost.com CHUM Interactive www.chumlimited.com Dynamic Logic www.dynamiclogic.com Edison Research www.edisonresearch.com Elytics, Inc. www.elytics.com Impact Mobile www.thinksmith.com Slashdot www.slashdot.com Tequila www.tequila.com WGBH www.wgbh.org Zap2it www.zap2it.com