Embed Size (px)
Citation preview
A sustainable energy model for Spain in 2050 Policy recommendations for the energy transition
May 2016

The following Monitor Deloitte professionals have participated in this report:
• Alberto Amores (Partner)
• Laureano Álvarez (Partner)
• Joaquín Chico (Senior Manager)
• Gonzalo Ramajo (Senior Consultant)
• Miguel Sánchez (Consultant)
• Carmelo Renobales (Consultant)
Additionally, the present report has counted with the professional assistance and guidance of Jose Ignacio Rios, former Partner and Director of the Spanish Monitor offices
Monitor Deloitte is Deloitte's strategic consulting practice, comprised of more than 2,000 professionals across 30 countries. It combines Monitor’s strategic consulting reputation and proprietary methodologies together with Deloitte's deep industry knowledge and implementation capabilities in order to advise leading organizations in the definition of winning strategies and the successful implementation of such.

A sustainable energy model for Spain in 2050 3Un modelo energético sostenible para España en 2050 3
Contents
Objectives and acknowledgements 5
Executive summary 6
1. The fight against climate change 14
1.1 Emission reduction is a global challenge 14
1.2 The EU has been at the forefront of decarbonisation policies 16
1.3 The Emissions Trading System is not providing an adequate price signal of the cost of emissions 19
1.4 Spain has made a major effort to fulfil its commitments for 2020 20
1.5 GHG emissions in Spain in 2013 22
2. The energy model in 2050 25
2.1 Transformations required in the energy model 27
2.2 Investment required in 2016-2050 32
2.3 Benefits of decarbonisation 32
3. The transition of the energy model (2016-2030) 35
3.1 The shift to energy carriers with lower emissions 36
3.1.1 Electrification of light transport 36
3.1.2 Decarbonisation of heavy road transport: modal shift to railways and natural gas vehicle 41
3.1.3 Decarbonisation of railway and sea transport 42
3.1.4 Electrification and gasification of the residential and services sectors 44
3.1.5 Electrification and gasification of the industrial sector 47
3.2 The installation of emission-free electricity generation 48
3.2.1 Renewable generation 48
3.2.2 Conventional generation 52
3.3 The promotion of energy efficiency 55
4. Policy recommendations for an efficient transition 57
4.1 Recommendations on the definition of targets and fiscal policy 58
4.2 Recommendations on the transport sector 58
4.3 Recommendations on the residential, services and industrial sectors 61
4.4 Recommendations on the electricity industry 62
Appendix 65
Model for energy consumption and emission estimate 65
Contact list 67

4

A sustainable energy model for Spain in 2050 5
Objectives and acknowledgements
This report was prepared by Monitor Deloitte as an analytical and participatory reflection on the necessary transition towards decarbonisation. The framework for this transformation lies in complying with the European target for reductions in greenhouse gas emissions and other considerations related to key energy policy matters: security of supply and the competitiveness of the energy system.
We are aware that the debate concerning the low carbon economy is a topic of major importance for our society, because of its undeniable impact on environmental sustainability and also due to its particular complexity. In this context, the objectives of the study are as follows:
• Provide a long-term view of what the compliance with the environmental objectives of such European Union involves by the 2050 time horizon, established as a reference point for defining the transition.
• Develop a medium-term analysis as a guide for the necessary energy transition, with sights set on the intermediate milestone of 2030, in order to support a series of energy policy recommendations for efficient decarbonisation.
This study was backed by the voluntary participation of a prestigious Panel of Experts from a range of backgrounds, in order to share and expand on its starting points, include their viewpoints on the most important matters and identify potential ways forward.
Monitor Deloitte is particularly grateful for the contributions made by the following participants:
• José Claudio Aranzadi. Former Minister of Industry and Energy. Former Minister of Industry, Trade and Tourism. Former President of the National Institute of Industry. Former Spanish Ambassador to the OECD.
• José Donoso. General Director of the Spanish Photovoltaics Union.
• Tomás Gómez San Román. Former Director of the National Energy Commission. Professor of Electrical Engineering at ICAI – IIT. Universidad Pontificia Comillas.
• Pedro Linares. Professor of Industrial Regulation and Economics at ICAI - IIT. Director of BP's Energy and Sustainability Chair. Universidad Pontificia Comillas.
• Vicente López Ibor. Former Director of the National Energy Commission. President of Estudio Jurídico Internacional (law firm).
• David Robinson. Chairman of DR & Associates. Senior Research Fellow at Oxford Institute for Energy Studies.
• Arturo Rojas. Partner at Analistas Financieros Internacionales (consulting firm).
• Javier Vega de Seoane. Chairman of Círculo de Empresarios (Spanish employers’ association).
The contents, analyses, conclusions and recommendations contained in this report do not necessarily reflect the individual opinions of the participating experts. A wide range of sometimes opposing viewpoints and opinions were expressed, which made it possible to study in greater depth and contrast the fundamental issues covered by the study.

6
Executive Summary
The fight against climate change The international community has made a commitment to reach carbon neutrality between 2050 and 2100.In 2011 the European Union confirmed its targets for GHG emission reductions by the 2050 time horizon: between 80% and 95% with respect to 1990 levels.
The Paris Agreement, reached at the XXI United Nations Climate Change Conference (COP 21) of the United Nations Framework Convention on Climate Change, included the commitment to achieve greenhouse gas (GHG) emissions neutrality between 2050 and 2100 in order to limit the global temperature increase.
The 2050 time horizon energy modelA change in forms of energy production and consumption between now and 2050 is vital in order to reduce emissions.Spain's emissions totalled 322 MtCO2 equivalent in 2013, 240 million of which came from energy uses and the remaining 82 million of which came from non-energy uses1.
The European commitment to GHG emission reductions of between 80% and 95% by 2050 will mean Spain, depending on the reference year in question, will have to restrict emissions to a very low level of between 14 and 88 MtCO2. To do
this, regardless of Spain's eventual specific binding commitments, energy uses and non-energy uses will have to reduce their GHG emissions by a very significant amount. In the case of energy uses, this target can only be achieved if the following goals are met simultaneously:
• Substitute current energy carriers for others with lower emissions, by replacing the consumption of oil products, limiting their consumption to uses with no viable emission-free alternative (e.g. air transport or specific industrial processes) with an electrification of demand and the use of energy carriers with lower emissions (e.g. the use of natural gas instead of oil products for sea and goods transport). This would involve:
– Increasing electric vehicle penetration from 0% to almost 100% by 2050.
– Achieving a modal shift of between 40% and 60% of heavy transport, currently undertaken by road almost in its entirety (95% in 2015), to electric railways.
– Stepping up the change to energy carriers with lower emissions in the residential, industrial and services sectors by means of the electrification and gasification of consumption, as applicable. The use of electricity must rise from its current level of 42% of energy consumption to 65-67%2 in 2050.
• Develop a power generation fleet based exclusively on renewable sources. 90-100% of the future electricity generation mix should come from renewables by 2050 (38%3 of generation came from renewables in 2015). Achieving this level of penetration will require the installation of between 145 and 201 GW of renewable power generation capacity (wind and solar PV)4, as well as sufficient back-up capacity to guarantee security of supply.
• Introduce energy efficiency measures to reduce final energy intensity5 by between 1.6% and 2.2%
1 Non-energy fuel uses (e.g. manufacture of plastics), emissions from agriculture and livestock, land uses and forestry and waste. This study did not analyse potential mechanisms for reducing emissions from non-energy uses
2 Calculated as a percentage of final energy
3 Including pumped-storage generation
4 Including the installation of 8 GW of new hydro and biomass generation capacity
5 Final energy demand / GDP
The European commitment to GHG emission reductions of between 80% and 95% by 2050 will mean Spain, depending on the reference year in question, will have to restrict emissions to a very low level of between 14 and 88 MtCO2
A sustainable energy model for Spain in 2050 7
6 Excluding investments related to the modal shift or the electrification of energy uses in fishing and agriculture or in non-energy uses. The value calculated for investments was estimated as the additional investments required to replace machinery and systems that decarbonise the economy, plus specific investments for the installation of renewable and back-up generation assets. Investments in energy transmission and distribution networks do not contemplate the replacement of existing facilities. In the case of investments in centralised storage facilities, estimates suggest the cost will converge with the cost of conventional technology providing the same back-up (e.g. combined cycle facilities)
7 Excluding taxes and charges on the end price
annually (energy intensity has fallen by 1.6% a year in recent years), for instance through measures taken in new building construction, the refurbishment of existing buildings and new industrial processes.
All the aforementioned actions, referred to here as “decarbonisation levers”, are essential if targets are to be met by the 2050 time horizon. In other words, it will not be enough to achieve a 100% renewable power generation mix if fossil fuels are still used for transport, buildings’ thermal uses or industrial processes. Neither will it be enough to centre all efforts on energy efficiency if an emission-free power generation fleet cannot be achieved.
We estimate that the investments that the Spanish economy would have to make between 2016 and 2050 in the main measures involving decarbonisation levers would amount to between EUR 330,000 million and EUR 385,000 million6, depending on the scenario considered.
This decarbonisation process would have three additional positive impacts:
• Less dependence on oil product imports (in 2013, EUR 34,000 million).
• Lower electricity prices7 (from EUR 120/MWh today to EUR 65-75/MWh in 2050) – because despite the need to recoup major investments, these costs will be offset by an increase in demand.
• Greater energy efficiency (electrification reduces the country's total energy consumption).
The transition of the energy model (2016-2030) There are major uncertainties involved in changing over to a decarbonised energy model and, therefore, we need robust and flexible policies during the transition.The large volume of investments to be made, the long timeframes for recouping investments and the uncertainties as to when particular technologies will
be sufficiently mature (in performance and cost terms) for large-scale deployment necessitate an intelligent transition. This transition must ensure the long-term objectives are met efficiently and allow for adaptation to technological and cost developments.
That is why this study pays special attention to the transition from the current energy model to the one we need in 2050. The transition must be robust and flexible, composed of policies and measures we will ultimately not regret, which do not require investments that could become prematurely obsolete or unnecessary as a result of technological developments.
As the analysis in this report shows, this situation requires the use of every available technology and energy source during the transition period. Prematurely dispensing with particular technologies or fuels (e.g. nuclear, coal, oil or gas) between now and 2030 would put at risk the economic efficiency of the transition or security of supply.
In order to analyse the transition towards the 2050 energy model, it is useful to refer to 2030, because it is an intermediate year for which the European Union has established a series of emissions, renewables and energy efficiency targets.
An example is given below of what the energy system could be like in 2030 if we stay on course to meet the environmental objectives efficiently while safeguarding
The investments that the Spanish economy would have to make between 2016 and 2050 in the main measures involving decarbonisation levers would amount to between EUR 330,000 million and EUR 385,000 million

8
security of supply. During this process every technology has an important role to play in the energy model:
• By 2030 it would be necessary to achieve an electrification level of between 35% and 39% of total final energy consumption, and to augment gas consumption to 29-30% through a highly significant penetration of natural gas vehicles (NGV) and an increase in the consumption of gas in the residential, services and industrial sectors.
– Electric vehicle penetration in passenger cars would reach between 7% and 10%, which would require sales of between 600,000 and 900,000 electric vehicles in 2030 (in contrast to the 2,300 sold in 2015). The average consumption of other types of new passenger vehicles (conventional cars and hybrids) would fall to ~4.1 l/100 km by 20218 and ~3.3 l/100 km by 2030 due to increased sales of hybrid vehicles (around 225,000 hybrid vehicles a year vs. 12,000 sold in 2014) and to improvements in the efficiency of conventional vehicles. Hybrid vehicles could serve as a bridge towards 100% electric vehicles, since the initial investments required are more in line with those for conventional vehicles, the need for charging infrastructure is reduced, and there are no issues related to limited performance.
– By 2030 between 20% and 25% of heavy transport should be by electric railway, and the remaining 75-80%9 should be by road.
Natural gas vehicles now constitute a mature technology and as such must play an important
8 The European Union has established the target of average emissions of 95 g of CO2/km for all new vehicles by 2021 for any manufacturer with registrations in excess of 1,000 units. This would result in fuel consumption of 4.1 l/100 km for petrol and 3.6 l/100 km for diesel
9 In Km - tonnes transported
role in the reduction of heavy road transport emissions during the transition
– Electricity consumption in the residential and services sectors should be increased to between 61% and 65%, and gas consumption should be increased to 23-28% of total energy consumption in those sectors. In order to move current values up to this level of penetration, residential consumers will have to invest in new thermal units (heating and domestic hot water).
– In the industrial sector, electricity would have to increase its share from 29% to 34-39%, whereas gas would have to maintain its share of between 44% and 46% by 2030. The role of natural gas will continue to be essential in the industrial sector, because it is more difficult to electrify a large number of industrial thermal processes.
• The electrification of demand described above should go hand in hand with the development of emission-free electricity generation. By 2030 between 30 and 39 GW of renewable capacity would need to be installed. The significant need for new renewable capacity in turn requires major back-up capacity which, during the transition to 2030, must be supplied by fossil fuel power plants, pumped storage facilities, international interconnections, demand response mechanisms and new storage technologies (to prevent emissions through the storage of excess generation from renewables).
It is difficult to forecast when the new storage technologies will become available in terms of volume and at a competitive cost and be able to provide the necessary back-up for peaks in demand. In any event, it seems unlikely that they will be able to provide back-up in excess of a few operating hours before 2030. Likewise, it could be argued that there are reasonable doubts as to the short-term availability of additional capacity from international interconnections or new demand response mechanisms. That is why it will be necessary to make use of all available technologies during the transition:
Prematurely dispensing with particular technologies or fuels (e.g. nuclear, coal, oil or gas) between now and 2030 would put at risk the economic efficiency of the transition or security of supply

A sustainable energy model for Spain in 2050 9
– The shutdown of conventional power plants starting in 2020, before new storage technologies have been developed sufficiently, would require new natural gas power plants.
Combined cycle plants operated for around 1,000 hours in 2015. At this operating level and with the current remuneration mechanisms, the plants in service are not recouping fixed costs and, therefore, there is a risk of early closures.
If regulatory commitments were made to close coal fired power plants currently in service, this would involve new investments of around EUR 3,500 million (up to an extra 9 GW of combined cycle gas turbine plants over and above the current 27 GW).
These new power plants would be condemned to restricted or null operation in the period to 2050, due to the emission reduction targets and the predicted rollout of new storage technologies during those years. In addition, there would be an increase in the wholesale price which could mean an extra cost for consumers of EUR 25,000-35,000 million (equivalent to EUR 9-11/MWh) in 2020-2030.
– Nuclear power plants contribute to mitigating climate change risk since generation is completely free of GHG emissions. The shutdown of the 7,800 MW currently installed, in the event that their useful life was not extended beyond 40 years, would result in additional emissions of around 170 MtCO2 equivalent up to 2030 (equal to half of the Spanish economy's total emissions in 2013).
This base load production would be replaced, largely, by conventional thermal production (when the closures of the nuclear plants begins there will be no other realistic alternative for the base load production). This replacement could entail an increase in the day-ahead market price of up to EUR 8-10/MWh10 in the short term.
Maintaining every back-up technology in the generation mix would mean greater diversification of supply sources, and would mitigate commodity market risk on the international markets. This diversification is a factor affecting security of supply and competitiveness while electricity storage technologies are being developed.
If the current generation capability is managed appropriately, any new generation capacity built in Spain from now on should be renewable, unless there are major increases in demand, or when it is not possible to develop other alternatives in time (e.g. interconnections, pumped storage).
Huge efforts are required in renewable energy penetration, so it is reasonable that these should be shared by a large number of agents, which would foster competition. The combination of technological disruption caused by solar technologies and battery storage and the growing desire of consumers to be self-sufficient in energy terms means that consumers themselves will contribute to investment efforts.
• A reduction in final energy intensity of between 1.4% and 2% a year will be required in energy efficiency on an ongoing basis to 2030 with the need to stay on a similar course until 2050. Numerous and highly disparate initiatives must be rolled out covering virtually all sectors of activity.
It is difficult to forecast when the new storage technologies will become available in terms of volume and at a competitive cost and be able to provide the necessary back-up for peaks in demand. Therefore, it will be necessary to make use of all available technologies during the transition
10 In the short term, combined cycle power plants would be the marginal technology -the last technology to be matched on the day-ahead wholesale electricity market and, therefore, the technology that marks the market price- instead of coal, which is currently the marginal technology. This change in the order of merit could result in an increase in the day-ahead wholesale market price of between EUR 8-10/MWh, which is the average difference between the bid prices for these two generation technologies
10
– Energy efficiency requirements have not been adopted by the residential and service building construction and refurbishment sector in the Spanish market; this issue must be tackled decisively.
– Industrial sectors are highly sensitive to price signals and the economic implications of measures and efforts must be centred on eliminating price signal distortions and, where appropriate, on the introduction of economic incentives or financing mechanisms to back the energy carrier change (to electricity or gas) and the introduction of greater efficiencies.
– The main electrification measures, as in the case of transport mentioned above, not only involve lower emissions resulting from the energy carrier change, but also huge efficiency gains.
RecommendationsPolicies, as well as new legal and regulatory frameworks, must be put in place to create incentives for structural changes. The fight against climate change requires a change in consumption patterns and methods, large-scale use of renewable energy and enormous efforts in energy efficiency. This all requires the mobilisation of major investments in generation, infrastructure, R&D+i, new approaches to building construction, etc. The change will necessitate the involvement and raised awareness of every level of Government and all the regulators, as well as companies and citizens.
Policies, as well as new legal and regulatory frameworks, must be put in place to create incentives for structural changes. Very close coordination in the planning and implementation of actions among the various public institutions will be essential in order for companies and end consumers to be able to take decisions rationally and efficiently.
In order to ensure a gradual and competitive transition that must be bold and show a commitment to changing the structures of our energy model, a number of recommendations are made for decarbonisation policies that confer the necessary importance on the security and competitiveness of the energy model.
• Recommendations on the definition of targets and fiscal policy
Recommendation 1: Establish binding targets for all sectors for 2030 and 2050. It is necessary to establish binding targets for emission reductions in all sectors, especially those not currently subject to the European Trading System (ETS) for emission allowances (known as diffuse sectors: transport, residential, services, etc.); and to create a structure of sub-targets for each sector in relation to the main types of equipment that are in tune with the meeting of sector targets; and to structure and implement measures, incentives and regulations for the various economic agents and energy consumers (some of whom are described in the following recommendations).
Recommendation 2: Introduce a specific regulation to implement an effective price signal of the emissions cost. To this end it is necessary to modify the current tax regime for fuels to tie it in with CO2 emissions. This could be done through a tax applied to sectors not subject to emission allowance trading (residential, services, transport) or through a mechanism designed to ensure an emission allowance price floor (such as that introduced in the UK). A tax or CO2 price floor would provide a clear price signal for the reduction of emissions and raise funds to contribute to R&D+i into new technologies (e.g. storage, renewables) or to cover costs currently included in the electricity tariff. These taxes should be designed to be revenue-neutral; i.e. they should be combined with an equivalent reduction in other taxes and a reduction in the charges included in the electricity tariff.
• Recommendations on the transport sector
Recommendation 3: Foster sustainable mobility in private road transport (electric/hybrid vehicles and charging points). To do this, it is necessary: to develop charging infrastructure in urban areas through the coordination of Municipal, Regional and National authorities and with a special focus on restricted charging points in public thoroughfares11; to establish stimulus packages creating incentives for
11 Supply points located in public thoroughfares the use of which is restricted to particular users
A sustainable energy model for Spain in 2050 11
electric vehicles and residential charging infrastructure, the latter being specifically intended for citizens who do not have a private parking space; to implement an industrial and R&D+i investment strategy to develop electric batteries and motors; to introduce the necessary changes in tariffs and regulations for electricity distribution; and to set up measures for reducing conventional vehicle traffic in cities in order to reduce levels of pollution.
Recommendation 4: Foster the modal shift away from heavy transport towards railways. A logistics infrastructure strategy must be developed including a review of the use criteria of the current railway network in order to maximise its heavy transport capacity, and Governments must dedicate sustained multiannual expenditure to develop basic infrastructure centred on ensuring the modal shift of heavy transport to the railways.
Recommendation 5: Promote natural gas vehicles as a tool for transition in heavy road transport. Appropriate mechanisms and regulations must be developed to provide incentives for the construction of refuelling infrastructure; developing an NGV (Natural Gas Vehicle) development and implementation strategy for heavy transport; and running awareness campaigns to inform transporters and potential users of the advantages of NGVs.
Recommendation 6: Develop sustainable sea transport by fostering the use of natural gas and developing green ports.To do this, it is necessary: to
provide incentives for investments in the employment of natural gas in sea transport; to plan and develop investments in liquefied natural gas storage facilities in ports as the system for refuelling different types of ship; and to foster investment in electricity supply infrastructure for ships docked in ports and promote regulatory changes in electricity distribution tariffs and regulations to adapt them to this new demand.
• Recommendations on the residential, services and industrial sectors
Recommendation 7: Promote emission reductions in the residential sector. To do this, it is necessary: to define a refurbishment plan for existing buildings together with an incentive scheme for new investments; to apply requirements for maximum energy consumption or minimum energy efficiency in buildings; to develop specific regulations for residential buildings (including existing buildings); to define informative measures, through awareness-raising campaigns or campaigns to provide consumers with clear and transparent information on the emissions of machinery or buildings; and to ensure electricity tariffs constitute a price signal that reflects the actual costs of supply and eliminates the costs of supporting public policies (for example, renewables promotion costs), which are not directly related to electricity supply.
Recommendation 8: Promote emission reductions in the services sector. To do this, it is necessary: to define a long-term coordinated action plan with
The fight against climate change requires a change in consumption patterns and methods, the large-scale use of renewable energy and enormous efforts in energy efficiency. The change will necessitate the involvement and raised awareness of every level of Government and all the regulators, as well as companies and citizens

12
specific strategies for each segment of the tertiary sector; to reconcile the roles of owners and tenants, where one is responsible for investments (owner) while the agent (tenant) pays for the energy supply; to set up incentives for investments or facilitate access to the required financing for attractive projects with medium/long-term return perspectives; to establish obligations to make investments in energy efficiency in buildings being refurbished; and to ensure electricity tariffs constitute a price signal that reflects the actual costs of supply and eliminates costs not directly related to the service.
Recommendation 9: Foster the energy carrier change (electrification and gasification) and energy efficiency in industry. To do this, it is necessary: to analyse the impact of the transition of
the energy model on industry while paying special attention to relocation risks for each type of industry; to set up financing mechanisms, tax benefits or other means of providing support, so the industry can make the necessary investments; and to ensure the electricity tariffs of industrial customers constitute a price signal that reflects the actual costs of supply and eliminates costs not directly related to the service.
• Recommendations on the electricity industry
Recommendation 10: Establish a reasonable planning and market framework for the installation of renewable generation and the required back-up capacity to cater for the demand growth. It is necessary to continuously develop and

A sustainable energy model for Spain in 2050 13
update the planning of the necessary capacity in the medium/long term (5-10 years), and to develop a reform of the electricity markets to generate a long-term signal which is efficient to incentivise new investments, as well as to ensure stability and to foster the installation of more mature technologies at a lower deployment cost.
Recommendation 11: Keep in operational conditions the back-up power generation capacity already installed. To do this, it is necessary: to maintain the back-up generation while developing storage technology that is technically and economically viable; to reform the electricity markets so that they provide a sufficiently clear price signal to competitively reward firm capacity; and not to incentivise new investment in back-up capacity which could in the future be underused (thermal generation) or premature investments in technologies that are not yet mature (storage).
Recommendation 12: Extend the operating authorisation for nuclear power plants up to 60 years under the required safety conditions. A decision-making process based on technical criteria and led by the Spanish Nuclear Safety Council is essential.
Recommendation 13: Develop regulations to promote the necessary investments in the grid. It is necessary to clearly define the role of electricity distributors in the development of electric vehicles (charging points) and in the integration of distributed renewable energy, so as to incentivise innovation and the automation of the grid, and to minimise the investment needed for the grid, while developing stable regulations that make it possible to obtain a reasonable return on the capital invested.
Recommendation 14: Turn the electricity tariff into an efficient price signal by changing its structure. To do this, it is necessary to eliminate from the electricity tariff additional costs derived from energy policies (e.g. energy, industrial or territorial policies) which distort the electricity price signal through the assignment of these costs among the various energy uses (this measure could result in reductions in the resources available for financing particular policies, which could be mitigated by applying the new environmental tax regime defined in Recommendation 2); and to shift the current system of tariffs away from a structure in which customers are charged according the voltage level of their connection to the grid and the contracted power towards a system that takes the various types of electricity consumption/use into account.

14
1850
1860
1870
1880
1890
1900
1910
1920
1930
1940
1950
1960
1970
1980
1990
2000
2010
270786
2,668
8,033
34,257
42,968
6,161
7,814
2,104
1,261
World GDP per capita($1990)
Greenhouse gas emissions(MtCO2 equiv.)
(1) First industrial process for the series manufacture of steelSource: World Research Institute; Angus Maddison Project; Monitor Deloitte analysis
1855 Bessemer method (1)
1883 Steam engine
1886 Combustion engine
1910 Model T (Henry Ford)
1914 First commercial flight
1950 Hydraulic perforation
1971 First email sent
1995 Present
BRICS industrial revolution
1. The fight against climate change
Emissions reduction is a global challenge that affects all sectors of any economy and all energy consumers.
The European Union is committed to reducing its greenhouse gas emissions (GHG emissions) by the 2050 time horizon by between 80% and 95% compared to 199012. In addition to this objective, the European Union has established a path towards emissions reduction with targets in 2020 and 2030.
The transposition of the 2020 targets to Spain resulted in a goal of increasing emissions by no more than 30%, taking 1990 as a reference. Spain has made a major effort towards decarbonisation in recent years and is on track to meet the 2020 targets.
12 A Roadmap for moving to a competitive low carbon economy in 2050: The text uses 1990 as the reference year to determine the emission reduction target for the whole EU. However, the year 2005 was used as a reference in order to set national targets for 2020. It would make sense to re-use this year as a baseline for setting national targets for the 2050 time horizon. This would mean that Spanish total emissions in 1990 (286 MtCO2) or 2005 (439 MtCO2) could be taken as a reference. The emissions cap by 2050 could be 14 MtCO2, applying the most restrictive criteria of 95% over the 1990 level, or 88 MtCO2, applying the least restrictive criteria of 80% over the 2005 emissions level
13 Source: IEA: Energy and Climate Change
1.1 Emission reduction is a global challengeGHG emissions such as carbon dioxide (CO2), methane (CH4) and nitrogen oxides (NOx) have accompanied technological and economic development; nevertheless, up until recently its negative potential impact on our environment had not received sufficient attention. Between 1995 and 2013 GHG emissions increased by more than 25%13 and, according to current thinking in the scientific community, in the absence of comprehensive and urgent action, climate change will have severe and irreversible impacts globally.
One of the great challenges facing our society in combating climate change will be to decouple GHG emissions from economic growth (see Figure 1).
Figure 1: Historical evolution of global greenhouse gas emissions and their relationship with GDP growth

A sustainable energy model for Spain in 2050 15
The international community has acquired the commitment to achieve carbon neutrality by 2050-2100
One of the most important factors for this correlation is the use of fossil fuels (mainly coal, oil and natural gas) for energy production, as a pillar of modern economic development until the end of the twentieth century. This was mainly due to:
• Their high calorific value compared with the replaced fuel, which was primarily wood and biomass.
• Their availability in most Western countries or the accessibility from them, as well as the relative ease of extraction, which led to a low cost to consumers.
• The fact that they could be transported in large quantities at low cost and without significant energy losses.
2%8%
3%
3%
30%
25%
6%
5%
13%
23%
8%2%
41%
25%
4%
(1) Only including energy-related CO2 emissions, representing 75% of total greenhouse gas emissions(2) Including CO2 emissions from heat generation(3) Including CO2 emissions from industrial waste and non-renewable municipal wasteSource: World Energy Outlook 2015; Monitor Deloitte analysis
Industry
5,461 MtCO2
7,789 MtCO2
8,484 MtCO2
13,656 MtCO2
Transport
Power generation(2)
Residential and services
CO2 emissions
33,289 MtCO2
Coal
Oil products
Natural gas
Other(3)
44%
36%
19%
1%
Figure 2: Global energy-related CO2 emissions(1) in 2013 broken down by type of fuel and consumption segment
• Ease of storage, thereby making it possible to ensure the supply of energy.
By 2013 the world was consuming annually a total of 9,120 Mtoe of final energy and emitting around 33,000 MtCO2 (see Figure 2). Coal, oil products and natural gas are the main causes of these emissions.

16
14 An estimate made by the Intergovernmental Panel on Climate Change (IPCC), a scientific body established in 1988 under the auspices of the United Nations, whose main objective is to examine and evaluate all the literature on climate change and provide information about its causes, potential impacts and response strategies
Figure 3: Relationship between cumulative carbon emissions in the atmosphere and global warming
Cumulative carbon emissions in the atmosphere(trillions tons of carbon)
!"#$%&'(%()*+")#*+,--./01
0ºC
0.5ºC
1ºC
1.5ºC
2ºC1 trillion
Present: ~0.5 trillion
1770
1810
1850
1890
1930
1970
2010
2050
Source: Trillionthonne; UNFCCC; Monitor Deloitte analysis
To a greater or lesser extent, these fuels are present in virtually all economic sectors, which indicates that a change in energy production and consumption patterns across all economic sectors will be necessary in order to achieve carbon neutrality.
According to the most widespread opinion in the scientific community, our environment is already experiencing the effects of GHG emissions. It is estimated14 that the limit of cumulative emissions in the atmosphere to prevent global warming 2°C above the pre-industrial level -a level above which there is a high risk of irreversible climate change- is 1 trillion tons of carbon. The most optimistic estimates indicate that the world has emitted about half of this limit (by 2011 0.52 trillion tons of carbon had already been emitted) and that this limit will be exceeded by 2040 if the world continues emitting at current rates (see Figure 3).
The Paris Agreement, reached at the XXI United Nations Climate Change Conference (COP21) of the United Nations Framework Convention on Climate Change included the signing parties’ commitment to limiting global warming to "well below 2°C" with respect to pre-industrial levels, and to drive efforts to limit it to 1.5°C and achieve carbon neutrality between 2050 and 2100. Although the agreement is not legally binding, the signing parties reached an agreement to organise, communicate and maintain national contributions in the future, implementing measures to achieve the overall objective set.
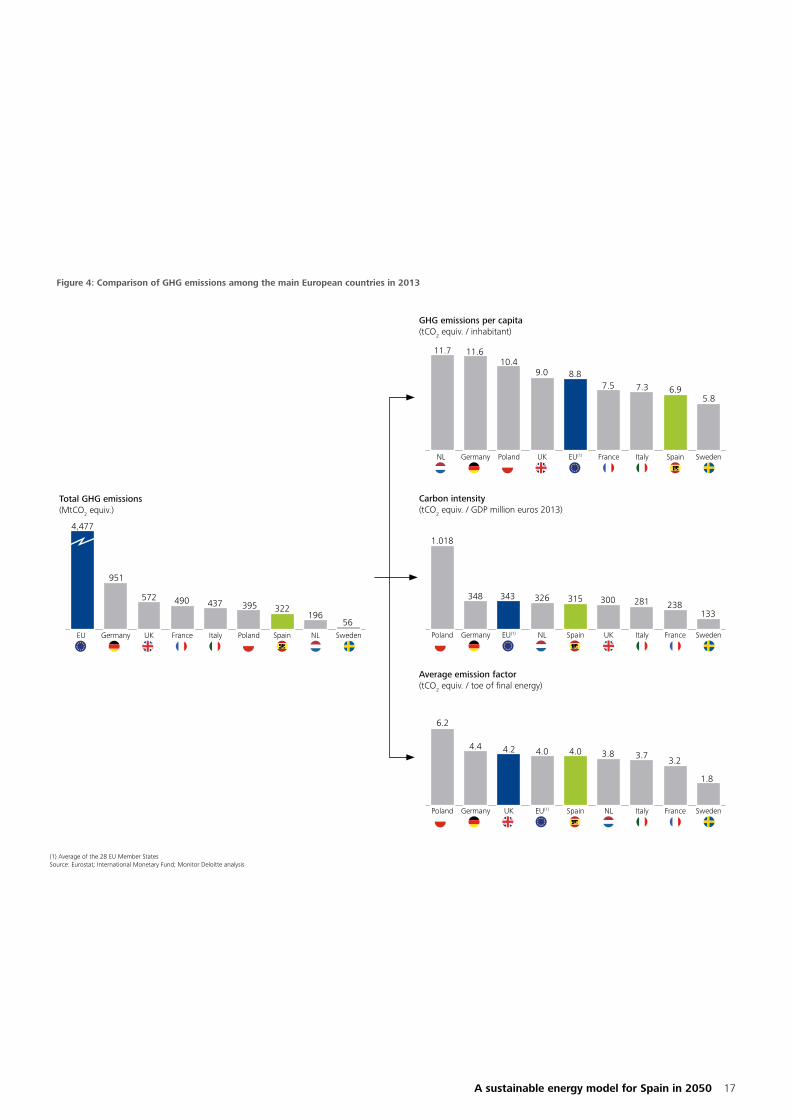
1.2 The EU has been at the forefront of decarbonisation policiesThe EU emitted 4,477 MtCO2 (see Figure 4) in 2013. Among the countries with the highest GDP in Europe, Germany is the country with the biggest amount of emissions in absolute terms and Poland is the country with the highest emissions rate relative to its energy consumption or GDP. Spain lies somewhere in the middle (emissions per final energy consumption and emissions per unit of GDP) or below the European average (emissions per capita).
It is estimated that the limit of cumulative emissions in the atmosphere to prevent global warming 2°C above the pre-industrial level -a level above which there is a high risk of irreversible climate change- is 1 trillion tons of carbon. The most optimistic estimates indicate that the world has emitted about half of this limit
A sustainable energy model for Spain in 2050 17
Figure 4: Comparison of GHG emissions among the main European countries in 2013
(1) Average of the 28 EU Member StatesSource: Eurostat; International Monetary Fund; Monitor Deloitte analysis
Total GHG emissions(MtCO2 equiv.)
SwedenNLSpainPolandItalyFranceUKGermanyEU
4,477
951
572 490 437 395 322196
56
GHG emissions per capita(tCO2 equiv. / inhabitant)
SwedenSpainItalyFranceEU(1)UKPolandGermanyNL
11.7 11.610.4
9.0 8.87.5 7.3 6.9
5.8
Carbon intensity(tCO2 equiv. / GDP million euros 2013)
SwedenFranceItalyUKSpainNLEU(1)GermanyPoland
1.018
348 343 326 315 300 281 238133
Average emission factor(tCO2 equiv. / toe of final energy)
SwedenFranceItalyNLSpainEU(1)UKGermanyPoland
6.2
4.4 4.2 4.0 4.0 3.8 3.73.2
1.8

18
The EU has already set ambitious targets to reduce GHG emissions so that by 2050 its economy does not depend, or does so to a lesser extent, on energy produced from GHG-emitting sources. This target sets a GHG emission reduction of between 80% and 95% by 2050 compared to 1990 emissions. To achieve this objective, the EU has developed a set of benchmark policies and intermediate milestones for decarbonisation (see Figure 5), in particular:
• The 2013-2020 Energy and Climate Change Package, adopted in 2007 by the European Council, laid the foundations for fulfilling the commitments on climate change and energy and included 2020 targets: reduce GHG emissions by at least 20% from 1990 levels, cover 20% of final energy consumption with renewable energy and reduce the consumption of primary energy by 20%.
• The 2030 Framework, adopted in 2014 as a continuation of the previous Energy and Climate Change Package, included a binding target of reducing GHG emissions by 40% compared to 1990 levels. In addition, the Framework proposed another binding target of increasing renewable energy "by at least 27%", although this objective will not be translated into legally binding targets for EU Member States. An energy efficiency target of 27% was also set.
• Roadmap 2050, presented in 2011, which states that by 2050 the EU must reduce its emissions to between 80% and 95% below 1990 levels, through domestic reductions.
Within the framework of the Paris summit, the EU confirmed to the international community its target of reducing its GHG emissions by 40% by 2030.
Figure 5: Evolution of EU GHG emissions for the achievement of environmental targets
6,000
5,000
2,000
1,000
4,000
3,000
0
-1% CAGR
- 4% CAGR
204020101990 20202000 20502030
Roadmap 2050Between -80% and -95% with respect to 1990
2013-2020Energy & Climate Change Package-20% with respect
to 1990
2030 Framework -40% with respect to 1990
Source: European Commission; Monitor Deloitte analysis
MtCO2 equiv.

A sustainable energy model for Spain in 2050 19
1.3 The Emissions Trading System is not providing an adequate price signal of the cost of emissionsIn 2005 the EU established the Emissions Trading System (ETS), which includes industrial, power generation and air transport sectors. Initially, the ETS set an annual emission limit whereby which each emitter, including power generation facilities, received a number of emissions allowances for no consideration. Generally speaking, this limit was progressively reduced and the power plants exceeding the limit had to buy allowances on the market to cover all their GHG emissions and, therefore, other grantees of allowances had lower emissions levels than those received for no consideration.
From 2013 onwards, a new method of progressively auctioning emission allowances was introduced. Currently all Spanish power generation companies under the aforementioned scheme procure all of their emission allowances by this mechanism, whereas other regulated industries maintain a percentage of their allowances for no consideration.
The ETS was designed with the intention of guiding decarbonisation through price signalling. However, its effectiveness has been limited due to the following:
• An excess of allowances resulting from the reduction as a consequence of the economic downturn, which led to a decline in prices from EUR 27/tCO2 in 2008 to less than EUR 8/tCO2 in 2015 (see Figure 6).
• The price of allowances is not adjusted to a valuation of the cost of the environmental externality that GHG emissions represent.
• The ETS only covers a percentage of total emissions and sectors, and does not distribute the efforts among all GHG emitters. Sectors that account for a
large part of the emissions, such as road transport, are not included in the ETS (in Spain more than 50% of emissions are not covered by the ETS: transport, residential, services, etc.).
Reducing the excess of allowances has been one of the EU's objectives and has led to the auctioning of 900 million GHG emission allowances being postponed until beyond 2019, thereby reducing the volumes offered in 2014, 2015 and 2016. This delay in the supply of allowances -known as back-loading- could adjust supply and demand, which would increase prices.
Figure 6: Historical evolution of the price of CO2 emission allowances(1)
201420132012 20152011201020072005 200920082006
40
35
30
25
20
15
10
5
0
EUR/tCO2
Excess emission allowances as a result
of the economic recession à drop in prices in 2007
Review of the emissions cap and withdrawal of emission allowances
from the market in 2008 à upswing in prices that matches record highs
Long-term price of CO2 to implement required decarbonisation initiatives
(1) Spot price of European Union Allowances (EUAs)Source: SendeCO2; Thomson Reuters; Monitor Deloitte analysis

20
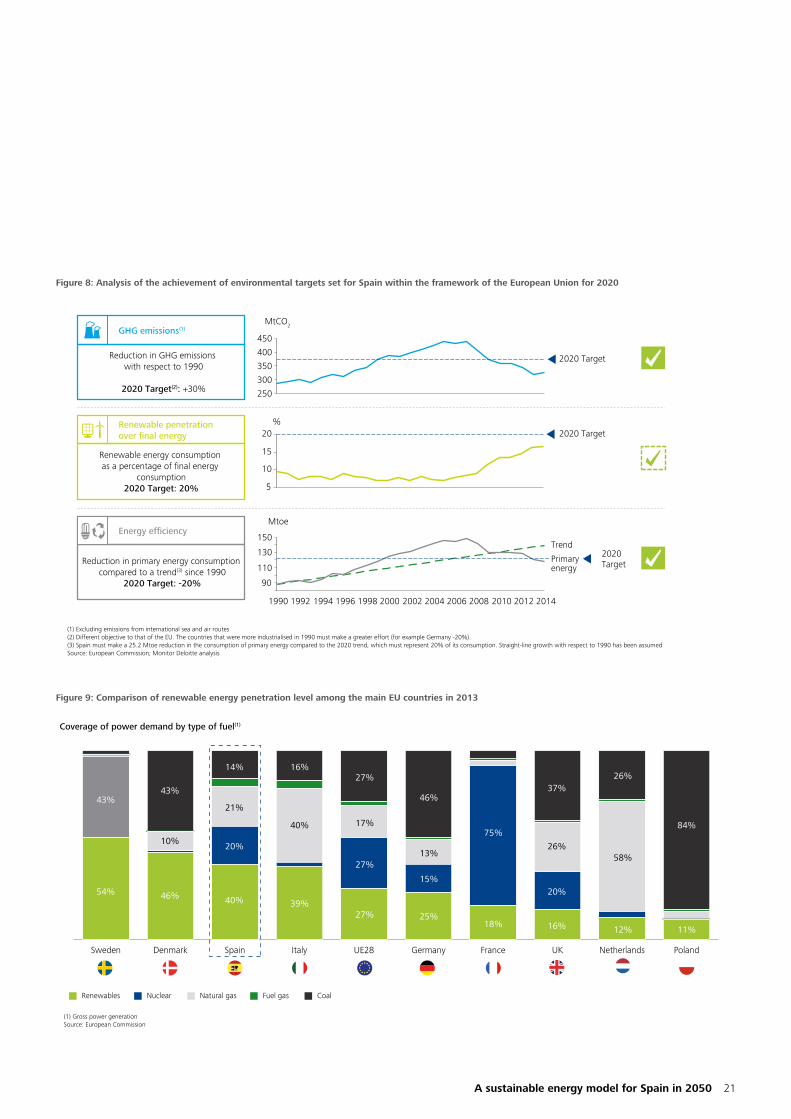
1.4 Spain has made a major effort to fulfil its commitments for 2020 Spain, along with other EU Member States, is actively involved in the fight against climate change through the annual meetings of the Conference of the Parties of the United Nations Framework Convention on Climate Change. As an EU Member State, Spain contributes to the achievement of the European objectives in accordance with the transpositions of these objectives to Spain (see Figure 7).
The transposition of the 2020 targets to Spain resulted in a goal of increasing GHG emissions by no more than 30%, taking 1990 as a reference. Spain is on track to meet 2020 targets, whereas the target related to renewable energy penetration out of final energy
consumption will require an extra effort to ensure its compliance (see Figure 8). Furthermore, the progress made in achieving the objectives has basically been due to the development of renewable power generation and the economic crisis that has led to a reduction in energy consumption, but not to a structural change in final energy consumption.
As far as the electricity generation mix is concerned, Spanish energy policy in recent years has led to significant differences with respect to what is the norm in the European Union: low coal penetration (particularly against some countries known for their support of renewable energy, such as Germany or Denmark) and renewable penetration above the European average and all comparable countries in terms of population and size (see Figure 9).
Figure 7: Analysis of EU environmental targets: 2020, 2030 and 2050
GHG emissions(1)
Renewable penetration over final energy consumption(5)
Energy efficiency
-20% + 30%(4)
20% (10% from renewable energy
in transport sector)
20% saving with respect
to 1990 trend
27% (review in 2020 intended
to increase target to 30%)
27% saving with respect
to 1990 trend
Compared to 1990
2020 Targets 2030 Targets 2050 Targets
Compared to 1990Compared to 2005 Compared to 2005 Compared to 1990
-40%
Between -80% and -95%
N/A
N/A
Non-ETS sectors(2)
-9% -10%
-30%
ETS sectors(3)
-21%
-43%
B
B
B
B
B B B
B
Binding target EU target Spain target
(1) Including emissions of CO2, N2O, NOx,CH4, SO2, HFCs, PFCs, SF6 and NF3. Excluding emissions from international sea and air routes(2) Sectors not covered by the Emission Trading System (ETS): transport except aviation, building construction, waste and agriculture (3) Sectors covered by the ETS: industrial consumption, power generation and air transport(4) Assuming that to Spain is allocated the same ETS reduction percentage as the EU average(5) Percentage of renewable energy consumption over total final energy consumptionSource: European Commission; Monitor Deloitte analysis
A sustainable energy model for Spain in 2050 21
Figure 8: Analysis of the achievement of environmental targets set for Spain within the framework of the European Union for 2020
Figure 9: Comparison of renewable energy penetration level among the main EU countries in 2013
400
250
350
450
300
2020 Target
2020 Target
2020 Target
MtCO2
5
10
15
20%
1990 1992 1994 1996 1998 2000 2002 2004 2006 2008 2010 2012 2014
90
150
130
110Primaryenergy
Trend
Mtoe
GHG emissions(1)
Reduction in GHG emissions with respect to 1990
2020 Target(2): +30%
Renewable penetration over final energy
Renewable energy consumption as a percentage of final energy
consumption2020 Target: 20%
Energy efficiency
Reduction in primary energy consumption compared to a trend(3) since 1990
2020 Target: -20%
(1) Excluding emissions from international sea and air routes(2) Different objective to that of the EU. The countries that were more industrialised in 1990 must make a greater effort (for example Germany -20%).(3) Spain must make a 25.2 Mtoe reduction in the consumption of primary energy compared to the 2020 trend, which must represent 20% of its consumption. Straight-line growth with respect to 1990 has been assumedSource: European Commission; Monitor Deloitte analysis
Coverage of power demand by type of fuel(1)
PolandNetherlandsUKFranceGermanyUE28ItalySpainDenmarkSweden
Renewables Nuclear Natural gas Fuel gas Coal
(1) Gross power generationSource: European Commission
54% 46%
10%
43%
14%
21%
20%
40% 39%27% 25%
18% 16% 12% 11%
84%
58%
26%
20%
26%
37%
75%
15%
13%
46%
27%
17%
27%
40%
16%
43%
22
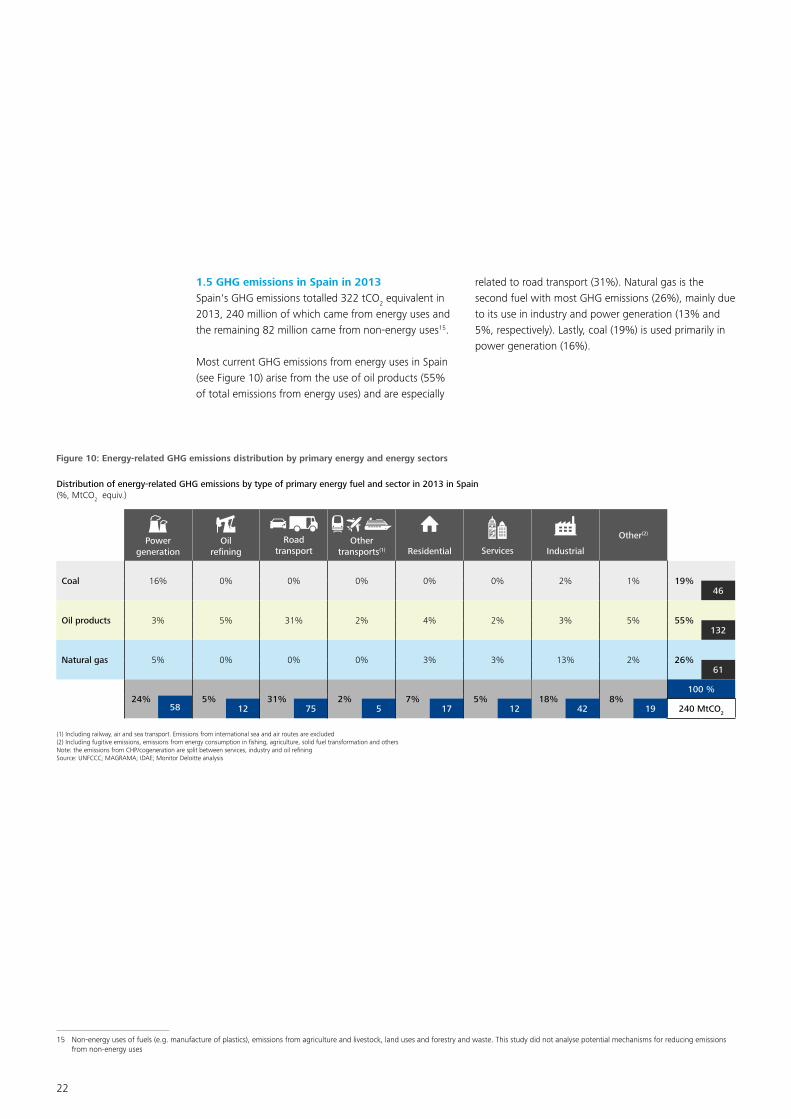
1.5 GHG emissions in Spain in 2013Spain's GHG emissions totalled 322 tCO2 equivalent in 2013, 240 million of which came from energy uses and the remaining 82 million came from non-energy uses15.
Most current GHG emissions from energy uses in Spain (see Figure 10) arise from the use of oil products (55% of total emissions from energy uses) and are especially
15 Non-energy uses of fuels (e.g. manufacture of plastics), emissions from agriculture and livestock, land uses and forestry and waste. This study did not analyse potential mechanisms for reducing emissions from non-energy uses
related to road transport (31%). Natural gas is the second fuel with most GHG emissions (26%), mainly due to its use in industry and power generation (13% and 5%, respectively). Lastly, coal (19%) is used primarily in power generation (16%).
Figure 10: Energy-related GHG emissions distribution by primary energy and energy sectors
Distribution of energy-related GHG emissions by type of primary energy fuel and sector in 2013 in Spain (%, MtCO2 equiv.)
Power generation
Oil refining
Road transport
Other transports(1)
Residential Services Industrial
Other(2)
Coal 16% 0% 0% 0% 0% 0% 2% 1% 19%46
Oil products 3% 5% 31% 2% 4% 2% 3% 5% 55%132
Natural gas 5% 0% 0% 0% 3% 3% 13% 2% 26%61
24% 5% 31% 2% 7% 5% 18% 8%100 %
58 12 75 5 17 12 42 19 240 MtCO2
(1) Including railway, air and sea transport. Emissions from international sea and air routes are excluded(2) Including fugitive emissions, emissions from energy consumption in fishing, agriculture, solid fuel transformation and othersNote: the emissions from CHP/cogeneration are split between services, industry and oil refiningSource: UNFCCC; MAGRAMA; IDAE; Monitor Deloitte analysis

A sustainable energy model for Spain in 2050 23
16 Including large hydropower dams
Figure 11: Comparison of the decarbonisation efforts of each economic sector since 2000 in Spain
In order to show a representative period of recent Spanish energy model developments, the year 2000 has been taken as the starting point. An earlier starting point was not used in order to avoid considering changes in Spanish economic structure not linked to the processes of decarbonisation initiated primarily from the adoption of the Kyoto Protocol (1997), which could affect the conclusions.
Since 2000 GHG emissions have fallen from 390 Mt (291 Mt energy-related) to 322 Mt in 2013 (240 Mt energy-related), representing a 17% reduction, despite an 18% increase in GDP.
Energy-related GHG emissions by economic sector(MtCO2 equiv.)
Total
Other(2)
Other transport(1)
Refining
Services
Residential
Industrial
Electricity
Road transport 79
91
59
18
7
13
9
15
291
75
58
42
17
12
12
5
19
240
2000 2013 Change2000-2013
(%)
-5%
-36%
-29%
-6%
+70%
-8%
-44%
+27%
(1) Including railway, sea and air transport. Emissions from international sea and air routes are excluded (2) Including fugitive emissions, and those from transformation industries, fishing, agriculture and othersSource: MAGRAMA; Monitor Deloitte analysis
• Power generation is the economic sector that has been decarbonised the most since 2000 (see Figure 11), reducing emissions by around 40%. This revolution has been due mainly to the incorporation of more than 30 GW16 of renewable power generation capacity since 2000, equal to more than 31% of the total installed capacity in 2014.
• The sector with the second highest emission reduction is the industrial sector, partly due to the decline in its activity as a result of de-industrialisation, but also due to energy carrier shifts (the percentage of oil products in the consumption of final energy in the industrial sector fell from 23% in 2000 to 13% in 2013).
24
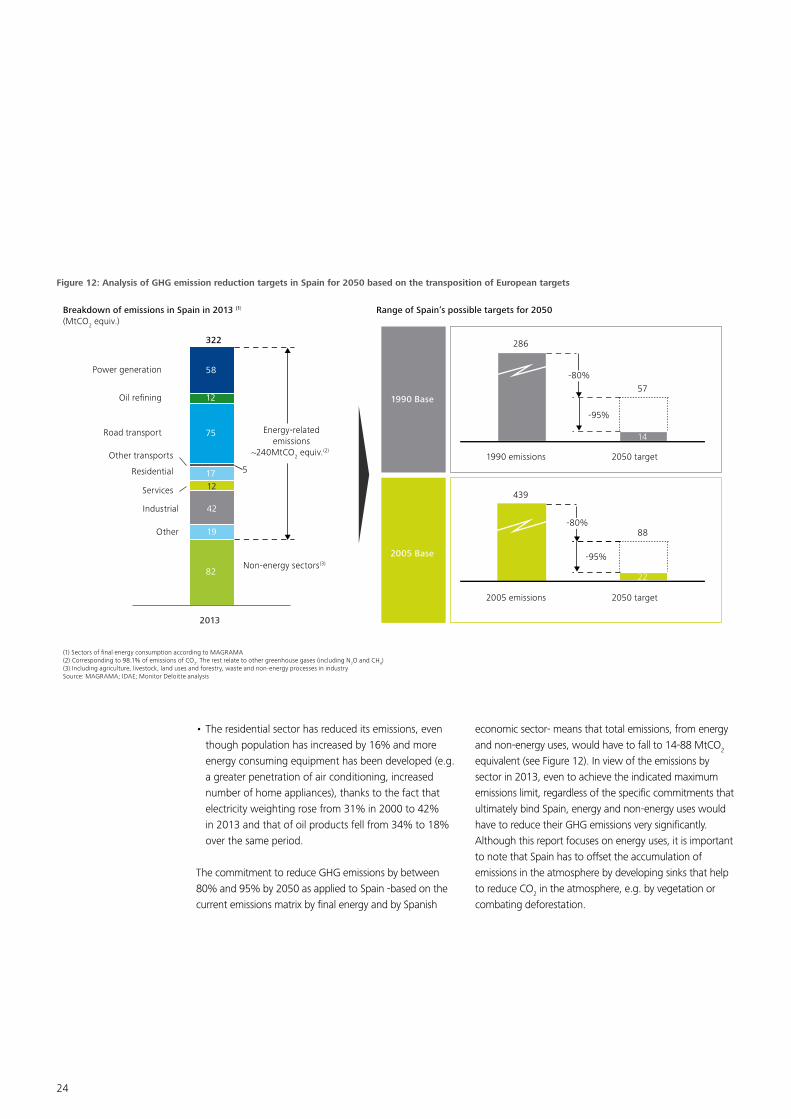
• The residential sector has reduced its emissions, even though population has increased by 16% and more energy consuming equipment has been developed (e.g. a greater penetration of air conditioning, increased number of home appliances), thanks to the fact that electricity weighting rose from 31% in 2000 to 42% in 2013 and that of oil products fell from 34% to 18% over the same period.
The commitment to reduce GHG emissions by between 80% and 95% by 2050 as applied to Spain -based on the current emissions matrix by final energy and by Spanish
economic sector- means that total emissions, from energy and non-energy uses, would have to fall to 14-88 MtCO2 equivalent (see Figure 12). In view of the emissions by sector in 2013, even to achieve the indicated maximum emissions limit, regardless of the specific commitments that ultimately bind Spain, energy and non-energy uses would have to reduce their GHG emissions very significantly. Although this report focuses on energy uses, it is important to note that Spain has to offset the accumulation of emissions in the atmosphere by developing sinks that help to reduce CO2 in the atmosphere, e.g. by vegetation or combating deforestation.
Figure 12: Analysis of GHG emission reduction targets in Spain for 2050 based on the transposition of European targets
(1) Sectors of final energy consumption according to MAGRAMA(2) Corresponding to 98.1% of emissions of CO2. The rest relate to other greenhouse gases (including N2O and CH4)(3) Including agriculture, livestock, land uses and forestry, waste and non-energy processes in industrySource: MAGRAMA; IDAE; Monitor Deloitte analysis
12
42
19
Industrial
82Non-energy sectors(3)
Other
12
75
17Residential
Power generation
Services
Road transport
Other transports
Oil refining
2013
51990 emissions
286
57
2050 target
439
22
14
88
2005 emissions 2050 target
Breakdown of emissions in Spain in 2013 (1) (MtCO2 equiv.)
Range of Spain’s possible targets for 2050
322
58
Energy-relatedemissions
~240MtCO2 equiv.(2)
1990 Base
2005 Base
-80%
-80%
-95%
-95%

A sustainable energy model for Spain in 2050 25
2. The energy model in 2050
This study is based on the premise that EU carbon emission targets for 2050 will be achieved, and economic, regulatory and technological conditions will be developed to facilitate this achievement
This study is based on the premise that EU carbon emission targets for 2050 will be achieved, and economic, regulatory and technological conditions will be developed to facilitate this achievement. Only those combinations of actions and energy policies (which we will call the "decarbonisation levers") that would lead to a strict compliance with those objectives in 2050 are considered, rejecting alternatives that do not allow such compliance or alternatives with a greater uncertainty.
The study is not intended to determine whether a particular action is preferable in terms of economic, regulatory, social, etc. impacts, or if it is more suitable for one sector or another, but rather it aims to analyse what actions must be carried out simultaneously up to 2050 if Spain wishes to fulfil the environmental objective indicated; the next step to take would be to reflect on the opportunities and risks that these actions will entail for the various sub-sectors of the Spanish economy.
There is also a major degree of uncertainty as to whether and when certain technologies, which are key to achieving the decarbonisation, will not only have overcome the R&D phase, but will also be fully operational commercially and able to be massively adopted by consumers (e.g. electric vehicles, battery storage technologies, hydrogen fuel cells or nuclear fusion).
The study is not intended as a technology prospective one, and similarly does not explicitly commit to any specific technology currently being researched or at its development phase, but rather assumes that the technologies needed to decarbonise will be developed and adopted, insofar as they are needed, in the period up to 2050.
However, in order to illustrate, for example, the investment costs to be made, the study is built on those solutions that have already made major progress towards their maturity, and on which sufficient literature has been written and enough estimates of cost ranges have been made for them to be used for the purposes of this analysis. As an example, the study considers the development and full adoption of electric vehicles in the 2050 time horizon, since today the electric vehicle is a reality (although the technology of storage batteries has to evolve and there is a lack of charging infrastructure), but does not consider hydrogen fuel cell vehicles, nuclear fusion or of CO2 capture and storage, given the impossibility of having, today, enough certainty as to their commercial development in the 2050 time horizon and their associated costs.
This is why the study pays special attention to the transition from the current energy model to the one we need in 2050. The transition must be robust and flexible; composed of policies and measures we will ultimately not regret, which do not require investments that could become obsolete, unnecessary or stranded as a result of technological developments.
Specific mention must be made of the treatment that has been given in the study to the energy storage technologies needed by a power generation fleet with a high penetration of non-dispatchable renewable energy. Storage presents a high degree of uncertainty over winning technologies and their future costs. Globally, multimillion euro investments are being made in R&D+i by technological research institutes, universities and material and equipment manufacturers from various sectors (automotive, energy, communications, etc.). The activity and results achieved thus far make possible to

26
feel reasonably confident that technological solutions suited to the needs of security of supply and to the back-up power that the electrical system requires will be achieved, at cost-competitive levels, well before 2050. This development will enable storage technologies to replace mainly thermal technologies in providing back-up power to an electricity system with increasing penetration of intermittent renewable energy.
To all intents and purposes, in view of the impossibility of knowing today which storage technologies will be developed and at what cost, the study considers, especially after 2030, that the back-up power capacity required as a result of the estimated penetration of renewable energy will be installed. These will most likely be storage systems, although we cannot guess what technology will be used to provide this back-up. In any case, it is assumed that the technology to be installed will have a competitive cost compared with current solutions (estimated, for the purposes of the study, using the current cost of conventional natural gas technology).
The actions or "levers" to be considered for the transformation of the energy model are very diverse in nature (see Figure 13) and can be grouped into three broad categories:
• Switch to energy carriers with lower emissions: substitute fuels and energy carriers with high emissions for others with lower emissions (e.g. replacing coal and oil with electricity or natural gas).
• Install emission-free power generation: substitute emitting power generation with renewable energy.
• Promote energy efficiency: actions aimed at making processes more efficient or simply not wasting energy on unnecessary consumption (e.g. improvement of the insulation of buildings or lighting systems controlled by automatic presence-detection).
Figure 13: Characterisation of the decarbonisation levers
Switch to lower emission energy carriers Emission-free power generation Energy efficiency and conservation
• Substitution of conventional light vehicles with hybrid or electric vehicles, or vehicles that consume biofuels or natural gas
• Substitution of conventional heavy vehicles with electric vehicles, or vehicles that consume biofuels or natural gas
• Move away from road transport of goods to railways (modal shift)
• Substitution of conventional sea transport with transport driven by natural gas and development of green ports (supply of emission-free power to vessels berthed in ports)
• Electrification of railway transport
• Increased electrification of the residential and services sectors (basically for heating and cooling uses)
• Use of carriers with lower emissions in the industrial sector
• Electrification of energy consumption in the agricultural and fisheries sectors
• Installation of wind and centralised solar PV generation capacity
• Installation of distributed solar PV generation capacity with and without associated storage
• Installation of the back-up required capacity to ensure security of supply
• Increased energy efficiency in the residential and services sectors (e.g. introduction of low-consumption household appliances, fully installation of LED lighting, etc.)
• Introduction of more efficient energy processes in the industrial sector
• Increased energy conservation in building construction
• Increased efficiency in vehicles with conventional engines
• Installation of electricity demand management systems (active reduction of consumption at peak demand)
A sustainable energy model for Spain in 2050 27
Figure 14: Evolution of annual GHG emissions in a current trend scenario and reduction thereof by type of decarbonisation lever(1)
Figure 15: Evolution of final energy consumption by energy carrier in Spain
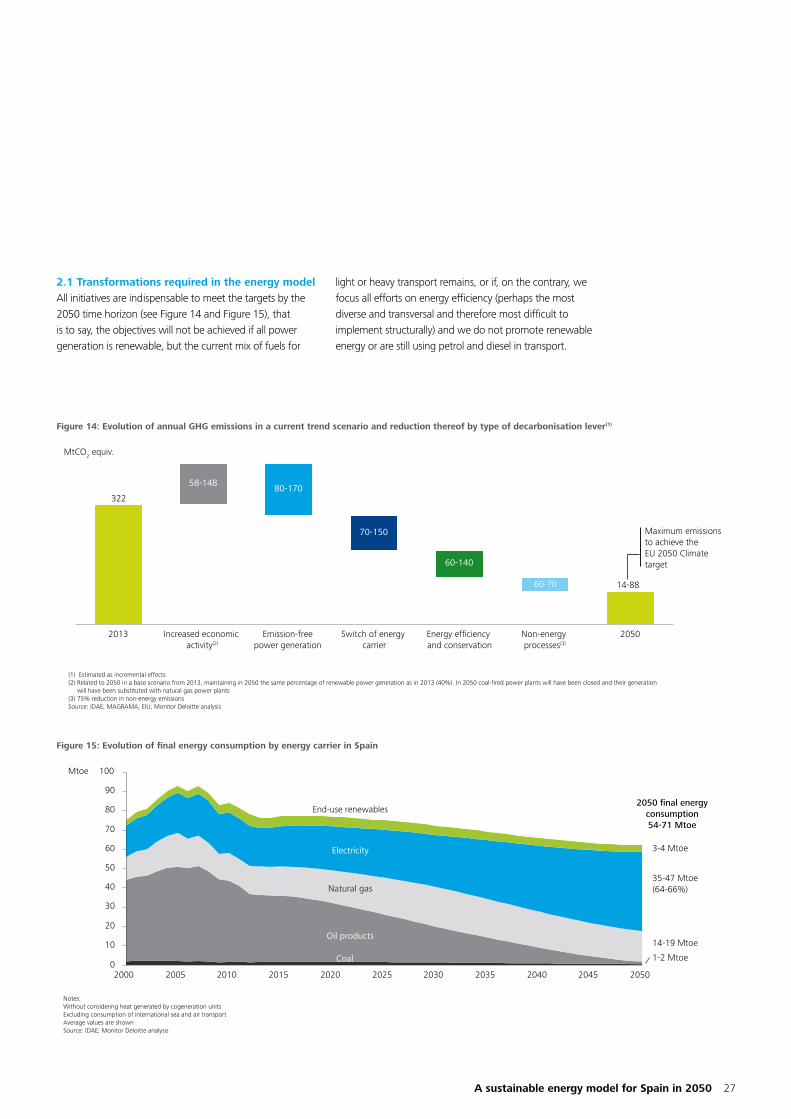
2.1 Transformations required in the energy modelAll initiatives are indispensable to meet the targets by the 2050 time horizon (see Figure 14 and Figure 15), that is to say, the objectives will not be achieved if all power generation is renewable, but the current mix of fuels for
light or heavy transport remains, or if, on the contrary, we focus all efforts on energy efficiency (perhaps the most diverse and transversal and therefore most difficult to implement structurally) and we do not promote renewable energy or are still using petrol and diesel in transport.
MtCO2 equiv.
322
60-70
70-150
80-17058-148
60-140
14-88
2013 Increased economic activity(2)
Emission-freepower generation
Switch of energy carrier
Energy efficiency and conservation
Non-energy processes(3)
2050
Maximum emissions to achieve the EU 2050 Climate target
(1) Estimated as incremental effects(2) Related to 2050 in a base scenario from 2013, maintaining in 2050 the same percentage of renewable power generation as in 2013 (40%). In 2050 coal-fired power plants will have been closed and their generation will have been substituted with natural gas power plants(3) 75% reduction in non-energy emissionsSource: IDAE; MAGRAMA; EIU; Monitor Deloitte analysis
60
20
50
80
100
90
30
10
0
70
40
20202010 20302000 2040203520152005 20502025 2045
Mtoe
End-use renewables
Electricity
Natural gas
Oil products
Coal
2050 final energyconsumption54-71 Mtoe
3-4 Mtoe
35-47 Mtoe(64-66%)
14-19 Mtoe
1-2 Mtoe
Notes:Without considering heat generated by cogeneration unitsExcluding consumption of international sea and air transportAverage values are shownSource: IDAE; Monitor Deloitte analysis

28
In the past, economic growth was associated with a higher consumption of fossil fuels. The situation of crisis since 2007-08 brought with it a temporary reduction in demand for reasons not involved with efficiency and the change in energy carrier. However, when the economic situation improves, if consumption carriers are not changed, the objectives will not be achieved. The increased decarbonisation potential will be achieved with the electrification of demand through renewable generation (see Figure 16). It is important to coordinate actions so that decarbonisation takes place efficiently and, therefore, it is necessary for the installation of new renewable generation capacity to accompany electrification of demand, thereby taking advantage of technological developments and the foreseeable cost reductions.
Figure 16: Decarbonisation potential through demand electrification with renewable energy in Spain
In this context the actions to be taken for the decarbonisation of the energy model would be as follows:
• Substitute the consumption of oil-based products, limiting them to sectors and uses in which there is no viable emission-free alternative available (e.g. air transport or certain industrial processes), through demand electrification and use of energy carriers with lower emissions (e.g. the use of natural gas rather than oil products for heating, sea transport or goods transport).
~M€ 1,900/year in fuel consumption(4)
~M€ 1,400/year in fuel consumption(4)
Emissions of 2.4 million vehicles (9% of the vehicle pool, average penetration by 2030 of fully electric vehicles)(MtCO2 equiv.)
Emissions of 15% of residential and services consumption(1) (increase in the relative weight of electricity by 2030)(MtCO2 equiv.)
Energy vector
Fossil fuel
Electricity with 2013 mix(2)
Electricity with2030 mix(3)
4,6 11,1
3,7
1,6
1,0
0,4
-90% -85%
Incremental electricity demand 4 TWh 43 TWh
9% of fully electric vehicles in the vehicle fleet
15% of final energy consumption of the sectors moves away from other fuels to electricity
(1) The electrification through heat pump has been considered(2) Average electricity emission factor in 2013: 0.25 tCO2/MWh(3) Average electricity emission factor in 2030: 0.11 tCO2/MWh(4) Average petrol price (EUR 1.1/litre), average diesel price (EUR 1/litre) and average natural gas price (EUR 69/MWh)Source: IDAE; MAGRAMA; Monitor Deloitte analysis

A sustainable energy model for Spain in 2050 29
The reduction in consumption of oil products would be achieved through the following changes in the energy model (see Figure 17):
– Increasing electric vehicle penetration from 0% to almost 100% by 2050. These would require the sales of light vehicles to be fully electric from 2040 onwards.
– Achieving a modal shift of between 40% and 60% of heavy transport, currently undertaken by road, to electric railways. This will require significant investments in the railway, port and associated logistics infrastructure that allow the use of the railway network for the vast majority of international and domestic goods transport (except suburban and intra-urban transport, which should be electrified to the maximum extent possible).
– Stepping up the change to energy carriers with lower emissions in the residential and services sectors by means of electrification and, to a lesser extent, gasification of their consumption. Electricity should represent more than 85% of these segments by 2050. The energy carrier shift in these sectors would focus on heating and domestic hot water consumption, estimating that the choice of a new energy carrier will depend on the cost competitiveness of the available technological solutions and on the applicable regulations in these sectors (see more details on these issues in section "3. The transition of the energy model 2016-2030").
Figure 17: Evolution of the vehicle fleet in Spain
Distribution of the passenger car fleet by fuel type (%)
Distribution of heavy transport currently carried by road by type of vehicle(2) (%)
100%
80%
60%
40%
20%
0%
100%
80%
60%
40%
20%
0%
20402020 20302015 2050
Hybrid vehicle(1)
Conventional vehicle
Electric vehicle
2050204020302015 2020
Conventionalheavy transport
Electricrailway
Natural gasheavy transport
Electric heavy transport
(1) Including hybrid vehicles and plug-in hybrid vehicles(2) Expressed in km-tonne transportedNote: Average values are shownSource: Spanish Directorate-General of Traffic (DGT); Eurostat; Monitor Deloitte analysis

30
• Develop a power generation capacity based on renewable energy. 90-100% of the new power generation mix should come from renewable sources by 2050 (38%17 of generation came from renewable energies in 2015). Achieving this level of penetration will require the installation of between 145 and 201 GW of renewable power generation capacity (wind and solar PV)18, as well as sufficient back-up/
storage capacity to guarantee the security of supply (see Figure 18). With appropriate management, any new generation capacity built in Spain from now on should be renewable, except in certain scenarios of major increases in demand, or when it is not possible to develop other sources of energy in time (e.g. interconnections, pumped storage).
Figure 18: Evolution of power generation capacity for the 2050 time horizon
1011
52
27
161-21630-39
6
6
Renewables(2)
Natural gas
Other(1)
40-6340-57
4
80-89
2030
80-9 0-9
115-163
34-35Coal
Nuclear
2050
27
8
26
6
8
2
8
1 118
2015
Required support(3)
Power generation installed capacity(GW)
Possible alternatives:• Storage• Pumping and repowering• Demand response• Supply management• Interconnections• Natural gas plants
108 GW
123-140 GW
207-286 GW
(1) Including fuel gas, cogeneration and others(2) Including hydropower and pumping. Including centralised and decentralised solar generation.(3) Back-up technology depending on the technological development of storage. The data given in the graph equals the backup provided by natural gas power plantsSource: REE; Monitor Deloitte analysis
17 Including pumped-storage generation
18 Including the installation of 8 GW of new hydropower and biomass capacity

A sustainable energy model for Spain in 2050 31
Figure 19: Evolution of energy intensity in Spain up to 2050(1)
• Implement energy efficiency measures. These measures should be based on the annual final energy intensity19 rate achieved in recent years (1.6% annually, considering the impact of the economic crisis on energy demand) and endeavour to maintain it or increase it to 2.2% annually (see Figure 19), through investment and decisive action on energy efficiency and conservation, primarily in new building construction, refurbishment of existing buildings and new industrial processes (see
19 Final energy demand / GDP
20 In 2013 light transport represented 23% of final energy consumption and 18% in terms of primary energy consumption
more details of these levers in "3. The transition of the energy model 2016-2030"). Certain measures included in the energy carrier shift section will have a significant impact on the overall energy efficiency of our energy system (e.g. adoption of electric vehicles, taking into account that they are 3-4 times more efficient than conventional vehicles (see Figure 22) and the current importance of light transport, in terms of both primary and final energy20).
100
80
60
40
20
0
2040200519951990
2025 205020152010
ktoe/thousandsof millions of EUR 2010
2000
204520302020 2035
CAGR +0.4% CAGR
-1.6%
CAGR between -1.6% y -2.2%
(1) Final energy (without considering heat generated by cogeneration units and international air and sea transport) as a percentage of GDPNote: average values are shownSource: International Monetary Fund; IDAE; Monitor Deloitte analysis

32
2.2 Investment required in 2016-2050To achieve all these changes a series of profound, coordinated and consistent measures will be necessary in the field of economic, energy, transport and infrastructure, urban and construction policy, which will involve all levels of Government. These measures are necessary to encourage a major investment effort, sustained over a long period of time. The main actions will entail, between 2016 and 2050, a cumulative investment21 of between EUR 330,000 million and EUR 385,000 million (see Figure 20), which is equivalent to an average annual investment of around EUR 10,000 million (these figures do not include the necessary investments related to the modal shift from heavy transport to rail). In order to put these figures into context, Spain invested in the high-speed railway network ~ EUR 40,000 million until 2013 and it is estimated that the electricity industry has invested between EUR 8,000 million and EUR 10,000 million a year over the last 10 years.
2.3 Benefits of decarbonisationBeyond the contribution to the fight against climate change, decarbonisation would have three positive impacts: lower dependence on energy imports, lower electricity prices for consumers and greater energy efficiency:
• Lower dependence on energy imports: in 2013 Spain had gross imports of 416 million barrels of oil equivalent (our domestic production is negligible) amounting to EUR 34,000 million, while in 2050 consumption is estimated at 6.6-15 million barrels of oil equivalent22 and, therefore, regardless of the oil price at that date, presumably the importation of such oil products would have a total cost well below the current cost.
• Lower electricity prices for the consumer: the average price of electricity for the consumer would fall from the current level of EUR 120/MWh to EUR
21 Excluding investments related to the modal shift or the electrification of energy uses in fishing and agriculture or in non-energy uses. The value calculated for investments was estimated as the additional investments required to replace machinery and systems that decarbonise the economy, plus specific investments for the installation of renewable and back-up generation power plants. Investments in energy transport and distribution networks do not contemplate the replacement of existing assets. In the case of investments in centralised storage facilities, estimates consider that the cost will converge with the cost of conventional technology that provides the same back-up (e.g. combined-cycle power plants)
22 Excluding non-energy uses of oil and international air and sea transport
Figure 20: Needed cumulative investment up to 2050 to decarbonise the Spanish energy model(1)
Billions of EUR 2015
Emission-free power generation(2)
Total
Energy efficiencyand conservation
Energy transmissionand distribution
networks(3)
Switch ofenergy carrier
29-39
330-385
185-251
50-59
38-73M€ 9,400-11,000/year
(1) Excluding investments related to the modal shift, green ports and electrification of the agriculture and fisheries sectors(2) Including centralised and decentralised generation(3) Including electricity and gas networksSource: IDAE; UNESA; MINETUR; GASNAM; IEA; Monitor Deloitte analysis

A sustainable energy model for Spain in 2050 33
23 Electricity demand at power plant bus bars
Figura 21: Evolution of the final cost of power supply
65-75/MWh in 2050 (see Figure 21). The change is basically due to the fact that although significant investments must be made in emission-free generation power plants and networks, which must be borne by consumers, these costs would be diluted by higher demand (258 TWh in 2015 to 410-57023 TWh in 2050) resulting in a decrease in the average price per kWh. The fall in the electricity price by 2030 would also be influenced by the full amortisation of the current tariff deficit and the gradual decrease in the amounts -currently charged in the access tolls- of the financial assistance for the renewable generation plants currently in operation.
2014
119
41%
22%
23%
Energy cost(3) SEIE compensationTransmission and dist. Tariff deficitSpecial regime Other(2)
85-90
2030
80-90
2040 20502020
65-75
~100
73
Final cost of power supply(1)
(EUR/MWh)
Power demand at bus bars (TWhe)
Installed capacity (GW) 108
258
110-111 123-140 165-214 207-286
284-305 305-375 360-475 410-570
Cost calculation assumptions
Evolution of costs 2014(4)
Full cost(generation and grid assets)
(1) Calculated using estimates of costs and demand at power plant bus bars. Excluding taxes, duties and other charges(2) Including: nuclear moratorium, General Radioactive Waste Plan, interruptibility service, imputation of the differences in network losses, CNMC tax and corrective measures (3) Including: energy cost (estimated as the energy-weighted market (day-ahead and intraday) price multiplied by demand), adjustment services, capacity payments and security of supply (4) Estimated for 2014 as the sum of the costs of energy and the costs of the electricity system, divided by total 2020 demand. The minimum range given (EUR 73/MWh) entails the exclusion of non-mainland compensatory items, the tariff deficit and cost of the special regime of production from the cost of the system (2014)Source: ESIOS; CNMC; Monitor Deloitte analysis
The average price of electricity for the consumer would fall from the current level of EUR 120/MWh to EUR 85-90/MWh in 2030 (-30%) and to EUR 65-75/MWh in 2050 (-40%)

34
• Greater energy efficiency: Electrifying demand with renewable energy produces an enormous gain in energy efficiency and, therefore, reduces the total energy consumption in Spain (in fact, it is the measure with the greatest impact on reducing emissions). As an example, substituting light vehicles using conventional engines (which is one of the energy uses that consumes most oil) with the electric vehicle is paradigmatic, since there is a gain in energy efficiency of up to 3-4 times (see Figure 22)24.
24 Estimated gain if the energy expenditure that is made from oil wellhead, transport and refining of crude oil up to refuelling and transformation into kinetic energy in the wheels of a conventional vehicle is compared with the same process performed by generating electricity, charging the battery of an electric car and transforming it in the electric engine into kinetic energy
This gain in energy efficiency can be seen in the estimated decrease in final energy consumption by the 2050 time horizon, in Mtoe, of light and heavy transport, arising mainly from their electrification and the modal shift in transport.
Figure 22: Comparison of consumption and energy efficiency between electric vehicles and conventional vehicles in 2030
Primary energy Final energy“before engine”
Final energy“after engine”
6.0 litres(58.7 kWh) 89%
Refining and transport(1)
Combustion engine
performance5.3 litres(2)
(52.2 kWh)1.4 litres
(13.5 kWh)~25%(4)
24.3 kWh
16.5 kWh
Conventional / electric ratio
240%
~360%
68%
91% 90% 13.5 kWhe15 kWhe(3)
100%
Current mix
Current mix
100% renewable
100% renewable
Generation(1) Transmission and distribution(1)
Electric motor efficiency
Diesel vehicle
Electric vehicle
~350% 100%
(1) Performance in transformation of primary energy into final energy(2) Vehicles with average consumption replaced by EVs. Average consumption of 7 l/100km in 2011 and 1.5% annual improvement. Calorific value of diesel 1,181 l/toe(3) Average consumption of electric vehicles added to the pool, average value of various models currently available on the market(4) Engine losses 60-70%, parasitic losses and while idling 4-6%, transmission losses 5-6%, effective final power 20%-30%Source: Spanish National Energy Commission (CNE); vehicle manufactures; Monitor Deloitte analysis

A sustainable energy model for Spain in 2050 35
3. The transition of the energy model (2016-2030)
There are major uncertainties involved in changing over to a decarbonised energy model and, therefore, we need robust and flexible policies during the transition
The large volume of investments to be made, the long timeframes for recouping investments, and uncertainties as to when particular technologies will be sufficiently mature for large-scale deployment necessitate an intelligent transition that ensures that long-term objectives are efficiently achieved. Dispensing with particular technologies or fuels (e.g. coal, oil or gas) between now and 2030 would endanger the economic efficiency of the transition or the security of supply of the energy model. In this connection, it will be fundamental to consider the following while defining a correct course of action:
• The use of transitional technologies enabling the gradual adoption by the market of other cleaner technologies, as the evolution of the latter reduces their costs to competitive levels.
• Prioritisation of the measures to be implemented based on:
– The volume of emissions, prioritising those measures that act on the main sources of GHG emissions.
– The cost-benefit analysis of each kind of measure, prioritising the most economically efficient when there are several alternatives.
In order to analyse the energy transition towards the 2050 energy model, it is useful to refer to 2030, because it is an intermediate year for which the European Union has established a series of targets for emissions, renewables and energy efficiency.
This section of the study presents a design for the transition until 2030, thus putting us on the path to achieving the environmental objectives for 2050 in an efficient manner and ensuring security of supply. In the transition, all the technologies play an important role in the energy model, optimising costs and investments. A fundamental criterion for the transition is that simply achieving the objectives for 2030 is not enough; rather, the optimal manner in which they are achieved must put us on the best path towards achieving the model required in 2050 without generating unprofitable investments or unnecessary costs arising from policies that later have to be modified.
This transition must go forward in the form of the three major groups of measures described in the previous chapter:
• The shift to energy carriers with lower emissions.
• The installation of emission-free electricity generation.
• The promotion of energy efficiency.
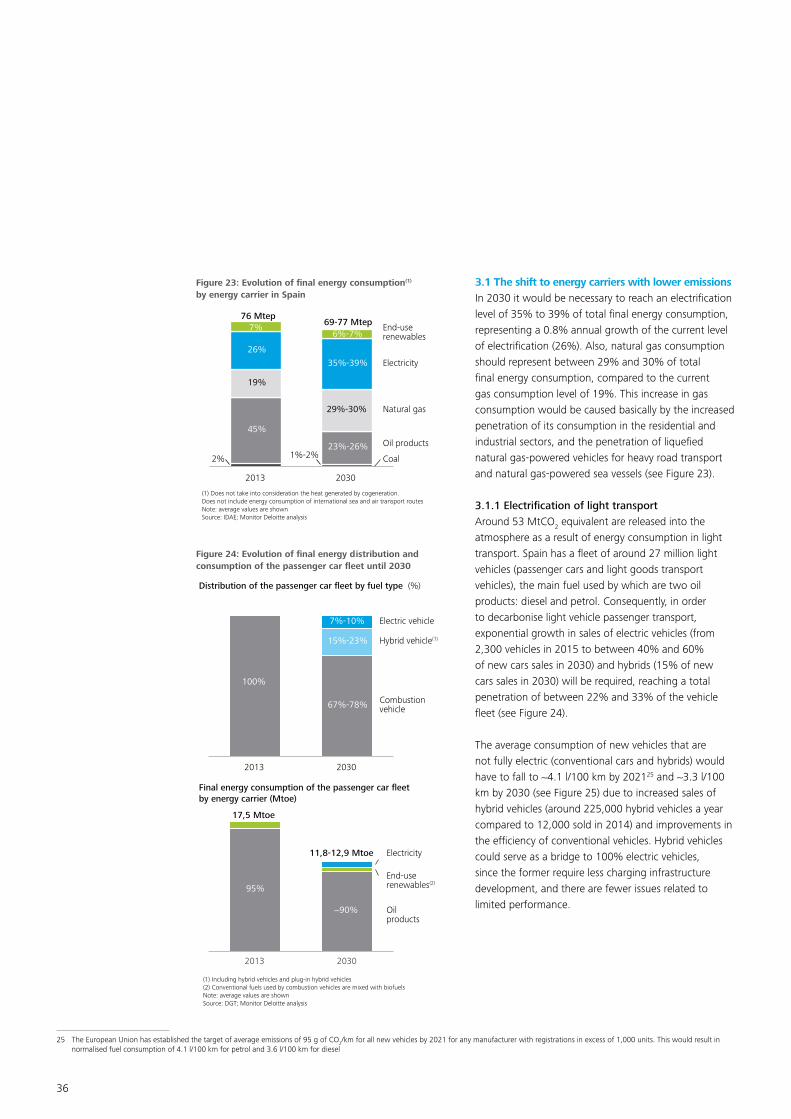
36
3.1 The shift to energy carriers with lower emissionsIn 2030 it would be necessary to reach an electrification level of 35% to 39% of total final energy consumption, representing a 0.8% annual growth of the current level of electrification (26%). Also, natural gas consumption should represent between 29% and 30% of total final energy consumption, compared to the current gas consumption level of 19%. This increase in gas consumption would be caused basically by the increased penetration of its consumption in the residential and industrial sectors, and the penetration of liquefied natural gas-powered vehicles for heavy road transport and natural gas-powered sea vessels (see Figure 23).
3.1.1 Electrification of light transportAround 53 MtCO2 equivalent are released into the atmosphere as a result of energy consumption in light transport. Spain has a fleet of around 27 million light vehicles (passenger cars and light goods transport vehicles), the main fuel used by which are two oil products: diesel and petrol. Consequently, in order to decarbonise light vehicle passenger transport, exponential growth in sales of electric vehicles (from 2,300 vehicles in 2015 to between 40% and 60% of new cars sales in 2030) and hybrids (15% of new cars sales in 2030) will be required, reaching a total penetration of between 22% and 33% of the vehicle fleet (see Figure 24).
The average consumption of new vehicles that are not fully electric (conventional cars and hybrids) would have to fall to ~4.1 l/100 km by 202125 and ~3.3 l/100 km by 2030 (see Figure 25) due to increased sales of hybrid vehicles (around 225,000 hybrid vehicles a year compared to 12,000 sold in 2014) and improvements in the efficiency of conventional vehicles. Hybrid vehicles could serve as a bridge to 100% electric vehicles, since the former require less charging infrastructure development, and there are fewer issues related to limited performance.
Figure 23: Evolution of final energy consumption(1) by energy carrier in Spain
Figure 24: Evolution of final energy distribution and consumption of the passenger car fleet until 2030
2013 2030
76 Mtep
19%
29%-30%
2%
6%-7%
26%
7%
23%-26%
35%-39%
45%
1%-2%
End-use renewables
Electricity
Natural gas
Oil products
Coal
69-77 Mtep
(1) Does not take into consideration the heat generated by cogeneration. Does not include energy consumption of international sea and air transport routesNote: average values are shownSource: IDAE; Monitor Deloitte analysis
Distribution of the passenger car fleet by fuel type (%)
Final energy consumption of the passenger car fleet by energy carrier (Mtoe)
2030
Hybrid vehicle(1)
67%-78% Combustion vehicle
Electricity
End-use renewables(2)
Oil products
7%-10% Electric vehicle
15%-23%
2013
100%
2013
95%
~90%
2030
17,5 Mtoe
11,8-12,9 Mtoe
(1) Including hybrid vehicles and plug-in hybrid vehicles(2) Conventional fuels used by combustion vehicles are mixed with biofuelsNote: average values are shownSource: DGT; Monitor Deloitte analysis
25 The European Union has established the target of average emissions of 95 g of CO2/km for all new vehicles by 2021 for any manufacturer with registrations in excess of 1,000 units. This would result in normalised fuel consumption of 4.1 l/100 km for petrol and 3.6 l/100 km for diesel

A sustainable energy model for Spain in 2050 37
Figure 25: Comparison between average unit consumption and registration of non-fully electric vehicles
2030
Diesel
Petrol
Hybrids(2)~225
230-370
150-240
2025
380-545363
450-750
225-375
250-360440-490
651
2015 2020
670-740
Decrease in conventional car sales due to the exponential entry of electric vehicles
Estimate of the average unit consumption of new conventional and hybrid vehicles(1)
(litres of fuel/100 km)
Annual registrations of conventional and hybrid vehicles(1)
(thousands of vehicles)
~ 5 4-4.1 3.4-3.5 3.2-3.4~-3.8%CAGR
~-2.9%CAGR
~-0.9%CAGR
~1,000
~1,5001,350-1,380
600-840
(1) Unit consumption weighted with the number of registrations of conventional and hybrid vehicles(2) Including hybrid and plug-in hybrid vehiclesNote: average values are shownSource: DGT; ANFAC; European Commission; Monitor Deloitte analysis

38
This expansion of electric mobility in passenger cars contrasts with the current scant level of penetration of the electric vehicle in Spain. This limited development is caused by a series of barriers (see Figure 26) which have been the subject of debate and political action in recent years.
a. Charging infrastructureUntil 2015 (year of the launch of the MOVEA programme, which includes a EUR 1,000 incentive for installing private charging points), the measures aimed at promoting the development of charging points (e.g. the MOVELE programme) had been focused on public charging points located on streets or roads. However, with current charging technology, public charging points can only be used occasionally; owners of electric vehicles basically need their own charging points. Electric cars are not a viable option if owners depend on finding an available charging point in the street, as it is already difficult enough to park on the street in certain urban areas.
Therefore, ownership of electric vehicles is in practice limited to citizens with their own parking space. Even in this case and due to the current tariff structure and hiring conditions, the parking space would need to be located in the same building as the dwelling; this would allow the connection of the charging point to the electric installation of the dwelling and avoid the need for a separate supply agreement.
b. Vehicle performanceThe main advantages of diesel and petrol over electricity are the ease of refuelling and the vehicle range, which are the cause of the two barriers which hinder the development of the electric vehicle with regard to performance:
– Charging speed. Nowadays a rechargeable electric battery requires 6 to 8 hours to fully charge. This time could be reduced to between 30 minutes and 1 hour through ultra-fast charging methods, as opposed to the mere 5 minutes needed to refuel a conventional vehicle.
Figure 26: Main barriers to massive penetration of electric vehicles
Vehicle cost
Charging infrastructure
Vehicle performance
a
b
c
a
Private charging points
• Barriers for deployment in blocks of flats, for example: – Physical space for the installation of charging points – Original electrical installations not adapted (high adaptation costs) to requirements for charging point installation
• Electricity tariff structure may imply a barrier, except in the case of charging infrastructure connection to the building installation
Public charging points
• Low availability of public charging points for those consumers without access to private to parking space and for daytime charging – Low profitability, lack of viable business models due to lack of demand and high O&M costs
– No incentives for developing charging infrastructure
b
Charging speed• Much longer refuelling time for an electric vehicle (ultra-fast
charge: 30 min-1 hour; normal charge: 6-8 hours) than for a conventional vehicle (5-10 min)
Rechargeable battery
• Lower range of electric vehicle (~200-300 km) compared to conventional vehicle (~ 500-700 km)
• Decline in battery performance as a result of repeated charging cycles
cFull cost of vehicle
• Higher sale price than that of a conventional vehicle (offering the same performance)
• Still higher full cost of an electric vehicle, despite its lower O&M costs
• Electricity tariff structure includes items other than power supply and does not represent an efficient price signal
Source: Monitor Deloitte analysis
Electric cars are not a viable option if owners depend on finding an available charging point in the street, as it is already difficult enough to park on the street in certain urban areas
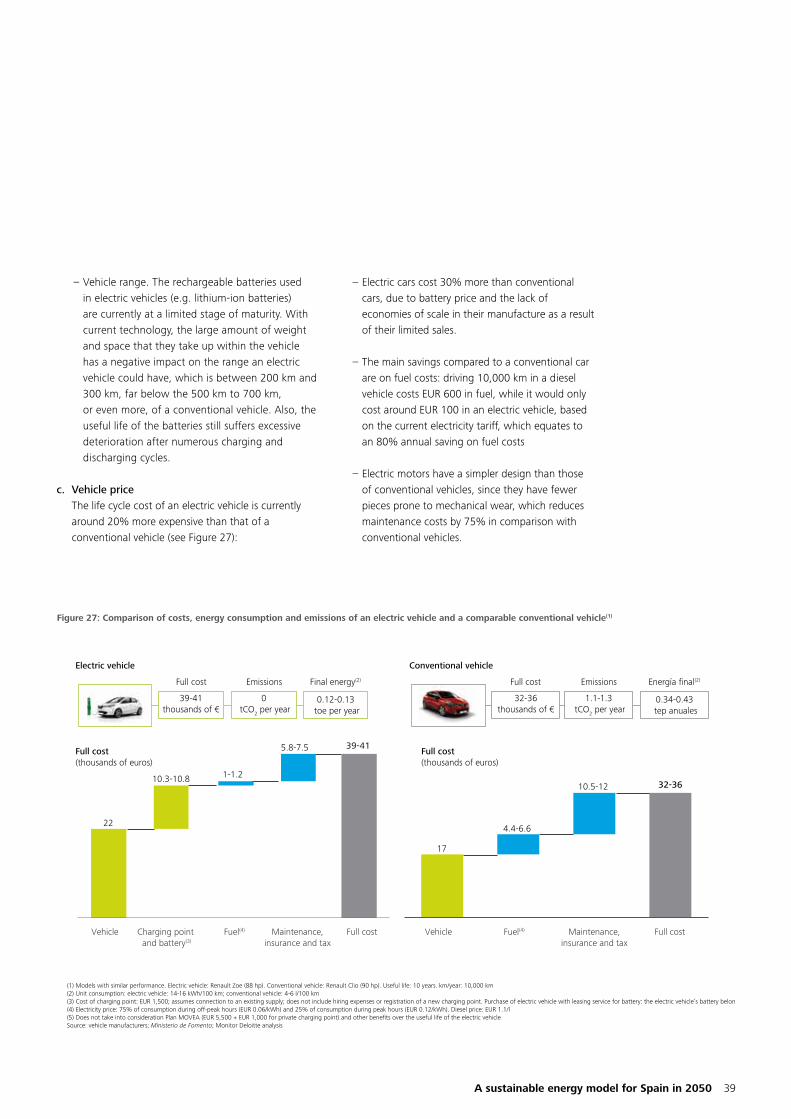
A sustainable energy model for Spain in 2050 39
Figure 27: Comparison of costs, energy consumption and emissions of an electric vehicle and a comparable conventional vehicle(1)
– Vehicle range. The rechargeable batteries used in electric vehicles (e.g. lithium-ion batteries) are currently at a limited stage of maturity. With current technology, the large amount of weight and space that they take up within the vehicle has a negative impact on the range an electric vehicle could have, which is between 200 km and 300 km, far below the 500 km to 700 km, or even more, of a conventional vehicle. Also, the useful life of the batteries still suffers excessive deterioration after numerous charging and discharging cycles.
c. Vehicle priceThe life cycle cost of an electric vehicle is currently around 20% more expensive than that of a conventional vehicle (see Figure 27):
– Electric cars cost 30% more than conventional cars, due to battery price and the lack of economies of scale in their manufacture as a result of their limited sales.
– The main savings compared to a conventional car are on fuel costs: driving 10,000 km in a diesel vehicle costs EUR 600 in fuel, while it would only cost around EUR 100 in an electric vehicle, based on the current electricity tariff, which equates to an 80% annual saving on fuel costs
– Electric motors have a simpler design than those of conventional vehicles, since they have fewer pieces prone to mechanical wear, which reduces maintenance costs by 75% in comparison with conventional vehicles.
Vehicle
10.3-10.8
5.8-7.5
Maintenance,insurance and tax
Maintenance,insurance and tax
39-41
Full costFuel(4)
1-1.2
Charging point and battery(3)
22
17
32-36
Full costVehicle
4.4-6.6
10.5-12
Fuel(4)
Electric vehicle
Full cost (thousands of euros)
Full cost (thousands of euros)
Conventional vehicle
EmissionsFull cost
39-41thousands of €
0.12-0.13 toe per year
Final energy(2) Emissions
1.1-1.3 tCO2 per year
Full cost
32-36thousands of €
0.34-0.43 tep anuales
Energía final(2)
(1) Models with similar performance. Electric vehicle: Renault Zoe (88 hp). Conventional vehicle: Renault Clio (90 hp). Useful life: 10 years. km/year: 10,000 km (2) Unit consumption: electric vehicle: 14-16 kWh/100 km; conventional vehicle: 4-6 l/100 km(3) Cost of charging point: EUR 1,500; assumes connection to an existing supply; does not include hiring expenses or registration of a new charging point. Purchase of electric vehicle with leasing service for battery: the electric vehicle’s battery belongs to the car manufacturer, the final consumer pays the manufacturer on a monthly basis for the use thereof. Battery hire unit cost: EUR 80/month(4) Electricity price: 75% of consumption during off-peak hours (EUR 0.06/kWh) and 25% of consumption during peak hours (EUR 0.12/kWh). Diesel price: EUR 1.1/l(5) Does not take into consideration Plan MOVEA (EUR 5,500 + EUR 1,000 for private charging point) and other benefits over the useful life of the electric vehicleSource: vehicle manufacturers; Ministerio de Fomento; Monitor Deloitte analysis
0 tCO2 per year

40
Spain has a system of incentives with a similar structure to e-mobility leading countries: direct incentives for purchases and tax exemptions (registration and circulation tax) (see Figure 28). Consumers who wish to buy an electric car in Spain are offered the following incentives: EUR 5,500 (directly towards the purchase), EUR 750 (for selling or scrapping the old vehicle), EUR 1,500 (exemption on the registration tax for an equivalent vehicle) and EUR 400 to EUR 500 (exemption on circulation tax over the entire useful life of the vehicle, assuming that it has a useful life of ten years). The incentives in Spain are not as high as those in Denmark and Norway, but they are not the lowest of the analysed countries.
The main barriers to the introduction of electric vehicles are the lack of private charging infrastructure, their performance and their prices. Hybrid vehicles could serve as a bridge to 100% electric vehicles, since the former reduce both infrastructure limitations and the difference between the performance of the electric and conventional vehicle. Specifically:
• Charging time is not necessarily a barrier, since the owner of the hybrid vehicle can decide to use the vehicle as if it were a conventional one in cases in which charging time may be a problem, charging
Figura 28: Summary of incentives for electric vehicles in the six countries with the highest electric vehicle penetration(1) and in Spain
Norway
Netherlands
US
Spain
Sweden
Denmark
France
11,500
15,500
8,100
2,500
7,600
7,000(3) 8,500(4)
5,600
• Tax incentive on purchase: VAT exemption (25%) and registration tax exemption (~ EUR 4,100)
• Tax incentive on purchase: registration tax exemption (EUR 500-11,000)• Periodic tax incentive: circulation tax exemption (EUR 380-1,900)
• Direct incentive for the investment: EUR 5,800 (Federal contribution) and certain states provide additional aid (EUR 1,800 in California)
• Direct incentive for the investment: EUR 5,500 for electric vehicles under EUR 32,000. Additional saving of EUR 750 in case of scrapping old car. Additional saving of EUR 1,000 for installing a private charging point• Tax incentive on purchase: registration tax exemption• Periodic tax exemption: 75% circulation tax exemption
• Direct incentive for the investment: ~ EUR 5,000 based on the difference compared to a comparable conventional vehicle • Periodic tax incentive: circulation tax exemption
• Tax incentive on purchase: registration tax exemption for electric vehicles < 2,000 kg• Periodic tax incentive: circulation tax exemption for electric vehicles < 2,000 kg
• Direct incentive for the investment: EUR 7,000 (maximum 30% of cost of vehicle)• Tax incentive on purchase: registration tax exemption
Saving on the purchase of an electric vehicle(2) (€)
(1) Calculated as a percentage of total vehicle sales in 2014(2) The saving on the purchase of a Renault Zoe has been used as an illustrative example(3) Including direct incentive for investment and registration tax exemption(4) Including the saving arising from the installation of a private charging point and a 75% annual road tax exemptionSource: Ministerio de Fomento; Internal Council of Clean Transportation; IEA; Monitor Deloitte analysis
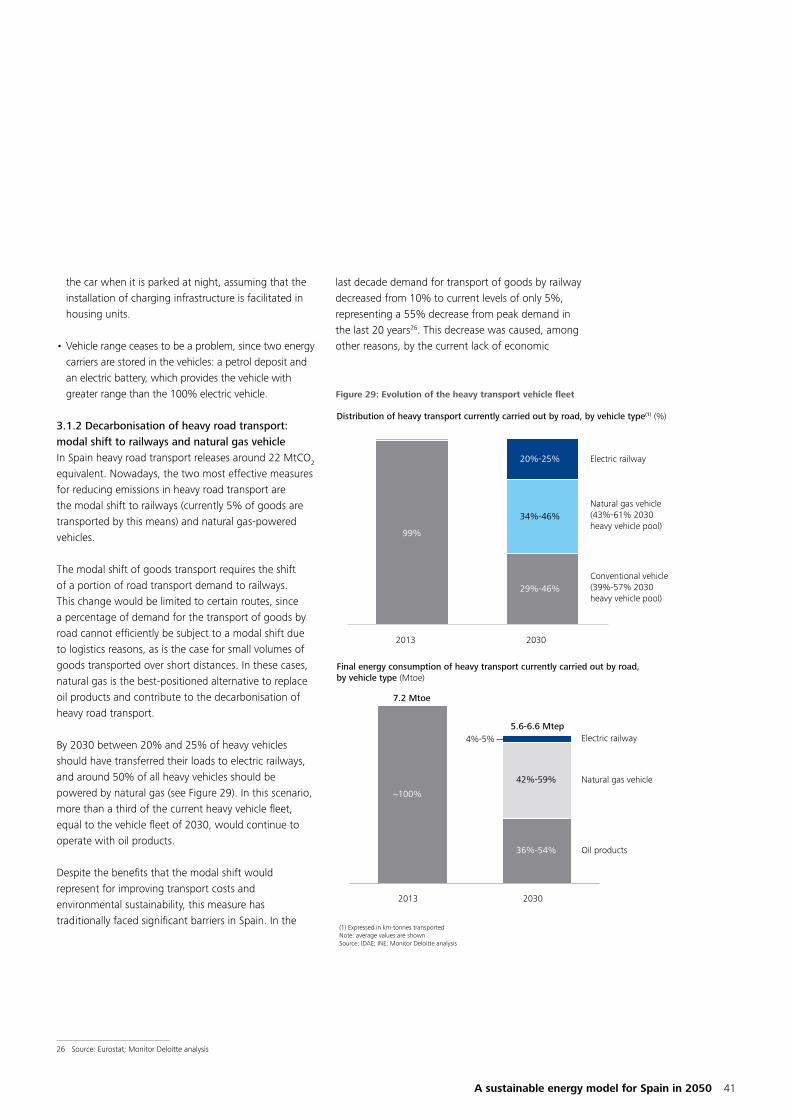
A sustainable energy model for Spain in 2050 41
the car when it is parked at night, assuming that the installation of charging infrastructure is facilitated in housing units.
• Vehicle range ceases to be a problem, since two energy carriers are stored in the vehicles: a petrol deposit and an electric battery, which provides the vehicle with greater range than the 100% electric vehicle.
3.1.2 Decarbonisation of heavy road transport: modal shift to railways and natural gas vehicleIn Spain heavy road transport releases around 22 MtCO2 equivalent. Nowadays, the two most effective measures for reducing emissions in heavy road transport are the modal shift to railways (currently 5% of goods are transported by this means) and natural gas-powered vehicles.
The modal shift of goods transport requires the shift of a portion of road transport demand to railways. This change would be limited to certain routes, since a percentage of demand for the transport of goods by road cannot efficiently be subject to a modal shift due to logistics reasons, as is the case for small volumes of goods transported over short distances. In these cases, natural gas is the best-positioned alternative to replace oil products and contribute to the decarbonisation of heavy road transport.
By 2030 between 20% and 25% of heavy vehicles should have transferred their loads to electric railways, and around 50% of all heavy vehicles should be powered by natural gas (see Figure 29). In this scenario, more than a third of the current heavy vehicle fleet, equal to the vehicle fleet of 2030, would continue to operate with oil products.
Despite the benefits that the modal shift would represent for improving transport costs and environmental sustainability, this measure has traditionally faced significant barriers in Spain. In the
last decade demand for transport of goods by railway decreased from 10% to current levels of only 5%, representing a 55% decrease from peak demand in the last 20 years26. This decrease was caused, among other reasons, by the current lack of economic
Figure 29: Evolution of the heavy transport vehicle fleet
4%-5%
42%-59%
~100%
Oil products
Natural gas vehicle
36%-54%
Electric railway
20302013
Distribution of heavy transport currently carried out by road, by vehicle type(1) (%)
Final energy consumption of heavy transport currently carried out by road, by vehicle type (Mtoe)
99%
2030
Conventional vehicle(39%-57% 2030 heavy vehicle pool)
2013
29%-46%
Natural gas vehicle(43%-61% 2030 heavy vehicle pool)
Electric railway20%-25%
34%-46%
(1) Expressed in km-tonnes transported Note: average values are shownSource: IDAE; INE; Monitor Deloitte analysis
7.2 Mtoe
5.6-6.6 Mtep
26 Source: Eurostat; Monitor Deloitte analysis

42
competitiveness of railways compared to trucks and the lower quality and reliability of service (see Figure 30). A major part of the solution to these problems would consist of developing an adequate infrastructure.
Spain currently has a railway network of over 13,000 km, 10,000 km of which are adapted to the transport of goods27. Spain has a relatively low railway network density in comparison with other major European countries. Consequently, Spain is among the countries with the lowest levels of railway transport of goods in Europe (see Figure 31).
Natural gas-powered engines are mature enough as a technology to play a significant role in reducing emissions in road transport of goods in those cases where there is no profitable electric technology or the conditions required for the modal shift are not met. Natural gas-powered engines can be prepared to consume fuel in two different states: compressed natural gas and liquefied natural gas. Due to the range they require, the best alternative for trucks is liquefied natural gas.
A priori, the main barrier for the deployment of liquefied natural gas-powered heavy vehicles could be the limited availability of natural gas refuelling stations in Spain (see Figure 32). However, given that trucks tend to belong to company fleets or have specifically-assigned refuelling stations, it would only be necessary to adapt the filling stations with high forecasted demand.
3.1.3 Decarbonisation of railway and sea transport Around 6 MtCO2 equivalent are released into the atmosphere as a result of railway transport, sea transport (including only transport between Spanish ports, which is the only sea transport included in the Spain emissions figures) and domestic air transport.
Railway transport of both goods and passengers in Spain is performed by means of electric or diesel locomotives. Currently, 37%28 of railway networks are not electrified; 40% of the final energy consumed in the railway sector is not electric. Most of those lines are not electrified as they are not profitable due to low levels of traffic. As well as the emissions, this is causing the need for new operators to acquire diesel locomotives that can move on non-electrified lines. These operators have diesel locomotives because there are certain lines which
Figure 30: Characteristics of the main causes of the decline in the use of railways for heavy transport
Othercauses
Economic competitiveness
Quality / reliability of service
a
b
c
aLack of economic
Currently, the unit cost per tonne transported by railway is higher than that transported by truck for the following reasons:• Inefficient costs (e.g. manoeuvres, track gauge changes, etc.)• Lack of specific investments in railway goods transport (UIC track gauge,
logistics terminals and adaptation of ports)• Underuse of available railway infrastructure (specifically connections
to customers) which, if it is not transferred to the customer, it is not profitable for the railway company
b
Lack of reliability / quality of service
• Excessive time taken to transfer goods • Numerous administrative formalities and customs controls compared
to other modes of goods transport• Train traffic conflicts or infrastructure bottlenecks to access large cities• Lack of coordination between Spanish public authorities in planning
and developing logistics infrastructure for goods transport
c Other causes
• Lack of railway transport adaptation to new logistics trends and limited use of new information technology
• Lack of cooperation between operators and Spanish public authorities, which hinders intermodal goods transport
• Inefficient liberalisation of the railway market and lack of business projects
• Difficulty in the interconnection with France (line gauge, topography, etc.)
27 Source: Eurostat
28 2012 Source: Eurostat;
In Spain, the modal shift has traditionally encountered high barriers. Spain is among the countries with the lowest levels of railway transport of goods in Europe
Source: Strategic Plan to Promote Freight Railway Transport in Spain (2010); Observatory for intermodal land and sea transport (2011); Spanish Logistics Strategy (2013); press releases; Monitor Deloitte analysis

A sustainable energy model for Spain in 2050 43
Figure 31: International comparison of modes of heavy transport and railway network density in 2013
Figure 32: Locations with natural gas refilling stations and penetration of the natural gas distribution network in 2013
0%
20%
40%
60%
80%
100%
% tonnes-km
0
5
10
15
km network/100 km2 of country
RailwayWaterways(1) Road Railway network
Switz
erlan
d
Austri
a
Swed
en
Finlan
d
German
y
Croati
a
Belgi
umFra
nce
Norway UK
Denmark Ita
ly
Portu
gal
Netherl
ands
Spain
Greece
Irelan
d
(1) Continental transport routes used by vessels of more than 50 tm, including sea routes, canals, rivers, lakes and routes of a similar natureSource: Eurostat; World Bank; CNMC; Monitor Deloitte analysis
Source: CNMC; GASNAM; Monitor Deloitte analysis
>40%
30-40%
20-30%
10-20%
0-10%
Housing units with access to the gas distribution network
Locations with NGV supply units

44
are not profitable for the infrastructure operator (ADIF) and which, consequently, it does not electrify, since it obtains no benefit/price signal for reducing consumption or emissions. However, these diesel locomotives are eventually used in the rest of the network; as a result, today more than half29 of the goods transported by diesel locomotives travel on electrified lines.
The complete decarbonisation of sea transport faces significant logistics barriers. As with road transport, natural gas is a high-potential fuel for decarbonising sea transport. Most of the vessels are currently operated with oil products, specifically HFO (Heavy Fuel Oil) and MDO (Marine Diesel Oil). The use of natural gas should increase until it reaches a penetration level of between 12% and 27% in 2030 (in 2013 consumption of natural gas in this sector was practically zero). To reduce these emissions, the following measures could be taken:
• Foster the installation of liquefied natural gas engines on ships. Natural gas is a technically and economically viable alternative for replacing the consumption of fuel distilled from oil and, unless there is a major technological advance in electricity or hydrogen storage technologies, it would be the option with the lowest environmental impact.
• Promote the installation of scrubbers30 to clean gas emissions from the inside of ships.
Also, the European Union has begun to implement measures to reduce emissions, not only on vessels during transport, but also over the time they are berthed at port. In this regard, advances have been made in the environmental management of ports through the Green Port concept. A Green Port is one which takes environmental sustainability into consideration. The main infrastructure necessary to achieve Green Port status includes most notably:
29 Spanish Railways Foundation;
30 A scrubber is a device which purifies air pollution by eliminating particles or gases through a liquid which removes unwanted contaminant from funnels.
• OPS (On-Shore Power Supply) systems, which relate to the electricity supply infrastructure for vessels berthed at ports. The electricity supply would avoid the need for the ship to use its engines for ancillary use while it is docked, which is a source of noise and emissions of CO2, SOx, NOx and particles that affect air quality in the vicinity of the ports.
• Electricity-powered engines on trawlers and other vessels which normally manoeuvre in ports.
Ports in Northern Europe have been at the forefront of implementing these measures. In Spain the ports of Valencia, Vigo and Castellón have Green Port status as well as other environmental accreditations. Of the ten ports with the highest levels of goods traffic in Spain, only two have Green Port accreditation.
3.1.4 Electrification and gasification of the residential and services sectorsAround 30 MtCO2 equivalent are released into the atmosphere from residential and services buildings, mainly as a result of energy consumption for heating purposes.
Electricity consumption in the residential and services sectors would need to increase to between 61% and 65% of total final energy consumption in those sectors, and gas consumption would have to increase to between 23% and 28% (see Figure 33).
In order to move current values up to this level of penetration, residential consumers will have to invest in new thermal equipment (heating and domestic hot water). The adoption of one form of energy or another will depend on the cost competitiveness of the various technological solutions available, and the applicable legislation, including legislation providing incentives for lower emissions coming from energy consumption. Until now, the main barriers to the

A sustainable energy model for Spain in 2050 45
switch to energy carriers with lower emissions (see Figure 34) have been:
• The price of electricity, resulting from the current tariff structure, which contains energy policy costs which increase the price in comparison with other energy carriers (for residential customers, this means that approximately 50% of the final electricity price relates to taxes, levies and energy policy costs which are financed through the tariff).
• The high level of initial investment in electrical equipment: this difficulty should be mitigated by the evolution of costs and the development of financing models to be offered by the companies selling the equipment.
A detailed analysis of measures would require the differences between types of buildings and subsectors of activity (e.g. residential as opposed to services) to be considered. For this purpose, it would be necessary to consider those differential factors which are important
Figure 33: Evolution of final energy consumption in the residential and services sectors by energy carrier between 2013 and 2030
Evolution of final energy consumption in the residential and services sectors (Mtoe)
2030
Natural gas
Electricity
End-use renewables
Oil products
61%-65%
19%
16%
12%
52%
1-2%
23%-28%
2013
9-11%
24.6 Mtoe23-26 Mtoe
Note: average values are shown. Does not include heat generated by cogenerationSource: IDAE; Monitor Deloitte analysis
Figure 34: Comparison of the main alternatives of thermal equipment for households
Full cost for the final consumer of various domestic hot water and heating supply options in an average household(1)
(thousands of EUR2015)
Natural gas boiler Heat pump Current tariff
Heat pump Revised tariff
Maintenance4.0
0.6
2.24.0
Fuel
Equipment(2)
3.75.8
1.3
9.0
1.3
10.8
2.2
Diesel boiler
26 0 0
100% renewable100% renewable
10216169
36
79
Electric boileRevised tariff
12.7
1.8
Electric boilerCurrent tariff
1.8
20.0
0
100% renewable100% renewable
102
0
161
0.6
0.6 0.6
Total emissions (tCO2)
Final fuel cost for the consumer(3)
(EUR/MWh)
(1) Annual thermal consumption of 8.200 kWh. Efficiency: natural gas boiler (94%), diesel boiler (90%), heat pump (340%), electric boiler (99%). Emission factors: natural gas (0,2 kgCO2/kWh), diesel (0,26 kgCO2/kWh) and electricity (0 kgCO2/kWh). Useful life: 15 years(2) Represents variable costs, including variable tolls. Does not include fixed toll(3) Including installationSource: IDAE; CNMC; market data; Monitor Deloitte analysis

46
for the development of specific measures, and which relate mainly to:
• Type of owner/administration (private companies, householders and public authorities or bodies). The administrators of buildings could have a professionalised energy management system in place which, inter alia, is linked to reducing the energy consumption of the buildings. On the other hand, household customers are not so sensitive in terms of reducing energy consumption and/or are not aware of how to do so.
• Renovation cycles. Certain buildings in the services sector, such as offices, hotels and shopping centres, have renovation cycles for equipment and even parts of buildings (e.g. façades) which are shorter than those in the residential sector. This would enable
the most frequent renovation projects to be taken advantage of in order to introduce improvements to the energy equipment.
• Cost control. The services sector periodically monitors costs and actively seeks ways to reduce operating costs. In general, residential customers are less sensitive to monthly energy costs (and more sensitive to large investments).
In this context, residential customers need both positive incentives (e.g. aid for investments) and negative incentives (e.g. limits on the use of the most pollutant fuels). If there are appropriate emission cost signals, the services sector consumer should evolve more naturally towards more efficient fuels with lower levels of emissions.

A sustainable energy model for Spain in 2050 47
Figure 35: Distribution of industrial consumption by energy carrier in Spain between 1990 and 2013
3.1.5 Electrification and gasification of the industrial sector65% of industrial energy consumption relates to fossil fuels, mainly natural gas. The relative weight of fossil fuels in industrial energy consumption has remained steady in recent years, although since 2000 the Spanish industrial sector has made significant efforts to replace the consumption of oil products and coal with natural gas (see Figure 35).
These efforts have resulted in the reduction of emissions in the industrial sector from 59 MtCO2 equivalent to 42 MtCO2 equivalent between 2000 and 2013. Each industrial subsector has different specific consumption needs and, with current technological development, certain energy uses and processes are not viable without the consumption of fossil fuels. In addition, within each subsector, each facility and process can present its own particular issues which must be considered when conducting a technical analysis of the potential of carrier change.
The Spanish economy, like other developed economies, is undergoing: a process of placing greater emphasis on the services sector; automation (it is estimated that 45% of manual activities today could be automated; this percentage is expected to be even higher for production activities); and digitalisation (increased connectivity between systems and development of products and services based on mobile or 100% web-run programmes). This entire process should result in a higher penetration of robots and machinery/systems that work basically with electricity.
In order to continue the decarbonisation process in the industrial sector, natural gas must remain the most important fuel due to its role in certain thermal processes in which there is no other energy carrier with lower emissions available. The relative weight of electricity must also increase, e.g. in the steel manufacturing industry, with the introduction of electric arc furnaces. The share of electricity in final
27%
9%
29% 29%
5% 7%
17%
36%44%
29%
23%13%
7% 8%19%
201320001990
0 %
60 %
40 %
100 %
20 %
80 %
1993 1997 200319991991 1995 20052001 2013201120092007
Electricity
Natural gas
Coal
Final use renewables
Oil products
CAGR 1990–2013(%)
20 Mtoe 25 Mtoe 21 Mtoe
-3.8%
-3.3%
+4.3%
-1.0%
+0.4%
Source: IDAE; Monitor Deloitte analysis

48
energy consumption would need to increase from 29% to between 34% and 39% between 2013 and 2030 (see Figure 36).
In order for the industry to make the necessary investments to reduce its emissions, the necessary incentives must be established and it must be ensured that there are no relocation risks:
• Investment decisions are usually made based on rational assessments. However, practical experience demonstrates that industrial consumers tend to be more demanding about the energy efficiency investment recovery period than when investing in their own production processes. In these cases, investment financing mechanisms would be necessary.
Figure 36: Evolution of final energy consumption in the industrial sector between 2013 and 2030
Evolution of final energy consumption in the industrial sector (Mtoe)
29%
44%
13%
2013
7%
8%
End-userenewables
Oil products
2030
Electricity
8%-9%
Natural gas44%-46%
Coal
34%-39%
5%-7%3%-4%
21 Mtoe
22-26 Mtoe
Note: average values are shown. Does not include heat generated by cogenerationSource: IDAE; Monitor Deloitte analysis
• During the industry energy model transition, special attention must be paid to relocation risks in each industrial subsector in order to identify and mitigate potential negative externalities of environmental policies. Locally applied methods, such as, for example, the creation of a tax on GHG emissions, could result in disincentives for the industry players remaining in the Spanish economy, without actually eliminating emissions. In this case, industrial relocation could be caused, transferring such emissions to another country with less restrictive environmental regulation.
These must be fundamental aspects to be considered when taking energy policy decisions in relation to this economic sector.
3.2 The installation of emission-free electricity generationThe electrification of the demand needed for decarbonisation must be accompanied by the development of an emission-free generation capability. According to the aforementioned energy carrier shift estimate, demand for electricity would grow by an average between 1% and 2.4% per year until 2030, reaching between 305 TWh and 375 TWh31 (see Figure 37).
Increased demand would occur in line with a certain flattening of the demand curve, as reflected by the reduction in the peak load coefficient32 (see Figure 37), which decreases from 50% (2010) to 36% (2030). This decrease in peak load coefficient will be caused by the greater penetration of demand response technologies, due to the development of storage and the increase in demand for electricity with certain management capacity, such as the electric vehicle charging.
3.2.1 Renewable generationIn order to achieve the EU’s 2030 Climate & Energy targets, all the electricity demand growth must be covered by renewable energy, except in certain scenarios of major increases in demand, or when it is not possible to develop other sources of energy in time (e.g. interconnections, pumped storage).
31 Electricity demand at power plant bus bars
32 The peak load coefficient is the ratio between the annual maximum instantaneous demand, known as peak demand, and average hourly demand
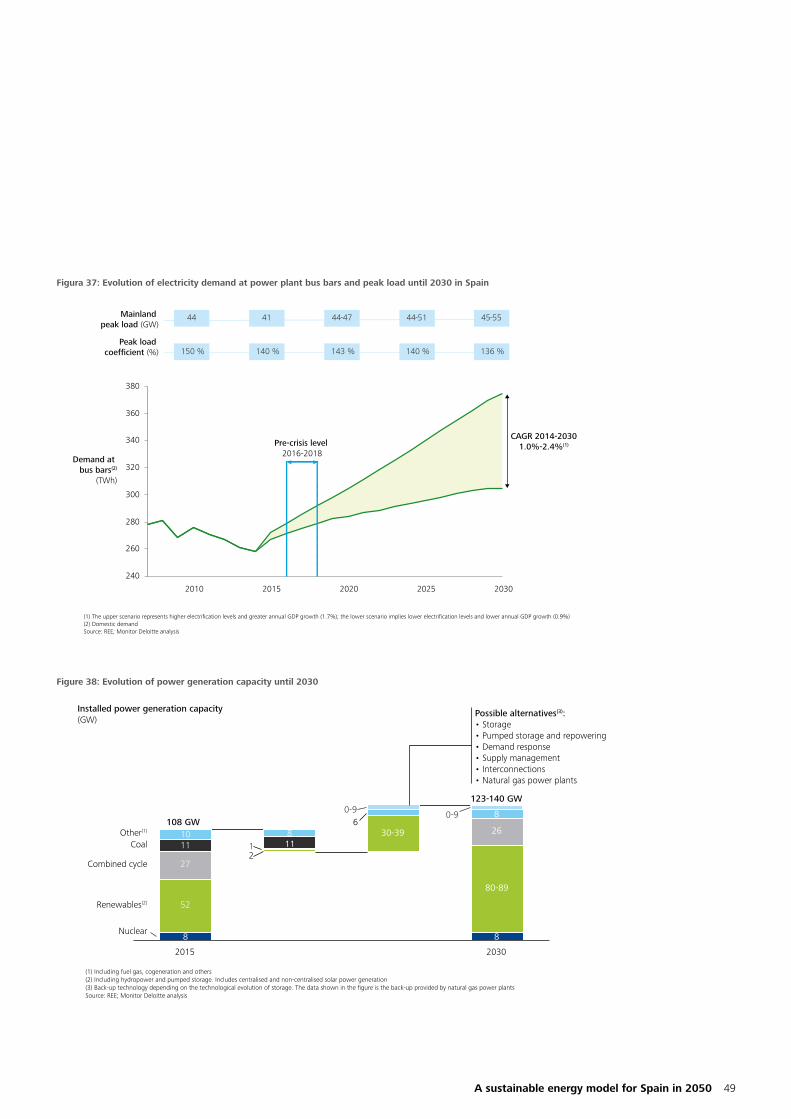
A sustainable energy model for Spain in 2050 49
Figura 37: Evolution of electricity demand at power plant bus bars and peak load until 2030 in Spain
320
360
380
340
300
260
280
240
2025 20302010 20202015
136 %140 %143 %140 %150 %
45-5544-5144-474144
Demand at bus bars(2)
(TWh)
CAGR 2014-20301.0%-2.4%(1)Pre-crisis level
2016-2018
Mainland peak load (GW)
Peak load coefficient (%)
(1) The upper scenario represents higher electrification levels and greater annual GDP growth (1.7%); the lower scenario implies lower electrification levels and lower annual GDP growth (0.9%)(2) Domestic demandSource: REE; Monitor Deloitte analysis
Figure 38: Evolution of power generation capacity until 2030
Installed power generation capacity(GW)
8
27
10
52
2015
11CoalOther(1) 2630-39
60-9 0-9
2
Nuclear
8
1
Renewables(2)
118
Combined cycle
8
2030
80-89
Possible alternatives(3):• Storage• Pumped storage and repowering• Demand response• Supply management• Interconnections• Natural gas power plants
(1) Including fuel gas, cogeneration and others(2) Including hydropower and pumped storage. Includes centralised and non-centralised solar power generation(3) Back-up technology depending on the technological evolution of storage. The data shown in the figure is the back-up provided by natural gas power plantsSource: REE; Monitor Deloitte analysis
108 GW
123-140 GW
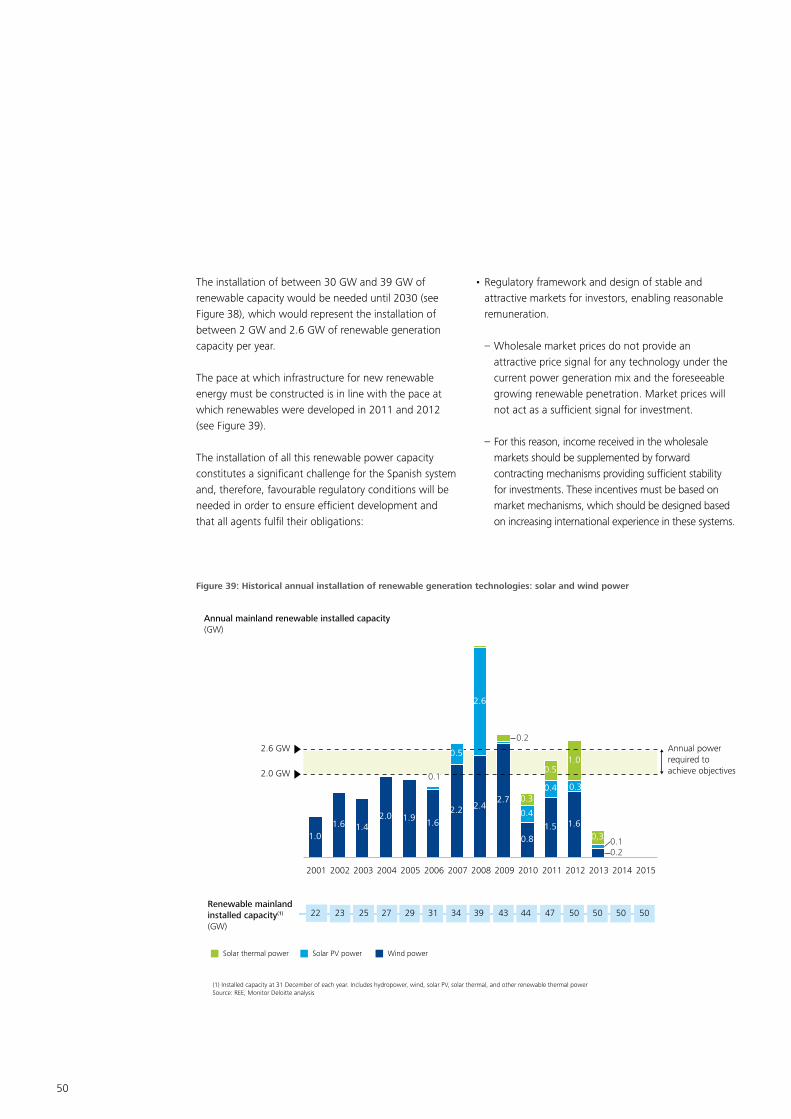
50
The installation of between 30 GW and 39 GW of renewable capacity would be needed until 2030 (see Figure 38), which would represent the installation of between 2 GW and 2.6 GW of renewable generation capacity per year.
The pace at which infrastructure for new renewable energy must be constructed is in line with the pace at which renewables were developed in 2011 and 2012 (see Figure 39).
The installation of all this renewable power capacity constitutes a significant challenge for the Spanish system and, therefore, favourable regulatory conditions will be needed in order to ensure efficient development and that all agents fulfil their obligations:
Figure 39: Historical annual installation of renewable generation technologies: solar and wind power
• Regulatory framework and design of stable and attractive markets for investors, enabling reasonable remuneration.
– Wholesale market prices do not provide an attractive price signal for any technology under the current power generation mix and the foreseeable growing renewable penetration. Market prices will not act as a sufficient signal for investment.
– For this reason, income received in the wholesale markets should be supplemented by forward contracting mechanisms providing sufficient stability for investments. These incentives must be based on market mechanisms, which should be designed based on increasing international experience in these systems.
Annual mainland renewable installed capacity (GW)
2015
0.3
1.5
0.2
0.4
2010
0.4
2002 2008
2.0
0.1
2007
1.4
2009
0.5
2005
2.6
2003 2004
2.4
2006
2.7
0.5
1.6
0.2
1.9
2001
1.01.6
2014
1.0
0,30.8
0.3
2011
2.2
2.0 GW
2013
2.6 GW
1.6
0.1
2012
Solar thermal power
22 23 25 27 29 31 34 39 43 44 47 50 50
Annual power required to achieve objectives
Renewable mainland installed capacity(1)
(GW)
50 50
Solar PV power Wind power
(1) Installed capacity at 31 December of each year. Includes hydropower, wind, solar PV, solar thermal, and other renewable thermal powerSource: REE; Monitor Deloitte analysis

A sustainable energy model for Spain in 2050 51
• There are significant efforts to be made in relation to the penetration of renewable energies, and the distribution of those efforts between many players will help the aim to be achieved. The technological disruption caused by solar technologies and small-scale battery storage, combined with the growing desire of consumers to be self-sufficient in energy terms, means that consumers themselves will contribute to investment efforts. In this future context, distributed generation and self-consumption may play a very important role and, accordingly, it will be necessary to allow free access and to impose no penalties for this form of energy production. In this connection, certain issues must be taken into consideration:
– For example, there is a cost difference between centralised solar PV generation plants where orientation, sun tracking and operation can be optimised, and small distributed facilities.
– Current electricity tariffs provide incentives for self-consumption because they include levies, taxes and cost overruns (see Figure 40). Efficient development of distributed generation requires a tariff which only reflects genuine supply costs.
– An efficient scheme for distributed generation must enable the customer to feed excess energy to the grid at market prices. Today this is possible for the smart meters with remote management installed.
Figure 40: Comparison of the electricity tariff with the generation cost of a solar distributed PV in 2015
EUR/MWh
185-205
200
150
Cost of distributed generation
• Economic balance: Measurement of the excess power injected into the network at the hourly market electricity price
Electricity price with current tariff
• Variable: power, capacity payment, and interruptibility and adjustment services
• Fixed: networks, non-mainland systems, special regime, security of supply, deficit settlement and other(2)
Electricity price with revised tariff
• Variable: power, capacity payment and interruptibility and adjustment services
• Fixed: networks and other(2)
(1) Calculated as the weighted cost of the electricity over the useful life of the asset (LCOE). Investment cost: k€ 2,000–2,200/MW; Operating hours: Economic balance: 1,600-1,800, of which 700-800 are injected into the networkDoes not include the transient charge for self-consumed energy as the installation has a power below 10kW. A 2.0 A consumer is considered one with: annual consumption of 3,000 kWh and installed power of 5.5 kW(2) Including: nuclear moratorium, General Radioactive Waste Plan, allocation of the difference of losses, CNMC charge and corrective measuresSource: CNMC; IEA-World Energy Outlook 2014; IEA-Solar Technology Roadmap 2014; Monitor Deloitte analysis
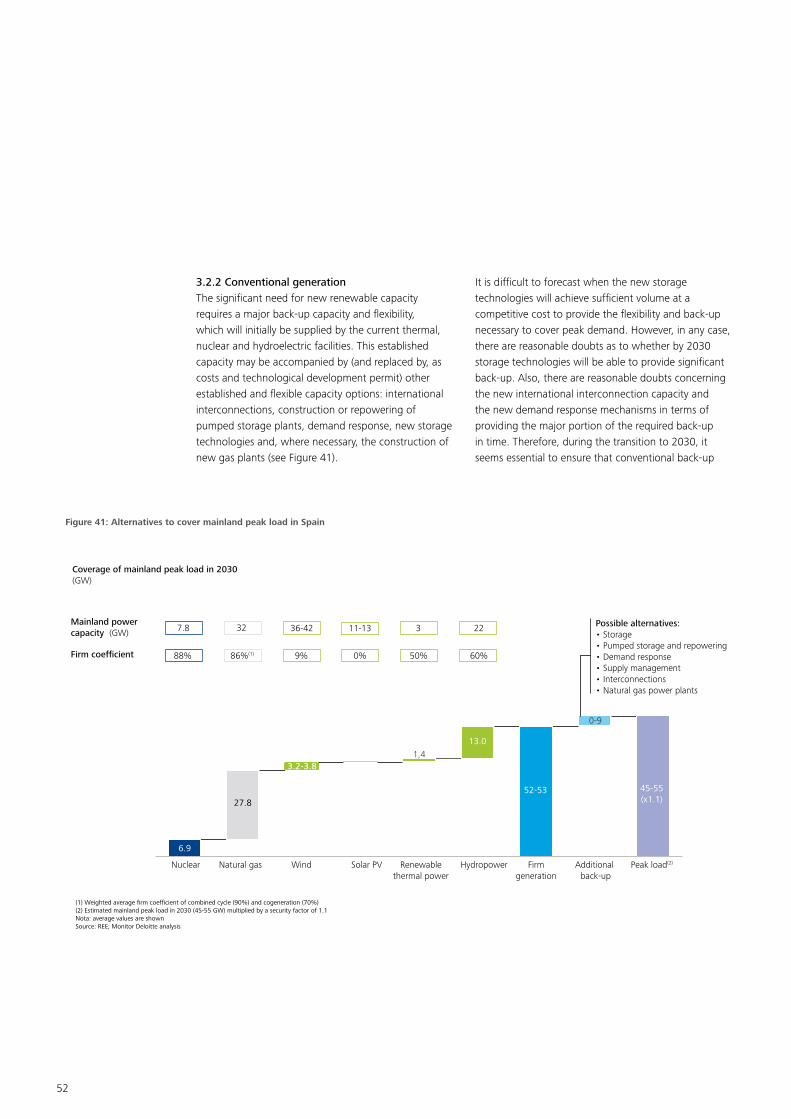
52
3.2.2 Conventional generationThe significant need for new renewable capacity requires a major back-up capacity and flexibility, which will initially be supplied by the current thermal, nuclear and hydroelectric facilities. This established capacity may be accompanied by (and replaced by, as costs and technological development permit) other established and flexible capacity options: international interconnections, construction or repowering of pumped storage plants, demand response, new storage technologies and, where necessary, the construction of new gas plants (see Figure 41).
It is difficult to forecast when the new storage technologies will achieve sufficient volume at a competitive cost to provide the flexibility and back-up necessary to cover peak demand. However, in any case, there are reasonable doubts as to whether by 2030 storage technologies will be able to provide significant back-up. Also, there are reasonable doubts concerning the new international interconnection capacity and the new demand response mechanisms in terms of providing the major portion of the required back-up in time. Therefore, during the transition to 2030, it seems essential to ensure that conventional back-up
Figure 41: Alternatives to cover mainland peak load in Spain
13.0
3.2-3.8
Wind Hydropower
1,4
Nuclear Renewablethermal power
Solar PVNatural gas Peak load(2)
0-9
Additional back-up
45-55(x1.1)
Firmgeneration
52-53
9% 60%0%86%(1)88%
36-42 11-13327.8 3
50%
22
Coverage of mainland peak load in 2030(GW)
Mainland power capacity (GW)
Firm coefficient
Possible alternatives:• Storage• Pumped storage and repowering• Demand response• Supply management• Interconnections• Natural gas power plants
6.9
27.8
(1) Weighted average firm coefficient of combined cycle (90%) and cogeneration (70%)(2) Estimated mainland peak load in 2030 (45-55 GW) multiplied by a security factor of 1.1Nota: average values are shownSource: REE; Monitor Deloitte analysis

A sustainable energy model for Spain in 2050 53
technologies already in operation are maintained in the system, while new technologies are developed and penetrate based on markets needs and their technological development. The available back-up alternatives today are:
• Increasing hydro and pumped storage generation capacity, sometimes through the repowering of plants, when it is economically efficient.
• Maintaining the back-up thermal technology plants while new storage technologies are not sufficiently developed. Early closure could compromise the security of supply and competitiveness in the Spanish energy system:
– Combined cycles ran around 1,000 operating hours in 2015. At this operating level and with the current remuneration mechanisms, the plants in service are not recouping fixed costs and, therefore, there is a risk of early closures.
– If a commitment were made to close the current coal-fired plants (in 2020, which is too early for economically viable alternatives to be available), new natural gas plants would need to be installed (up to 9 GW in addition to the current 27 GW, which would represent around EUR 3,500 million of new investment).
These new plants would, on the one hand, be forced to operate at low levels until 2050, due to increased storage and the emission reduction targets, and, on the other hand, have a useful life of 40 years. Therefore, they would continue to release CO2 until beyond 2050, which seems inconsistent with the targets set.
In addition, there would be an increase in the wholesale price which could mean an extra cost for customers of EUR 25,000-35,000 million (equivalent to a wholesale market price
increase of EUR 9-11/MWh) in 2020-2030. In the hypothetical case of having to maintain any of the coal-fired plants until the end of the next decade, mechanisms could be established to limit their operation and, therefore, their emissions, while in turn guaranteeing security of supply. The cost of keeping these plants open to provide security of supply would probably be lower than the cost of constructing new natural gas units.
– In the case of nuclear power plants, plans to make early closures when the plants have reached 40 years of life or even before would also endanger competitiveness and security of supply, and would, furthermore, increase CO2 emissions. Nuclear power plants contribute to mitigating climate change risk since they are free of GHG emissions.
It is difficult to forecast when the new storage technologies will become available in terms of volume and at a competitive cost and be able to provide the necessary back-up for peaks in demand

54
The possible closure of the already installed 7,800 MW of nuclear power plants between 2022 and 2027 would give rise to additional emissions of around 170 MtCO2 equivalent until 2030 (equal to half of the total emissions of the Spanish economy in 2013) (see Figure 42), since base load production would largely be replaced by conventional thermal production (if and when the closures of the nuclear plants began, there would be no other realistic alternatives for base load production that would be required at that date).
From the competitiveness perspective, this situation could give rise to an increase of up to EUR 8-10/MWh33 in the wholesale market price, given that nuclear energy would be replaced by other base technologies with higher variable costs, mainly natural gas.
Therefore, conventional generation should play a key role in the transition taking place efficiently whilst security of supply is maintained and the penetration of renewables increases. The following measures are necessary for this to happen:
• Avoiding the early closure of plants already installed in the system during the transition period until 2030 with no mature and deployed storage technologies, would possibly lead to scenarios of inefficient investment in conventional GHG-emitting technologies in order to provide the back-up needed.
• Adapting the design of the wholesale market in order to efficiently value availability, something which does not happen in the current energy market. The current
33 In the short term, combined cycle power plants would be the marginal technology -the last technology to be matched on the day-ahead wholesale electricity market and, therefore, the technology that marks the market price- instead of coal, which currently plays this role. This change in the order of merit could result in an increase in the day-ahead wholesale market price of between EUR 8-10/ MWh, which is the average difference between the bid prices for these two generation technologies
Figure 42: Comparison of GHG emissions and investments depending on the extension of nuclear plants’ operational life
Cumulative emissions2015-2030
CoalNatural gas
Investment(1)
2015-2030
GHG emissions from power generation scenarios(MtCO2 equiv.)
Extension of nuclear
plants’ operational
life
No extension of nuclear plants’
operational life
805 MtCO2 3,355 M€
170 MtCO2
reduction
975 MtCO2 M€ 5,335
1.980 M€reduction
(1) Estimated on the base of the unit investment cost of the various generation technologies.Source: IDAE; Monitor Deloitte analysis
0
40
80
2030
55
2025
56
20202015
80
0
40 30
54

A sustainable energy model for Spain in 2050 55
"energy only" market model does not provide adequate signals for investment and it is not efficient with the future mix of technologies - the preponderance of technologies with low or zero variable costs. Nowadays, the system does not allow the costs of any generation technology to be fully recovered.
In any case, the advantage of this way of managing the current power generation fleet is its flexible nature. It is not a case of committing to those plants over a fixed period, but rather a portion of that thermal generation fleet will gradually close by 2030 as technological development and reductions in storage technology costs make them more competitive.
Lastly, maintaining every back-up technology in the electricity generation mix would mean greater diversification of sources of supply, and mitigate the risk of variations in prices of raw materials on the international markets.
3.3 The promotion of energy efficiencyA reduction in final energy intensity of between 1.4% and 2% a year (see Figure 43) would be required on an ongoing basis until 2030 with the need to stay on a similar course until 2050. Numerous and highly disparate initiatives in energy efficiency and conservation must be rolled out covering virtually all sectors of activity. This means that a significant number of drivers, sectors of activities and types of agents must be "mobilised" and provided with incentives to achieve significant results as a whole which, without any doubt, is no easy task.
Despite the appeal of these measures, there are "historical" barriers which stall their adoption, including most notably:
• Large initial investments, long cost recovery periods and difficulty attaining economic benefits at short term.
• Difficulties in financing energy efficiency projects, since the characteristics and risks of investments, contractual structures and counterparties make projects relatively unattractive.
Figure 43: Evolution of energy intensity in Spain until 2030(1)
0
20
40
60
80
100
200019951990
2005 2015
2030202520202010
ktoe/thousands of millions de EUR2010
CAGR +0.4% CAGR
-1.6%
CAGR between -1.4% y -2.0%
(1) Final energy (without considering heat from cogeneration plants and international air and sea transport) as a percentage of GDPNote: average values are shownSource: International Monetary Fund; IDAE; Monitor Deloitte analysis
Conventional generation should play a key role in the transition taking place efficiently
• The agent which must undertake the investment often does not directly enjoy its benefits (e.g. the changing of windows in a building is paid for by the owner, whilst the energy consumption saving will be enjoyed by the tenants), making the adoption of efficiency and conservation measures difficult.
However, energy efficiency holds advantages over other measures, meaning that the investment and the effort to be put in must be very significant:

56
• Unlike other drivers described above, there is practically no technological uncertainty as to the various measures: LED lighting, improvements to the insulation of buildings, advanced home automation and air conditioning, technical equipment for improving industrial processes, etc. have already been fully developed, with extensive commercial implementation experience and advances continually being made.
• In highly competitive sectors of activity with major energy consumers, such as the industrial sector, investment decisions are usually made on the basis of rational assessments. In these cases, incentives for emission-free technologies that are more competitive than conventional ones would not be necessary, but rather mechanisms for facilitating financing of investments would be needed. In addition, during the transition to the energy model in the industry, special attention must be paid to relocation risks in each industrial subsector in order to identify and mitigate potential negative externalities of environmental policies.
• Last, but not least, one must remember that the huge energy efficiency potential to be captured in the Spanish (and world) market would be harnessed, as explained above, through the electrification of demand by generating renewable energies, with the electrification of transport as the main component.

A sustainable energy model for Spain in 2050 57
4. Policy recommendations for an efficient transition
The different levels of Government and private sector in Spain need to take decisive action to lead the change in the energy model
Based on the foregoing analysis of the long-term vision (2050) and transition, we hereby propose a set of recommendations aimed at guiding our energy model towards efficient decarbonisation. The transition will have to be made gradually but decisively, towards the change in the country's energy model while the security and competitiveness of energy supply are maintained.
The recommendations included in this section are summarised as follows (see Figure 44):
Figure 44: Energy policy recommendations aimed at leading our energy model towards decarbonisation
Recommendations on the definition of targets and fiscal policy1. Establish binding objectives for all sectors
for 2030 and 20502. Introduce a specific regulation
to implement an effective price signal of the cost of emissions
Recommendations on the residential, services and industrial sectors7. Promote emission reductions
in the residential sector 8. Promote emission reductions
in the services sector 9. Foster the energy carrier change
(electrification and gasification) and energy efficiency in industry
Recommendations on the electricity industry 10. Establish a reasonable planning and
market framework for the installation of renewable generation and required back-up capacity to cater for demand growth
11. Keep in operational conditions the back-up generation capacity already installed
12. Extend the operating authorisation for nuclear power plants up to 60 years under the required safety conditions
13. Develop regulations to promote the necessary investments in the grid
14. Turn the electricity tariff into an efficient price signal by changing its structure
Recommendations on the transport sector3. Foster sustainable mobility in private
road transport (electric/hybrid vehicles and charging points)
4. Foster the modal shift away from heavy transport towards railways
5. Promote natural gas vehicle as a tool for transition in heavy road transport
6. Develop sustainable sea transport by fostering the use of natural gas and developing green ports

58
4.1 Recommendations on the definition of targets and fiscal policyRecommendation 1: Establish binding targets for all sectors for 2030 and 2050. Binding decarbonisation targets must be set for all energy uses, especially those not currently subject to the regulation on emission allowances (the so-called diffuse sectors: transport, residential and services). The objectives schemes must be similar across sectors, but they have to consider the efforts made so far and the economic and technical potential of the low carbon technologies. In this context, it would be fundamental for:
• All sectors (transport, power generation, residential, services, industry, etc.) to have binding emissions reduction targets to help achieve the overall targets for 2030 and 2050 (and any interim target that might be set).
• A structure of sub-targets by sector should be set, on the main types of GHG-emitting equipment, aligned with achieving the sectoral targets, particularly in the diffuse sectors. It is technically difficult to measure and verify emissions from these diffuse sectors and, therefore, these sub-targets should possibly take the form of emission limits for the equipment used by these sectors (similar, for example, to the emission limits per 100 km currently applied to the automotive industry).
• Also, these objectives should act as a reference for the various regulatory entities (state administrations, regional and municipal administrations, the Spanish institute for energy efficiency (IDAE)) in order to structure and develop measures, incentives and regulations for the various economic agents and energy consumers (some of which are described in the following recommendations).
Recommendation 2: Introduce a specific regulation to implement an effective price signal of the emissions cost. This could be done through a tax applied to sectors not subject to the emission trading system (residential, services, transport) or through a mechanism designed to ensure an emission allowance price floor (such as that introduced in the UK). • Establish a tax or CO2 price floor, which would provide a
clear price signal for the reduction of emissions and raise funds to contribute to R&D+i into new technologies (e.g. storage or renewables) or to cover non energy-related costs currently included in the electricity tariff.
• These taxes should be designed to be revenue-neutral; i.e. they should be combined with an equivalent reduction in other taxes and a reduction in the charges included in the electricity tariff, providing an incentive for the required electrification of demand.
4.2 Recommendations on the transport sectorRecommendation 3: Foster sustainable mobility in private road transport (electric/hybrid vehicles and charging points).• Develop charging infrastructure in urban areas in a
coordinated way between municipal, regional and national administrations (with special involvement of the municipal administrations) to ensure they ease the progressive availability of charging infrastructure in these areas through:
– Planned and progressive roll-out of charging infrastructure on public roads in each urban area, developing regulations and the business model that is consistent with the electric vehicles penetration rate.
– Business models and appropriate regulation for agents to invest in infrastructure (e.g. concessions, charging stations in free competition, regulated

A sustainable energy model for Spain in 2050 59
distribution business, etc.), allowing for economic viability and cost recovery and a reasonable return on the infrastructure for the agents involved.
– Charging points with restricted access so that the owners of electric vehicles without a private garage can assure that they have a place on the street where they can park their cars and charge them.
– Charging points in private garages (individual or shared) so that the main barriers in terms of architecture, infrastructure and electrical equipment, business model, etc. are removed, to encourage the installation of charging infrastructure in existing community neighbourhoods and buildings.
• Establish comprehensive packages to stimulate demand for electric mobility that include the purchase of vehicles and access to restricted charging points for citizens who do not have garages, including:
– Higher subsidies and tax deductions/exemptions for the acquisition and use of electric/hybrid vehicles.
– Municipal regulations for the creation of restricted access parking spaces, aimed at owners of electric vehicles without their own garages, thereby guaranteeing them a place in the street with a charging point.
– Increasingly restrictive limits on GHG emissions for the retailing of vehicles with conventional combustion engines.
– Additional levies and tax charges applicable both to conventional vehicle acquisition and use (taxes on fuel, road tax or charges for access to and parking in cities).
• Develop an industrial and R&D+i investment strategy for the development of batteries and electric motors in order to capitalise on the benefits of the national automotive sector.
• Make the necessary changes to tariffs and to electricity distribution regulation, reducing the barriers that may be associated with these elements. Specifically:
– Definition of a tariff that reflects the actual costs of supply and system costs for the new electricity uses, such as electric mobility. This tariff has to make it possible to generate an efficient price signal for potential buyers of electric vehicles and guarantee the economic sustainability of the power system.
– Review of the distribution regulation to prevent this from becoming a technical or regulatory barrier to the deployment of charging infrastructure for private use.
• Establish measures to reduce conventional vehicle traffic in cities to reduce pollution:
– Promote electric car sharing schemes.
– Provide incentives for natural gas-powered public transport.
– Limit the circulation of conventional vehicles in city centres for reasons of air quality.
Recommendation 4: Foster the modal shift away from heavy transport towards railways.• Develop a strategy for logistics infrastructure that
allows the decarbonisation of the heavy transport sector, including:

60
– Port infrastructure for logistics management of loading/unloading of vessels and connection to the railway network and connection infrastructure with logistics centres for capillary distribution.
– Review the criteria for the operation and use of the existing railway network to maximise its freight capacity.
– Electrification of network sections not yet electrified (introducing in the economic analysis the cost of emissions avoided).
– Doubling of the railway network and/or use of the conventional network and/or construction of new electrified railway network dedicated to long-distance freight, particularly from port areas and industrial production centres to areas of consumption and international transportation.
• A sustained multi-year investment effort by public authorities (as has been done in the development of the high-speed railway network for passenger transport) for the development of a basic infrastructure focused on the modal shift of heavy goods transportation to railway transport.
Recommendation 5: Promote natural gas vehicles as a tool for transition in heavy road transport.• Develop a strategy for the development and
implementation of NGVs as a technology for heavy transport in conjunction with vehicle manufacturers, construction agents and charging infrastructure operators and groups of potential users, including assistance programmes to encourage demand for NGVs.
• Develop mechanisms and regulations that encourage the construction of refuelling infrastructure, as this is one of the bottlenecks in the development of NGVs.
• Conduct awareness campaigns among the hauliers and potential users to communicate the benefits of NGVs.
Recommendation 6: Develop sustainable sea transport by fostering the use of natural gas and developing green ports.• Encourage investment in systems that reduce GHG
emissions at ports, such as the use of OPS (On-shore Power Supply) systems or electricity supply infrastructure for vessels berthed in ports, and promote regulatory changes in power tariffs and in electricity distribution legislation to adapt them to this new demand.

A sustainable energy model for Spain in 2050 61
• Investment incentives for the use of natural gas in sea transport through grants or deductions/tax exemptions for ships to be built with these technologies, and the promotion of engine changes in all types of vessels.
• Plan and develop investment in storage facilities for liquefied natural gas in ports and charging systems for the various types of vessels.
4.3 Recommendations on the residential, services and industrial sectorsRecommendation 7: Promote emission reductions in the residential sector.• Define a plan to renovate existing buildings accompanied
by a system of grants, which is an initiative with significant potential in Spain due to the sluggish pace of energy rehabilitation of residential buildings.
• Apply maximum requirements for energy consumption or minimum levels of energy efficiency in buildings, in line with the emissions targets set for the residential sector in accordance with Recommendation 1.
• Develop specific regulations for residential buildings, including existing ones, to strengthen the control
mechanisms in existing legislation and establish high standards of mandatory energy efficiency and conservation (including insulation, closures and sealings, air conditioning, lighting, etc.).
• Define information measures, through awareness campaigns, on the emissions of different types of equipment or properties.
• Ensure that the electricity tariff is a price signal that reflects the actual costs of supply, eliminating those excess costs arising from policies that distort the price signal.
Recommendation 8: Promote emission reductions in the services sector. • Define a coordinated long-term action plan with
specific strategies for each segment of the tertiary sector, with the aim of focusing resources on actions with the greatest abatement potential to ensure compliance with the emissions targets set for this sector.
• Reconcile the roles of owners and tenants, where one is in principle responsible for investments (owner) although he or she is not typically the agent that pays

62
the energy supply (tenant) and therefore reaps the benefits of greater efficiency.
• Create incentives for investments or provide access to the necessary funding for attractive projects with medium-to-long return periods.
• Establish obligations, subject to periodic inspection, to make investments in energy efficiency in buildings undergoing refurbishment processes.
• Ensure that the electricity tariff is a price signal that reflects the actual supply costs, eliminating those excess costs arising from policies that distort the price signal.
Recommendation 9: Foster the energy carrier change (electrification and gasification) and energy efficiency in industry. • Analyse the impact of the transition of the energy
model for the industry, paying particular attention to the relocation risks.
• Establish financing mechanisms, tax benefits or other support instruments in order to reduce the current difficulties in making these investments which generally require shorter investment recovery periods and/or higher returns.
• Ensure that the electricity tariff is a price signal that reflects the actual costs of supply, eliminating those additional costs arising from policies that distort the price signal, and making a balanced allocation among agents and energy uses; as described in Recommendation 14.
4.4 Recommendations on the electricity industryRecommendation 10: Establish a reasonable planning and market framework for the installation of renewable generation and the required back-up capacity to meet the demand growth.• Implement a plan for the necessary renewable
generation capacity at medium to long term (10 years) based on estimates of demand growth, the achievement of objectives and the maturity of the various technologies available.
• Minimise the extra costs for consumers, it being crucial to install generation technologies with greater maturity and a lower total cost in order to minimise transition costs.
• Reform the electricity market so that it competitively rewards investment and firm capacity so that the necessary incentives for the efficient deployment of renewable technologies are created.
• Create mechanisms that solve the inefficiencies of the current market, whose marginal price signal is efficient for dispatching but does not provide the necessary investment signals, and include design elements that create an efficient long-term economic signal.

A sustainable energy model for Spain in 2050 63
Recommendation 11: Keep in operational conditions the back-up power generation capacity already installed.• Maintain back-up power generation capacity while
economically and technically feasible storage technology develops. Key to this will be a stable and predictable regulatory framework that ensures the obtainment of a reasonable return for all technologies, as well as compliance with environmental and safety regulations.
• As in Recommendation 10, the electricity market must be reformed in order to generate the price signal needed to competitively remunerate firm capacity.
• Refrain from encouraging new investment in back-up capacity which in the future may be underused (thermal generation) or investments in some low-mature technologies (power storage), allowing free private decision regarding the continued operation of already installed thermal generation, subject to achievement of objectives or compliance with environmental regulations.
Recommendation 12: Extend the operating authorisation for nuclear power plants up to 60 years under the required safety conditions.• Extend the operating authorisation for nuclear power
plants up to 60 years -in line with other countries that have extended the working life of their nuclear power plants- under the required safety conditions.
• Ensure a decision-making process based on the applicable legislation led by the Nuclear Safety Council.
• Include a transparent analysis of the fulfilment of security rules in the process for authorising extended operation.
Recommendation 13: Develop regulations to promote the necessary investments in the grid.• Define the role of electricity distribution companies
in the development of electric vehicles (charging infrastructure) and in the integration of distributed renewable energy, so as to act as an incentive to innovation and grid automation, minimising the investment needed for the grid.
• Develop stable regulations that enable the obtainment of a reasonable return on invested capital in order to provide service to changes in power demand-generation that could occur in the coming years (e.g. electric vehicle integration, distributed generation, etc.).
• Adapt the electricity distribution remuneration model, based on physical units, so the nature of the new assets and network costs can be recognised in order to encourage innovation and modernisation of this activity.
• Promote investment in networks recognising higher remuneration for certain assets that have a transformational nature.
Recommendation 14: Turn the electricity tariff into an efficient price signal by changing its structure.• Remove from the electricity tariff those additional
costs resulting from energy policies (e.g. energy, industrial or territorial policy) that distort the electricity price signal, allocating such costs among the different energy uses. Thus, electricity prices would be lowered for the end user to more competitive levels, thereby encouraging the electrification of demand.

64
– Close to 50% of the costs included in the electricity tariff are unrelated to electricity supply (support for renewable energies, tariff deficit, etc.) and relate more to energy, industrial or territorial policy.
– These extra costs do not give an efficient signal for electrification because they increase the electricity price and reduce its competitiveness compared with other energy carriers that produce emissions.
– These additional costs should be eliminated from the electricity tariff, allocating them among the other energy uses.
– If there is a drop in the economic resources for financing environmental policies due to the application of this measure, the mentioned shortfall could be mitigated by applying the new environmental taxation defined in Recommendation 2.
• Modify the current tariff system, from a structure where customers are billed depending on the voltage level of connection to the network and the power contracted, to a system that considers the different types of consumption/uses of electricity.
– There is currently a wide variety of uses of electricity: base consumption for industry, intermittent consumption, consumption with high level of availability, consumption associated with mobility, both in private vehicles and public facilities, consumption with distributed generation or storage, etc.
– The tariff system must ensure that all customers contribute to bearing the costs of the system depending on their type of use of the network and create incentives for a rational use of the network (e.g. avoid oversizing of the network).
– The current tariff is not designed for many of these uses; for example, the electricity tariff for the electric vehicle must be designed to encourage nocturnal charging, thereby avoiding any increase in peak system demand.
– Smart meters allow us to know accurately the use made of the network, thereby making it possible to create tariffs that best suit this variety of consumption.

A sustainable energy model for Spain in 2050 65
5. Appendix
Model for energy consumption and emission estimate A model has been developed in order to estimate final energy consumption and GHG emissions depending on the application of the decarbonisation levers.
The calculation of future final energy consumption and emissions follows the steps illustrated in the next Figure:
Figure 45: Spanish energy system model performance
Final energy uses 2008-2013:
2008-2013
2014-2050
Final energy consumption Source: AIDE
Conversion of final energy into uses by using transformation energy efficiency ratios
Correlation factors between uses and GDP growth, except for railway, maritime and air transport (remains constant)
Conversion of final energy into uses by using transformation energy efficiency ratios
Road transport (passenger cars and heavy transport(1)):
travelled km
Railway, maritime and air transport:
usable energy(2)
Residential: heat (heating and domestic hot water)
and final energy (other uses(3))
Services: heat (coal, gas and oil products) and final energy
(electricity)
Industry: final energy
Fishing, agriculture and others: final energy
Final energy uses 2014-2050
Final energy consumption
Power generation GHG emissions
Emissionfactors
Emissionfactors
1
2
3
4
5
6
(1) Car passengers include vehicles with less than 3.5 tons and heavy transport vehicles include vehicles with more than 3.5 tons (2) Energy from international routes in maritime and air transport is not included(3) Other residential uses: electrical appliances, air conditioning, lighting and stove

66
1-2 Conversion of final energy into uses. Final energy consumption of 2008-2013 is transformed into final use, e.g. number of km travelled by road transport or thermal energy needed in the residential sector.
2-3 Forecast of uses depending on the different economic growth scenarios: uses are correlated with GDP growth through specific factors, except for certain transport uses.
3-4 Conversion of uses to final energy consumption for the 2014-2050 time period: final uses are transformed into final energy consumption depending on the hypotheses adopted that determine how each particular use is satisfied (e.g. electric vehicle penetration level and its impact on the number of km travelled consuming electricity). A progressive improvement due to energy efficiency and conservation is applied (equivalent to a lower consumption of final energy).
4-5 Once the electricity demand for 2014-2050 is determined, renewable power generation is estimated, as well as the back-up capacity needed to cover the maximum demand.
5-6 Based on non-electric final energy consumption, emissions are estimated for the period 2014-2050 depending on the emissivity coefficients of each fuel. Power generation emissions are also estimated with the emissivity coefficient of each fuel for different power generation technologies.
Boundary condition for the estimation: compliance with environmental restrictions set by the European Union (emission targets for 2020, 2030 and 2050, as well as the final renewable energy target for 2030).
From the forecasted uses of final energy, the model estimates:
• Annual GHG emissions, both from energy uses and from non-energy uses.
• Power generation capacity by technology (generation mix) needed to meet the power demand and comply with the demand coverage ratio and with the renewable power generation targets set by the European Union
• Investment and overinvestment in final equipment needed to achieve penetration levels of different decarbonisation levers.
In the case of power generation and grids (electrical transport and distribution grids), all the investment needed has been estimated. In the actions related to the shift in energy carrier and energy efficiency, the estimates performed correspond to overinvestment, that is, the overrun from investing in an activity or equipment with lower or null emissions (e.g. acquiring an electric vehicle) vs investing in a conventional activity (acquiring a conventional vehicle).
• Electricity tariff in EUR/MWh, following a full cost estimation, considering that consumers must bear all the costs of the power system (return on investment and O&M costs). Taxes and other fees are not considered.

A sustainable energy model for Spain in 2050 67
Contact list
Alberto Amores is Senior Partner Leader of Energy & Resources Strategy Consulting Practice in Spain (Monitor Deloitte)
Laureano Álvarez is Partner of Energy & Resources Strategy Consulting Practice in Spain (Monitor Deloitte)
Joaquín Chico
Senior Manager of Energy & Resources Strategy Consulting Practice in Spain (Monitor Deloitte)


For further information, please visit www.deloitte.es
Deloitte refers to one or more of Deloitte Touche Tohmatsu Limited, a UK private company limited by guarantee (“DTTL”), its network of member firms, and their related entities. DTTL and each of its member firms are legally separate and independent entities. DTTL (also referred to as “Deloitte Global”) does not provide services to clients. Please see www.deloitte.com/about for a more detailed description of DTTL and its member firms.
Deloitte provides audit, consulting, financial advisory, risk management, tax, and related services to public and private clients spanning multiple industries. With a globally connected network of member firms in more than 150 countries and territories, Deloitte brings world-class capabilities and high-quality service to clients, delivering the insights they need to address their most complex business challenges. Deloitte’s more than 225,000 professionals are committed to making an impact that matters.
This communication contains general information only, and none of Deloitte Touche Tohmatsu Limited, its member firms, or their related entities (collectively, the “Deloitte Network”) is, by means of this communication, rendering professional advice or services. Before making any decision or taking any action that may affect your finances or your business, you should consult a qualified professional adviser. No entity in the Deloitte Network shall beresponsible for any loss whatsoever sustained by any person who relies on this communication.
© 2016. For information, contact Deloitte, S.L.
Designed and produced by the Communications, Brand and Business Development department, Madrid.