Embed Size (px)
Citation preview
N A T U R A L R E S O U R C E S I N S T I T U T E
NRI Report No: 2731
Rural Non-Farm Economy Project
The Rural Non-Farm Economyin Armenia, Georgia and Romania:
A Synthesis of Findings
Junior R Davis, Dirk J Bezemer & Tiago Wandschneider
April 2003
This document is an output from a project funded by the UK Department for InternationalDevelopment (DFID) and the Worldbank for the benefit of developing countries.
The views expressed are not necessarily those of DFID or the Worldbank.
World Bank
i
Contents
1 INTRODUCTION ................................................................................................1
1.1 BACKGROUND TO THE RESEARCH.......................................................................1 1.2 CONCEPTUAL FRAMEWORK .................................................................................3 1.3 AIMS AND RATIONALE OF APPROACH ..................................................................4
2 COUNTRY BACKGROUND...............................................................................6
3 MAIN PROBLEMS FOR THE RURAL ECONOMY IN TRANSITION COUNTRIES .................................................................................................................7
4 OVERVIEW OF FINDINGS................................................................................8
5 ANALYSIS: ASSETS, ACTIVITIES, AND POVERTY......................................10
6 SUMMARY AND CONCLUSIONS....................................................................14
REFERENCES ............................................................................................................18
ANNEX 1 ‘CAPITALS’ BY REGIONAL TYPES, DEVELOPMENT & POVERTY......................................................................................................................................19
ANNEX 2 ECONOMIC ACTIVITY INDICATORS BY REGION, DEVELOPMENT & POVERTY................................................................................22
ANNEX 3 FACTORS IN HOUSEHOLDS’ INVOLVEMENT IN RNF ACTIVITIES................................................................................................................25
ANNEX 4 FACTORS AFFECTING THE RISK OF POVERTY ............................28
ANNEX 5 EARNED INCOME NON-FARM SHARES & SECTORAL COMPOSITION OF RNFE........................................................................................30
Tables
TABLE 1 ARMENIA: 'CAPITALS' BY REGIONAL TYPES, REGIONAL DEVELOPMENT &
POVERTY INCIDENCE.............................................................................................19 TABLE 2 GEORGIA: 'CAPITALS' BY REGIONAL TYPES, REGIONAL DEVELOPMENT &
POVERTY INCIDENCE.............................................................................................20 TABLE 3 ROMANIA: 'CAPITALS' BY REGIONAL TYPES, REGIONAL DEVELOPMENT &
POVERTY INCIDENCE.............................................................................................21 TABLE 4 ARMENIA: ECONOMIC ACTIVITY INDICATORS BY REGION, DEVELOPMENT
LEVEL, AND POVERTY INCIDENCE .......................................................................22 TABLE 5 GEORGIA: ECONOMIC ACTIVITY INDICATORS BY REGION, DEVELOPMENT
LEVEL, AND POVERTY INCIDENCE .......................................................................23 TABLE 6 ROMANIA: ECONOMIC ACTIVITY INDICATORS BY REGION, DEVELOPMENT
LEVEL, AND POVERTY INCIDENCE .......................................................................24 TABLE 7 ARMENIA: FACTORS IN HOUSEHOLDS’ INVOLVEMENT IN NON-AGRICULTURAL
ACTIVITIES ............................................................................................................25
ii
TABLE 8 GEORGIA: FACTORS IN HOUSEHOLDS’ INVOLVEMENT IN NON-AGRICULTURAL ACTIVITIES ............................................................................................................26
TABLE 9 ROMANIA: FACTORS IN HOUSEHOLDS’ INVOLVEMENT IN NON-AGRICULTURAL ACTIVITIES ............................................................................................................27
TABLE 10 ARMENIA: FACTORS AFFECTING THE RISK OF POVERTY.................................28 TABLE 11 GEORGIA: FACTORS AFFECTING THE RISK OF POVERTY.................................28 TABLE 12 ROMANIA: FACTORS AFFECTING THE RISK OF POVERTY.................................29
Figures FIGURE 1: SCHEMATIC DIAGRAM OF THE FIELDWORK CRITERIA/STRUCTURE ..................5 FIGURE 2 EARNED INCOME NON-FARM SHARES IN RURAL ARMENIA...........................30 FIGURE 3 SECTORAL COMPOSITION OF THE RNFE IN ARMENIA...................................30 FIGURE 4 EARNED INCOME NON-FARM SHARES IN RURAL GEORGIA...........................31 FIGURE 5 SECTORAL COMPOSITION OF THE RNFE IN GEORGIA ..................................31 FIGURE 6. EARNED INCOME NON-FARM SHARES IN RURAL ROMANIA..........................32 FIGURE 7. SECTORAL COMPOSITION OF THE RNFE IN ROMANIA..................................32
iii
Acronyms and Abbreviations AMD Armenian Dram, currency introduced in 1993 CEE Central and Eastern Europe CIS Commonwealth of Independent States DFID Department for International Development, UK EBRD European Bank for Reconstruction and Development EU European Union FAO UN Food and Agriculture Organisation FDI Foreign Direct Investment GAO Gross Agricultural Output GDP Gross Domestic Product GEL Georgian currency, the Lari, introduced in 1995 GOA Government of Armenia GOG Government of Georgia GOR Government of Romania HH Household HHH Head of Household IDP Internally displaced persons IGA Income generating activity IHS Integrated Household Survey LFA Less favoured area MAFI Ministry of Agriculture and Food Industry, Georgia MFA More favoured area MSME Micro, small and medium sized enterprise NGO Non-governmental organisation NRI Natural Resources Institute NSS GoA National Statistical Service/ GoG National Statistical Service PRSP Poverty Reduction Strategy Paper RNF Rural non-farm RNFE Rural non-farm economy ROL Romanian currency, the Lei. SME Small and medium sized enterprise SWAPs Sector Wide Approaches
1
1 Introduction The literature on transition economies devotes relatively little attention to agriculture and the rural non-farm economy, despite the importance of the sector and its relevance to the livelihoods of the majority of the world’s poor. This report is part of a growing volume of empirical work on agriculture in transition countries and especially on the topic of the rural non-farm economy and livelihood diversification among the poor. The empirical work presented in this report is primarily based on large (nation-wide) rural household surveys and other field-related research activities using a broad range of methodologies. The report has been a collaborative endeavour involving significant contributions from the following individuals: • In Armenia: Ms Astghik Mirzakhanian (UNDP), Ms Gayane Minasyan (World
Bank), Mr Nairuhi Jrbashyan, Mr Paruir Asatryan, Mr Ruben Yeganyan, Mr Nelson Shahnazaryan, Dr Marc Duponcel (FAO) and Mr Patrick Tateossian (formerly EU).
• In Georgia: Ms Tea Khoperia, Mr Tskitishvili (IPM_Georgia), Ms Darejan Kapanadze (World Bank), Mr Giorgi Meskhidze (Centre for Social Studies) and Mr Tamaz Dundua (Elkana).
• In Romania: Mr Sebastian Lazariou (CSOP), Mrs Ana Bleahu (Institute for the Quality of Life, Romanian Academy), Mrs Angela Gaburici (Academy of Economic Sciences, Romania), Mr Gabriel Ionita (World Bank) and Mr David Humphreys (DFID).
The authors would also like to thank: Ms Felicity Proctor (World Bank and DFID), Professor Paul Hare (Heriot-Watt University), and Dr Gertrud Buchenreider (University of Hohenheim) for their contributions and comments on this paper. The authors gratefully acknowledge the support of the DFID/World Bank Collaborative Program for Rural Development, Project No. V0135. However, the views in this report are solely those of the authors and do not necessarily represent the official view of the agencies or individuals concerned. 1.1 Background to the research The focus of this paper is on rural non-farm livelihoods in economies in transition. It was prepared as part of the Natural Resources Institute project entitled ‘Characterisation and Analysis of the Non-Farm Rural Sector in Transition Economies’, undertaken for the World Bank and the Department for International Development (DFID). This programme of applied policy research began in March 2000 as a result of the Rural Non-Farm Economy (RNFE) workshop held within the World Bank in Washington in June 1999. This document is intended to summarise the key findings from national surveys of the RNFE in Armenia, Georgia and Romania conducted during November 2001 to March 2002. The intended outputs of this study are (1) to improve understanding of the dynamics of the RNFE in providing employment and income diversification opportunities in Armenia, Georgia and Romania, and (2) to promote mechanisms for integrating research results into relevant policy processes. Improved policy-making in this context may involve: • A focus on improving the well-being and livelihoods of the rural population, through
2
developing their capacity to access resources and actively participate in non-farm rural enterprise and employment opportunities;
• An emphasis on the diversity and diversification of income sources in the face of vulnerability to shocks and stresses - particularly on the part of the poorest members of society; and
• An acceptance of the need for an in-depth understanding of the context (socio-cultural, economic, agronomic) in which non-farm rural livelihood options are currently pursued and in which new options can be developed.
The paper contributes to a wider NRI project which aims to identify the institutional and policy deficiencies constraining non-farm rural livelihoods in Central and Eastern Europe (CEE) and the Commonwealth of Independent States (CIS), to analyse the determinants of infrastructural and policy factors and to work with policy-makers to improve non-farm rural economy opportunities. The findings of this study relate well to other surveys conducted by the World Bank in the region in terms of their methodology, coherence and outcomes (e.g. in Romania the ASAL survey (1996)1). The work presented is of particular value for at least four reasons: 1. Our research focused on a specific subset of the rural economy and consequently
particular sections of the population involved in non-farm employment and income generating activities. These groups are often ignored or under-represented in rural surveys and thus, a clear understanding of their motivation to diversify, manage risk, migrate or enter formal employment should assist the development of appropriate rural policies, particularly in the context of poverty reduction strategies and the promotion of rural economic growth.
2. Income diversification comes from a variety of sources, including agriculture, migration, remittances, daily travel to nearby urban employment, local wage-labour opportunities, and self-employment. There has however been a lack of reliable statistical data on this issue; and the situation is further complicated by the presence of the informal economy. A major strength of this research has been to analyse the situation in more depth, provide new empirical data and to assess the relative importance of each of these income sources. Our research provides an improved understanding of the complex social and economic factors that underlie rural livelihood diversification and poverty in transition economies.
3. Key factors influencing capacity to engage in the RNFE include: household composition; education and skills; access to finance; and social capital and networks. Again, however, the empirical evidence is patchy and incomplete. A further strength of this research, therefore, has been to evaluate this in more depth.
4. Policy initiatives and interventions designed to improve the situation for rural populations have tended to emphasise employment opportunities. In the transition economies, employment opportunities have focused on creating jobs or on creating conditions in which jobs are created. Conversely, people’s capacity to access or create rural
1 Within the Agricultural Sector Adjustment Loan (ASAL) of the World Bank, a cross sectional microeconomic survey of more than 1,000 rural enterprises was carried out in Romania during 1996 and 1997. A similar household survey focussing on private farming in Armenia was conducted in 1998. From 2000 to 2002 Davis, Buchenreider, Erjavec, Davidova et. al., Final Report (2002) conducted a RNFE survey in Bulgaria, Macedonia and Slovenia under the auspices of the EC-PHARE ACE programme.
3
non-farm employment has received less attention. This has been a further important contribution of this research.
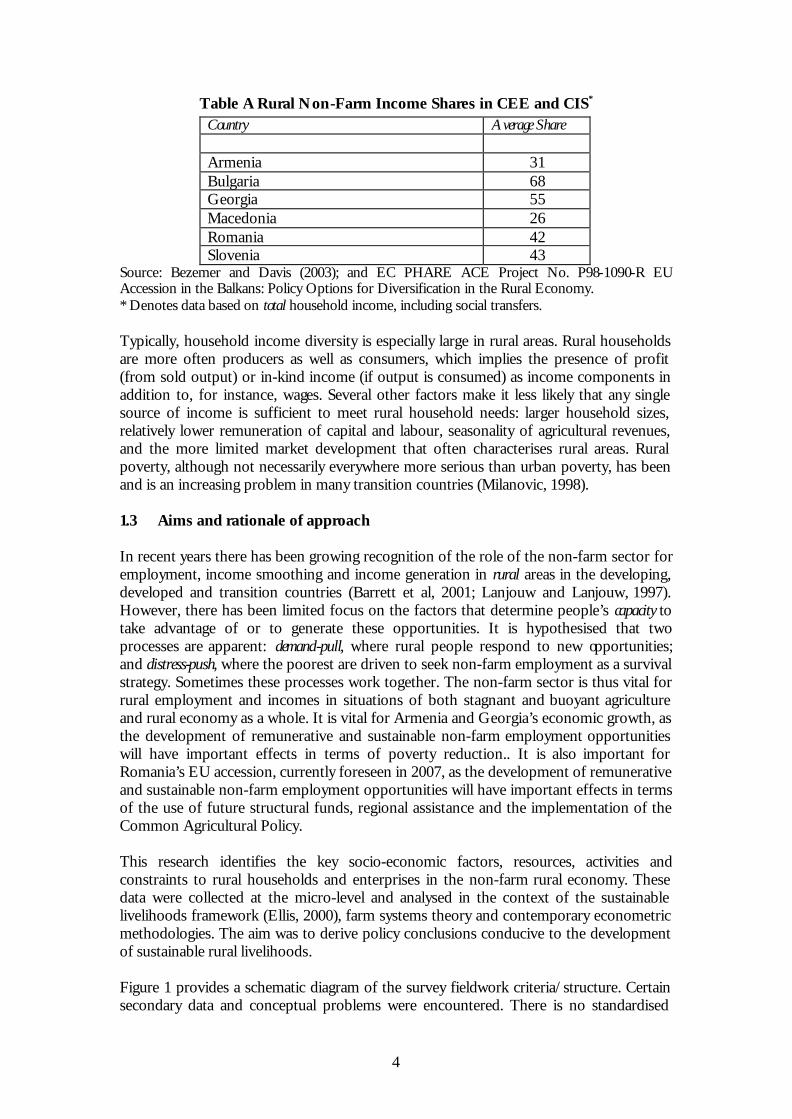
1.2 Conceptual framework This paper is structured around the concepts of livelihood and diversity. ‘A livelihood comprises the assets (natural, physical, human, financial and social capital), the activities, and the access gained to these … that together determine the living gained by … the household’ (Ellis, 2000:10). Assets form households’ endowment of resources with which to gain their living. In this definition, the conventional meaning of assets is expanded to include, besides material and financial resources, also household members’ skills and experience (human capital) and their relations within wider communities (social capital). This inclusive definition, as well as use of the term ‘capital’ in these senses, is not uncontroversial (Davis & Bezemer, 2003), but it serves to highlight several unifying features of diverse resources. They require investment, in terms of time or money, in order to be obtained or formed. They can (but need not) be used in an economically productive way. And in doing so, they are (imperfectly) substitutable and complement household labour. Activities comprise all the ways in which household members utilise their non-leisure time to support their livelihoods. This broad definition includes work and care, employment and entrepreneurship, agricultural production and trade, and a range of other dichotomies (some of these are depicted in Davis & Bezemer, 2003). Engagement in activities both requires assets and may increase households’ stock of assets. Households’ endowment of assets and involvement in activities jointly support their level of well-being. The second central term in this report is diversity, which follows naturally from the idea of livelihood. Diversity in a household’s activities and income (which is one measure for a household’s living standard) ‘refers to the existence, at a point in time, of … different household income sources…’ (Ellis, 2000:14). Given heterogeneity in assets, diversity in income is almost implied. Indeed, both individual and household income normally derives from more than one source: income diversification is the norm, specialisation the exception (Barrett et al, 2001). Table A shows the average rural non-farm income shares in Central and Eastern Europe and the Commonwealth of Independent States households.
4
Table A Rural Non-Farm Income Shares in CEE and CIS* Country Average Share Armenia 31 Bulgaria 68 Georgia 55 Macedonia 26 Romania 42 Slovenia 43
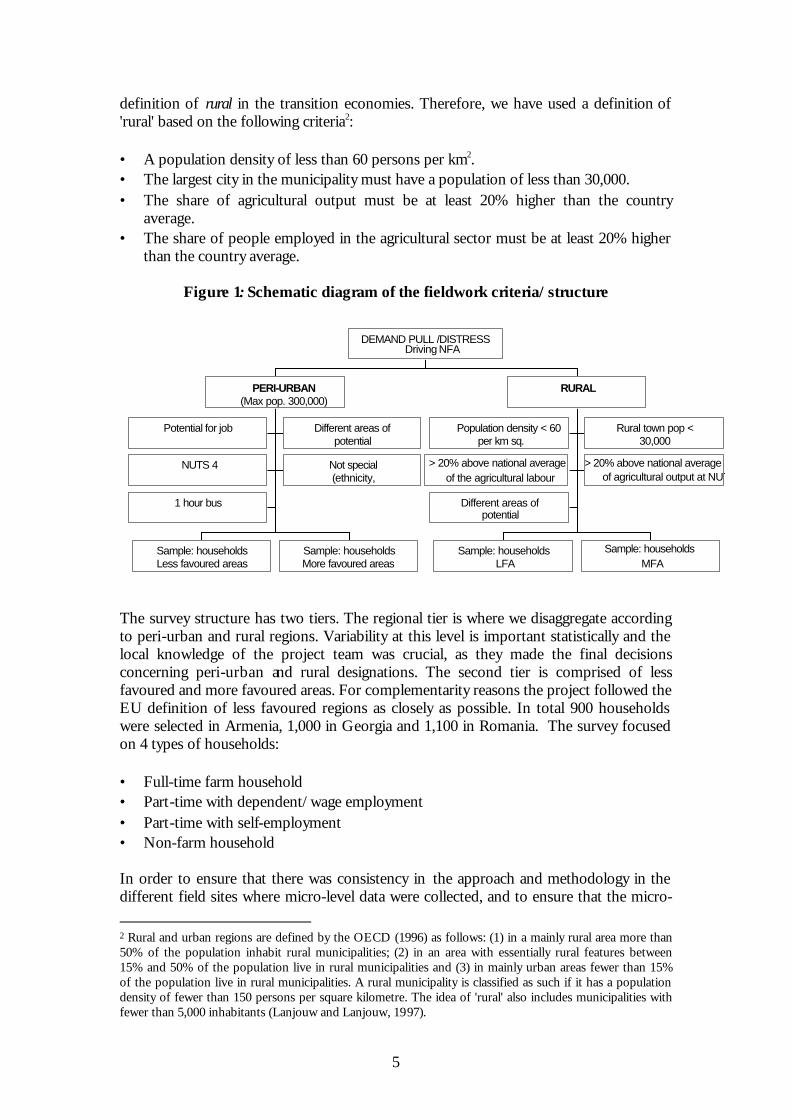
Source: Bezemer and Davis (2003); and EC PHARE ACE Project No. P98-1090-R EU Accession in the Balkans: Policy Options for Diversification in the Rural Economy. * Denotes data based on total household income, including social transfers. Typically, household income diversity is especially large in rural areas. Rural households are more often producers as well as consumers, which implies the presence of profit (from sold output) or in-kind income (if output is consumed) as income components in addition to, for instance, wages. Several other factors make it less likely that any single source of income is sufficient to meet rural household needs: larger household sizes, relatively lower remuneration of capital and labour, seasonality of agricultural revenues, and the more limited market development that often characterises rural areas. Rural poverty, although not necessarily everywhere more serious than urban poverty, has been and is an increasing problem in many transition countries (Milanovic, 1998). 1.3 Aims and rationale of approach In recent years there has been growing recognition of the role of the non-farm sector for employment, income smoothing and income generation in rural areas in the developing, developed and transition countries (Barrett et al, 2001; Lanjouw and Lanjouw, 1997). However, there has been limited focus on the factors that determine people’s capacity to take advantage of or to generate these opportunities. It is hypothesised that two processes are apparent: demand-pull, where rural people respond to new opportunities; and distress-push, where the poorest are driven to seek non-farm employment as a survival strategy. Sometimes these processes work together. The non-farm sector is thus vital for rural employment and incomes in situations of both stagnant and buoyant agriculture and rural economy as a whole. It is vital for Armenia and Georgia’s economic growth, as the development of remunerative and sustainable non-farm employment opportunities will have important effects in terms of poverty reduction.. It is also important for Romania’s EU accession, currently foreseen in 2007, as the development of remunerative and sustainable non-farm employment opportunities will have important effects in terms of the use of future structural funds, regional assistance and the implementation of the Common Agricultural Policy. This research identifies the key socio-economic factors, resources, activities and constraints to rural households and enterprises in the non-farm rural economy. These data were collected at the micro-level and analysed in the context of the sustainable livelihoods framework (Ellis, 2000), farm systems theory and contemporary econometric methodologies. The aim was to derive policy conclusions conducive to the development of sustainable rural livelihoods. Figure 1 provides a schematic diagram of the survey fieldwork criteria/structure. Certain secondary data and conceptual problems were encountered. There is no standardised
5
definition of rural in the transition economies. Therefore, we have used a definition of 'rural' based on the following criteria2: • A population density of less than 60 persons per km2. • The largest city in the municipality must have a population of less than 30,000. • The share of agricultural output must be at least 20% higher than the country
average. • The share of people employed in the agricultural sector must be at least 20% higher
than the country average.
Figure 1: Schematic diagram of the fieldwork criteria/structure
The survey structure has two tiers. The regional tier is where we disaggregate according to peri-urban and rural regions. Variability at this level is important statistically and the local knowledge of the project team was crucial, as they made the final decisions concerning peri-urban and rural designations. The second tier is comprised of less favoured and more favoured areas. For complementarity reasons the project followed the EU definition of less favoured regions as closely as possible. In total 900 households were selected in Armenia, 1,000 in Georgia and 1,100 in Romania. The survey focused on 4 types of households: • Full-time farm household • Part-time with dependent/wage employment • Part-time with self-employment • Non-farm household In order to ensure that there was consistency in the approach and methodology in the different field sites where micro-level data were collected, and to ensure that the micro- 2 Rural and urban regions are defined by the OECD (1996) as follows: (1) in a mainly rural area more than 50% of the population inhabit rural municipalities; (2) in an area with essentially rural features between 15% and 50% of the population live in rural municipalities and (3) in mainly urban areas fewer than 15% of the population live in rural municipalities. A rural municipality is classified as such if it has a population density of fewer than 150 persons per square kilometre. The idea of 'rural' also includes municipalities with fewer than 5,000 inhabitants (Lanjouw and Lanjouw, 1997).
Potential for jobcreation
Different areas ofagriculturalpotential
NUTS 4 Not specialcases(ethnicity,
gender)1 hour busdistance
Sample: householdsLess favoured areas
(LFA)
Sample: householdsMore favoured areas
(MFA)
PERI-URBAN(Max pop. 300,000)
Population density < 60per km sq.
Rural town pop <30,000
> 20% above national averageof the agricultural labour
force
> 20% above national averageof agricultural output at NUTS3
Different areas ofagriculturalpotential
Sample: householdsLFA
Sample: householdsMFA
RURAL
DEMAND PULL /DISTRESSPUSHDriving NFA
6
level data collection and the modelling work is well-integrated, NRI organized in-country meetings and workshops with relevant research and government agencies. For a detailed explanation of the survey design and sampling frame for each country we refer to the individual country reports listed in the reference section at the end of this paper (Bezemer and Davis, 2003a,b, c). 2 Country background The territory of Armenia is administratively divided into 11 marzes, including the capital city Yerevan, which has also been granted the marz status. As territorial-administrative units, marzes were formed on 4 December 1995, by the Territorial-Administrative Division Act. Marzes are divided into rural (871) and urban (47) communities, while the capital city of Yerevan is divided into 12 districts (communities). Armenia has relatively limited agricultural resources and, in the long term, the weight of agriculture in the whole economy will fall to lower levels. Its important contribution to GDP (25%) reflects the fact that the sector has performed better than the rest of the economy in the first decade of transition. The large-scale distribution of land has enabled the agricultural sector to play a buffer role in the process of economic reforms, with a steep increase in agricultural employment, even if the agricultural labour force is largely under-utilized. In Armenia rural livelihoods, particularly for the poor are made more precarious by the prevalence of natural disasters such as drought and earthquakes. Armenia also has relatively high rates of internal and external migration. The territory of Georgia is administratively divided into 9 districts, 65 regions, and 5 towns of Republic Dependence (excluding Abkhazia and Tskhinvali). Georgia is a mountainous country extending across almost 70,000 km2 with a population of 5.5 million in 1991. Around 70% of the population is Georgian, 8% Armenian and about 6% each Russian and Azeri. Georgia’s capital Tbilisi comprises approximately 23% (1.3 million people) of the country’s total population. Population density in Georgia is 78.4 people per km2. Officially, 56% of Georgia’s population is classified as urban and 44% as rural. Agriculture is a key sector in the Georgian economy as it accounts for around 28% of GDP, generates 70% of value added in the non-service economy sectors and employs around 50% of the labour force (latest figures for 1999). This is true not only in rural areas, but also in small towns. Around 43 percent (3.2 million ha) of the territory is used for agriculture. However, yields are low, the domestic market is depressed and exports are small. The sector is dependent on irrigation infrastructure in the east and drainage infrastructure in the west. This infrastructure has virtually collapsed because of the civil war and deferred maintenance. In addition, the severe droughts of 1998 and 2002 demonstrated the fragility of rural households' coping strategies in the face of these shocks. More than 45% of Romania’s population lives in the rural environment, in localities known as “communes”. A commune is made up of several small villages, but there are also communes that consist of a single larger village. The rural area in Romania is considered to be the administrative territory of the 2,685 rural communes in the country. The past communist regime left an unfortunate inheritance in the rural area of vast mono-agricultural areas with a dilapidated infrastructure and with many villages deprived of elementary conditions for a decent living (potable water, electricity etc); particularly credit markets are poorly developed (Heidhues et al, 1998a,b). Government borrowing remains high, with budgets inflated by redundancy payments to workers dismissed from loss-making state-owned enterprises. During the period 1996-2002, the government has
7
managed to reduce the budget deficit from 4.0% of GDP to 3.0% while Gross Agricultural Output (GAO) has been fairly stable with the exception of 1992. Despite significant worsening of the terms of trade for agriculture during the period 1999 to 2002, it remains an important sector for the Romanian domestic economy. In 2000, the share of agricultural trade in GDP was 3.5%. In Romania rural livelihoods, particularly for the poor are based almost exclusively on subsistence agriculture, state transfers (pensions and social welfare transfers) and migration. For more information on the socio-economic, RNF and agricultural sector background to these countries we refer to the individual country reports listed in the reference section at the end of this paper (Bezemer and Davis, 2003a,b,c). 3 Main Problems for the Rural Economy in Transition Countries The literature (e.g. summarized in Davis and Bezemer, 2003; Davis and Pearce, 2000) indicates that key problems and constraints to non-farm employment include the following factors: Excessive rural labour market stress due to: • The slow expansion of the private sector which could absorb the excess labour • The low formal qualifications and high average age of the agricultural labour force • The high market transaction costs for goods, services and production factors Under-investment since transition in rural infrastructure: • A gap between rural and urban areas in terms of the quality and utility of
infrastructure, markets, institutional and informational facilities make it harder for certain types of employment or enterprise to be developed in rural areas.
• Central government transfers and external donor support could still play a key role in less favoured rural municipalities.
Lack of opportunities on-farm: • Low returns to farming • Lack of access to farm input markets • Temporary events and shocks such as droughts and earthquakes • Absence or lack of access to rural financial markets • Marketing constraints Significant constraints on rural non-farm SME and MSME development • A lack of capital to start a small business • Corruption and informal market entry barriers • A lack of informational infrastructure – limited information on regional prices,
markets etc., • A lack of MSME managerial know-how or training • A lack of an active/ functioning land market • A lack of demand • A lack of markets for agricultural produce
8
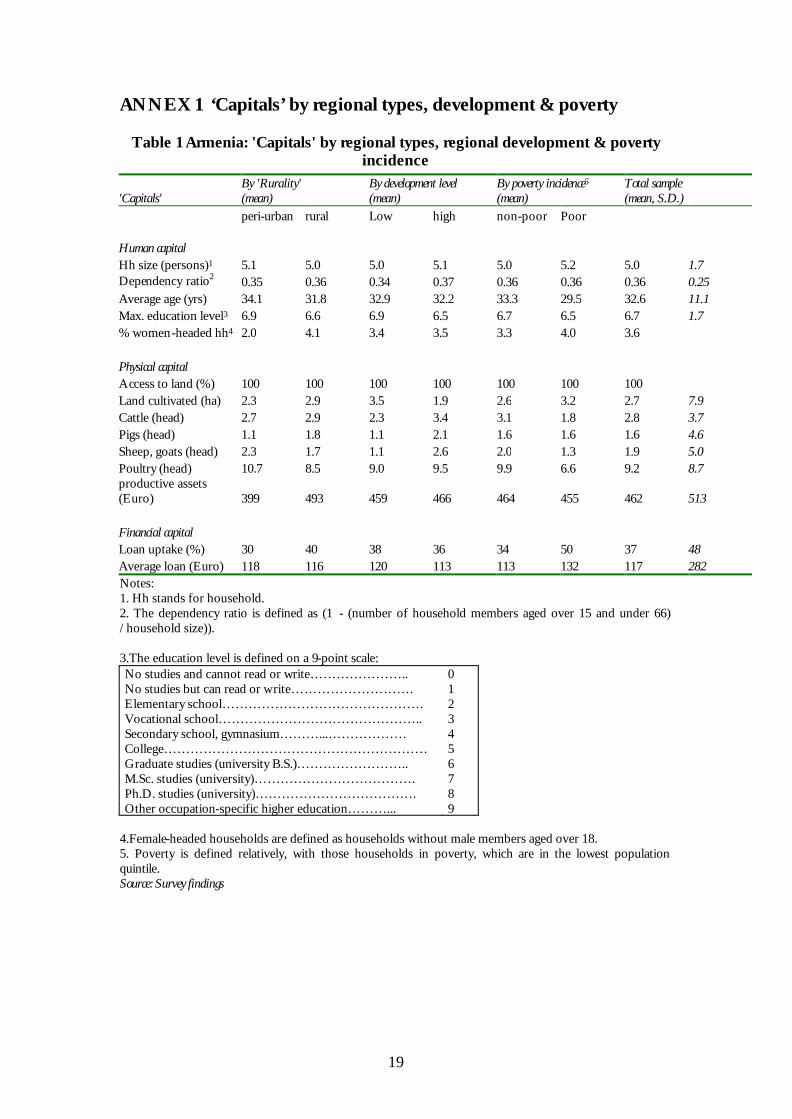
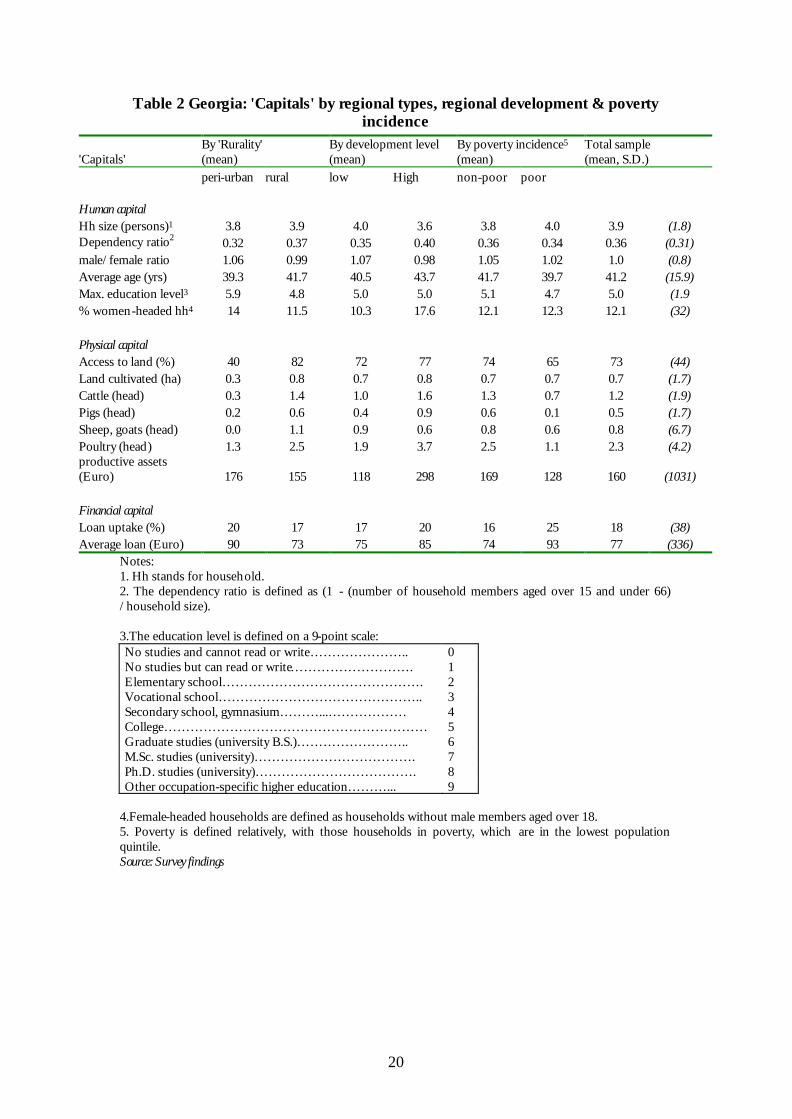
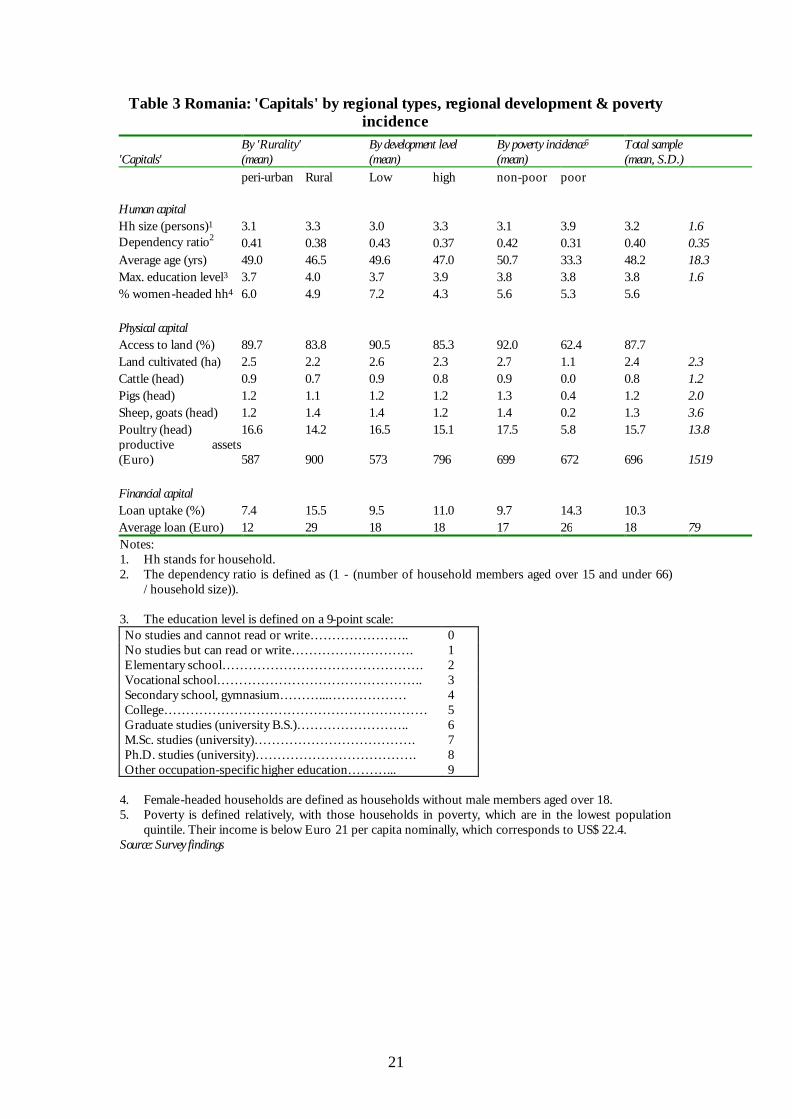
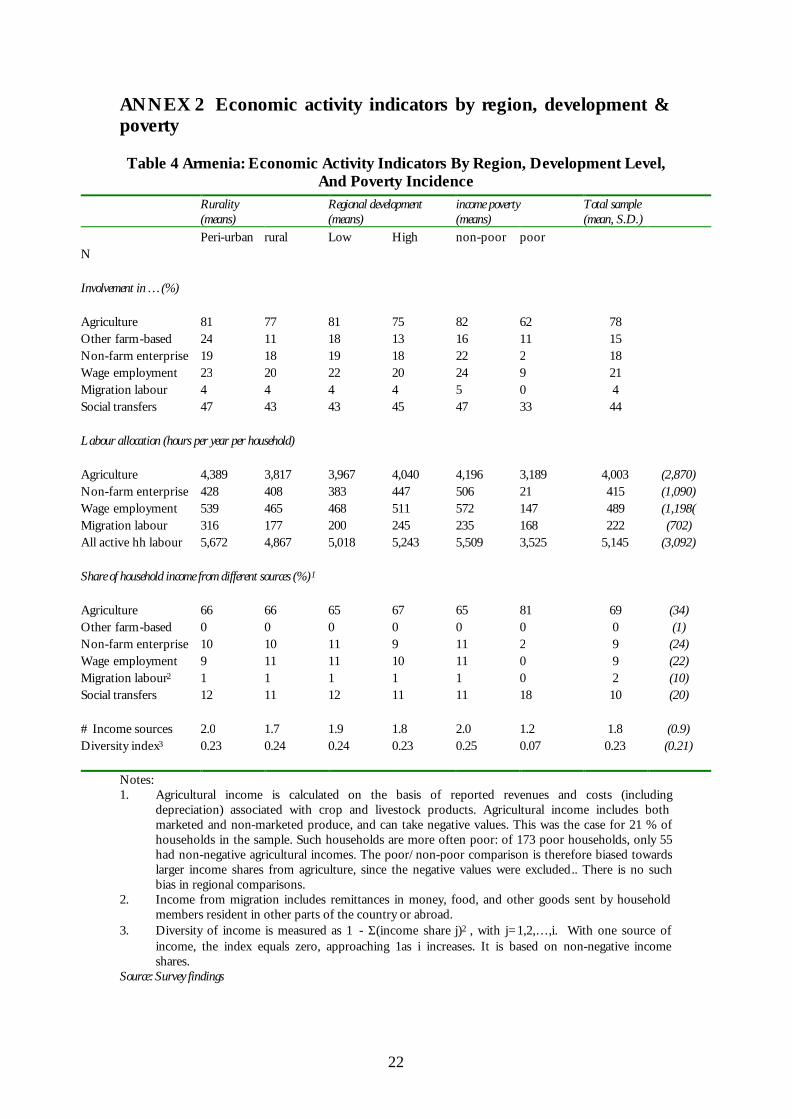
4 Overview of findings In most transition economies under socialism, the RNFE was large. Agro-industrial complexes and manufacturing co-operatives were widely located in rural areas as a means of developing and industrialising the country, which was a political objective of those regimes. At the start of transition in 1990, most of this rural industrial and manufacturing base largely collapsed because it was heavily dependent on state subsidies and the continuation of soft-budget constraints. As compared to most developing countries, transition economies have a favourable endowment of rural infrastructure and high education levels. However, this legacy from socialism is now eroding. A striking aspect of our research is the diversity found across transition economies in terms of the structure of rural incomes, patterns of land distribution, and importance of non-farm activities for poor and non-poor households. In this section, the survey findings will be presented following the Sustainable Livelihoods approach of structuring livelihoods into capitals (or assets), activities, and outcomes in terms of household well-being, as measured by incomes. Annex 1 comprising Table 1, Table 2 and Table 3 presents the human, physical and financial capital of households in the survey, for different levels of natural and man-made capital (regional development and rurality) and by incidence of poverty. In Armenia, both poor3 and rural households are younger on average and women head more of these households than for the other countries that were surveyed. In Georgia rural households are on average larger, with an older demographic profile, more dependents and lower education levels than in Armenia and Romania. We found that Romanian households tend to be smaller, younger, better educated and less often without men. In Georgia and Romania access to land is not universal, but it is widespread. Landlessness in these two countries is most frequent for the poorest households. As regards capital endowments, loan uptake and access appears to be quite high in Armenia, particularly in rural areas and among poor households. It appears that rural credit markets are mainly used to satisfy household consumption needs rather than investments. These findings should however be interpreted with caution since standard deviations of loan data are large in each sample. Annex 2 comprising Table 4, Table 5 and Table 6, displays indicators for households’ involvement in economic activities, categorized by different levels of regional development and rurality and by incidence of poverty. The differences between the three countries in this regard are quite striking. For example, in Armenia agriculture accounts for 69 % of income on average. This is very high (higher for instance than the typical 50-60 % found for poor sub-Saharan African countries). If we accept the figure as valid, an explanation could be the combination of two developments unique to Armenia: rapid and serious impoverishment due to natural disaster, systemic disruption of economy and society, and violent territorial conflict, combined with a highly effective land distribution. In Armenia, poor households are less often involved in all economic activities, supply less household labour to economic activities, and derive less of their income from activities and relatively more from social transfers, all compared to non-poor households.
3 We define the poor or poorest households in our survey as those whose income fall within the lowest quintile of our sample.
9
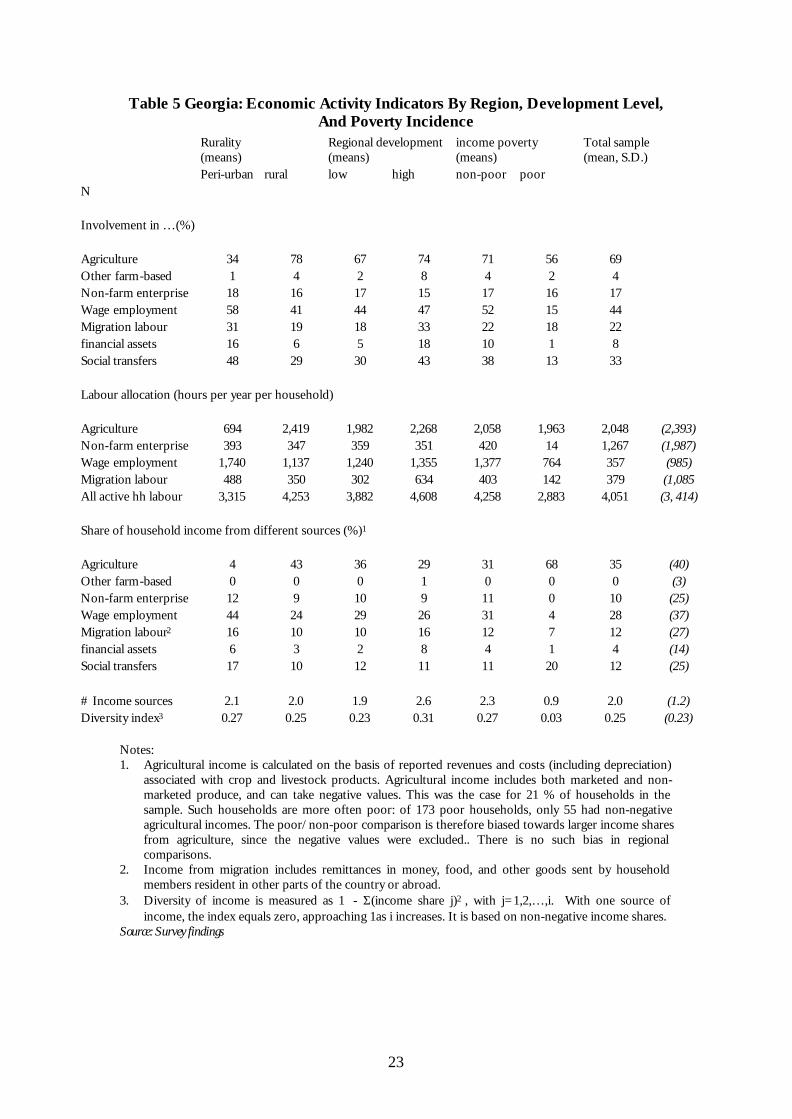
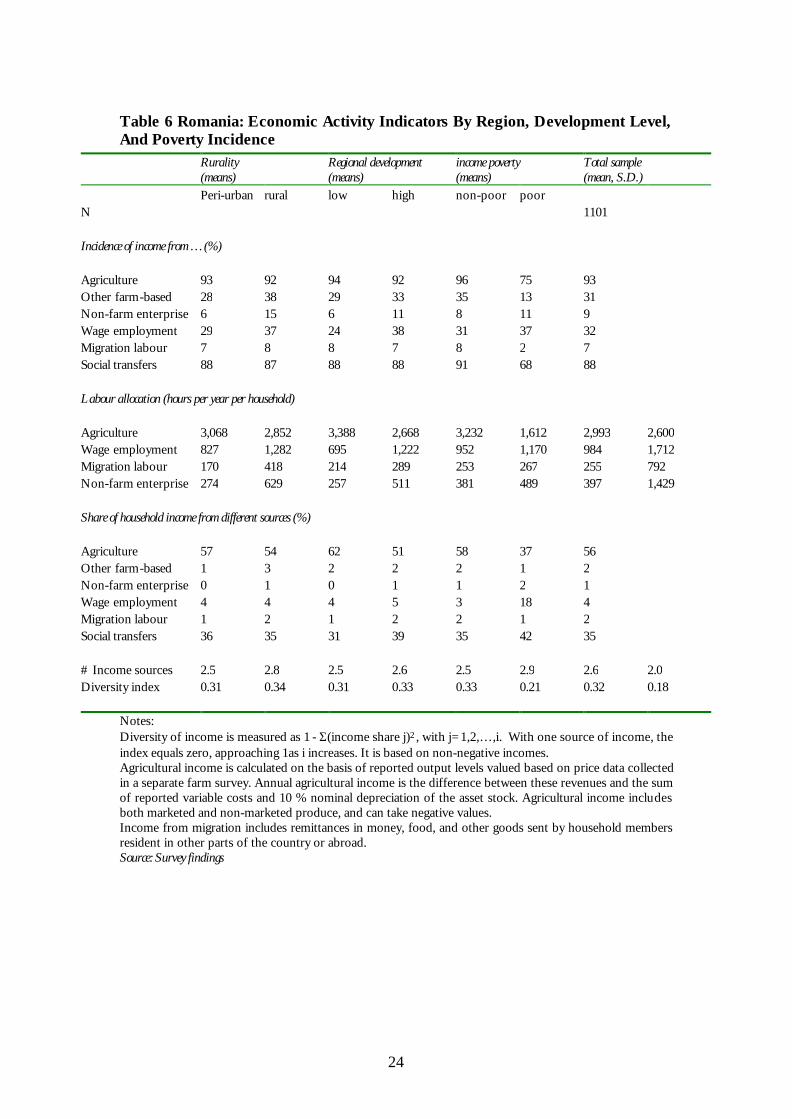
Particularly non-farm activities (wage employment and non-farm enterprise) are hardly accessed by the poor. Smaller diversity in household incomes, as reflected in the diversity index, is clearly associated with poverty. This suggests that access to gainful activities, and particularly to non-farm activities, is crucial to escaping poverty. In Georgia, the livelihoods structure is the opposite of Armenia, where agriculture is relatively unimportant: on average only 35 % of household income comes from food production, including in-kind income (see Table 5). The percentage of households deriving income from agriculture is also relatively low. This limited importance of agriculture in the rural economy is a result of Georgia’s incomplete land reforms. It is also a result of its recent past as an industrialised, relatively well-developed economy compared to many of the other Soviet republics in the Caucasus and Central Asia. Romanian rural livelihoods structures fall somewhere in-between the Armenian and Georgian cases (see Table 6). We found, in line with widespread access to land, virtually all non-poor households and three quarters of the poor produce food. A third of all households have an additional on-farm activity, such as food processing or renting out machinery and buildings, with little variation in this incidence between rural and peri-urban areas or with levels of regional development. However, poor households have such activities much less often. A tenth of households engage in non-farm enterprise, mainly in services; the poor more often than the non-poor. This may suggest that operating a non-farm enterprise represents a distress-push strategy that may provide a refuge from deeper destitution. Annex 5 presents bar graphs, which show the income distributional aspect of the RNFE in more detail, and provides an impression of the activities found within the RNFE. In bar graphs 1, 2 and 4 the share of agricultural and RNF income in earned income is displayed. This directly corresponds to economic activities, excluding income unrelated to activities such as social transfers. The first observation here is about the overwhelming importance of agriculture in Armenia and, to a lesser extent, Romania. Non-agricultural income there is largely social transfers, and does not reflect a vibrant RNFE. Second, the bar graphs show in more detail that the change in income structure over income levels is very different in Georgia as compared to Romania. In Georgia RNF income continually rises with total income and it appears to be mainly a privilege of the rich. In Romania the reverse is true, and the RNFE is a refuge for the poor. Bar graphs 3, 5 and 7 show that trade dominates both wage and self-employment in Georgia, while services dominate both in Romania. In Armenia, trade is over 60 % of all self-employed jobs, while the state sector accounts for a similar percentage in wage employment. While these observations are understandable in view of the different countries' background, we wish to highlight the policy implications. First, fostering the RNFE as a means of growth and poverty alleviation is best achieved by taking into account both its income distributional aspect and its sectoral structure. Both are likely to vary widely between countries. Second, as wage employment is typically an important RNFE component and state involvement is often large in this area, RNF policies should involve both private and public employers and entrepreneurs.
10
5 Analysis: assets, activities, and poverty The previous sections introduced the building blocks of rural households’ livelihoods, and the distribution of these between poor and non-poor households in the countries surveyed. The patterns observed in annexes 1 and 2 suggest some inferences on the nature of the RNFE. Based on this we will ask two further questions. First, what are the determinants of households’ involvement in the rural non-farm economy? Second, how, if at all, do rural non-farm activities contribute to poverty alleviation? It is useful to briefly set out some methodological decisions we made in addressing these questions. A first issue is to decide how to measure involvement in the RNFE. A number of candidates can be suggested: (a) Involvement as a binary (yes/no) variable, as indicated by deriving income from, or
allocating labour to, non-agricultural activities; (b) Income derived from non-agricultural activities, either in money units or as a share
in total income; (c) Labour allocated to non-agricultural activities, either in time units or as a share in
total household labour time. We note that agricultural incomes can be negative since it is calculated by subtracting costs from revenues. In these cases income shares cannot be calculated. This would exclude about a fifth of each country sample, with a strong bias towards excluding poor households. This would be a disadvantage of using income shares. When choosing between labour time and income as measures of the extent of involvement, it is useful to note that this analysis aims to provide guidance to policies fostering the economic benefits to rural households from participating in the rural non-farm economy. We are not primarily interested in providing advice on how to bring households to allocate more time to rural non-farm activities. The two measures will largely, but not completely overlap. We therefore selected as the binary variable the incidence of income from specific non-agricultural activities. A further methodological choice is whether to use a binary of continuous measure for non-agricultural income (options (a) or (b) above). The latter is more informative since it reflects not only participation itself but also the extent in income terms; but further exploration showed that the information in the data allows us to estimate with some significance participation in non-agricultural activities, but not its extent, as measured in a continuous income variable. Hence, option (a) above was selected. The logistic specification, appropriate for binary dependent variables, was then employed (the 'probit' specification yielded very similar results). The variables reflecting natural, human, physical, and financial capitals, presented in Annexes 1 and 2, were used as independent variables. Locational variables included dummies for development level and for rural or peri-urban location (DEVELOPED and RURAL). Independent variables representing human capital included household size (HHSIZE), dependency ratio and male/female ratios (DEPRATIO and M_F_RATIO), average age (AGE), highest level of education (MAXEDU) and a dummy denoting households without adult men (WOMENHEAD). Variables representing wealth included the area of land (LAND), the value of equipment (ASSETS), the number of livestock (ANIMALS) and amount of credit taken up in 2001 (LOAN). Possible synergies or trade-offs between agricultural and other activities were taken into account
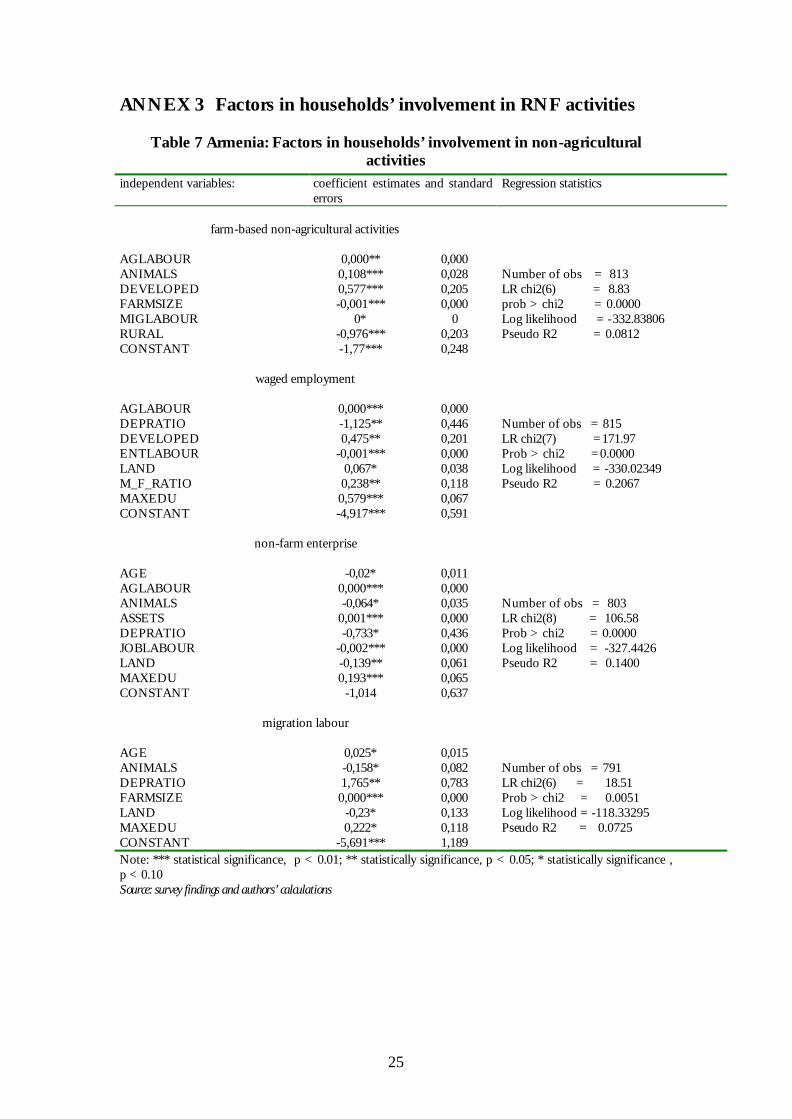
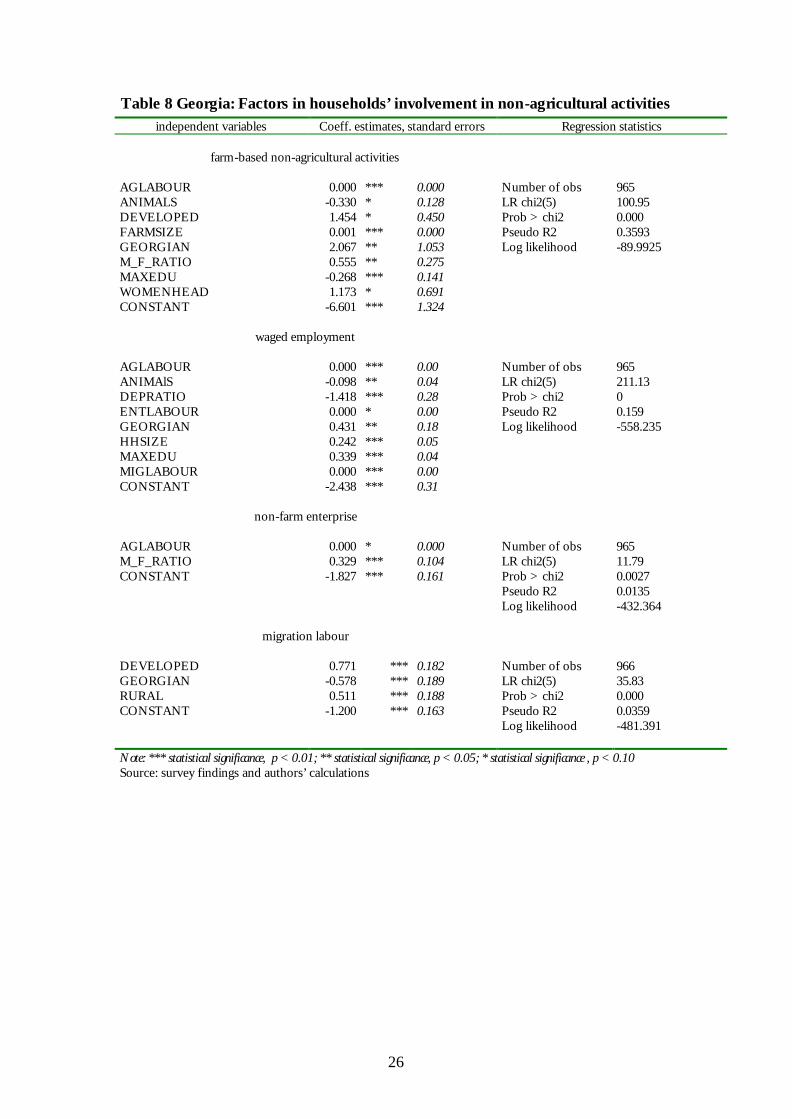
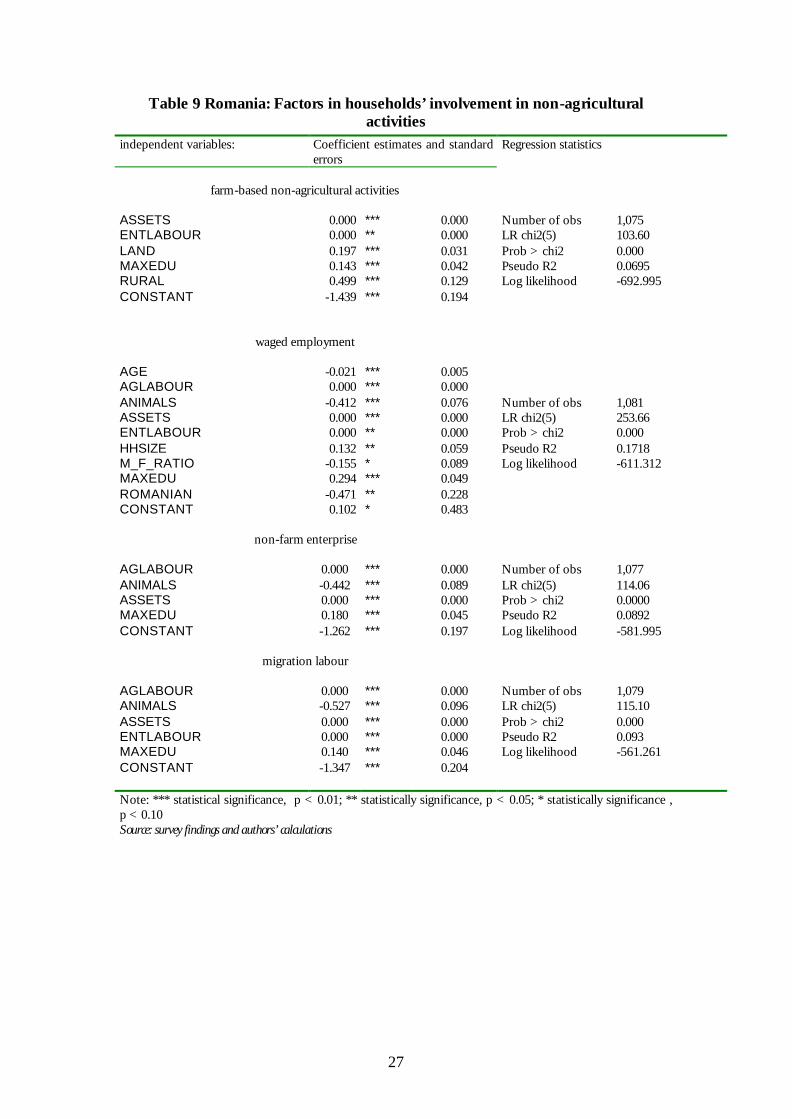
11
by including farm size in revenue terms (AGREV), and labour allocated to other activities (MIGLABOUR, ENTLABOUR, JOBLABOUR and AGLABOUR). Dependent binary variables are the incidence of income from farm-based non-agricultural activities, from non-farm wage employment, from non-farm enterprise, and from migration labour. For more detailed information on the methodology employed we refer to the individual country reports listed in the reference section (Bezemer and Davis, 2003a,b,c). Annex 3 comprising Table 7, Table 8 and Table 9 presents the results of the four logistic regressions for each of the three countries. In interpreting the findings, it is useful to note that coefficient estimates reflect the statistical association between independent factors and households’ involvement in the three non-agricultural activities analysed. Since there are scale unit differences between independent factors, comparisons between coefficient values are not meaningful. The discussion is therefore presented in terms of comparisons between the signs of the various coefficients. We found that in all three of the countries, there do not appear to be trade-offs between labour allocated to the various non-agricultural activities and labour allocated to agriculture. The coefficient estimates for AGLABOUR equal zero or are insignificant. This implies that households in the sample are not labour-constrained in agriculture, indeed they may be underemployed. In Armenia and Romania location matters to the incidence of farm based non-agricultural activities and wage employment, which are more frequent in better-developed areas (MFA). Again, in each country it appears that households with more land and animals are less likely to have a non-farm enterprise. This could be because better-endowed farms generate more income (above the reservation wage), which would lessen the need to seek additional non-farm income. But concentration on subsistence farming on very small plots may increase the risk of poverty. We found that wage employment is mainly determined by human capital factors, and is more likely among households that have fewer dependents, larger households, and better education levels. In Armenia, to a greater extent than the other countries, the incidence of migration labour is positively associated with both the age and dependency ratio. This suggests that particularly families without children are better able to generate income from (temporary) work outside the locality, in or outside Armenia. More land and livestock binds people to their locality, decreasing the probability of migration; better education makes migration more likely. Overall, the general importance of education for non-farm activities is clear. Those with higher education levels more often engage in all three types of off-farm activities, plausibly because education is better-rewarded off-farm. The analysis also serves to underline the differences, over non-farm activities, in conditioning factors. Location is important for wage employment and farm-based activities, but not for non-farm enterprise. The nature of the farm as indicated by land, animals, and assets, is relevant to non-farm enterprise, but hardly to wage employment. We now address the second analytical question. How, if at all, do rural non-farm activities contribute to poverty alleviation? This possible connection, and its complex nature, has been the rationale for much recent research into the RNFE. We will analyse it by looking at the association of a household’s assets and economic activities with its risk
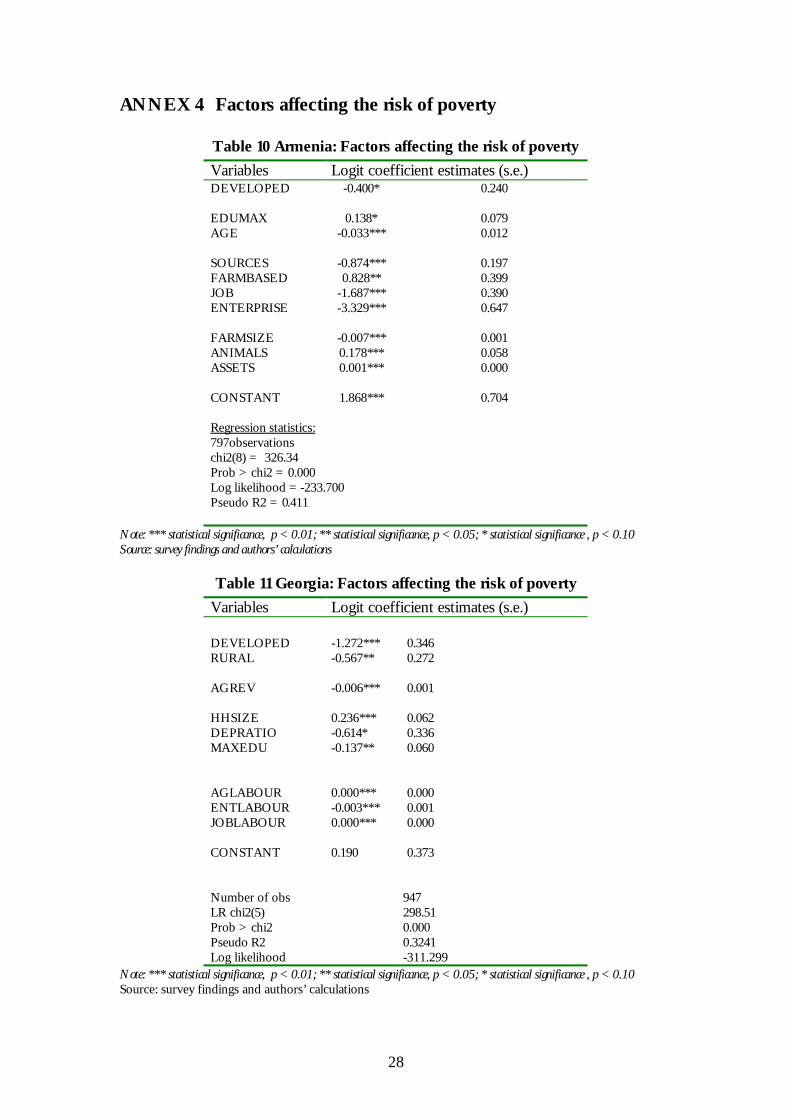
12
of poverty. The appropriate analysis is again a binary logit regression, where the dependent variable reflects whether (1) or not (0) a household is in poverty. Since we study cross-country poverty, it is defined relatively in terms of the per capita income level in the lowest quintile. We note that this is a much stricter definition for poverty than most conventional, absolute measures. The pattern of a households’ economic activities is captured by variables indicating their having income (1) or not (0) from non-farm enterprise (ENTERPRISE), wage employment (JOB), and migration (MIGRATE). We include the ‘capital’ variables reported on above, which plausibly also bear on the risk of poverty, and the number of income sources. The findings should be interpreted as follows: the coefficients with a negative sign imply that the presence of (or increase in) the associated factor decreases the risk of poverty. Again, it is the sign rather than the value of the coefficients, which we discuss below. For more detailed information on the methodology employed we refer to the individual country reports listed in the bibliography (Bezemer and Davis, 2003a,b,c). Annex 4 comprising Table 10, Table 11 and Table 12 present our findings on the risk of poverty in four areas: human capital, economic activities, location and the structure of agricultural holdings. In Armenia, in common with Georgia and Romania, we found that households in better-developed areas have a lower risk of poverty. Somewhat counter-intuitively, those with higher education levels are more at risk of poverty. However both the coefficients are only weakly significant (see Table 10). More sources of income are associated with lower poverty risk. This is particularly due to the effects of wage employment and enterprise employment, both of which enter with highly significant coefficients. Migration is also concentrated among the better-off households, but its incidence is too low for it to appear statistically significant in this analysis. Households engaged in farm-based non-agricultural activities have higher risks of poverty. In addition, other farm-connected variables such as the number of livestock and stock of assets have this effect. The interpretation suggests that these bind household members to farm work, excluding opportunities for more remunerative activities. It is only high farm revenues, not larger farms in other terms (such as land or labour), which decrease poverty risk. Also in Georgia, larger farms, in revenue terms, imply a smaller risk of poverty. This intuitively clear finding underlines the importance of viable farming structures to alleviating poverty. Larger households in the Georgian sample are more at risk from poverty, which is a finding common to many studies on poverty. Better education helps reduce the risk of being impoverished. We also find some evidence that having more dependents is weakly associated with a lower risk of poverty. One possible explanation of such a result could be the access to pension payments or child benefits that a pensioner or young child implies, lifting some households out of income poverty (as we have defined it). Since more household members also require higher consumption levels, it is open to question as to whether a higher dependency ratio also implies an increase in (not only income, but also) consumption and well-being more broadly interpreted. In Georgia, we found that there is no additional effect on the risk of poverty from being more heavily involved, in terms of labour allocation, in either wage employment or agriculture. In the case of agriculture, this is understandable because there is hardly any difference in labour allocation to agriculture between poor and non-poor households. In
13
the case of wage employment, there is a large difference, but the effect of wage employment on risk of poverty is likely already captured by human capital variables. In Romania, we found that households with a higher average age (fewer or no children) and those with better education are less often found in the lowest income quintile. Non-farm enterprise and migration labour are found to be positively associated with a higher risk of poverty. Such activities may still play a role in the reduction of deep poverty, by allowing poor households to prevent deeper destitution. But it does not help reducing poverty as defined by our relative poverty line. Such non-agricultural activities appear to be of a distress-push nature. The fact that, despite these findings, having more sources of income is still linked to a reduced risk of poverty may be due to the main non-agricultural income sources, wage employment and social transfers. Romanian households with livestock-orientated farm operations are less at risk of poverty, in line with the generally higher returns to livestock production compared to crop production. It is interesting to note that location does not have a statistically significant relation to the risk of poverty in Romania. This is not to say that less developed areas, or more rural areas do not have a higher incidence of poverty; but rather that any location-specific effects are incorporated in the other variables. This is desirable in an applied study, since polices cannot influence locality; but they can affect those other factors that may make households, and indeed localities, vulnerable to poverty. In Romania’s rural economy, characterized by high levels of subsistence food production, low levels of savings, and faltering financial markets, it could be argued that it is mainly the physical and human capitals that determine income and poverty levels.
14
6 Summary and Conclusions The radical changes that have occurred in the Armenian, Georgian and Romanian economies during the last decade have created new pressures on these countries’ rural areas. Increasing industrial unemployment generated an urban-rural migratory flow. The collapse of the agri-industrial processing and industrial sector increased rural unemployment. Since the collapse of the former Soviet Union, land reforms have also generated new relationships in rural areas, and a massive redistribution of land. However, agriculture continues to function inefficiently, and is unable to provide a decent and sustainable standard of living for most rural inhabitants. Therefore, many donors and multilateral agencies are focusing on the potential of the rural non-farm economy (RNFE) and more specifically, non-farm diversification to reduce rural underemployment. There are several reasons underlying the decision to diversify. These include low on-farm incomes or returns on labour, the existence of a surplus of resources (land, capital, labour or knowledge), as a strategy to spread risk, or to smooth the impact of the fluctuations in a single source of income (e.g. agriculture). In Armenia, agricultural growth (particularly in terms of generating higher farm revenues) has an important role to play in the effort to reduce poverty in rural areas. This is all the more so as subsistence agriculture is by far the most important activity present in rural areas, accounting for around 80 percent of household incomes on average. There is under-employment in agriculture. It is therefore important to increase the use of labour by enhancing production in off-farm activities in rural areas. Increased agricultural efficiency may both release farm labour and raise farm incomes. Our findings suggest that in order to be most effective in reducing poverty in rural areas, agricultural development should not be confined to medium-sized or large farms only, which are a minority. There is an increasing awareness of the importance of non-farm employment activities in the Georgian rural economy among multilateral donors and NGOs. In Georgia, a sizeable proportion of the population derives a living from agriculture, but its contribution to total income is relatively low. The rural households in our study depend on non-farm sources for 65% of their income on average. The role of local non-farm rural activities should increase, as there is still an acute dependence on social welfare payments in many households for livelihood security. As in Armenia, labour in agriculture and other activities in rural areas is under-utilized. It is therefore important to increase the use of labour by enhancing production in the agricultural sector and in off-farm activities in rural areas. Our survey of Romania shows that rural non-farm activities are important in supporting poor household livelihoods, complementing farming activities. The reasons for involvement in non-farm activities varied according to the level of different types of capital. Overall, poor households are most involved in non-farm activities due to distress-push factors; better-off, higher-status households tend to be involved due to demand-pull factors. Our surveys in Armenia, Georgia and Romania have highlighted the importance of social transfers as a source of non-farm income in supporting the livelihoods of the rural poor. Non-farm sources of wage and enterprise income are very important for Georgian households, but much less so in Romania and Armenia, mainly because of the prevalence of social transfers and better access to land, respectively. More land and livestock tends
15
to bind people to their locality, decreasing the probability of migration; whilst better education makes migration more likely. Our investigations of the current RNFE situation in Armenia, Georgia and Romania have provided different pictures of types of employment/income activities undertaken, and distribution of time and income over activities. These differences need to be interpreted in the context of the respective current stage of reform and economic development reached in both the rural sector and economy-wide. The differences in activities and context will also imply different potential growth patterns. In Romania particularly and Armenia to some extent, current RNFE development potential may be less constrained by the business environment and more constrained by farm structure and the influence this has on the commercialisation of agriculture and investment in RNF activities. RNFE development in Georgia is constrained by both factors. For more information on these issues and the policy implications of our research findings we refer to the individual country reports listed in the reference section below (Bezemer and Davis, 2003a,b,c). Taking a more general view, the following factors may be crucial in promoting RNFE development and employment: • In some countries, reform of exchange rates, tariff and enterprise taxation policies
will be required to develop a sound enabling environment for RNFE growth. • Take measures that promote land consolidation, a key element of which is the
stimulation of the land market. This will help create conditions for the use of collateral for loans and investment in viable on-farm and non-farm activities.
• Encourage large processing factories and SMEs to open branches in rural areas. This would enable the development of marketing, procurement and distribution chains through firms from the core to the peripheral rural areas. Also, as the poor in many countries are most often involved in wage employment, this is a job creating strategy that directly supports the poor.
• Improve community infrastructure, particularly roads, railways, information technology systems and telecommunications. The integration of credit with training and technology extension programs should also be developed.
• Promote the establishment of farmers’ associations, co-operatives and credit clubs to conduct consultations in farms regarding marketing, purchase of various services, using extension services, receiving credits and other matters relating to the development of co-operatives or farming/producer associations. Collective action makes sense where it can achieve more than could be obtained by individual initiative alone. In most transition economies, we feel that rural collective action could achieve economies of scale in the RNFE that individuals cannot currently reach, particularly in terms of buying and selling when scale confers more power to negotiate prices and terms. Also, collective action in rural areas enables the supply of public goods and services which support RNFE growth that no private business would supply – since they would not be able to get payment from all who benefited (e.g. roads etc). Important also is support for social capital systems and networks, which provide basic services and sustenance for the poorest in rural communities.
• Special programs for rural areas which support RNFE growth should also be considered, for example: employment and resource centres, a national coordination council, vocational training for secondary school drop-outs; storage and processing facilities for perishable products; and a fleet of modern transport with refrigeration facilities.
16
• There needs to be greater coordination and integration between NGO activities with public sector programs in rural areas; particularly in terms of micro-credit provision. In addition, local governance institutions need real fiscal power, to better generate/ retain local tax revenues and increase investment in local communities and resources.
Although we have shown that the RNFE may have potential for rural poverty alleviation, conceptually the RNFE remains confusing and unclear (Davis and Bezemer, 2003). The multifarious economic activities with differing pro-poor growth potential and implications for policy intervention make it important to focus on key issues and activities (e.g., tourism, construction, transport services etc.) which have growth potential. At the same time, the importance of linkages and multiplier effects in the rural economy implies that governments and multilateral agencies need to move away from traditional sectorally compartmentalised thinking of rural areas towards more “joined-up” models of multisectoral, mutually symbiotic growth. Key issues of relevance to the RNFE in transition countries for further research include: identifying drivers of rural economic growth, the social cost of demographic change, possible trajectories of economic transformation, and how to facilitate market and enterprise development. We need to improve our understanding of how degrees of rurality with respect to market access, agricultural productivity and other variables affect the stage and mode of the RNFE and thus its potential for pro-poor growth. We also need an improved understanding of the nature and routings of the main linkages in rural-urban space, both backwards and forwards from agriculture. There are also important globalisation aspects to this in terms of domestic and international demand for rural exports (whether labour, commodities or capital). We have tried to make the case for improved rural job creation in our study, and further research in this regard will need to consider whether and how much public subsidy may be required to compensate the private sector for the potential costs of locating value-adding activities in rural areas? Is there scope for government and multilateral agencies to provide incentives to the private sector, perhaps through intervening (in a non-distortionary way) in existing commodity chains and enterprises to be more pro-poor? Again, interventions could be promoted via tax breaks, training and infrastructure; but also on a sub-sectoral basis (producer associations, marketing support) or spatial basis (enterprise clusters, around rural towns etc.). Research and future investigations on the RNFE would also need to consider whether businesses in general, could viably do more out-contracting to rural areas (by investigating the cost implications of this)? Macroeconomic factors have an important impact on the RNFE, as they affect general employment opportunities and the institutional framework within which the RNFE functions – in particular, the education system; financial institutions and credit market; factors which influence the development of MSMEs; and the land market and farm structure. Reforms within the agriculture sector also have a major impact on the RNFE due to the linkages between the two sectors, both of a positive and negative nature. In general terms, growth in the farming sector has a positive influence on the RNFE and vice-versa, but it is vital that the RNFE is expanded in order to improve rural livelihoods in the long-run when the farming sector is expected to contract. With the resumption of economic growth, as incomes rise, there will be a need to allow for a shift in patterns of demand towards industry and then services. This does not mean that agriculture declines as the economy grows, but that the share of agricultural output in total output will decline. Since agricultural productivity starts at a very low level, it can
17
be expected to rise, probably faster than in some other sectors, so constant or slowly rising output (in agriculture) will continue to be accompanied by major job losses. In the short-medium term, the growth of the rural non-farm private sector will exacerbate current economy-wide trends of higher income dispersion than that in the former state sector. Therefore, many of the low-paid in the new non-farm MSMEs earn less than state employees (when they are paid). A dualistic economic structure is developing where good jobs in the new RNFE private sector require better-educated and skilled people than most former state employees, which displace backward industries and agriculture. The long-term unemployed throughout the region are becoming a large reserve of less-employable labour. There remains a question as to whether the RNFE should be left to itself – with national governments and their agencies merely ensuring that the institutional and other reforms continue to progress – or whether it requires positive intervention. The arguments provided in this paper suggest that the latter would be helpful, possibly even essential. The RNFE in transition economies should be viewed as an integral part of a growth strategy for the economy and not only as a defensive survival strategy (Davis and Bezemer, 2003).
18
References ACE-Phare 98: EU Accession in the Balkans; Policy options for Diversification in the
Rural Economy, (Project acronym BPODRE) Project No; P98-1090-R Final Report.
Barrett, C., T. Reardon, and P. Webb (2001) Non-farm Income Diversification and Household Livelihood Strategies in Rural Africa: Concepts, Issues, and Policy Implications. Food Policy: 26 (4).
Bezemer, D. J., and Davis, J.R. (2003a) The rural non-farm economy in Armenia: Overview of findings. NRI, unpublished mimeo.
Bezemer, D. J., and Davis, J.R. (2003b) The rural non-farm economy in Georgia: Overview of findings. NRI, unpublished mimeo.
Bezemer, D. J., and Davis, J.R. (2003c) The rural non-farm economy in Romania: Overview of findings. NRI, unpublished mimeo.
Davis, J.R. and Bezemer, D.J., (2003) Key emerging and conceptual issues in the development of the rural non-farm economy in developing countries and transition economies, unpublished mimeo.
Ellis, F. (2000) The Determinants of Rural Livelihood Diversification in Developing Countries. Journal of Agricultural Economics. Vol. 51 (2): 289-302.
Heidhues, F., Davis, J.R., & Schrieder G. (1998a) Agricultural transformation and implications for designing rural financial policies in Romania, the European Review of Agricultural Economics, vol. 25, Issue No. 3, 1998.
Heidhues, F., Schrieder G., Hare, P.G., Davis, J.R., & Gaburici, A. (1998b) Empirical Research on the Financial Market in Romanian Private farm Sector, Romanian Economic Research Observer, Nos. 3-4 1998. Pub. Romanian Academy the National Institute of Economic Research. ACE Phare 95.
Lanjouw JO and Lanjouw P (1997) The rural non-farm sector: an update. Paper presented at the XXIII International Conference of Agricultural Economists (IAAE) on Food security, diversification and resource management: refocusing the role of agriculture. 10-16 August, Sacramento, USA.
Lerman Z, and Mirzakhanian (1999) Private Agriculture in Armenia. Washington, D.C. World Bank.
Milanovic, M., (1998) Income, Inequality, and Poverty during the Transition from Planned to Market Economy, World Bank Regional and Sectoral Studies, 1998.
19
ANNEX 1 ‘Capitals’ by regional types, development & poverty
Table 1 Armenia: 'Capitals' by regional types, regional development & poverty incidence
'Capitals' By 'Rurality' (mean)
By development level (mean)
By poverty incidence5
(mean) Total sample (mean, S.D.)
peri-urban rural Low high non-poor Poor Human capital Hh size (persons)1 5.1 5.0 5.0 5.1 5.0 5.2 5.0 1.7 Dependency ratio2 0.35 0.36 0.34 0.37 0.36 0.36 0.36 0.25 Average age (yrs) 34.1 31.8 32.9 32.2 33.3 29.5 32.6 11.1 Max. education level3 6.9 6.6 6.9 6.5 6.7 6.5 6.7 1.7 % women-headed hh4 2.0 4.1 3.4 3.5 3.3 4.0 3.6 Physical capital Access to land (%) 100 100 100 100 100 100 100 Land cultivated (ha) 2.3 2.9 3.5 1.9 2.6 3.2 2.7 7.9 Cattle (head) 2.7 2.9 2.3 3.4 3.1 1.8 2.8 3.7 Pigs (head) 1.1 1.8 1.1 2.1 1.6 1.6 1.6 4.6 Sheep, goats (head) 2.3 1.7 1.1 2.6 2.0 1.3 1.9 5.0 Poultry (head) 10.7 8.5 9.0 9.5 9.9 6.6 9.2 8.7 productive assets (Euro) 399 493 459 466 464 455 462 513 Financial capital Loan uptake (%) 30 40 38 36 34 50 37 48 Average loan (Euro) 118 116 120 113 113 132 117 282 Notes: 1. Hh stands for household. 2. The dependency ratio is defined as (1 - (number of household members aged over 15 and under 66) /household size)). 3.The education level is defined on a 9-point scale: No studies and cannot read or write………………….. 0 No studies but can read or write………………………. 1 Elementary school………………………………………. 2 Vocational school……………………………………….. 3 Secondary school, gymnasium………...……………… 4 College…………………………………………………… 5 Graduate studies (university B.S.)…………………….. 6 M.Sc. studies (university)………………………………. 7 Ph.D. studies (university)………………………………. 8 Other occupation-specific higher education………... 9
4.Female-headed households are defined as households without male members aged over 18. 5. Poverty is defined relatively, with those households in poverty, which are in the lowest population quintile. Source: Survey findings
20
Table 2 Georgia: 'Capitals' by regional types, regional development & poverty incidence
'Capitals' By 'Rurality' (mean)
By development level (mean)
By poverty incidence5
(mean) Total sample (mean, S.D.)
peri-urban rural low High non-poor poor Human capital Hh size (persons)1 3.8 3.9 4.0 3.6 3.8 4.0 3.9 (1.8) Dependency ratio2 0.32 0.37 0.35 0.40 0.36 0.34 0.36 (0.31) male/female ratio 1.06 0.99 1.07 0.98 1.05 1.02 1.0 (0.8) Average age (yrs) 39.3 41.7 40.5 43.7 41.7 39.7 41.2 (15.9) Max. education level3 5.9 4.8 5.0 5.0 5.1 4.7 5.0 (1.9 % women-headed hh4 14 11.5 10.3 17.6 12.1 12.3 12.1 (32) Physical capital Access to land (%) 40 82 72 77 74 65 73 (44) Land cultivated (ha) 0.3 0.8 0.7 0.8 0.7 0.7 0.7 (1.7) Cattle (head) 0.3 1.4 1.0 1.6 1.3 0.7 1.2 (1.9) Pigs (head) 0.2 0.6 0.4 0.9 0.6 0.1 0.5 (1.7) Sheep, goats (head) 0.0 1.1 0.9 0.6 0.8 0.6 0.8 (6.7) Poultry (head) 1.3 2.5 1.9 3.7 2.5 1.1 2.3 (4.2) productive assets (Euro) 176 155 118 298 169 128 160 (1031) Financial capital Loan uptake (%) 20 17 17 20 16 25 18 (38) Average loan (Euro) 90 73 75 85 74 93 77 (336)
Notes: 1. Hh stands for household. 2. The dependency ratio is defined as (1 - (number of household members aged over 15 and under 66) /household size). 3.The education level is defined on a 9-point scale: No studies and cannot read or write………………….. 0 No studies but can read or write………………………. 1 Elementary school………………………………………. 2 Vocational school……………………………………….. 3 Secondary school, gymnasium………...……………… 4 College…………………………………………………… 5 Graduate studies (university B.S.)…………………….. 6 M.Sc. studies (university)………………………………. 7 Ph.D. studies (university)………………………………. 8 Other occupation-specific higher education………... 9
4.Female-headed households are defined as households without male members aged over 18. 5. Poverty is defined relatively, with those households in poverty, which are in the lowest population quintile. Source: Survey findings
21
Table 3 Romania: 'Capitals' by regional types, regional development & poverty incidence
'Capitals' By 'Rurality' (mean)
By development level (mean)
By poverty incidence5
(mean) Total sample (mean, S.D.)
peri-urban Rural Low high non-poor poor Human capital Hh size (persons)1 3.1 3.3 3.0 3.3 3.1 3.9 3.2 1.6 Dependency ratio2 0.41 0.38 0.43 0.37 0.42 0.31 0.40 0.35 Average age (yrs) 49.0 46.5 49.6 47.0 50.7 33.3 48.2 18.3 Max. education level3 3.7 4.0 3.7 3.9 3.8 3.8 3.8 1.6 % women-headed hh4 6.0 4.9 7.2 4.3 5.6 5.3 5.6 Physical capital Access to land (%) 89.7 83.8 90.5 85.3 92.0 62.4 87.7 Land cultivated (ha) 2.5 2.2 2.6 2.3 2.7 1.1 2.4 2.3 Cattle (head) 0.9 0.7 0.9 0.8 0.9 0.0 0.8 1.2 Pigs (head) 1.2 1.1 1.2 1.2 1.3 0.4 1.2 2.0 Sheep, goats (head) 1.2 1.4 1.4 1.2 1.4 0.2 1.3 3.6 Poultry (head) 16.6 14.2 16.5 15.1 17.5 5.8 15.7 13.8 productive assets (Euro) 587 900 573 796 699 672 696 1519 Financial capital Loan uptake (%) 7.4 15.5 9.5 11.0 9.7 14.3 10.3 Average loan (Euro) 12 29 18 18 17 26 18 79 Notes: 1. Hh stands for household. 2. The dependency ratio is defined as (1 - (number of household members aged over 15 and under 66)
/household size)). 3. The education level is defined on a 9-point scale: No studies and cannot read or write………………….. 0 No studies but can read or write………………………. 1 Elementary school………………………………………. 2 Vocational school……………………………………….. 3 Secondary school, gymnasium………...……………… 4 College…………………………………………………… 5 Graduate studies (university B.S.)…………………….. 6 M.Sc. studies (university)………………………………. 7 Ph.D. studies (university)………………………………. 8 Other occupation-specific higher education………... 9
4. Female-headed households are defined as households without male members aged over 18. 5. Poverty is defined relatively, with those households in poverty, which are in the lowest population
quintile. Their income is below Euro 21 per capita nominally, which corresponds to US$ 22.4. Source: Survey findings
22
ANNEX 2 Economic activity indicators by region, development & poverty Table 4 Armenia: Economic Activity Indicators By Region, Development Level,
And Poverty Incidence
Rurality (means)
Regional development (means)
income poverty (means)
Total sample (mean, S.D.)
Peri-urban rural Low High non-poor poor N Involvement in …(%) Agriculture 81 77 81 75 82 62 78 Other farm-based 24 11 18 13 16 11 15 Non-farm enterprise 19 18 19 18 22 2 18 Wage employment 23 20 22 20 24 9 21 Migration labour 4 4 4 4 5 0 4 Social transfers 47 43 43 45 47 33 44 Labour allocation (hours per year per household) Agriculture 4,389 3,817 3,967 4,040 4,196 3,189 4,003 (2,870) Non-farm enterprise 428 408 383 447 506 21 415 (1,090) Wage employment 539 465 468 511 572 147 489 (1,198( Migration labour 316 177 200 245 235 168 222 (702) All active hh labour 5,672 4,867 5,018 5,243 5,509 3,525 5,145 (3,092) Share of household income from different sources (%)1
Agriculture 66 66 65 67 65 81 69 (34) Other farm-based 0 0 0 0 0 0 0 (1) Non-farm enterprise 10 10 11 9 11 2 9 (24) Wage employment 9 11 11 10 11 0 9 (22) Migration labour2 1 1 1 1 1 0 2 (10) Social transfers 12 11 12 11 11 18 10 (20) # Income sources 2.0 1.7 1.9 1.8 2.0 1.2 1.8 (0.9) Diversity index3 0.23 0.24 0.24 0.23 0.25 0.07 0.23 (0.21)
Notes: 1. Agricultural income is calculated on the basis of reported revenues and costs (including
depreciation) associated with crop and livestock products. Agricultural income includes both marketed and non-marketed produce, and can take negative values. This was the case for 21 % of households in the sample. Such households are more often poor: of 173 poor households, only 55 had non-negative agricultural incomes. The poor/non-poor comparison is therefore biased towards larger income shares from agriculture, since the negative values were excluded.. There is no such bias in regional comparisons.
2. Income from migration includes remittances in money, food, and other goods sent by household members resident in other parts of the country or abroad.
3. Diversity of income is measured as 1 - Σ(income share j)2 , with j=1,2,…,i. With one source of income, the index equals zero, approaching 1as i increases. It is based on non-negative income shares.
Source: Survey findings
23
Table 5 Georgia: Economic Activity Indicators By Region, Development Level, And Poverty Incidence
Rurality (means)
Regional development (means)
income poverty (means)
Total sample (mean, S.D.)
Peri-urban rural low high non-poor poor N Involvement in …(%) Agriculture 34 78 67 74 71 56 69 Other farm-based 1 4 2 8 4 2 4 Non-farm enterprise 18 16 17 15 17 16 17 Wage employment 58 41 44 47 52 15 44 Migration labour 31 19 18 33 22 18 22 financial assets 16 6 5 18 10 1 8 Social transfers 48 29 30 43 38 13 33 Labour allocation (hours per year per household) Agriculture 694 2,419 1,982 2,268 2,058 1,963 2,048 (2,393) Non-farm enterprise 393 347 359 351 420 14 1,267 (1,987) Wage employment 1,740 1,137 1,240 1,355 1,377 764 357 (985) Migration labour 488 350 302 634 403 142 379 (1,085 All active hh labour 3,315 4,253 3,882 4,608 4,258 2,883 4,051 (3, 414) Share of household income from different sources (%)1
Agriculture 4 43 36 29 31 68 35 (40) Other farm-based 0 0 0 1 0 0 0 (3) Non-farm enterprise 12 9 10 9 11 0 10 (25) Wage employment 44 24 29 26 31 4 28 (37) Migration labour2 16 10 10 16 12 7 12 (27) financial assets 6 3 2 8 4 1 4 (14) Social transfers 17 10 12 11 11 20 12 (25) # Income sources 2.1 2.0 1.9 2.6 2.3 0.9 2.0 (1.2) Diversity index3 0.27 0.25 0.23 0.31 0.27 0.03 0.25 (0.23)
Notes: 1. Agricultural income is calculated on the basis of reported revenues and costs (including depreciation)
associated with crop and livestock products. Agricultural income includes both marketed and non-marketed produce, and can take negative values. This was the case for 21 % of households in the sample. Such households are more often poor: of 173 poor households, only 55 had non-negative agricultural incomes. The poor/non-poor comparison is therefore biased towards larger income shares from agriculture, since the negative values were excluded.. There is no such bias in regional comparisons.
2. Income from migration includes remittances in money, food, and other goods sent by household members resident in other parts of the country or abroad.
3. Diversity of income is measured as 1 - Σ(income share j)2 , with j=1,2,…,i. With one source of income, the index equals zero, approaching 1as i increases. It is based on non-negative income shares.
Source: Survey findings
24
Table 6 Romania: Economic Activity Indicators By Region, Development Level, And Poverty Incidence
Rurality (means)
Regional development (means)
income poverty (means)
Total sample (mean, S.D.)
Peri-urban rural low high non-poor poor N 1101 Incidence of income from …(%) Agriculture 93 92 94 92 96 75 93 Other farm-based 28 38 29 33 35 13 31 Non-farm enterprise 6 15 6 11 8 11 9 Wage employment 29 37 24 38 31 37 32 Migration labour 7 8 8 7 8 2 7 Social transfers 88 87 88 88 91 68 88 Labour allocation (hours per year per household) Agriculture 3,068 2,852 3,388 2,668 3,232 1,612 2,993 2,600 Wage employment 827 1,282 695 1,222 952 1,170 984 1,712 Migration labour 170 418 214 289 253 267 255 792 Non-farm enterprise 274 629 257 511 381 489 397 1,429 Share of household income from different sources (%) Agriculture 57 54 62 51 58 37 56 Other farm-based 1 3 2 2 2 1 2 Non-farm enterprise 0 1 0 1 1 2 1 Wage employment 4 4 4 5 3 18 4 Migration labour 1 2 1 2 2 1 2 Social transfers 36 35 31 39 35 42 35 # Income sources 2.5 2.8 2.5 2.6 2.5 2.9 2.6 2.0 Diversity index 0.31 0.34 0.31 0.33 0.33 0.21 0.32 0.18
Notes: Diversity of income is measured as 1 - Σ(income share j)2 , with j=1,2,…,i. With one source of income, the index equals zero, approaching 1as i increases. It is based on non-negative incomes. Agricultural income is calculated on the basis of reported output levels valued based on price data collected in a separate farm survey. Annual agricultural income is the difference between these revenues and the sum of reported variable costs and 10 % nominal depreciation of the asset stock. Agricultural income includes both marketed and non-marketed produce, and can take negative values. Income from migration includes remittances in money, food, and other goods sent by household members resident in other parts of the country or abroad. Source: Survey findings
25
ANNEX 3 Factors in households’ involvement in RNF activities
Table 7 Armenia: Factors in households’ involvement in non-agricultural activities
independent variables: coefficient estimates and standard errors
Regression statistics
farm-based non-agricultural activities
AGLABOUR 0,000** 0,000 ANIMALS 0,108*** 0,028 DEVELOPED 0,577*** 0,205 FARMSIZE -0,001*** 0,000 MIGLABOUR 0* 0 RURAL -0,976*** 0,203 CONSTANT -1,77*** 0,248
Number of obs = 813 LR chi2(6) = 8.83 prob > chi2 = 0.0000 Log likelihood = -332.83806 Pseudo R2 = 0.0812
waged employment
AGLABOUR 0,000*** 0,000 DEPRATIO -1,125** 0,446 DEVELOPED 0,475** 0,201 ENTLABOUR -0,001*** 0,000 LAND 0,067* 0,038 M_F_RATIO 0,238** 0,118 MAXEDU 0,579*** 0,067 CONSTANT -4,917*** 0,591
Number of obs = 815 LR chi2(7) =171.97 Prob > chi2 =0.0000 Log likelihood = -330.02349 Pseudo R2 = 0.2067
non-farm enterprise
AGE -0,02* 0,011 AGLABOUR 0,000*** 0,000 ANIMALS -0,064* 0,035 ASSETS 0,001*** 0,000 DEPRATIO -0,733* 0,436 JOBLABOUR -0,002*** 0,000 LAND -0,139** 0,061 MAXEDU 0,193*** 0,065 CONSTANT -1,014 0,637
Number of obs = 803 LR chi2(8) = 106.58 Prob > chi2 = 0.0000 Log likelihood = -327.4426 Pseudo R2 = 0.1400
migration labour
AGE 0,025* 0,015 ANIMALS -0,158* 0,082 DEPRATIO 1,765** 0,783 FARMSIZE 0,000*** 0,000 LAND -0,23* 0,133 MAXEDU 0,222* 0,118 CONSTANT -5,691*** 1,189
Number of obs = 791 LR chi2(6) = 18.51 Prob > chi2 = 0.0051 Log likelihood = -118.33295 Pseudo R2 = 0.0725
Note: *** statistical significance, p < 0.01; ** statistically significance, p < 0.05; * statistically significance , p < 0.10 Source: survey findings and authors’ calculations
26
Table 8 Georgia: Factors in households’ involvement in non-agricultural activities independent variables Coeff. estimates, standard errors Regression statistics
farm-based non-agricultural activities
AGLABOUR 0.000 *** 0.000 Number of obs 965 ANIMALS -0.330 * 0.128 LR chi2(5) 100.95 DEVELOPED 1.454 * 0.450 Prob > chi2 0.000 FARMSIZE 0.001 *** 0.000 Pseudo R2 0.3593 GEORGIAN 2.067 ** 1.053 Log likelihood -89.9925 M_F_RATIO 0.555 ** 0.275 MAXEDU -0.268 *** 0.141 WOMENHEAD 1.173 * 0.691 CONSTANT -6.601 *** 1.324
waged employment
AGLABOUR 0.000 *** 0.00 Number of obs 965 ANIMAlS -0.098 ** 0.04 LR chi2(5) 211.13 DEPRATIO -1.418 *** 0.28 Prob > chi2 0 ENTLABOUR 0.000 * 0.00 Pseudo R2 0.159 GEORGIAN 0.431 ** 0.18 Log likelihood -558.235 HHSIZE 0.242 *** 0.05 MAXEDU 0.339 *** 0.04 MIGLABOUR 0.000 *** 0.00 CONSTANT -2.438 *** 0.31
non-farm enterprise
AGLABOUR 0.000 * 0.000 Number of obs 965 M_F_RATIO 0.329 *** 0.104 LR chi2(5) 11.79 CONSTANT -1.827 *** 0.161 Prob > chi2 0.0027 Pseudo R2 0.0135 Log likelihood -432.364
migration labour DEVELOPED 0.771 *** 0.182 Number of obs 966 GEORGIAN -0.578 *** 0.189 LR chi2(5) 35.83 RURAL 0.511 *** 0.188 Prob > chi2 0.000 CONSTANT -1.200 *** 0.163 Pseudo R2 0.0359 Log likelihood -481.391 Note: *** statistical significance, p < 0.01; ** statistical significance, p < 0.05; * statistical significance , p < 0.10 Source: survey findings and authors’ calculations
27
Table 9 Romania: Factors in households’ involvement in non-agricultural activities
independent variables: Coefficient estimates and standard errors
Regression statistics
farm-based non-agricultural activities
ASSETS 0.000 *** 0.000 Number of obs 1,075 ENTLABOUR 0.000 ** 0.000 LR chi2(5) 103.60 LAND 0.197 *** 0.031 Prob > chi2 0.000 MAXEDU 0.143 *** 0.042 Pseudo R2 0.0695 RURAL 0.499 *** 0.129 Log likelihood -692.995 CONSTANT -1.439 *** 0.194
waged employment
AGE -0.021 *** 0.005 AGLABOUR 0.000 *** 0.000 ANIMALS -0.412 *** 0.076 Number of obs 1,081 ASSETS 0.000 *** 0.000 LR chi2(5) 253.66 ENTLABOUR 0.000 ** 0.000 Prob > chi2 0.000 HHSIZE 0.132 ** 0.059 Pseudo R2 0.1718 M_F_RATIO -0.155 * 0.089 Log likelihood -611.312 MAXEDU 0.294 *** 0.049 ROMANIAN -0.471 ** 0.228 CONSTANT 0.102 * 0.483
non-farm enterprise
AGLABOUR 0.000 *** 0.000 Number of obs 1,077 ANIMALS -0.442 *** 0.089 LR chi2(5) 114.06 ASSETS 0.000 *** 0.000 Prob > chi2 0.0000 MAXEDU 0.180 *** 0.045 Pseudo R2 0.0892 CONSTANT -1.262 *** 0.197 Log likelihood -581.995
migration labour AGLABOUR 0.000 *** 0.000 Number of obs 1,079 ANIMALS -0.527 *** 0.096 LR chi2(5) 115.10 ASSETS 0.000 *** 0.000 Prob > chi2 0.000 ENTLABOUR 0.000 *** 0.000 Pseudo R2 0.093 MAXEDU 0.140 *** 0.046 Log likelihood -561.261 CONSTANT -1.347 *** 0.204 Note: *** statistical significance, p < 0.01; ** statistically significance, p < 0.05; * statistically significance , p < 0.10 Source: survey findings and authors’ calculations
28
ANNEX 4 Factors affecting the risk of poverty
Table 10 Armenia: Factors affecting the risk of poverty Variables Logit coefficient estimates (s.e.) DEVELOPED -0.400* 0.240 EDUMAX 0.138* 0.079 AGE -0.033*** 0.012 SOURCES -0.874*** 0.197 FARMBASED 0.828** 0.399 JOB -1.687*** 0.390 ENTERPRISE -3.329*** 0.647 FARMSIZE -0.007*** 0.001 ANIMALS 0.178*** 0.058 ASSETS 0.001*** 0.000 CONSTANT 1.868*** 0.704 Regression statistics: 797observations chi2(8) = 326.34 Prob > chi2 = 0.000 Log likelihood = -233.700 Pseudo R2 = 0.411
Note: *** statistical significance, p < 0.01; ** statistical significance, p < 0.05; * statistical significance , p < 0.10 Source: survey findings and authors’ calculations
Table 11 Georgia: Factors affecting the risk of poverty Variables Logit coefficient estimates (s.e.) DEVELOPED -1.272*** 0.346 RURAL -0.567** 0.272 AGREV -0.006*** 0.001 HHSIZE 0.236*** 0.062 DEPRATIO -0.614* 0.336 MAXEDU -0.137** 0.060 AGLABOUR 0.000*** 0.000 ENTLABOUR -0.003*** 0.001 JOBLABOUR 0.000*** 0.000 CONSTANT 0.190 0.373 Number of obs 947 LR chi2(5) 298.51 Prob > chi2 0.000 Pseudo R2 0.3241 Log likelihood -311.299
Note: *** statistical significance, p < 0.01; ** statistical significance, p < 0.05; * statistical significance , p < 0.10 Source: survey findings and authors’ calculations
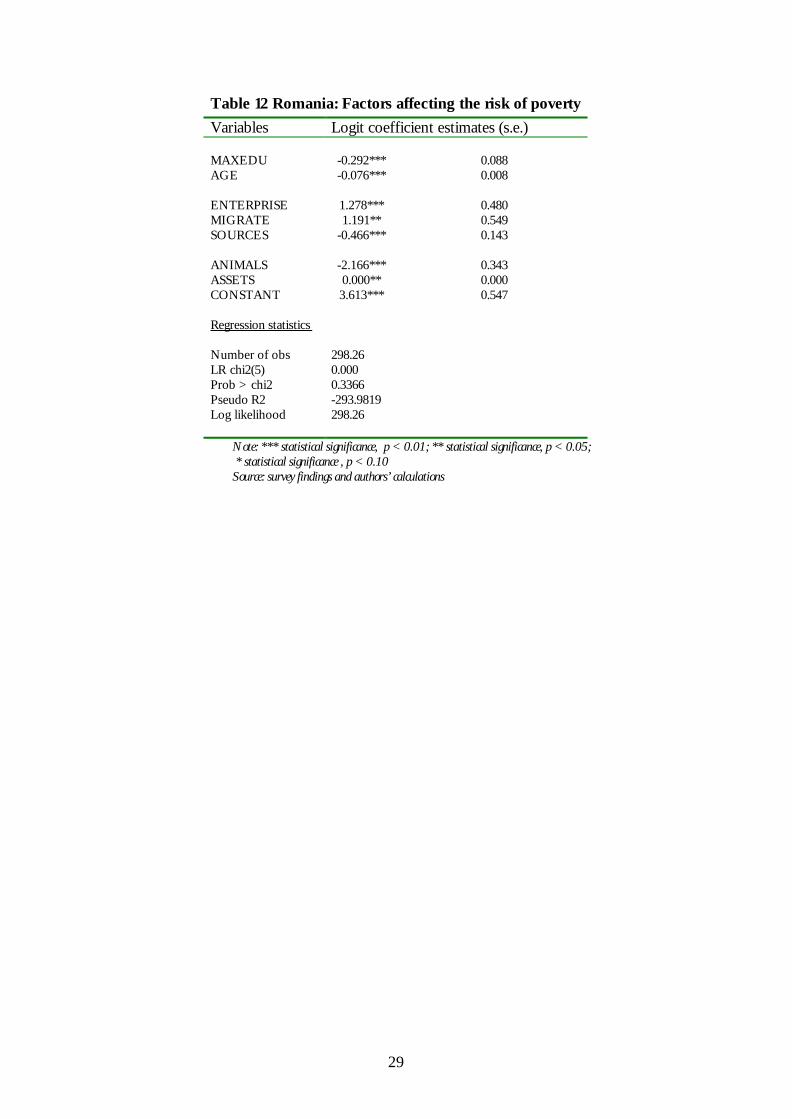
29
Table 12 Romania: Factors affecting the risk of poverty Variables Logit coefficient estimates (s.e.) MAXEDU -0.292*** 0.088 AGE -0.076*** 0.008 ENTERPRISE 1.278*** 0.480 MIGRATE 1.191** 0.549 SOURCES -0.466*** 0.143 ANIMALS -2.166*** 0.343 ASSETS 0.000** 0.000 CONSTANT 3.613*** 0.547
Regression statistics
Number of obs 298.26 LR chi2(5) 0.000 Prob > chi2 0.3366 Pseudo R2 -293.9819 Log likelihood 298.26
Note: *** statistical significance, p < 0.01; ** statistical significance, p < 0.05; * statistical significance , p < 0.10 Source: survey findings and authors’ calculations
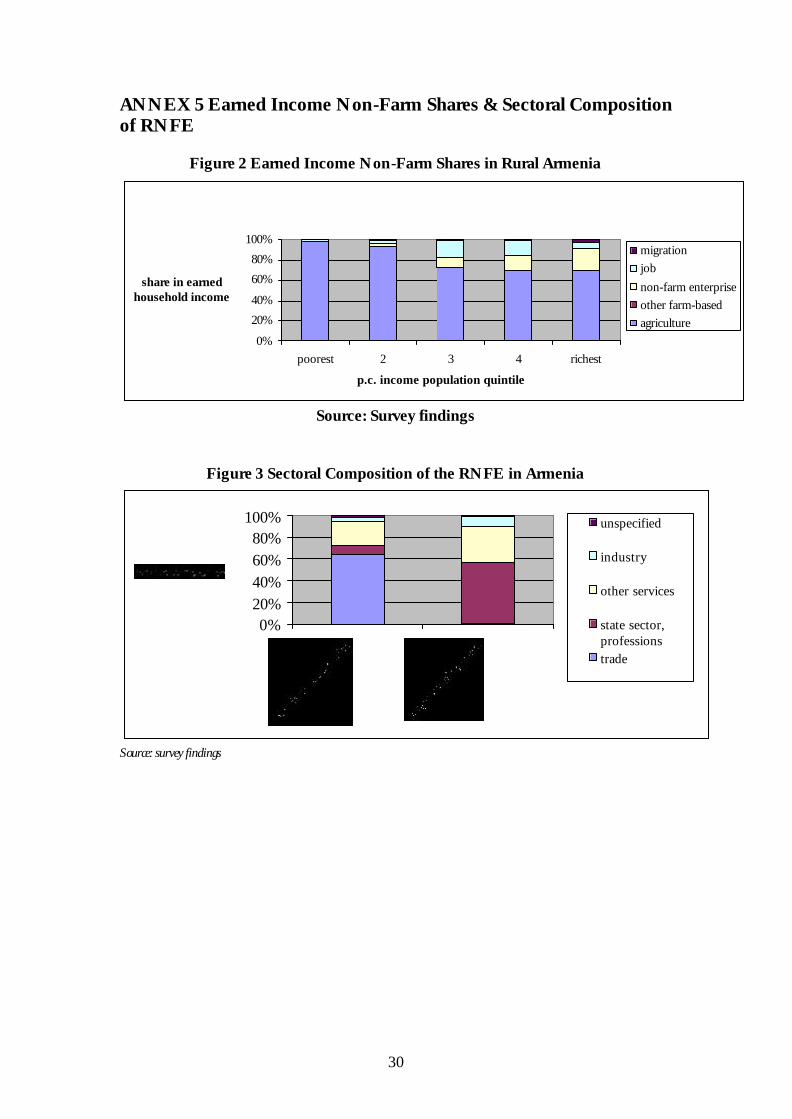
30
ANNEX 5 Earned Income Non-Farm Shares & Sectoral Composition of RNFE
Figure 2 Earned Income Non-Farm Shares in Rural Armenia
0%
20%
40%
60%
80%
100%
poorest 2 3 4 richest
p.c. income population quintile
share in earned household income
migrationjobnon-farm enterpriseother farm-basedagriculture
Source: Survey findings
Figure 3 Sectoral Composition of the RNFE in Armenia
0%20%40%60%80%
100% unspecified
industry
other services
state sector,professionstrade
Source: survey findings
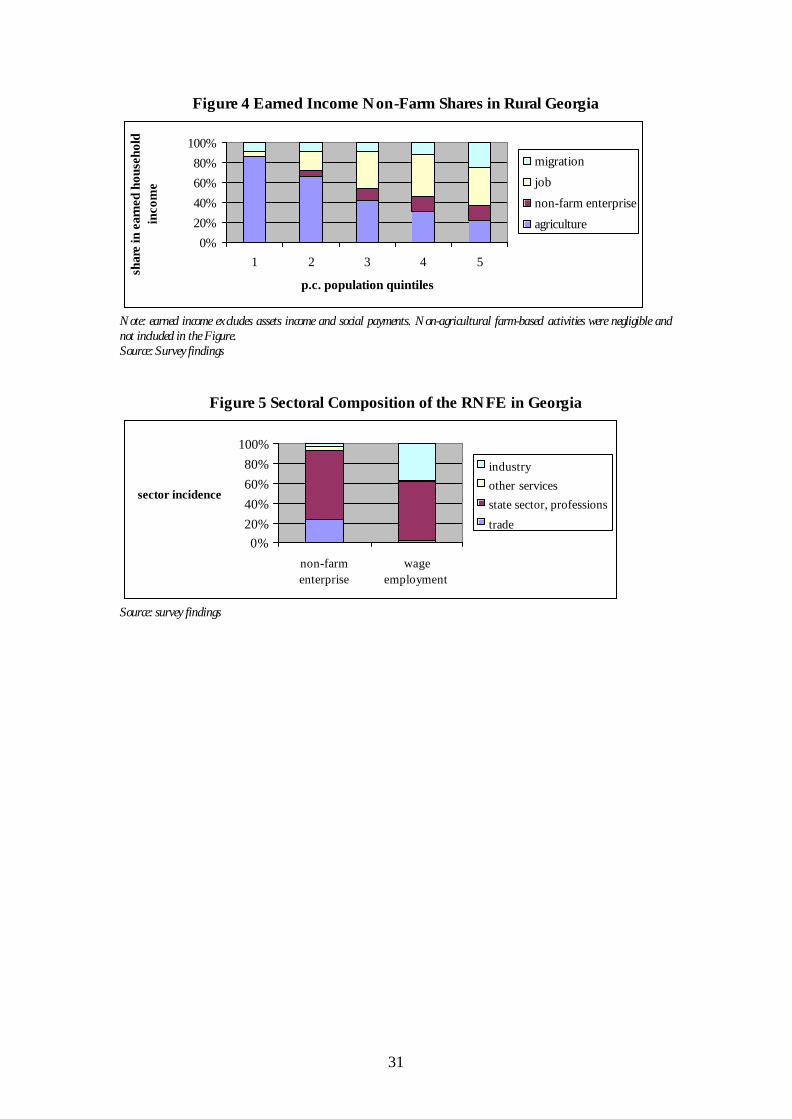
31
Figure 4 Earned Income Non-Farm Shares in Rural Georgia
0%20%40%60%80%
100%
1 2 3 4 5
p.c. population quintiles
shar
e in
ear
ned
hous
ehol
d in
com
emigration
job
non-farm enterprise
agriculture
Note: earned income excludes assets income and social payments. Non-agricultural farm-based activities were negligible and not included in the Figure. Source: Survey findings
Figure 5 Sectoral Composition of the RNFE in Georgia
Source: survey findings
0%20%40%60%80%
100%
non-farmenterprise
wageemployment
sector incidence
industryother servicesstate sector, professions
trade
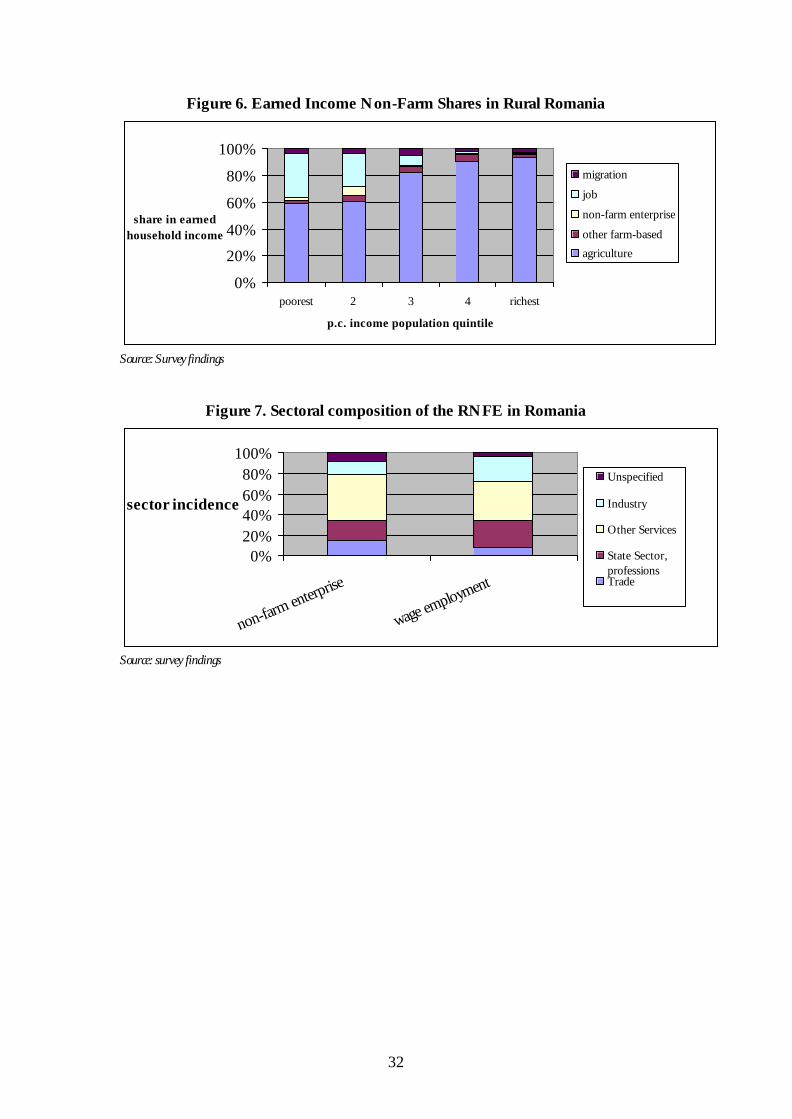
32
Figure 6. Earned Income Non-Farm Shares in Rural Romania
0%
20%
40%
60%
80%
100%
poorest 2 3 4 richest
p.c. income population quintile
share in earned household income
migration
job
non-farm enterprise
other farm-based
agriculture
Source: Survey findings
Figure 7. Sectoral composition of the RNFE in Romania
0%20%40%60%80%
100%
non-farm enterprise
wage employment
sector incidence
Unspecified
Industry
Other Services
State Sector,professionsTrade
Source: survey findings
Enterprise Trade and Finance Group Natural Resources Institute
University of Greenwich at Medway Central Avenue
Chatham Maritime Kent ME4 4TB Unted Kingdom
Tel: +44 (0)1634 883199Fax: +44 (0)1634 883706
Email: [email protected]://www.nri.org/rnfe/index.html
FS 54723ISO 9001