Embed Size (px)
Citation preview
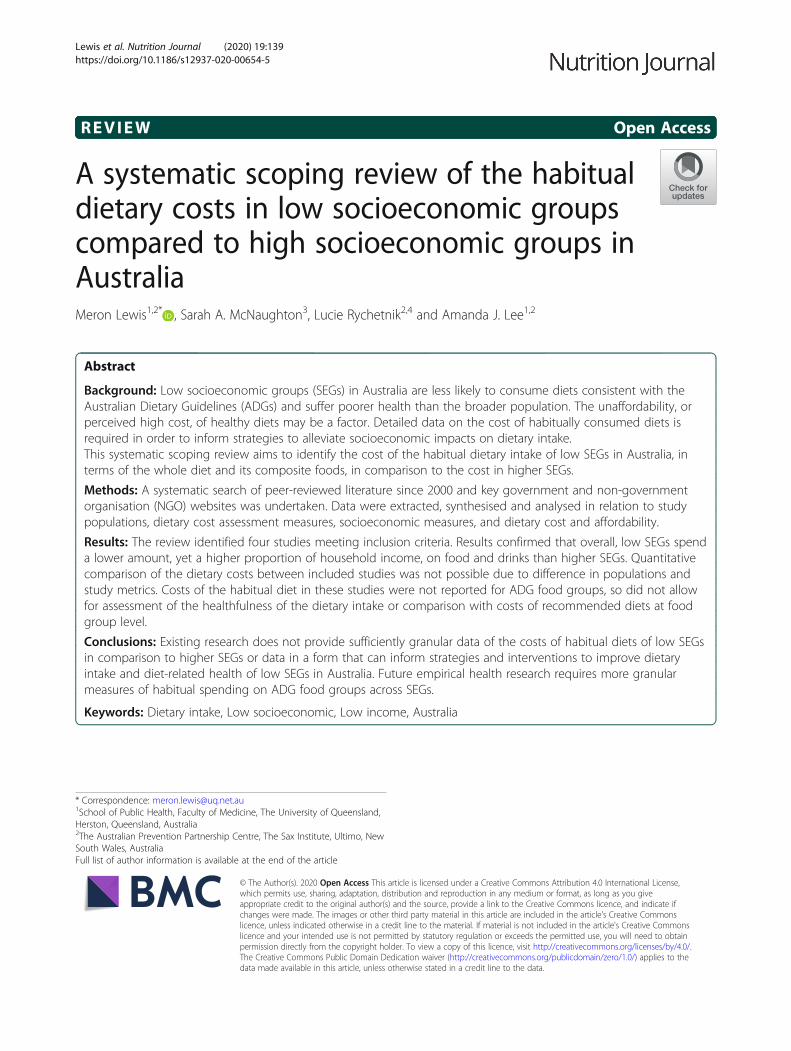
REVIEW Open Access
A systematic scoping review of the habitualdietary costs in low socioeconomic groupscompared to high socioeconomic groups inAustraliaMeron Lewis1,2* , Sarah A. McNaughton3, Lucie Rychetnik2,4 and Amanda J. Lee1,2
Abstract
Background: Low socioeconomic groups (SEGs) in Australia are less likely to consume diets consistent with theAustralian Dietary Guidelines (ADGs) and suffer poorer health than the broader population. The unaffordability, orperceived high cost, of healthy diets may be a factor. Detailed data on the cost of habitually consumed diets isrequired in order to inform strategies to alleviate socioeconomic impacts on dietary intake.This systematic scoping review aims to identify the cost of the habitual dietary intake of low SEGs in Australia, interms of the whole diet and its composite foods, in comparison to the cost in higher SEGs.
Methods: A systematic search of peer-reviewed literature since 2000 and key government and non-governmentorganisation (NGO) websites was undertaken. Data were extracted, synthesised and analysed in relation to studypopulations, dietary cost assessment measures, socioeconomic measures, and dietary cost and affordability.
Results: The review identified four studies meeting inclusion criteria. Results confirmed that overall, low SEGs spenda lower amount, yet a higher proportion of household income, on food and drinks than higher SEGs. Quantitativecomparison of the dietary costs between included studies was not possible due to difference in populations andstudy metrics. Costs of the habitual diet in these studies were not reported for ADG food groups, so did not allowfor assessment of the healthfulness of the dietary intake or comparison with costs of recommended diets at foodgroup level.
Conclusions: Existing research does not provide sufficiently granular data of the costs of habitual diets of low SEGsin comparison to higher SEGs or data in a form that can inform strategies and interventions to improve dietaryintake and diet-related health of low SEGs in Australia. Future empirical health research requires more granularmeasures of habitual spending on ADG food groups across SEGs.
Keywords: Dietary intake, Low socioeconomic, Low income, Australia
© The Author(s). 2020 Open Access This article is licensed under a Creative Commons Attribution 4.0 International License,which permits use, sharing, adaptation, distribution and reproduction in any medium or format, as long as you giveappropriate credit to the original author(s) and the source, provide a link to the Creative Commons licence, and indicate ifchanges were made. The images or other third party material in this article are included in the article's Creative Commonslicence, unless indicated otherwise in a credit line to the material. If material is not included in the article's Creative Commonslicence and your intended use is not permitted by statutory regulation or exceeds the permitted use, you will need to obtainpermission directly from the copyright holder. To view a copy of this licence, visit http://creativecommons.org/licenses/by/4.0/.The Creative Commons Public Domain Dedication waiver (http://creativecommons.org/publicdomain/zero/1.0/) applies to thedata made available in this article, unless otherwise stated in a credit line to the data.
* Correspondence: [email protected] of Public Health, Faculty of Medicine, The University of Queensland,Herston, Queensland, Australia2The Australian Prevention Partnership Centre, The Sax Institute, Ultimo, NewSouth Wales, AustraliaFull list of author information is available at the end of the article
Lewis et al. Nutrition Journal (2020) 19:139 https://doi.org/10.1186/s12937-020-00654-5

BackgroundLow socioeconomic groups (SEGs) are known to sufferpoorer health than other population groups, with an esti-mated 2.1 year reduction in life expectancy in high incomecountries, including Australia, attributable to low socio-economic status [1]. Food insecurity is also more preva-lent in low SEGs [2], where people do not “at all times,have physical, social and economic access to sufficient,safe and nutritious food which meets their dietary needsand food preferences for an active and healthy life” [3].In Australia, calls have been made for public policies
to address the impacts of socioeconomic disadvantage inorder to improve health for all [4–7]. Contributing fac-tors include environmental, economic and social deter-minants [8]. In order to assess health inequities andidentify low SEGs, estimates of income, occupationalskill level or unemployment status, available householdassets (e.g. car and home ownership), educational quali-fications, and/or the clustering of these factors in spe-cific locations may be used to classify population groupswith common social or financial characteristics [9].The contribution to poor health from diet is also large;
whilst less than 1% of Australians follow the recom-mended Australian Dietary Guidelines (ADGs) [10, 11],there have been suggestions that low SEGs are more likelyto consume a less healthy diet than the broader Australianpopulation [12–14]. Cost and affordability are aspects offood choice which are of particular relevance to those re-ceiving low incomes [14–16]. The household food budgetis considered to be more flexible compared to other fixedhousehold expenses (such as rent and utility bills), suchthat a household receiving a low disposable income thatexperiences a sudden additional expense is likely to lowertheir food budget to compensate [2]. A number of studieshave examined the cost of ‘healthy’ food and assessed itsaffordability for low SEGs [17, 18], finding that ‘healthy’diets, according to various definitions, are difficult to af-ford for low income households.One indicator of unaffordability is when food costs
30% or more of disposable income [19–21]. More re-cently, 25% of disposable income has been posited as thelevel whereafter ‘food stress’ occurs [22]. High levels offood stress impact the ‘economic access’ dimension offood security, whilst other determinants of low socioeco-nomic status, such as car ownership and place of resi-dence, also affect the dimensions of physical access,availability, and food utilisation [3].Both real and perceived unaffordability of healthy diets
may play an important role in determining the diets oflow SEGs [23]. Consideration of the cost and affordabil-ity of healthy diets should be made in comparison to thecost of habitually consumed diets (which are likely to beless ‘healthy’) [19]. Habitually consumed diets comprisethe types and amounts of food usually eaten on a regular
basis, and are the major determinant of diet-relatedhealth [24].A study of the Consumer Price Index (CPI) in
Australia showed that over a period of 18 years healthierfoods increased in price more than unhealthy foods [25].Other studies have examined price per energy unit, con-cluding that foods high in nutrients, yet with a low en-ergy density, were more expensive than less nutritious,energy dense foods [13, 19]. However, all of these studieshave examined selected foods rather than whole diets oroverall dietary patterns. Additionally, the data analysis ofthese studies includes energy in both metrics (price perkJ and kJ per gram) suggesting that the inverse relation-ship between the metrics may be a spurious mathemat-ical artefact [13, 26]. Statistical analysis of the price of4430 foods in the USA has indeed shown there is nosupport for the argument that high energy dense foodsare cheaper than low energy dense foods [27].Given lower incomes, low SEGs are likely to have less
income to spend in absolute terms, and spend a higherproportion of their total income on their habitual diet,than higher SEGs [28]. However, it is not clear whetherany studies have assessed habitual food costs of lowSEGs with sufficient granularity to allow comparison tohealthy food costs. Therefore, the aim of this systematicliterature review is to identify studies assessing the costof the habitual diet, and its composite foods, in low andhigher SEGs in Australia and to determine whethercomparisons can be made of relative diet quality.
MethodsSearch strategyThe search strategy was structured to identify studiesproviding an assessment of the cost of habitual dietaryintake of low SEGs in Australia in comparison to higherSEGs. The research question was considered in PICOT(population, intervention, comparator, outcome andtime) format and the PRISMA (Preferred ReportingItems for Systematic Reviews and Meta-analyses) [29]statement was used to guide review processes.The search population included Australians of any age
and gender categorised as belonging to a low SEG byany method.The intervention was defined as measurement of the
cost of the habitual dietary intake of individuals orhouseholds of the search population. The comparatorwas the cost of the habitual dietary intake of individualsor households categorised as belonging to a higher SEGthan the search population. Outcomes were defined ascosts of habitual whole diets or selected food groups.The search timeframe was restricted to documents
published in the 20 years from July 2000 to October2019, as it was considered that earlier documents maylack relevance due to changes over time in the social
Lewis et al. Nutrition Journal (2020) 19:139 Page 2 of 12
and economic landscape and dietary patterns of Austra-lians. In particular, July 2000 saw the introduction of agoods and services tax in Australia, which exempts basichealthy foods.The peer-reviewed literature databases searched were:
The Cochrane Library; PubMed; MEDLINE; EMBASE;CINAHL; Informit Health Collection; and Web of Science(Science Citation Index and Conference Proceedings Cit-ation Index). The search terms used were (nutrition ORdiet OR diets OR food OR foods OR drinks) AND (costOR costs OR costed OR price* OR afford*) AND (low-in-come OR low income OR low socioeconomic) ANDAustralia. “Low income” has been used commonly as aproxy for low socioeconomic status in research relating tothe cost and affordability of healthy diets, and thus thisterm was used in the search as an additional term with‘low socioeconomic’ [18, 20, 30]. Food costs and socioeco-nomic status are influenced by many country-specific so-cial and economic issues, so the location was restricted toAustralia as overseas findings would potentially be less ap-plicable to the Australian situation.Websites were identified as those known to the authors to
provide information on diet cost or to report on the healthand/or socioeconomic determinants of health in Australia[17, 30]. The websites searched were: The Australian Preven-tion Partnership Centre/The Sax Institute; Australian HealthPolicy Collaboration; Public Health Association of Australia;National Health and Medical Research Council; NationalPreventive Health Agency; Commonwealth Health Depart-ment; Australian Institute of Health and Welfare; AustralianTreasury; Australian Council of Social Services; West Austra-lian Council of Social Services; Queensland Council of SocialServices; Victorian Council of Social Services; NSW Councilof Social Services; South Australian Council of Social Ser-vices; Northern Territory Council of Social Service; Tasman-ian Council of Social Services; and the Grattan Institute.Search terms ((Diet OR nutrition) AND (socioeconomic ORincome)) were systematically entered into each website-specific search engine. The first five page returns, or the firstten items listed (when sorted by relevance) from each searchwas scrutinised. The results were screened using the inclu-sion and exclusion criteria described below.The databases of peer-reviewed literature, and key
government and non-government organisation relatedwebsites, were searched together with hand-searching allincluded references for any missing relevant documents.ML conducted all stages of the search and data extrac-tion process, and AJL cross checked 50% of abstractsand data extractions to control for any observer bias.
Inclusion criterion
� Studies which described the individual or householdhabitual costs of food and drinks, and;
� Studies that differentiated the costs of food anddrinks by a socioeconomic measure, and;
� Studies where the household or individual waslocated in Australia.
Exclusion criteria
� Any study not including individuals or householdslocated in Australia, or;
� Any study solely relating to the cost of ‘healthy’ dietsor other pre-determined specific diet that was not ahabitual diet, or;
� Any study which did not report dietary costsdifferentiated by a socioeconomic measure, or;
� Any study solely qualitatively assessed the influenceor perception of food price/affordability onpurchasing behaviours
The listed databases and websites were searched andresulting citations were downloaded into EndNote X8[31]. Duplicates were removed, and the inclusion and ex-clusion criteria were applied systematically to remainingcitations, based on title, then abstract, then full text.
Data extractionData were extracted by the following fields; study au-thors and date; age group, gender, and location of studypopulation; measure of habitual dietary intake costs;SEG categorisation measure used; and, estimated dietaryintake costs and proportion of income spent on dietaryintake of each SEG. Quality assessment tools were notutilised as the included studies were descriptive studiesand it was important to capture all available assessmentsof habitual diet costs. In this way, the methodology wassimilar to a scoping review.
Data synthesis and analysisFollowing data extraction, the representativeness of the in-cluded study’s population was assessed. The methods toassess diet cost and categorise SEGs used in the includedstudies were noted. Finally, the estimated dietary intakecosts and proportions of income spent of each SEG wereassessed for agreement between the included studies.
ResultsFollowing application of the search strategy, one peerreviewed study (“Inglis et al.” [32]) and three large non-peer reviewed studies (Australian Bureau of Agricultureand Resource Economics and Sciences study “ABARESstudy” [33], Australian Bureau of Statistics HouseholdExpenditure study “ABS HES study” [34], and TheHousehold, Income and Labour Dynamics in Australiastudy “the HILDA study” [35]) were included. The PRIS
Lewis et al. Nutrition Journal (2020) 19:139 Page 3 of 12
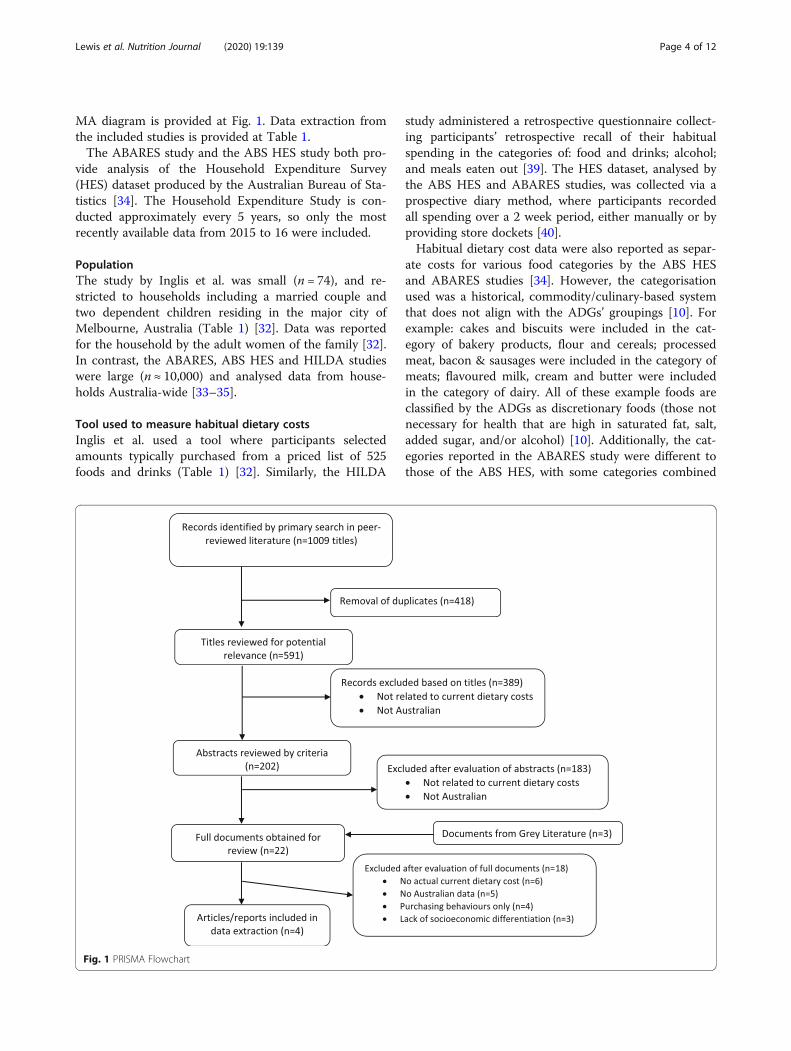
MA diagram is provided at Fig. 1. Data extraction fromthe included studies is provided at Table 1.The ABARES study and the ABS HES study both pro-
vide analysis of the Household Expenditure Survey(HES) dataset produced by the Australian Bureau of Sta-tistics [34]. The Household Expenditure Study is con-ducted approximately every 5 years, so only the mostrecently available data from 2015 to 16 were included.
PopulationThe study by Inglis et al. was small (n = 74), and re-stricted to households including a married couple andtwo dependent children residing in the major city ofMelbourne, Australia (Table 1) [32]. Data was reportedfor the household by the adult women of the family [32].In contrast, the ABARES, ABS HES and HILDA studieswere large (n ≈ 10,000) and analysed data from house-holds Australia-wide [33–35].
Tool used to measure habitual dietary costsInglis et al. used a tool where participants selectedamounts typically purchased from a priced list of 525foods and drinks (Table 1) [32]. Similarly, the HILDA
study administered a retrospective questionnaire collect-ing participants’ retrospective recall of their habitualspending in the categories of: food and drinks; alcohol;and meals eaten out [39]. The HES dataset, analysed bythe ABS HES and ABARES studies, was collected via aprospective diary method, where participants recordedall spending over a 2 week period, either manually or byproviding store dockets [40].Habitual dietary cost data were also reported as separ-
ate costs for various food categories by the ABS HESand ABARES studies [34]. However, the categorisationused was a historical, commodity/culinary-based systemthat does not align with the ADGs’ groupings [10]. Forexample: cakes and biscuits were included in the cat-egory of bakery products, flour and cereals; processedmeat, bacon & sausages were included in the category ofmeats; flavoured milk, cream and butter were includedin the category of dairy. All of these example foods areclassified by the ADGs as discretionary foods (those notnecessary for health that are high in saturated fat, salt,added sugar, and/or alcohol) [10]. Additionally, the cat-egories reported in the ABARES study were different tothose of the ABS HES, with some categories combined
Fig. 1 PRISMA Flowchart
Lewis et al. Nutrition Journal (2020) 19:139 Page 4 of 12
(e.g. fruit and vegetables) and others omitted (e.g. alco-holic drinks).
SEG categorisation tool usedAll four included studies categorised SEG by a financialvariable (Table 1). Household income was used in allstudies, either as gross income, after tax income, equiva-lent disposable income, or without further definition.Equivalent disposable household income was calculatedby adjusting the reported actual household income to
account for the number and age (greater than or lessthan 15 years) of household members [37].Household net worth was also used to categorise SEGs
in the ABS HES and ABARES studies [33, 34]. In thesetwo studies, SEG was additionally categorised by the re-ported main source of household income. Private in-come, such as employment or investment income, wasdistinguished from government pensions or allowances,such as unemployment benefits, single parent pension,disability pension, and aged pensions [33, 34].
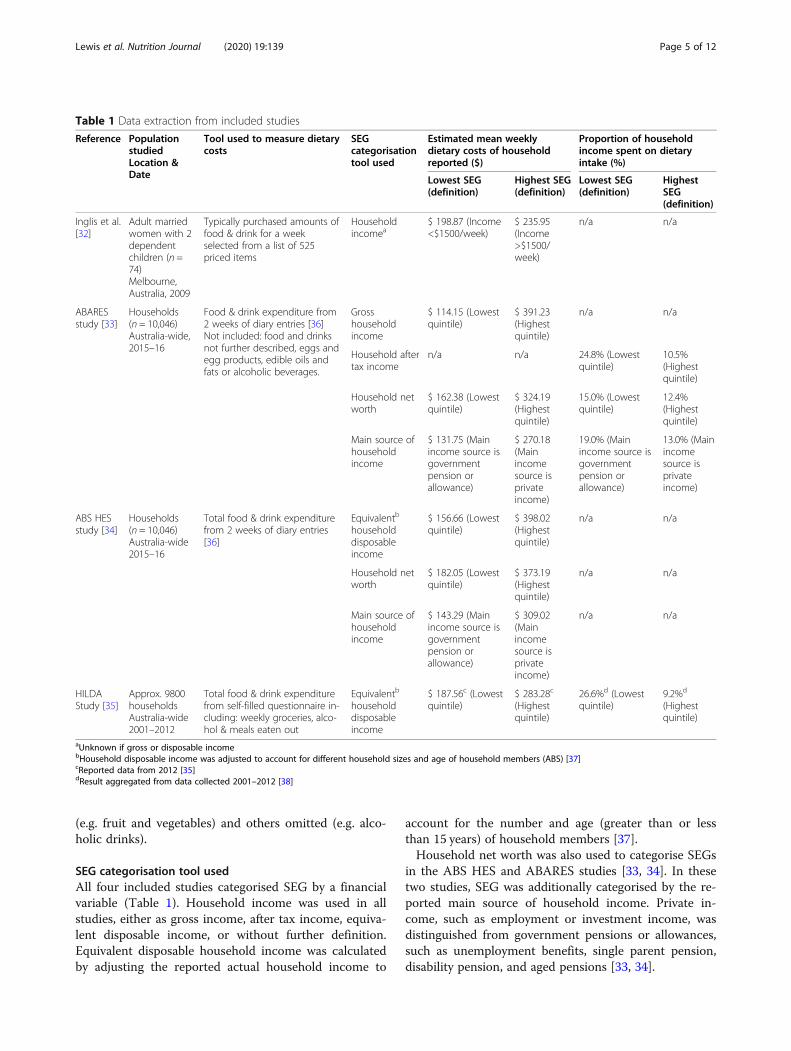
Table 1 Data extraction from included studies
Reference PopulationstudiedLocation &Date
Tool used to measure dietarycosts
SEGcategorisationtool used
Estimated mean weeklydietary costs of householdreported ($)
Proportion of householdincome spent on dietaryintake (%)
Lowest SEG(definition)
Highest SEG(definition)
Lowest SEG(definition)
HighestSEG(definition)
Inglis et al.[32]
Adult marriedwomen with 2dependentchildren (n =74)Melbourne,Australia, 2009
Typically purchased amounts offood & drink for a weekselected from a list of 525priced items
Householdincomea
$ 198.87 (Income<$1500/week)
$ 235.95(Income>$1500/week)
n/a n/a
ABARESstudy [33]
Households(n = 10,046)Australia-wide,2015–16
Food & drink expenditure from2 weeks of diary entries [36]Not included: food and drinksnot further described, eggs andegg products, edible oils andfats or alcoholic beverages.
Grosshouseholdincome
$ 114.15 (Lowestquintile)
$ 391.23(Highestquintile)
n/a n/a
Household aftertax income
n/a n/a 24.8% (Lowestquintile)
10.5%(Highestquintile)
Household networth
$ 162.38 (Lowestquintile)
$ 324.19(Highestquintile)
15.0% (Lowestquintile)
12.4%(Highestquintile)
Main source ofhouseholdincome
$ 131.75 (Mainincome source isgovernmentpension orallowance)
$ 270.18(Mainincomesource isprivateincome)
19.0% (Mainincome source isgovernmentpension orallowance)
13.0% (Mainincomesource isprivateincome)
ABS HESstudy [34]
Households(n = 10,046)Australia-wide2015–16
Total food & drink expenditurefrom 2 weeks of diary entries[36]
Equivalentb
householddisposableincome
$ 156.66 (Lowestquintile)
$ 398.02(Highestquintile)
n/a n/a
Household networth
$ 182.05 (Lowestquintile)
$ 373.19(Highestquintile)
n/a n/a
Main source ofhouseholdincome
$ 143.29 (Mainincome source isgovernmentpension orallowance)
$ 309.02(Mainincomesource isprivateincome)
n/a n/a
HILDAStudy [35]
Approx. 9800householdsAustralia-wide2001–2012
Total food & drink expenditurefrom self-filled questionnaire in-cluding: weekly groceries, alco-hol & meals eaten out
Equivalentb
householddisposableincome
$ 187.56c (Lowestquintile)
$ 283.28c
(Highestquintile)
26.6%d (Lowestquintile)
9.2%d
(Highestquintile)
aUnknown if gross or disposable incomebHousehold disposable income was adjusted to account for different household sizes and age of household members (ABS) [37]cReported data from 2012 [35]dResult aggregated from data collected 2001–2012 [38]
Lewis et al. Nutrition Journal (2020) 19:139 Page 5 of 12

Estimated dietary costsAll four studies reported quantified dietary costs bySEGs, and all found that lower SEGs had lower dietarycosts than higher SEGs (Table 1) [32–35]. The estimatedmean weekly dietary cost of the lowest SEGs varied from$114.15 [33] to $187.56 [35] per household. The highestSEGs’ estimated mean weekly dietary cost varied from$235.95 [32] to $398.02 [34] per household. Whilst theABARES study [33] analysed the same data set as theABS HES study [34], it did not report the categories of“food and drinks not further described”, “eggs and eggproducts”, “edible oils and fats” or “alcoholic beverages”,resulting in lower estimated dietary costs than expected.The Inglis study [32] only reported costs of a family offour (two adults and two children), whereas the otherthree studies [33–35] reported dietary costs equivalisedfrom a range of household sizes.
Proportion of household income spent on dietary costsThe ABARES and HILDA studies reported the propor-tion of household income spent on food and drinks(Table 1) [33, 35]. The HILDA study reported that 34%of all households in the bottom two quintiles of house-hold income distribution spent more than 30% of house-hold income on food [35]. It is unclear if this proportionhad been calculated on gross or disposable income.The ABARES study reported that, using household
after tax income as a socioeconomic measure, the lowestquintile spent 24.8% of income on dietary intake,whereas the highest quintile spent 10.5%. When thisstudy used household net worth as a socioeconomicmeasure, the lowest quintile spent 15.0% of income ondietary intake, whereas the highest quintile spent 12.4%.Further, when this study reported dietary costs using themain source of household income as the socioeconomicmeasure, households mainly receiving government pen-sions or allowances spent 19.0% of income on dietary in-take, whereas households mainly receiving income fromprivate sources spent 13.0% on diet.
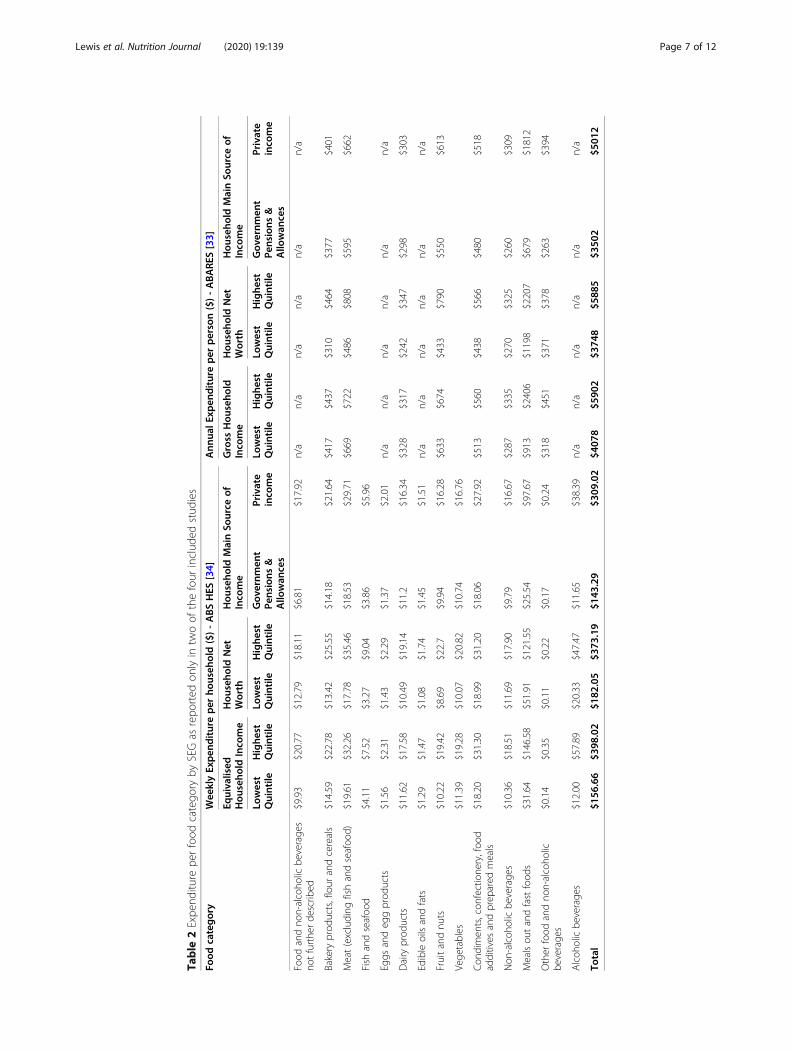
Estimated dietary cost by food categoryIn the two included studies reporting expenditure by foodcategories (Table 2), the lowest SEG (by any measure)spent less in absolute costs than the highest SEG in almostall food categories [33, 34]. The exception was reported inthe ABARES study, where expenditure on dairy productswas slightly higher for the lowest quintile of gross house-hold income than the highest quintile [33]. The main dif-ferences in spending patterns by SEG were for thecategories of ‘meals out’ and fast foods [33, 34], wherethose households in the lowest SEG assessed by any meas-ure spent a significantly lower proportion of the total foodexpenditure on these categories than higher SEGs. Simi-larly for the category of alcoholic drinks, where provided
[34], the lowest SEGs spent a much lower proportion oftotal food expenditure on these than higher SEGs.
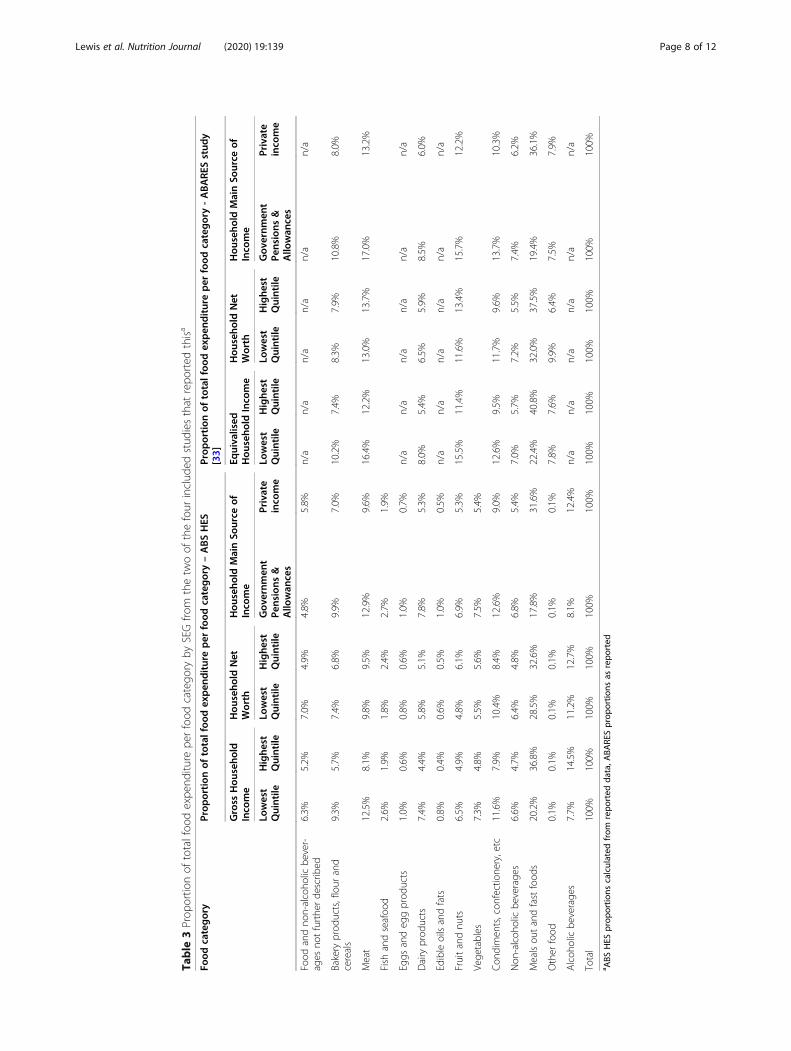
Proportion of total food expenditure per food categoryThe ABARES study also reported the proportion of thetotal food expenditure for each food category, and similardata were calculated from the reported ABS HES expend-iture data (Table 3). Again, the largest difference betweenSEGs by any measure was the category of ‘meals out’ andfast food and the category of alcohol, where reported; thehigher SEGs spent a much greater proportion of their totalfood expenditure on these items than the lowest SEGs.
DiscussionThis systematic review examined studies assessing thecost of the habitual diet, and its composite foods, in lowand higher SEGs in Australia. The review identified onlyfour studies that met the inclusion criteria. All includedstudies found that low SEG households (categorised byvarious financial variables) spent less on their diet thanhigher SEG households [32–35]. However, a lack ofreporting of costs by ADG food groups excluded poten-tial quantitative analysis of habitual diet costs by healthyor unhealthy food and drinks categories.The small number of identified studies from this sys-
tematic literature review was surprising, given the fre-quent identification in the literature of the importanceof price on food choice [15, 23, 38, 41, 42]. Research onthe cost of ‘healthy’ foods and whether these are afford-able for low SEGs has been conducted in Australia, butfew studies have examined or compared the costs ofhealthy diets to habitual total food and drink expend-iture by these groups [17].Previous analysis of household cost and expenditure
surveys internationally, found a large degree of hetero-geneity in the measurement methods and purpose of thesurveys, and limitations in the application of such surveyresults to nutrition policy [43]. The most recent AHSNNPAS in 2011–13 [11] used food categories alignedwith the food groups of the ADGs [10]. Similar re-categorisation within the food and drink expendituresection of the HES [34] would provide harmonious datathat support more meaningful analysis of monitoringand surveillance data sets from a nutrition and healthperspective. A concordance between the food categoriesof the HES (also used in calculation of Consumer PriceIndex (CPI) information) and the ADG food groups hasbeen developed and used by the ABS [44], however it isnot publicly available.
Under-representation of rural and remote populationsThree of the four studies included in this review ana-lysed data from a large national sample from throughoutAustralia [33–35]. Such Australia-wide studies are
Lewis et al. Nutrition Journal (2020) 19:139 Page 6 of 12
Table
2Expe
nditu
repe
rfood
catego
ryby
SEGas
repo
rted
onlyin
twoof
thefour
includ
edstud
ies
Food
category
Wee
klyExpen
ditureper
househ
old($)-ABSHES
[34]
Ann
ualE
xpen
diture
per
person($)-ABARE
S[33]
Equivalised
Hou
seho
ldInco
me
Hou
seho
ldNet
Worth
Hou
seho
ldMainSo
urce
ofInco
me
Gross
Hou
seho
ldInco
me
Hou
seho
ldNet
Worth
Hou
seho
ldMainSo
urce
ofInco
me
Lowest
Quintile
Highe
stQuintile
Lowest
Quintile
Highe
stQuintile
Gov
ernm
ent
Pensions
&Allo
wan
ces
Private
inco
me
Lowest
Quintile
Highe
stQuintile
Lowest
Quintile
Highe
stQuintile
Gov
ernm
ent
Pensions
&Allo
wan
ces
Private
inco
me
Food
andno
n-alcoho
licbe
verage
sno
tfurthe
rde
scrib
ed$9.93
$20.77
$12.79
$18.11
$6.81
$17.92
n/a
n/a
n/a
n/a
n/a
n/a
Bakery
prod
ucts,flour
andcereals
$14.59
$22.78
$13.42
$25.55
$14.18
$21.64
$417
$437
$310
$464
$377
$401
Meat(excluding
fishandseafoo
d)$19.61
$32.26
$17.78
$35.46
$18.53
$29.71
$669
$722
$486
$808
$595
$662
Fish
andseafoo
d$4.11
$7.52
$3.27
$9.04
$3.86
$5.96
Eggs
andeg
gprod
ucts
$1.56
$2.31
$1.43
$2.29
$1.37
$2.01
n/a
n/a
n/a
n/a
n/a
n/a
Dairy
prod
ucts
$11.62
$17.58
$10.49
$19.14
$11.2
$16.34
$328
$317
$242
$347
$298
$303
Edibleoilsandfats
$1.29
$1.47
$1.08
$1.74
$1.45
$1.51
n/a
n/a
n/a
n/a
n/a
n/a
Fruitandnu
ts$10.22
$19.42
$8.69
$22.7
$9.94
$16.28
$633
$674
$433
$790
$550
$613
Vege
tables
$11.39
$19.28
$10.07
$20.82
$10.74
$16.76
Con
dimen
ts,con
fectione
ry,foo
dadditives
andprep
ared
meals
$18.20
$31.30
$18.99
$31.20
$18.06
$27.92
$513
$560
$438
$566
$480
$518
Non
-alcoh
olicbe
verage
s$10.36
$18.51
$11.69
$17.90
$9.79
$16.67
$287
$335
$270
$325
$260
$309
Mealsou
tandfastfood
s$31.64
$146.58
$51.91
$121.55
$25.54
$97.67
$913
$2406
$1198
$2207
$679
$1812
Other
food
andno
n-alcoho
licbe
verage
s$0.14
$0.35
$0.11
$0.22
$0.17
$0.24
$318
$451
$371
$378
$263
$394
Alcoh
olicbe
verage
s$12.00
$57.89
$20.33
$47.47
$11.65
$38.39
n/a
n/a
n/a
n/a
n/a
n/a
Total
$156
.66
$398
.02
$182
.05
$373
.19
$143
.29
$309
.02
$407
8$5
902
$374
8$5
885
$350
2$5
012
Lewis et al. Nutrition Journal (2020) 19:139 Page 7 of 12
Table
3Prop
ortio
nof
totalfoo
dexpe
nditu
repe
rfood
catego
ryby
SEGfro
mthetw
oof
thefour
includ
edstud
iesthat
repo
rted
thisa
Food
category
Prop
ortion
oftotalfoo
dexpen
ditureper
food
category–ABSHES
Prop
ortion
oftotalfoo
dexpen
ditureper
food
category-ABARE
Sstud
y[33]
Gross
Hou
seho
ldInco
me
Hou
seho
ldNet
Worth
Hou
seho
ldMainSo
urce
ofInco
me
Equivalised
Hou
seho
ldInco
me
Hou
seho
ldNet
Worth
Hou
seho
ldMainSo
urce
ofInco
me
Lowest
Quintile
Highe
stQuintile
Lowest
Quintile
Highe
stQuintile
Gov
ernm
ent
Pensions
&Allo
wan
ces
Private
inco
me
Lowest
Quintile
Highe
stQuintile
Lowest
Quintile
Highe
stQuintile
Gov
ernm
ent
Pensions
&Allo
wan
ces
Private
inco
me
Food
andno
n-alcoho
licbe
ver-
ages
notfurthe
rde
scrib
ed6.3%
5.2%
7.0%
4.9%
4.8%
5.8%
n/a
n/a
n/a
n/a
n/a
n/a
Bakery
prod
ucts,flour
and
cereals
9.3%
5.7%
7.4%
6.8%
9.9%
7.0%
10.2%
7.4%
8.3%
7.9%
10.8%
8.0%
Meat
12.5%
8.1%
9.8%
9.5%
12.9%
9.6%
16.4%
12.2%
13.0%
13.7%
17.0%
13.2%
Fish
andseafoo
d2.6%
1.9%
1.8%
2.4%
2.7%
1.9%
Eggs
andeg
gprod
ucts
1.0%
0.6%
0.8%
0.6%
1.0%
0.7%
n/a
n/a
n/a
n/a
n/a
n/a
Dairy
prod
ucts
7.4%
4.4%
5.8%
5.1%
7.8%
5.3%
8.0%
5.4%
6.5%
5.9%
8.5%
6.0%
Edibleoilsandfats
0.8%
0.4%
0.6%
0.5%
1.0%
0.5%
n/a
n/a
n/a
n/a
n/a
n/a
Fruitandnu
ts6.5%
4.9%
4.8%
6.1%
6.9%
5.3%
15.5%
11.4%
11.6%
13.4%
15.7%
12.2%
Vege
tables
7.3%
4.8%
5.5%
5.6%
7.5%
5.4%
Con
dimen
ts,con
fectione
ry,etc
11.6%
7.9%
10.4%
8.4%
12.6%
9.0%
12.6%
9.5%
11.7%
9.6%
13.7%
10.3%
Non
-alcoh
olicbe
verage
s6.6%
4.7%
6.4%
4.8%
6.8%
5.4%
7.0%
5.7%
7.2%
5.5%
7.4%
6.2%
Mealsou
tandfastfood
s20.2%
36.8%
28.5%
32.6%
17.8%
31.6%
22.4%
40.8%
32.0%
37.5%
19.4%
36.1%
Other
food
0.1%
0.1%
0.1%
0.1%
0.1%
0.1%
7.8%
7.6%
9.9%
6.4%
7.5%
7.9%
Alcoh
olicbe
verage
s7.7%
14.5%
11.2%
12.7%
8.1%
12.4%
n/a
n/a
n/a
n/a
n/a
n/a
Total
100%
100%
100%
100%
100%
100%
100%
100%
100%
100%
100%
100%
a ABS
HES
prop
ortio
nscalculated
from
repo
rted
data,A
BARE
Sprop
ortio
nsas
repo
rted
Lewis et al. Nutrition Journal (2020) 19:139 Page 8 of 12

designed with the intention of being nationally represen-tative, however they do not include participants fromcommunities classified as ‘very remote’ [40]. Addition-ally, the small sample numbers of those living in rural andremote locations, makes examination of the impact of lo-cation on dietary cost challenging. Whilst location and re-moteness were not a focus of this review, rural andremote locations tend to include a high proportion of lowSEGs [9], and contend with higher food prices, and pooreravailability and access, compared to major cities [17].
Challenges of implementing habitual dietary costsmeasurement toolsResearch into financial affairs of the population can bechallenging due to a reluctance for participants to dis-cuss private matters such as their family finances [45].Social desirability bias may affect the accuracy of re-ported food purchasing, similarly to dietary intakereporting, where consumption of healthy foods is com-monly over-reported and less healthy foods under-reported [46]. Data collection can be onerous for partici-pants, especially when required to identify and record allspending. For example, the ABS HES requires surveyparticipants to diarise all expenditure for 2 weeks [36].The method used by Inglis et al., involving selection offrequency of purchase of costed products from a list ofitems, excludes non-supermarket items such as takeawayor restaurant foods, and alcohol, which may explain thelower expenditure estimates of this study compared tothose reported in the ABS HES [32]. Further, thismethod does not capture the relatively lower spendingof low SEGs in these categories compared to higherSEGs, and thus the differential in expenditure betweenSEGs is lower than in the other included studies. Add-itionally, for those households experiencing food inse-curity, food acquired from sources such as familymembers or charities will not be captured by food ex-penditure records, as it does not involve a financial cost.Less onerous data collection techniques, such as the useof barcode scanning of food purchases [47], may im-prove accuracy of food cost records.
Limitations of tools used to categorise SEGCategorisation of population groups by socioeconomicstatus may utilise one or more of a variety of measures,each of which affect the findings. When household in-come is used to categorise SEGs, it should be noted thatthe lowest income quintile, as defined by the ABS HESand the HILDA datasets [34, 35], is likely to containolder person households who are retired with a low in-come, but have access to lifetime savings for daily ex-penditure. This is evidenced by the higher net worth ofthe lowest quintile than the next three higher incomequintiles, and that the total goods and services
expenditure of the lowest quintile is 137% of after tax in-come [33]. Similarly, when categorising SEGs by networth, the lowest quintile will include households ofyounger people who may have “reasonable incomes buthave yet to accumulate significant assets” [33]. Low house-hold worth may also occur when assets are offset by highlevels of debt [48]. High household net worth can providereserves to support expenditure, but may also be bound inassets that limit cash flow [48]. In Australia, household in-come is more equally distributed than household wealth[49]. All of these limitations suggests that net worth is ablunt instrument for categorisation of SEGs for the pur-poses of investigating expenditure on diet, which reliesupon accessible funds on a regular basis.Those households mainly receiving income from gov-
ernment pensions and allowances include groups suchas the unemployed, single parents, people with a disabil-ity, and retirees without significant private funds, all ofwhom could be considered as low income due to pen-sion/allowance rates usually being lower than a work-force income. The categorisation of SEGs by incomesource is not ideal however, as income from privatesources may include minimum wage, or under-employment, and thus result in a low income.Inglis et al. used a household income level of less than
or more than $1500/week to discriminate between highand low SEGs [32]. It was not reported if this was gross ordisposable household income. This cut point appears con-sistent with the mean disposable income per household inthe middle tertile of Australia in 2009 ($721/week equiva-lised household income = $1514 for a family of four) [50].
Comparison of estimated dietary costsOverall, the four included studies found that low SEGs(measured by various financial variables) spent less on theirdiet than higher SEGs [32–35]. The heterogeneity of thestudy populations, SEG categorisation and food expend-iture measures preclude direct quantitative comparison be-tween the included studies. A large difference was observedbetween the lowest and highest SEGs in spending on mealsout and fast food both in actual cost [34] and proportion oftotal food expenditure [33]. However, this commodity/cu-linary based categorisation of foods does not necessarily in-dicate a difference in the healthfulness of food consumed,merely difference in the purchase location. None of the in-cluded studies reported food expenditure by food groupsconsistent with the ADGs groupings [10]. Whilst it isknown from population dietary intake data that low SEGsconsume lower quality diets than higher SEGs [12], the lackof specific data supporting assessment of the healthfulnessof the costed diets means that it is currently unclear if lowSEGs, or any population group, will need to spend more orless on various food groups and total diets in order to movetowards a healthier diet.
Lewis et al. Nutrition Journal (2020) 19:139 Page 9 of 12
Proportion of income spent on dietThe included studies reported that the proportion ofhousehold income spent on food and drinks was, as ex-pected, consistently higher for low SEGs [33, 35]. TheABARES report, using household after tax income tocategorise SEG, found that expenditure on food anddrinks by the lowest SEG was close to 25% of householdincome. Similarly, the HILDA study found that a signifi-cant proportion of households (34%) in not just the low-est, but the two lowest quintiles of household income,had expenditure above 30% of household income. Thushouseholds of low SEGs are likely to have difficultyaffording their habitual diet. Indeed, single-item mea-sures of food insecurity in Australia [51] suggest 4% ofhouseholds are affected, but more comprehensive mea-sures encompassing all dimensions of food insecurity es-timate prevalence at 10–30% of households [52].Given this, the development of public health policy to
encourage the purchase and consumption of healthierfood and drinks must consider cost implications, as anyactual or perceived need for additional food expenditureis likely to be rejected by those who cannot stretch theirbudget any further. In particular, research comparingthe cost of healthy diets to habitual diet costs of lowSEGs would provide strong evidence to support suchpolicies.
Strengths and limitations of the reviewA strength of this review is detailed analysis of the fac-tors reported in the included studies that influence as-sessment of the habitual dietary costs of Australiansdifferentiated by SEGs. The review was limited by theavailability of documents to online searches, and to thedata reported. The HES and HILDA surveys were notdesigned primarily for dietary analysis and the currentreporting formats do not support this in any detail.A limitation of studies of habitual food expenditure is
that cost differences due to both brand or food typechoice are not assessed, and thus a higher cost of a foodcategory does not necessarily reflect a higher intake. Forexample, the unit expenditure on fruit will be higher forout-of-season produce compared to the same quantity ofin-season fruits, and usually unit expenditure onbranded products will be higher than on home-label,generic items. A more recently developed alternativemethod uses reported intake data from dietary surveysto determine the mean intake of a population group,followed by costing of this diet using the most commonbrands or food types [30, 53]. This standardised ap-proach, the Healthy Diets Australian Standardised Af-fordability and Pricing (ASAP) methods protocol,therefore provides a more comprehensive assessment ofthe relationship between diet cost and health [30].
Due to the small number and heterogeneous nature ofthe identified studies, meta-analysis or other statisticalanalysis of the results was precluded. Future research inthis area that includes harmonized, granular data alignedwith the ADG food groups would provide stronger evi-dence of the relationship between expenditure on dietaryintake by SEG from a health perspective.
ConclusionsThis systematic review confirmed that there were differ-ences in expenditure on dietary intake by SEG; all in-cluded studies reported that low SEGs spent less on dietthan higher SEGs in absolute terms, but spent a higherproportion of their household income on food anddrinks. Heterogeneity due to differences in populationsstudied, SEG categorisation and methods of measuringand reporting dietary intake costs did not allow quanti-tative nutritional analysis of dietary intake costs acrossthe included studies.A lack of granularity of data and lack of reporting of
the cost by ADG food group expenditure meant that theresults could not be used to assess habitual householdexpenditure on healthy or unhealthy foods and drinks.Updating the food categories used in national householdexpenditure surveys to align with the ADG food groupswould assist in the provision of detailed data that can besynthesised to support the development of targeted in-terventions and policies to reduce the inequities ofhealthy eating.
AbbreviationsABARES: Australian Bureau of Agriculture and Resource Economics andSciences; ABS HES: Australian Bureau of Statistics Household ExpenditureStudy; ADG: Australian Dietary Guidelines; CPI: Consumer Price Index;HILDA: Household, Income and Labour Dynamics in Australia; PRISMA: Preferred Reporting Items for Systematic Reviews and Meta-analyses;SEG: Socioeconomic group
AcknowledgementsNot applicable.
Authors’ contributionsML designed and conducted the search, data extraction, analysed the dataand drafted the manuscript. AJL cross checked the search, data extractionand data analysis. All authors provided critical feedback and provided inputto the manuscript. The author(s) read and approved the final manuscript.
FundingML was supported by a Research Training Program Scholarship provided byThe University of Queensland, and a Top-up Scholarship provided by TheAustralian Prevention Partnership Centre, The Sax Institute.
Availability of data and materialsData sharing is not applicable to this article as no datasets were generatedor analysed during the current study.
Ethics approval and consent to participateNot applicable.
Consent for publicationNot applicable.
Lewis et al. Nutrition Journal (2020) 19:139 Page 10 of 12

Competing interestsThe authors declare that they have no competing interests.
Author details1School of Public Health, Faculty of Medicine, The University of Queensland,Herston, Queensland, Australia. 2The Australian Prevention PartnershipCentre, The Sax Institute, Ultimo, New South Wales, Australia. 3DeakinUniversity, Institute for Physical Activity and Nutrition, School of Exercise andNutrition Sciences, Geelong, Australia. 4School of Public Health, University ofSydney, Camperdown, New South Wales, Australia.
Received: 7 May 2020 Accepted: 30 November 2020
References1. Stringhini S, Carmeli C, Jokela M, Avendaño M, Muennig P, Guida F, et al.
Socioeconomic status and the 25 x 25 risk factors as determinants ofpremature mortality: a multicohort study and meta-analysis of 1.7 millionmen and women. Lancet. 2017;389(10075):1229–37.
2. Booth S, Smith A. Food security and poverty in Australia -- challenges fordietitians. Australian Journal of Nutrition & Dietetics. 2001;58(3):150–6.
3. FAO. The State of Food Insecurity in the World 2001. Rome: Food andAgriculture Organisation; 2002.
4. Harris B, Fetherston H, Calder R. Australia’s health tracker by socio-economicstatus 2017. Melbourne: Australian Health Policy Collaboration; 2017.
5. Australian Institute of Health and Welfare. Australia's health 2016 -Health of population groups: Health across socioeconomic groups 2016[Available from: https://www.aihw.gov.au/reports/australias-health/australias-health-2016/contents/chapter-5-health-of-population-groups].Accessed Aug 2019.
6. Friel S, Pescud M, Malbon E, Lee A, Carter R, Greenfield J, et al. Usingsystems science to understand the determinants of inequities in healthyeating. PLoS One. 2017;12(11):e0188872.
7. Pescud M, Friel S, Lee A, Sacks G, Meertens E, Carter R, et al. Extending theparadigm: a policy framework for healthy and equitable eating (HE2). PublicHealth Nutr. 2018;21(18):3477–81.
8. Marmot M, Allen J, Bell R, Bloomer E, Goldblatt P. WHO European review ofsocial determinants of health and the health divide. Lancet. 2012;380(9846):1011–29.
9. Australian Bureau of Statistics. 2033.0.55.001 Census of Population andHousing: Socio-Economic Indexes for Areas (SEIFA). Australia: Australian Bureauof Statistics; 2011. [Available from: http://www.abs.gov.au/websitedbs/censushome.nsf/home/seifa].
10. National Health and Medical Research Council. Australian Dietary Guidelines- providing the scientific evidence for healthier Australian Diets. Canberra:National Health and Medical Research Council; 2013.
11. Australian Bureau of Statistics. 4364.0.55.012 - Australian Health Survey:Consumption of Food Groups from the Australian Dietary Guidelines, 2011–12. Canberra: Australian Bureau of Statistics; 2016. [Available from: http://www.abs.gov.au/ausstats/[email protected]/mf/4364.0.55.012].
12. Livingstone KM, Olstad DL, Leech RM, Ball K, Meertens B, Potter J, et al.Socioeconomic inequities in diet quality and nutrient intakes amongAustralian adults: Findings from a nationally representative cross-sectionalstudy. Nutrients. 2017;9(10):1092.
13. Darmon N, Drewnowski A. Contribution of food prices and diet cost tosocioeconomic disparities in diet quality and health: a systematic reviewand analysis. Nutr Rev. 2015;73(10):643–60.
14. Friel S, Hattersley L, Ford L. Evidence review: Addressing the socialdeterminants of inequities in healthy eating. In: VicHealth, editor. TheNational Centre for Epidemiology and Population Health. Canberra: TheAustralian National University; 2015.
15. Turrell G, Kavanagh AM. Socio-economic pathways to diet: modelling theassociation between socio-economic position and food purchasingbehaviour. Public Health Nutr. 2006;9(3):375–83.
16. Zorbas C, Palermo C, Chung A, Iguacel I, Peeters A, Bennett R, et al. Factorsperceived to influence healthy eating: a systematic review and meta-ethnographic synthesis of the literature. Nutr Rev. 2018;76(12):861–74.
17. Lewis M, Lee A. Costing ‘healthy’ food baskets in Australia - a systematicreview of food price and affordability monitoring tools, protocols andmethods. Public Health Nutr. 2016;19(16):2872–86.
18. Kettings C, Sinclair AJ, Voevodin M. A healthy diet consistent with Australianhealth recommendations is too expensive for welfare-dependent families.Aust N Z J Public Health. 2009;33(6):566–72.
19. Lee A, Mhurchu CN, Sacks G, Swinburn B, Snowdon W, Vandevijvere S, et al.Monitoring the price and affordability of foods and diets globally. Obes Rev.2013;14(Suppl 1):82–95.
20. Barosh L, Friel S, Engelhardt K, Chan L. The cost of a healthy and sustainablediet--who can afford it? Aust N Z J Public Health. 2014;38(1):7–12.
21. Burns C, Friel S. It’s time to determine the cost of a healthy diet in Australia.Aust N Z J Public Health. 2007;31(4):363–5.
22. Ward PR, Coveney J, Verity F, Carter P, Schilling M. Cost and affordability ofhealthy food in rural South Australia. Rural Remote Health. 2012;12:1938.
23. Chapman K, Goldsbury D, Watson W, Havill M, Wellard L, Hughes C, et al.Exploring perceptions and beliefs about the cost of fruit and vegetables andwhether they are barriers to higher consumption. Appetite. 2017;113:310–9.
24. Australian Institute of Health and Welfare. Australian burden of disease study:impact and causes of illness and death in Aboriginal and Torres Strait islanderpeople 2011. Canberra: Australian Institute of Health and Welfare; 2015.
25. Burns C, Sacks G, Gold L. Longitudinal study of Consumer Price Index (CPI)trends in core and non-core foods in Australia. Aust N Z J Public Health.2008;32(5):450–3.
26. Waterlander WE, Mackay S. Costing a healthy diet: measurement and policyimplications. Public Health Nutr. 2016;19(16):2867–71.
27. Davis GC, Carlson A. The inverse relationship between food price andenergy density: is it spurious? Public Health Nutr. 2015;18(6):1091–7.
28. Burns C. In: Victorian Health Promotion Foundation, editor. A review of theliterature describing the link between poverty, food insecurity and obesitywith specific reference to Australia. VicHealth: Melbourne; 2004.
29. PRISMA. Welcome to the Preferred Reporting Items for Systematic Reviewsand Meta-Analyses (PRISMA) website! 2015 [Available from: http://www.prisma-statement.org/].
30. Lee AJ, Kane S, Lewis M, Good E, Pollard CM, Landrigan TJ, et al. Healthydiets ASAP - Australian standardised affordability and pricing methodsprotocol. Nutr J. 2018;17(1):88.
31. EndNote X8. Clarivate; 2018.32. Inglis V, Ball K, Crawford D. Does modifying the household food budget
predict changes in the healthfulness of purchasing choices among low-and high-income women? Appetite. 2009;52(2):273–9.
33. Australian Bureau of Agriculture and Resource Economics and Sciences. In:Department of Agriculture and Water Resources, editor. Food demand inAustralia: Trends and issues 2018. Canberra: Department of Agriculture andWater Resources; 2018.
34. Australian Bureau of Statistics. 6530.0 - Household Expenditure Survey,Australia: Summary of Results, 2015–16. Canberra: Australian Bureau ofStatistics; 2017. [Available from: https://www.abs.gov.au/AUSSTATS/[email protected]/Lookup/6530.0Main+Features12015-16?OpenDocument].
35. Wilkins R. Household expenditure on food. The Household Income andLabour Dynamics in Australia Survey : selected findings from Waves 1 to 12.Melbourne: Melbourne Institute of Applied Economic and Social Research;2015. p. 81–4.
36. Australian Bureau of Statistics. 6503.0 - Household Expenditure Survey andSurvey of Income and Housing, User Guide, Australia, 2009–10. Canberra:Australian Bureau of Statistics; 2012. [Available from: http://www.abs.gov.au/AUSSTATS/[email protected]/allprimarymainfeatures/3D7C35239FAFC81DCA2581B4000E46EE?opendocument].
37. Australian Bureau of Statistics. Equivalised Total Household Income 2016[Available from: https://www.abs.gov.au/websitedbs/censushome.nsf/home/statementsdwellinghied?opendocument&navpos=430]. Accessed Aug 2019.
38. Farahbakhsh J, Hanbazaza M, Ball GDC, Farmer AP, Maximova K, Willows ND. Foodinsecure student clients of a university-based food bank have compromised health,dietary intake and academic quality. Nutr Diet. 2017;74(1):67–73.
39. Sun C. HILDA project technical paper series no. 1/10, February 2010.Melbourne: The University of Melbourne; 2010.
40. Australian Bureau of Statistics. 6503.0 - Household Expenditure Survey and Surveyof Income and Housing, User Guide, Australia, 2015–16. Canberra: AustralianBureau of Statistics; 2017. [Available from: https://www.abs.gov.au/AUSSTATS/[email protected]/allprimarymainfeatures/C571EA00F941140ECA2571880005BEE2?opendocument].
41. Burns C, Cook K, Mavoa H. Role of expendable income and price in foodchoice by low income families. Appetite. 2013;71:209–17.
Lewis et al. Nutrition Journal (2020) 19:139 Page 11 of 12
42. Inglis V, Ball K, Crawford D. Socioeconomic variations in women's diets:what is the role of perceptions of the local food environment? J EpidemiolCommunity Health. 2008;62(3):191–7.
43. Fiedler JL. Towards overcoming the food consumption information gap:strengthening household consumption and expenditures surveys for foodand nutrition policymaking. Glob Food Secur. 2013;2(1):56–63.
44. Australian Bureau of Statistics. 6401.0 - Consumer Price Index, Australia, Dec2015 Feature Article: Australian Dietary Guidelines Price Indexes. Canberra:Australian Bureau of Statistics; 2016. [Available from: http://www.abs.gov.au/AUSSTATS/[email protected]/Previousproducts/6401.0Feature%20Article1Dec%202015?opendocument&tabname=Summary&prodno=6401.0&issue=Dec%202015&num=&view=].
45. Shapiro GK, Burchell BJ. Measuring financial anxiety. J Neurosci PsycholEcon. 2012;5(2):92–103.
46. van de Mortel TF. Faking It: Social desirability response bias in self-reportresearch. Aust J Adv Nurs. 2008;25(4):40–8.
47. Jones NRV, Tong TYN, Monsivais P. Meeting UK dietary recommendations isassociated with higher estimated consumer food costs: an analysis usingthe National Diet and Nutrition Survey and consumer expenditure data,2008–2012. Public Health Nutr. 2018;21(5):948–56.
48. Balestra C, Tonkin R. Inequalities in household wealth across OECDcountries: Evidence from the OECD Wealth Distribution Database. Paris:OECD Statistics Working Papers, OECD Publishing; 2018. (02 Apr 2020).
49. Australian Bureau of Statistics. 6523.0 - Fact Sheet 2: Understanding measuresof income and wealth. In: Australian Bureau of Statistics, editor. 2019.
50. Australian Bureau of Statistics. 6523.0 - Household Income and IncomeDistribution, Australia, 2009–10 2011 [Available from: https://www.abs.gov.au/AUSSTATS/[email protected]/Previousproducts/6523.0Main%20Features22009-10?opendocument&tabname=Summary&prodno=6523.0&issue=2009-10&num=&view=].
51. Australian Bureau of Statistics. 4364.0.55.001 - Australian Health Survey:Users’ Guide, 2011-2013. Canberra: Australian Bureau of Statistics; 2013.[Available from: https://www.abs.gov.au/ausstats/[email protected]/Lookup/1F1C9AF1C156EA24CA257B8E001707B5?opendocument].
52. Yii V, Palermo C, Kleve S. Population-based interventions addressing foodinsecurity in Australia: a systematic scoping review. Nutr Diet. 2020;77(1):6–18.
53. Lee AJ, Kane S, Ramsey R, Good E, Dick M. Testing the price andaffordability of healthy and current (unhealthy) diets and the potentialimpacts of policy change in Australia. BMC Public Health. 2016;16:315.
Publisher’s NoteSpringer Nature remains neutral with regard to jurisdictional claims inpublished maps and institutional affiliations.
Lewis et al. Nutrition Journal (2020) 19:139 Page 12 of 12