Embed Size (px)
Citation preview
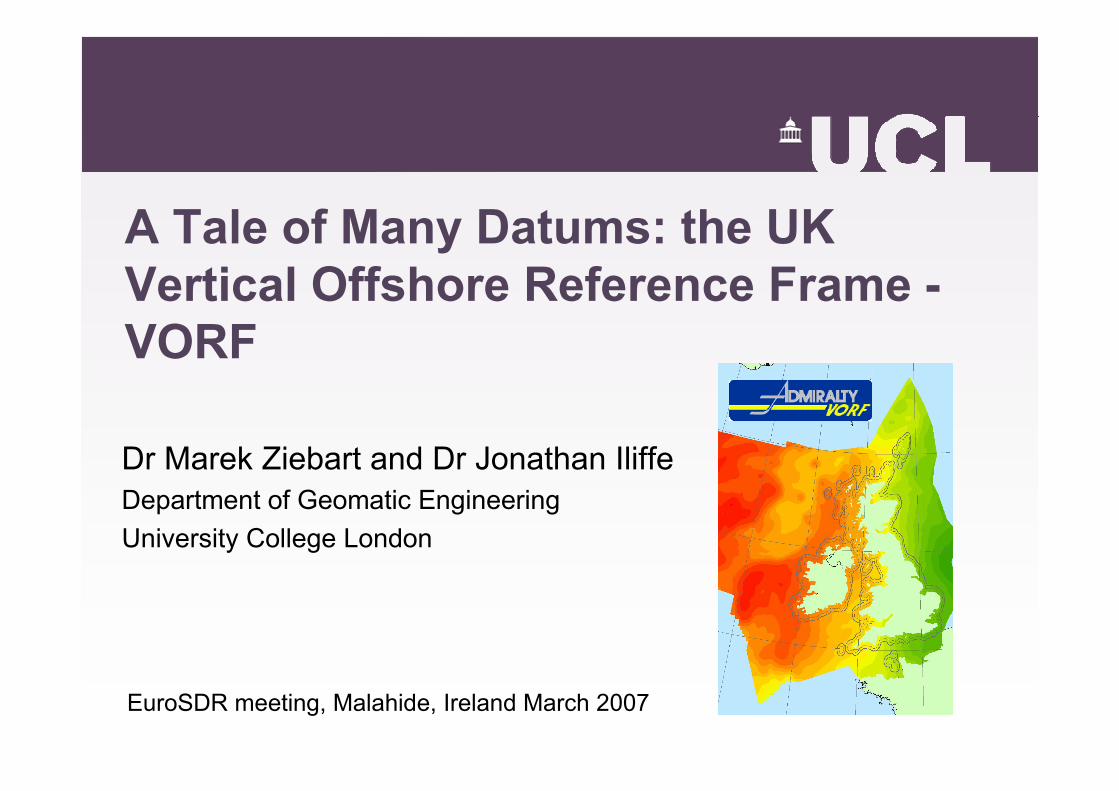
A Tale of Many Datums: the UK Vertical Offshore Reference Frame -VORF
Dr Marek Ziebart and Dr Jonathan IliffeDepartment of Geomatic EngineeringUniversity College London
EuroSDR meeting, Malahide, Ireland March 2007
Presentation structure
• What is VORF?• Why do we need it?• Model development• Interface and software functionality• Applications• Project status and initial test results• Conclusions
What is VORF?
• A high resolution digital model of all the reference surfaces in all navigable waters of the British Isles. All surfaces are modelled with respect to the GPS global datum (WGS84/ITRF2000, ETRF89)
• The software to transform rapidly and robustly between these different datums.
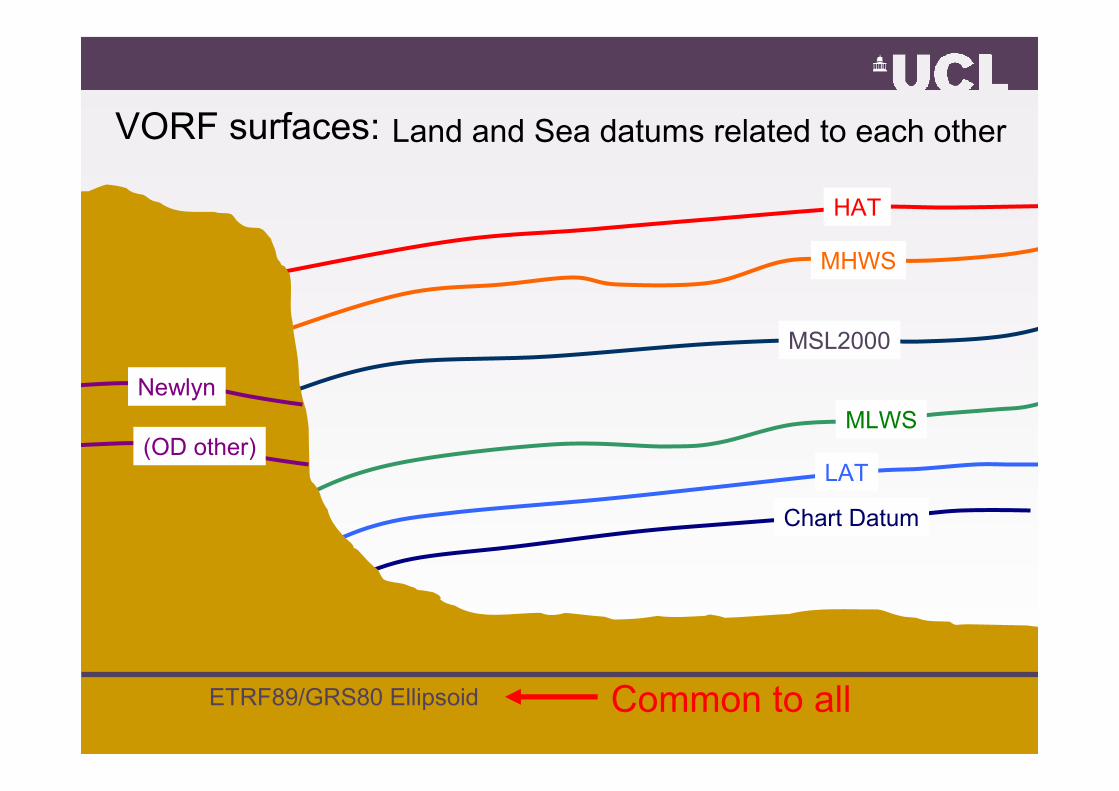
Chart Datum
LAT
MLWS
MSL2000
MHWS
HAT
VORF surfaces:
ETRF89/GRS80 Ellipsoid
Newlyn
(OD other)
Land and Sea datums related to each other
Common to all
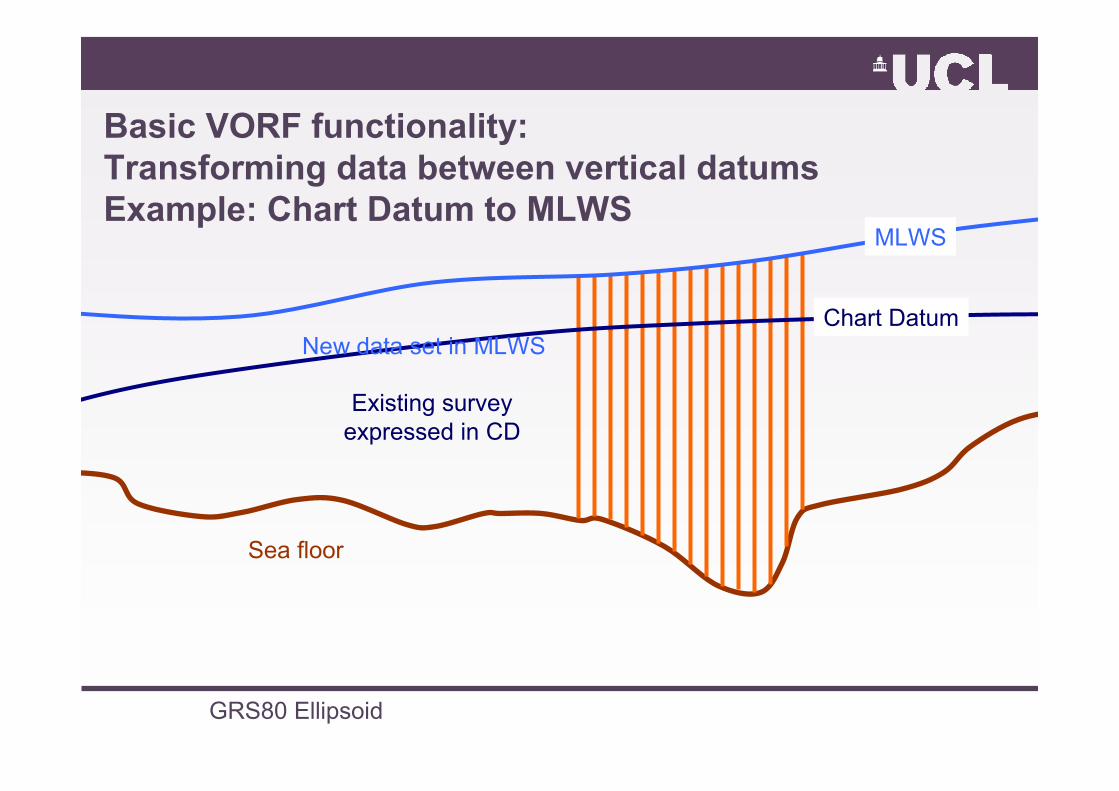
GRS80 Ellipsoid
Basic VORF functionality: Transforming data between vertical datumsExample: Chart Datum to MLWS
MLWS
Existing surveyexpressed in CD
Chart Datum
Sea floor
New data set in MLWS
Why is VORF needed?
• Continuing developments in GNSS• LIDAR and multibeam technology• Global trends in datum unification, harmonisation
of charting, automation in navigation and data acquisition
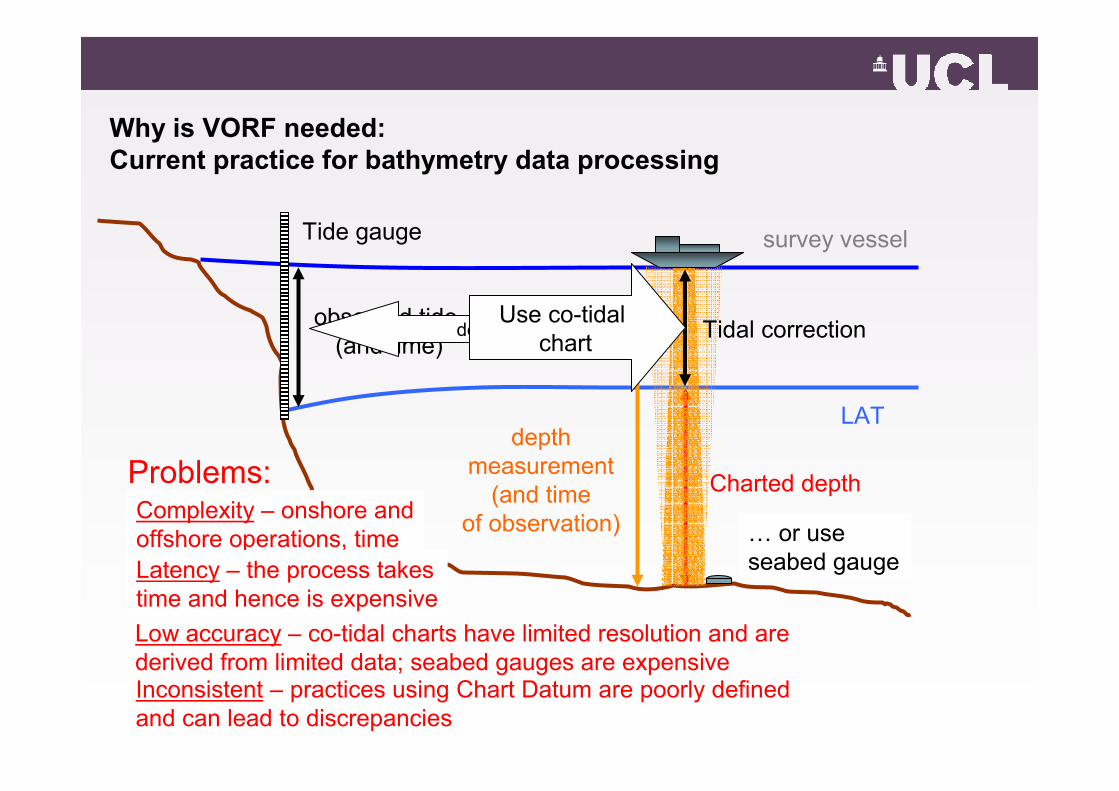
LAT
Charted depth
depthmeasurement
(and timeof observation)
survey vesselTide gauge
observed tide (and time)
Tidal correctionderived fromUse co-tidal
chart
Why is VORF needed:Current practice for bathymetry data processing
Problems:Complexity – onshore andoffshore operations, timeLatency – the process takestime and hence is expensiveLow accuracy – co-tidal charts have limited resolution and arederived from limited data; seabed gauges are expensiveInconsistent – practices using Chart Datum are poorly definedand can lead to discrepancies
… or use seabed gauge
CD
Charted depth
depthmeasurement
Tidal correction
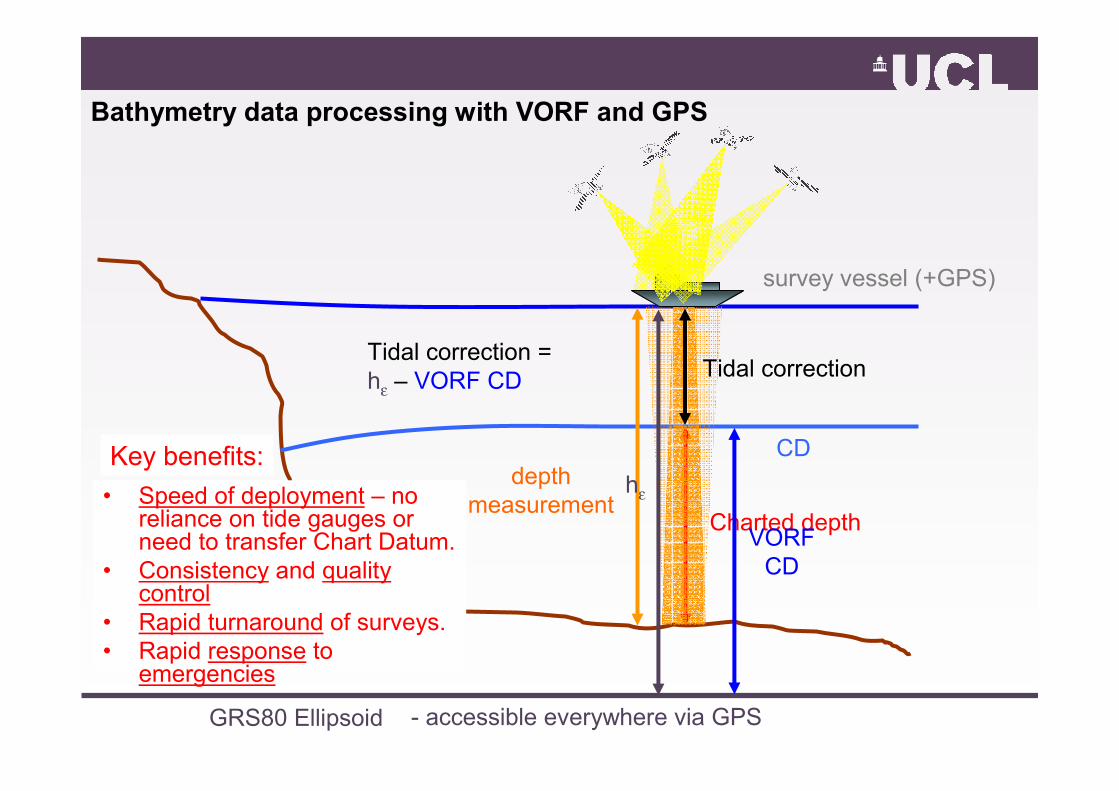
Bathymetry data processing with VORF and GPS
GRS80 Ellipsoid
VORFCD
survey vessel (+GPS)
hε
Tidal correction = hε – VORF CD
- accessible everywhere via GPS
• Speed of deployment – no reliance on tide gauges or need to transfer Chart Datum.
• Consistency and quality control
• Rapid turnaround of surveys.• Rapid response to
emergencies
Key benefits:
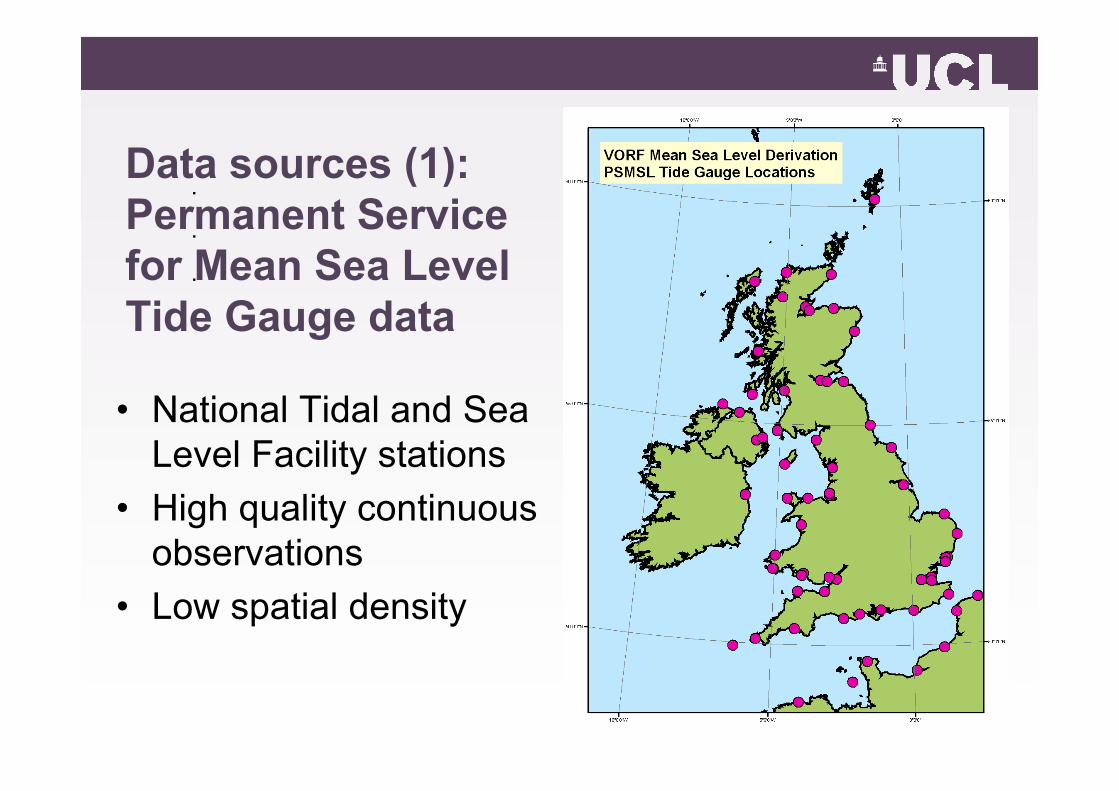
Data sources (1):Permanent Service for Mean Sea Level Tide Gauge data
• National Tidal and Sea Level Facility stations
• High quality continuous observations
• Low spatial density
.
.
.
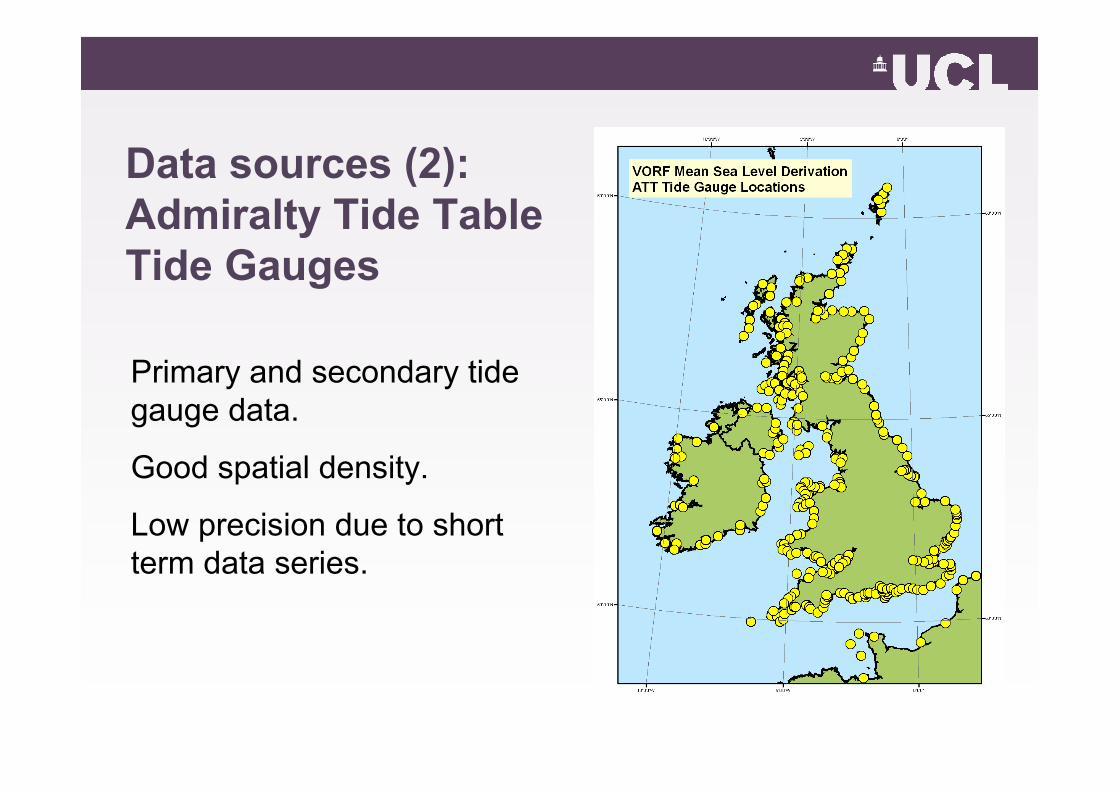
Data sources (2):Admiralty Tide Table Tide Gauges
Primary and secondary tide gauge data.
Good spatial density.
Low precision due to short term data series.
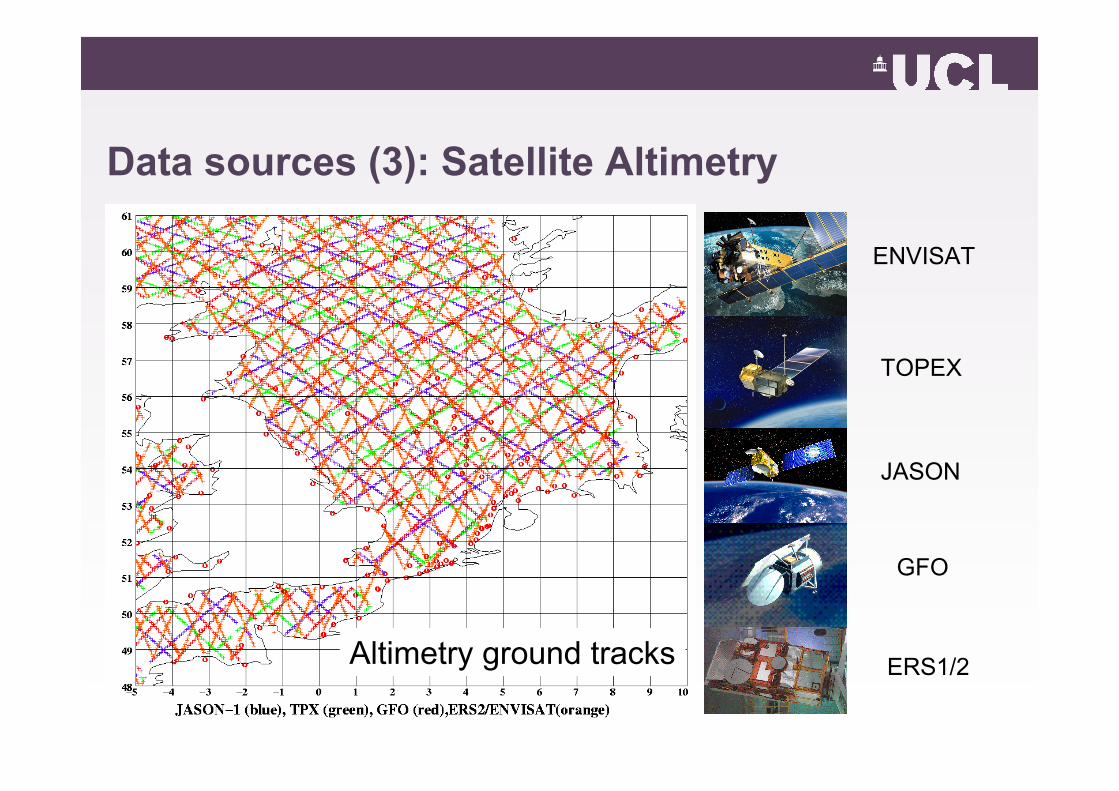
Data sources (3): Satellite Altimetry
ENVISAT
TOPEX
JASON
GFO
ERS1/2Altimetry ground tracks
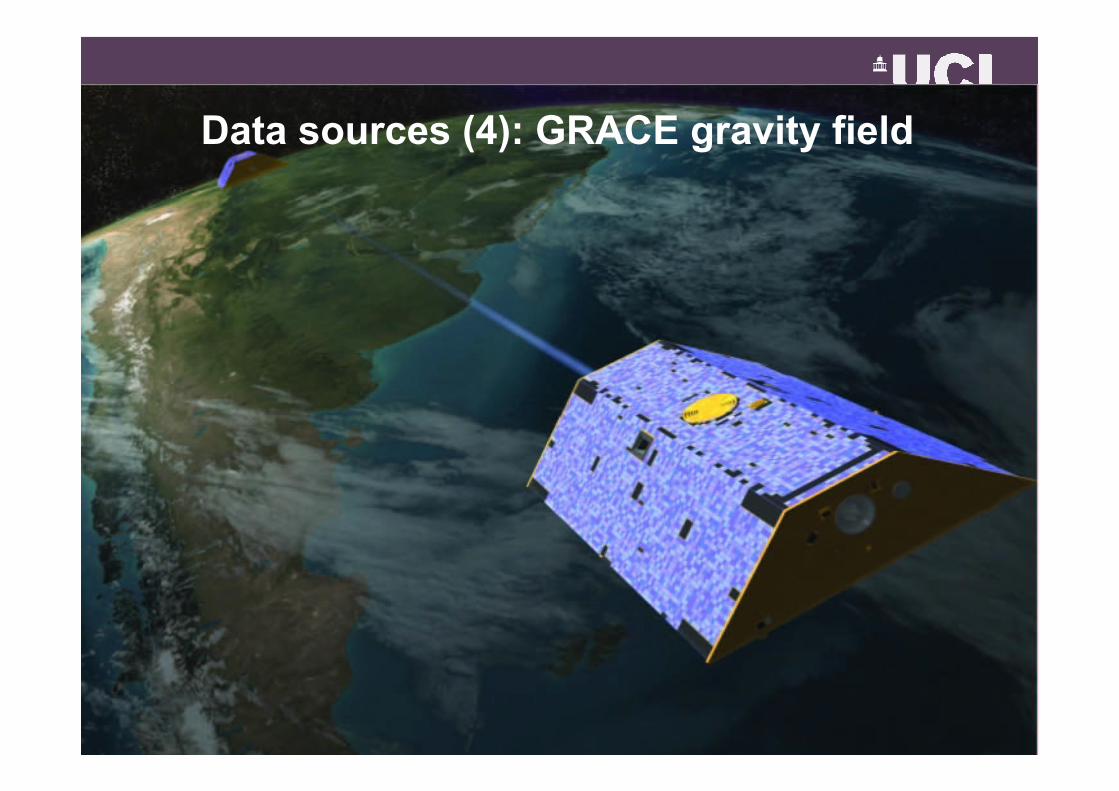
Data sources (4): GRACE gravity field
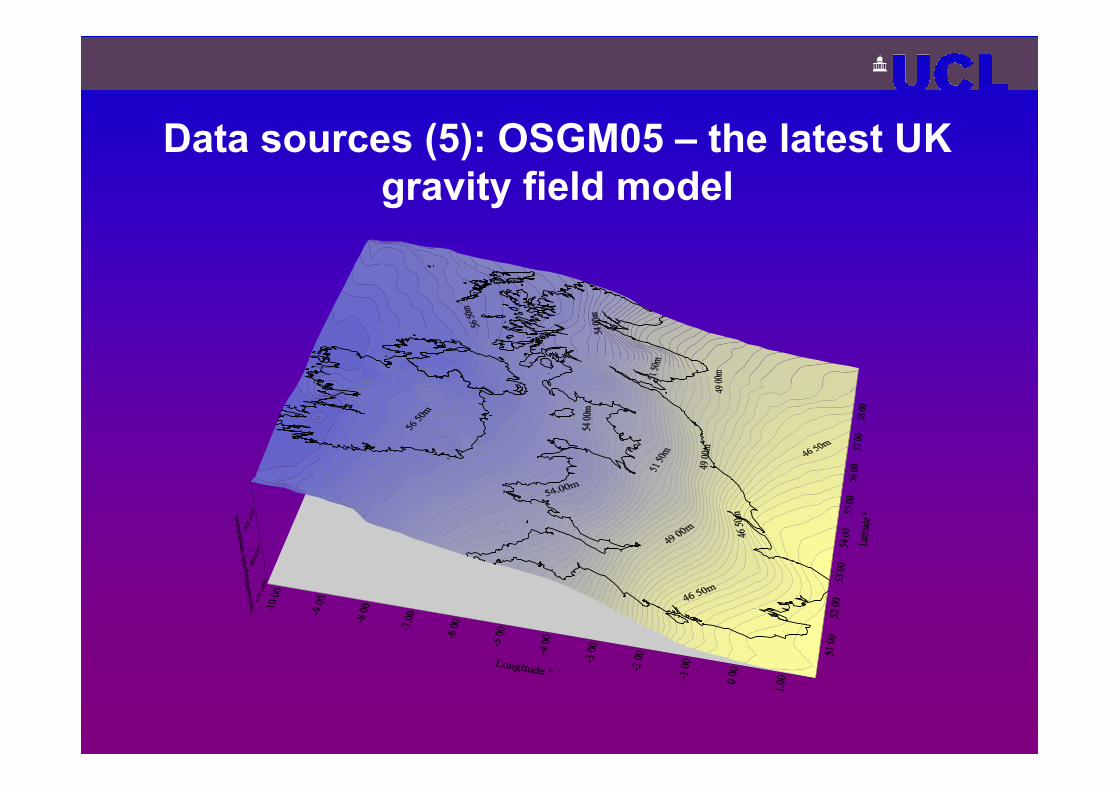
Data sources (5): OSGM05 – the latest UK gravity field model
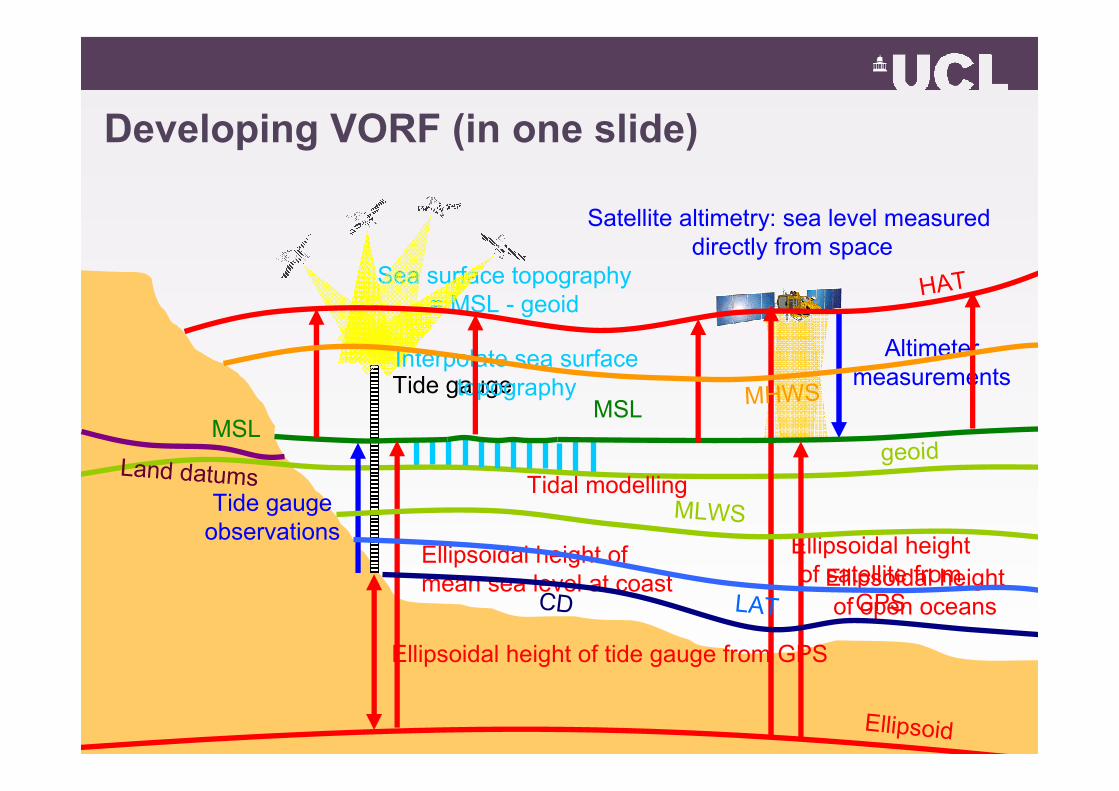
Sea surface topography= MSL - geoid
Developing VORF (in one slide)
Ellipsoid
geoid
Tide gauge
Ellipsoidal height of tide gauge from GPS
MSL
Tide gaugeobservations
Ellipsoidal height of mean sea level at coast
Satellite altimetry: sea level measured directly from space
Ellipsoidal heightof satellite from
GPS
Altimetermeasurements
MSL
Ellipsoidal heightof open oceans
Interpolate sea surfacetopography
HAT
LAT
MHWS
MLWS
CD
Land datums Tidal modelling
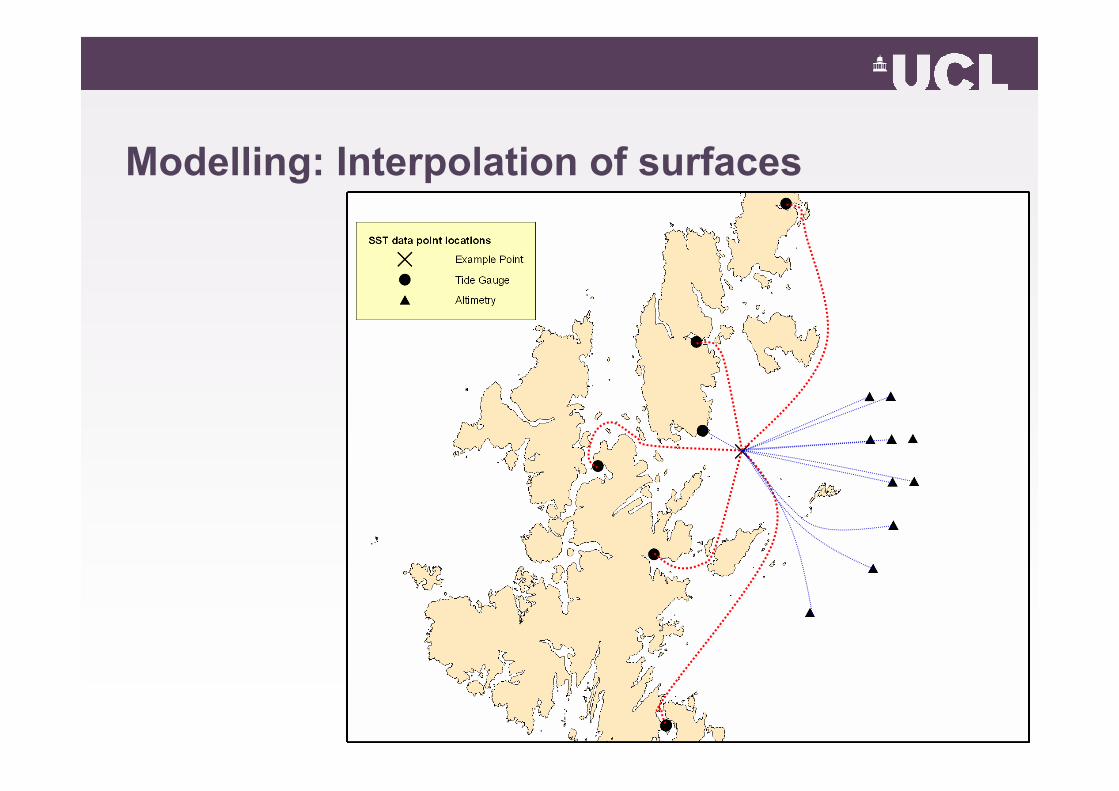
Modelling: Interpolation of surfaces
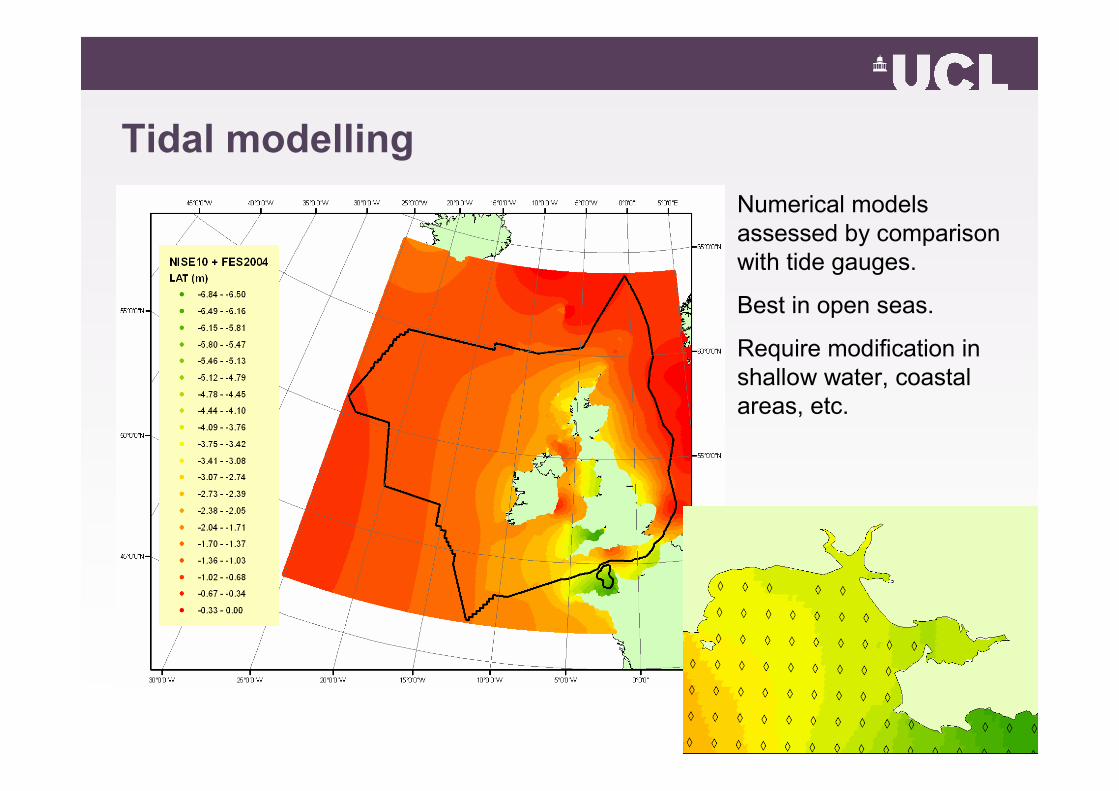
Tidal modellingNumerical models assessed by comparison with tide gauges.
Best in open seas.
Require modification in shallow water, coastal areas, etc.
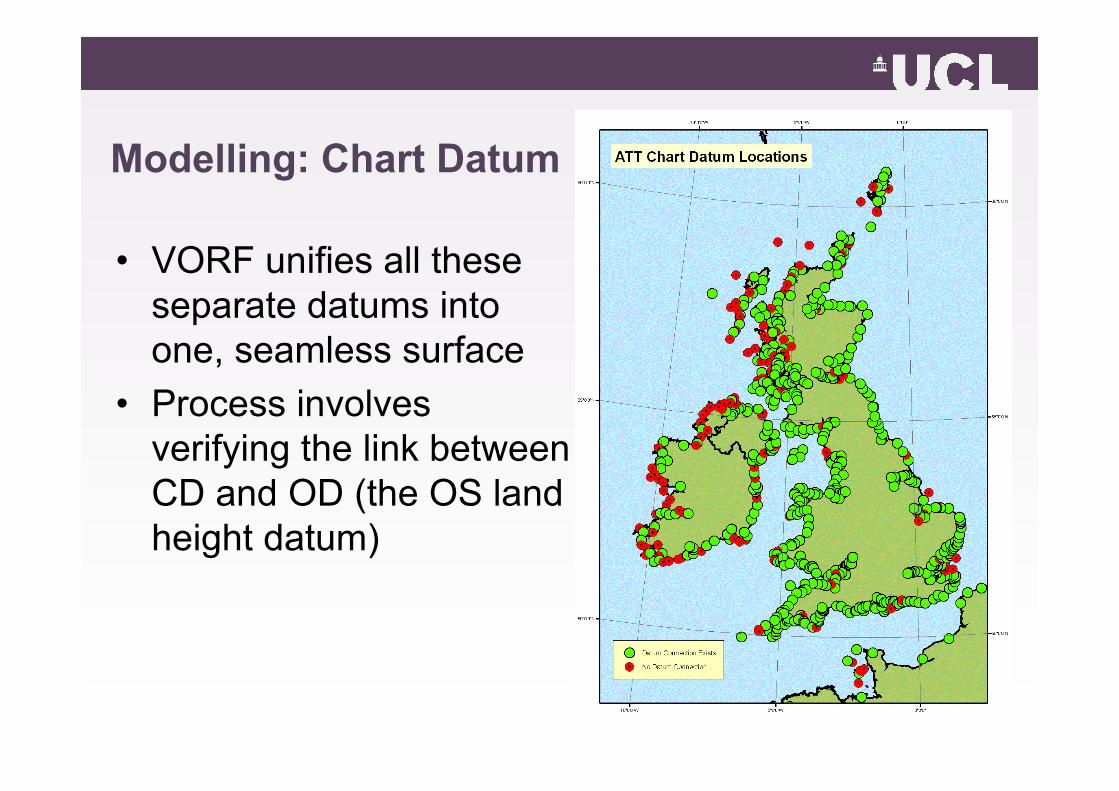
Modelling: Chart Datum
• VORF unifies all these separate datums into one, seamless surface
• Process involves verifying the link between CD and OD (the OS land height datum)
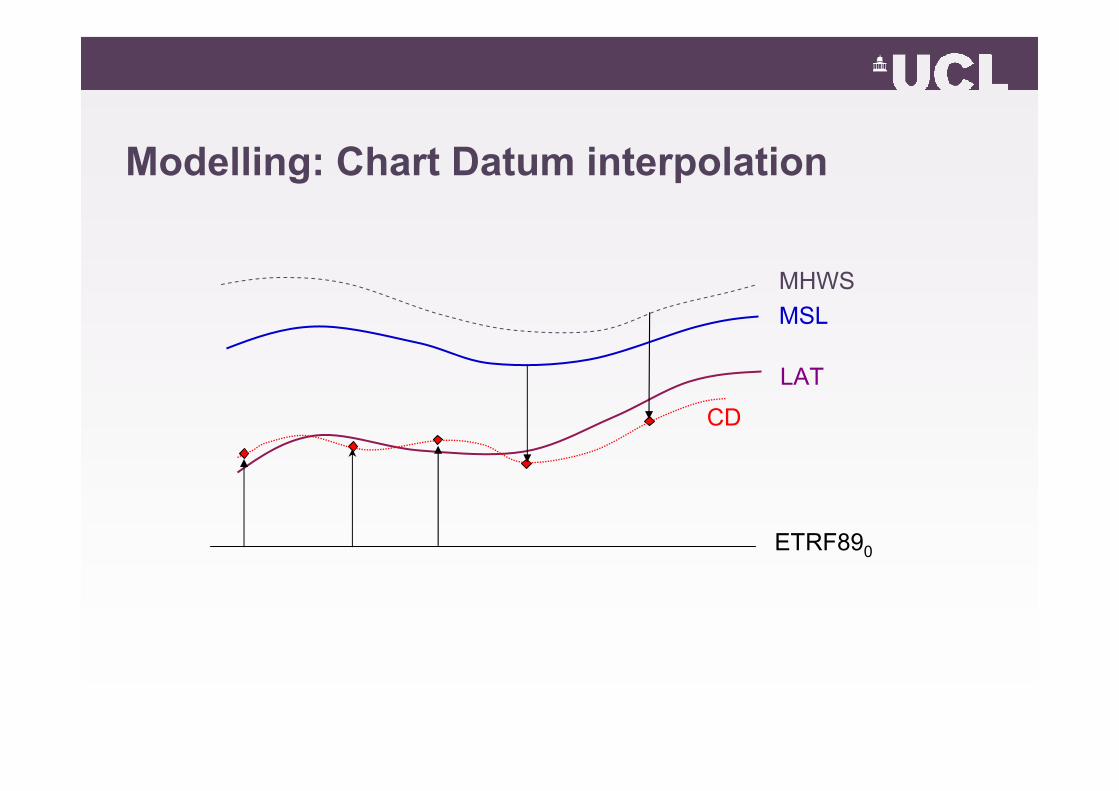
Modelling: Chart Datum interpolation
MSL
LAT
ETRF890
MHWS
CD
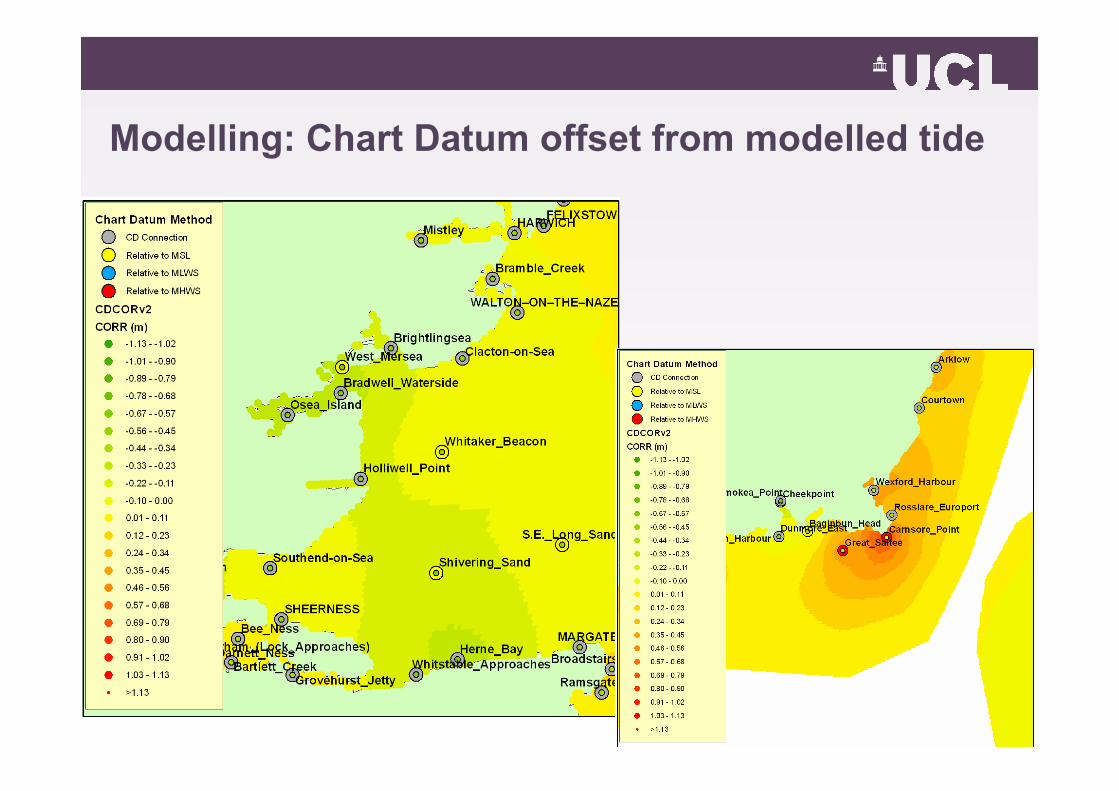
Modelling: Chart Datum offset from modelled tide
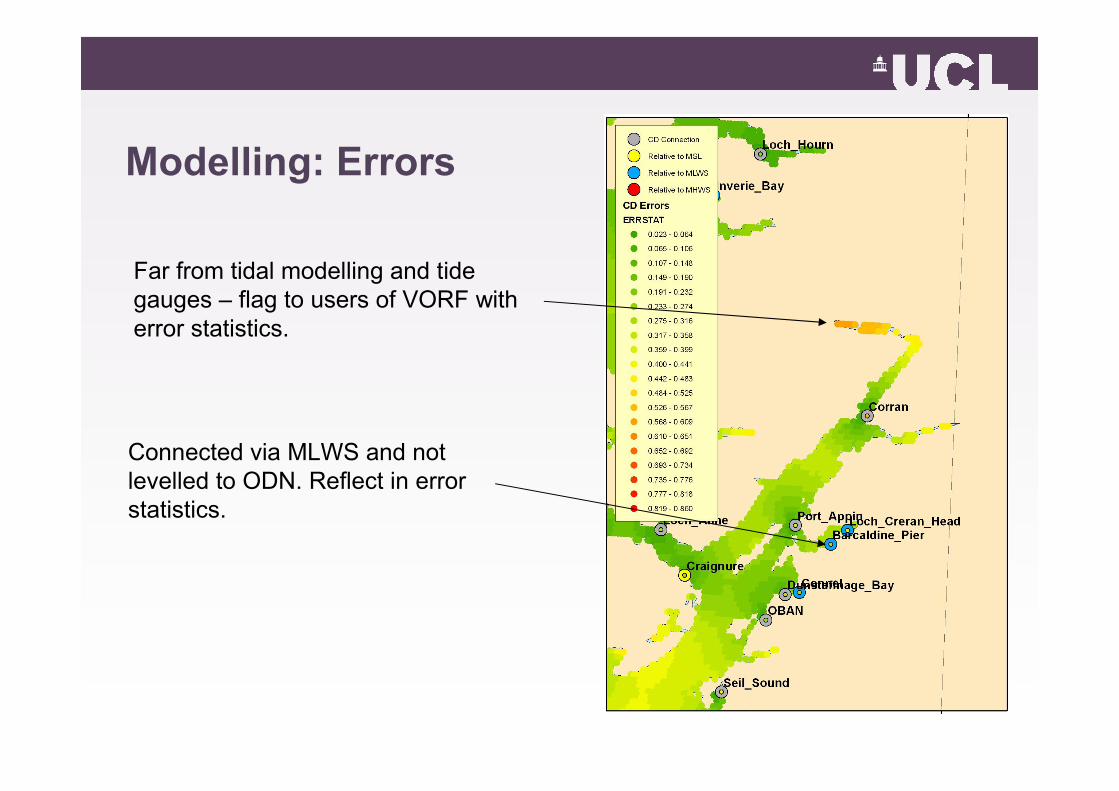
Far from tidal modelling and tide gauges – flag to users of VORF with error statistics.
Connected via MLWS and not levelled to ODN. Reflect in error statistics.
Modelling: Errors
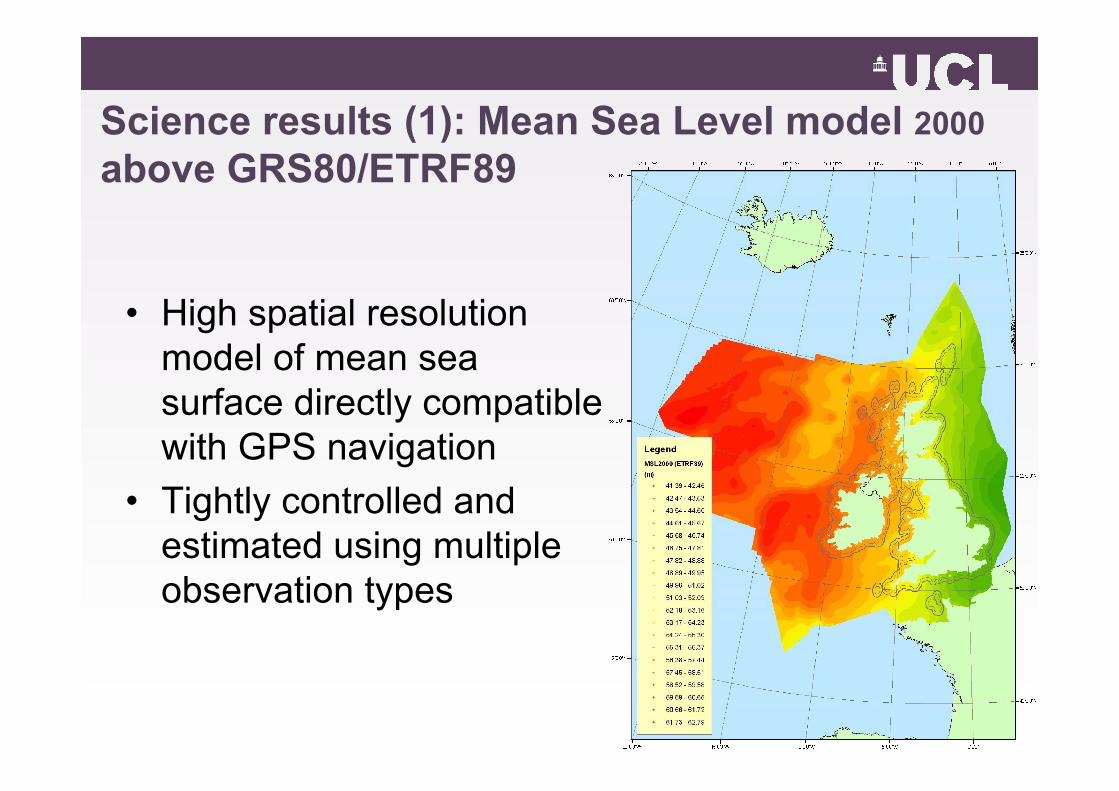
Science results (1): Mean Sea Level model 2000above GRS80/ETRF89
• High spatial resolution model of mean sea surface directly compatible with GPS navigation
• Tightly controlled and estimated using multiple observation types
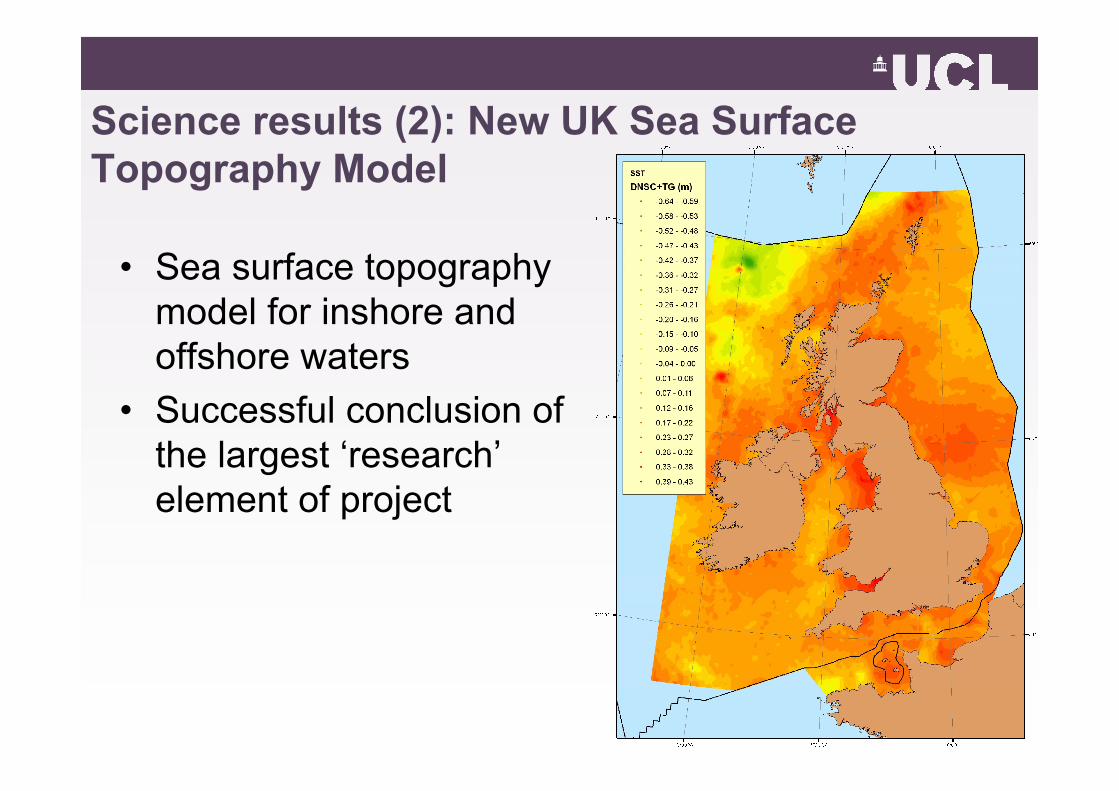
Science results (2): New UK Sea Surface Topography Model
• Sea surface topography model for inshore and offshore waters
• Successful conclusion of the largest ‘research’element of project
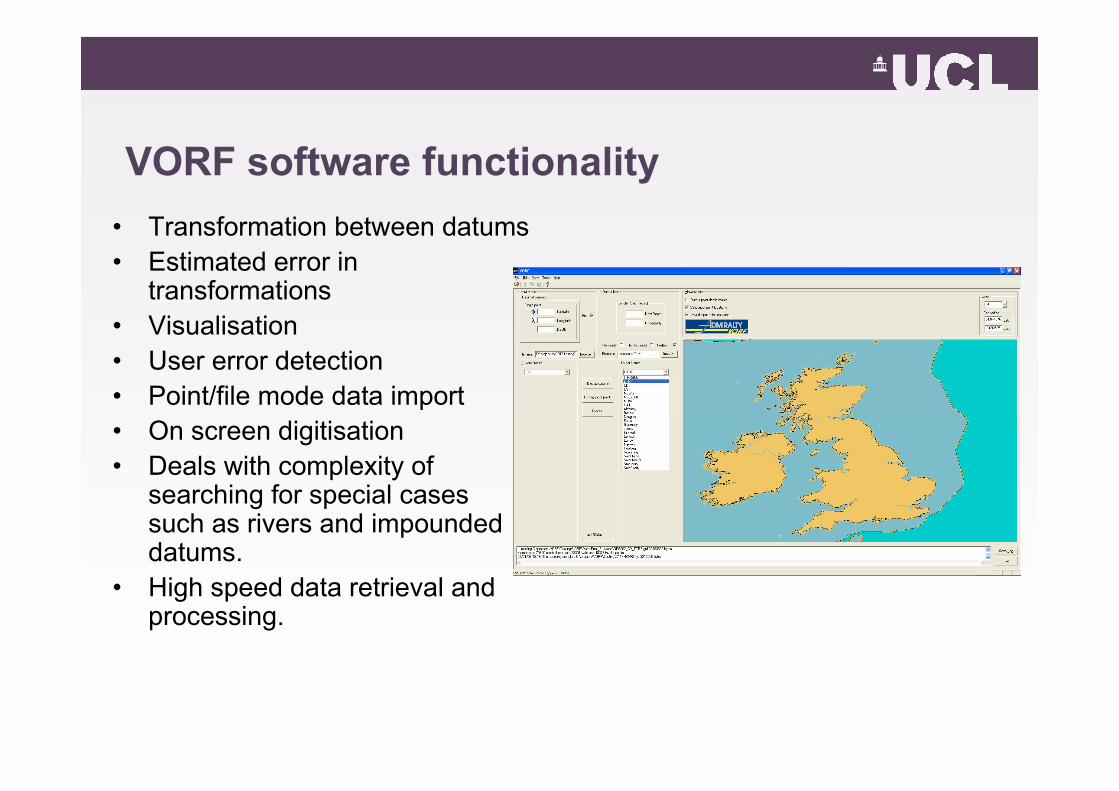
VORF software functionality• Transformation between datums• Estimated error in
transformations• Visualisation• User error detection• Point/file mode data import• On screen digitisation• Deals with complexity of
searching for special cases such as rivers and impounded datums.
• High speed data retrieval and processing.
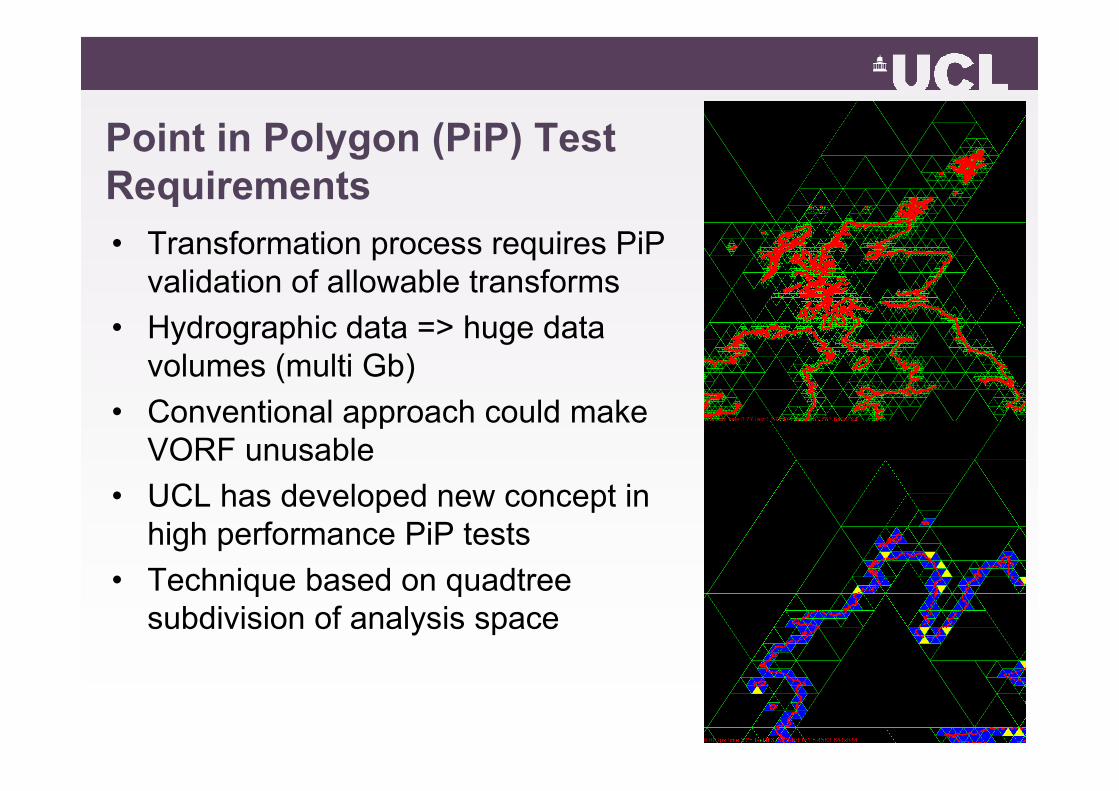
Point in Polygon (PiP) Test Requirements• Transformation process requires PiP
validation of allowable transforms• Hydrographic data => huge data
volumes (multi Gb)• Conventional approach could make
VORF unusable• UCL has developed new concept in
high performance PiP tests• Technique based on quadtree
subdivision of analysis space
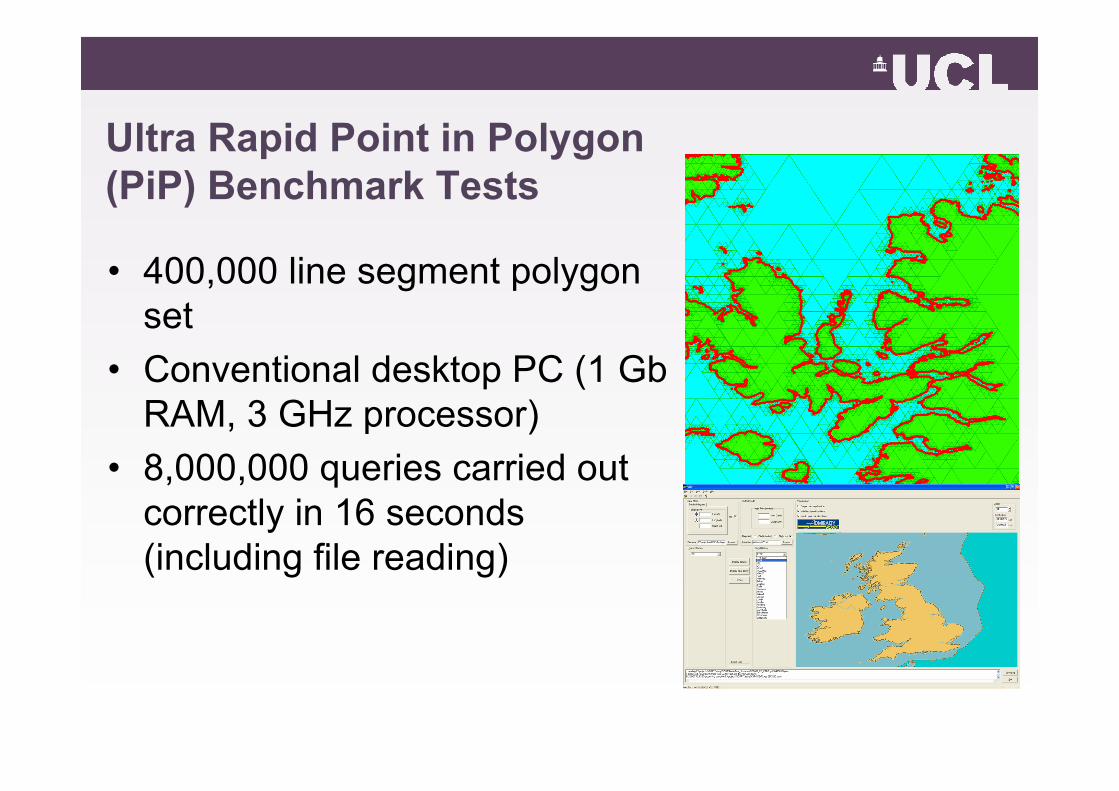
Ultra Rapid Point in Polygon (PiP) Benchmark Tests
• 400,000 line segment polygon set
• Conventional desktop PC (1 GbRAM, 3 GHz processor)
• 8,000,000 queries carried out correctly in 16 seconds (including file reading)
Offshore Height from GPS/GNSS?• For survey applications VORF is ineffective without accurate
ellipsoidal height estimates of the vessel• Conventional DGPS gives low precision height, but:• C-NAV capabilities (height uncertainty ~10 cm)• Long range RTK modelling (height uncertainty <10 cm)• Ordnance Survey OSNet technology• Modernised GPS (better frame definition, more signal
power)• Galileo• Rejuvenated GLONASS• New Chinese GNSS (full constellation by 2008?)• Integrity concepts/time to first alarm => more confidence for
safety critical applications
Applications: Cost and Efficiency of Surveys
• Reduces complexity in survey operations• Enables easier access to a consistent, seamless
datum• Enhances quality control• Reduces costs
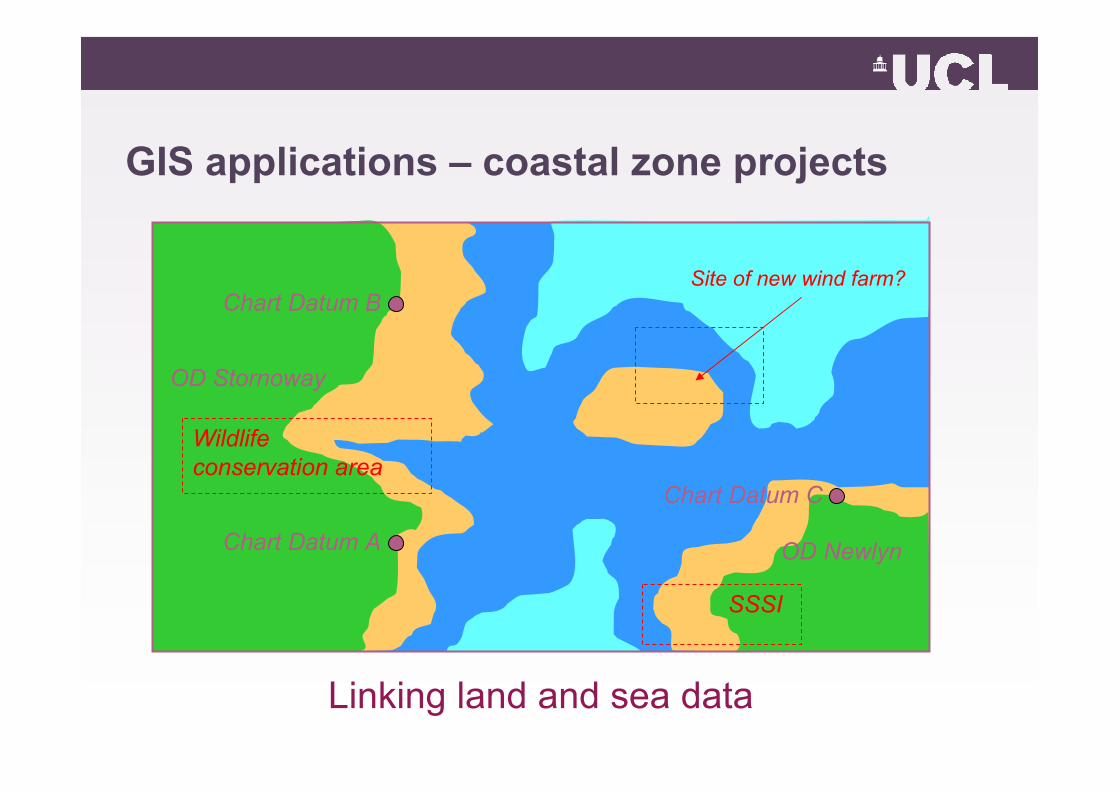
GIS applications – coastal zone projects
Chart Datum A
Chart Datum B
Chart Datum C
OD Newlyn
OD Stornoway
Site of new wind farm?
SSSI
Wildlife conservation area
Linking land and sea data
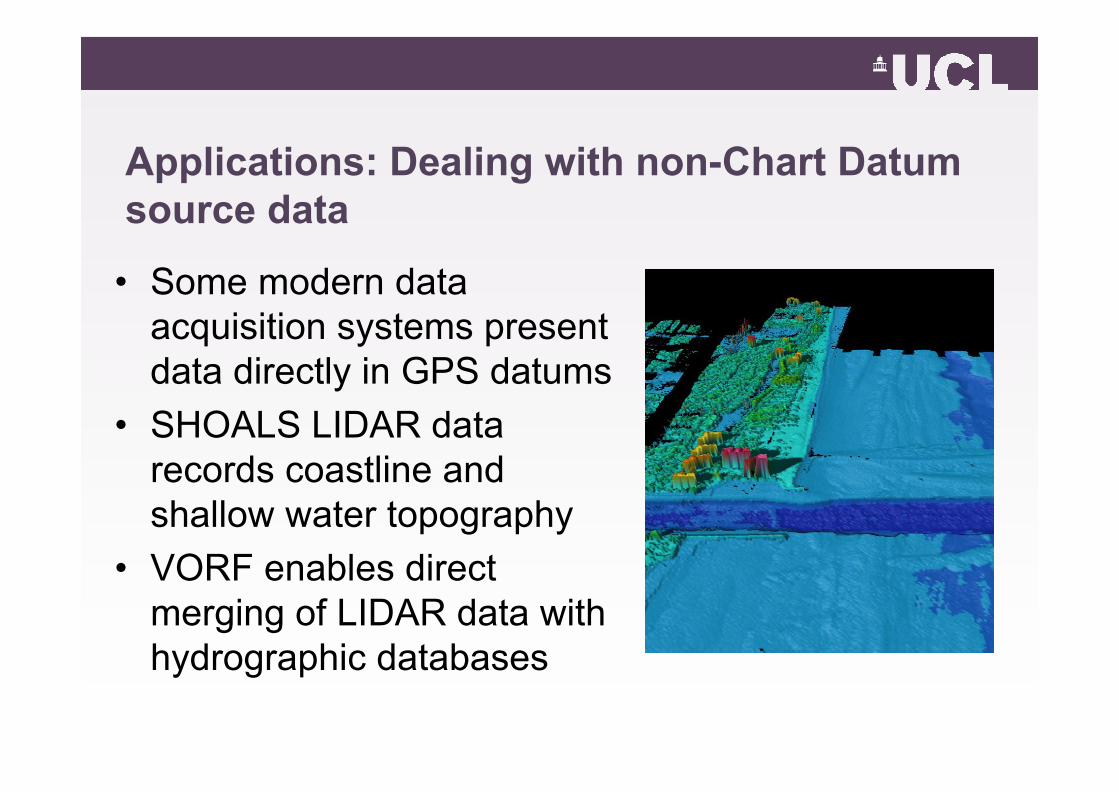
Applications: Dealing with non-Chart Datum source data
• Some modern data acquisition systems present data directly in GPS datums
• SHOALS LIDAR data records coastline and shallow water topography
• VORF enables direct merging of LIDAR data with hydrographic databases
Summary of VORF advantages
• VORF derives continuous surfaces, with fixed reference to ETRF89.
• It provides a consistent interpolation between Chart Datums, and methodology for extrapolation offshore.
• It eliminates some of the reliance on remote or expensive tidal observations.
• It has the potential to be built in to real-time applications. • It fully exploits current and future GNSS technology, and is
the basis for future accuracy enhancements.
Status and initial test results
• Technology demonstrator delivered to UKHO December 2006
• Proof of concept established• Tests of precision, stability, functionality and
performance all complete• Areas of model weakness identified and remedial
actions quantified• Interest shown by GPS receiver manufacturers• Initial sea trials carried out
Accuracy –how well has all this worked so far?
• Tests of interpolating and extrapolating sea level• LAT/Chart Datum comparison• Initial sea trials
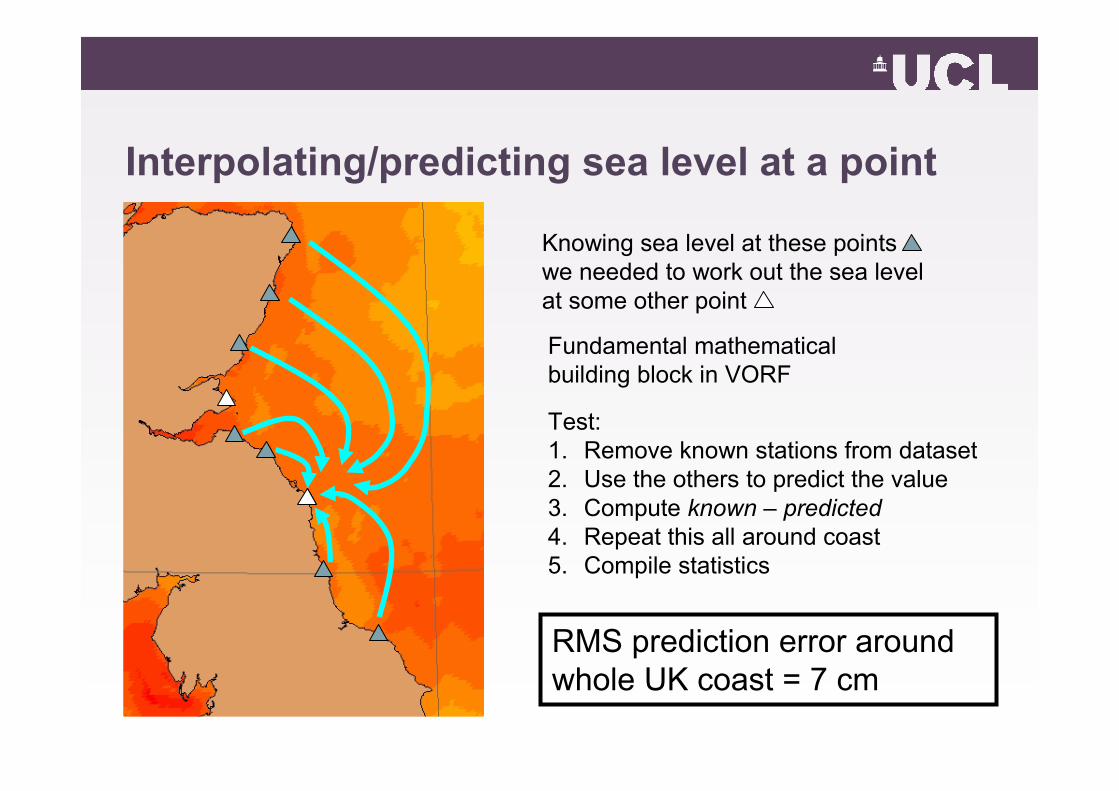
Interpolating/predicting sea level at a point
Knowing sea level at these pointswe needed to work out the sea levelat some other point
Fundamental mathematicalbuilding block in VORF
Test: 1. Remove known stations from dataset2. Use the others to predict the value3. Compute known – predicted4. Repeat this all around coast5. Compile statistics
RMS prediction error around whole UK coast = 7 cm
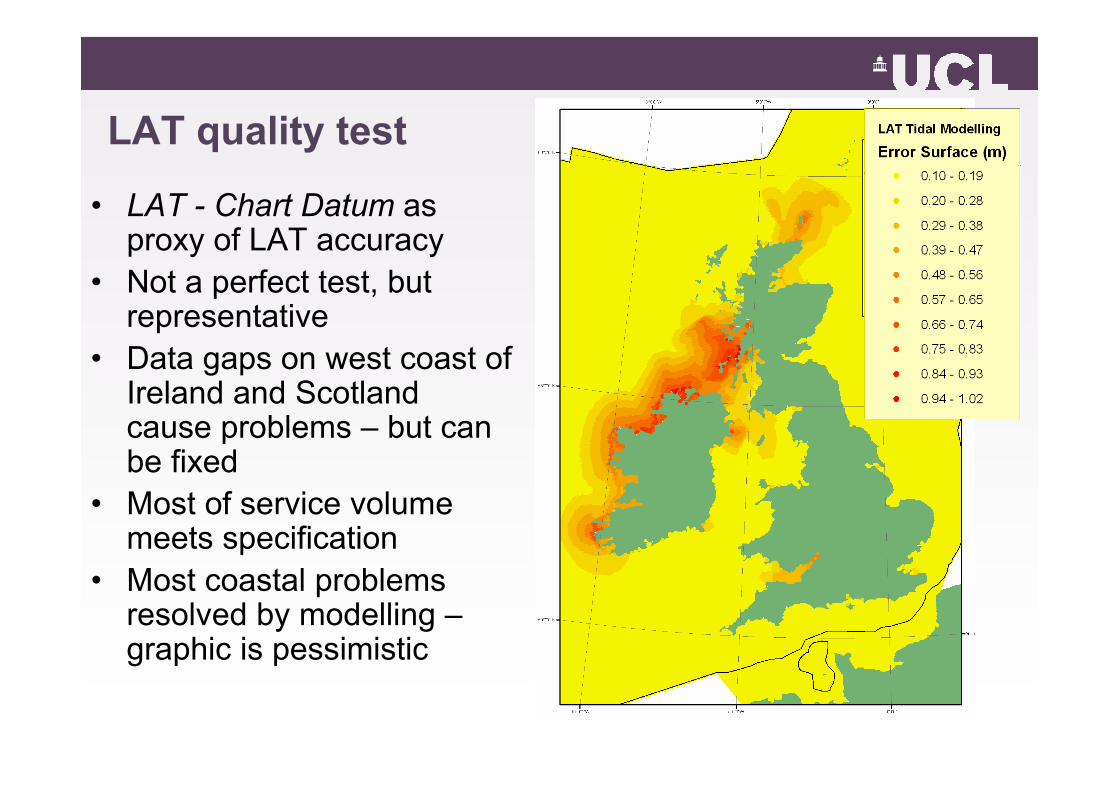
• LAT - Chart Datum as proxy of LAT accuracy
• Not a perfect test, but representative
• Data gaps on west coast of Ireland and Scotland cause problems – but can be fixed
• Most of service volume meets specification
• Most coastal problems resolved by modelling –graphic is pessimistic
LAT quality test
First Sea Trials
• Survey carried out off Thames estuary• Conventional approach used: Tide gauge at coast
and co-tidal charts used to reduce soundings• Soundings also reduced using GPS/VORF• No significant bias between two surveys• RMS scatter in differences ~ 7 to 9 cm• Strong validation of concept
Conclusions• VORF: a research and technology demonstrator –
concept has been proven to work• GNSS navigation and positioning is becoming ubiquitous • VORF links UKHO data and products directly to GNSS
positioning and measurement technologies – and copes with vast data volumes
• VORF is an enabling technology• Surveying without tide gauges – cheaper, faster, more
accurate• Lidar data – transform directly from WGS84 to
CD/Newlyn• Most importantly: VORF joins the land and the sea –
data sets/measurement techniques/services, all can be integrated