Embed Size (px)
Citation preview

16
Journal of the Statistical and Social Inquiry Society of Ireland
Vol. XLV
A Tale of Two Clusters: The Evolution of Ireland’s Economic Complexity
since 1995
Neave O’Clery*
Harvard University
(read before the Society, 19 November 2015)
Abstract This paper characterizes the evolution of the manufacturing and industrial export structure of Ireland
since 1995 within the framework of Economic Complexity and the Product Space. We observe a high level of
specialisation in Ireland’s export structure, coupled with high income per capita as compared to the complexity
level of its industrial activities (as captured by its Economic Complexity Index). We identify a dual structure
within the economy, with domestic and foreign-owned exporters exhibiting distinct characteristics. In the latter
case, we observe a recent consolidation and reduction in complexity level by the foreign-owned high tech
pharmaceuticals and electronics sectors, with limited evidence of spill-overs leading to growth of domestic firms
in these sectors. This contrasts with a dynamic and growing domestic food and agriculture sector, which is well
positioned for continued expansion of Ireland’s indigenous activities into more complex goods. Finally, we
illustrate this framework as a tool for policy-makers by identifying some potential new sectors that share many
inputs with Ireland’s current domestic capability base, and could increase Ireland’s complexity level for future
growth.
Keywords: manufacturing, exports, IrelandJELs: L16, L60, O14
1. WHY DO COUNTRIES GROW?
Building on classical theories which focus on the relative contributions of capital, labour and technology to
economic growth1 2 3 recent work has proposed that countries grow by expanding their knowledge and capability
base, enabling them to diversify into new industries and economic activities.4 5 6 7 The specific capabilities and
inputs available to a country determine the set of ‘nearby’ or likely new industries, and govern its diversification.
While classical trade theory suggests that current industrial make-up has little to no effect on future structure, new
research provides strong signals that the capabilities or skills a country has today affect its industrial path in the
future.8
This work has been supported by the Irish Department of Jobs, Enterprise and Employment. It builds on the framework of
Economic Complexity proposed by Prof Ricardo Hausmann at Harvard University, and Cesar Hidalgo at MIT. It has benefitted
from insightful conversations with multiple people including Adrian Devitt, Conor Hand, Eoin Gahan, Eduardo Lora, Brad
Cunningham, and Luis Espinoza.1 Flam H & Flanders MJ (1991) Heckscher-Ohlin Trade Theory. Cambridge, Mass.: MIT Press2 Romer PM (1990) ‘Endogenous Technological Change’. Journal of Political Economy 98 (5, II): 71–102.3 Aghion P & Howitt P (1992) ‘A Model of Growth Through Creative Destruction’. Econometrica 60 (2): 323–351.4 Hausmann R & Klinger B (2006) Structural transformation and patterns of comparative advantage in the product space.
Inter-American Development Bank.5 Hidalgo CA, Klinger B, Barabasi AL & Hausmann R (2007) ‘The product space conditions the development of nations’.
Science, 317:482-487.6 Hidalgo CA & Hausmann R (2009) ‘The Building Blocks of Economic Complexity’. PNAS 106 (106(26)): 10570–10575.7 Hausmann R & Hidalgo CA (2011) ‘The network structure of economic output’. Journal of Economic Growth, 16(4):309--
342.8 Hausmann R, Hidalgo CA, Stock D & Yildirim M (2014) Implied comparative advantage. Center for International
Development, Harvard University.

17
In order to describe this process, the Economic Complexity framework employs the Product Space,4 5 6 7 a network
that models the process of industrial diversification of an economy. The Product Space is based on the intuitive
idea that a country that exports fabrics is more likely to next export garments than it is to export jet engines.
Metrics derived from the structure of the network, such as the Economic Complexity Index (ECI), which ranks
countries by the knowledge accumulated via production in their economies, have been shown to rival alternative
predictors for industrial growth such as education and quality of institutions.7
This paper characterizes the evolution of the manufacturing and industrial export structure of Ireland since 1995
within the framework of Economic Complexity and the Product Space. We observe a high level of specialisation
in Ireland’s export structure, coupled with high income per capita as compared to the complexity level of its
industrial activities (as captured by its Economic Complexity Index). We identify a dual structure within the
economy, with domestic and foreign-owned exporters exhibiting distinct characteristics. In the latter case, we
observe a recent consolidation and reduction in complexity level by the foreign-owned high tech pharmaceuticals
and electronics sectors, with limited evidence of spill-overs leading to growth of domestic firms in these sectors.
This contrasts with a dynamic and growing domestic food and agriculture sector, which is well positioned for
continued expansion of Ireland’s indigenous activities into more complex goods. Finally, we illustrate this
framework as a tool for policy-makers by identifying some potential new sectors that share many inputs with
Ireland’s current domestic capability base, and could increase Ireland’s complexity level for future growth.
2. CONTEXT: AN ECONOMIC RECOVERY DEPENDANT ON EXPORTS
Ireland is a country in recovery. A domestic housing and construction bubble, fuelled by cheap credit and lax
banking oversight, led Ireland to the edge of the abyss in 2008. As the world suffered a global financial crisis,
Ireland’s banks buckled under massive exposure to real-estate related debt. However, strong fundamentals in
terms of quality and competitiveness, coupled with public support for reforms, have enabled Ireland to embark on
a successful program of economic recovery. Yet, with domestic demand lagging due to low (but improving)
employment figures, Ireland’s recovery in the short term is heavily dependent on the success of its export
activities.9
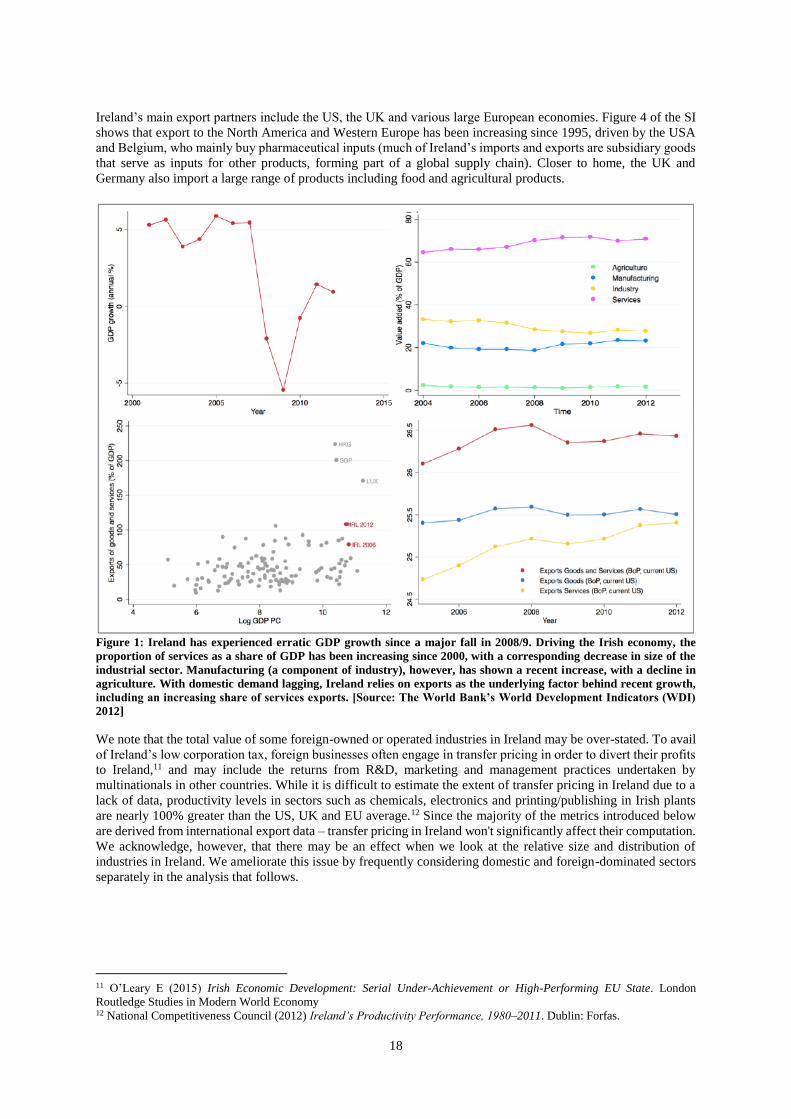
Ireland’s domestic economy is driven mainly by services (constituting over 60% of GDP), with manufacturing a
growing component of an overall declining industrial sector. Figure 1 shows that exports of goods and services
are high (and growing) as compared to other countries with a similar GDP. Goods exports have traditionally been
the dominant factor, but recently services exports – dominated by financial services and IT - have caught up with
(and very recently overtaken) goods exports.
A key component of its growth and industrial strategy, Ireland is a major recipient of net inflows of foreign direct
investment (FDI) compared to other countries at a similar GDP per capita as seen in Figure 1 of the Supplementary
Information (SI), driven by a competitive tax regime and a young, highly educated and skilled labour force. In
fact, in 2011, a small number of sectors dominated by foreign-owned multinational enterprises accounted for one
quarter of total economy-wide gross value added,10 and today Ireland is home to a plethora of international brand
names in high tech, electronics and pharmaceuticals. In contrast, Irelands’ national producers typically focus on
high quality foodstuffs and agricultural products with recent growth in medical devices.
Attracting firms to Ireland, and driving domestic growth, Ireland exhibits extraordinarily high levels of tertiary
education, and high ranking in both overall competitiveness (ranked 25th in the world in 2015) and ease of doing
business (ranked 15th in the world in 2014) as seen in Figure 2 of the SI. In particular, it excels in competitiveness
in areas such as health, education, goods and labour market efficiency and technological readiness/innovation.
This is coupled with excellent performances in financial and administrative areas related to starting and
maintaining a business, including providing access to credit, setting attractive tax rates and protecting investors.
Some challenges remain in practical areas such as electricity and construction permits.
Here we focus on the evolution of Ireland’s exports, both as a important component of Ireland’s growth, and as a
signal of international competitiveness in particular products and industries. The composition of Ireland’s exports
has evolved towards an increasing reliance on pharmaceuticals and chemicals in terms of export share since 1995,
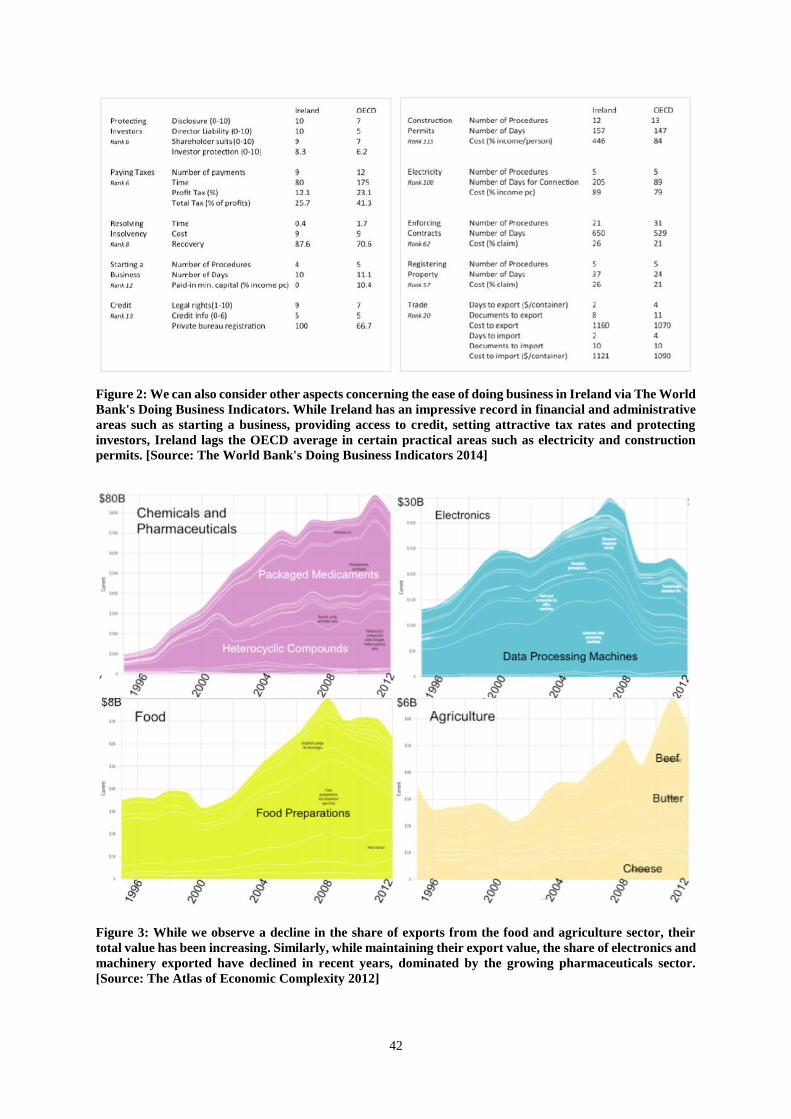
as seen in Figure 2. While we observe a decline in the share of exports from the food and agriculture sector, their
total value has been increasing (see Figure 3 of the SI). Similarly, while maintaining their export value, the share
of electronics and machinery exported has declined in recent years, dominated by the growing pharmaceuticals
sector.
9 Byrne S & O’Brien M (2015) ‘The Changing Nature of Irish Exports: Context, Causes and Consequences’. Irish Central
Bank April Quarterly Bulletin 10 Irish Department of Finance (2014) Economic Impact of the Foreign-owned Sector in Ireland.
18
Ireland’s main export partners include the US, the UK and various large European economies. Figure 4 of the SI
shows that export to the North America and Western Europe has been increasing since 1995, driven by the USA
and Belgium, who mainly buy pharmaceutical inputs (much of Ireland’s imports and exports are subsidiary goods
that serve as inputs for other products, forming part of a global supply chain). Closer to home, the UK and
Germany also import a large range of products including food and agricultural products.
Figure 1: Ireland has experienced erratic GDP growth since a major fall in 2008/9. Driving the Irish economy, the
proportion of services as a share of GDP has been increasing since 2000, with a corresponding decrease in size of the
industrial sector. Manufacturing (a component of industry), however, has shown a recent increase, with a decline in
agriculture. With domestic demand lagging, Ireland relies on exports as the underlying factor behind recent growth,
including an increasing share of services exports. [Source: The World Bank’s World Development Indicators (WDI)
2012]
We note that the total value of some foreign-owned or operated industries in Ireland may be over-stated. To avail
of Ireland’s low corporation tax, foreign businesses often engage in transfer pricing in order to divert their profits
to Ireland,11 and may include the returns from R&D, marketing and management practices undertaken by
multinationals in other countries. While it is difficult to estimate the extent of transfer pricing in Ireland due to a
lack of data, productivity levels in sectors such as chemicals, electronics and printing/publishing in Irish plants
are nearly 100% greater than the US, UK and EU average.12 Since the majority of the metrics introduced below
are derived from international export data – transfer pricing in Ireland won't significantly affect their computation.
We acknowledge, however, that there may be an effect when we look at the relative size and distribution of
industries in Ireland. We ameliorate this issue by frequently considering domestic and foreign-dominated sectors
separately in the analysis that follows.
11 O’Leary E (2015) Irish Economic Development: Serial Under-Achievement or High-Performing EU State. London
Routledge Studies in Modern World Economy 12 National Competitiveness Council (2012) Ireland’s Productivity Performance, 1980–2011. Dublin: Forfas.

19
Figure 2: While Ireland’s export basket has consistently relied on electronics, pharmaceuticals, food and agricultural
produce since 1995, we observe a shift in composition derived from a huge growth in the share pharmaceuticals (and
to a lesser extent medical devices), and a decline in electronics (and to a lesser extent food). [Source: The Atlas of
Economic Complexity]
It must also be emphasised that much of the analysis to follow does not include traditional services industries such
as personal services (e.g. hairdressing) and accounting, or newer services industries that are important for Ireland
such as computer software. While the omission of service exports might have limited implication for the analysis
of under-developed countries (given their industrial structure), it has significant implications for high-tech
economies heavily reliant on services such as Ireland. Nevertheless, since exports are a primary driver of growth
for Ireland, important insights may still be derived from examining the nature and dynamics of goods exports
within the Economic Complexity framework.
3. THE PRODUCT SPACE & ECONOMIC COMPLEXITY:
DOES WHAT A COUNTRY PRODUCES MATTER FOR ITS FUTURE ECONOMIC GROWTH?
Many early texts of development economics argued that externalities or spill-overs created during the process of
industrialisation, as new products were introduced, lead to increased economic growth.13 14 15 However, more
recent theories focus instead on the relative contributions of core productive factors such as capital, labour, human
capital and institutions1 and technological differences of Romer2, Aghion and Howitt.3
In the first case, poor countries tend to specialize in goods that rely mainly on labour and land, while richer
countries focus on producing goods that use more human and physical capital and demand better institutions.
Under the second technological differences theory, countries continually move into slightly more advanced
products. In both cases particular products are ignored, or abstracted. But is there truly no product-specific pattern
or path dependence inherent in the process of industrial diversification and growth?
13 Rosenstein-Rodan P (1943) ‘Problems of Industrialization of Eastern and South Eastern Europe’. Economic Journal 53:
202–211. 14 Hirschman A (1958) The Strategy of Economic Development. New Haven, Conn.: Yale University Press 15 Matsuyama K (1992) ‘Agricultural Productivity, Comparative Advantage, and Economic Growth’. Journal of Economic
Theory 58 (December): 317–334
20
An alternative perspective4,5,6,7 focuses on the mechanisms by which the diffusion of capabilities spurs
diversification and generates growth. Under this framework, 'capabilities' are typically thought of as skills,16
know-how or tacit knowledge, but can also include physical inputs, and other localised attributes such as
institutions, culture and natural amenities. It is hypothesised that countries grow as they acquire new capabilities,
and learn to combine these capabilities to make increasingly sophisticated products requiring many
complementary skills and inputs
Employing a simple analogy, we consider skills as letters in a game of scrabble. The more letters - or capabilities
- a country has, the greater the number of words, or industries, that the country can build, and the longer and more
sophisticated the words become. Critically, these new industries will be very similar to the old ones in their
production needs as economies exploit existing capabilities to move into new economic activities requiring similar
inputs. Hence, this perspective sees industrialisation as a path dependent process, whereby the appearance of new
industries is conditional on the presence of relevant capabilities, often in the form of similar industries.
The Product Space4,5,6,7, as seen in Figure 3, is a network that models this process of industrial diversification,
where nodes represent products (or industries) that are connected based on how similar their the capability
requirements are. In practice, the similarity or edge weight between two nodes is estimated using a measure of co-
export – i.e., a pair of products is connected by an edge if they are exported by a similar set of countries. The logic
behind this approximation is that if a pair of products is co-exported by a large subset of countries, then these
products must require a similar capability base.17 This approach is related to the classical theories of Marshall18,
Porter19 and more recent work of Glaeser et al.20 who study the drivers of co-location of industries.
The Product Space network is highly heterogeneous. Some regions in the network are tightly connected, implying
that neighbouring products use a similar set of capabilities. Countries exporting or producing products in these
regions will find it relatively easy to diversify their export basket since they already have most of the capabilities
required by many nearby products. On the other hand, countries that have products which are located in sparsely
connected regions of the Product Space will find it more difficult to diversify since many new capabilities will be
needed to ‘jump’ longer distances. The Product Space structure has been shown to be a successful predictor of the
appearances of new industries, and the growth of existing industries, in terms of global export patterns8.
This view of growth through industrial diversification remains the focal point of much debate. Traditional
economic theory held that specialization is needed for efficiency reasons. For example, the Ricardian trade model
suggests that countries should focus on their strengths, and engage in international trade to acquire goods for
which they do not exhibit comparative advantage.21 In contrast, more recently others have argued that
diversification is a much more importance source of productivity growth, protecting against shocks and terms of
trade erosion due to declining commodity prices.22 There remains much debate surrounding the nature of observed
diversification (or specialisation), the theoretical foundations of such dynamics, and the optimal path for
developing countries.
16 Hanushek EA & Woessmann L (2008) ‘The Role of Cognitive Skills in Economic Development’. Journal of Economic
Literature, 46(3): 607-68 17 We estimate this co-location measure using international trade data (UN Comtrade data provided by CEPII) from the
Harmonized Commodity Description and Coding System for 129 countries and 1240 product classes – technical details are to
be found in the Appendix. 18 Marshall A (1890) Principles of Economics. London: Macmillan. 19 Porter ME (1998) ‘Clusters and the New Economics of Competition.’ Harvard Business Review, November–December: 77–
90. 20 Ellison G, Glaeser E & Kerr W (2010) ‘What Causes Industry Agglomeration? Evidence from Coagglomeration Patterns’.
American Economic Review, 100(3): 1195-1213. 21 Ricardo D (1971) On the Principles of Political Economy, and Taxation. Harmondsworth: Penguin Books 22 Kaulich F (2012) ‘Diversification vs. specialization as alternative strategies for economic development: Can we settle a
debate by looking at the empirical evidence?’ United Nations Industrial Development Organization, Development Policy,
Statistics and Research Branch Working Paper 3/2012.

21
Figure 3: The Product Space is a network that describes the process of industrial diversification via the
acquisition of capabilities. Nodes, or industries, are connected via edges representing the similarity between
the capabilities needed to develop each industry. Research has shown that countries grow by diversifying
into nearby industries requiring similar inputs in a path dependant manner. Hence, countries with existing
industries in the interior of the network, represented by densely connected nodes, have increased
opportunity for diversification – they have more possibilities to jump into nearby industries requiring
similar capabilities. We observe that industries with similar inputs cluster together, such as the green
textiles cluster seen on the far right hand size. [Source: The Atlas of Economic Complexity]
For example, Imbs and Wacziarg23 employed empirical analysis to show that countries tend to diversify, followed
by a period of specialisation after a sufficient level of wealth is reached (around 9,000 1985 US dollars per capita).
Others disagree, arguing that re-specialisation is difficult to conclusively identify in the data – largely due to
measurement difficulty.24 The debate is more intense, however, surrounding the question of whether
diversification, and subsequent re-specialisation, has a positive impact on economic growth. In the former case,
there is some consensus: diversification is correlated with economic growth for developing countries22. However,
on the question of specialisation economists are more divided22,23,4,5,6.
From these questions, a more nuanced theory has emerged4,5,6,7, holding that it is not the number of products which
a country exports that is the key: it is the type or sophistication of those products. Highly developed countries
export more complex products: those requiring rare capabilities and inputs possessed by only a handful of
technologically advanced economies. The Product Complexity Index (PCI), a quantitative measure of product
sophistication, is a metric derived from the structure of the Product Space. It is calculated by computing the
average diversity of countries that make a specific product, and the average ubiquity of the other products that
these countries make – see Supplementary Information for a technical definition.
23 Imbs J & Wacziarg R (2003) ‘Stages of Diversification’. American Economic Review, vol. 93, no. 1, pp. 63-86. 24 De Benedictis L, Gallegati M & Tamberi M (2007) ‘Overall Specialization and Income: Countries Diversify’. Working
paper 73, University of Rome La Sapienza, CIDEI.
22
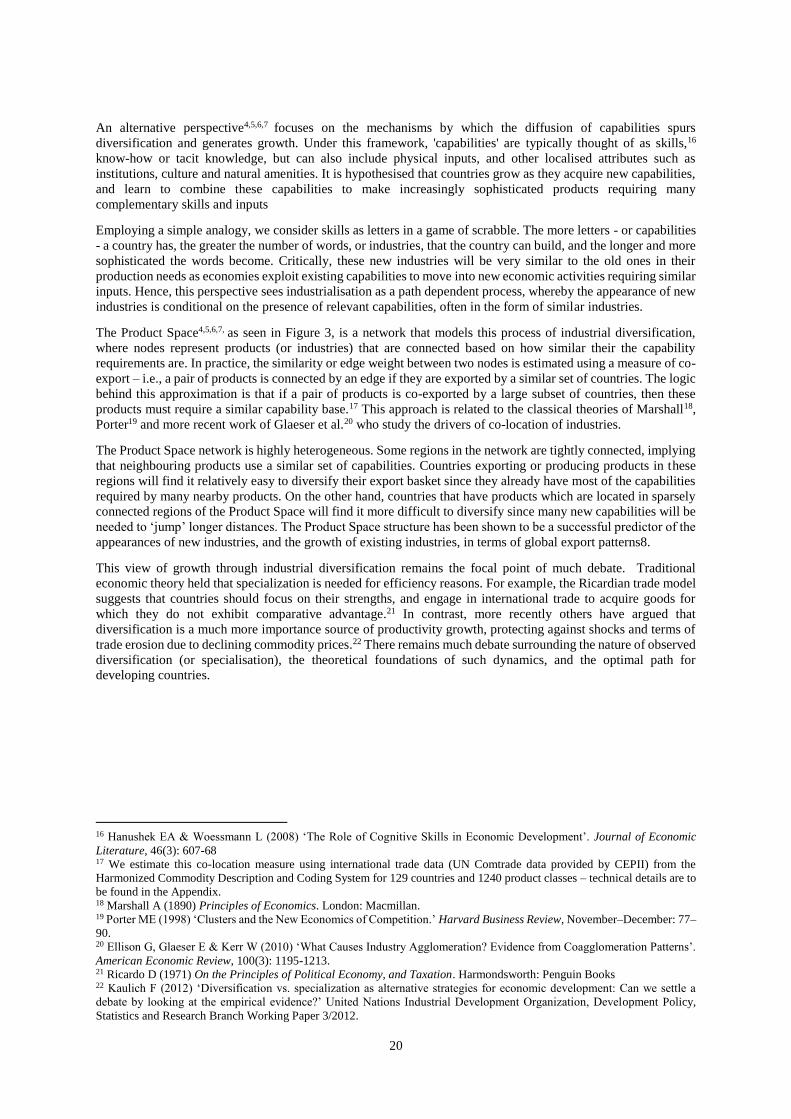
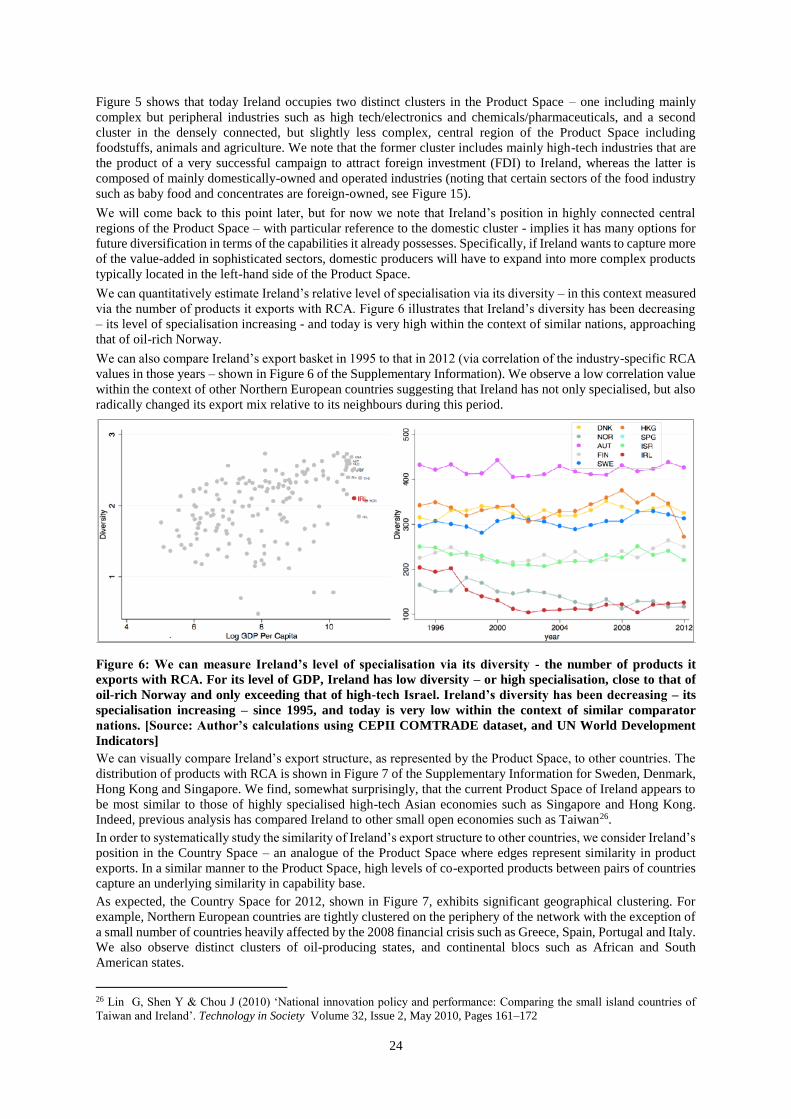
Figure 4: Ireland’s export basket has been shrinking since 1995, when it exported a wide range of products
including some textiles, metals, printed materials and peat and cement. Today Ireland resides in two
distinct clusters of the product space, with electronics and pharmaceuticals clustering together on the left
periphery – and food and agricultural products residing in a cluster on the centre right. Note: nodes or
products are coloured if Ireland exports the product with Revealed Comparative Advantage. [Source: The
Atlas of Economic Complexity, with artistic and text overlays by Author]
Figure 3, and Figure 5 of the SI, shows that the least complex products (such as primary agriculture and
commodities) typically inhabit the right hand side – especially the right-hand periphery - of the Product Space,
while more complex products (such as chemicals and electronics) typically inhabit densely connected central
regions of the left hand side of the Product Space. Less developed countries typically diversify and grow by
expanding their export base from the centre/right region towards the more complex left hand side5.
We can also derive a metric for the composite sophistication or complexity level of a country’s export basket. A
country is considered complex if it produces a wide range of products, including many complex products that
require rare inputs that only few countries possess. The Economic Complexity Index (ECI)6 of a country is a
measure of the complexity of its industrial structure, and is driven by aggregate PCI of the products it exports –
see Supplementary Information for a mathematical definition.
It has been shown that the residual derived from the relationship between GDP per capita and ECI is highly
predictive of economic growth6. In other words, countries with low levels of GDP relative to others at a similar
complexity level are in some sense under-utilising their capability base and tend to grow faster in the future.
Conversely, countries that exhibit high levels of GDP compared to other countries at a similar complexity level
(perhaps, for example, due to natural resource wealth) do not have a broad capability base, and tend to exhibit
lower levels of future growth. The fact that this residual is highly predictive of economic growth – even more so
than traditional indicators measuring school and institutional quality – has led to arguments that ECI is an
important measure of economic well-being or potential.6

23
Figure 5: We have seen that, over the last decade, Ireland has specialised. In 2012 Ireland occupied two distinct
regions of the Product Space – including a cluster of high complexity mainly foreign-owned chemical,
pharmaceutical (pink) and electrical products (blue) on the left-hand periphery and a separate cluster of mainly
domestic food and agricultural (yellow/orange/red nodes) industries on the centre-right. The presence of
domestic industries in highly connected central regions of the Product Spaces implies that Irish firms have many
options for diversification in terms of the capabilities they already possess. In contrast, the peripheral nature of
some of the foreign-owned industries implies that spill-overs may be limited due to their highly specialised nature
- coupled with very high entry costs. [Source: The Atlas of Economic Complexity, with artistic and text overlays
by Author]
4. EXPORT DIVERSITY AND COMPLEXITY IN IRELAND
Under the assumption that industrial diversification occurs via the acquisition of new capabilities, by locating the
products which Ireland is able to make in the Product Space, we can examine how the productive structure of the
Irish economy evolved over time. Later, we can also employ the Product Space to identify potential new industries
by locating complex industries (nodes) at short distance from the Ireland’s current export basket.
We measure the ‘presence’ of products in the Product Space by determining if they are exported with Revealed
Comparative Advantage (RCA). A product is exported with RCA when the relative share of a country’s exports
in the product exceeds the global share of exports in that product. For example, if apples compose 10% of Irelands
export basket, but just 2% of global exports, then Ireland would have an RCA factor of 5. If Ireland exports any
product with RCA factor>1, we say that Ireland exports that product with RCA.
Over the past decade Ireland’s coverage of the Product Space, in terms of the number of products exported with
RCA, has been shrinking. Figure 4 shows that in 1995 Ireland exported a wide range of products including some
textiles, metals, printed materials and peat and cement. However, since then Ireland has specialised, exporting
fewer and fewer products with RCA (a list of products exported in 2012 with RCA is provided in Tables 1-3 of
the Supplementary Information). This behaviour contrasts to that typically observed for less developed countries
that diversify in the Product Space as they grow, and more developed countries which tend to be highly
diversified25 . The observed consolidation and specialisation for Ireland is supported by analysis by other authors9,
and in contrast to a global trend.
25 Bahar D, Hausmann R & Hidalgo CA (2012) ‘International Knowledge Diffusion and the Comparative Advantage of
Nations’ Center for International Development, Harvard University.
24
Figure 5 shows that today Ireland occupies two distinct clusters in the Product Space – one including mainly
complex but peripheral industries such as high tech/electronics and chemicals/pharmaceuticals, and a second
cluster in the densely connected, but slightly less complex, central region of the Product Space including
foodstuffs, animals and agriculture. We note that the former cluster includes mainly high-tech industries that are
the product of a very successful campaign to attract foreign investment (FDI) to Ireland, whereas the latter is
composed of mainly domestically-owned and operated industries (noting that certain sectors of the food industry
such as baby food and concentrates are foreign-owned, see Figure 15).
We will come back to this point later, but for now we note that Ireland’s position in highly connected central
regions of the Product Space – with particular reference to the domestic cluster - implies it has many options for
future diversification in terms of the capabilities it already possesses. Specifically, if Ireland wants to capture more
of the value-added in sophisticated sectors, domestic producers will have to expand into more complex products
typically located in the left-hand side of the Product Space.
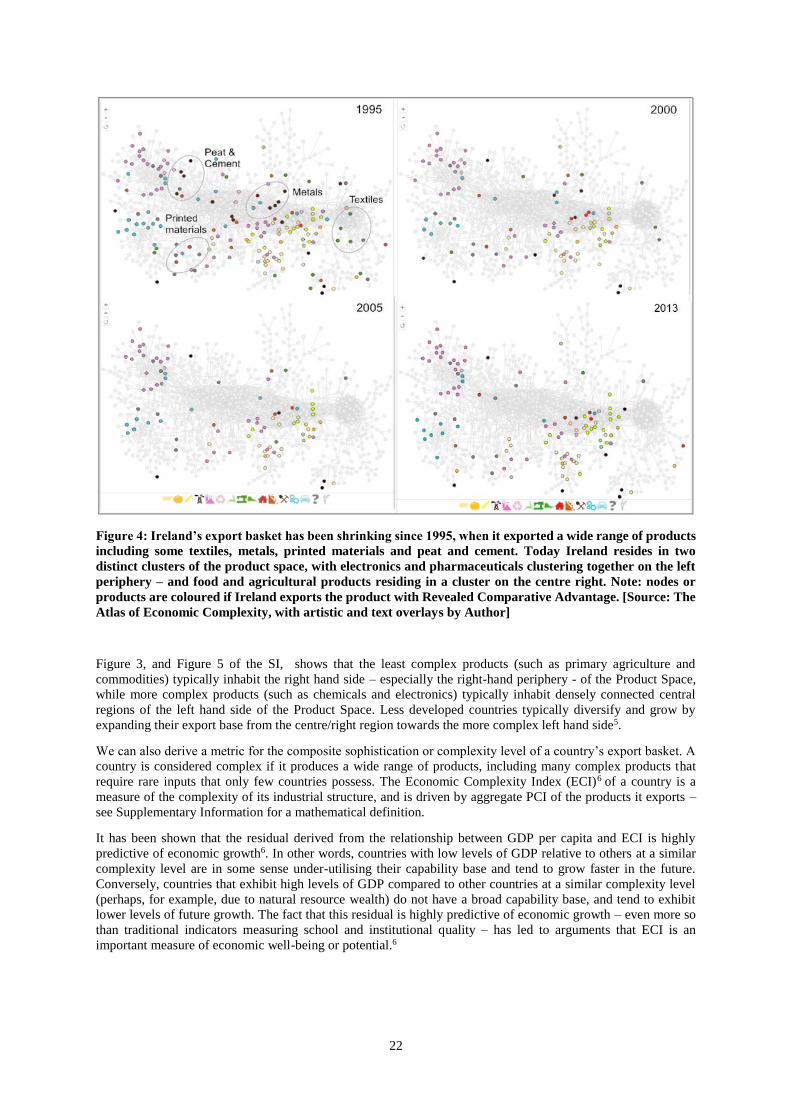
We can quantitatively estimate Ireland’s relative level of specialisation via its diversity – in this context measured
via the number of products it exports with RCA. Figure 6 illustrates that Ireland’s diversity has been decreasing
– its level of specialisation increasing - and today is very high within the context of similar nations, approaching
that of oil-rich Norway.
We can also compare Ireland’s export basket in 1995 to that in 2012 (via correlation of the industry-specific RCA
values in those years – shown in Figure 6 of the Supplementary Information). We observe a low correlation value
within the context of other Northern European countries suggesting that Ireland has not only specialised, but also
radically changed its export mix relative to its neighbours during this period.
Figure 6: We can measure Ireland’s level of specialisation via its diversity - the number of products it
exports with RCA. For its level of GDP, Ireland has low diversity – or high specialisation, close to that of
oil-rich Norway and only exceeding that of high-tech Israel. Ireland’s diversity has been decreasing – its
specialisation increasing – since 1995, and today is very low within the context of similar comparator
nations. [Source: Author’s calculations using CEPII COMTRADE dataset, and UN World Development
Indicators]
We can visually compare Ireland’s export structure, as represented by the Product Space, to other countries. The
distribution of products with RCA is shown in Figure 7 of the Supplementary Information for Sweden, Denmark,
Hong Kong and Singapore. We find, somewhat surprisingly, that the current Product Space of Ireland appears to
be most similar to those of highly specialised high-tech Asian economies such as Singapore and Hong Kong.
Indeed, previous analysis has compared Ireland to other small open economies such as Taiwan26.
In order to systematically study the similarity of Ireland’s export structure to other countries, we consider Ireland’s
position in the Country Space – an analogue of the Product Space where edges represent similarity in product
exports. In a similar manner to the Product Space, high levels of co-exported products between pairs of countries
capture an underlying similarity in capability base.
As expected, the Country Space for 2012, shown in Figure 7, exhibits significant geographical clustering. For
example, Northern European countries are tightly clustered on the periphery of the network with the exception of
a small number of countries heavily affected by the 2008 financial crisis such as Greece, Spain, Portugal and Italy.
We also observe distinct clusters of oil-producing states, and continental blocs such as African and South
American states.
26 Lin G, Shen Y & Chou J (2010) ‘National innovation policy and performance: Comparing the small island countries of
Taiwan and Ireland’. Technology in Society Volume 32, Issue 2, May 2010, Pages 161–172

25
Ireland is nestled between other Northern European and similar wealthy nations on the periphery of the network.
When we compare Ireland’s position in 1995 and 2012, we observe that Ireland has migrated from its position
between the Scandinavian nations and Canada, and the Eastern European bloc, to be close to countries reliant on
high tech exports such as Japan, Singapore and South Korea – mirroring Ireland’s transformation in the Product
Space during this period. We note that Ireland is simultaneously be similar to both Northern European countries
and high-tech Asian economics based on overlapping export baskets for different product groups.

26
Figure 7: Analogous to the Product Space, we can derive a Country Space for which nodes, or countries,
are connected via edges that represent the similarity in underlying capability structure. As with the Product
Space, we estimate this similarity by measuring the extent to which pairs co-export the same products. Here
we show the Country Space in 1995 (top) and 2012 (bottom) with nodes sized by GDP per capita, and
coloured by geographical region. We observe heavy geographical clustering – for example, Northern
European countries are tightly clustered on the periphery of the network with the exception of a small
number of countries heavily affected by the 2008 financial crisis such as Greece, Spain, Portugal and Italy
which are disconnected from the main Northern European bloc. In 1995, Ireland was positioned between
the Scandinavian nations and Canada, and the Eastern European bloc. However, in 2012 Ireland had
migrated to be more similar to countries reliant on high tech exports such as Japan, Singapore and South
Korea. [Source: Author’s calculations using CEPII 2012 COMTRADE data, and WDI 2012]
Figure 8: Ireland’s ECI is high relative to other countries with comparable per capita GDP (red), and even
more so excluding chemical industries (green), or excluding both chemical and electrical industries (dark
grey). Over time, we also see an increasing negative residual, implying that Ireland’s GDP per capita is
increasingly very high as compared to its underlying capability base. Furthermore, relative to similar
countries (bottom left) and the most complex countries (bottom right), Ireland exhibits a declining
complexity rank. [Source: Author’s calculations using CEPII COMTRADE dataset, and UN World
Development Indicators]

27
Finally, we consider Ireland’s overall complexity level within the context of its wealth, and dual Product Space
structure observed above. Figure 8 shows that Ireland’s GDP per capita relative to other countries with comparable
ECI is high in both 1995 and 2012, suggesting limited growth potential at the current complexity level - or possibly
even predicts a contraction5.
Given that a cluster of industries, namely chemicals, pharmaceuticals and electronics are mainly foreign-owned,
and hence are not fully integrated into Ireland’s capability base (this point is discussed and explored extensively
below), we also show the ECI excluding these products from the complexity calculation. In this case, we observe
an increasing negative residual, further confirming that Ireland exhibits high wealth compared to its observable
capability base, and diversity, as captured by exports. We also note that this result is robust when using GNP
rather than GDP (see Figure 8 of the Supplementary Information). As GDP is heavily influenced by foreign
earnings from Irish output, GNP is often cited as a more reliable measure of the income of residents.
However, it is prudent to note again that services – particularly tradable services which tend to perform better in
terms of growth potential27 - are not included in this analysis, and which may be a source of increased complexity
unseen here.
Relative to similar countries (bottom left of Figure 8) and the most complex countries (bottom right of Figure 8),
Ireland exhibits declining complexity rank (we consider ranks rather than levels when comparing complexity
across time). This indicates that Ireland either is losing high complexity products, or it is gaining low complexity
products - or a combination of these factors.
We have seen that Ireland has exhibited intense export specialisation, and a decline in aggregate complexity level,
over the past two decades, cumulating in a dual structure in the Product Space most similar to a handful of high
tech Asian economies in terms of export basket. We will explore these dynamics further when we look at the
evolution of product exports and complexity over time below.
5. INDUSTRY APPEARANCES AND DISAPPEARANCES: WHAT HAS BEEN DRIVING THE
OBSERVED RECENT DECREASE IN COMPLEXITY FOR IRELAND?
We have previously observed that Ireland has experienced a period of intense specialisation over the past two
decades. Globally, however, we observe that most highly complex countries are highly diversified. In fact, while
complex countries tend to make a range of products including rare products, less complex countries tend to make
ubiquitous products, i.e., those made by a wide range of countries. Has Ireland, in some sense, over-specialised
leading to an increased exposure to external risks, and limitations in future growth due to a contracting capability
base? By considering the past evolution and future potential of Ireland, in terms of both complexity level and
position in the Product Space, we can begin to address this question.
We have seen that Ireland has been experiencing a decline in the number of industries it participates in with a
Revealed Comparative Advantage, and overall or aggregate complexity level. We first group products into sectors
at Harmonized System (HS) 2-digit sector level, and analyse product presences, appearances and disappearances
since 1995.
Figure 9: Here we consider the evolution of sectors (ordered in terms of mean product complexity) in terms
of the number of products exported with RCA. We observe that the most complex sectors, such as chemicals
and electrical products, have been declining since 1995 in both the number of products exported with RCA,
and the share of products in the sector exported with RCA. On the other hand, lower complexity sectors
such as foodstuffs, animals and agriculture have shown an increase in the number of products exported
with RCA since 2005. [Source: Author’s calculations using CEPII COMTRADE dataset]
27 Aghion P, Boulanger J & Cohen E (2011) Rethinking Industrial Policy. Bruegel Policy Brief

28
Figure 10: Most sectors have seen a declining number of appearances over time, with vegetables showing a
significant increase during the period 2001-2005. Conversely, most sectors have seen an increase in
disappearances over time, particularly in the chemical and electrical industries, with the exception of some
lower complexity sectors such as vegetables and minerals. In many cases the net appearances of new
industries was positive during the period 1995-2000, yet turned negative in later years. There was high
entry and exit of many sectors, with increasing churn in high complexity sectors such as stone/glass, plastics,
chemicals and machinery/electrical. [Source: Author’s calculations using CEPII COMTRADE 2012 data]
Figure 9 shows that most complex sectors, such as chemicals and electrical products, have been declining since
1995 in both the number of products exported with RCA, and the share of products in the sector exported with
RCA. On the other hand, lower complexity sectors such as foodstuffs, animals and agriculture have shown an
increase in the number of products exported with RCA since 2005. Hence, it is clear that a combination of a
decrease in high complexity products, and an increase in low complexity products, has driven the decrease in
overall complexity (the ECI) as previously observed.
Considering appearances and disappearances in more detail, as seen in Figure 10, we observe that:
• While most sectors have seen a declining number of appearances since 1995, vegetables, metals and
minerals have seen a modest increase in recent years.
• Almost all sectors have seen an increase in the number of disappearances in recent years, in
particular chemicals and electronics. Similarly, in contrast, vegetables and minerals have seen a
decline in disappearances.
• We see a negative net number of appearances (i.e., net disappearances) for all sectors for the most
recent time-period, with greatest net negative appearances in chemicals, stone/glass and textiles.
• The churn (number of appearances and disappearances) has been high for
chemicals/pharmaceuticals, textiles and machinery (driven by disappearances). However, churn is
lower for animals and food, and declining for vegetables, minerals and wood.
29
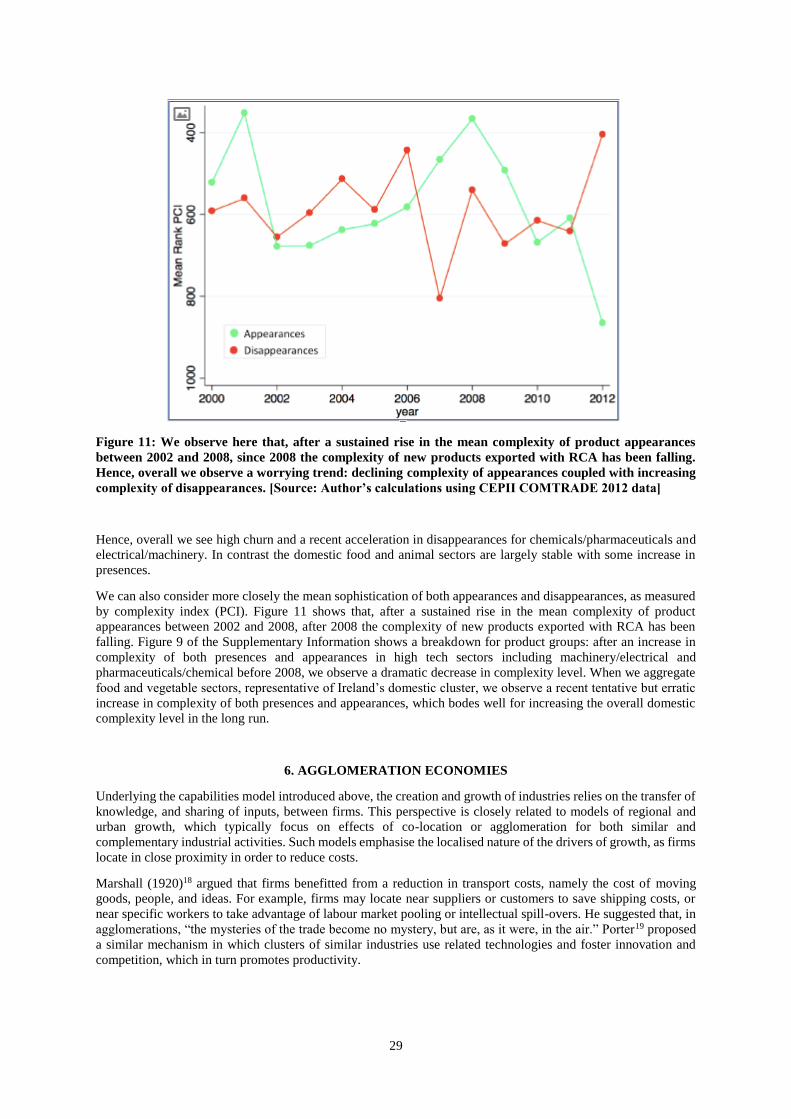
Figure 11: We observe here that, after a sustained rise in the mean complexity of product appearances
between 2002 and 2008, since 2008 the complexity of new products exported with RCA has been falling.
Hence, overall we observe a worrying trend: declining complexity of appearances coupled with increasing
complexity of disappearances. [Source: Author’s calculations using CEPII COMTRADE 2012 data]
Hence, overall we see high churn and a recent acceleration in disappearances for chemicals/pharmaceuticals and
electrical/machinery. In contrast the domestic food and animal sectors are largely stable with some increase in
presences.
We can also consider more closely the mean sophistication of both appearances and disappearances, as measured
by complexity index (PCI). Figure 11 shows that, after a sustained rise in the mean complexity of product
appearances between 2002 and 2008, after 2008 the complexity of new products exported with RCA has been
falling. Figure 9 of the Supplementary Information shows a breakdown for product groups: after an increase in
complexity of both presences and appearances in high tech sectors including machinery/electrical and
pharmaceuticals/chemical before 2008, we observe a dramatic decrease in complexity level. When we aggregate
food and vegetable sectors, representative of Ireland’s domestic cluster, we observe a recent tentative but erratic
increase in complexity of both presences and appearances, which bodes well for increasing the overall domestic
complexity level in the long run.
6. AGGLOMERATION ECONOMIES
Underlying the capabilities model introduced above, the creation and growth of industries relies on the transfer of
knowledge, and sharing of inputs, between firms. This perspective is closely related to models of regional and
urban growth, which typically focus on effects of co-location or agglomeration for both similar and
complementary industrial activities. Such models emphasise the localised nature of the drivers of growth, as firms
locate in close proximity in order to reduce costs.
Marshall (1920)18 argued that firms benefitted from a reduction in transport costs, namely the cost of moving
goods, people, and ideas. For example, firms may locate near suppliers or customers to save shipping costs, or
near specific workers to take advantage of labour market pooling or intellectual spill-overs. He suggested that, in
agglomerations, “the mysteries of the trade become no mystery, but are, as it were, in the air.” Porter19 proposed
a similar mechanism in which clusters of similar industries use related technologies and foster innovation and
competition, which in turn promotes productivity.

30
The role of foreign-owned and operated firms is important within the context of the Product Space framework as
the dynamics of industrial diversification, under the assumption that it is based on the percolation of capabilities
within an economy which may be significantly altered by FDI as new knowledge, skills and inputs are ‘parachuted
in’ leading to varied – potentially positive or negative - effects. Aside from the well-publicised risks of heavy
reliance on FDI including issues such as plant relocation, patent expiry etc.28, the key implication here is that a
variety of mechanisms could result in limited benefit or knowledge spillover to the local economy in terms of the
appearance of similar or related domestic industry.
For example, large number of inputs and capabilities critical to foreign-owned operations – and in particular large
multi-nationals operating a highly complex global supply chain – are sourced internationally (through a variety
of channels). Hence, while local workforces benefit from such experience, the fact that just a subset of the highly
technical inputs needed are sourced locally may mean that these newly acquired capabilities have a more limited
impact in terms of the growth of similar industries. Conversely, external inputs such as FDI could have the
opposite effect when injected into industries close to the current capability structure – complementing and
amplifying existing strengths thus promoting and accelerating growth into nearby products.
Here we consider the evidence for such spill-overs within the Irish economy within the Economic Complexity
framework, and ask if its diversification over time is well-described by the Product Space model. But first, we
look for further evidence of a dual economy – composed of domestic and foreign producers exhibiting distinct
characteristics as seen previously via our Product Space clusters – in firm-level data.
If we consider the set of all manufacturing firms (not restricted to exporters) captured by Ireland’s Central
Statistics Office Census of Industrial Production, we observe almost complete dominance of foreign firms across
the board – in terms of the number of firms, employees and annual turnover - with the exception of the food and
agriculture sector. Specifically, Figure 12 shows that:
1. Chemicals/pharmaceuticals: Foreign firms are dominant in terms of number of enterprises, number of
employees (by a factor of 5) and annual turnover (by a factor of 20) for the chemical and pharmaceutical
sectors.
2. Electronics/computers: While Ireland has approximately twice as many domestic firms as compared to
foreign-owned firms in electronics/computers, foreign firms dominate in terms of employees (by a factor
of 4) and turnover (by a factor of 21).
3. Manufacturing: Similarly for ‘other manufacturing’, foreign firms dominate in terms of employees (by
a factor of 15) and turnover (by a factor of 38).
4. Food: Somewhat surprisingly, while Ireland has a greater number of firms (570 Irish firms compared to
37 foreign firms) and employees, foreign firms have larger turnover than domestically-owned firms ($US
14m compared to $US 12 for Irish firms) in the food sector.
28 McKinsey & Co. (2014) Capturing the value of Ireland’s global connections

31
Figure 12: We observe broad-based dominance of foreign-owned manufacturing firms over Irish
manufacturing firms for various key sectors (NACE 2-digit sectors) in 2012. In particular, we can see that
foreign firms are dominant in terms of number of enterprises, number of employees and annual turnover
for the chemical and pharmaceutical sectors. While Ireland has a significant number of firms in
electronics/computers and other manufacturing, foreign firms dominate in terms of employees and
turnover. Somewhat surprisingly, while Ireland has a greater number of firms and employees, foreign firms
have larger turnover than domestically-owned firms in the food sector. [Source: 2012 Census Industrial
Production from CSO Ireland]
Hence, foreign firms appear to dominate domestic firms in almost all key sectors, while Irish firms have only a
significant foothold in the food sector.
Ireland has traditionally followed what has been termed an ‘industrialisation by invitation’ approach whereby
policy-makers believed that attracting FDI in a range of high-tech clusters would both lead to economic growth
and foster indigenous industrial activity11. Yet, despite concerted efforts to foster spill-overs11, evidence of the
occurrence of positive externalities are mixed11 29 and this seemingly singular approach has come under
criticism30.
A 2014 report by the Irish Department of Finance10 highlights the current dis-connect between domestic and
foreign dominated sectors:
• Due to the high value-added nature of foreign-dominated sectors, productivity levels are higher than in
Irish-owned firms. This differential holds across all sectors but is particularly pronounced in
manufacturing.
• Higher productivity levels are reflected in wage levels which are nearly twice as high in foreign-owned
firms as compared with indigenous ones.
29 The Lucerna Project (2010) Capabilities & Competitiveness: A Methodological Approach for Understanding Irish Economic
Transformation 30 Bailey D & Lenihan H (2015) ‘A Critical Reflection on Irish Industrial Policy: A Strategic Choice Approach’. International
Journal of the Economics of Business Volume 22, Issue 1, 2015.

32
• While the presence of foreign-owned companies in the economy can benefit domestic firms, the industry
output and employment multipliers in terms of indirect effects on the economy are much higher for
domestic sectors than for FDI.
For example, high-tech foreign-owned businesses are typically integrated into vertical supply chains often reliant
on suppliers in the owners country and distributors on mainland Europe, and often lead to little demand for Irish
suppliers31 32. There is also limited evidence of labour market pooling. For example, evidence suggests that skills
needed by Irish pharmaceutical industry have been acquired in third level institutions and not ‘on-the-job’33.
Finally, limited evidence also exists for knowledge spill-overs with the exception of the Dublin software
industry34.
Indeed, analogous to the Product Space distribution of industries observed above, a dichotomous innovation
system has also been observed regarding the ways in which indigenous and foreign-owned businesses conduct
innovation in Ireland11. For example, indigenous firms are more likely to interact with customers and suppliers,
which both spurs innovation and leads to a higher return on that innovation35. On the other hand, foreign-owned
businesses based in Ireland tend not to develop in-house R&D capacity, but rather engage with higher education
institutes doing research in their respective field36. This latter approach, driven by tax incentives, has again failed
to compelling spur on domestic innovation and generate high-tech start-up activity11.
Hence, both a range of data sources and previous research support our earlier observation that Ireland inhabits
two distinct clusters in the Product Space. Here we complement this work by developing a data-driven approach
to investigate of the pattern of Ireland’s industry appearances in the Product Space, as documented in Tables 4-7
of the SI. We would expect that over time, as clusters of products form in the Product Space and the likelihood of
new neighbouring products increases due to concentration of industries, we could better predict new appearances.
However, external processes such as injections of FDI may disrupt this path-dependent process and render the
Product Space model less predictive of industry growth.
In order to estimate the likelihood of product appearances, and compare this estimate to actual industry
appearances, we use a measure of ‘distance’ in the Product Space from a particular product to the export basket
of a specific country (i.e., the industries it inhabits) – where a closer industry is more likely to appear8, see SI for
a detailed derivation. Conversely, we can identify which appearances were in some sense unexpected due to their
increased distance. For example, if Ireland already exports apples and pears – neighbours of plums in the Product
Space – it is more likely to export plums in the future. Conversely, Ireland might be less likely to export rubber
as it does not already export any of the products neighbouring rubber in the Product Space, and hence an
appearance of rubber would be unexpected.
Figure 13 shows that, splitting the data into domestic and foreign-owned sectors, we observe that appearances in
domestic sectors became more predictable over time suggesting that an expansion of the underlying capability
base (which could be augmented by FDI into these sectors) has given rise to new products as modelled by the
Product Space.
However, in the latter case we observe a decrease in the prediction power of the Product Space structure,
suggesting a lack of spill-over from the high-tech foreign sector possibly due to a lack of transfer of sufficient
capabilities to the indigenous workforce due to their relative distance37 (in the Product Space) from existing local
capabilities, specialised input needs, very high start-up and R&D costs, and other barriers to entry such as patent
protection in pharmaceuticals and electronics.
31 Gallagher L, Doyle E & O’Leary ‘E (2002) ‘Creating the Celtic Tiger and Sustaining Economic Growth: A Business
Perspective’. Quarterly Economic Commentary, Economic and Social Research Institute, Dublin, Spring, 63-81. 32 Barry F, Gorg H & Strobl E (2003), Foreign Direct Investment, Agglomerations and Demonstration Effects: An Empirical
Investigation’. Review of World Economics/Weltwirtschaftliches, 139, 4, 583-600. 33 Van Egeraat C (2006) ‘The Pharmaceutical Industry in Ireland: Agglomeration, Localisation or Simply Spatial
Concentration?’ NIRSA Working Paper Series, 28, February, National Institute for Regional and Spatial Analysis, Maynooth. 34 Crone M (2004) ‘Celtic Tiger Cubs: Ireland’s VC-Funded Software Start-ups’. The Institute for Small Business Affairs,
National Entrepreneurship and SME Development Conference, Newcastle-Gateshead. 35 Doran J & O’Leary E (2011) ‘External Interaction, Innovation and Productivity: An Application of the Innovation Value
Chain’. Spatial Economic Analysis, 6(2): 199–222 36 Jordan D & O’Leary E (2008) ‘Is Irish Innovation Policy Working? Evidence from Irish High-Technology Businesses’.
Journal of the Statistical and Social Inquiry Society of Ireland, XXXVII: 1–45. 37 Our distance metric is based on the RCA level of neighbouring nodes – i.e., industries surrounded by high RCA existing
industries are more likely to appear. See Appendix for a technical definition.

33
7. OPPORTUNITIES FOR GROWTH
We have seen that the structure of the Product Space enables us to estimate if past appearances and disappearances
were ‘expected’ based on their ‘distance’ to Ireland’s export structure at that time. This logic can be extended to
predicting or designing – via, for example, policy actions such as grants or subsidies - future industry appearances
under the same logic that nearby industries require similar inputs to current capabilities, and are thus more likely
to be good candidates for strategic investment.
On an international level, industrial policy has had a chequered history. Accused of promoting graft, and reducing
competition via ‘picking winners’ without clear theoretical foundation, there has been much scepticism regarding
a state’s ability to conduct this role fairly and effectively. However, industrial policy has recently enjoyed
somewhat of a resurgence as data-driven tools such as the Product Space have become available, and governments
in both the developing and developed world attempt to actively promote the growth of specific sectors in the face
of emerging threats from a diverse range of sources including climate change, the proliferation of low-growth
non-tradable services industries, and the success of China which has long conducted wide-ranging industrial
policy38.
We have seen in the previous section that Ireland has traditionally engaged in industrial policy, attracting FDI in
a range of high-tech clusters in the hope that this would generate spill-overs and foster indigenous economic
activity11. Today, it is widely acknowledged that better linkages between industries, and increased opportunity for
bottom-up growth, is needed for diversification and expansion of domestic sectors.11, 39
Before proceeding any further, it is important to note that we seek here to simply illustrate the potential of the
Economic Complexity framework and the Product Space as a tool for industrial policy. Further in-depth analysis
of market dynamics and a range of internal and external factors, which is beyond the scope of this paper, would
be necessary to robustly identify in detail promising sectors for investment.
Figure 13: We observe that appearances of chemicals/pharmaceuticals and machinery/electrical have
occurred at both close and further distances from the current Product Space over time, yet vegetable
products and animal products have been appearing in a more predictable fashion (we find that the
relationship between distance and year is statistically significant with t=-2.43 and r2=0.12) – i.e.,
increasingly in close proximity to the Ireland’s position in the Product Space. [Source: Author’s
calculations using CEPII COMTRADE 2012 data]
38 Aghion P, Boulanger J & Cohen E (2011) Rethinking Industrial Policy. Bruegel Policy Brief 39 Irish Department of Jobs Enterprise and Innovation (2014) Ireland’s Smart Specialisation Strategy for Research and
Innovation, Summary

34
Figure 14: For developing countries, we often have the situation where complex industries are further away
(i.e., the distance is greater). However, in Ireland’s case, many complex industries are close to current
products. Here the sectors (HS 3-digit aggregation) are sized by world trade, and filled according to the
number of sub-sectors Ireland exports with RCA. Hence, the non-filled space corresponds to the
‘opportunity’ for growth of new products within these sectors. [Source: The Atlas of Economic Complexity
2012, with artistic and text overlays by Author]
We have seen that under the Economic Complexity model, countries grow as they diversify into more complex
industries in a step-wise fashion (typically moving from right to left) in the Product Space. For many developing
countries, complex industries are far away in the Product Space and strategic diversification is difficult. However,
in Ireland’s case, a large range of complex industries are close to current products and hence Ireland is well-
positioned in the Product Space to increase its aggregate complexity level, as seen in Figure 14.
Quantitatively, the metric Opportunity Value measures how well a country is positioned in the Product Space by
calculating the distance of the country to the products it is currently not exporting with RCA, weighted by the
complexity value of each product (see SI for a detailed definition). Figure 15 shows that Ireland’s Opportunity
Value is more or less as expected for its level of wealth, confirming that it is in a reasonably good position to
move into nearby more complex industries.

35
Figure 15: Ireland occupies a densely connected central cluster, and a high complexity peripheral cluster,
in the Product Space leading to many nearby potential new industries and a consistently high opportunity
value (see Appendix for definition). Compared to similar countries (bottom left) and the most complex
countries (bottom right), Ireland exhibits a relatively high and stable opportunity value. [Source: Author’s
calculations using CEPII COMTRADE 2012 data]
Individual products are chosen because they exhibit close distance to Ireland’s current export basket, have
complexity greater than the current mean complexity value, and high Opportunity Gain (a metric that combines
both distance and complexity analogous to the country-level aggregate measure Opportunity Value).
We wish to identify promising products that are both close the Ireland’s current export or capability structure, and
have will increase overall complexity level). Potential products fulfil several criteria:
• Currently not exported with RCA>1
• Small ‘distance’ to Ireland’s current Product Space;
• PCI greater than current mean PCI
• RCA in previous years such that 0.05<RCA<1 in order to eliminate products such as kiwis, for example,
which may not be suited to Irelands climate (and have hence never been exported in any quantity), and
industries in which Ireland previously had a comparative advantage and exited the market.
Figure 16, and Figures 10 and 11 of the SI, highlights a range of products which balance distance and complexity.
In particular, we note that diversification into varied machinery sectors which are at close proximity to the current
domestic cluster could be a stepping stone to higher complexity measurement instruments towards the left-hand
side of the Product Space. These strategic industries include various measurement instruments, pumps (liquid and
fire extinguishers) and a range of machinery including lifting, harvesting, excavation, and agricultural and stone-

36
working machinery. Consistent with developments on the ground, the former set of products fit well within
existing growth of the medical devices sector. Agricultural machinery has also been recently independently
identified as having significant export potential40.
An extensive list of potential industries and their corresponding distance and complexity is included in the
Supplementary Information, see Tables 8-13.
Figure 16: Finally, we illustrate the position of several potential industries in the Product Space. We observe
that diversification into varied machinery sectors could be a stepping stone to higher complexity
measurement instruments. [Source: The Atlas of Economic Complexity 2012, with artistic and text overlays
by Author]
8. DISCUSSION AND CONCLUSIONS
In this paper we have explored the evolution of Ireland’s export structure and complexity in the Product Space
over the past two decades within the context of an economy heavily dependent on exports, and a long-standing
focus on attracting FDI as a means to foster domestic activity.
This analysis has identified several risks to Ireland. In particular, Ireland exports fewer and fewer products with
RCA over time, with an acceleration in the number of high complexity products observed exiting the market since
2008. This shrinking Product Space indicates that it is specialising – yet we observe an intense level of
specialisation as compared to similar countries. Furthermore, the evidence that specialisation leads to economic
growth for developed countries is mixed.
Ireland’s position in the Product Space exhibits a dual structure with two disconnected clusters representing
domestic and foreign-owned industries respectively. Due to this distinctive feature, Ireland is today most similar
in terms of productive structure to high-tech Asian economies such as Japan, Singapore and Hong Kong.
During this period of consolidation, Ireland has experienced a decline in its Economic Complexity Index driven
by industry exits in high-tech sectors such as electronics, and increasing domestic exports of low complexity
40 Irish Times Article (2015) http://www.irishtimes.com/business/agribusiness-and-food/farm-machinery-manufacturers-
have-eyes-on-export-market-1.2093199

37
agricultural and food goods. As a result, Ireland has a very high level of GDP per capita as compared to other
countries at a similar complexity or capability level.
Most of Ireland’s high-value foreign-owned exporters, brought to Ireland by a very successful campaign to attract
FDI, are located in peripheral regions of the Product Space far away from the domestic cluster. This suggests that
knowledge and skills are not easily transferable to the indigenous workforce, and we observe that evidence of
spill-overs in terms of the creation of new closely-related domestic-owned industries is limited. We note that,
however, spill-overs in terms of the creation of new related services industries (not present in our data sets) – such
as computer software and maintenance – have been observed.
The peripheral nature of the foreign-owned cluster does indicate Ireland might enjoy some protection in terms of
competition as it is ‘distant’ in terms of the capabilities needed move into this region in the Product Space for
many countries. However, the trend towards high levels of diversification for developed countries will likely
negate any such protection in the longer run. Specialisation could also leave Ireland open to industry shocks such
as patent expiry, changing tax rules, competition from emerging manufacturing bases and changes in the
organisation of international supply chains.
However, on the domestic front things are more positive in terms of future trajectory. Ireland’s domestic exporters
are located in central highly connected regions of the Product Space leading to high opportunity value and plenty
of potential nearby industries (requiring similar capabilities) for expansion. Furthermore, lower complexity but
domestically-owned sectors such as foodstuffs, animals and agriculture have shown a recent increase in products
exported with RCA – suggesting that the domestic capability base is expanding. FDI into these sectors is also
significant which, in this case due to its proximity to Ireland’s current domestic productive capabilities, is likely
to bring new complementary expertise and accelerate the observed expansion of the cluster. Ireland has also seen
recent growth in domestic industries in medical and optical devices straddling the divide between foreign and
nationally-owned firms in the Product Space (yet has not yet increased the number of products with RCA in this
sector).
Hence, overall the Economic Complexity framework suggests that Ireland’s complexity level is below that which
would be expected for a country of comparable wealth. However, while this low and declining complexity level
has been driven by high specialisation and recent consolidation in some highly sophisticated FDI-driven sectors,
the evidence is more promising that an increase in ‘domestic’ complexity can be driven by expansion into products
and industries nearby to the existing food and agriculture cluster.

38
APPENDIX: SUPPLEMENTARY INFORMATION
1. GLOSSARY
• Revealed Comparative Advantage (RCA): A product is exported with RCA when the share of that product
in a country's export basket exceeds the global share of exports in that product.
• Product Space: The Product Space is a network that models the process of industrial diversification of an
economy. Constructed from international export data, nodes (products) are connected based on the
similarity between the sets of countries that export each product pair. This metric is intended to capture
shared inputs or required knowledge or skills.
• Country Space: Analogous to the Product Space, nodes of the Country Space are countries which are
connected based on their shared capability base. Again, the edge weights are derived from the similarity
between the sets of products that each country pair exports.
• Ubiquity: Product ubiquity is the number of countries that export the product with RCA.
• Diversity: Country diversity is the number of products that a country exports with RCA.
• Product Complexity Index (PCI): The PCI measures the number and type of capabilities needed to
manufacture a product. It is determined by calculating the average diversity of countries that make a
specific product, and the average ubiquity of the other products that these countries make.
• Economic Complexity Index (ECI): The ECI of a country ranks how diversified and complex the country's
export basket is. Analogous to PCI, it is computed iteratively via a country's diversity refined by the
ubiquity of it's products.
• Distance: Distance in the Product Space is measured from a single (non-exported) product to the current
set of products exported by a country. Mathematically, it is the sum of the RCAs of exported products
weighted by the edge weights connecting these products to the non-exported product.
• Opportunity Gain: The Opportunity Gain measures the potential complexity gain for a country with respect
to an individual product. It is computed by calculating the distance of the country to the product (in the
Product Space) weighted by the complexity value of the product.
• Opportunity Value: The Opportunity Value measures how well a country is positioned in the Product
Space. It is computed by calculating the distance of the country to the products it is currently not exporting
with comparative advantage, weighted by the complexity value of each product.
2. ECONOMIC COMPLEXITY VARIABLES
The Product Space and accompanying complexity metrics are derived from CEPII international trade data
between 1995 and 2013, including 129 countries and 1240 product classes4 which can be aggregated at various
levels. Typically we consider product classes at the Harmonised System (HS) 4-digit level, and sectors at the HS
2-digit and HS 3-digit levels.
We measure the intensity with which a country exports a product by computing its Revealed Comparative
Advantage (RCA). The RCA (corresponding to a product in a country) is defined as the ratio between the share
of total exports that the product represents in the country's export basket, and the global share of exports of that
product. A product is over-represented in a country's export basket if its RCA is above 1.
Formally, if Xc,i is equal to the export value of country c in industry i, then the RCA of country c in industry i is
defined as:

39
We say that
• A product is present if RCA≥1
• A product is absent if RCA≤1
• A product appears in t1 if RCA≤1 in t0 and RCA≥1 in t1
• A product disappears in t1 if RCA≥1 in t0 and RCA≤1 in t1
for some combination of times t0 and t1. Tables 1-7 show industry presences, appearances and disappearances
for Ireland during the period 1995-2012.
The Product Space
The Product Space, introduced by Hausmann and Hidalgo [1, 5], is a network where nodes represent industries
that are connected - via weighted edges - based on how similar their knowledge or input requirements are. In
practice, the similarity or edge weight between two nodes is computed using a measure of co-export between
two products. The logic behind this approximation is that if two products are co-exported by a subset of countries,
then these countries must have a similar capability base.
The structure of a network such as the Product Space may be represented by an adjacency matrix Φ, with entries ϕij corresponding to the weight of an edge from node i to node j. If we denote the indicator matrix
for RCA>1 via Mc,i = Mc,i > 1, the edge weight between node i and j is the minimum of the conditional
probability of exporting a product i given the export of another good j, and is computed as
where the diversity of country c and the ubiquity of industry i are defined as
respectively.
In practice, since this is a dense (full) matrix, we cannot represent the whole matrix when illustrating the Product
Space visually. Hence various techniques, including the Minimum Spanning Tree [8], are applied to reduce the
number of edges to illustrate the underlying structure of the network [6].
The Country Space
The Country Space may be defined analogously to the Product Space, where the network structure enables us to
compare the relative productive structure of country pairs in terms of shared skills and capabilities. In a similar
fashion to the construction of the Product Space, these similarities are estimated by measuring co-export of traded
products [3]. In this case, we log transform the RCAs (adding a small constant due to zero values) such that Lc,i
= log10(Mc,i + 0.1), and define edge weights that are the entries in adjacency matrix Ψ
where Lj denotes the vector of the log transformed RCA's (for all industries) corresponding to country j.
Similarly to the Product Space above, since this is a dense (full) matrix, we cannot represent the whole matrix
when illustrating the network visually. The Country Space, shown in Figure 7 of the main paper, was laid out
by the author using the two highest edges connected to each node/industry plus high edge weights over a
threshold equal to 0.6. This layout currently features on the Atlas of Economic Complexity website
http://atlas.cid.harvard.edu/.

40
Complexity Indices and Opportunity Value
As proposed by Hausmann and Hidalgo [2], the complexity of an economy is related to the range of useful
knowledge embedded in it, which can then be combined to make products. These products cannot be made by
countries that are missing parts of the required capability set. The complexity metric attempts to estimate this
capability set for a given product or country.
Hence, beyond country diversity and product ubiquity, in order to generate a more accurate measure of the number
of capabilities available in a country, or required by a product, we need to incorporate more information about the
nature of the products. For example, for countries, this requires us to calculate the average ubiquity of the products
that it exports and the average diversity of the countries that make those products and so forth. For products, this
requires us to calculate the average diversity of the countries that make them and the average ubiquity of the other
products that these countries make.
These relationships can be expressed in a recursive format, known as the 'Method of Reflections'. The average
diversity of country c and analogously the average ubiquity of industry i may be expressed as:
Continuing the iteration, we reach a pair of expressions:
which, via substitution, can be expressed in closed form in terms of either c or i:
with
and
The application of eigenvalue methods enables us to obtain the long-run solution of the iterative systems above.
In particular, the Economic Complexity Index (ECI) is the second largest eigenvector of M̃cc’, and the Product
Complexity Index (PCI) is the second largest eigenvector of the analogous matrix M̃ii’.
Density, Distance and Opportunity Value
In order to estimate which products are 'close' to the current productive structure of an economy, we need to
derive a metric of distance in the product space. We can define a density predictor variable, the reciprocal of
distance, which essentially measures the likelihood of a product presence or appearance based on the RCA of
its neighbours in the Product Space [7].
Specifically, the density of industry in country c is computed via the weighted average the edge weights for industries with RCA connected to product i:

41
where Ni is the neighbourhood of the k nearest neighbours of node i (defined via k largest out-edges from node i).
The logic here is that if a node or product is surrounded by high RCA industries in the Product Space, then it is
more likely that either this product is already present, or it will appear in the future. It has been shown that density,
which captures path dependance in the Product Space, is highly predictive of export/employment/wage growth
on an industry-country level [7].
The distance of industry i from country c can be seen as the inverse of density (i.e., less 'likely' products are
'further' away):
Under this model, a country is well positioned to diversify if it has existing industries in dense well-connected
regions of the Product Space, and close neighbours with high product complexity.
We define the opportunity value of country c, which can be seen as the level of complexity of the products that it
does not currently export with RCA weighted by how close these products, as
and the opportunity gain, which measures the change in opportunity value for country c that would come as a
consequence of developing industry i, as
3. FIGURES AND TABLES
Figure 1: Ireland is a major recipient of net inflows of FDI, driven by favourable tax conditions and a highly
educated and competitive workforce. Only Hong Kong, Singapore and Luxemburg exhibit similar levels of
FDI for a comparable GDP level. Recent inflows were dominated by the services sectors including financial
intermediation and computer activities, with manufacturing sectors experiencing a decline including
chemicals and pharmaceuticals. [Source: WDI 2012 (left figure) and OECD (right figure)]
42
Figure 2: We can also consider other aspects concerning the ease of doing business in Ireland via The World
Bank's Doing Business Indicators. While Ireland has an impressive record in financial and administrative
areas such as starting a business, providing access to credit, setting attractive tax rates and protecting
investors, Ireland lags the OECD average in certain practical areas such as electricity and construction
permits. [Source: The World Bank's Doing Business Indicators 2014]
Figure 3: While we observe a decline in the share of exports from the food and agriculture sector, their
total value has been increasing. Similarly, while maintaining their export value, the share of electronics and
machinery exported have declined in recent years, dominated by the growing pharmaceuticals sector.
[Source: The Atlas of Economic Complexity 2012]

43
Figure 4: Ireland's main export partners include the US, the UK and various large European countries.
Export to the US and Western Europe has been increasing since 1995, driven by the USA and Belgium,
who mainly buy pharmaceutical inputs, and the UK and Germany who import a range of products
including food and agricultural products. [Source: The Atlas of Economic Complexity 2012]
Figure 5: Here we see the Product Space with nodes coloured by Product Complexity Index (a measure of
product sophistication in terms of the rarity of capabilities needed to manufacture the product). Darker
nodes (more complex products) are mainly located in left-hand densely connected central regions of the
network. [Source: The Atlas of Economic Complexity with custom node colouring by Author].

44
Figure 6: We compare the export basket for Northern European countries in 1995 to that in 2010 (via
correlation of the industry-specific RCA values in those years). We observe a low correlation value for
Ireland suggesting that Ireland has not only specialised, but also radically changed its export mix relative
to its neighbours during this period. [Source: Author’s calculations using CEPII 2012 COMTRADE data,
and UN World Development Indicators 2012.]
Figure 7: We observe that comparable Northern European countries export products located in diverse
areas of the Product Space (data for 2012). In contrast, Hong Kong and Singapore are most similar to
Ireland in the sense that they occupy distinct clusters and are mainly absent from the central interior.
Singapore is particularly similar to Ireland in that it competitively exports pharmaceuticals, electronics
and a small number of agricultural and food products. [Source: The Atlas of Economic Complexity, with
artistic and text overlays by Author.]

45
Figure 8: We show in the main text that Ireland exhibits high levels of GDP per capita as compared to its
complexity level. As GDP is heavily influenced by foreign earnings in Ireland, GNP is often cited as a more
reliable measure. Here we show that, irrespective of whether we use GDP or GDP, Ireland is wealthy as
compared to other countries of a comparable complexity level. [Source: The Atlas of Economic Complexity,
and UN World Development Indicators.]

46
Figure 9: Since 2008 we observe a decrease in mean complexity for products from machinery/electrical,
pharmaceuticals/chemicals or plastics (left column), while we observe an erratic recent increase in
complexity in food/vegetable sectors (right column). Similarly, product appearances in the former case are
also declining in complexity, while appearances in the latter case exhibit an erratic increase. [Source:
Author's calculations using CEPII COMTRADE 2012 data.]

47
Figure 10: Considering the complexity-distance relationship for individual products not currently exported
with RCA in Ireland, we see a wide range of industries represented (HS 4-digit aggregation). These include
close but lower complexity products represented in yellow, and higher complexity
chemicals/pharmaceuticals in pink and electronics/machinery in blue/grey (and textiles in green). [Note:
markers are sized by global market size]. [Source: The Atlas of Economic Complexity 2012, with artistic
and text overlays by Author.]

48
Figure 11: Zooming in on individual sectors, we can identify some potential products for diversification.
For example there are a number of processed food products at near distance to Ireland's current Product
Space. At a significantly higher complexity level, we observe that - in general – the more complex a product
is in the chemicals and pharmaceuticals sector, the more distant it is. Interestingly, we observe the converse
relationship for electronic/machinery products where very high complexity products are located at close
proximity. These strategic industries include various measurement instruments, pumps (liquid and fire
extinguishers) and a range of machinery including lifting, harvesting, excavation, agricultural and stone-
working machinery. [Source: The Atlas of Economic Complexity, with artistic and text overlays by
Author.]

49
Table 1: Industries exported with RCA in 2012 - sorted by1H2S 2-digit sector, and then by RCA level
from low to high.

50
Table 2: Industries exported with RCA in 2012 - continued.
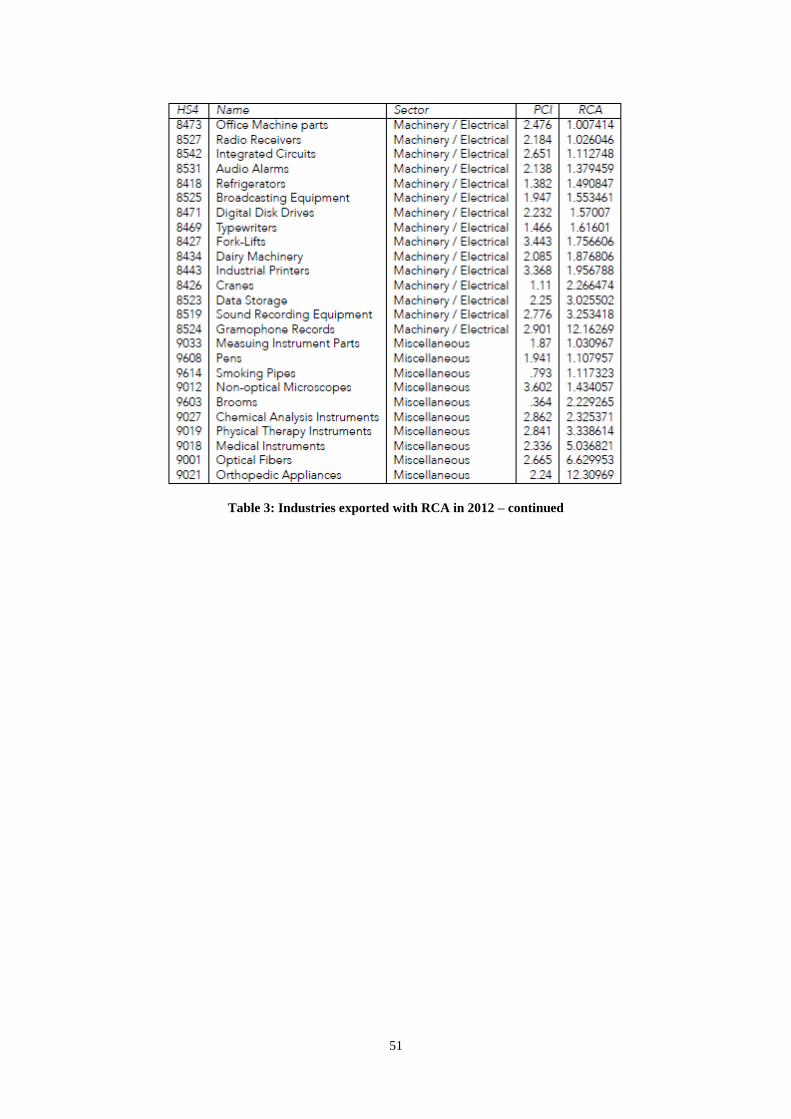
51
Table 3: Industries exported with RCA in 2012 – continued

52
Table 4: Industry appearances 2000-2012 - sorted by HS 2-digit sector, and then by year of appearance.

53
Table 5: Industry appearances 2000-2012 - continued.
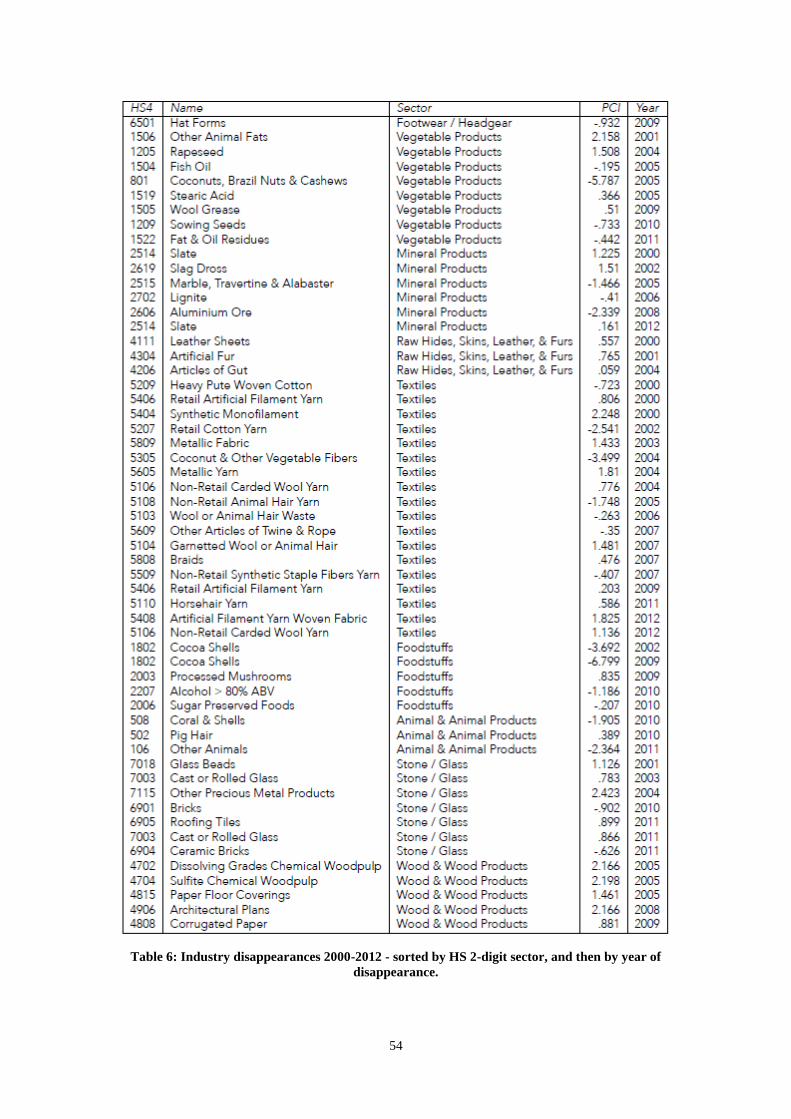
54
Table 6: Industry disappearances 2000-2012 - sorted by HS 2-digit sector, and then by year of
disappearance.

55
Table 7: Industry disappearances 2000-2012 - continued.

56
Table 8: Potential strategic industries - sorted by HS 2-digit sector, and then distance to Ireland's current
location in the Product Space.

57
Table 9: Potential strategic industries - continued.

58
Table 10: Potential strategic industries - continued.

59
Table 11: Potential strategic industries - continued.

60
Table 12: Potential strategic industries - continued.

61
Table 13: Potential strategic industries - continued.

62
Appendix References
[1] Hidalgo CA, Klinger B, Barabasi AL, and Hausmann R. The product space conditions the development of
nations. Science, 317:482--487, 2007.
[2] Hidalgo CA and Hausmann R. The building blocks of economic complexity. Proc Natl Acad Sci USA,
106(26):10570--10575, 2009.
[3] Bahar D, Hausmann R, and Hidalgo CA. International Knowledge Diffusion and the Comparative Advantage
of Nations. Center for International Development, 2012.
[4] Lipset Feenstra, Ma Deng, and Mos World Trade Flows: 1962-2000.
[5] Hausmann R and Hidalgo CA. The network structure of economic output. Journal of Economic Growth,
16(4):309--342, 2011.
[6] Hausmann R, Hidalgo CA, Bustos S, Coscia M, Chung S, Jimenez J, Simoes A, and Yildirim MA. The atlas
of economic complexity: Mapping paths to prosperity. Harvard University Center for International Development,
MIT Media Lab, 2011.
[7] Hausmann R, Hidalgo CA, D Stock, and M Yildirim. Implied comparative advantage. Working Paper, Center
for International Development, Harvard University, 2014.
[8] Graham RL and Hell P. On the history of the minimum spanning tree problem. Ann. History Comput, 7:43--
57, 1985.

63
VOTE OF THANKS PROPOSED BY EOIN O’LEARY,1 UNIVERSITY COLLEGE CORK
I would like to thank the Society for inviting me to second the vote of thanks on this very worthwhile and
interesting paper. Neave should be complimented for being one of the first to offer a detailed application of the
complexity framework to Ireland.2 For my part, in my book published last March, which Neave cites, I pointed
to possible advancements in the area of product space (O’Leary, 2015: 185). I should add that Neave was already
engaging in her work by the time I was writing my book. I was therefore very glad to see this paper and am
particularly pleased to be invited to respond to it.
My comments are in three sections. I begin with some general comments on the paper in the context of my own
work, and continue with more detailed comments on the theory and method used by the author. This is followed
by some thoughts on the findings.
General Comments
This paper analyses the evolution of Ireland’s merchandise exports since 1995 using the economic complexity
framework (Hidalgo, Klinger, Barabasi and Hausman, 2007). It observes a higher level of specialisation than
would be suggested by Ireland’s level of GDP per capita. It identifies a dual structure within the economy, with
domestic and foreign-owned exporters exhibiting distinctly different characteristics. In the latter case, there is a
recent consolidation and reduction in complexity level by foreign-owned businesses producing high-technology
pharmaceutical and electronics products. This contrasts with a dynamic and growing pattern for businesses
producing food products, likely to be domestically owned. According to Neave, these businesses may be well
positioned for continued expansion of Ireland’s indigenous activities into more complex goods.
These results in many respects resonate with my own work which has increasingly pointed to the existence of a
dual economy in Ireland. In my last co-authored paper to the Society, I reported an intriguing result that despite
indigenous businesses spending considerably less per worker on R&D, these businesses are significantly more
likely than foreign-owned businesses to introduce new innovative products (Doran, Jordan and O’Leary, 2013).
Subsequent work on Irish innovation has pointed to the innovation activities of foreign-owned businesses being
largely self-contained within the corporations to which they belong, with little likelihood that external interaction
by Irish-based subsidiaries increases the likelihood that they will innovate. This contrasts with indigenous
businesses where there is stronger evidence that external interaction is important for innovation (Doran and
O’Leary, 2014).
In my book I have argued that apart from low tax, which has clearly been hugely important, other factors have
played a role in offering foreign-owned businesses in the pharmaceutical and ICT sectors sustainable advantages
from operating out of Ireland. Assistance from IDA Ireland and government departments in the provision of
locations with net urbanization economies for foreign-assisted businesses is likely to have been important. These
advantages include the availability of a general pool of skilled labour and appropriate infrastructural facilities to
meet their needs. A further strength has been strong connectivity of these businesses with other units in the
corporations to which they belong in support of productivity enhancement. The skills of the Irish-based
management and workforce in successfully up-grading these large businesses, often over a number of decades,
have also been a positive and under-researched feature. However, the main weakness has been the lack of linkages
from these businesses to others in the Irish economy which has meant that a critical mass of internationally
competitive indigenous businesses, in the pharmaceutical, ICT or related sectors has failed to emerge since the
1970s.
As regards indigenous manufacturing I show that the food processing sector, broadly defined, is our only
internationally competitive manufacturing sector.3 While this sector has stronger linkages into the Irish economy,
which have contributed to its sustainability, it has a number of significant weaknesses. While there are a small
number of large successful businesses such as Kerry, Glanbia and ABP, there are also a very large number of
small low productivity businesses. I argue that there is a lack of entrepreneurial vibrancy in the sector due to the
over-emphasis on commodity production, the dominance of the EU’s ‘beggar-thy-neighbour’ Common
Agricultural Policy, and the destructive effects of industry rent-seeking. Despite a strong export performance,
these weaknesses have contributed to a failure to realize potential and have undermined the sustainability of the
1 I would like to thank my colleague Dr Eleanor Doyle for sharing her thoughts on this paper. 2 The only other study on Ireland in this field that I am aware of is by Brady, Doyle and Noonan (2013), who focus on
comparing Ireland and Finland since 2000. 3 Although compared to this paper I was operating at a much higher level of aggregation.

64
sector (O’Leary, 2015: 166-7). This conclusion clearly differs from Neave’s more up-beat conclusions about this
sector. I will return to this later.
I would also re-iterate that the ‘elephant in the room’ remains the absence of data on the nature and extent of
capabilities in the Irish labour force, which is so important for linkages. This has more to do with the skills
acquired ‘on the job’ that worker’s formal education qualifications (Kavanagh and Doyle, 2003). Data are
therefore needed at the levels of the firm and the individual worker that will allow us to trace skills commonalities
across firms, sectors and even places. This kind of research is being carried out by evolutionary economic
geographers for Scandinavian countries (see for example, Timmermans and Boschma, 2014). Without these data
we will continue ‘grasping at straws’ in relation to the key questions of linkages and relatedness.
The author is up-front in stating that her analysis is confined to merchandise exports. The techniques being used
requires access to the extremely detailed and standardized internationally available merchandise trade statistics.
Services exports are excluded from the analysis. The policy response to Neave’s finding of a recent consolidation
and reduction in the complexity level by the foreign-owned businesses in high-technology pharmaceuticals and
electronics sectors might be to point to the growing presence of foreign-owned high-technology businesses in
internationally traded services sectors such as business services and software. This would miss the point. Neave’s
results are extremely interesting in and of themselves. While internationally traded services are becoming
increasingly important, manufacturing is still vital. These results offer fascinating insights into how our
manufacturing sectors are performing relative to those in other developed countries. There is no reason that I see
in principle why the product space technique could not be applied to traded services. Unfortunately, international
data on traded services is far too aggregated, lacking the granularity of the merchandise trade data.
Neave states in her paper that the problem of the overstatement of value-added due to transfer pricing by Irish-
based multi-nationals does not significantly affect the export data, on which her analysis greatly depends. I have
doubts about this statement, although I note that Neave offered more qualification on this point in her presentation
tonight. The practice of transfer pricing results in the over-valuation of exported output (and indeed often the
undervaluation of imports) in the categories in which these businesses are dominant. For example, for Chemicals
and related products the share of merchandise exports increased enormously from 19% in 1995 to a massive 60%
in 2012 (O’Leary, 2015: 74). This category of products is clearly related to the chemical and pharmaceutical
industry, where it is widely known that inflated productivity levels are substantially affected by transfer pricing.
I show that adjusting for transfer pricing might reduce the Irish productivity level in this sector by up to 50% in
2007 (O’Leary, 2015: 43). This anomaly in Irish export data has the knock-on effect that the export shares of
categories dominated by indigenous businesses are dwarfed by comparison. For example, the decline registered
in the export share of Total food and live animals, which includes food processing, is over-stated as a result. There
is little that can be done about this as the task of adjusting Irish trade data for transfer pricing is particularly
difficult. However, I would argue that more caution is warranted in interpreting the results. For example,
measures of revealed comparative advantage for Ireland are biased as a result.
The Findings
The paper contains a very large number of interesting network maps based on different ways of applying the
algorithm. I will concentrate on a few.
In Figure 5 we see that in 2013 Ireland occupied two distinct regions of the product space. These are a cluster of
high complexity mainly foreign-owned chemical, pharmaceutical and electrical products on the left-hand
periphery and a separate cluster of mainly domestic food and agricultural products on the centre-right. The
presence of food products in highly connected central areas of the Product Spaces implies that Irish firms and
industries producing these products have many options for diversification in terms of the capabilities they already
possess. Bearing in mind my earlier observations about this sector, I would add that these options should be seen
as opportunities, which I think concurs with Neave’s conclusion presented tonight. I have argued above that the
food processing industry has not reached its potential. The implication from Neave’s results is that opportunities
exist if the long-standing problems that have undermined the industry can be addressed. In contrast, the peripheral
nature of some of the foreign-owned industries implies that spill-overs may be limited due to their highly
specialised nature. These results provide further evidence suggestive of the self-contained nature of these
industries, with little linkages to other industries.
In Figure 6 it is shown that Ireland’s level of diversity of products exported (as measured by the revealed
comparative advantage measure) has been declining over the past two decades from a relatively low level in the
mid-1990s. Only Norway had a similarly low level, and it also declined. Other comparator countries, including

65
Denmark, Austria, Finland, Sweden, Hong Kong, Singapore and Israel, all had higher levels to begin with, which
they maintained until 2012. This pattern, combined with what is referred to as a worrying trend in Figure 11, of
declining complexity in product appearances coupled with increasingly complexity of disappearances (mostly in
pharmaceutical and electrical products), is suggestive of increasing risk associated with Ireland’s strategy of
industrialization by invitation. This result should be of interest to policymakers charged with Ireland’s on-going
economic development strategy.
In this regard I have argued that there has been an absence of long-term strategic planning by Irish policymakers.
It has been more a case of crisis management in the late 1950s and the late 1980s, before the Celtic Tiger period,
to backing a winning formula since (O’Leary, 2015). Was it always the plan that the IDA pipeline would be as
important today as it was in the 1980s? Neave questions the sustainability of our foreign-assisted internationally
competitive industries due to them not being fully integrated into Ireland’s capability base. This adds to other
concerns around the sustainability of reliance by policymakers on tax advantages to attract multi-nationals. There
is an urgent need in my view for long-term policymaking that is genuinely strategic.
I will conclude by congratulating the author on her meticulous and innovative work which should be used and
developed further for Ireland by economists and policymakers. In doing so I would like to commend this very
interesting paper to you and second the vote of thanks to Neave.
References
Brady, G, E. Doyle and L. Noonan. (2013). Trade Sophistication Indicators: Balancing Diversity, and
Specialization. International Advances in Economic Research. 19: 425–438.
Doran J. and E. O’Leary. (2014). The Roles of R&D and networking for innovation by Irish and foreign-owned
firms: evidence from the Irish CIS 2006-08. Department of Economics UCC, Working Paper Series, 14-05.
Forthcoming in The World Economy.
Doran, J., D. Jordan and E. O’Leary. (2013). Effects of R&D spending on Innovation by Irish and Foreign-owned
Businesses. Journal of the Statistical and Social Inquiry Society of Ireland. XLII: 15-41.
Frenken, K., Van Oort, F. and Verburg, T. (2007). Related Variety, Unrelated Variety and Regional Economic
Growth. Regional Studies. 41(5): 685-697.
Hidalgo, C., B. Klinger, A. Barabási and R. Hausmann (2007). The Product Space Conditions the Development
of Nations. Science, 317 (27), July: 482-487.
Hirschman A (1958) The Strategy of Economic Development. New Haven, Conn.: Yale University Press.
Kavanagh C. and E. Doyle (2003). Human Capital and Productivity in the Irish Context. In Aylward K and
O’Toole R (Editors). Perspectives on Irish Productivity: A Selection of Essays by Irish and International
Economists, pp 297-314, Forfas, Dublin.
Kennedy K.A. (1991). Linkages and Overseas Industries. In Foley T. and D. Mc Aleese (Editors). Overseas
Industry in Ireland. Dublin: Gill and Mac Millan, pp 82-105.
Neffke, F.M.H., Henning, M. and Boschma, R. (2012). The impact of aging and technological relatedness on
agglomeration externalities: a survival analysis. Journal of Economic Geography 12: 485-517.
O’Leary E. (2015). Irish Economic Development: High-performing EU State or serial under-achiever?
Routledge Studies in the Modern World Economy, London and New York. Online. Available
http://www.tandf.net/books/details/9780415645126/ (accessed 4th Nov 2015).
Porter, M.E. (1998). Clusters and the New Economics of Competition. Harvard Business Review: November –
December: 77-90.
Timmermans B. and R. Boschma (2014). The effect of intra- and inter-regional labour mobility on plant
performance in Denmark: the significance of related labour inflows. Journal of Economic Geography, 14: 289–
311.

66
DISCUSSION
Frank Barry: This is an interesting and thought-provoking paper, on which I have three comments. Though I
didn’t realise it at first, all three comments work in the direction of making the findings less worrying than might
at first sight appear to be the case. The first point is that the huge scale of Ireland’s services exports means that
the analysis is missing a much larger part of the canvas in its portrait of Ireland than of most other countries. A
lot of spillovers from the foreign-owned manufacturing sector in Ireland actually show up in services. My first
example of this comes from my study of the origins of the indigenous-owned software sector, which is perhaps
the leading indigenous high-tech sector. The diversity of foreign-owned manufacturing sectors in Ireland was an
important factor in its emergence, since the customised and niche software products these firms required were at
that time largely non-tradable. My second example comes from a paper with Chris Van Egeraat in the ESRI
Quarterly Economic Commentary in 2008 entitled “The Decline of the Computer Hardware Sector: How Ireland
Adjusted”. We showed that as hardware production migrated, most of the hardware firms remained here,
transitioning their operations into (better paid) services activities such as sales, technical support, software, R&D,
logistics etc.
A second point is that Ireland seems to have very little difficulty in drawing in from abroad whatever skilled
workers new MNCs might require – be it Italian-speaking software engineers or whatever. It is a high-wage
English-speaking environment and seems to be trendy (a la Richard Florida) for the present at least. The
constraints assumed in the paper might be less binding for economies like Ireland with very internationally-open
labour markets.
My final point is addressed to the finding that Irish income per capita is high relative to the apparent complexity
of the industrial structure. Comparing us to East Asian or other distant economies overlooks the income premium
we derive from geographic proximity to the world’s richest markets (as shown by Redding and Venables,
‘Economic Geography and International Inequality’ in the Journal of International Economics 2004).
Gerry Wrynn: On an issue highlighted by the speaker, namely that the ICT sector in Ireland is dominated by
Multinational companies I would point out that there are dynamic and fast growing indigenously owned
companies that have emerged in recent years, supported by Agencies like Enterprise Ireland and benefitting from
the Stare financed Research Centres and Technology Centres. However there has been a tendency for such
companies to be acquired by cash-rich multinationals seeking emerging technologies and those companies thereby
then join the multinational cohort. This phenomenon has contributed to the fact that total exports by Irish owned
companies have been stagnant at about 10% and Enterprise Ireland must constantly nurture new companies to
replace those lost to the multinational sector just to maintain that proportion. I also mention that employment in
the manufacturing sector had been rising steadily, with this week's CSO QNHS data showing a gain of about
19,000 jobs since the Forfas Manufacturing Strategy was published three years ago, a Strategy in respect of which
Dr Celine Mc Hugh, who had replied to tonight's paper, had been a key driving force.
Patrick Quill: I congratulate Neave on an excellent example of 'big data' being used to arrive at product groups
with similar input structure. I would also suggest that the same methodology might not transfer to services.
Linkages between products may be more readily observed in the goods case, because the input structure of goods
is more complex than that of services. This can be illustrated by viewing the input-output tables, where the first
quadrant (goods) is quite packed, whereas the fourth (services) quadrant is sparse and mainly diagonal.
John FitzGerald: This paper represents a novel way of presenting important data on the Irish economy. The
necessity of concentrating on the goods market and excluding the services sector from the analysis because of
data issues is a significant restriction. With the move from producing tradable goods to tradable services, even
within individual firms, this is a significant restriction. The best way of dealing with this is to consider other
available evidence before reaching conclusions on the economy and its comparative advantage. The spillover
effects of foreign firms may be important. The transfer of management skills through movement of personnel
from the MNE sector is pretty important. In a number of key sectors there is limited domestic value added, after
profit repatriations. Tis needs to be taken into account. The Netherlands Central Planning Bureau have done
valuable research looking at trade in value added. This approach might prove useful.