Embed Size (px)
Citation preview

Thanks to Dan Wales and Ida Hjortsoe for playing key roles in putting together the analysis discussed in these comments. Special thanks to Will Abel and Abigail Whiting as well. Further thanks to Stuart Berry, Simon Caunt, Federico Di Pace, Jack McKeown, Tsveti Nenova, Gareth Ramsay, Emma Sinclair, Brad Speigner, Jumana Saleheen, Srdan Tatomir, and Martin Weale for helpful discussions and suggestions. Also thanks to the JobCentre Plus in Brixton for a tour and insights on the job-search process. The views expressed here are my own and do not necessarily reflect those of the Bank of England or other members of the Monetary Policy Committee
All speeches are available online at www.bankofengland.co.uk/publications/Pages/speeches/default.aspx
1
A tale of two labour markets: the UK and US Speech given by
Kristin Forbes, External MPC member, Bank of England
Henry Jackson Society, London
26 January 2016

All speeches are available online at www.bankofengland.co.uk/publications/Pages/speeches/default.aspx
2
2
It was the best of times, it was the worst of times, it was the age of wisdom, it was the age of foolishness,
it was the epoch of belief, it was the epoch of incredulity, it was the season of Light, it was the season
of Darkness, it was the spring of hope, it was the winter of despair, we had everything before us, we had
nothing before us, we were all going direct to Heaven, we were all going direct the other way – in short,
the period was so far like the present period…
-Charles Dickens, A Tale of Two Cities
The opening of Charles Dickens’ A Tale of Two Cities could easily be written about the UK labour market
today. In many ways it is the “best of times”. The unemployment rate is at 5.1% – the lowest rate in over
ten years. Over 260,000 net new jobs were created over the three months through November, and there are
now over 1.7 million more people employed than before the financial crisis. The employment rate for the
working-age population is 74% – the highest since records began in 1971.
But by other measures, the labour market could be described as the “worst of times”. Wage growth has
slowed recently – with whole economy total pay growth slipping down from 3.3% oya in the three months to
May to 2.0% oya over the three months to November. Median incomes have only grown by 1.6% over the
last 4 years, so that after adjusting for inflation, median household income in 2014/2015 is still about 2%
below its peak in 2009/2010.1 The many workers who have recently found employment may still feel the
“spring of hope”, but this could easily slip into a “winter of despair” if their earnings do not grow faster.
This dichotomy in the UK labour market presents a substantial challenge for those of us setting monetary
policy. By most quantity measures, the UK labour market appears to be very healthy and near equilibrium.
If the challenges companies are already facing to find workers continue and accelerate, this should drive a
sharp pickup in wages and in inflation that would suggest we should have already begun tightening monetary
policy. By most nominal measures, however, the UK labour market still has some slack and firms are not
under so much pressure to find and keep workers that they need to pay more. With slow wage growth,
inflation currently at 0.2%, and downward price pressure from cheaper energy and sterling’s past
appreciation, there appears to be little risk of inflation suddenly spiking to well above our 2% target in a way
that would require increasing interest rates soon.
Therefore, correctly interpreting recent developments in the labour market is critically important. A
misinterpretation could lead to inappropriate monetary policy and Dickens’ “age of foolishness”. My goal
today is instead to help steer us toward the preferred “age of wisdom” by evaluating the UK’s labour market
through several different lenses. First, I will compare trends in the UK labour market to those in the
US – highlighting how the UK is similar to a country which recently started to tighten monetary policy.
Second, I will discuss several key differences between the labour markets in these two countries – mainly in
1 These numbers are based on projections from the Annual Survey of Hours and Earnings (ASHE) conducted by the ONS and from the
IFS, respectively.

All speeches are available online at www.bankofengland.co.uk/publications/Pages/speeches/default.aspx
3
3
labour market participation, self-employment, migration, and the consistency of the recovery. Third, I will
discuss what this analysis of the two countries’ labour markets implies for wage growth and labour
costs – getting at the heart of how the UK and US labour markets can appear to be at their “best” and “worst”
simultaneously. Finally, I will conclude with implications for monetary policy in the United Kingdom.
1. The UK and US: Similarities
The similarities between the UK and US labour markets are so striking that at times it can be difficult to tell
the data for one country from the other. Just to keep you guessing, I’ll temporarily hide the identification of
each of the countries and look at a number of key trends since 2007 – in both their labour markets and key
aspects of their economies relevant to the labour market. Instead of showing you pictures for the UK and
US, I’ll take Dickens to heart and rename them after two lovely cities in both countries – Dover and Exeter.
And just so you are warned, I’ll ask you in a few minutes if you can guess whether Dover represents the UK
or US – and likewise for Exeter.
To begin, the key macroeconomic statistics and monetary policy responses of both countries – proxied by
Dover and Exeter – have been similar. Figure 1 shows that in both cases, GDP growth plummeted during
the crisis in 2008, had some ups and downs in the initial recovery phase from 2010 through 2013, was fairly
solid for about a year, and then moderated to about 2% oya growth in Q3 2015. The UK and US have been
neck and neck for the honor of being the fastest growing G7 economy in 2014 and 2015 – and probably
2016. Figure 2 shows that both countries lowered their main policy interest rate to about zero as the crisis
unfolded, and did not raise rates for over six years. In December 2015, the US “lifted off” – so I have
consciously stopped this graph in November of 2014 so as not to give away the country/city identity….
Figure 1: Output growth Figure 2: Policy rates
Sources: BEA, ONS and Thomson Reuters Datastream. Sources: Federal Reserve, Bank of England and Thomson
Reuters Datastream.
-7
-6
-5
-4
-3
-2
-1
0
1
2
3
4
2007 2008 2009 2010 2011 2012 2013 2014 2015
GDP (Exeter)
GDP (Dover)
1997 - 2007 Average
1997 - 2007 Average
Percentage change on a year earlier
0
1
2
3
4
5
6
7
2007 2008 2009 2010 2011 2012 2013 2014 2015
Base rate (Exeter)
Base rate (Dover)
1997 - 2007 Average
1997 - 2007 Average
Per cent

All speeches are available online at www.bankofengland.co.uk/publications/Pages/speeches/default.aspx
4
4
The currencies in both countries have also strengthened sharply since the spring of 2013: the dollar by 25%
as of today and sterling by 22% as of its recent peak last summer (although it has since fallen back so that
its overall appreciation since the spring of 2013 is now only 13%). These currency appreciations have
reduced the price of imported goods in each country and dragged on inflation. This drag, combined with
even larger drags from cheaper energy and food, have caused inflation to fall sharply and bounce around
zero over much of 2015. Table 1 shows how strikingly similar the most recent measures of headline and
core inflation are in both countries – although service inflation is somewhat higher in the UK than the US.2
Table 1: Inflationary pressures in the UK
and US
UK US
Inflation
Headline inflation 0.2 0.4
Core inflation 1.4 1.3
Service inflation 2.8 1.9
Peak ERI appreciation
from spring 2013* 22% 25%
*Note that sterling has depreciated since its peak last
summer so that its overall appreciation since the spring
of 2013 is currently only 13%.
Figure 3: Unemployment rate
Sources: BLS, ONS (LFS) and Thomson Reuters Datastream.
Moving to the labour market, the similarities grow even stronger. Figure 3 shows the impressive decline in
the unemployment rate in both countries from post-crisis highs to about 5% in the most recent data. The
unemployment rate in both countries is now around or below the corresponding pre-crisis average (in the
dashed lines calculated over 1997 through 2007). In both countries, the unemployment rate is estimated to
be around the level consistent with “full employment”. Figure 4 provides more detail on which types of
unemployed are finding work based on their duration of unemployment. It shows that the decline in the
unemployment rate has occurred for all groups. This fall has been particularly sharp for the short-term
unemployed, so that this rate is now solidly below pre-crisis averages for both countries. But the
unemployment rates for the medium and long-term unemployed have also declined to reach their pre-crisis
rates in both countries, except for the unemployment rate for the long-term unemployed in Exeter which may
still have some space to fall.3
2 UK headline and core inflation is measured using the CPI, while US inflation is measured with the PCE. I focus on the PCE for the US
as the weights for different sectors – most importantly housing – are closer to those for the UK CPI than the US CPI measure. The PCE measure is also more closely followed by the Federal Reserve Board, and therefore most important for monetary policy. 3 This could also be the case in Dover where the long-term unemployment rate has undergone a structural decline since the 1990s.
4
5
6
7
8
9
10
11
2007 2008 2009 2010 2011 2012 2013 2014 2015
Unemployment rate (Exeter)Unemployment rate (Dover)1997 - 2007 Average1997 - 2007 Average
Per cent

All speeches are available online at www.bankofengland.co.uk/publications/Pages/speeches/default.aspx
5
5
Figure 4a: Unemployment rate, by duration Figure 4b: Unemployment rate, by duration
Sources: BLS, ONS (LFS) and Thomson Reuters Datastream.
Not only are the various unemployment rates and trends similar in the two countries, but Figure 5 shows
there are also similarities in average hours worked. Hours worked fell during the crisis in both countries,
undoubtedly as companies reduced working hours to meet slower demand. Then, average hours in both
countries increased after the crisis, as growth and production picked up. This upward trend has since stalled
and roughly levelled off to around 2014 averages in both countries (albeit with some ups and downs
between). People are working fewer hours on average relative to pre-crisis in both countries (though it is
worth mentioning that average hours were on a downward trend before the crisis).
This trend of lower hours worked could indicate some slack in the labour market if people want to return to
their longer pre-crisis working hours. But survey evidence and the lack of improvement in these measures
over the last two years (while most other aspects of both labour markets have continued to tighten) suggests
that much of these lower hours worked reflects a choice by workers and an equilibrium level. My colleague
on the MPC, Martin Weale gave an excellent speech last week which carefully analysed these trends in
hours worked in the UK. He presented convincing new evidence that the decline in hours worked is due to
income effects (as incomes increase, workers chose to work fewer hours) and demographics (as older
workers prefer to work fewer hours). His analysis suggests that the current level of average hours worked is
around its equilibrium level for the UK at current wage rates.4
4 See Weale (2016). Benito and Saleheen (2013) find that individuals change their hours in response to financial shocks, suggesting
that workers likely increased their hours in the aftermath of the financial crisis, but are now normalizing their work patterns.
0
0.5
1
1.5
2
2.5
3
3.5
4
4.5
5
2007 2008 2009 2010 2011 2012 2013 2014 2015
0 - 6 months (Dover)6 - 12 months (Dover)12 months + (Dover)1997 - 2007 Average1997 - 2007 Average1997 - 2007 Average
Per cent
0.0
1.0
2.0
3.0
4.0
5.0
6.0
7.0
2007 2008 2009 2010 2011 2012 2013 2014 2015
0 - 6 months (Exeter)6 - 12 months (Exeter)12 months + (Exeter)1997 - 2007 Average1997 - 2007 Average1997 - 2007 Average
Per cent

All speeches are available online at www.bankofengland.co.uk/publications/Pages/speeches/default.aspx
6
6
Figure 5: Average hours
Sources: BLS, ONS (LFS) and Thomson Reuters Datastream.
Even if unemployment rates and hours worked are around the levels believed to be “equilibrium”, (i.e., levels
that are sustainable without wages picking up faster than consistent with the inflation target), it is important to
realise that the equilibrium is very difficult to estimate in real time. The structure of the economy and
labour force has changed so sharply over the past decade, that it is impossible to know exactly where
“equilibrium” is and what is sustainable. Fortunately, many economists – including those at the
Bank of England – still exert an impressive amount of effort and the highest quality analysis to try and
pinpoint exactly where this equilibrium point is. But we all appreciate that there are wide uncertainty bands
around these estimates.
Therefore, for additional insight on how close the labour market is to equilibrium, I find it useful to closely
follow measures of labour market “churn” – basically how easy it is for workers to find jobs and for
companies to find workers, as well as if workers are confident enough to quit and switch jobs. Figures 6
through 9 show four of these measures for the US and UK – I mean Dover and Exeter: separations (when an
employee leaves a job for any reason), job-to-job flows (when an employee moves from one job to another),
quits (when an employee quits a job), and vacancies (jobs a company is trying to fill). Each indicator is
graphed as an index set at 100 in the year 2007 in order to adjust for the different size of the two
economies.5 The similar performance of each of these different measures of labour market churn is quite
striking. Each churn measure has improved starkly from its recent crisis lows, with separations and
job-to-job flows currently around 2007 levels in both countries, quits slightly below (especially for Dover) and
vacancies well above for both countries.
5 A related exercise, controlling for employment growth shows similar results.
31.2
31.7
32.2
32.7
33.2
33.7
34.2
2007 2008 2009 2010 2011 2012 2013 2014 2015
Average weekly hours (Exeter)Average weekly hours (Dover)1997 - 2007 Average1997 - 2007 Average
Average hours

All speeches are available online at www.bankofengland.co.uk/publications/Pages/speeches/default.aspx
7
7
Figure 6: Separations Figure 7: Job to Job flows
Figure 8: Quits Figure 9: Vacancies
Sources: BLS, US Census Bureau, ONS and Thomson Reuters Datastream.
Another way of measuring labour market churn, which simultaneously captures tightness from the viewpoint
of both workers and employers, is the Beveridge curve. It shows the relation between the vacancy rate and
the unemployment rate. It is called a “curve” because an economy traditionally moves up and to the left
during recoveries, as the unemployment rate falls and the vacancy rate increases. Then movement stalls at
a peak as the labour market becomes very tight and it is harder for companies to find workers, before moving
down and to the right as the economy slows, the unemployment rate increases, and the vacancy rate falls.
Figure 10 shows very similar patterns for both countries as they have followed the traditional movement
around the “curve” over the past fourteen years. Both countries also show the typical upward shift of the
curve that often occurs after a sharp recession. This upward shift could indicate that the “matching” of
40
50
60
70
80
90
100
110
120
130
2007 2008 2009 2010 2011 2012 2013 2014 2015
Separations (Exeter)
Separations (Dover)Index 2007 Q1 = 100
40
50
60
70
80
90
100
110
120
130
2007 2008 2009 2010 2011 2012 2013 2014 2015
Job to Job (Exeter)
Job to Job (Dover)Index 2007 Q1 = 100
40
50
60
70
80
90
100
110
120
130
2007 2008 2009 2010 2011 2012 2013 2014 2015
Quits (Exeter)
Quits (Dover)
Index 2007 Q1 = 100
40
50
60
70
80
90
100
110
120
130
2007 2008 2009 2010 2011 2012 2013 2014 2015
Vacancies (Exeter)
Vacancies (Dover)
Index 2007 Q1 = 100

All speeches are available online at www.bankofengland.co.uk/publications/Pages/speeches/default.aspx
8
8
unemployed workers to company vacancies is more difficult, a typical result of a recession when a larger
share of the unemployed have been out of work for a longer period and therefore have more difficulty finding
employment.6 This increase in skill mismatch could also reflect a longer term structural mismatch between
the types of jobs created and skills of the workforce, or a more temporary mismatch with the existing skills of
new entrants into the labour force (such as through younger entrants or migration). There is also preliminary
evidence that Dover is near this “stall” point, indicating the recovery in the labour market is largely complete.
Figure 10a: Beveridge curve, Dover Figure 10b: Beveridge curve, Exeter
Sources: BLS, ONS and Thomson Reuters Datastream.
I could continue to show you graphs such as this where it is hard to differentiate between these
two cities – or countries – for the rest of my time here today. But I’m fairly sure that you have absorbed the
key point: the evolution of the US and UK labour markets has been strikingly similar by most key measures.
There is one other set of similar indicators, however, that I would be remiss if I did not show you. They are at
the heart of the current puzzle in these labour markets: slow wage growth. When labour markets appear to
be as tight and close to equilibrium levels (to the best that we can measure them) as we have just seen in
these two countries, we generally see a sharp pickup in wages. Yet, as shown in Figure 11a, any upward
momentum in wage growth has stalled at around 2% in each country as of Q3 based on the most popular
and timely wage measure – for average weekly earnings. Granted, this measure has been more volatile and
has recently been higher in Dover than in Exeter. But what is particularly striking is that wage growth
remains over a percentage point below pre-crisis averages in both countries.
6 Diamond and Sahin (2014) discuss these shifts in the Beveridge curve. Hobijn and Sahin (2012) argue that skill mismatch was one of
the factors playing a role in the shift of the Beveridge curve in the US and UK. Patterson et al. (2013) also find that matching difficulties rose sharply during the recession in the UK. However, there is also evidence that the fall in matching efficiency may not be entirely attributable to the crisis, see e.g. Hall and Schulhofer-Wohl (2015) or Speigner (2015).
1.4
1.6
1.8
2.0
2.2
2.4
2.6
4 5 6 7 8 9
Vacancy rate, per cent
Unemployment rate, per cent
2015
2014
2013
2002-2008
2009
2010-2012
1.5
2.0
2.5
3.0
3.5
4.0
4 6 8 10
Vacancy rate, per cent
Unemployment rate, per cent
2015
2014
2013
2002-2008
2009
2010
2011
2012

All speeches are available online at www.bankofengland.co.uk/publications/Pages/speeches/default.aspx
9
9
By now you may be thinking that you’ve figured out which of these lines is the US and which is the UK.
Dover (red) must be the US because wage growth must have been stronger there to justify their earlier rate
hike? Or were you thinking that Dover must be the UK because wages in the UK began to accelerate last
year? Before you become too confident in either guess, it is important to remember that there are many
different ways to measure wages – and they do not always send the same message. For example,
Figure 11b shows wage growth in the two countries using measures which go some way toward controlling
for changes in the composition of the workforce.7 Now wage growth in Exeter recently appears stronger (and
increased more last year) than in Dover. The key message from the last graph about both countries still
remains – wage growth is over a percentage point below the pre-crisis averages that were previously
consistent with inflation around 2%. But which country is represented by which city is not quite so clear….
Figure 11a: Average weekly earnings Figure 11b: Median growth rate of earnings
Sources: BLS, ONS and Thomson Reuters Datastream. Sources: Federal Reserve Bank of Atlanta and ONS (Economic
Review 2015).
Adding to the confusion, other measure of pay growth have suggested that wage growth may not be quite as
dismal, and some measures could even be described as robust in both countries and above pre-crisis
averages. For example, Figure 11c shows average hourly earnings, which accounts for the changes in
average hours worked in both countries (as shown in Figure 5). Figure 11d shows average growth in real
wages, which accounts for low headline inflation. As of Q3, average hourly earnings growth had picked up
sharply in Dover, and real wage growth had increased in both countries to above pre-crisis averages.8 From
the perspective of workers, real wage growth is the best measure of the improvement in their living standards
as it best captures how much more they can purchase each month after adjusting for any changes in prices.
7 The line for the US measures wage growth based on data compiled by the Federal Reserve Bank of Atlanta and the line for the UK is
based on data from the ONS Economic Review (2015). 8 Each of these figures is based on quarterly data and therefore does not include data for Q4 2015. The discussion in Section 3 will
incorporate more timely wage data calculated using the most recent monthly information from November when possible.
-3
-2
-1
0
1
2
3
4
5
6
7
2007 2008 2009 2010 2011 2012 2013 2014 2015
AWE (Exeter)AWE (Dover)1997 - 2007 Average1997 - 2007 Average
Percentage change on a year earlier
1
2
3
4
5
2007 2008 2009 2010 2011 2012 2013 2014 2015
ExeterDover2002-2007 average2002-2007 average
Percentage change on a year earlier

All speeches are available online at www.bankofengland.co.uk/publications/Pages/speeches/default.aspx
10
10
It is unclear, however, whether the pick-up in real wage growth will prove persistent. Is this simply an artifact
of low inflation combined with moderate pay growth, temporarily boosting real wages? Or will companies
respond to any pickup in inflation with higher nominal pay growth and therefore maintain this robust growth in
real wages?
Figure 11c: Average hourly earnings Figure 11d: Real wage growth
Sources: BLS, ONS and Thomson Reuters Datastream. Sources: BLS, ONS and Thomson Reuters Datastream.
Let me summarise what we have learned from all of these indicators. There are striking similarities in
macroeconomic and labour market developments in the UK and US. Both countries have experienced sharp
recoveries in GDP to solid – albeit not spectacular – growth rates since 2013. Both have kept policy rates
near zero since the crisis – with only one 25bps increase by the US last month. Both have headline inflation
just above zero today, due in part to sharp falls in energy prices, plus additional drags from food prices and
currency appreciation. Both have core inflation rates of 1.3% or 1.4%. Both have continued to experience
rapid job creation, sharp falls in unemployment to around 5%, and steady improvements in labour market
churn – all to around the point where wages tend to increase sharply. Yet headline wage growth remains
slow in each country and not consistent with the other measures indicating a tight labour market.
Wage growth by other measures, however, such as adjusted for composition effects, hourly effects, and
inflation, has been stronger and somewhat more consistent (albeit to varying degrees), with the other
indicators suggesting that both labour markets are near or at equilibrium.
-2
-1
0
1
2
3
4
5
6
7
2007 2008 2009 2010 2011 2012 2013 2014 2015
Average hourly earnings (Exeter)Average hourly earnings (Dover)1998-2007 average1998-2007 average
Percentage change on a year earlier
-7
-6
-5
-4
-3
-2
-1
0
1
2
3
4
2007 2008 2009 2010 2011 2012 2013 2014 2015
Real wages (Exeter)Real wages (Dover)1998-2007 average1998-2007 average
Percentage change on a year earlier

All speeches are available online at www.bankofengland.co.uk/publications/Pages/speeches/default.aspx
11
11
2. The UK and US: Differences
Is anyone ready to guess which city is which country? Is Dover the UK or US? For those of you who follow
the twists and turns of this labour market data, a few charts should have provided some hints. I’ll now
highlight four major differences between the UK and US labour markets: in participation, self-employment,
migration, and the continuity in the labour market recovery. This should take you out of your Dickens-like
misery, as by each of these measures it is easy to identify the UK.
First – and most striking – are the different labour force participation trends in the two countries. Labour
force participation is defined as the share of the working age population that is either in work or looking for
work. The black line in Figure 12a shows that in Dover, labour force participation has basically been steady
over the last eight years around its current participation rate of 63.5%. In contrast, Figure 12b shows that in
Exeter, labour force participation has continually declined over the last eight years by almost 3.5pp to reach
a low of 62.6% today. As you’ve probably guessed, this means that Dover is the UK and Exeter is the US.
Figure 12a: Change in participation rate, by
demography, Dover
Figure 12b: Change in participation rate, by
demography, Exeter
Sources: BLS, ONS, Thomson Reuters Datastream and Bank of England calculations.
What has driven this sharp divergence in labour market participation in two countries whose labour markets
appeared so similar by most other measures? Both countries are aging at roughly similar rates – a trend
which tends to naturally decrease participation rates over time. This automatic decline in participation rates
that would be expected to occur just due to demographic trends – and assuming no other changes in
participation rates by age group – is captured in the two blue bars in Figures 12a and 12b. This shows that
this natural demographic effect would have been expected to decrease UK participation by around 1.5pp
-2.0
-1.5
-1.0
-0.5
0.0
0.5
1.0
1.5
2.0
2007 2008 2009 2010 2011 2012 2013 2014 2015
Higher participation of 16-65Higher participation rates of 65+Demographics: shifts across 16-65 year oldsDemographics: larger share of 65+Change in participation rate
Change in Dover participation rate since 2007 Q1, pp
-4.5
-4.0
-3.5
-3.0
-2.5
-2.0
-1.5
-1.0
-0.5
0.0
0.5
2007 2008 2009 2010 2011 2012 2013 2014 2015
Lower participation of 16-65Higher participation rates of 65+Demographics: shifts across 16-65 year oldsDemographics: larger share of 65+Change in participation rate
Change in Exeter participation rate since 2007 Q1, pp

All speeches are available online at www.bankofengland.co.uk/publications/Pages/speeches/default.aspx
12
12
from 2007 through 2015, a little less than the 1.8pp drag in the US.9 Partially counteracting this, participation
for older workers has increased in both countries. Bank of England analysis suggests that this reflects some
combination of factors that are both structural (e.g., improved longevity, changes to the state pension age
and out-of-work benefits) and cyclical (e.g., delayed retirement to bolster pension incomes).10
This increased
participation of older workers is shown in green on the graph – and has been larger in the UK than the US
(although participation rates for older cohorts started at lower levels in the UK).
Even more important in explaining the differences between countries, however, is the yellow bar – the
infamous “other”. What could explain this “other”? One factor, which has undoubtedly played some role, is
different changes in government benefit policy in the two countries. Both countries increased fiscal stimulus
during the crisis, but through different programs and approaches. A detailed explanation of these
changes – and how they could have interacted with the labour market and participation – would require a
speech unto itself (and probably more than one). For those of you interested in details, Mulligan (2015)
provides an excellent and thorough analysis of the changes in UK and US benefit policies since 2007.
It shows that the UK programs were designed in a way that were more stringent but reduced marginal tax
rates on both personal income and consumption, possibly increasing incentives to work for some people.
UK programs also reduced the costs to companies for employees, thereby providing an incentive to keep
workers. In contrast, the changes to US benefit policy over this period slightly increased the cost to
employers for workers, and substantially reduced the incentives to work – such as by easing the eligibility for
benefits and increasing the implicit tax rate for moving from unemployment to work. Although it is difficult to
calculate the exact effect of any of these different policies on labour force participation, especially given other
policy and economic changes at this time, it is likely that they – and especially their combined effect – may
have increased the incentive to work and corresponding employment rate in the UK relative to in the US.
Related to these divergent trends in labour force participation is another striking difference between the UK
and US labour markets – the increased share of the UK workforce that is self-employed.11
Many of us have
an image of the US as the land of the serial entrepreneur – often a group of young men (unfortunately not
nearly as often women) with a dream who start a company in a garage. Companies such as Apple,
Microsoft, Amazon and Harley Davidson come to mind. Try googling “companies started in a garage”
– and you’ll be surprised not only by how many websites you find answering this question, but that most of
them are US companies. Figure 13 suggests, however, that UK workers are actually more likely to be
self-employed, and this proportion has increased noticeably since the crisis to almost 15% today. In
contrast, the share of self-employed in the US has not only remained well below UK levels, but fallen a bit
since 2007 to 6.3% today. Granted, many of the people counted as self-employed may not be trying to start
the next Google or Apple – and are probably not working in a garage. Data for the UK suggests that many of
9 The predominance of the darker blue bars for the UK occurs because the UK is experiencing its demographic drag a little later than the
US, so that the main factor reducing participation occurs through a larger share of older workers. 10
See ‘Explaining recent trends in participation’ in the November 2014 Inflation Report. 11
There has also been an increase in part-time workers in both the UK and US, and a continuation of a longer-term trend of having a higher share of part-time work in the UK than the US. The relative differential between the two countries has not changed substantially, however, so I do not discuss this as a recent difference in the evolution of the two countries’ labour markets.

All speeches are available online at www.bankofengland.co.uk/publications/Pages/speeches/default.aspx
13
13
these self-employed are people running small businesses in the construction sector or contracting out their
expertise on a project-by-project basis – such as for drafting, consulting or other professional and technical
fields. Nonetheless, this is a noteworthy difference between the US and UK labour markets.
A third difference in these labour markets is the role of migration. Figure 14 shows net migration as a share
of the working population based on data from the OECD (with ONS projections). This migration share was
substantially higher for the US than the UK through the 1990s and early 2000s, and higher for the UK since
about 2005. The differential between migration shares in the two countries has ebbed and flowed over time,
with almost identical shares as recently as 2013. In 2015 net migration as a share of the working-age
population is expected to be about 0.4pp higher in the UK than the US.
Figure 13: Self employment Figure 14: Net migration
Sources: BLS, ONS (LFS) and Thomson Reuters Datastream. Sources: OECD, BEA, ONS and Bank of England calculations.
A final difference between the two countries is more speculative – but worth considering. By some
measures, the US recovery has been more steady and consistent, while the UK recovery began in fits and
starts and took longer to gain momentum and become sustained. For example, return to Figure 8 showing
the number of quits – a measure of workers’ confidence that they will be able to find another job. In the US
(Exeter), this measure started to turn around as early as mid-2009, and has steadily improved since then.
In contrast, the number of quits in the UK (Dover) showed signs of starting to turn around at the same time,
but then fell back sharply at the start of 2011, and stayed at depressed levels for several months before
restarting its gradual improvement. Similarly, Figure 10 with the Beveridge curves shows the US moving
steadily through the curve in the traditional progression from recession to recovery, while the UK movement
stalled from 2010 through 2012.
6
7
8
9
10
11
12
13
14
15
16
2007 2008 2009 2010 2011 2012 2013 2014 2015
Self employed (US)Self employed (UK)2000 - 2007 Average1997 - 2007 Average
Per cent
-0.1
0.0
0.1
0.2
0.3
0.4
0.5
0.6
0.7
0.8
0.9
1990 1995 2000 2005 2010 2015
US UKProjection Projection Per cent
of working population

All speeches are available online at www.bankofengland.co.uk/publications/Pages/speeches/default.aspx
14
14
Plotting the four measures of labour market churn together on one chart makes the consistency of the
recovery in the US labour market clearer, especially when compared to the stops and starts in the UK.
For example, Figure 15 shows a clear turning point in the US indicators in 2009 before fairly steady upward
momentum in each measure. Drawing a trend line doesn’t require any fancy econometrics. In contrast,
the UK indicators show more starts and stalls before embarking on a path of continued improvement. There
is still clear improvement since 2014 in all indicators – but the positive momentum has only been established
for a shorter period and the recovery appears to have stalled around 2010 to 2012. This shorter period of
sustained momentum could mean less confidence in the UK recovery until it has been in place for longer.12
Figure 15a: Labour market churn, UK Figure 15b: Labour market churn, US
Sources: ONS and Thomson Reuters Datastream. Sources: BLS, US Census Bureau and Thomson Reuters
Datastream.
These four differences in the UK and US labour markets are not independent and may have some important
interrelationships. For example, one common thread may be the impact of the recent challenges in the euro
area and this region’s closer links with the UK than the US. The fits and starts of the UK labour market
recovery – especially around 2010 to 2012 – may be related to uncertainty about the euro area over this
period. Moreover, the academic literature suggests that weaker economic growth and job creation is one
important factor “pushing” migrants to other countries; this suggests that the weaker recovery in the euro
area after 2010 may have contributed to increased migration into the UK.
The differences between UK and US labour force participation rates and self-employment rates could be
linked. UK participation rates may have been bolstered relative to those in the US by the increased tendency
to work as self-employed in the UK. Some workers may want to work, but not full time, possibly because
they are around retirement age or have family-care responsibilities. This is supported by the evidence in
12
Some of this difference between countries could be due to the natural volatility of each series used. But, even after accounting for this possibility, the UK recovery still appears less metronomic.
30
40
50
60
70
80
90
100
110
120
130
2007 2008 2009 2010 2011 2012 2013 2014 2015
Separations (UK)Job to Job (UK)Quits (UK)Vacancies (UK)
Index 2007 Q1 = 100
30
40
50
60
70
80
90
100
110
120
130
2007 2008 2009 2010 2011 2012 2013 2014 2015
Separations (US)Job to Job (US)Quits (US)Vacancies (US)
Index 2007 Q1 = 100

All speeches are available online at www.bankofengland.co.uk/publications/Pages/speeches/default.aspx
15
15
Figures 16a and 16b which breaks out the increase in the self-employment share of the UK population driven
by males/females and older workers. It shows that a greater tendency for females to become self-employed
has driven over half of the increase in self-employment in the UK. Workers over 65 have also driven a
significant share of this increase.13
These groups of workers may have been less likely to participate in the
labour force if they did not have the flexibility of self-employment.
Figure 16a: Change in self-employment rate, by
gender
Figure 16b: Change in self-employment rate, by
age
Sources: ONS, Thomson Reuters Datastream and Bank of
England calculations.
Sources: ONS, Thomson Reuters Datastream and Bank of
England calculations.
A final linkage between these differences between the UK and US labour markets is the role of migration and
the different characteristics of migrants relative to citizens.14
Figures 17a and 17b show the participation
rates of citizens and non-citizens in the UK and US.15
In both countries, citizens have lower participation
rates than migrants. In the US, both groups show a similar, steady decline in participation rates since 2007,
as documented in Figure 12b for the full population. In contrast, in the UK the participation rate of
UK-citizens has been fairly steady, but that for migrants has increased quite sharply (from less than 68% in
2007 to above 70% in 2014).
13
See also ‘Self-employment: What can we learn from recent developments?’ in Bank of England Quarterly Bulletin, 2015Q1. 14
See Nickell and Saleheen (2015) for information on the characteristics of migrants versus native-born in the UK. 15
These data refer to UK citizens and non-UK citizens; and to native and foreign-born for the US.
-0.5
0.0
0.5
1.0
1.5
2.0
2007 2008 2009 2010 2011 2012 2013 2014
More males work as self-employed
More females work as self-employed
More females in the workforce
Change in self-employed percentage of the labour force
Change in UK self employed as percentage of the labour force since 2007, pp
-0.5
0.0
0.5
1.0
1.5
2.0
2007 2008 2009 2010 2011 2012 2013 2014
Other
More 65+ work as self-employed
More workers aged 65+
Change in self-employed percentage of the labour force
Change in UK self employed as percentage of the labour force since 2007, pp

All speeches are available online at www.bankofengland.co.uk/publications/Pages/speeches/default.aspx
16
16
Figure 17a: UK participation rates, by citizenship Figure 17b: US participation rates, by country of
birth
Sources: ONS and Thomson Reuters Datastream.
Source: BLS.
Figure 17c: UK self-employment rates, by
citizenship
Figure 17c shows similar trends for the probability of
being self-employed in the UK – with a sharper
increase in this share for migrants.16
(Comparable
data was not available for the US.) These different
trends in labour force participation and
self-employment for migrants relative to UK citizens
could reflect a number of factors. For example, the
higher participation of migrants could reflect the fact
that migrants are more likely to be working age17
or
that a large share of migrants into the UK come with
a job.18
Sources: ONS and Thomson Reuters Datastream.
Whatever the reason for these differences, straightforward algebra shows that if the share of migrants
relative to the working population increases, the fact that migrants are more likely to participate in the labour
force and be self-employed will generate an automatic compositional effect that increases the participation
rate and self-employment rate for the population as a whole. Figures 18a and 18b show how these
compositional effects linked to migration have affected the participation rates in the UK and US.
16
However, the share of self-employment of migrants has been relatively volatile over the last 15 years. 17
The share of migrants that are aged 25 to 49 years old in the population aged above 16 is 67%, as compared to only 39% for UK citizens. Source: LFS. 18
The International Passenger Survey suggests that more than 60% of migrants arrive to the UK with a definite job.
62
63
64
65
66
67
68
69
70
71
2007 2008 2009 2010 2011 2012 2013 2014
Non-UK citizenshipUK citizenship Per cent
62
63
64
65
66
67
68
69
2007 2008 2009 2010 2011 2012 2013 2014
Foreign bornNative
Per cent
11
12
13
14
15
16
17
2007 2008 2009 2010 2011 2012 2013 2014
Non-UK citizenship
UK citizenshipPer cent

All speeches are available online at www.bankofengland.co.uk/publications/Pages/speeches/default.aspx
17
17
The effects have been minimal in the US, but in the UK the increase in migrants (that are more likely to
participate in the workforce, in green) combined with the increased participation rates of migrants over time
(in red) has provided a boost to the UK participation rate. In fact, this boost almost entirely balances the
decrease in participation by UK citizens (largely from aging). While immigration was a key factor in
supporting the much stronger participation rate in the UK labour market, the larger drag from natives’ lower
participation in the US is also important in explaining the differences across the two countries.
Figure 18a: UK change in participation rate, by
citizenship
Figure 18b: US change in participation rate, by
country of birth
Sources: ONS, Thomson Reuters Datastream and Bank of England calculations.
Sources: BLS, Thomson Reuters Datastream and Bank of England calculations.
Figure 19: UK change in self-employment, by
citizenship
Data is not available to do the same type of
comparison for the role of migrants in the different
self-employment rates in the two countries, but
Figure 19 performs the same calculation to show that
the increase in self-employment among migrants has
also contributed meaningfully to the increase in
self-employment documented in the UK (albeit not by
as much as for participation).
Sources: ONS, Thomson Reuters Datastream and BoE calculations.
-0.6
-0.4
-0.2
0.0
0.2
0.4
0.6
2007 2008 2009 2010 2011 2012 2013 2014
UK citizens participate lessNon-UK citizens participate moreMore non-UK citizensChange in participation rate
Change in UK participation rate since 2007, pp
-3.5
-3.0
-2.5
-2.0
-1.5
-1.0
-0.5
0.0
0.5
2007 2008 2009 2010 2011 2012 2013 2014
Native citizens participate lessForeign born citizens participate lessMore foreign born citizensChange in participation rate
Change in US participation rate since 2007, pp
-0.5
0.0
0.5
1.0
1.5
2.0
2007 2008 2009 2010 2011 2012 2013 2014
More UK citizens are self-employed
More non-UK citizens are self-employed
More non-UK citizens
Change in self-employed percentage ofthe labour force
Change in UK self employed as percentage of the labour force since 2007, pp

All speeches are available online at www.bankofengland.co.uk/publications/Pages/speeches/default.aspx
18
18
Where does this leave us? The US and UK labour markets are strikingly similar by most measures. But
these two labour markets also show differences in four key trends and characteristics – some of which are
related. The UK has experienced a greater increase in labour force participation, self-employment, and
migration, but it has also had a shorter period of sustained improvement in the labour market.
3. The UK and US: Implications for Wages and Inflation
By now, I may have buried you in enough statistics and graphs that you have forgotten why we are going
through this exercise. Why are we spending so much time looking at these details of the labour market?
The main reason is straightforward: labour market developments are critical to predicting where inflation is
going in the medium term, and the primary target of the Monetary Policy Committee is to maintain inflation
around our 2% target sustainably. Since any adjustments in monetary policy take one to two years to be
fully effective, that means we need to set monetary policy based on where we think inflation will be in the
next few years – instead of where inflation is today.
Inflation is extremely hard to predict with accuracy.19
This is true around the world, and especially in the UK
where it can move sharply due to unexpected shocks from abroad. This challenge is palpable today;
seven-eighths of the deviation of inflation from the 2.0% target is due to movements in the prices of energy,
food and other goods. After looking through these types of external and more temporary shocks, a critically
important determinant of the more persistent and predictable component in inflation is developments in the
labour market. Therefore, much of the task of predicting inflation boils down to a task of understanding the
labour market.
If you followed that logic chain, however, you will have noticed that there is still one piece of this chain that is
missing. How does our analysis of the UK and US labour markets relate to future wage growth, labour costs
and inflation in these countries?
Let’s review what we’ve learned about the US and UK labour markets to see if we can answer this question.
Since I’ve covered so much material, I’ll summarize the results with colour coding in Table 2. For each
measure, green indicates that slack still exists; orange indicates that the measure is almost at equilibrium
and any remaining slack is on track to disappear soon; and red indicates a labour market that is already
around equilibrium or tighter. To assess equilibrium, I’ll compare current levels to pre-crisis averages or
2007 – a year when the labour market was probably too “tight”. This approach is far from perfect – but given
the challenges in calculating equilibrium for any of these measures today, this approach will be biased
toward finding any slack that might still exist by using a very tight labour market as the baseline.
19
The Bank of England’s Independent Evaluation Office’s ‘Evaluating Forecast Performance’ from November 2015 shows the MPC and private forecasters’ inflation forecast errors since 1997. A recent article in the Economist (January 9, 2016) also shows the challenges in forecasting.
All speeches are available online at www.bankofengland.co.uk/publications/Pages/speeches/default.aspx
19
19
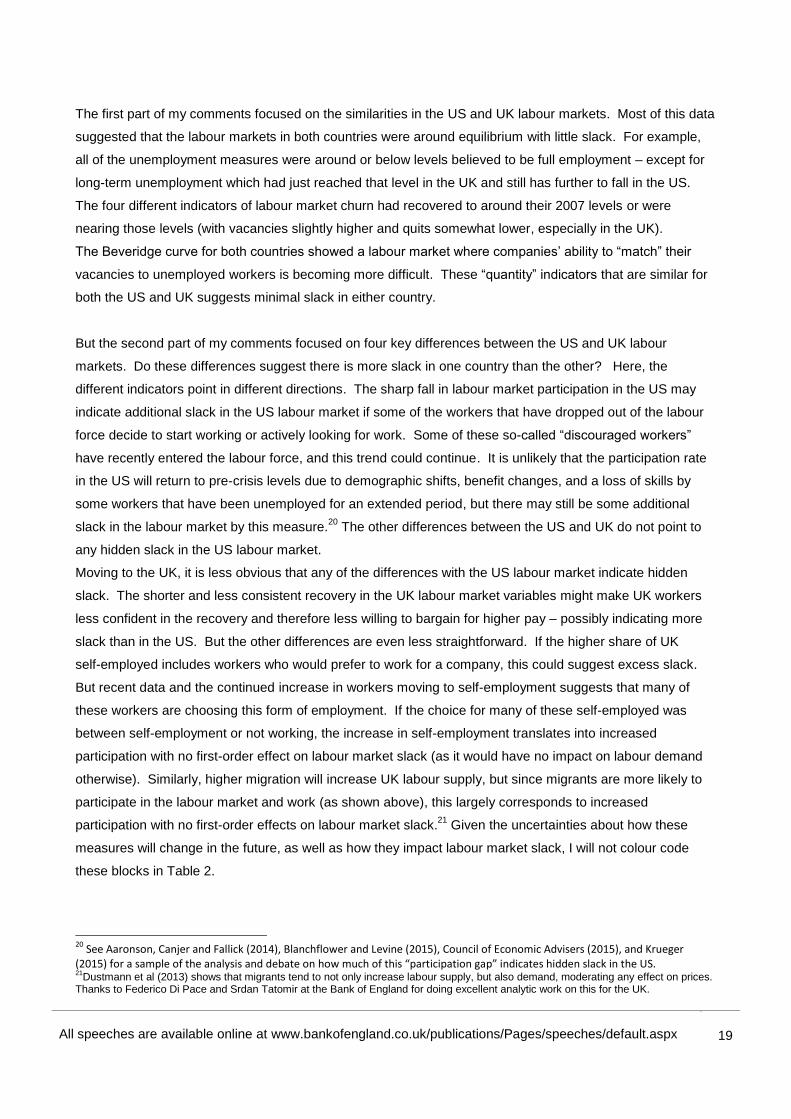
The first part of my comments focused on the similarities in the US and UK labour markets. Most of this data
suggested that the labour markets in both countries were around equilibrium with little slack. For example,
all of the unemployment measures were around or below levels believed to be full employment – except for
long-term unemployment which had just reached that level in the UK and still has further to fall in the US.
The four different indicators of labour market churn had recovered to around their 2007 levels or were
nearing those levels (with vacancies slightly higher and quits somewhat lower, especially in the UK).
The Beveridge curve for both countries showed a labour market where companies’ ability to “match” their
vacancies to unemployed workers is becoming more difficult. These “quantity” indicators that are similar for
both the US and UK suggests minimal slack in either country.
But the second part of my comments focused on four key differences between the US and UK labour
markets. Do these differences suggest there is more slack in one country than the other? Here, the
different indicators point in different directions. The sharp fall in labour market participation in the US may
indicate additional slack in the US labour market if some of the workers that have dropped out of the labour
force decide to start working or actively looking for work. Some of these so-called “discouraged workers”
have recently entered the labour force, and this trend could continue. It is unlikely that the participation rate
in the US will return to pre-crisis levels due to demographic shifts, benefit changes, and a loss of skills by
some workers that have been unemployed for an extended period, but there may still be some additional
slack in the labour market by this measure.20
The other differences between the US and UK do not point to
any hidden slack in the US labour market.
Moving to the UK, it is less obvious that any of the differences with the US labour market indicate hidden
slack. The shorter and less consistent recovery in the UK labour market variables might make UK workers
less confident in the recovery and therefore less willing to bargain for higher pay – possibly indicating more
slack than in the US. But the other differences are even less straightforward. If the higher share of UK
self-employed includes workers who would prefer to work for a company, this could suggest excess slack.
But recent data and the continued increase in workers moving to self-employment suggests that many of
these workers are choosing this form of employment. If the choice for many of these self-employed was
between self-employment or not working, the increase in self-employment translates into increased
participation with no first-order effect on labour market slack (as it would have no impact on labour demand
otherwise). Similarly, higher migration will increase UK labour supply, but since migrants are more likely to
participate in the labour market and work (as shown above), this largely corresponds to increased
participation with no first-order effects on labour market slack.21
Given the uncertainties about how these
measures will change in the future, as well as how they impact labour market slack, I will not colour code
these blocks in Table 2.
20
See Aaronson, Canjer and Fallick (2014), Blanchflower and Levine (2015), Council of Economic Advisers (2015), and Krueger (2015) for a sample of the analysis and debate on how much of this “participation gap” indicates hidden slack in the US. 21
Dustmann et al (2013) shows that migrants tend to not only increase labour supply, but also demand, moderating any effect on prices. Thanks to Federico Di Pace and Srdan Tatomir at the Bank of England for doing excellent analytic work on this for the UK.

All speeches are available online at www.bankofengland.co.uk/publications/Pages/speeches/default.aspx
20
20
The indicators in Table 2 that are colour-coded send a clear message - the two labour markets are very
“hot”; the majority of quantity indicators suggest that the UK and US markets are around equilibrium and very
little slack remains. This is the point when wages would normally begin to increase quickly. This is also
where things get more complicated.
Table 2: Tying it All Together: Slack in the UK and US Labour Markets
UK US
Labour Market Quantities: Similarities
Unemployment
Overall unemployment rate
Short-term unemployment
Medium-term unemployment
Long-term unemployment
Hours worked
Labour market churn
Separations
Job-to-job flows
Quits
Vacancies
Beveridge curve
Labour Market Quantities: Differences
Participation rates
Self-employment ? ?
Migration ? ?
Consistency/length of recovery
Table 3 shows a range of measures of wage inflation in the US and UK. The top two lines show the most
commonly cited measures – average weekly earnings for the whole economy and the private sector. These
measures of wage growth are still well below historic averages, and well below what would normally occur in
labour markets that are otherwise fairly close to equilibrium. This surprisingly low nominal wage growth is
not unique to the UK and US and is shared with other developed economies. For example, Figure 20 shows
the residuals from estimating a simple wage equation for each of the major developed economies in the
G7.22
The residual from these estimates is currently negative for 6 of the 7 countries, and the average
(PPP-weighted) residual of around -0.5% suggests that wage growth in the G7 is 0.5pp lower than would be
expected after controlling for the economic environment in each country. This negative residual and
corresponding unexplained weakness in wages for most G7 economies has existed for around 2 ½ years.23
22
This model controls for country characteristics, such as the amount of slack in the labour market and productivity growth. 23
See Gilhooly, Kindberg-Hanlon and Wales (2015).

All speeches are available online at www.bankofengland.co.uk/publications/Pages/speeches/default.aspx
21
21
Table 3: Different Measures of Wage Inflation in the UK and US
UK US
Historic
average
Q1
2015
Q2
2015
Q3
2015 Latest
Historic
average
Q1
2015
Q2
2015
Q3
2015 Latest
AWE all 4.4 2.3 2.6 3.0 2.0 NA NA NA NA NA
AWE private sector 4.5 2.9 2.9 3.4 2.2 3.2 2.3 1.7 1.9 1.9
AHE* 4.8 2.1 2.8 3.5 2.6 3.4 1.9 1.9 2.0 2.1
Compensation 4.5 1.4 2.9 2.9 2.9* 3.9 2.5 3.1 3.4 3.4*
Composition adjusted 4.4 3.2 3.0 3.8 3.8* 3.6 2.6 2.0 1.9 1.9*
Median growth rate
of earnings 4.5 NA NA NA 2.1* 4.0 NA NA NA 3.3*
Real wage** 2.9 2.7 3.0 3.4 2.3 1.1 2.1 1.5 1.6 1.6
Real consumption
wage 2.9 1.3 2.9 2.9 2.9* 1.8 2.3 2.9 3.1 3.1*
Average 4.1 2.3 2.8 3.3 2.6 3.0 2.3 2.2 2.3 2.5
Sources: BEA, BLS, ONS, Thomson Reuters Datastream and Bank of England calculations. “Latest” refers to the three month
average to November. * indicates latest quarterly or annual data are used. Measures presented are intended to be as comparable as
possible across countries. Composition-adjusted refers to the Employment Cost Index in the US. Micro-matched survey refers to the
ASHE in the UK and a measure of median wage growth released by the Atlanta Federal Reserve in the US.
Figure 20: Unexplained component of nominal
wage growth in G7 economies
There are a number of possible reasons why wage
growth has been slower than expected given recent
developments in labour markets. I’ll focus on the
five most relevant for the UK and US. First, the
changing composition of the workforce (such as
more recent hires being younger, less experienced,
or in occupations that pay less) would naturally slow
wage growth, as discussed in Broadbent (2015).
Bank of England research finds this effect reduced
UK wages by 0.8pp in 2015Q3. Second, and
related, if there is a fall in average hours worked
(which Figure 5 suggests has occurred in the US
and the UK relative to historic averages), this would
automatically reduce measures of weekly wages
(which do not adjust for hours) for those on hourly
contracts/paid by the hour.
Sources: OECD, Eurostat, ONS, national sources, Thomson Reuters Datastream and Bank of England calculations. Note: Wage equations estimated over 1995-2015 using
lagged variables as follows: ∆𝑊𝑡 = 𝛼 − 𝛽(𝑊𝑡−1 − 𝑑𝑒𝑓𝑙𝑎𝑡𝑜𝑟 − 𝑘 ∙ 𝑝𝑟𝑜𝑑𝑡−1) − 𝛾𝑢𝑔𝑎𝑝𝑡 +𝛿∆𝑝𝑟𝑜𝑑𝑡 + 𝜉∆𝑊𝑡−1 + 휀𝑡.
-5
-4
-3
-2
-1
0
1
2
3
4
20
00
20
01
20
02
20
03
20
04
20
05
20
06
20
07
20
08
20
09
20
10
20
11
20
12
20
13
20
14
20
15
G7 Swathe
PPP-weighted average
Percentage point contribution

All speeches are available online at www.bankofengland.co.uk/publications/Pages/speeches/default.aspx
22
22
Third, today’s low headline inflation may reduce the pressure on companies to increase wages as workers’
real incomes and purchasing power are currently boosted by cheaper energy and food24
. Fourth, there could
be more slack in the labour market then the analysis above suggests (such as due to a lower equilibrium
unemployment rate), putting less upward pressure on wages. Finally, changes in economic structure and in
the global economy more broadly may have reduced the bargaining power of workers (such as through
reduced unionization or greater international competition).
Which of these factors is behind the slow AWE wage growth in the US and UK is critically important to
understand how recent trends in the labour market will translate into higher wages and inflation in the future.
Some of these hypotheses are difficult to test – but several pieces of evidence suggest that the first three
factors have played at least some role. More specifically, other measures of wage growth in Table 3 adjust
for these factors: for compositional effects, for hours worked, and for current inflation (real wages). In many
of these cases, wage growth has been stronger than implied by the headline figures that do not incorporate
any of these factors. For example, composition-adjusted wage growth for the UK was 3.8% in Q3 (the latest
available) – which was almost 1pp higher than AWE wage growth at that time. Some of these measures are
difficult to calculate and can be volatile25
– so I do not want to put too much weight on any one measure.
And even with these adjustments, the average of these wage measures suggests that wage growth is still
below pre-crisis averages in both countries. Wage growth also slowed in the UK at the end of the year
by each of the measures for which we have more timely data (although has been more stable in the US).
There is still some puzzle as to why wage growth does not have more momentum in both countries with
labour markets as tight as shown above. But the comparisons in Table 3 also suggest that some of the
headline weakness likely results from factors that are likely to be temporary or have little effect on
labour costs.26
To figure out exactly what this means for inflation and monetary policy, it is important to look at one more set
of indicators. And I promise that this is the last table I’ll show you. When evaluating how wages will translate
into consistent inflationary pressures, it is important to adjust payments to workers by any changes in worker
productivity. If workers are more efficient, they can earn more without increasing cost pressures. Therefore,
an important statistic when assessing how labour market developments will be feeding through into inflation
is to assess developments in unit wage costs and unit labour costs (which also include other costs such as
pensions). Both measures adjust for worker productivity. We don’t talk about these measures as often as
the statistics come out with more delay than many of the wage indicators, and they are often subject to
revision when the highly imperfect productivity data is revised.
Table 4 shows several different measures of unit wage and unit labour costs for both the US and UK.
24
See Forbes (2015) and Carney (2016), which both make this argument and report different estimates showing that lagged inflation can significantly affect domestic costs and wage growth. 25
For example, hourly wage growth is calculated based on the volatile measure of hours per week, and the composition-adjusted wage measures rely on a model of how different worker characteristics affect wages. 26
More specifically, composition and hourly effects would largely be balanced by reduced productivity growth. See Broadbent (2015) for more detail.

All speeches are available online at www.bankofengland.co.uk/publications/Pages/speeches/default.aspx
23
23
By each of these measures, unit costs have increased from Q1 to Q3 in 2015 (data for Q4 is not yet
available). In some cases the increase is quite sharp – with unit labour costs more than doubling (albeit from
low levels) for the three different measures for the UK. The reason why these costs have all increased –
despite more moderate wage growth – is the productivity slowdown in each country. Figure 21 breaks down
unit wage costs into compensation per employee and labour productivity (where a more negative number
indicates higher productivity). It shows how productivity growth has been much lower than in the past,
thereby boosting unit wage costs in both countries despite only moderate wage growth.
Table 4: Different Measures of Unit Wage and Labour Costs in the UK and US
UK US
Historic
average
Q1
2015
Q2
2015
Q3
2015
Historic
average
Q1
2015
Q2
2015
Q3
2015
Whole Economy
ONS ULC (ex.
backcast) 3.0 0.7 2.2 1.9 2.2 1.4 1.7 2.4
ONS ULC (inc.
backcast) 3.0 0.4 1.8 1.6 NA NA NA NA
UWC (inc.
backcast) 2.5 1.4 1.5 2.3 2.1 1.6 2.3 2.8
AWE / productivity 2.5 1.5 1.3 2.1 1.3 1.4 1.1 1.9
Private sector
ULC (inc. backcast) 2.7 0.0 1.7 1.6 1.6 1.2 2.6 3.0
Average 2.7 0.8 1.7 1.9 1.8 1.4 1.9 2.5
Sources: BEA, BLS, ONS,Thomson Reuters Datastream and Bank of England calculations . None of the US
measures use GDP backcasts.
Figure 21a: Unit wage costs, UK Figure 21b: Unit wage costs, US
Sources: ONS and Bank of England calculations. Sources: BEA and Bank of England calculations.
-6
-4
-2
0
2
4
6
8
10
19
98
19
99
20
00
20
01
20
02
20
03
20
04
20
05
20
06
20
07
20
08
20
09
20
10
20
11
20
12
20
13
20
14
20
15
Compensation per employeeLabour productivityUnit wage costs
Percentage change
-6
-4
-2
0
2
4
6
8
10
19
98
19
99
20
00
20
01
20
02
20
03
20
04
20
05
20
06
20
07
20
08
20
09
20
10
20
11
20
12
20
13
20
14
20
15
Compensation per employeeLabour productivityUnit wage costs
Percentage change on a year earlier

All speeches are available online at www.bankofengland.co.uk/publications/Pages/speeches/default.aspx
24
24
The contrast between the productivity-adjusted measures of labour costs in Table 4, with the unadjusted
measures of wage and cost growth in Table 3, highlights several important points. Rather than pick a
favorite measure, I’ll just focus on the averages for each series. Average wage growth in the UK has been
higher than in the US, but has since moderated, while that in the US has been more stable. In contrast, after
adjusting for productivity growth, unit labour costs in the US have consistently been higher than in the UK.
In fact the average measure of unit labour costs in the US is now above the historic average for this series.
But this largely stems from moderate wage growth combined with unusually low productivity growth.
So which measure is the most useful indicator of slack in the economy – and especially for predicting future
inflationary pressures? This is where the evidence is even murkier. Although economic models and theory
suggest an important link from unemployment/labour market slack → wage growth/unit labour costs →
inflation, the links in this chain have grown weaker recently. There is increasing evidence of a “flattening” of
the Phillips’ curve relationship between unemployment and wages, basically evidence that levels and
changes in unemployment have a weaker effect on wage growth than in the past.27
There is also some
evidence that the relationship between labour costs and price inflation – which was stronger in the 1980’s
and 1990’s – has weakened recently. Some analysis suggests that after incorporating the information from
labour market quantities, labour costs provide no useful additional information for predicting inflation.28
Which
leads us full-circle back to the first section of this talk – and why it is useful to start any analysis of labour
markets by looking at quantity variables such as unemployment and churn (as well as the more volatile wage
and cost measures) when attempting to evaluate slack in a labour market and the implications for inflation.
This “quantity based” approach of measuring slack and its impact on inflation may also be more relevant
during recoveries.29
4. Conclusions
Before I conclude, let me congratulate all of you. You have now been through a lengthy set of economic
statistics, tables and figures with excruciating detail on the UK and US labour markets. This session has
been closer to a class at MIT than the more lively sessions of Parliament at which you usually spend your
days. You may be even more mentally exhausted than if you just read A Tale of Two Cities, or even one of
Dicken’s longest books – say David Copperfield or Bleak House.
Nonetheless, this exercise was worthwhile (albeit admitting that I am entirely biased) – and maybe even as
rewarding – at least for any economists in the room – as finishing a Dicken’s book? This detailed look at the
various characteristics of the UK and US labour markets has highlighted a number of important issues for
27
See Blanchard, Cerutti and Summers (2015). 28
This could result from firms being more willing to adjust margins in order to smooth changes in labour costs. Evidence for the US is provided by Bidder (2015) and supported by internal BoE analysis for the UK. 29
For example, Michaillat (2012) suggests that indicators of churn and matching frictions have a greater effect on wages during recoveries than during recessions.

All speeches are available online at www.bankofengland.co.uk/publications/Pages/speeches/default.aspx
25
25
monetary policy. Most quantity-based labour market indicators in both the US and UK indicate very little
slack remaining in their labour markets – and if anything more slack in the US than the UK. Both economies
appear to have very limited ability to continue adding jobs at recent rates without having wages pick up
sharply and risk inflation overshooting 2% as the effects of external shocks fade.
But both economies have also been experiencing slower headline wage growth than would be expected
given the tightness of their labour markets. The evidence presented here suggests that some of this
weakness is due to temporary factors (such as composition effects) and how these headline numbers are
calculated (such as not adjusting for hours worked or productivity). Labour costs have been increasing more
steadily and are closer to levels consistent with the other signs of little slack in the labour market. But there
is still evidence of some unexplained loss of momentum in wage growth (especially in the UK), and labour
costs are not yet at the levels consistent with inflation meeting the 2% target sustainably in the UK. On a
more positive note, if wages in the UK began to regain the momentum they had early last year, without any
corresponding improvement in productivity, they could soon be at levels consistent with meeting the inflation
target, especially as the effects of cheaper energy and past currency appreciation fade.
It might be tempting to use the analysis above to suggest that since the US and UK labour markets show
very similar and low levels of slack, they should be making the same adjustments to their monetary policy
today (without saying which country is making the correct decision). It is true that the summary,
colour-coded chart in Table 2 finds similar degrees of slack in these two countries’ labour markets. If
anything, the quantity measures indicate greater slack in the US labour market, while the labour cost
measures suggest less. There are many other important differences in these two economies beyond the
scope of this talk, however, which affect how labour market developments in each country will feed through
into inflation. For example, the fiscal position in the US should provide a boost to US economic growth and
inflation over the next year, while the fiscal position in the UK will provide a headwind. Or another reason
why the US may be more likely to tighten monetary policy sooner is that the US Federal Reserve Board does
not have the same tools and flexibility to address concerns about overheating in specific sectors of the
economy (such as housing) as the Financial Policy Committee does at the Bank of England. On the other
hand, although the currencies in both countries have strengthened over the last 3 years, these movements
are likely to create a more substantive drag on US than UK inflation going forward, as the dollar has
appreciated more sharply and more recently while sterling has recently depreciated.30
Although
developments in the labour market are critical for determining the appropriate stance for monetary policy in
the UK and US, other considerations such as these are also important.
So where does this leave us? A close look at the UK and US labour markets suggest that they are stronger
and tighter than the most popular headline wage figures suggest. After a severe crisis and prolonged
recovery, they have largely returned to normality. A key theme in the Tale of Two Cities is resurrection, and
30
A given currency movement would normally have a larger impact on the UK economy as it is more open and has a higher degree of exchange rate pass-through.

All speeches are available online at www.bankofengland.co.uk/publications/Pages/speeches/default.aspx
26
26
the labour markets in these two countries have come back to life. The analysis above suggests that
momentum in wages and unit labour cost growth should accelerate in both economies.
In the UK, however, wages and labour costs have not yet gained enough momentum to be consistent with
inflation reaching our 2% target. Tightening monetary policy today would require faith that our forecasting
models will work and the tightness in labour market quantities and measures of labour market churn will soon
translate into stronger wages and then higher inflation. But, unfortunately, these models have not been
working very well recently. Therefore, although I still have faith, I would like to see a bit more upward
movement in these wage and cost measures to build confidence that the normal chain of tight labour
markets feeding through into higher wages is still intact. In other words: trust, but verify. The most recent
falls in oil prices, by delaying the recovery in inflation, provide the luxury of a bit more time to build this
confidence. Once this upward momentum in wages and unit costs builds – as I expect it will – then it will be
time for the UK to follow the example of its fellow “city” and begin the slow and gradual process of tightening
monetary policy. The relatively smooth experience of “lift-off” in the US suggests that, at least in this
Tale of Two Cities, there will not be a revolution.
References
Aaronson, Stephanie, Cajner, Tomaz, and Fallick, Bruce, 2014. “Labor Force Participation: Recent Developments and Future Prospects.” Brookings Papers on Economic Activity, Fall 2014, pgs. 197-254. Benito, Andrew and Saleheen, Jumana, 2013. "Labour supply as a buffer: evidence from UK households," Economica, Col. 80, pp 698-720 Bidder, Rhy, 2015. “Are Wages Useful in Forecasting Price Inflation?”. FRBSF Economic Letter 2015-33. Blanchard, Olivier, Cerutti, Eugenio and Summers, Lawrence, 2015. “Inflation and Activity: Two Explorations and Their Monetary Policy Implications.” Peterson Institute for International Economics Working Paper 15-19. Blanchflower, David and Levin, Andrew, 2015. “Labour Market Slack and Monetary Policy”. NBER Working Paper No. 21094 Broadbent, Ben, 2015. “Compositional shifts in the labour market”, speech given on 23 September 2015. Carney, Mark, 2016. “The turn of the year”, speech given on 19 January 2016. Council of Economic Advisers, 2015. “Achievements and Challenges in the U.S. Labor Market.” Economic Report of the President, Chp.3. Diamond, Peter and A. Sahin, 2014. “Shifts in the Beveridge Curve.” Federal Reserve Bank of New York Staff Reports, No 687. Dustmann, C. et al (2013). “The Effect of Immigration along the Distribution of Wages.” Review of Economic Studies.

All speeches are available online at www.bankofengland.co.uk/publications/Pages/speeches/default.aspx
27
27
Forbes, Kristin, 2015. “When, why and what’s next for low inflation? No magic slippers needed”, speech given on 17 June 2015. Gilhooly, Bob, Kindberg-Hanlon, Gene and Wales, Dan, 2015. “Global inflation: a laboured process”, Bank Underground post from 17 December 2015. Hall, Robert and Schulhofer-Wohl, Sam, 2015. “Measuring Job-Finding Rates and Matching Efficiency with Heterogeneous Jobseekers”, NBER Working Paper No. 20939. Hobijn, Bart and Sahin, Aysegul, 2012. “Beveridge curve shifts across countries since the Great Recession”, prepared for Jacques Polak Annual Research Conference 2012. Krueger, Alan. 2015. “How Tight is the Labor Market?”. The 2015 Martin Feldstein Lecture. National Bureau of Economic Research. Michaillat, Pascal, 2012. “Do Matching Frictions Explain Unemployment? Not in Bad Times.” American Economic Review 102(4): 1721-1750. Mulligan, Casey, 2015. “Fiscal Policies and the Prices of Labor: A Comparison of the U.K. and U.S.” Journal of Labor Policy. Nickell, Stephen and Saleheen, Jumana, 2015. “The Impact of Immigration on Occupational Wages: Evidence from Britain.” Bank of England Staff Working Paper No. 574 Patterson, Christina, Sahin, Aysegul, Topa, Giorgio and Violante, Giovanni, 2013. “Mismatch Unemployment in the UK”, mimeo Speigner, Bradley, 2015. “Finding a Match”, Bank Underground post from 2 December 2015. Weale, Martin, 2016. “What’s in a week’s work?”, speech given on 20 January 2016.