Embed Size (px)
Citation preview

D. Kaeli and K. Sachs (Eds.): SPEC Benchmark Workshop 2009, LNCS 5419, pp. 57–76, 2009. © Springer-Verlag Berlin Heidelberg 2009
A Tale of Two Processors: Revisiting the RISC-CISC Debate
Ciji Isen1, Lizy John1, and Eugene John2
1 ECE Department, The University of Texas at Austin 2 ECE Department, The University of Texas at San Antonio
{isen,ljohn}@ece.utexas.edu, [email protected]
Abstract. The contentious debates between RISC and CISC have died down, and a CISC ISA, the x86 continues to be popular. Nowadays, processors with CISC-ISAs translate the CISC instructions into RISC style micro-operations (eg: uops of Intel and ROPS of AMD). The use of the uops (or ROPS) allows the use of RISC-style execution cores, and use of various micro-architectural techniques that can be easily implemented in RISC cores. This can easily allow CISC processors to approach RISC performance. However, CISC ISAs do have the additional burden of translating instructions to micro-operations. In a 1991 study between VAX and MIPS, Bhandarkar and Clark showed that after cancel-ing out the code size advantage of CISC and the CPI advantage of RISC, the MIPS processor had an average 2.7x advantage over the studied CISC proces-sor (VAX). A 1997 study on Alpha 21064 and the Intel Pentium Pro still showed 5% to 200% advantage for RISC for various SPEC CPU95 programs. A decade later and after introduction of interesting techniques such as fusion of micro-operations in the x86, we set off to compare a recent RISC and a recent CISC processor, the IBM POWER5+ and the Intel Woodcrest. We find that the SPEC CPU2006 programs are divided between those showing an advantage on POWER5+ or Woodcrest, narrowing down the 2.7x advantage to nearly 1.0. Our study points to the fact that if aggressive micro-architectural techniques for ILP and high performance can be carefully applied, a CISC ISA can be imple-mented to yield similar performance as RISC processors. Another interesting observation is that approximately 40% of all work done on the Woodcrest is wasteful execution in the mispredicted path.
1 Introduction
Interesting debates on CISC and RISC instruction set architecture styles were fought over the years, e.g.: the Hennessy-Gelsinger debate at the Microprocessor Forum [8] and Bhandarkar publications [3, 4]. In the Bhandarkar and Clark study of 1991 [3], the comparison was between Digital's VAX and an early RISC processor, the MIPS. As expected, MIPS had larger instruction counts (expected disadvantage for RISC) and VAX had larger CPIs (expected disadvantage for CISC). Bhandarkar et al. pre-sented a metric to indicate the advantage of RISC called the RISC factor. The average RISC factor on SPEC89 benchmarks was shown to be approximately 2.7. Not even one of the SPEC89 program showed an advantage on the CISC.

58 C. Isen, L. John, and E. John
The Microprocessor forum debate between John Hennessy and Pat Gelsinger in-cluded the following 2 quotes:
"Over the last five years, the performance gap has been steadily diminishing. It is an unfounded myth that the gap between RISC and CISC, or between x86 and everyone else, is large. It's not large today. Furthermore, it is getting smaller."
- Pat Gelsinger, Intel
"At the time that the CISC machines were able to do 32-bit microprocessors, the RISC machines were able to build pipelined 32-bit microprocessors. At the time you could do a basic pipelining in CISC machine, in a RISC machine you could do superscalar designs, like the RS/6000, or superpipelined designs like the R4000. I think that will continue. At the time you can do multiple instruction issue with rea-sonable efficiency on an x86, I believe you will be able to put second-level caches, or perhaps even two processors on the same piece of silicon, with a RISC machine."
- John Hennessy, Stanford
Many things have changed since the early RISC comparisons such as the VAX-MIPS comparison in 1991 [3]. The debates have died down in the last decade, and most of the new ISAs conceived during the last 2 decades have been mainly RISC. However, a CISC ISA, the x86 continues to be popular. It translates the x86 macro-instructions into micro-operations (uops of Intel and ROPS of AMD). The use of the uops (or ROPS) allows the use of RISC-style execution cores, and use of various mi-cro-architectural techniques that can be easily implemented in RISC cores. A 1997 study of the Alpha and the Pentium Pro [4] showed that the performance gap was nar-rowing, however the RISC Alpha still showed significant performance advantage. Many see CISC performance approaching RISC performance, but exceeding it is probably unlikely. The hardware for translating the CISC instructions to RISC-style is expected to consume area, power and delay. Uniform-width RISC ISAs do have an advantage for decoding and runtime translations that are required in CISC are defi-nitely not an advantage for CISC.
Fifteen years after the heated debates and comparisons, and at a time when all the architectural ideas in Hennessy's quote (on chip second level caches, multiple proc-essors) have been put into practice, we set out to compare a modern CISC and RISC processor. The processors are Intel's Woodcrest (Xeon 5160) and IBM's POWER5+ [11, 16]. A quick comparison of key processor features can be found in Table 1. Though the processors do not have identical micro-architectures, there is a signifi-cant similarity. They were released around the same time frame and have similar transistor counts (276 million for P5+ and 291 million for x86). The main differ-ence between the processors is in the memory hierarchy. The Woodcrest has larger L2 cache while the POWER5+ includes a large L3 cache. The SPEC CPU2006 re-sults of Woodcrest (18.9 for INT/17.1 for FP) are significantly higher than that of POWER5+ (10.5 for INT/12.9 for FP). The Woodcrest has a 3 GHz frequency while the POWER5 has a 2.2 GHz frequency. Even if one were to scale up the POWER5+ results and compare the score for CPU2006 integer programs, it is clear that even ignoring the frequency advantage, the CISC processor is exhibiting an ad-vantage over the RISC processor. In this paper, we set out to investigate the per-formance differences of these 2 processors.

A Tale of Two Processors: Revisiting the RISC-CISC Debate 59
Table 1. Key Features of the IBM POWER5+ and Intel Woodcrest [13]
IBM POWER5+ Intel-Woodcrest(Xeon 5160)
Bit width 64bit 32/64bit
Cores/chip*Thread/core 2x2 2x1
Clock Frequency 2.2GHz 3.GHz
L1 I/D 2x64/32k 2x32k/32k
L2 1.92M 4M
L3 36M (off-chip) None
Execution Rate/Core 5 issue 5uops
Pipeline Stages 15 14
Out of Order 200 inst 126 uops
Memory B/W 12.8GB/s 10.5GB/s
Process technology 90nm 65nm
Die Size 245mm2 144nm2
Transistors 276 million 291 million
Power (Max) 100W 80W
SPECint/fp2006 [cores] 10.5 / 12.9 18.9 / 17.1 [4]
SPECint/fp2006_rate[cores] 197 / 229 [16] 60.0 / 44.1 [4]
Other interesting processor studies in the past include a comparison of the PowerPC601 and Alpha 21064 [12], a detailed study of the Pentium Pro processor [5], a comparison of the SPARC and MIPS [7], etc.
2 The Two Chips
2.1 POWER5+
The IBM POWER5+ is an out of order superscalar processor. The core contains one instruction fetch unit, one decode unit, two load/store pipelines, two fixed-point exe-cution pipelines, two floating-point execution pipelines, and two branch execution pipelines. It has the ability to fetch up to 8 instructions per cycle and dispatch and re-tire 5 instructions per cycle. POWER5+ is a multi-core chip with two processor cores per chip. The core has a 64KB L1 instruction cache and a 32KB L1 data cache. The chip has a 1.9MB unified L2 cached shared by the two cores. An additional 36MB L3 cache is available off-chip with its controller and directory on the chip.
The POWER5+ memory management unit has 3 types of caches to help address translation: a translation look-aside buffer (TLB), a segment look-aside buffer (SLB) and an effective-to-real address table (ERAT). The translation processes starts its search with the ERAT. Only on that failing does it search the SLB and TLB. This processor supports simultaneous multithreading.

60 C. Isen, L. John, and E. John
2.2 Woodcrest
The Xeon 5160 is based on Intel’s Woodcrest micro-architecture, the server variant of the Core micro-architecture. It is a dual core, 64 bit, 4-issue superscalar, moderately pipelined (14 stages), out-of-order MPU, and implemented in a 65nm process. The processor can address 36 bits of physical memory and 48 bits of vir-tual. An 8 way 32KB L1 I cache, a dual ported 32KB L1D cache along with a shared 4MB L2 cache feeds data and instruction to the core. Unlike the POWER5+ it has no L3 cache. The branch prediction occurs in-side the Instruction Fetch Unit. The Core micro-architecture employs the tra-ditional Branch Target Buffer (BTB), a Branch Address Calculator (BAC) and the Re-turn Address Stack (RAS) and two more predictors. The two predictors are: the loop detector (LD) which predicts loop exits and the Indirect Branch Predictor (IBP) which picks targets based on global history, which helps for branches to a calculated address. A queue has been added between the branch target predictors and the instruc-tion fetch to hide single cycle bubbles introduced by taken branches. The x86 instruc-tions are generally broken down into simpler micro-operations (uops), but in certain specialized cases, the processor fuses certain micro-operations to create integrated or chained operations. Two types of fusion operations are used: macro-fusion and micro-fusion.
3 Methodology
In this study we use the 12 integer and 17 floating-point programs of the SPEC CPU2006 [18] benchmark suite and measure performance using the on chip perform-ance counters. Both POWER5+ and Woodcrest microprocessors provide on-chip logic to monitor processor related performance events. The POWER5+ Performance
Fig. 1. IBM POWER5+ Processor [16]
Fig. 2. Front-End of the Intel Woodcrest processor [17]

A Tale of Two Processors: Revisiting the RISC-CISC Debate 61
Monitor Unit contains two dedicated registers that count instructions completed and total cycles as well as four programmable registers, which can count more than 300 hardware events occurring in the processor or memory system. The Woodcrest archi-tecture has a similar set of registers, two dedicated and two programmable registers. These registers can count various performance events such as, cache misses, TLB misses, instruction types, branch misprediction and so forth. The perfex utility from the Perfctr tool is used to perform the counter measurements on Woodcrest. A tool from IBM was used for making the measurements on POWER5+.
The Intel Woodcrest processor supports both 32-bit as well as 64-bit binaries. The data we present for Woodcrest corresponds to the best runtime for each benchmark (hence is a mix of 64-bit and 32-bit applications). Except for gcc, gobmk, omnetpp, xalancbmk and soplex, all other programs were in the 64-bit mode. The benchmarks for POWER5+ were compiled using Compilers: XL Fortran Enterprise Edition 10.01 for AIX and XL C/C++ Enterprise Edition 8.0 for AIX. The POWER5+ binaries were compiled using the flags:
C/C++ -O5 -qlargepage -qipa=noobject -D_ILS_MACROS -qalias=noansi -qalloca + PDF (-qpdf1/-qpdf2)
FP - O5 -qlargepage -qsmallstack=dynlenonheap -qalias=nostd + PDF (-qpdf1/-qpdf2).
The OS used was AIX 5L V5.3 TL05. The benchmarks on Woodcrest were com-piled using Intel’s compilers - Intel(R) C Compiler for 32-bit applications/ EM64T-based applications Version 9.1 and Intel(R) Fortran Compiler for 32-bit applications/ EM64T-based applications, Version 9.1. The binaries were compiled using the flag: -xP -O3 -ipo -no-prec-div / -prof-gen -prof-use.
Woodcrest was configured to run using SUSE LINUX 10.1 (X86-64).
4 Execution Characteristics of the Two Processors
4.1 Instruction Count (path length) and CPI
According to the traditional RISC vs. CISC tradeoff, we expect POWER5+ to have a larger instruction count and a lower CPI compared to Intel Woodcrest, but we observe that this distinction is blurred. Figure 3 shows the path length (dynamic instruction count) of the two systems for SPEC CPU2006. As expected, the instruction counts in the RISC POWER5+ is more in most cases, however, the POWER5+ has better in-struction counts than the Woodcrest in 5 out of 12 integer programs and 7 out of 17 floating-point programs (indicated with * in Figure 3). The path length ratio is de-fined as the ratio of the instructions retired by POWER5+ to the number of instruc-tions retired by Woodcrest. The path length ratio (instruction count ratio) ranges from 0.7 to 1.23 for integer programs and 0.73 to 1.83 for floating-point programs.
The lack of bias is evident since the geometric mean is about 1 for both integer and floating-point applications. Figure 4 presents the CPIs of the two systems for SPEC CPU2006. As expected, the POWER5+ has better CPIs than the Woodcrest in most cases. However, in 5 out of 12 integer programs and 7 out of 17 floating-point pro-grams, the Woodcrest CPI is better (indicated with * in Figure 4). The CPI ratio is the

62 C. Isen, L. John, and E. John
Fig. 3. a) Instruction Count (Path Length)-INT
Fig. 3. b) Instruction Count (Path Length) – FP
ratio of the CPI of Woodcrest to that of POWER5+. The CPI ratio ranges from 0.78 to 4.3 for integer programs and 0.75 to 4.4 for floating-point applications. This data is a sharp contrast to what was observed in the Bhandarkar-Clark study. They obtained an instruction count ratio in the range of 1 to 4 and a CPI ratio ranging from 3 to 10.5. In their study, the RISC instruction count was always higher than CISC and the CISC CPI was always higher than the RISC CPI.

A Tale of Two Processors: Revisiting the RISC-CISC Debate 63
Fig. 4. a) CPI of the 2 processors for INT
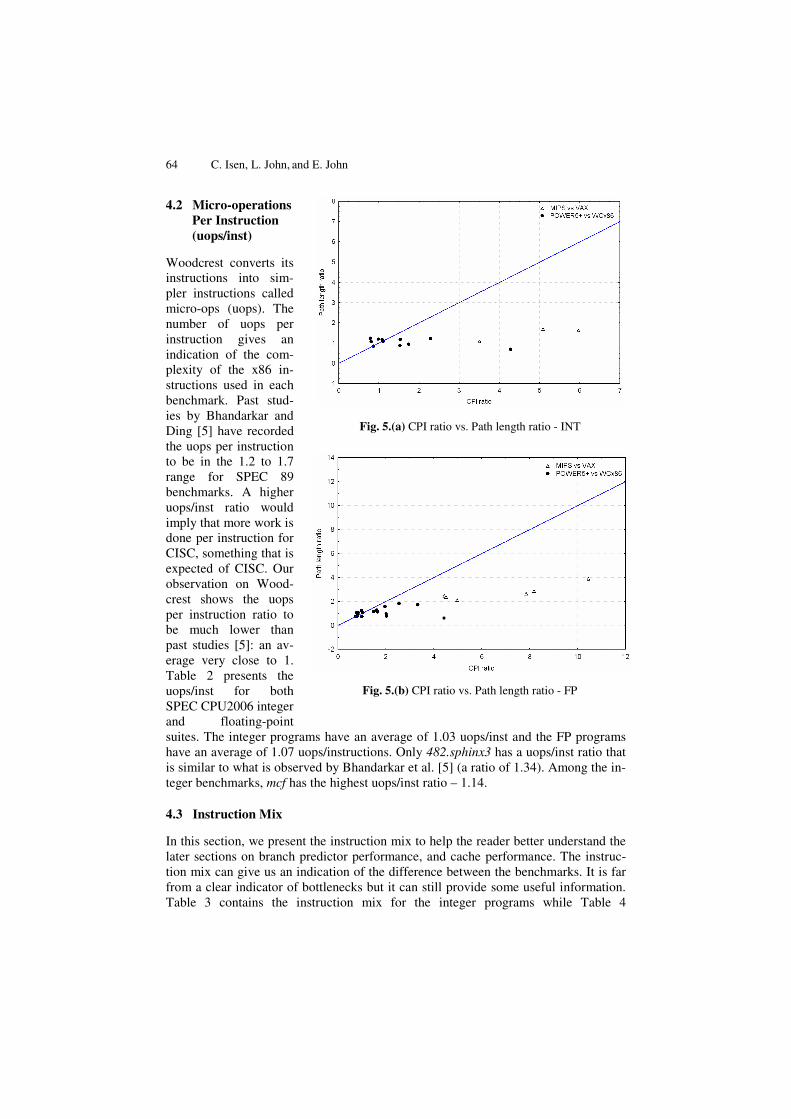
Fig. 4. b) CPI of the 2 processors for FP Figure 5 illustrates an interesting metric, the RISC factor and its change from the
Bhandarkar-Clark study to our study. Bhandarkar–Clark defined RISC factor as the ratio of CPI ratio to path length (instruction count) ratio. The x-axis indicates the CPI ratio (CISC to RISC) and the y-axis indicates the instruction count ratio (RISC to CISC).
The SPEC 89 data-points from the Bhandarkar-Clark study are clustered to the right side of the figure, whereas most of the SPEC CPU2006 points are located closer to the line representing RISC factor=1 (i.e. no advantage for RISC or CISC). This line represents the situation where the CPI advantage for RISC is cancelled out by the path length advantage for CISC. The shift highlights the sharp contrast between the results observed in the early days of RISC and the current results.
64 C. Isen, L. John, and E. John
4.2 Micro-operations Per Instruction (uops/inst)
Woodcrest converts its instructions into sim-pler instructions called micro-ops (uops). The number of uops per instruction gives an indication of the com-plexity of the x86 in-structions used in each benchmark. Past stud-ies by Bhandarkar and Ding [5] have recorded the uops per instruction to be in the 1.2 to 1.7 range for SPEC 89 benchmarks. A higher uops/inst ratio would imply that more work is done per instruction for CISC, something that is expected of CISC. Our observation on Wood-crest shows the uops per instruction ratio to be much lower than past studies [5]: an av-erage very close to 1. Table 2 presents the uops/inst for both SPEC CPU2006 integer and floating-point suites. The integer programs have an average of 1.03 uops/inst and the FP programs have an average of 1.07 uops/instructions. Only 482.sphinx3 has a uops/inst ratio that is similar to what is observed by Bhandarkar et al. [5] (a ratio of 1.34). Among the in-teger benchmarks, mcf has the highest uops/inst ratio – 1.14.
4.3 Instruction Mix
In this section, we present the instruction mix to help the reader better understand the later sections on branch predictor performance, and cache performance. The instruc-tion mix can give us an indication of the difference between the benchmarks. It is far from a clear indicator of bottlenecks but it can still provide some useful information. Table 3 contains the instruction mix for the integer programs while Table 4
Fig. 5.(a) CPI ratio vs. Path length ratio - INT
Fig. 5.(b) CPI ratio vs. Path length ratio - FP

A Tale of Two Processors: Revisiting the RISC-CISC Debate 65
Table 2. Micro-ops per instruction for CPU2006 on Intel Woodcrest
BENCHMARK uops/inst BENCHMARK uops/inst 400.perlbench 1.06 433.milc 1.01 401.bzip2 1.03 434.zeusmp 1.02 403.gcc 0.97 435.gromacs 1.01 429.mcf 1.14 436.cactusADM 1.12 445.gobmk 0.93 437.leslie3d 1.09
456.hmmer 1.08 444.namd 1.02
458.sjeng 1.06 447.dealII 1.04 462.libquantum 1.05 450.soplex 1.00 464.h264ref 1.02 453.povray 1.07
471.omnetpp 0.98 454.calculix 1.05 473.astar 1.07 459.GemsFDTD 1.16 483.xalancbmk 0.96 465.tonto 1.08
470.lbm 1.00 481.wrf 1.16
482.sphinx3 1.34 410.bwaves.input1 1.01 416.gamess 1.02 INT - geomean 1.03 FP – geomean 1.07
Table 3. Instruction mix for SPEC CPU2006 integer benchmarks
POWER5+ Woodcrest
BENCHMARK Branches Stores Load Others Branches Stores Loads other
400.perlbench 18% 15% 25% 41% 23% 11% 24% 41%
401.bzip2 15% 8% 23% 54% 15% 9% 26% 49%
403.gcc 19% 17% 18% 46% 22% 13% 26% 39%
429.mcf 17% 9% 26% 48% 19% 9% 31% 42%
445.gobmk 16% 11% 20% 53% 21% 14% 28% 37%
456.hmmer 14% 11% 28% 47% 8% 16% 41% 35%
458.sjeng 18% 6% 20% 56% 21% 8% 21% 50%
462.libquantum 21% 8% 21% 50% 27% 5% 14% 53%
464.h264ref 7% 16% 35% 42% 8% 12% 35% 45%
471.omnetpp 19% 17% 26% 38% 21% 18% 34% 27%
473.astar 13% 8% 27% 52% 17% 5% 27% 52%
483.xalancbmk 20% 9% 23% 47% 26% 9% 32% 33%
contains the same information for floating-point benchmarks. In comparing the com-position of instructions in the binaries of POWER5+ and Woodcrest, the instruction mix seems to be largely similar for both architectures. We do observe that some Woodcrest binaries have a larger fraction of load instructions compared to their POWER5+ counterparts. For example, the execution of hmmer on POWER5+ has 28% load instruction while the Woodcrest version has 41% loads. Among integer programs, gcc, gobmk and xalancbmk are other programs where the percentage of loads in Woodcrest is higher than that of POWER5+.

66 C. Isen, L. John, and E. John
Table 4. Instruction mix for SPEC CPU2006 floating-point benchmarks
POWER5+ Woodcrest
BENCHMARK Branches Stores Load Others Branches Stores Loads Others
410.bwaves 1% 7% 46% 46% 1% 8% 47% 44%
416.gamess 8% 8% 31% 53% 8% 9% 35% 48%
433.milc 3% 18% 34% 46% 2% 11% 37% 50%
434.zeusmp 2% 11% 26% 61% 4% 8% 29% 59%
435.gromacs 4% 14% 28% 54% 3% 14% 29% 53%
436.cactusADM 0% 14% 38% 48% 0% 13% 46% 40%
437.leslie3d 1% 12% 28% 59% 3% 11% 45% 41%
444.namd 5% 6% 28% 61% 5% 6% 23% 66%
447.dealII 15% 9% 32% 45% 17% 7% 35% 41%
450.soplex 15% 6% 26% 53% 16% 8% 39% 37%
453.povray 12% 14% 31% 44% 14% 9% 30% 47%
454.calculix 4% 6% 25% 65% 5% 3% 32% 60%
459.GemsFDTD 2% 10% 31% 57% 1% 10% 45% 43%
465.tonto 6% 13% 29% 52% 6% 11% 35% 49%
470.lbm 1% 9% 18% 72% 1% 9% 26% 64%
481.wrf 4% 11% 31% 54% 6% 8% 31% 56%
482.sphinx3 8% 3% 31% 59% 10% 3% 30% 56%
We also find a difference in the fraction of branch instructions, though not as sig-nificant as the differences observed for load instructions. For example, xalancbmk has 20% branches in a POWER5+ execution and 26% branches in the case of Woodcrest. A similar difference exists for gobmk and libquantum. In the case of hmmer, unlike the previous cases, the number of branches is lower for Woodcrest (14% for POWER5+ and only 8% for Woodcrest). Similar examples for difference in the frac-tion of load and branch instructions can be found in the floating-point programs. A few examples are cactusADM, leslie3d, soplex, gemsFDTD and lbm. FP programs have traditionally had a lower fraction of branch instructions, but three of the pro-grams exhibit more than 12% branches. This observation holds for both POWER5+ and Woodcrest. Interestingly these three programs (dealII, soplex and povray) are C++ programs.
4.4 Branch Prediction
Branch prediction is a key feature in modern processors allowing out of order execu-tion. Branch misprediction rate and misprediction penalty significantly influence the stalls in the pipeline, and the amount of instructions that will be executed specula-tively and wastefully in the misprediction path. In Figure 6 we present the branch misprediction statistics for both architectures. We find that Woodcrest outperforms POWER5+ in this aspect. The misprediction rate for Woodcrest among integer benchmarks ranges from a low 1% for xalancbmk to a high 14% for astar. Only

A Tale of Two Processors: Revisiting the RISC-CISC Debate 67
gobmk and astar have a misprediction rate higher than 10% for Woodcrest. On the other hand, the misprediction rate for POWER5+ ranges from 1.74% for xalancbmk and 15% for astar. On average the misprediction for integer benchmarks is 7% for POWER5+ and 5.5% for Woodcrest. In the case of floating-point benchmarks this is 5% for POWER5+ and 2% for Woodcrest. We see that, in the case of the floating-point programs, POWER5+ branch prediction performs poorly relative to Woodcrest. This is particularly noticeable in programs like games, dealII, tonto and sphinx.
0%
2%
4%
6%
8%
10%
12%
14%
16%
400.perlben
ch
401.bzip2
403.gcc
429.mcf
445.gobmk
458.sjeng
462.libquantum
464.h264ref
471.omnetpp
473.astar
483.xalan
cbmk
P5+ branch mispred % WC branch mispred %
Fig. 6. a) Branch misprediction – INT
0%
2%
4%
6%
8%
10%
12%
410.b
waves
416.g
ames
s
433.m
ilc
434.z
eusm
p
435.g
romac
s
436.c
actus
ADM
437.l
eslie
3d
444.n
amd
447.d
ealII
450.s
oplex
453.p
ovray
454.c
alculi
x
459.G
emsF
DTD
465.t
onto
470.l
bm
481.w
rf
482.s
phinx
3
P5 + branch mispred % WC branch mispred %
Fig. 6. b) Branch misprediction – FP
68 C. Isen, L. John, and E. John
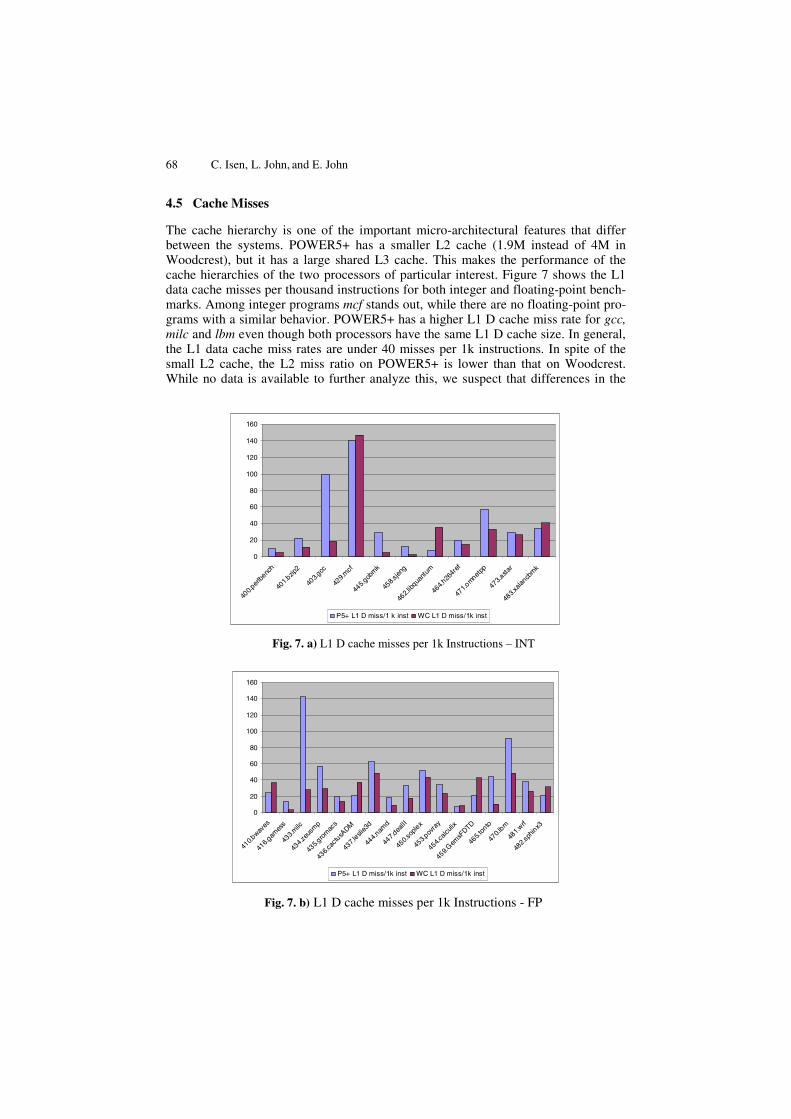
4.5 Cache Misses
The cache hierarchy is one of the important micro-architectural features that differ between the systems. POWER5+ has a smaller L2 cache (1.9M instead of 4M in Woodcrest), but it has a large shared L3 cache. This makes the performance of the cache hierarchies of the two processors of particular interest. Figure 7 shows the L1 data cache misses per thousand instructions for both integer and floating-point bench-marks. Among integer programs mcf stands out, while there are no floating-point pro-grams with a similar behavior. POWER5+ has a higher L1 D cache miss rate for gcc, milc and lbm even though both processors have the same L1 D cache size. In general, the L1 data cache miss rates are under 40 misses per 1k instructions. In spite of the small L2 cache, the L2 miss ratio on POWER5+ is lower than that on Woodcrest. While no data is available to further analyze this, we suspect that differences in the
0
20
40
60
80
100
120
140
160
400.p
erlbe
nch
401.b
zip2
403.g
cc
429.m
cf
445.g
obm
k
458.s
jeng
462.l
ibqua
ntum
464.h
264r
ef
471.o
mnetpp
473.a
star
483.x
alancb
mk
P5+ L1 D miss/1 k inst WC L1 D miss/1k inst
Fig. 7. a) L1 D cache misses per 1k Instructions – INT
0
20
40
60
80
100
120
140
160
410.b
waves
416.g
ames
s
433.m
ilc
434.z
eusm
p
435.g
rom
acs
436.c
actu
sADM
437.l
eslie3
d
444.n
amd
447.d
ealII
450.s
ople
x
453.p
ovra
y
454.c
alculi
x
459.G
emsF
DTD
465.t
onto
470.l
bm
481.w
rf
482.s
phin
x3
P5+ L1 D miss/1k inst WC L1 D miss/1k inst
Fig. 7. b) L1 D cache misses per 1k Instructions - FP

A Tale of Two Processors: Revisiting the RISC-CISC Debate 69
0
5
10
15
20
25
30
35
40
400.p
erlbe
nch
401.b
zip2
403.g
cc
429.m
cf
445.g
obm
k
458.s
jeng
462.l
ibqua
ntum
464.h
264r
ef
471.o
mnetpp
473.a
star
483.x
alancb
mk
P5 L2 miss/1k inst WC L2 miss/1k inst
Fig. 8. a) L2 cache misses per 1k Instructions – INT
0
10
20
30
40
50
60
410.b
waves
416.g
ames
s
433.m
ilc
434.z
eusm
p
435.g
rom
acs
436.c
actu
sADM
437.l
eslie3
d
444.n
amd
447.d
ealII
450.s
ople
x
453.p
ovra
y
454.c
alculi
x
459.G
emsF
DTD
465.t
onto
470.l
bm
481.w
rf
482.s
phin
x3
P5+ L2 miss/1k inst WC L2 miss/1k inst
Fig. 8. b) L2 cache misses per 1k Instructions – FP
amount of loads in the instruction mix (as discussed earlier), differences in the instruction cache misses (POWER5+ has a bigger I-cache) etc. can lead to this.
4.6 Speculative Execution
Over the years out-of-order processors have achieved significant performance gains from various speculation techniques. The techniques have primarily focused on con-trol flow prediction and memory disambiguation. In Figure 9 we present speculation percentage, a measure of the amount of wasteful execution, for different benchmarks. We define the speculation % as the ratio of instructions that are executed specula-tively but not retired to the number of instructions retired (i.e. (dispatched_inst_cnt / retired_inst_cnt) -1). We find the amount of speculation in integer benchmarks to be

70 C. Isen, L. John, and E. John
Speculation %
0
0.1
0.2
0.3
0.4
0.5
0.6
0.7
0.8
400.p
erlbenc
h
401.
bzip2
403.g
cc
429.m
cf
445.gob
mk
458.sj
eng
462.
libqu
antu
m
464.h2
64re
f
471.om
netp
p
473.a
star
483.xa
lancb
mk
P5+(inst disp/compl) WC(UOPS disp/retired)
Fig. 9. (a) Percentage of instructions executed speculatively - INT
Speculation %
0
0.05
0.1
0.15
0.2
0.25
0.3
410.b
waves
416.g
ames
s
433.m
ilc
434.ze
usmp
435.g
rom
acs
436.ca
ctusA
DM
437.le
slie3d
444.n
amd
447.dealI
I
450.so
plex
453.p
ovray
454.ca
lculix
459.G
emsF
DTD
465.to
nto
470.lb
m
481.w
rf
482.sp
hinx3
P5+(inst disp/compl) WC(UOPS disp/retired)
Fig. 9. (b) Percentage of instructions executed speculatively - FP
higher than floating-point benchmarks, not surprising considering the higher percent-age of branches and branch mispredictions in integer programs.
In general, the Woodcrest micro-architecture speculates much more aggressively compared to POWER5+. On an average, an excess of 40% of instructions in Wood-crest and 29% of instructions in POWER5+ are speculative for integer benchmarks. The amount of speculations for FP programs on average is 20% for Woodcrest and 9% for POWER5+. Despite concerns on power consumption, the fraction of instruc-tions spent in mispredicted path has increased from the average of 20% (25% for INT and 15% for FP) seen in the 1997 Pentium Pro study. Among the floating-point pro-grams, POWER5+ speculates more than Woodcrest in four of the benchmarks: dealII, soplex, povray and sphinx. It is interesting to note that 3 of these benchmarks are C++

A Tale of Two Processors: Revisiting the RISC-CISC Debate 71
programs. With limitation on power and energy consumption, wastage from execution in speculative path is of great concern.
5 Techniques That Aid Woodcrest
Part of Woodcrest’s performance advantage comes from the reduction of micro-operations through fusion. Another important technique is early load address resolu-tion. In this section, we analyze these specific techniques.
5.1 Macro-fusion and Micro-op Fusion
Although the Woodcrest breaks instructions into micro-operations, in certain cases, it also uses fusion of micro-operations to combine specific uops to integrated opera-tions, thus taking the advantage of simple or complex operations as it finds fit. Macro-fusion [11] is a new feature for Intel’s Core micro-architecture, which is designed to decrease the number of micro-ops in the instruction stream. Select pairs of compare and branch instruction are fused together during the pre-decode phase and then sent through any one of the four decoders. The decoder then produces a micro-op from the fused pair of instructions. The hardware can perform a maximum of one macro-fusion per cycle.
Table 5 and Table 6 show the percentage of fused operations for integer and float-ing-point benchmarks. In the tables, fused operations are classified as macro-fusion and micro-fusion. Micro-fusion is further classified into two: Loads that are fused with arithmetic operations or an indirect branch (LD_IND_BR) and store address computations fused with data store (STD_STA). As stated before, the version of the benchmark selected (32bit vs. 64bit) depends on the overall performance. This was done to give maximum performance benefit to CISC. It turns out that most of the pro-grams performed best in the 64-bit mode but in this mode macro-fusion does not work well. Since our primary focus is in comparing POWER5+ with Woodcrest we used the binaries that yielded best performance for this study too.
The best case runs (runs with highest performance) for integer benchmarks have an average of 19% operations that can be fused by micro or macro-fusion. This implies that the average uops/inst will go up from 1.03 to 1.23 uops/inst if there was no fu-sion. The majority of the fusion comes from micro-fusion, an average of 14%, and the rest from macro-fusion. Macro-fusion in integer benchmarks ranges from 0.13% in hammer to 21% for xalancbmk. For micro-fusion, we find it to range from 6% (astar) to 29% (hmmer). Among the two sub-components of micro-fusion, store address com-putation fusion is predominant. ‘Store address and store’ fusion ranges from 4%, for astar, to 18%, for omnetpp. On the other hand Loads fusion (LD_IND_BR - Loads that fused with arithmetic operations or an indirect branch) is the lowest for mcf and the highest for hmmer. The best case runs (runs with highest performance) for FP benchmarks have an average of 15% uops that can be fused by micro or macro-fusion. Almost all of the fusion is from micro-fusion. The percentage of uops that can be fused via micro-fusion in FP programs ranges from 4% (sphinx) to 21% (leslie3D).

72 C. Isen, L. John, and E. John
Table 5. Micro & macro-fusion in SPEC CPU2006 integer benchmarks
BENCHMARK uops/inst
%macro-
fusion uop
%micro-
fusion uop
%fusion
uop
%LD_IND_BR
uops
%STD_STA
uops
400.perlbench 1.06 0% 13% 13% 3% 11%
401.bzip2 1.03 0% 12% 12% 4% 9%
403.gcc 0.97 15% 16% 31% 4% 13%
429.mcf 1.14 0% 8% 8% 0% 8%
445.gobmk 0.93 12% 19% 31% 5% 15%
456.hmmer 1.08 0% 29% 29% 14% 15%
458.sjeng 1.06 0% 9% 9% 2% 7%
462.libquantum 1.05 0% 8% 8% 3% 5%
464.h264ref 1.02 0% 18% 18% 6% 12%
471.omnetpp 0.98 10% 22% 31% 5% 18%
473.astar 1.07 0% 6% 6% 1% 4%
483.xalancbmk 0.96 21% 13% 34% 13% 10%
Average 1.03 5% 14% 19% 5% 11%
Table 6. Micro & macro-fusion in SPEC CPU2006 – FP benchmarks
BENCHMARK uops/inst
%macro-
fusion uop
%micro-
fusion uop
%fusion
uop
%LD_IND_BR
uops
%STD_STA
uops
410.bwaves 1.01 0% 19% 19% 11% 8%
416.gamess 1.02 0% 20% 20% 11% 9%
433.milc 1.01 0% 13% 13% 3% 11%
434.zeusmp 1.02 0% 13% 13% 5% 8%
435.gromacs 1.01 0% 18% 18% 3% 14%
436.cactusADM 1.12 0% 20% 20% 8% 12%
437.leslie3d 1.09 0% 21% 21% 12% 10%
444.namd 1.02 0% 9% 9% 3% 6%
447.dealII 1.04 0% 19% 19% 12% 7%
450.soplex 1.00 4% 15% 20% 8% 7%
453.povray 1.07 0% 13% 13% 5% 8%
454.calculix 1.05 0% 9% 9% 6% 3%
459.GemsFDTD 1.16 0% 13% 13% 5% 9%
465.tonto 1.08 0% 20% 20% 10% 10%
470.lbm 1.00 0% 19% 19% 10% 9%
481.wrf 1.16 0% 13% 13% 7% 6%
482.sphinx3 1.34 0% 4% 4% 2% 2%
Average 1.07 0% 15% 15% 7% 8%

A Tale of Two Processors: Revisiting the RISC-CISC Debate 73
Hypothetically, not having fusion would increase the uops/inst for floating-point programs from 1.07 uops/inst to 1.23 uops/inst and for integer programs from 1.03 uops/inst to 1.23 uops/inst. It is clear that this micro-architectural technique has played a significant part in blunting the advantage of RISC by reducing the number of uops that are executed per instruction.
5.2 Early Load Address Resolution
The cost of memory access has been accentuated by the higher performance of the logic unit of the processor (the memory wall). The Woodcrest architecture is said to perform an optimization aimed at reducing the load latencies of operations with re-gards to the stack pointer [2]. The work by Bekerman et al. [2] proposes tracking the ESP register and simple operations on it of the form reg±immediate, to enable quick resolutions of the load address at decode time. The ESP register in IA32 holds the stack pointer and is almost never used for any other purpose. Instructions such as CALL/RET, PUSH/POP, and ENTER/LEAVE can implicitly modify the stack pointer. There can also be general-purpose instructions that modify the ESP in the fashion ESP←ESP±immediate. These instructions are heavily used for procedure calls and are translated into uops as given below in Table 7. The value of the immedi-ate operand is provided explicitly in the uop.
Table 7. Early load address prediction - Example
PUSH EAX ESP←ESP - immediate.
Mem[ESP] ← EAX
POP EAX EAX ← mem[ESP]
ESP←ESP - immediate.
LOAD EAX from stack EAX ← mem[ESP+imm]
These ESP modifications can be tracked easily after decode. Once the initial ESP value is known later values can be computed after each instruction decode. In essence this method caches a copy of the ESP value in the decode unit. Whenever a simple modification to the ESP value is detected the cached value is used to compute the ESP value without waiting for the uops to reach execution stage. The cached copy is also updated with the newly computed value. In some cases the uops cause operations that are not easy to track and compute; for example loads from memory into the ESP or computations that involve other registers. In these cases the cached value of ESP is flagged and it is not used for computations until the uop passes the execution stage and the new ESP value is obtained. In the mean while, if any other instruction that follows attempts to modify the ESP value, the decoder tracks the change operation and the delta value it causes. Once the new ESP value is obtained from the uop that passed the execution stage, the delta value observed is applied on it to bring the ESP register up-to-date. Having the ESP value at hand allows quick resolution of the load addresses there by avoiding any stall related to that. This technique is expected to bear fruit in workloads where there is a significant use of the stack, most likely for func-tion calls. Further details on this optimization can be found in Bekerman et al. [2].

74 C. Isen, L. John, and E. John
In Table 8 we present data related to ESP optimization. The percentage of ESP.SYNC refers to the number of times the ESP value had to be synchronized with the delta value as a percent of the total number of instructions. A high number is not desirable as it would imply the frequent need to synchronize the ESP data i.e. ESP data can not be computed at the decoder because it has to wait for the value from the execution stage. % ESP.ADDITIONS is a similar percent for the number of ESP addi-tion operations performed in the decode unit – an indication of the scope of this opti-mization. A high value for this metric is desirable because, larger the percentage of instructions that use the addition operation, more are the number of cycles saved. The stack optimization seems to be more predominant in the integer benchmarks and not the floating-point benchmarks. The % ESP addition optimization in integer benchmarks range from 0.1% for hmmer to 11.3% for xalancbmk. The % of ESP synchronization is low even for benchmarks with high % of ESP addition. For exam-ple xalancbmk exhibits 11.3% ESP addition and has only 3.76% ESP synchronization. The C++ programs are expected to have more function calls and hence more scope for this optimization. Among integer programs omnetpp and xalancbmk are among the ones with a large % ESP addition. The others are gcc and gobmk; the modular and highly control flow intensive nature of gcc allows for these optimizations. Although Astar is a C++ application, it makes very little use of C++ features [19] and we find that it has a low % for ESP addition. Among the floating-point applications, dealII and povray, both C++ applications, have a higher % of ESP addition.
Table 8. Percentage of instructions on which early load address resolutions were applied
BENCHMARK
% ESP
SYNCH
% ESP
ADDITIONS BENCHMARK
% ESP
SYNCH
% ESP
ADDITIONS
400.perlbench 0.90% 6.88% 433.milc 0.00% 0.04%
401.bzip2 0.30% 1.41% 434.zeusmp 0.00% 0.00%
403.gcc 1.80% 7.99% 435.gromacs 0.03% 0.14%
429.mcf 0.17% 0.24% 436.cactusADM 0.00% 0.00%
445.gobmk 1.81% 8.45% 437.leslie3d 0.00% 0.00%
456.hmmer 0.00% 0.11% 444.namd 0.00% 0.01%
458.sjeng 0.41% 3.19% 447.dealII 0.20% 3.05%
462.libquantum 0.12% 0.13% 450.soplex 0.11% 0.54%
464.h264ref 0.12% 1.44% 453.povray 0.67% 2.77%
471.omnetpp 3.06% 7.60% 454.calculix 0.03% 0.09%
473.astar 0.01% 0.14% 459.GemsFDTD 0.08% 0.33%
483.xalancbmk 3.76% 11.30% 465.tonto 0.26% 0.77%
470.lbm 0.00% 0.00%
481.wrf 0.19% 0.35%
482.sphinx3 0.17% 0.90%
410.bwaves 0.03% 0.04%
416.gamess 0.15% 0.76%
INT - geomean 1.04% 4.07% FP - geomean 0.12% 0.60%

A Tale of Two Processors: Revisiting the RISC-CISC Debate 75
On average the benefit from ESP based optimization is 4% for integer programs and 0.6% for FP programs. Each ESP based addition that is avoided amounts to avoiding execution of one uop. Although the average benefit is low, some of the ap-plications benefit significantly in reducing unnecessary computations and there by helping performance of those applications in relation to their POWER5+ counter parts.
6 Conclusion
Using the SPEC CPU2006 benchmarks, we analyze the performance of a recent CISC processor, the Intel Woodcrest (Xeon 5160) with a recent RISC processor, the IBM POWER5+. In a CISC RISC comparison in 1991, the RISC processor showed an ad-vantage of 2.7x and in a 1997 study of the Alpha 21064 and the Pentium Pro, the RISC Alpha showed 5% to 200% advantage on the SPEC CPU92 benchmarks. Our study shows that the performance difference between RISC and CISC has further nar-rowed down. In contrast to the earlier studies where the RISC processors showed dominance on all SPEC CPU programs, neither the RISC nor CISC dominates in this study. In our experiments, the Woodcrest shows advantage on several of the SPEC CPU2006 programs and the POWER5+ shows advantage on several other programs.
Various factors have helped the Woodcrest to obtain its RISC-like performance. Splitting the x86 instruction into micro-operations of uniform complexity has helped, however, interestingly the Woodcrest also combines (fuses) some micro-operations to a single macro-operation. In some programs, up to a third of all micro-operations are seen to benefit from fusion, resulting in chained operations that are executed in a single step by the relevant functional unit. Fusion also reduces the demand on reserva-tion station and reorder buffer entries. Additionally, it reduces the net uops per in-struction. The average uop per instruction for Woodcrest in 2007 is 1.03 for integer programs and 1.07 for floating-point programs, while in Bhandarkar and Ding’s 1997 study [5] using SPEC CPU95 programs, the average was around 1.35 uops/inst. Al-though the POWER5+ has smaller L2 cache than the Woodcrest, it is seen to achieve equal or better L2 cache performance than the Woodcrest. The Woodcrest has better branch prediction performance than the POWER5+. Approximately 40%/20% (int/fp) of instructions in Woodcrest and 29%/9% (int/fp) of instructions in the POWER5+ are seen to be in the speculative path.
Our study points out that with aggressive micro-architectural techniques for ILP, CISC and RISC ISAs can be implemented to yield very similar performance.
Acknowledgement
We would like to acknowledge Alex Mericas, Venkat R. Indukuru and Lorena Pesantez at IBM Austin for their guidance. The authors are supported in part by NSF grant 0702694, and an IBM Faculty award. Any opinions, findings and conclusions expressed in this paper are those of the authors and do not necessarily reflect the views of the National Science Foundation (NSF) or other research sponsors.

76 C. Isen, L. John, and E. John
References
1. Agerwala, T., Cocke, J.: High-performance reduced instruction set processors. Technical report, IBM Computer Science (1987)
2. Bekerman, M., Yoaz, A., Gabbay, F., Jourdan, S., Kalaev, M., Ronen, R.: Early load ad-dress resolution via register tracking. In: Proceedings of the 27th Annual international Symposium on Computer Architecture, pp. 306–315
3. Bhandarkar, D., Clark, D.W.: Performance from architecture: comparing a RISC and a CISC with similar hardware organization. In: Proceedings of ASPLOS 1991, pp. 310–319 (1991)
4. Bhandarkar, D.: A Tale of two Chips. ACM SIGARCH Computer Architecture News 25(1), 1–12 (1997)
5. Bhandarkar, D., Ding, J.: Performance Characterization of the Pentium® Pro Processor. In: Proceedings of the 3rd IEEE Symposium on High Performance Computer Architecture, February 01-05, 1997, pp. 288–297 (1997)
6. Chow, F., Correll, S., Himelstein, M., Killian, E., Weber, L.: How many addressing modes are enough. In: Proceedings of ASPLOS-2, pp. 117–121 (1987)
7. Cmelik, et al.: An analysis of MIPS and SPARC instruction set utilization on the SPEC benchmarks. In: ASPLOS 1991, pp. 290–302 (1991)
8. Hennessy, Gelsinger Debate: Can the 386 Architecture Keep Up? John Hennessy and Pat Gelsinger Debate the Future of RISC vs. CISC: Microprocessor Report
9. Hennessy, J.: VLSI Processor Architecture. IEEE Transactions on Computers C-33(11), 1221–1246 (1984)
10. Hennessy, J.: VLSI RISC Processors. VLSI Systems Design, VI:10, pp. 22–32 (October 1985)
11. Inside Intel Core Microarchitecture: Setting New Standards for Energy-Efficient Performance,
http://www.intel.com/technology/architecture-silicon/core/ 12. Smith, J.E., Weiss, S.: PowerPC 601 and Alpha 21064. A Tale of Two RISCs, IEEE Com-
puter 13. Microprocessor Report – Chart Watch - Server Processors. Data as of (October 2007)
http://www.mdronline.com/mpr/cw/cw_wks.html 14. Patterson, D.A., Ditzel, D.R.: The case for the reduced instruction set computer. Computer
architecture News 8(6), 25–33 (1980) 15. Patterson, D.: Reduced Instruction Set Computers. Communications of the ACM 28(1), 8–
21 (1985) 16. Kanter, D.: Fall Processor Forum 2006: IBM’s POWER6,
http://www.realworldtech.com/ 17. Kanter, D.: Intel’s Next Generation Microarchitecture Unveiled. Real World Technologies
(March 2006), http://www.realworldtech.com 18. SPEC Benchmarks, http://www.spec.org 19. Wong, M.: C++ benchmarks in SPEC CPU 2006. SIGARCH Computer Architecture
News 35(1), 77–83 (2007)

![RISC, CISC, and Assemblers - Cornell University · RISC, CISC, and Assemblers ... • Complexity: CISC, RISC Assemblers ... –e.g. Mem[segment + reg + reg*scale + offset] 14 RISC](https://img.pdfslide.net/doc/110x75/5c1068af09d3f254228c84fd/risc-cisc-and-assemblers-cornell-risc-cisc-and-assemblers-complexity.jpg)