Embed Size (px)
Citation preview

A taxonomy of innovation: How do public sector agencies innovate?
Results of the 2010 European Innobarometer survey of public agencies
This report was prepared by
Anthony Arundel1 & Hugo Hollanders2
October 2011 Disclaimer: The views expressed in this report, as well as the information included in it, do not necessarily reflect the opinion or position of the European Commission and in no way commit the institution.
1 UNU-MERIT, University of Maastricht and the Australian Innovation Research Centre, University of Tasmania 2 UNU-MERIT (Maastricht Economic and Social Research Institute on Innovation and Technology), Maastricht University

2
Table of content Abstract ................................................................................................................................................ 3
Preface................................................................................................................................................. 4
1. Introduction ...................................................................................................................................... 5
2. Methods ........................................................................................................................................... 7
2.1 Factor analysis results.................................................................................................................... 8
2.2 Cluster solution............................................................................................................................... 9
2.3 Cluster validation.......................................................................................................................... 10
2.4 Summary of differences by innovation method............................................................................. 12
3. Agency characteristics and innovation method............................................................................... 13
3.1 Innovation methods by country..................................................................................................... 14
3.2 Regression model for agency characteristics ............................................................................... 16
4. Effect of innovation method on outputs........................................................................................... 18
4.1 Regression models for the positive effects of innovation .............................................................. 20
4.2 Positive effects of innovation after controlling for the variety of innovations.................................. 23
5. Conclusions.................................................................................................................................... 25
References......................................................................................................................................... 27
ANNEX: EPSIS questionnaire on Public Services Innovation............................................................. 29

3
Abstract We use factor analysis followed by cluster analysis to identify different innovation strategies or methods that European public sector agencies use to innovate. The methodology identifies three methods. The first, used by 30.4% of the responding agencies, consists of a policy driven approach to innovation, with innovation implemented in response to mandated changes in the agency budget, new laws or regulations, new policy priorities, or the mandated introduction of new services. The second method, used by 34.3% of the agencies, is characterised by a ‘bottom up’ approach to innovation and is the opposite of the policy driven approach. Bottom up innovators have active management support for innovation and have implemented several policies to encourage the development of innovative ideas and tests of their efficacy. The third method, external knowledge innovators, is used by 35.3% of the agencies. These agencies report high levels of barriers to innovation and seek to overcome them by drawing on sources outside of the agency for assistance with developing an innovation. The effect of each innovation method on outcomes was analysed using descriptive analyses and regression techniques. The results show significantly poorer outcomes for policy driven innovators than for the other two innovation methods. A significantly lower percentage of policy driven innovators report each of five benefits from service innovations and four benefits from process/organisational innovations. For almost all benefits from innovation, the poorer performance of policy driven innovators remains after controlling for the effect of agency size, geographic area of responsibility (local, regional, national), the use of innovation groups and training to support innovation, and national per capita income. The exception is improved user satisfaction from innovative services, for which there is no significant difference between policy driven innovators and the other two innovation methods.

4
Preface In comparison with the private sector, there has been little rigorous empirical research on how innovation occurs in the public sector, with most research based on case studies or very small-scale surveys. There are exceptions, particularly for health care services and education and for the adoption of specific technologies, but until recently there have been no large-scale surveys of how local, regional and national public sector agencies that are responsible for a range of government services innovate. Up until the early 2000s, the largest survey of public sector innovation was probably the study by Borins (2001), who surveyed 300 public agencies in the United States and several Commonwealth countries. Since then, three separate surveys of public sector innovation were implemented in 2010. The smallest is the NESTA pilot survey of health organisations and local government organisations in the UK, which obtained 175 responses (Hughes et al, 2011). The MEPIN project developed a survey questionnaire for innovation in the public sector that adapted the third revision of the Oslo Manual (2005) guidelines for how to measure innovation in the private sector. Pilot versions of the MEPIN questionnaire were implemented between May and October of 2010 in Denmark, Finland, Iceland, Norway and Sweden, although the type of public agency that received the questionnaire varied in each country. Four countries included hospitals, and two also included secondary schools. Responses were obtained from 2,012 public sector organisations. The third and largest study is the European Commission’s Innobarometer (IB) Survey, which is the data source for this paper. The survey was limited to sectors that are dominated by the public sector (with the exclusion of health and educational services) and obtained 3,699 responses from public organisations. All 27 European Union countries plus Norway and Switzerland were included in the survey. The IB questionnaire was developed by MERIT in collaboration with Gallup (the survey organisation) and the European Commission. A copy of the full questionnaire is provided in the Annex. All of the questionnaires for the three 2010 surveys (MEPIN, NESTA and IB) use a similar definition of innovation in the public sector and collect data on innovation activities and management strategies, but within this shared structure there are also notable differences. The major difference between the MEPIN questionnaire3and the IB questionnaire is that the former more closely tracks the Community Innovation Survey for private firms, collecting data on expenditures and other investment in innovation and on the objectives of innovation. In addition, the MEPIN questionnaire collects only two questions on outcomes: one question asks if the organisation was the first to develop any of its product innovations and a second question asks if the organisation was the first to develop any of its process innovations. The English translation for both questions does not define ‘first’ by geographical area, so we do not know if the respondents interpret ‘first’ as referring to their own country or if these are world first innovations. In contrast, the IB questionnaire delves considerably more deeply into innovation outcomes. In addition to including a question on ‘first to the country’ product innovations (there is no equivalent IB question for process innovations), the IB questionnaire includes five questions on the positive benefits of service innovations, four questions on the positive benefits of process/organisational innovations, and four questions on the negative effects of any of its innovations, which includes service, process/organisational, and communication innovations. There are many other minor differences in the IB questionnaire compared to the MEPIN questionnaire that are not worth describing in detail, such as the structure of questions on external information sources and the definitions of political drivers, strategies and barriers. The main difference is that the IB questionnaire provides considerably more opportunities for examining the effect of innovation strategies on outcomes. The MEPIN questionnaire, on the other hand, provides considerably more data on how public sector organisations innovate. In comparison with the NESTA questionnaire, the IB questionnaire collects considerably less information on knowledge flows. NESTA collects detailed information on a range of external organisations as both a source of ideas for innovation and on their role in developing innovations. NESTA also collects information on the methods used to obtain external knowledge and the recipients
3The full MEPIN questionnaire is provided on pages 74 to 82 of the MEPIN report (Bugge et al, 2011).

5
of this knowledge within the respondent organisation. In contrast to both the MEPIN and IB questionnaires, NESTA does not collect information on barriers to innovation. In contrast to the MEPIN and NESTA reports, this report does not provide basic frequencies for individual questions. This information is available in the full Gallup report using the IB data. Instead, we use the 2010 IB survey results to develop a taxonomy for how public sector organisations innovate. We then examine the effects of different innovation strategies on outcomes. A future paper will examine the barriers to innovation (a particularly fascinating topic), the role of collaboration in the public sector, and provides additional analyses on outcomes. For simplicity, and to differentiate our study from research on private sector firms, we replace the lengthy term ‘public sector organisation’ with the simpler term ‘agency’.
1. Introduction Research on public sector innovation has followed two streams. The first assumes that many of the factors and strategies that influence how firms innovate will also apply to the public sector. The second perspective assumes that there are significant differences in how innovation occurs in the public sector and consequently it is not possible to directly apply a model of private sector innovation to public agencies. Both perspectives frequently intersect, with public sector innovation both differing from private sector innovation and sharing some similarities. An example of this intersection is in the types of innovations introduced by firms and public agencies. Firms innovate when they introduce a new or improved good or service onto the market or through implementing a new or improved process, marketing method, or organizational method (OECD, 2005). Public sector agencies can also introduce similar innovations, although they are more likely to introduce services than goods. A low prevalence of goods innovation could also make it difficult for public agency respondents to differentiate between process innovations (often associated with the production of goods) from organizational innovations. The concept of a marketing innovation could also be a poor fit in the public sector, which is why Bugge, Mortensen and Bloch (2011) developed the alternative concept of ‘communication’ innovations. When we talk about how a firm or a public agency innovates, we refer to the factors or drivers that cause a firm or a public agency to invest in an innovation, the internal and external information sources that the firm or agency draws upon to identify innovative solutions to a problem, the barriers that must be overcome, and the strategies that the firm or agency adopts to support and encourage innovation. These latter can include different types of internal investments, methods to manage knowledge, staff training, and the decision to collaborate (or not) with other firms, agencies or organisations. Some of these factors could be similar between firms and agencies, such as the types of collaboration partners, while others are likely to differ, such as the drivers for innovation. Most of the empirical research to date on how innovation occurs has focused on the private sector and is predominantly based on one of two methods: exploratory factor or cluster analysis to identify different types of innovation strategies and a theoretical approach based on differences in innovative capabilities. The exploratory methodology, either based on cluster analysis alone or more commonly factor analysis to reduce the number of variables, followed by cluster analysis, has been frequently used in the past decade by a range of researchers using European survey data.4.
As an example of the exploratory approach, de Jong and Marsili (2006) use principal component analysis followed by cluster analysis to identify different types of innovative firms with less than 100 employees. The principal component analysis uses fifteen variables, covering innovative outputs (product and process innovations), innovative inputs (the presence of an innovation budget, time devoted to innovation, and the presence within the firm of innovation specialists), three external sources of information for innovation, two measures of managerial attitudes to innovation, and two
4See Corrocher et al. (2009), Frenz and Lambert (2009), Hollenstein (1996), Hollenstein (2003), Jensen et al. (2007), De Jong and Marsili (2006), Knell and Srholec (2010), Leiponen and Drejer (2007), Peeters et al. (2004), Sellenthin and Hommen, 2002 and Srholec and Verspagen (2008).

6
measures of interactions with external sources. Their analyses identify four types of firms: ‘supplier dominated’, ‘specialised suppliers’, ‘science-based’, and ‘resource intensive’.
The disadvantage of the exploratory approach is that it is highly subjective (particularly cluster analysis) and the results can vary across each set of survey data. Nevertheless, the exploratory approach can be of value for identifying broad categories for how firms innovate. Some of the main categories also appear in different studies, suggesting that these categories are robust. For example, almost all of the exploratory studies of firms find that there are several categories of firms that innovate without an emphasis on R&D.
An alternative to the exploratory approach is to develop a taxonomy based on a theory of how firms innovate. This method was used by Pavitt (1984) and in several analyses of survey data (Veugelers and Cassiman, 1999;Cuervo-Cazurra and Un 2010). The advantage of the theoretical approach is that the taxonomy can be replicated over time, countries, and sectors, since it is based on the construction of discrete and replicable categories for different types of innovative firms. Although the available research suggests that the public sector faces different drivers and barriers than the private sector, we lack sufficient understanding of how public sector innovation occurs to use a theoretical approach to construct a taxonomy for how public sector agencies innovate. The alternative, adopted in this study, is to use the exploratory methodology. An exploratory methodology needs to address a major difference between how public agencies and private sector firms innovate. Innovation in the public sector can be driven by top-down policy decisions, such as the introduction of new regulations or government programs. This does not mean that ‘bottom-up’ innovation does not occur, but in some agencies policy driven innovation could dominate innovative activities. However, we don’t know if policy is the primary driver for innovation in the public sector, or if public agencies frequently innovate through bottom-up methods that involve the development of innovative capabilities within the agency. This can occur through management support combined with other actions such as staff incentives to encourage innovative ideas and evaluations to support innovation activities (Borins, 2001). Given adequate data, the exploratory method may be able to differentiate between bottom up and policy driven innovation strategies. Obstacles or barriers to innovation in the public sector have attracted a lot of attention, possibly because of a belief that the obstacles faced by public agencies differ from those in the private sector. Barriers that are possibly more important in the public sector include risk aversion, resistance to change on the part of users, regulatory requirements that limit change, a lack of resources, and professional and management resistance (possibly part of a risk averse culture) (Thenint, 2010; Mulgan and Albury, 2003; Koch and Hauknes, 2005). The development of a taxonomy for innovation in the public sector is of academic and policy interest because an understanding of the different factors that influence innovation can be used to develop and improve policies (and management strategies) to encourage innovation in public agencies. A second step is to evaluate the effect of how public agencies innovate on outcomes of interest, such as the types of innovations that are implemented or the benefits of innovation.

7
2. Methods We use the results of the 2010 Innobarometer survey of innovation in public sector agencies. The questionnaire was developed collaboratively between MERIT, the European Commission and Gallup Europe. Questionnaire translation into all relevant national languages and implementation was managed by Gallup Europe, with the survey in the field in October 2010. The survey was a quota sample, with pre-selected numbers of responses for each European country ranging from 10 responses for very small countries (Malta and Luxembourg) to 400 for the larger EU countries (Germany, the UK, France, Italy, Spain and Poland). In total, the IB survey obtained 3,699 valid responses from public agencies, of which 3,384 (91.5%) reported at least one innovation between January 2008 and the time of the survey. The full Innobarometer report (European Commission, 2011) provides further details on the survey methodology.5 The questionnaire includes a few questions on the characteristics of the public agency (number of employees, areas of responsibility, geographic area served), a series of questions on the types of innovation introduced by the agency (services, communication methods, processes or organisational methods), work force skills, effects of innovation, drivers and strategies, barriers, and expected developments over the next two years. We follow de Jong and Marsili (2006) and others by using a three-step exploratory analysis that usesfactoranalysisto reduce the number of variables to factors, cluster analysis to assign agencies to discrete clusters on the basis of their factor scores, and validation analysis that uses questions that were not included in the factor analysis to determine if there are statistically significant differences between the identified clusters. Factor analysis is particularly useful because many of the questions of interest are grouped with similar questions, for instance on information sources, drivers, and strategies. Many of these questions are correlated and cannot be used together in regressions. Factor analysis reduces the number of questions to a limited number of main factors that capture different activities. It also excludes unimportant variables. We use Principal Component Analysis (PCA) with varimax rotation to identify the main factors. The varimax rotation method produces uncorrelated factors, maximizing the differences between the factors. PCA assumes that the variables are measured on an interval scale. The IB survey has no interval variables, but several ordinal questions are available. Questions on an ordinal scale are widely used in PCA (see the studies cited in footnote 3) and provide reasonable results. Not all of the IB questions are suitable for exploratory research on how public agencies innovate, either because the question is not relevant (such as questions on innovation outcomes and effects) or because the questions only solicited ‘yes’ or ‘no’ responses instead of using an ordinal scale. Ordinal questions on the use of work groups and training for innovation are not included in the factor analysis so that they can provide a validation check. There are 25 ordinal questions of interest for exploratory analysis, divided into four topics: eight questions on the use of different information sources for the development of innovations (Q14), four questions on policy or legislative factors that drive innovations (Q16), five questions on strategies to support innovation (Q17), and seven questions on barriers to innovation (Q18).6 All 3,384 agencies that reported an innovation were eligible to answer the questions on information sources, policy drivers, strategies and barriers. For all questions, a ‘Don’t know/not applicable’ option was provided. The share of respondents who answered ‘don’t know’ ranges from 1.1% for the importance of ‘ideas from staff’ to 14.2% for the importance of a ‘mandated budget increase’ as a policy driver. If all agencies with at least one ‘Don’t know’ response to one of the 25 questions of interest are excluded, 1,178 or 34.8% of all innovative agencies are lost to the factor analysis. In order to conserve agencies, we assume that a ‘Don’t know’ response is equivalent to a ‘not important’ response. An important information source, strategy or policy driver is likely to be remembered. The 5See pages 188-196 of the report “Innobarometer 2010”: at http://www.proinno-europe.eu/page/innobarometer 6Question groups 14 and 16 ask if each information source or policy driver was ‘not important’,’ somewhat import’ or ‘very important’. Question group 17 asks if each strategy to support innovation was used ‘not at all’, ‘partly’, or ‘fully’. Question 18 on barriers provided a four point ordinal scale of ‘no importance’, ‘low importance’, ‘medium importance’ and ‘high importance’.

8
same applies if the response is due to a ‘not applicable’ decision by the respondent. This could occur if an agency did not use a specific information source or if it was not subject to a specific policy. In both cases, the result is similar to a ‘no’ response: either the information source is not used or the policy did not influence the innovative activities of the agency. There is one exception to this rule. An agency that replied ‘Don’t know’ to all sub-questions in a group (for instance all eight questions on information sources) is excluded from the analyses because the respondent either refused or was unable to answer any of the relevant questions. In total, 102 agencies (3%) were excluded for this reason, leaving 3,282 agencies for the PCA analysis. The number of factors to extract from the PCA was based on Kaiser’s criteria, which identified five factors with eigenvalues greater than 1. The selected five factors explain 48.5% of the variance. All diagnostics are acceptable, with no evidence of multicollinearity problems (no correlations between the variables are over 0.9 and the determinant for all correlations is .003, well above the necessary value of 0.00001). The sample size is good with a Kaiser-Meyer-Olkin measure of sampling adequacy of 0.866 for all variables combined and above 0.725 for all individual variables. Cluster analysis is very sensitive to outliers. Consequently 9 agencies with at least one factor score with a standard deviation greater or equal to 3.0 were excluded from the cluster analyses, reducing the number of eligible cases to 3,273. The cluster analysis uses the K-Means cluster procedure suitable for a large numbers of cases. Two, three and four cluster solutions were examined, with the three cluster solution providing the most interpretable results.
2.1 Factor analysis results Table 1 provides the factor loadings from the PCA for five factors. Loadings greater than 0.4 are highlighted in bold.
The first factor consists of barriers to innovation. The second factor includes different methods of obtaining information of relevance to innovation from sources outside the public agency, such as enterprises or clients. The third factor includes all policy drivers, with very low factor loadings for all other variables. The fourth factor consists of three variables that measure active management involvement in innovation: the importance of ‘ideas from management’ as an information source for the development of innovations, how well ‘managers support trial-and-error testing of new ideas’, and how well ‘managers take an active role in developing and implementing innovations’. Two variables for information sources, ‘ideas from staff’ and ‘best practice examples from other governments’, provide a weak contribution to this factor, indicating that the factor partially includes other activities within the agency to support innovation. The fifth factor captures strategies to support innovation, such as providing staff incentives, including users in design or planning, and evaluating new or improved services after completion.

9
Table 1. Results of Principal Component Analysis (Varimax rotation) for questions on innovation sources (I), policy drivers (P) strategies (S) and barriers (B)
Barriers
External
Knowledge Policy
Active
Mgmt
Support
strategies I: Ideas from management 0.036 0.329 0.145 0.561 0.012
I: Ideas from staff -0.002 0.396 0.088 0.354 0.294
I: Best practice of other governments 0.074 0.447 0.154 0.360 0.024
I: Professional organisations 0.027 0.592 0.113 0.248 0.030
I: Visits to conferences 0.164 0.592 0.069 0.093 -0.049
I: Enterprises as suppliers 0.112 0.698 0.037 0.008 -0.002
I: Enterprises as clients 0.154 0.724 0.051 -0.001 0.173
I: Citizens as clients or users 0.086 0.624 0.159 -0.012 0.254
P: Mandated budget decrease 0.139 0.035 0.610 0.038 0.078
P: Mandated budget increase 0.147 0.114 0.522 -0.140 0.072
P: New laws or regulations 0.123 0.023 0.746 0.108 0.040
P: New policy priorities 0.057 0.113 0.635 0.157 0.082
P: Mandated e-government or online services 0.128 0.196 0.545 0.134 -0.097
S: Managers support trial and error testing of ideas 0.087 0.046 0.000 0.741 0.130
S: Managers take an active role in innovation 0.052 0.038 0.085 0.758 0.259
S: Staff incentives for new idea development -0.048 -0.010 0.015 0.101 0.770
S: Users involved in design or planning of services 0.059 0.153 0.039 0.077 0.747
S: Evaluation of new or improved services 0.064 0.146 0.111 0.242 0.535
B: Lack of management support 0.738 0.142 0.052 0.057 -0.060
B: Lack of staff incentives 0.767 0.093 0.054 -0.013 -0.065
B: Staff resistance 0.759 0.099 0.066 0.052 0.022
B: Uncertain acceptance by users of your services 0.728 0.129 0.069 0.003 0.122
B: Regulatory requirements 0.601 0.062 0.259 0.038 0.065
B: Lack of sufficient human or financial resources 0.543 0.025 0.229 0.036 0.021
B: Risk averse culture in your organisation 0.686 0.079 0.071 0.078 0.020
2.2 Cluster solution Table 2 gives the results for a three-cluster solution for the four factors identified in Table 1. The first column, labelled ‘bottom up innovators’, has negative average scores for the factors for external knowledge sources and policy but the highest average scores for management involvement and innovation support strategies. The second column is labelled ‘External knowledge’ innovators because of the high average factor score for external knowledge sources and low or negative scores for policy, active management, and support strategies. Of interest, this is the only cluster with a positive score for barriers, suggesting that these agencies respond to barriers by seeking external solutions. Of interest, five of the seven barriers refer to conditions within the agency, with only two barriers referring to external conditions (‘uncertain acceptance by users of your services’ and ‘regulatory requirements’). A logical response could be for these agencies to seek to overcome internal barriers by seeking ideas and advice from external sources. The third column, labelled ‘policy driven innovators’, has the highest score for policy and negative scores for all other factors. The number of agencies within each cluster is very similar at approximately one-third each. Each cluster captures a different innovation method or approach to innovation on the part of the agency.

10
Table 2. Cluster solution: standardized factor scores for cluster centres
Factor Bottom up innovators External knowledge
Policy driven innovators
Barriers -0.32021 0.51541 -0.23249 External knowledge sourcing -0.40911 0.84759 -0.53295 Policy -0.17239 -0.09585 0.30583 Active management 0.75950 0.03102 -0.87374 Support strategies 0.45488 -0.22399 -0.25392
Number of agencies 1,123 (34.3%) 1,156 (35.3%) 994 (30.4%)
The advantage of this three-cluster solution is that it clearly separates agencies where policy is a strong driver of innovation from agencies which are bottom-up innovators, as shown by strong management involvement in innovation and the implementation of strategies to support innovation by agency staff.
2.3 Cluster validation Validation determines if there are significant differences between the cluster solutions (or innovation methods) for variables that are similar to but not used in the PCA and cluster analysis. The available validation variables consist of two questions on agency strategies to support innovation and two questions on information sourcing strategies.
Table 3 gives the results for one strategy to support innovation7, which is creating internal groups of employees that meet regularly to develop innovations. The policy driven innovators have the highest percentage of employees that do not participate in these groups, at 30.2%, compared to only 11.8% of bottom up innovators and 11.1% of external knowledge innovators. Only 7.0% of policy driven agencies have 50% or more of employees participating in these groups, compared to 18.3% of bottom up innovators and 13.7% of external knowledge innovators.
Table 3. Percent employees involved in groups that meet regularly to develop new or significantly improved innovations by innovation method1 Innovation method
Bottom up innovators External Knowledge Policy driven innovators Total
None 11.8% 11.1% 30.2% 17.2%
Less than 25% 52.1% 55.6% 51.7% 53.2%
Between 25% and 49% 17.8% 19.6% 11.0% 16.4%
Between 50% and 74% 8.8% 6.7% 3.2% 6.3%
75% or more 9.5% 7.0% 3.8% 6.9%
100.0% 100.0% 100.0% 100.0%
1: Defined in question as new or improved services, communication methods, processes or organisational methods.The difference between policy driven innovators and the other two types of innovators is statistically significant (p <0.000). The difference between bottom up innovators and external knowledge sources is statistically significant with p = 0.043.
Table 4 gives results for the second innovation strategy, which is the percentage of agencies that provide ‘training for employees specifically for implementing, using or providing’ new or improved services, communications methods, and process/organisational methods. For each of the three types 7All results in this report are unweighted. Although weights are provided for the data, the differences between weighted and unweighted results are very low, usually less than 1 percentage points.

11
of innovations, a significantly lower share of policy driven agencies provide training. For example, only 61.1% of policy driven innovators provide training for process or organisational innovations, compared to 76.3% of bottom up innovators and 78.3% of external knowledge innovators. Table 4. Percentage of public agencies by innovation method that provide training for employees specifically for implementing, using or providing new or improved innovations. Bottom up
innovators External
Knowledge Policy driven
innovators Total
Services1 82.6% 85.7% 70.3% 80.0%
Communication methods1 71.0% 80.4% 62.2% 71.6%
Processes or organisational methods1 76.3% 78.3% 61.1% 72.4%
1: Results limited to agencies that reported each type of innovation. The differences by innovation method are statistically significant (p <.05). The difference between bottom up innovators and external knowledge innovators for process/organisational methods is only significant at the 0.10 level, with p =.07. Differences between two innovation modes that are not statistically significant at the level of p<0.05 are marked in italics. The first set of results for strategies to source information are given in Table 5. For service and process/organisational innovations, respondents were asked if their agency developed one or more innovations ‘together with other public sector organisations’, ‘private businesses’ and ‘not for profit’ organisations. These are largely innovation methods that require collaboration with organisations external to the public agency and consequently the knowledge sourcing innovators should perform best on these questions. The question was not asked of innovative communication methods. For both types of innovations, external knowledge innovators had the highest frequency of collaboration with external organisations and policy driven innovators the lowest frequency of collaboration with external organisations. Table 5. Percentage of public agencies by innovation method that developed innovations through collaboration with external organisations Services1 Bottom up
innovators External
knowledge Policy driven
innovators Total
Other public sector organisations 62.7% 67.4% 55.3% 62.5% Private businesses 42.7% 46.7% 32.3% 41.4% Not for profit organisations 37.8% 41.3% 25.9% 35.9%
Processes or organisational methods1 Other public sector organisations 58.9% 59.9% 43.0% 54.7% Private businesses 40.8% 42.3% 30.7% 38.4%
Not for profit organisations 29.1% 33.5% 19.5% 28.0%
1: Results limited to agencies that reported each type of innovation. The differences by innovation method are statistically significant (p <.05) with the following exceptions: for services, between bottom up innovators and external knowledge sources for other public sector organisations and for not for profit organisations. For process/ organisational methods: between bottom up innovators and external knowledge innovators. Differences between two innovation modes that are not statistically significant at the level of p < 0.05 are marked in italics. Table 6 gives results for agencies that ‘obtained information essential to your innovations’ from sources based in different regions: their country, another European Union country, or a country outside the European Union. The percentages are based on how far an agency has gone to obtain essential information. For example, agencies that obtained essential information from both another EU country and a non-EU country are assigned to the latter category. As for collaboration, we expect knowledge sourcing innovators to be more likely to source essential information from external sources located at a distance. This expectation is correct, with 31.1% of knowledge sourcing innovators obtaining essential information from sources located outside their country, compared to 25.2% of bottom up innovators and 13.1% of policy driven innovators. Furthermore, 41.0% of policy-driven innovators did not obtain any essential information from external sources, compared to only 25.4% of knowledge sourcing innovators.

12
Table 6. Percentage of public agencies by innovation method that obtained essential information for innovation from increasingly distant sources Bottom up
innovators External
Knowledge Policy driven
innovators Total
None (no essential information obtained) 27.9% 25.4% 41.0% 30.6%
From an organisation within their country 46.9% 44.8% 45.4% 45.7%
From an organisation within another EU country 15.6% 17.5% 9.7% 14.7%
From an organisation outside the EU 9.6% 12.3% 3.9% 9.1%
Total 100.0% 100.0% 100.0% 100.0%
1: The differences by innovation method are statistically significant, with p <.000 between policy driven innovators and the other two innovation methods. The difference between bottom up and external knowledge innovators is only significant at the below 0.10 level (p = 0.09).
2.4 Summary of differences by innovation method The validation results show that there are large differences between policy driven innovators and the other two innovation methods. Policy driven innovators have the lowest use of innovation groups (not surprising, given top-down decision making), rates of provision of training for innovation and external collaboration. Policy driven innovators either do not obtain essential information from other sources, or they predominantly obtain this information from within its own country. The differences between the bottom-up innovators and the external knowledge innovators are considerably less marked. The bottom-up innovators are significantly more likely to use innovation groups than the external knowledge innovators and less likely to provide training for innovation, although the differences are much less than with policy driven innovators. As expected, external knowledge innovators have the best performance for the two variables for sourcing external knowledge. External knowledge innovators are more likely to innovate through collaboration than bottom up innovators, but the differences are minor and in only one case (for collaboration with private businesses) statistically significant. External knowledge innovators will also go farther from home to obtain information that is essential for innovation.

13
3. Agency characteristics and innovation method The specific characteristics of each public agency could influence how it innovates. These include the agency size, measured in number of employees, the nationality of the agency, and the type of agency. These factors are comparable to research on innovation by firms, which often controls for firm size, country, and sector. The main difference is the addition of a variable for the geographic area of responsibility for public agencies. As shown in Table 7, policy driven innovators tend to be smaller than the other two types of innovators. They have the highest percentage of agencies with less than 50 employees (64.1%), while the bottom up innovators have the highest share of agencies with more than 250 employees: 31.7% versus 14.1% for policy driven innovators. Table 7. Distribution of employees by innovation method Employees Bottom up innovators External Knowledge Policy driven innovators Total
10 to 49 41.4% 47.4% 64.1% 50.4%
50 to 99 12.5% 13.7% 11.5% 12.6%
100 to 249 14.5% 10.9% 10.3% 12.0%
250 to 499 11.5% 11.0% 5.1% 9.4%
500 to 999 7.3% 6.7% 4.4% 6.2%
1000 or more 12.9% 10.3% 4.6% 9.5%
100.0% 100.0% 100.0% 100.0%
1: The differences by innovation method are statistically significant, with p <.000 between policy driven innovators and the other two innovation methods and p = 0.01 between bottom up and external knowledge innovators.
Table 8 gives the distribution of each innovation method by geographic area of responsibility. A higher percentage of policy driven innovative agencies are responsible for local areas (85.4% versus 75.5% of external knowledge innovators), while bottom up innovators have the highest percentage of agencies with national responsibilities (10.6%). Table 8. Percentage of public agencies by innovation method by geographic area of responsibility Area Bottom up innovators External Knowledge Policy driven innovators Total
Local1 73.5% 75.5% 85.4% 77.8%
Regional1 15.9% 18.4% 11.2% 15.4%
National1 10.6% 6.1% 3.4% 6.8%
100.0% 100.0% 100.0% 100.0%
1: The differences by innovation method are statistically significant, with p <.000 between policy driven innovators and the other two innovation methods and between bottom up and external knowledge innovators. The results in Tables 7 and 8 show that policy-driven innovators are both smaller and more likely to be responsible for local areas than either bottom-up innovators or knowledge sourcing innovators. To determine if policy driven innovators are consistently smaller than average for all areas of responsibility, the analyses were conducted separately for each area of responsibility (results not shown). For local agencies only, policy driven innovators are smaller than the average. There are no significant differences between the three types of innovators with regional responsibilities. For national agencies, policy driven innovators show a ‘U’ shaped distribution, with an above average share of agencies with less than 50 employees (41.2% versus 26.9% for bottom up innovators) and over 1,000 employees (17.6% versus 4.3% for external knowledge innovators).

14
3.1 Innovation methods by country The distribution of innovation methods could differ across countries, due to possible national differences in the adoption of ‘top-down’ or policy driven organisational structures in the public sector versus bottom up structures. These could replicate observed differences in the organisational structure of private firms, where a higher share of firms in Northern European countries adopt flatter organisational structures that give greater responsibility and autonomy to employees, compared to firms in more traditional Southern European countries (Arundel et al, 2007). As a first step to maximize the number of observations, countries are assigned to one of three groups: northern and developed countries (Belgium, Denmark, Germany, France, Ireland, Luxembourg, Netherlands, Austria, Finland, Sweden, United Kingdom, Norway and Switzerland); Mediterranean countries (Greece, Spain, Italy and Portugal); and developing and transition countries (Czech Republic, Estonia, Cyprus, Latvia, Lithuania, Hungary, Malta, Poland, Slovenia, Slovakia, Bulgaria and Romania). The results are given in Table 9. Of note, the percentages sum across the rows (instead of down the columns as in the previous tables) because we are primarily interested in the distribution of innovation methods within each country group. As shown in Table 9, there is no difference by region in the share of policy driven innovators. In contrast, a notably higher than average share of agencies from northern developed economies are bottom up innovators (46.6% compared to the average of 34.9%), which is almost entirely due to a lower share of innovative agencies that rely on external knowledge sources. There is very little difference in the distribution of innovation methods among the developing and transition countries and the Mediterranean countries. Table 9. Distribution of innovation methods by country group
Bottom up innovators
External Knowledge
Policy driven innovators Total
Developing and Transition countries 25.3% 43.8% 30.8% 100.0%
Northern developed countries 46.6% 24.3% 29.2% 100.0%
Mediterranean countries 23.9% 44.3% 31.8% 100.0%
Total 34.9% 35.3% 29.9%
Differences in the distribution of innovation methods among agencies in the Northern developed countries is significantly different from the distribution for the other two regions (p <0.000). There is no difference between developing and transition countries and the Mediterranean countries (p=0.7). Table 10 provides results for individual countries except for Malta, Cyprus and Luxembourg, which are excluded because they have 10 or fewer respondents. The countries are organised in descending order based on the percentage of agencies that are policy driven innovators. Results for the six largest EU countries, for which there are 275 or more respondents, are shaded. As shown in Table 10, the results for large countries within the regions can vary substantially, indicating that using the aggregated results for three regions, as in Table 9, can give a misleading picture of the distribution of innovation methods. For instance, within the northern developed countries, the United Kingdom has almost twice the percentage of bottom up innovators than Germany and France, with the difference due to a much higher share of policy driven innovators in the latter two countries. The Scandinavian countries of Denmark, Finland, Norway and Sweden also have a considerably higher share of bottom up innovators than Germany or France. The share of policy driven innovators in Germany and France is similar to that of Italy. Although both Italy and Spain are Mediterranean countries, the former has a much higher share of policy driven innovators than Spain, while almost two-thirds of agencies in Spain draw on external knowledge. The distribution of innovation methods for Spain is more similar to Poland, a transition country, than that of Italy. Table 10 uses a bold font to identify which of the two non policy-driven innovation methods are more frequent: bottom up innovators versus external knowledge innovators. A quick perusal suggests that bottom up innovators account for a higher share of innovative agencies in the higher income countries, while external knowledge innovators are more prevalent in lower income countries. Figure 1 graphs

15
the relationship between 2010 per capita average income (measured in PPS Euros) and the share of bottom up innovators and shows that there is indeed a positive relationship between per capita income and the share of bottom up innovators, with an R2 of 0.50. This suggests that there is a positive relationship between the level of economic development and the encouragement of bottom up innovation in public agencies. Table 10. Distribution of innovation methods by country
Number of agencies
Bottom up innovators
External knowledge
Policy driven innovators Total
Czech Republic 81 24.7% 7.4% 67.9% 100.0% Slovakia 85 20.0% 22.4% 57.6% 100.0% Italy 353 24.6% 25.5% 49.9% 100.0% Germany 291 33.3% 16.8% 49.8% 100.0% France 271 31.0% 24.0% 45.0% 100.0% Greece 84 21.4% 38.1% 40.5% 100.0% Estonia 47 27.7% 31.9% 40.4% 100.0% Finland 88 47.7% 19.3% 33.0% 100.0% Lithuania 31 22.6% 45.2% 32.3% 100.0% Austria 65 32.3% 35.4% 32.3% 100.0% All countries 3273 34.3% 35.3% 30.4% 100.0% Hungary 65 60.0% 12.3% 27.7% 100.0% Poland 352 18.8% 56.0% 25.3% 100.0% Slovenia 37 40.5% 37.8% 21.6% 100.0% Latvia 48 29.2% 50.0% 20.8% 100.0% Netherlands 92 58.7% 20.7% 20.7% 100.0% Switzerland 45 51.1% 28.9% 20.0% 100.0% Denmark 41 53.7% 26.8% 19.5% 100.0% Romania 92 26.1% 56.5% 17.4% 100.0% Bulgaria 61 18.5% 65.2% 16.3% 100.0% Spain 367 21.3% 62.7% 16.1% 100.0% Portugal 79 35.4% 49.4% 15.2% 100.0% Sweden 81 66.7% 18.5% 14.8% 100.0% Norway 45 80.0% 6.7% 13.3% 100.0% Belgium 61 41.0% 45.9% 13.1% 100.0% United Kingdom 310 59.0% 28.4% 12.6% 100.0% Ireland 45 62.2% 35.6% 2.2% 100.0%
Results for countries with more than 300 responses are shaded.

16
Figure 1. Share of bottom up innovators by national 2010 per capita income in PPS
Per capita GDP from Eurostat and is given in purchasing power standards (PPS), where 100 is the average for the EU-27. See http://epp.eurostat.ec.europa.eu/tgm/table.do?tab=table&init=1&plugin=1&language=en&pcode=tsieb010.
3.2 Regression model for agency characteristics The descriptive results given above show that the innovation method used by an agency is correlated with its size (measured in employees), geographical area of responsibility, and country (possibly through the effect of the level of economic development). Since several of these factors are also correlated, for instance agency size and area of responsibility, we use a regression model to examine the effect of each agency characteristic on the innovation method, while controlling for the effect of all other variables. In addition, the regressions add a fourth variable that measures the type of agency. General government agencies are responsible for finance or for a range of different activities. The alternative consists of agencies with specific responsibilities, such as for education or health. Instead of using country dummies, the regressions follow the implications of Figure 1 by using the average per capita income in purchasing power standards (PPS) measured in Euros. The PPS per country range from a low of 44 for Bulgaria to a high of 179 for Norway, with 100 equal to the average for the EU-27 countries. Table 11 provides the results of two logit model regressions of the factors that influence whether or not the agency is a bottom up or external knowledge innovator compared to a policy driven innovator. The third comparison between bottom-up versus external knowledge innovators is not provided because the data do not fit a logit regression model. The regression results show that the effect of agency size, geographic area of responsibility, and country remain after controlling for other factors. Agencies with more than 50 employees are more likely to be bottom up or external knowledge innovators than policy-driven innovators. This confirms that policy driven innovators tend to be smaller than the other two types of innovative agencies. In addition, both bottom up and external knowledge innovators are more likely to serve national or regional areas, whereas policy-driven agencies are more likely to serve local areas. An increase in the average per capita income of the country increases the probability that the agency is a bottom up innovator, whereas it decreases the probability that the agency is an external knowledge innovator. This confirms the observed distribution in Figure 1 and the results of Table 10. The strategy of using external knowledge sources to innovate is more prevalent among the lower income transition countries, while a bottom up approach to innovation is more common among higher income countries. Bottom up innovators are less likely to be general government agencies, while there is no significant difference for this variable between external knowledge and policy driven innovators.

17
Table 11. Logit regression model results for agency characteristics
Bottom up innovators versus policy-driven
innovators
External knowledge versus policy-driven
innovators B p B p Agency employees1 0.000 0.000 50-99 .435 0.002 .450 0.001 100-249 .599 0.000 .523 0.001 250-499 1.051 0.000 1.378 0.000 500-999 .664 0.001 .967 0.00 1000+ 1.191 0.000 1.460 0.000 Geo responsibility: National2 1.053 0.000 0.559 0.018 Geo responsibility: Regional2 0.343 0.012 0.407 0.002 General government agency3 -0.291 0.002 -0.085 0.377 National average per capita income (PPS) 0.007 0.000 -0.017 0.000 Constant 0.341 0.217 2.83 0.000 Number of agencies 2117 2136 Nagelkerke R2 0.115 0.113 Percent correctly classified 63.0% 64.3%
1: Reference category is 10-49 employees. 2: Reference category is local agencies. 3: Reference category is agencies with specific responsibilities only (education, health, housing, environment, etc). Statistically significant results (p<0.05) are marked in bold font.

18
4. Effect of innovation method on outputs Whether or not public agencies use different methods to innovate is an interesting question in its own right, but we are primarily interested in the relationship between how public agencies innovate and innovation outputs, which include both the frequency of the three main types of innovations and also the positive benefits of service and process/organisational innovations. As shown in Table 12, a lower percentage of policy driven innovators introduce each type of innovation. The only significant difference between external knowledge and bottom up innovators is for communication methods. Table 12. Percentage of agencies by innovation method that introduced each type of innovation between January 2008 and November 2010 External Knowledge Bottom Up innovators Policy driven innovators
Service 78.6% 80.2% 66.9%
Process/organisational 93.6% 94.6% 87.6%
Communication method 82.6% 86.5% 75.9%
The differences between policy driven innovators and the other two innovation methods are statistically significant (p < 0.000), but only the difference for communication methods is significant between external knowledge and bottom up innovators (p = .005). Differences between two innovation modes that are not statistically significant at the level of p<0.05 are marked in italics. Three survey questions asked about the benefits of innovation on a yes or no basis: question 11 asks about the positive effects or benefits of service innovations, question 12 asks about the positive effects or benefits of process or organisational innovations, and question 13 asks about the negative effects of services, process, and organisational innovations. Table 13 gives the results for the negative effects of innovation. There are two results of interest. First, almost two-thirds of all types of innovators report no negative effects from their innovations. Second, with one exception, there are no significant differences for each effect by innovation method. The only exception is a lower percentage of policy driven innovators compared to bottom up and external knowledge innovators that report ‘user resistance or dissatisfaction’ as a result of innovation (10.2% versus 13.2% and 15.7% respectively). Table 13. Percentage of agencies by innovation method that report negative effects of service, process, or organisational innovations introduced since January 20081
Bottom up External
knowledge Policy driven
Additional administrative costs 16.2% 17.4% 18.3%
Reduced types or flexibility for services 6.8% 8.5% 5.3%
Slower delivery of services 3.9% 5.5% 3.3%
User resistance or dissatisfaction 13.2% 15.7% 10.2%
Other negative effect 3.3% 2.7% 3.3%
No negative effect 66.6% 62.4% 67.1%
Don’t know 3.0% 3.2% 3.7%
1: Limited to agencies that introduced at least one process or organisational innovation. Differences between two innovation methods that are not statistically significant (p < 0.05) are given in italics. Table 14 gives results for the benefits of service innovations. External knowledge innovators have the highest percentage of agencies (36.6%) that are first-movers (they introduced a new service before other public agencies in their country) and the highest share of services that are new or significantly

19
improved since January 2008 (14.2%). The policy driven innovators have the lowest performance for these two indicators. The remaining results in Table 14 give the frequencies for the different positive effects of service innovations. There are no significant differences between bottom up and external knowledge innovators. In contrast, a lower percentage of policy driven innovators report offering services to more or new types of users, better targeting of services, improved user access to information, and faster delivery of services. Table 14. Percentage of agencies by innovation method that report positive effects from service innovations introduced since January 20081
Bottom
up External
knowledge Policy driven
Introduced a new service before other public agencies in your country 31.9% 36.6% 16.7%
50% or more of services are new or significantly improved since January 2008 11.4% 14.2% 7.3%
Positive effects of service innovations
Offer services to more or new types of users 61.4% 63.8% 51.2%
Better targeting of services 73.9% 69.7% 56.6%
Improved user satisfaction 78.5% 76.8% 74.3%
Improved user access to information 82.2% 83.9% 76.5%
Faster delivery of services 70.5% 71.6% 58.7%
Other positive effect 3.1% 2.6% 3.7%
No positive effect 1.3% 1.3% 4.0%
Don’t know 1.5% 0.8% 1.7%
1: Limited to agencies that introduced at least one service innovation. Differences between two innovation methods that are not statistically significant (p < 0.05) are given in italics. Table 15 gives results for the positive effects of process/organisational innovations. Again, there are no significant differences between bottom up and external knowledge innovators. Similar to the results for service innovations, a significantly lower percentage of policy driven innovators report positive benefits, such as simplified administrative procedures, reduced costs for providing services, faster service delivery, and improved employee satisfaction or working conditions. Table 15. Percentage of agencies by innovation method that report positive effects of process/organisational innovations introduced after January 20081
Bottom up innovators
External knowledge
Policy driven innovators
Simplified administrative procedures 71.5% 68.6% 60.0%
Reduced costs for providing services 58.5% 56.8% 41.7%
Enable faster delivery of services 69.0% 70.9% 58.6%
Improved employee satisfaction or working conditions 68.6% 66.3% 55.1%
Other positive effect 2.7% 4.0% 3.6%
No positive effect 2.9% 2.7% 7.7%
Don’t know 2.1% 1.5% 3.1%
1: Limited to agencies that introduced at least one process or organisational innovation. Differences between two innovation methods that are not statistically significant (p < 0.05) are given in italics.

20
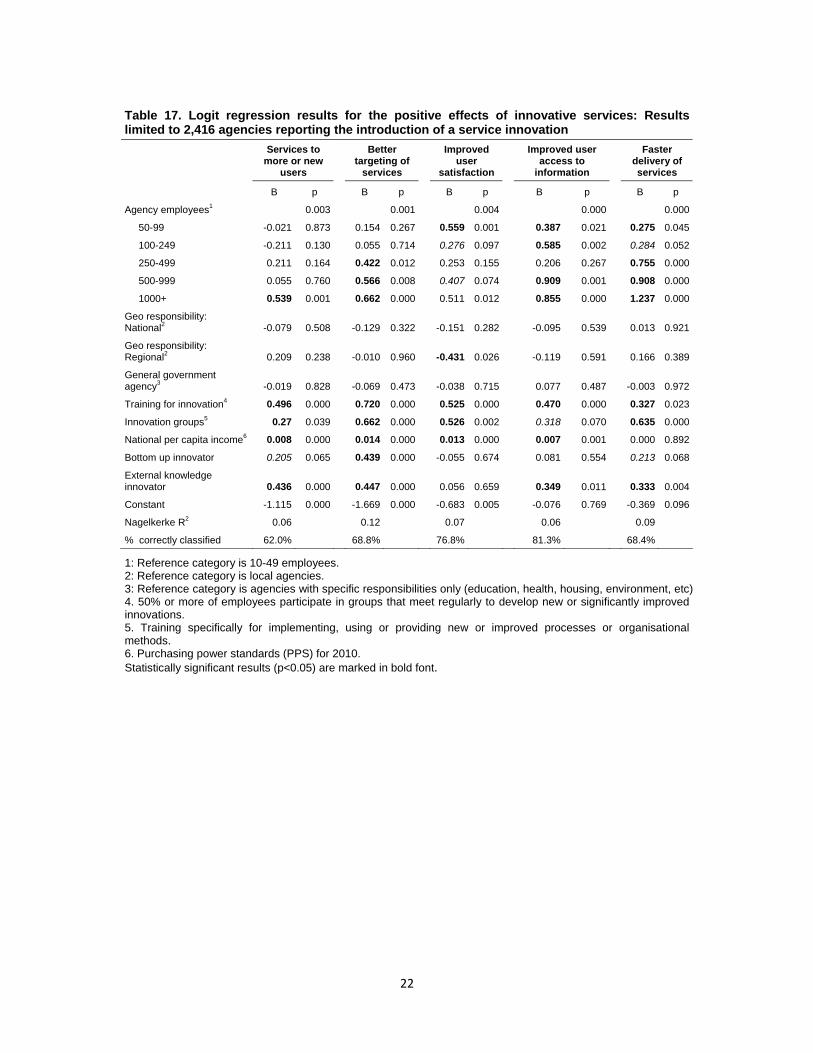
4.1 Regression models for the positive effects of innovation Regression model results for four positive effects of process/organisational innovation are given in Table 16 and for five positive effects for services innovation in Table 17. The advantage of the regression models, compared to the frequencies given in Tables 14 and 15 above, is that the regressions simultaneously consider the effect of other variables in addition to the innovation method used by each agency. The regression models include variables for two innovation methods, bottom up and external knowledge innovators, with policy driven innovators as the reference category. The models include three variables for agency characteristics (employment, geographical area of responsibility, and agency type) and the national average per capita income (PPS Euros). Two variables for innovation support strategies that were excluded from the construction of the innovation method variables are also included: 1) whether or not the agency provides training for innovation and 2) if 50% or more of employees are involved in regular group meetings to develop new innovations. The size of the agency has a significant effect on three of the four benefits from process innovation and for all five of the benefits from services innovation. The exception is ‘improve employee satisfaction or working conditions’ as a result of process/organisational innovation. In all cases, larger agencies are more likely to report a benefit from innovation, although there is considerable variation in the size boundary before a positive effect is observed. For example, agencies with 100 or more employees are more likely to report the benefit of simpler administrative procedures from process/organisational innovation, whereas the positive effect for offering services to ‘more or new users’ only occurs for agencies with more than 1000 employees. The geographic area of responsibility has almost no effect on reported benefits. The only significant result is for service innovations that result in ‘improved user satisfaction’, where regional agencies are less likely to report this benefit. Similarly, the type of government agency has no effect on benefits from service innovations, but this variable has more of an effect for process/organisational innovations, where general government agencies are less likely to report reduced costs and more likely to report faster delivery of services. Training and innovation groups are likely to result in innovation benefits by improving efficiency and ensuring that the innovation is a success. As would be expected, the presence of both of these strategies has a significantly positive effect on most of the nine benefits from innovation, after controlling for the innovation method. The average national per capita income has a significant positive effect for seven of the nine innovation benefits. The only exception is for faster delivery of services, both as a benefit of service innovation and of process/organisational innovation. The results suggest that more economically developed countries focus on different goals. For instance, the effect of national per capita income is greatest for quality outcomes, such as ‘improve employee satisfaction or working conditions’, better targeting of services, and improved user satisfaction. The effect of national income is lower for ‘reducing the cost of providing services’ and ‘improving user access to information’. The latter may also be of less importance because higher income countries may have already addressed the issue of user access in previous years.

21
Table 16. Logit regression results for the positive effects of innovative process or organisational methods: Results limited to 2,918 agencies reporting the introduction of a process/organisational innovation
Simplify admin
procedures
Reduce costs of providing services
Faster delivery of services
Improve employee satisfaction or
working conditions
B p B p B p B p
Agency employees1 0.000 0.000 0.000 0.564
50-99 0.079 0.527 -0.044 0.712 0.329 0.011 -0.060 0.631
100-249 0.515 0.000 0.176 0.157 0.153 0.243 -0.179 0.167
250-499 0.634 0.000 0.608 0.000 0.525 0.001 0.057 0.707
500-999 0.779 0.000 0.719 0.000 0.793 0.000 0.170 0.354
1000+ 0.905 0.000 1.149 0.000 0.807 0.000 -0.034 0.828
Geo responsibility: National2 0.126 0.311 -0.021 0.850 -0.010 0.932 -0.028 0.807
Geo responsibility: Regional2 -0.02 0.912 0.210 0.204 -0.031 0.858 -0.162 0.332
General government agency3 0.118 0.178 -0.177 0.030 0.252 0.003 -0.134 0.112
Training for innovation4 0.563 0.000 0.514 0.000 0.780 0.000 0.568 0.000
Innovation groups5 0.36 0.009 0.300 0.013 0.131 0.312 0.450 0.001
National per capita income6 0.012 0.000 0.005 0.001 0.000 0.971 0.010 0.000
Bottom up innovator 0.194 0.070 0.389 0.000 0.232 0.027 0.389 0.000
External knowledge innovator 0.265 0.011 0.442 0.000 0.351 0.001 0.426 0.000
Constant -1.323 0.000 -1.193 0.000 -0.397 0.035 -0.952 0.000
Nagelkerke R2 0.12 0.12 0.09 0.07
% correctly classified 69.6% 61.9% 68.6% 65.8%
1: Reference category is 10-49 employees. 2: Reference category is local agencies. 3: Reference category is agencies with specific responsibilities only (education, health, housing, environment, etc). 4. 50% or more of employees participate in regular group meetings to develop new or significantly improved innovations. 5. Training specifically for implementing, using or providing new or improved processes or organisational methods. 6. Purchasing power standards (PPS) for 2010. Statistically significant results (p<0.05) are marked in bold font.
22
Table 17. Logit regression results for the positive effects of innovative services: Results limited to 2,416 agencies reporting the introduction of a service innovation
Services to more or new
users
Better targeting of
services
Improved user
satisfaction
Improved user access to
information
Faster delivery of services
B p B p B p B p B p
Agency employees1 0.003 0.001 0.004 0.000 0.000
50-99 -0.021 0.873 0.154 0.267 0.559 0.001 0.387 0.021 0.275 0.045
100-249 -0.211 0.130 0.055 0.714 0.276 0.097 0.585 0.002 0.284 0.052
250-499 0.211 0.164 0.422 0.012 0.253 0.155 0.206 0.267 0.755 0.000
500-999 0.055 0.760 0.566 0.008 0.407 0.074 0.909 0.001 0.908 0.000
1000+ 0.539 0.001 0.662 0.000 0.511 0.012 0.855 0.000 1.237 0.000
Geo responsibility: National2 -0.079 0.508 -0.129 0.322 -0.151 0.282 -0.095 0.539 0.013 0.921
Geo responsibility: Regional2 0.209 0.238 -0.010 0.960 -0.431 0.026 -0.119 0.591 0.166 0.389
General government agency3 -0.019 0.828 -0.069 0.473 -0.038 0.715 0.077 0.487 -0.003 0.972
Training for innovation4 0.496 0.000 0.720 0.000 0.525 0.000 0.470 0.000 0.327 0.023
Innovation groups5 0.27 0.039 0.662 0.000 0.526 0.002 0.318 0.070 0.635 0.000
National per capita income6 0.008 0.000 0.014 0.000 0.013 0.000 0.007 0.001 0.000 0.892
Bottom up innovator 0.205 0.065 0.439 0.000 -0.055 0.674 0.081 0.554 0.213 0.068
External knowledge innovator 0.436 0.000 0.447 0.000 0.056 0.659 0.349 0.011 0.333 0.004
Constant -1.115 0.000 -1.669 0.000 -0.683 0.005 -0.076 0.769 -0.369 0.096
Nagelkerke R2 0.06 0.12 0.07 0.06 0.09
% correctly classified 62.0% 68.8% 76.8% 81.3% 68.4%
1: Reference category is 10-49 employees. 2: Reference category is local agencies. 3: Reference category is agencies with specific responsibilities only (education, health, housing, environment, etc) 4. 50% or more of employees participate in groups that meet regularly to develop new or significantly improved innovations. 5. Training specifically for implementing, using or providing new or improved processes or organisational methods. 6. Purchasing power standards (PPS) for 2010. Statistically significant results (p<0.05) are marked in bold font.

23
4.2 Positive effects of innovation after controlling for the variety of innovations The regression model results in Tables 16 and 17 show that both external knowledge innovators and bottom up innovators are significantly more likely than policy driven innovators to report positive effects from both process/organisational and service innovations. This indicates that these two innovation strategies are more likely to lead to positive benefits than a policy driven innovation strategy. This conclusion holds after controlling for possible confounding factors such as agency size, geographical area of responsibility, and national per capita income. External knowledge innovators are more likely to report positive results for all four of the positive effects from process/organisational innovations and for four of the five benefits of service innovations. The exception is for user satisfaction, where there is no statistically significant difference between external knowledge innovators and the reference category of policy driven innovators. The results are weaker for the bottom up innovators, for which the positive result for ‘simplifying administrative procedures’ as a result of process/organisational innovation is only significant at the p <.10 level. For services, only the p <.10 level of significance is reached for ‘services to more or new users’ and for ‘faster delivery of services’. The largest difference with external knowledge innovators is for ‘improved user access to information’. For this benefit, the result for bottom up innovators does not reach statistical significance and the coefficient is considerably lower, at 0.081, than the coefficient for external knowledge innovators, at 0.349. 8 This result could be due to the outreach activities of external knowledge innovators providing them with better information on user requirements. The superior performance of bottom up and external knowledge strategies, compared to a policy driven strategy, could be due to the latter introducing fewer innovations than bottom up and external knowledge innovators and consequently having fewer opportunities to observe a positive effect from at least one of their innovations.9 There is some evidence that this is the case from the data on different types of innovations. Although the questionnaire only asks about service innovations in general, the question for process and organisational innovations asks about five different types of innovations. This information can be used to construct a measure for innovation variety. Among process/organisational innovators, policy driven innovators report fewer different types of these innovations: an average of 2.5 types compared to 3.1 types for bottom up innovators and 3.4 types for external knowledge innovators. Once the number of types of innovations are added to the regression (see Table 18), the significant effect for bottom up and external knowledge innovators only holds for two of the four positive effects from process/organisational innovations: ‘reduce costs of providing services’ and ‘improve employee satisfaction or working conditions’. The effect of the innovation method is no longer significant for ‘simplify administrative procedures’ and ‘faster delivery of services’. Therefore, the number of types of innovations partially reduces the impact of the innovation method on the positive benefits from process/organisational innovations. The effect of the number of types of process/organisational innovations does not necessarily reduce the advantages of bottom up and external knowledge innovation strategies, since both of these strategies could be specifically implemented to increase the number of innovations. In this respect, the fact that including the number of types of innovations reduces the significance of the innovation method is due to the intrinsic nature of these two strategies to produce more innovations – it partly explains why these two strategies are more effective than a policy driven strategy. For instance, the bottom up strategy should produce more innovations through implementing strategies to encourage agency staff to innovate while the external knowledge strategy should result in more innovations because it actively seeks ideas for innovation from other organisations.
8As the variables for both bottom up innovators and external knowledge innovators are both measured on a binary scale (yes or no), the coefficients for the two are directly comparable. 9On average, policy driven agencies are smaller than bottom up and external knowledge agencies and smaller agencies could be more likely to introduce fewer innovations. However, this effect is controlled for by the inclusion of the variable for employee numbers in the regressions.

24
Table 18. Logit regression results for the positive effects of innovative process or organisational methods: includes the number of types of process/organisational innovations (Results limited to 2,918 agencies reporting the introduction of a process/organisational innovation)
Simplify admin
procedures
Reduce costs of providing services
Faster delivery of services
Improve employee
satisfaction or working
conditions
B Sig. B Sig. B Sig. B Sig.
Agency employees1 0.000 0.000 0.006 0.186
50-99 0.039 0.761 -0.100 0.415 0.273 0.040 -0.109 0.391
100-249 0.418 0.003 0.056 0.661 0.002 0.986 -0.299 0.024
250-499 0.490 0.004 0.440 0.003 0.315 0.053 -0.112 0.470
500-999 0.603 0.004 0.524 0.003 0.551 0.007 -0.029 0.878
1000+ 0.655 0.001 0.872 0.000 0.456 0.010 -0.316 0.050
Geo responsibility: National2 0.109 0.386 -0.038 0.734 -0.032 0.790 -0.044 0.704
Geo responsibility: Regional2 -0.044 0.808 0.195 0.246 -0.057 0.746 -0.189 0.264
General government agency3 0.112 0.207 -0.188 0.024 0.256 0.003 -0.144 0.090
Training for innovation4 0.352 0.000 0.263 0.007 0.502 0.000 0.346 0.000
Innovation groups5 0.289 0.038 0.223 0.071 0.026 0.846 0.383 0.004
National per capita income6 0.014 0.000 0.007 0.000 0.002 0.183 0.012 0.000
Number of types of proc/org 0.273 0.000 0.314 0.000 0.378 0.000 0.286 0.000
Bottom up innovator 0.089 0.414 0.271 0.009 0.088 0.414 0.283 0.007
External knowledge innovator 0.107 0.319 0.262 0.010 0.134 0.213 0.266 0.010
Constant -1.990 0.000 -1.969 0.000 -1.305 0.000 -1.648 0.000
Nagelkerke R2 0.15 0.16 0.14 0.10
% correctly classified 70.7% 63.7% 69.8% 67.5%
1: Reference category is 10-49 employees. 2: Reference category is local agencies. 3: Reference category is agencies with specific responsibilities only (education, health, housing, environment, etc). 4. 50% or more of employees participate in regular group meetings to develop new or significantly improved innovations. 5. Training specifically for implementing, using or providing new or improved processes or organisational methods. 6. Purchasing power standards (PPS) for 2010. Statistically significant results (p<0.05) are marked in bold font.

25
5. Conclusions We use exploratory factor and cluster analysis to identify three different strategies or methods that European public agencies use to innovate: policy driven methods, bottom up methods and external knowledge methods. Each innovation method is used by approximately one-third of the eligible innovative agencies that responded to the 2010 IB survey. Policy driven innovators The first method is characterised by a policy driven approach to innovation, with innovation implemented in response to mandated changes in the agency budget, new laws or regulations, new policy priorities, or the mandated introduction of new services. This method is used by 30.4% of the agencies. This method can be considered as the ‘classic’ public sector approach to innovation, or at least it meets common perceptions of how a public agency might innovate (Clark et al, 2008). For example, compared to the two other methods, significantly fewer policy-driven innovators actively encourage staff participation in innovation, either through work groups to develop innovations or through training to assist with the implementation of innovations. These agencies are also less likely to collaborate on the development of an innovation with external organisations or to obtain essential information for innovation from any external source and particularly from an external source in a different country. It is possible that the top-down nature of innovation within these agencies removes the need for involving staff or external sources in its innovation activities. Another explanation is that policy driven agencies have less autonomy and are responsible for implementing innovations developed by higher levels in the government bureaucracy: regression analysis shows that they are significantly smaller than the other two types of agencies and a higher percentage serve local areas versus regional or national areas. One expectation is that policy-driven innovators should be more common in traditional economies where work and decision making is more likely to be organised hierarchically in contrast to a flatter, more participatory structure. This expectation was rejected: policy-driven agencies do not consistently dominate countries with hierarchical work structures. However, the nationality of the agency does have a large effect on the distribution of the three innovation methods within each country, but the effect is due to differences in economic development, as measured by average per capita income. Bottom up innovators The second method is characterised by a ‘bottom up’ approach to innovation and is the opposite of the policy driven approach. Bottom up innovators have active management support for innovation and have implemented several policies to encourage the development of innovative ideas and tests of their efficacy. These include incentive programs for staff, support for trial and error testing, and methods to evaluate new services. This method is used by 34.3% of the agencies. Compared to policy driven agencies, a significantly higher percentage of the employees of bottom up agencies take part in work groups to develop innovations and in training for innovation. They are also more likely to collaborate on innovation and to obtain essential knowledge for their innovation activities from organisations outside their country. They are also the largest agencies in terms of the number of employees and are more likely to serve the entire nation. They are particularly prevalent in the Netherlands and Scandinavia, which have the highest level of participatory work organisational structures. This method also accounts for over half of all agencies in Hungary, Switzerland, the United Kingdom, and Ireland. External knowledge innovators The third method is used by 35.3% of the agencies. These agencies report high levels of barriers to innovation and seek to overcome them by drawing on sources outside of the agency for assistance with developing an innovation. These external sources include enterprises as clients or suppliers, users of agency services, visits to conferences, professional organisations, and best practice experience of other governments. These agencies are significantly different from policy driven innovators but similar to those of bottom up innovators, although slightly more offer training, collaborate with external organisations, and obtain essential knowledge for their innovative activities from organisations outside their country. They are the most prevalent innovation method in the developing and transition countries of the European Union and in the Mediterranean countries.

26
The distribution of bottom up and external knowledge innovators is linked to national per capita average incomes. An increase in income increases the share of bottom up innovators, whereas a decrease in income increases the share of external knowledge innovators. This relationship remains after controlling for agency size and geographical area of responsibility. A possible explanation could be linked to ‘catch up’ policies. Public agencies in developing and transition countries could be drawing on the experience of more developed countries. In contrast, countries at the frontier of agency efficiency and governance have no choice but to develop ‘leading edge’ public sector innovations by themselves. There are obvious parallels here with the private sector, where firms in developing countries innovate through imitation while firms at the technological frontier must invest in developing new technology in-house. However, in the public sector, where there is minimal market competition between agencies in different countries, both innovating through a focus on external knowledge and through bottom up methods appears to be equally effective, as shown by the results for innovation outputs. Effect of innovation methods on outputs Although this study is limited to public agencies that report at least one innovation, policy driven agencies are less likely than the other two types of innovators to introduce a service, communication, or process/organisational innovation and they introduce fewer types of process/organisational innovations. They are also significantly less likely to introduce a new service before other public agencies in their country and a lower percentage of their services was either introduced in the previous three years or significantly improved. In respect to four negative effects of service and process/organisational innovation, there are no significant differences between the three innovation methods. In contrast, a significantly lower percentage of policy driven innovators report each of five positive effects from service innovations and four positive effects from process/organisational innovations. For almost all positive effects from innovation, the poorer performance of policy driven innovators remains after controlling for the effect of agency size, geographic area of responsibility, the use of innovation groups and training, and national per capita income. The exception is improved user satisfaction from innovative services, for which there is no significant difference between policy driven innovators and the other two innovation methods. The poorer performance of policy driven innovators for positive effects is puzzling. This is unlikely to be due to biases in the responses to these questions, since there is no difference between the three types of innovators for the questions on the negative effects of innovation. A possible explanation is that policy driven innovators introduce fewer innovations and consequently have fewer chances to observe a benefit from at least one type of innovation. This effect is partly controlled for in a second model for process/organisational innovations, where data are available on the variety of innovations (a proxy for an innovation count). Policy driven innovators introduce an average of 2.5 types of process/organisational innovations compared to 3.1 for bottom up innovators and 3.4 for external knowledge innovators. The inclusion of this variable reduces the difference between policy driven innovators and the other two innovation methods for four positive effects, but the difference is still statistically significant and in favour of the other two innovation methods for two of these four positive effects: a reduction in the cost of services and an improvement in employee satisfaction or working conditions. As argued above in section 4.2, these results do not necessarily reduce the advantages of the external knowledge and bottom up innovation methods, since these two methods could have been intentionally introduced to increase the number and variety of innovations. In this case, the number of different types of innovations is a direct outcome of the innovation method itself. A second possible explanation is that a policy driven innovation strategy, based on top down mandates, is less effective at developing high quality innovations. To obtain maximum benefits, agencies need to either evaluate their services after implementation (as used by bottom up innovators) or draw on the experience of external organisations (as used by external knowledge innovators).

27
References Arundel A, Lorenz E, Lundvall B-A, and Valeyre A, (2007), How Europe's economies learn: a
comparison of work organization and innovation mode for the EU-15, Industrial and Corporate Change, 16:1175-1210.
Borins, S. (2001), "Encouraging innovation in the public sector", Journal of Intellectual Capital, 2:310 – 319.
Borins S (2006), “The challenge of innovating in Government”, IBM Center for Business of Government.
Bugge MM, Mortensen PS and Bloch C. (2011), Measuring Public Innovation in Nordic Countries: Report on the Nordic Pilot Studies, Danish Centre for Studies in Research and Research Policy (CFA), University of Aarhus, February.
Clark J, Good B, Simmonds P. (20098), Innovation in the Public and Third Sectors, NESTA, Working Paper September 2008, NESTA (National Endowment for Science Technology and the Arts, London.
Corrocher N, Cusmano L, Morrison A. (2009), ‘Modes of innovation in knowledge-intensive business services evidence from Lombardy, Journal of Evolutionary Economics, 19:173-196.
Cuervo-Cazurra A, Un CA. (2010), ‘Why some firms never invest in formal R&D’, Strategic Management Journal 31: 759-779.
European Commission (2011), “Innobarometer 2010:Analytical ReportInnovation in Public Administration, DG Enterprise, Brussels.
Frenz M, Lambert R (2009), ‘Exploring non-technological and mixed modes of innovation across countries’, in OECD, Innovation in Firms: A microeconomic perspective, OECD, Paris.
Hollenstein H.(1996), A composite indicator of a firm’s innovativeness. An empirical analysis based on survey data for Swiss manufacturing. Research Policy 25:633-645.
Hollenstein H. (2003), Innovation modes in the Swiss service sector: a cluster analysis based on firm level data. Research Policy 32:845-863.
Hughes A, Moore K, and Kataria N (2011), ‘Innovation in Public Sector Organisations: A Pilot Survey for Measuring Innovation Across the Public Sector’, NESTA, London.
Jensen MB, Johnson B, Lorenz B, Lundval BA. (2007), Forms of knowledge and modes of innovation. Research Policy 36:680-693.
de Jong JPG and Marsili O (2006), ‘The fruit flies of innovations: A taxonomy of innovative small firms’, Research Policy 35:213-229.
Koch P and Hauknes J (2005), Innovation in the Public Sector, Report No. D20, NIFU Step, Oslo.
Knell M, Srholec M (2010), ‘The novelty of innovation and the level of development’, paper for the Bi-annual conference of the European Association for Comparative Economic Studies, August 26-28, Tartu, Estonia.
Leiponen A, Drejer I. (2007), What exactly are technological regimes? Intra-industry heterogeneity in the organisation of innovation activities. Research Policy 36:1221-1238.
Mulgan, G. and Albury, D. (2003), Innovation in the Public Sector, Strategy Unit, Cabinet Office, October.
OECD (Organisation for Economic Co-operation and Development) (2005), Oslo Manual: Guidelines for Collecting and Interpreting Innovation Data. OECD, Paris.
Peeters L, Swinnen G, Tiri M. (2004), ‘Patterns of innovation in the Flemish business sector: A multivariate analysis of CIS-3 firm-level data’, IWT Observatory, Insitutute for the promotion of innovation by science and technology in Flanders.
Pavitt K. (1984), ‘Sectoral Patterns of Technical Change - Towards a Taxonomy and a Theory’, Research Policy 13:343-373.

28
Sellenthin MO, Hommen L. (2002), ‘How innovative is Swedish industry? A factor and cluster analysis of CIS 2’, International Review of Applied Economics, 16:319-331.
Srholec M, Verspagen B. (2008), The voyage of the Beagle in innovation systems land: explorations on sectors, innovation, heterogeneity and selection, UNU-MERIT Working Papers Series # 2008-008, UNU-MERIT, Maastricht.
Thenint H (2010), “Innovation in the Public Sector”, INNO-GRIPS, Pro-Inno Europe, February.
Veugelers R, Cassiman B. (1999), ‘Make and buy in innovation strategies: evidence from Belgian manufacturing firms’, Research Policy 28: 63-80.

29
ANNEX: EPSIS questionnaire on Public Services Innovation
Organisation information
Please answer all questions for the organisation for which you are responsible. For example, if you are
responsible for the regional office of a national organisation, only answer for your regional office.
Now let me start with a few basic questions on your organisation.
D1. How many employees does your organisation have?
READ OUT – ONE ANSWER ONLY
- Less than 10 ...............................1 THANK AND TERMINATE
- Between 10 and 49 ................................................................ 2
- Between 50 and 99 ................................................................ 3
- Between 100 and 249 ............................................................ 4
- Between 250 and 499 ............................................................ 5
- Between 500 and 999 ............................................................ 6
- 1000 or more .......................................................................... 7
- [DK/NA]................................................................................... 9
D2. Is your organisation?
READ OUT – ONE ANSWER ONLY a) A government organisation or owned by the government .................................................. 1
b) A not for profit organisation which is independent from the government ........................... 2
c) A private sector organisation ............................................................................................... 3
D3. Which of the following are part of your organisation’s main areas of responsibility? Select up to the three
most representative activities for your organisation.
READ OUT – UP TO 3 ANSWERS a) General government activities or finance.................................................................. 1
b) Education ................................................................................................................... 2
c) Health ......................................................................................................................... 3
d) Social services ........................................................................................................... 4
e) Culture, sport or recreation........................................................................................ 5
f) Housing....................................................................................................................... 6
g) Environment............................................................................................................... 7
h) Other .......................................................................................................................... 9
D4. Which of the following best describes the geographic area served by the organisation where you work?
READ OUT – ONE ANSWER ONLY

30
Local ................................................................................................................................ 1
Regional........................................................................................................................... 2
National............................................................................................................................ 3
Section 1: Innovation The next set of questions asks if your organisation has introduced, since January 2008, any innovations. An
innovation is a new or significantly improved service, communication method, process, or organisational
method.
Q1. Since January 2008, did your organisation introduce any new or significantly improved services?
ONE ANSWER ONLY - Yes............................................................................................ 1
- No ............................................................................................. 2
- [DK/NA]..................................................................................... 9
[IF “NO” OR “DK/NA” GO TO Q5]
Q2. Were any of these services:
ONE ANSWER ONLY
New to the public administration in your country. ................................................................ 1
Only new to your organisation.............................................................................................. 2
[DK/NA]................................................................................................................................. 9
Q3. Were any of these new or significantly improved services developed by:
READ OUT – ONE ANSWER PER LINE - Yes............................................................................................ 1
- No ............................................................................................. 2
- [DK/NA]..................................................................................... 9
a) Your organisation together with other public sector organisations, including regional or
national affiliates of your organisation...............................................................................1 2 9
b) Your organisation together with private businesses.....................................................1 2 9
c) Your organization together with not-for-profit organisations.........................................1 2 9
d) Your organisation by itself.............................................................................................1 2 9
e) Other organisations or businesses, with your organisation making no further changes or
only minimal changes ........................................................................................................1 2 9
Q4 Please think of the different types of services provided by your organization in 2010. What percent of
these are new or have been significantly improved since January 2008?
READ OUT – ONE ANSWER ONLY

31
- Less than 25%.......................................................................... 1
- Between 25% and 49%............................................................ 2
- Between 50% and 74%............................................................ 3
- 75% or more ............................................................................. 4
- [DK/NA]..................................................................................... 9
Q5. Since January 2008, did your organisation introduce any new or significantly improved methods of
communicating your activities to the public, such as …?
READ OUT – ONE ANSWER PER LINE - Yes............................................................................................ 1
- No ............................................................................................. 2
- [DK/NA]..................................................................................... 9
a) New or improved methods of promoting your organisation or your services ...............1 2 9
b) New or improved methods of influencing the behaviour of users, citizens or others...1 2 9
c) First time commercialisation (for sale) of services or goods.........................................1 2 9
Q6. Since January 2008, did your organisation introduce any new or significantly improved processes or
organisational methods, such as …?
READ OUT – ONE ANSWER PER LINE - Yes............................................................................................ 1
- No ............................................................................................. 2
- [DK/NA]..................................................................................... 9
a) New or improved methods of providing services or interacting with your users ..........1 2 9
b) New or improved delivery or logistics systems for your inputs.....................................1 2 9
c) New or improved supporting activities such as maintenance systems, purchasing,
accounting, or computing systems, etc ............................................................................1 2 9
d) New or improved management systems ......................................................................1 2 9
e) New or improved methods of organising work responsibilities or decision making. ....1 2 9
[IF “NO” OR “DK/NA” TO ALL OPTIONS GO TO Q8]

32
Q7. Were any of these new or significantly improved processes or organisational methods developed by:
READ OUT – ONE ANSWER PER LINE - Yes............................................................................................ 1
- No ............................................................................................. 2
- [DK/NA]..................................................................................... 9
a) Your organisation together with other public sector organisations, including regional or
national affiliates of your organisation...............................................................................1 2 9
b) Your organisation together with private businesses.....................................................1 2 9
c) Your organization together with not-for-profit organisations.........................................1 2 9
d) Your organisation by itself.............................................................................................1 2 9
e) Other organisations or businesses, with your organisation making no further changes or
only minimal changes ........................................................................................................1 2 9
Section 2: Work force and skills
Q8. In 2010, approximately what percent of your organisation’s employees had a university degree?
READ OUT – ONE ANSWER ONLY - 0%............................................................................................. 1
- Between 1% and 9%................................................................ 2
- Between 10% and 24%............................................................ 3
- Between 25% and 49%............................................................ 4
- Between 50% to 74%............................................................... 5
- 75% or more ............................................................................. 6
- [DK/NA]..................................................................................... 9
[IF ALL ANSWERS TO QUESTION Q1, Q5, and Q6 ARE “NO” OR “DON’T KNOW” GO TO Q17]
Q9. What percent of your employees are currently involved in groups that meet regularly to develop new or
significantly improved services, communication methods, processes or organisational methods?
READ OUT – ONE ANSWER ONLY - None ......................................................................................... 1
- Less than 25% ......................................................................... 2
- Between 25% and 49% ........................................................... 3
- Between 50% and 74% ........................................................... 4
- 75% or more ............................................................................. 5
- [DK/NA]..................................................................................... 9

33
Q10. Since January 2008, did your organization provide training for your employees specifically for
implementing, using or providing …?
READ OUT – ONE ANSWER PER LINE - Yes............................................................................................ 1
- No ............................................................................................. 2
- [DK/NA]..................................................................................... 9
a) New or improved services.......................................................................................... 1 2 9
b) New or improved communication methods................................................................ 1 2 9
c) New or improved processes or organisational methods............................................ 1 2 9
Section 3: Effects of innovation
Q11. Have any of your new or significantly improved services, introduced since January 2008, had a major
positive effect by:
READ OUT –ROTATE 1-5 - MULTIPLE ANSWERS POSSIBLE
Enabling your organisation to offer services to more or new types of users..........................1
Enabling your organisation to better target its services..........................................................2
Improving user satisfaction......................................................................................................3
Improving user access to information .....................................................................................4
Enabling faster delivery of services.........................................................................................5
[IF NONE OF 1-5 SELECTED] Other positive effect ..............................................................6
[IF NONE OF 1-5 SELECTED] No positive effect ..................................................................7
Q12. Have any of your new or significantly improved processes or organizational methods, introduced
since January 2008, had a major positive effect by:
READ OUT –ROTATE 1-4 - MULTIPLE ANSWERS POSSIBLE
Simplifying administrative procedures.................................................................................... 1
Reducing costs for providing services.....................................................................................2
Enabling faster delivery of services.........................................................................................3
Improving employee satisfaction or working conditions .........................................................4
[IF NONE OF 1-4 SELECTED] Other positive effect ..............................................................5
[IF NONE OF 1-4 SELECTED] No positive effect ..................................................................6
Q13. Have any of your new or significantly improved services, processes or organizational methods, introduced since January 2008, had a sustained major negative effect by:
READ OUT – ROTATE - MULTIPLE ANSWERS POSSIBLE
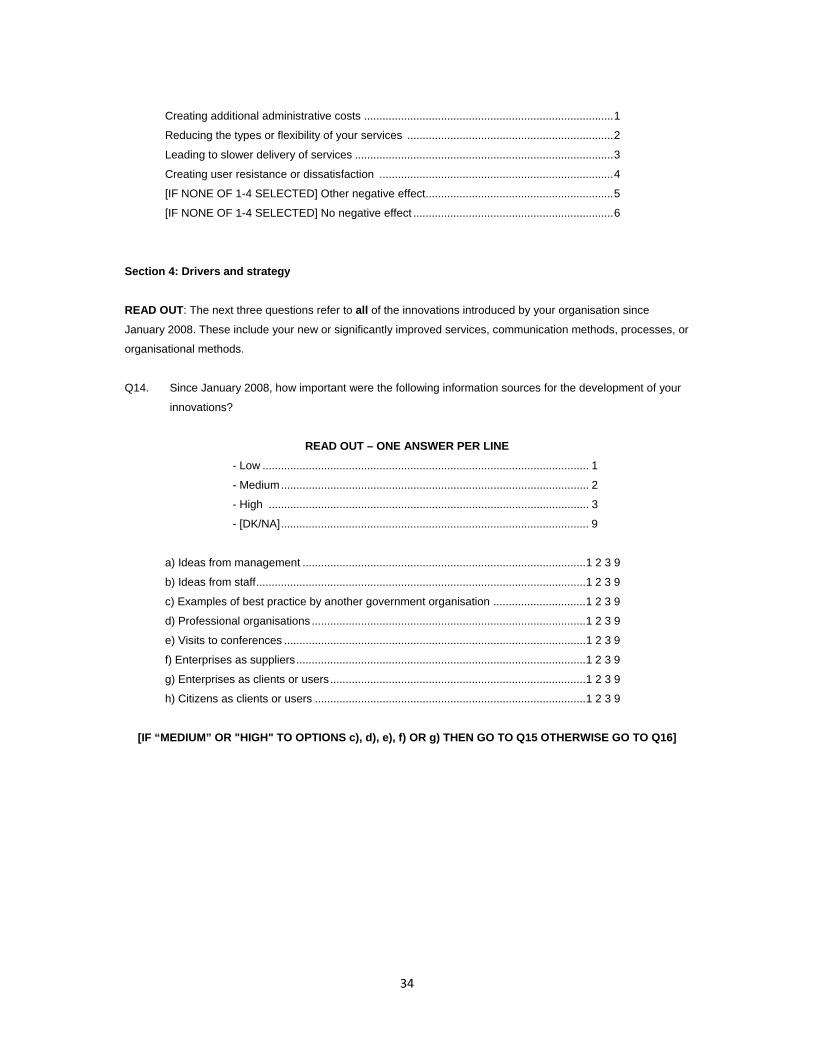
34
Creating additional administrative costs .................................................................................1
Reducing the types or flexibility of your services ...................................................................2
Leading to slower delivery of services ....................................................................................3
Creating user resistance or dissatisfaction ............................................................................4
[IF NONE OF 1-4 SELECTED] Other negative effect.............................................................5
[IF NONE OF 1-4 SELECTED] No negative effect .................................................................6
Section 4: Drivers and strategy
READ OUT: The next three questions refer to all of the innovations introduced by your organisation since
January 2008. These include your new or significantly improved services, communication methods, processes, or
organisational methods.
Q14. Since January 2008, how important were the following information sources for the development of your
innovations?
READ OUT – ONE ANSWER PER LINE - Low .......................................................................................................... 1
- Medium.................................................................................................... 2
- High ........................................................................................................ 3
- [DK/NA].................................................................................................... 9
a) Ideas from management ............................................................................................1 2 3 9
b) Ideas from staff...........................................................................................................1 2 3 9
c) Examples of best practice by another government organisation ..............................1 2 3 9
d) Professional organisations .........................................................................................1 2 3 9
e) Visits to conferences ..................................................................................................1 2 3 9
f) Enterprises as suppliers..............................................................................................1 2 3 9
g) Enterprises as clients or users...................................................................................1 2 3 9
h) Citizens as clients or users ........................................................................................1 2 3 9
[IF “MEDIUM” OR "HIGH" TO OPTIONS c), d), e), f) OR g) THEN GO TO Q15 OTHERWISE GO TO Q16]

35
Q15. Since January 2008, did you obtain information essential to your innovations from any of the following
sources?
READ OUT – ONE ANSWER PER LINE - Yes............................................................................................ 1
- No ............................................................................................. 2
- [DK/NA]..................................................................................... 9
a) An organisation, enterprise or event in your country ..........................................................1 2 9
b) An organisation, enterprise or event in another European Union country..........................1 2 9
c) An organisation, enterprise or event outside the European Union .....................................1 2 9
d) A European Commission organisation or event..................................................................1 2 9
Q16. How important were the following political or legislative factors in driving the development and
introduction of your innovations since January 2008?
READ OUT – ONE ANSWER PER LINE - Low .......................................................................................................... 1
- Medium.................................................................................................... 2
- High ........................................................................................................ 3
- [DK/NA].................................................................................................... 9
a) Mandated decrease in your organisation’s budget....................................................1 2 3 9
b) Mandated increase in your organisation’s budget .....................................................1 2 3 9
c) New laws or regulations .............................................................................................1 2 3 9
d) New policy priorities ...................................................................................................1 2 3 9
e) Mandated introduction of new e-government or online services...............................1 2 3 9

36
Q17. How well do the following apply to your organisation since January 2008?
[IF ALL ANSWERS TO QUESTION Q1, Q5, and Q6 ARE “NO” OR “DON’T KNOW” ONLY ASK QUESTIONS 17a and 17c]
READ OUT – ONE ANSWER PER LINE - Not at all .................................................................................................. 1
- Partly........................................................................................................ 2
- Fully ........................................................................................................ 3
- [DK/NA].................................................................................................... 9
a) Managers support trial-and-error testing of new ideas..............................................1 2 3 9
b) Managers takes an active role in developing and implementing innovations ...........1 2 3 9
c) Staff have incentives to think of new ideas and take part in their development........1 2 3 9
d) Users are involved in the design or planning of new or improved services ..............1 2 3 9
e) New or improved services are evaluated after completion........................................1 2 3 9
Section 5: Barriers
Q18. Since January 2008, how important were the following factors in preventing or delaying your
organization’s efforts to develop or introduce new or significantly improved services, communication
methods, processes or organisational methods?
READ OUT – ONE ANSWER PER LINE - Not important ........................................................................................... 1
- Low importance ....................................................................................... 2
- Medium importance ................................................................................ 3
- High importance ..................................................................................... 4
- [DK/NA].................................................................................................... 9
a) Lack of management support .................................................................................1 2 3 4 9
b) Lack of incentives for your staff ..............................................................................1 2 3 4 9
c) Staff resistance........................................................................................................1 2 3 4 9
d) Uncertain acceptance by the users of your services..............................................1 2 3 4 9
e) Regulatory requirements ........................................................................................1 2 3 4 9
f) Lack of sufficient human or financial resources.......................................................1 2 3 4 9
g) Risk adverse culture in your organisation...............................................................1 2 3 4 9

37
Section 6: Procurement
Q19. Since January 2008, did your organisation put out tenders to private businesses to provide any of the
following goods and services?
READ OUT – ONE ANSWER PER LINE - Yes............................................................................................ 1
- No ............................................................................................. 2
- [DK/NA]..................................................................................... 9
a) ICT equipment or systems ............................................................................................1 2 9
b) Technologies or services to improve environmental or energy performance ..............1 2 9
c) Other types of technology .............................................................................................1 2 9
d) Consulting to recommend, design or pilot test new or improved services ...................1 2 9
e) R&D for new technologies and services .......................................................................1 2 9
f) Provide one or more services to your users ..................................................................1 2 9
[IF “NO” OR “DK/NA” TO ALL OPTIONS GO TO QUESTION 23]
Q20. Prior to publishing tenders does your organisation usually consult with …?:
READ OUT – MULTIPLE ANSWERS POSSIBLE Potential suppliers/ contractors................................................................................................ 1
The users of your services ....................................................................................................... 2
Other organisations conducting similar procurements ............................................................ 3
Other organisations providing specialist advice ..................................................................... 4
Q21. For an applicant to be successful in a tender from your organisation do you consider that…
READ OUT – ONLY ONE ANSWER …low cost is more important than innovation for winning the tender ....................... 1
…innovation is more important than low cost for winning the tender ....................... 2
…cost and innovation have equal importance for winning the tender...................... 3
DK/NA ........................................................................................................................ 9
Q22. Did any of your tenders since January 2008 obtain the following results?
READ OUT – MULTIPLE ANSWERS POSSIBLE
Introduce a new or significantly improved service provided by or for your organisation........1
Significantly reduce the costs of providing existing services ..................................................2
Significantly reduce the environmental impacts of your services ...........................................3

38
Section 7: Expected developments in the next two years Q23. Over the next two years, do you expect any of the following factors to have a positive or negative impact
on the ability of your organisation to introduce new or significantly improved services?
READ OUT – ONE ANSWER PER LINE - Positive impact ........................................................................................ 1
- Negative impact....................................................................................... 2
- No impact ............................................................................................... 3
- [DK/NA].................................................................................................... 9
a) Mandated decrease in your organisation’s budget....................................................1 2 3 9
b) Mandated increase in your organisation’s budget .....................................................1 2 3 9
c) New laws or regulations .............................................................................................1 2 3 9
d) New policy priorities ...................................................................................................1 2 3 9
e) Increasing demand from citizens ...............................................................................1 2 3 9
f) Introduction of new technologies ................................................................................1 2 3 9
Q24. Compared to the period between 2008 and 2010, do you expect the number of innovations introduced
by your organisation over the next two years to increase, decrease, or remain unchanged?
READ OUT – ONE ANSWER PER LINE
- Increase.................................................................................... 1
- Decrease .................................................................................. 2
- Remain the same ..................................................................... 9
a) Number of new or significantly improved services .......................................................1 2 9
b) Number of new or significantly improved communication methods .............................1 2 9
c) Number of new or significantly improved processes or organisational methods .........1 2 9