Embed Size (px)
Citation preview
Review of Income and Wealth Series 43, Number 1, March 1997
A TAXONOMY O F MULTILATERAL METHODS FOR
MAKING INTERNATIONAL COMPARISONS
O F PRICES AND QUANTITIES
BY ROBERT J. HILL
University of New South Wula
A taxonomy of multilateral methods is developed. All the main methods are classified within the taxonomy. It is then shown that methods in the same class share many of the same properties. Therefore the taxonomy should help practitioners to appreciate the wide range of alternative methods for making international comparisons, the relationships between methods, and the relative strengths and weaknesses of each method.
Many different methods have been proposed for making multilateral inter- national comparisons of prices and quantities. The various methods were generally advocated by different authors from different perspectives using different nota- tions. Hence the relationships between methods in the literature are frequently unnecessarily obscured. This paper develops a taxonomy that builds on the pione- ering work of Van Ijzeren (1987), and rationalizes the literature, by classifying all the main methods within a general framework. The taxonomy groups methods together if and only if they can be shown to be special cases of a more general method thereby revealing the underlying generic similarities between apparently different methods. The taxonomy reveals five main classes of methods, which are called here Multilateral Generalized Tornqvist, Average Basket, Average Price, Fisher Star and Mean Asymmetric Star. Methods in each class are shown to share many of the same strengths and weaknesses. Therefore, the taxonomy serves both to rationalize the literature, and to help users find the multilateral method most suited to their purpose.
2.1. Multiluterul PPPs und Quuntity Indices
Consider the problem of calculating multilateral (transitive) Purchasing Power Parities (PPPs) denoted by Px and quantity indices denoted by Qk, over a set of K countries. If the quantity indices are normalized to sum to one, then they are called output shares. It is assumed that each country indexed by k = 1, . . . , K, supplies price and quantity data (pk , , qkr), defined over the same set of goods and services, indexed by i = I, . . . , N.
Note: I would like to thank Erwin D~ewert, Bert Balk, Peter Hill, and two anonymous referees for helpful comments. Any remaining errors are my own.
The performance of each class of multilateral method identified in the taxon- omy is evaluated with reference to five index number tests and the Gerschenkron effect. These tests and the Gerschenkron effect are described below.'
(i) Weak Fuctor Reversul Test
A multilateral method satisfies the Weak Factor Reversal Test if its price and quantity indices are related as shown in ( I ) .
(ii) Strong Factor Reversal Test
A multilateral method satisfies the Strong Factor Reversal Test if first, it satisfies the Weak Factor Reversal Test and second, the PPP formula can be obtained from the quantity index formula by simply interchanging the price and quantity vectors. The Strong Factor Reversal Test is important because if satisfied, it implies that a method calculates quantity indices and PPPs in a symmetric or balanced manner.
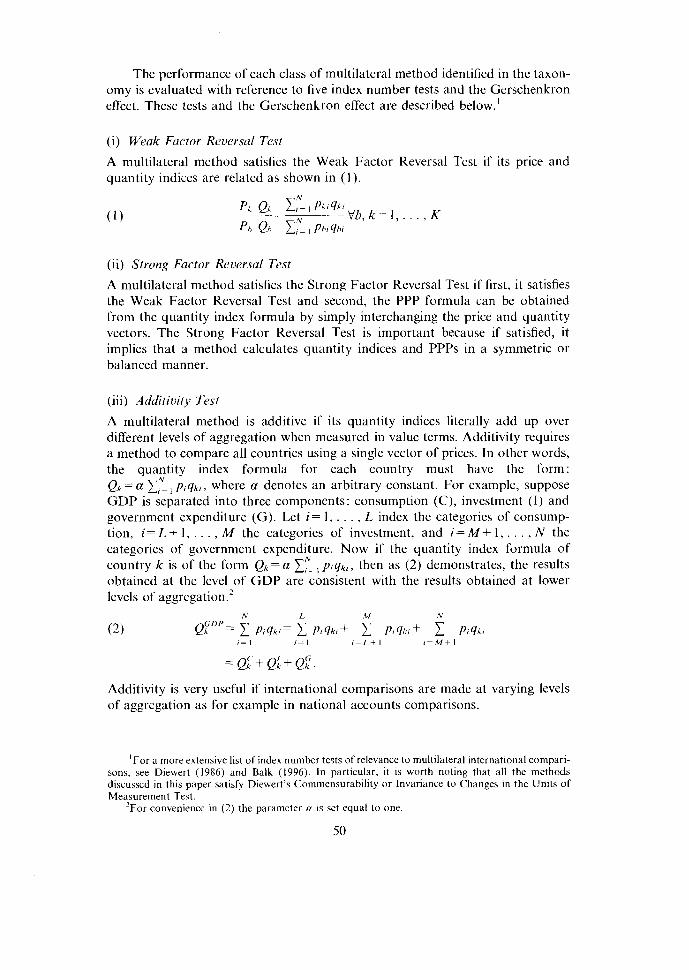
(iii) Additivity Test
A multilateral method is additive if its quantity indices literally add up over different levels of aggregation when measured in value terms. Additivity requires a method to compare all countries using a single vector of prices. In other words, the quantity index formula for each country must have the form:
N Q k = a X I = , p,qkl, where a denotes an arbitrary constant. For example, suppose GDP is separated into three components: consumption (C), investment (I) and government expenditure (G). Let i = I, . . . , L index the categories of consump- tion, i= L+ 1, . . . , M the categories of investment, and i= M + I , . . . , N the categories of government expenditure. Now if the quantity index formula of
N country k is of the form Q,, = a I ,_ , plqkl , then as (2) demonstrates, the results obtained at the level of GDP are consistent with the results obtained at lower levels of aggregation.2
Additivity is very useful if international comparisons are made at varying levels of aggregation as for example in national accounts comparisons.
'For a more extensive list of index number tests of relevance to multilateral international compari- sons, see Diewert (1986) and Balk (1996). In particular, it is worth noting that all the methods discussed in this paper satisfy Diewert's Commensurability or Invariance to Changes in the Units of Measurement Test.
'For convenience in (2) the parameter a is set equal to one.

(iv) Average Test (Quuntity Indices)
This Average Test seems like a reasonable minimum requirement to impose on a multilateral method. Therefore, it is perhaps surprising to discover that many multilateral methods sometimes violate it.
(v) Average Test (PPPs)
This Average Test also seems like a reasonable minimum requirement to impose on a multilateral method. However, again many multilateral methods violate it. Moreover, methods that always satisfies the Average Test for PPPs will sometimes violate the Average Test for quantity indices and vice versa.3
(vi) The Gerschenkron Eject
The Gerschenkron effect is only applicable to methods that compare all countries using either a reference price or quantity vector. For methods of the former type, the output share of a country tends to fall as the reference price vector becomes relatively more characteristic of its own price vector. Conversely, for methods of the latter type, the output share of a country tends to rise as the reference quantity vector becomes relatively more characteristic of its own quantity vector. This systematic relationship between the reference price or quantity vector and the resulting output shares is known as the Gerschenkron effect.
2.2. Bilateral PPPs and Quuntity Indices
The following bilateral formulae defined over two countries b and k are referred to repeatedly. It should be noted that unlike their multilateral coun- terparts, bilateral indices are intransitive.
N N E l= ~ h t q k r E l = I ~ l i r q h ,
( 5 ) Laspeyres : Ql,k = -F-, P~LX. = N 1 ; - I P ~ I q h l 1 ; - 1 Phiqhr
'see Drechsler and Krzeczkowska (1982)
Also the Country (Time) Reversal Test is referred to in Section 7. This test is defined below in (9). Fisher and Tornqvist satisfy (9) while Paasche and Laspeyres do not.
2.3. Symmetric und Weighted Meuns K It is assumed here that a mean M ( w I , . . . , WK, X I , . . . , xK) = Mk= I (wk, xk)
is a function of K variables, x l , . . . , xK and K parameters or weights wl , . . . , WK, K
such that wk 2 0, Vk = 1 , . . . , K and 1, = , wx = 1. A mean is symmetric if: wl =
w2 = . . . = WK= 1/K. Otherwise a mean is weighted. A mean has at least the follow- ing three properties.4
(i) Min (xl , . . . , XK) 5 M(wI, . . . , WK, X I , . . . , XK) 5 Max (XI , . . . , XK) (Min-Max Property) ;
(ii) M(,(IPI w, Ylx) = M(Y2 W, Y ~ x ) , where Y I and Y2 denote different permu- tations of the components of the vectors w and x (Symmetry);
(iii) If xk > y k , Vk = 1, . . . , K, then :
M(wl,. . . , WK, X I , . . . , xK) > M ( w I , . . . , WK, Y I , . . . , y ~ ) (Monotonicity).
The three best known examples of means are the arithmetic, geometric and harmonic means. These means are used extensively in the calculation of multi- lateral PPPs and quantity indices.
K
Arithmetic Mean : MA(wl , . . . , WK, x I , . . . , XK) = 1 w k xk k - I
K
Geometric Mean: MG(wl, . . . , WK, x l , . . . , XK) = n xIh k - 1
K
Harmonic Mean: MH(wI, . . . , WK, X I , . . . , XK) =
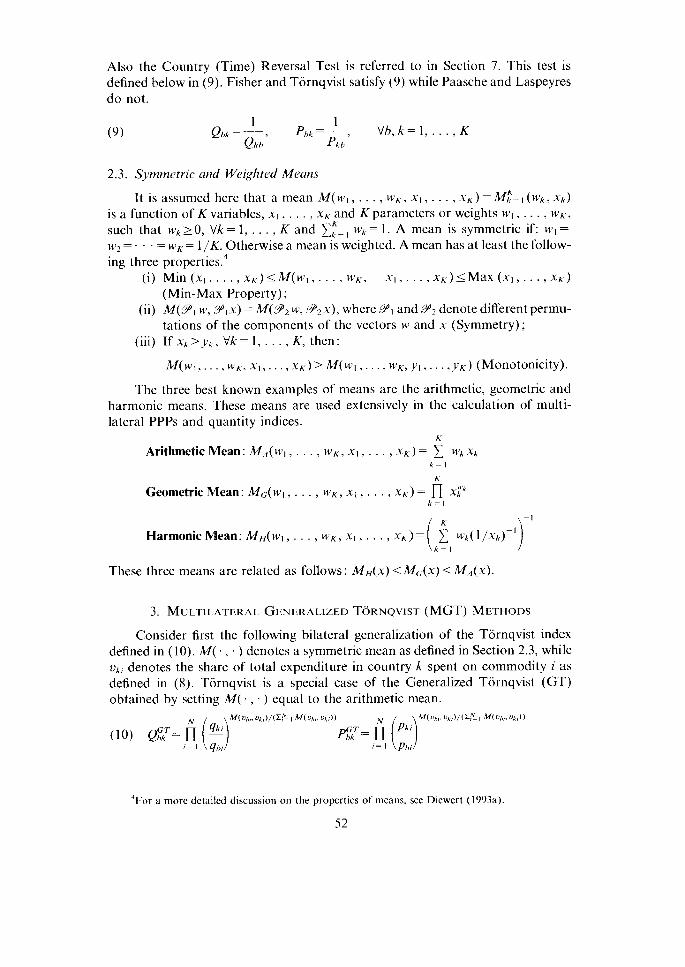
3. MULTILATERAL GENERALIZED TORNQVIST (MGT) METHODS
Consider first the following bilateral generalization of the Tornqvist index defined in (10). M ( . , . ) denotes a symmetric mean as defined in Section 2.3, while vk, denotes the share of total expenditure in country k spent on commodity i as defined in (8). Tornqvist is a special case of the Generalized Tornqvist (GT) obtained by setting M( . , . ) equal to the arithmetic mean.
4 ~ o r a more detailed discussion on the properties of means, see Diewert (1993a).

The bilateral Generalized Tornqvist is turned into a n~ultilateral index by simply redefining M( . , . ) to be a function of all K countries rather than just two count- ries. The Multilateral Generalized Tornqvist (MGT) quantity index and PPP are defined below in ( 1 1 ).
MGT methods differ only in the choice of symmetric mean formula M:= I(v,,). The two best known methods of this type are the Walsh method defined in (12) which uses the geometric mean formula, and the Walsh method with arithmetic weights defined in (13) which uses the arithmetic mean f o r m u ~ a . ~
MGT methods violate the Weak and Strong Factor Reversal Tests, the Additivity Test and both Average Tests. However, at least they are not subject to the Gersch- enkron effect.
Star methods compare countries by linking bilateral indices using the "star" spanning tree depicted in Figure One important implication of using the star spanning tree is that a priori one country must be selected and placed at the center of the star. The country in the center is labelled country X. Comparisons between each pair of countries in the set are made indirectly via country X. The quantity index and PPP between countries h and k are calculated as follows:
Qxk and Px, denote arbitrary bilateral indices. Country X may be one of the countries in the comparison or an artificially created "average" country. In the taxonomy a distinction is drawn between Asymmetric and Symmetric Star methods. Asymmetric Star methods place one of the countries in the comparison at the center of the star, while Symmetric Star methods place an artificial average country at the center of the star.
Symmetric Star methods may differ in two respects. First they may differ with respect to the bilateral index number formula used in (14). Second they may
5 ~ o r a more detailed discussion on these two methods, see Ruggles (1967). "A spanning tree is a set of K vertices (countries) that are connected by exactly K- 1 edges
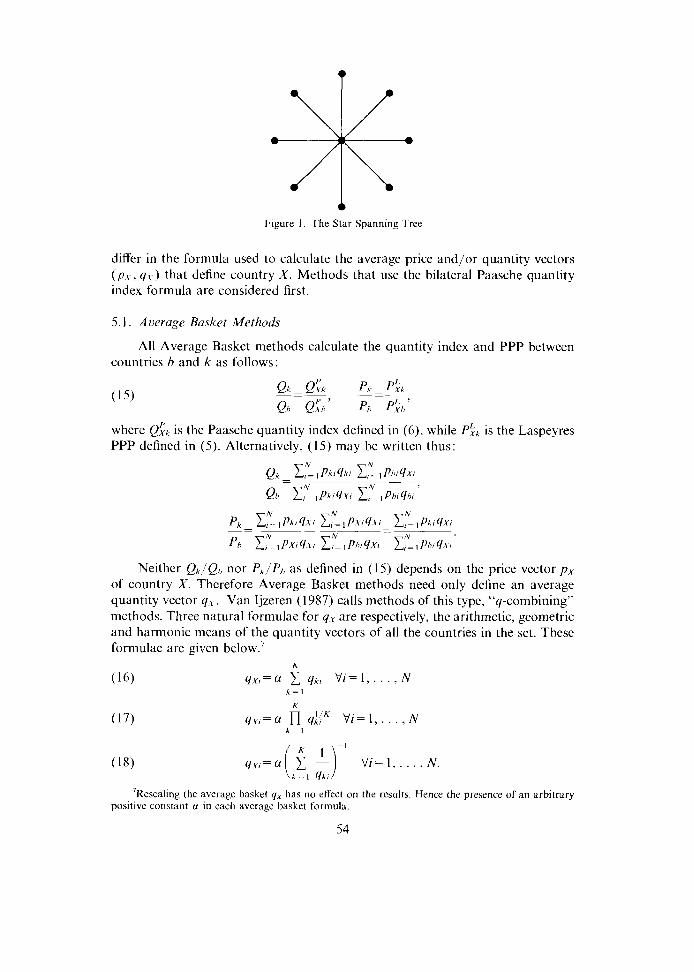
& Figure 1 . The Star Spanning Tree
differ in the formula used to calculate the average price and/or quantity vectors (px, q,) that define country X. Methods that use the bilateral Paasche quantity index formula are considered first.
5.1. Average Basket Methods
All Average Basket methods calculate the quantity index and PPP between countries b and k as follows:
where Q$A is the Paasche quantity index defined in (6), while is the Laspeyres PPP defined in ( 5 ) . Alternatively, (15) may be written thus:
Neither Qk/Q,, nor Pk/Ph as defined in (1 5) depends on the price vector px of country X. Therefore Average Basket methods need only define an average quantity vector qx. Van Ijzeren (1987) calls methods of this type, "q-combining" methods. Three natural formulae for q, are respectively, the arithmetic, geometric and harmonic means of the quantity vectors of all the countries in the set. These formulae are given below.'
I(
(16) qxi=u 1 qk, Vi=I , . . . , N h = l
' ~ e s c a l i n ~ the average basket q, has no cffecl on the results. Hence the presence of an arbitrary positive constant u in each average basket formula.

The Average Basket method that calculates qx using (16) is usually called the ECLAC method. ECLAC stands for United Nations Economic Commission for Latin America and the Caribbean. This method was advocated by Walsh (1901), who called it Scrope's method, and by Van Ijzeren (1956) who called it the weighted heterogenous group method. It is also discussed in Ruggles (1967) and Diewert (1993b). The Average Basket method based on (17) was advocated by Walsh (1901) who called it Scrope's method with geometric weights.8 However, it is referred to here as the Geometric Average Basket method. The Average Basket method based on (18) does not seem to have been advocated in the literature. A logical name for it would be the Harmonic Average Basket method.
Although these three methods differ only in the choice of symmetric mean formula, there is one very important difference between them. The ECLAC method (16) gives countries with larger baskets greater weight in the q, formula. In contrast, the Harmonic Average Basket method (18) gives countries with smaller baskets larger weight in the qx formula. Meanwhile, the Geometric Average Basket method (17) gives equal weight to the baskets of all countries. Therefore, which of these formulae is to be preferred depends on the desired weighting of countries.
Equal weighting across countries can be imposed on ( 1 6 ) and (18) by dividing each quantity vector qk by its corresponding quantity index.' These formulae are
xX are given below. The average baskets qx, and Paasche quantity indices Q' obtained by solving the system of N + K simultaneous equations.
The de-weighting procedure has no effect on the Geometric Average Basket method since it already gives all countries equal weight. In other words, (17) and (20) are equivalent. The Average Basket method that calculates q, using (19) is known as the unweighted Van Ijzeren (1956) heterogenous group method. Van Ijzeren (1956) is a highly original paper that proposes three different methods. The first of these is the heterogenous group method. The homogenous group and balanced methods are discussed later in the paper. The heterogenous group method finds the set of PPPs that equate the ratio of the cost of buying the basket of country j in all countries in the set, to the cost of buying the basket of country j in country j, across all countries j= 1 , . . . , K in the set. The equations defining the heterogenous group PPPs, Pxl , . . . , PxK may be written as follows:
K
(22) c ( W ~ P & P , ~ ) = A P ~ , v j = i , . . . , K, k = l
' ~ ~ a i n see Diewert (1 993b). h his point is made by Van Ijzeren (1987). He calls this procedure "de-weighting."

where wk denote country weights and A is the Perron-Frobenius root of the system." Similarly the equations defining the heterogenous group quantity indices, QXI , . . . , QXK may be written as follows:
Although Van Ijzeren (1956) approaches the multilateral international compari- son problem from a completely different perspective, the solution to (22 ) and (23 ) is nevertheless an Average Basket method. The heterogenous group average basket formula is given in (24 ) . This result is proved in the Appendix, Proof 1.
If wk = 1, Vk = 1, . . . , K, then the average basket formula reduces to (19 ) . If on the other hand the weights wk equal the output shares Q Y ~ / ( ~ ~ Q;,), then the average basket formula reduces to (16 ) .
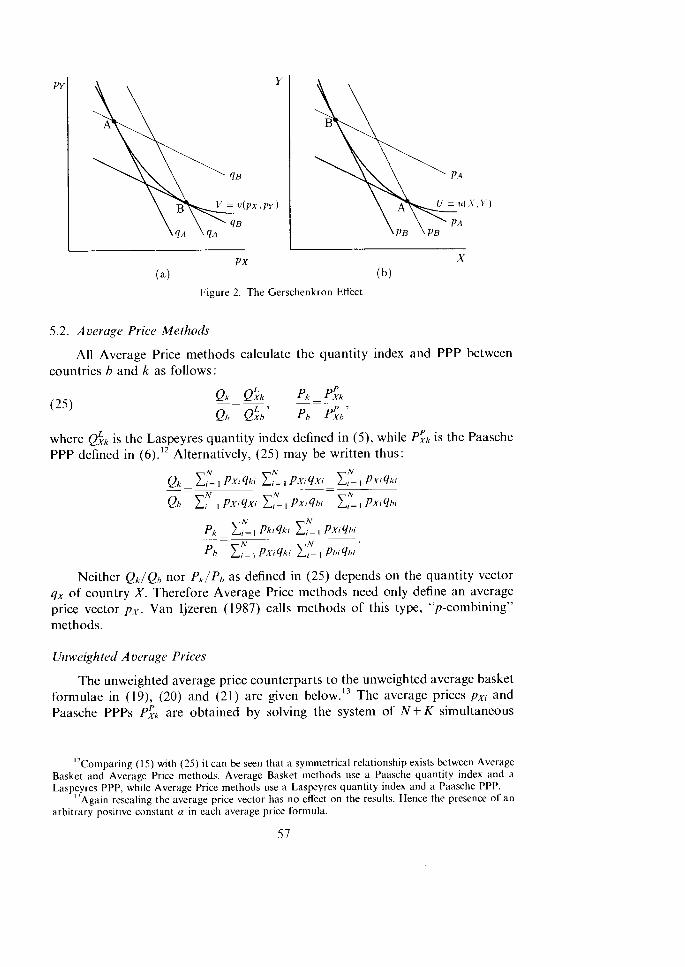
Average Basket methods satisfy the Weak Factor Reversal Test and the Average Test for PPPs. However, Average Basket methods fail the Additivity Test, the Average Test for quantity indices, and the Strong Factor Reversal Test. Furthermore, Average Basket methods are subject to the Gerschenkron effect." According to the Gerschenkron effect, the output share of a country tends to rise as the average basket used in the comparison becomes relatively more character- istic of its own basket as compared with the baskets of the other countries. This implies that measured per capita income differentials across countries will tend to be larger if the average basket is similar to the basket of the richest country than if it is similar to the basket of the poorest country in the comparison. The Gerschenkron effect arises because expenditure patterns change in response to changes in relative prices. Consumers tend to switch their consumption towards relatively cheaper goods. Figure 2(a ) provides an intuitive example of the Gersch- enkron effect as it applies to Average Basket methods. The basket is defined over two goods X and Y. For convenience, countries A and B are placed on the same indifference curve v ( p , , p u ) . The baskets of countries A and B are denoted respectively by q, and q,. Similarly, the price vectors are denoted by p, and po. If A and B are compared using A's basket q , , then Figure 2(a ) implies that: p a . qA < p B . q~ * P:,> 1. Now applying the Weak Factor Reversal Test, the fol- lowing inequality is obtained : Q;,< ( p , . q , ) / ( p , . qA) . In contrast, if A and B are compared using B's basket q ~ , then: p ~ . q , < p ~ . qo+ > I . The Weak Factor Reversal Test now implies that : 1 /QgA > ( p , . q , ) / ( p A . q , ) . Therefore, l / Q g A > Q : ~ . In other words, B appears richer relative to A if B s basket q , is used to make the comparison than if A's basket q, is used.
10 The Perron-Frobenius root measures the strength of the substitution effect across countries. If there is no substitution effect then ,I equals K. In general, L rises as the substitution effect gets stronger. For a more detailed discussion on the properties of Perron-Frobenius roots, see Debreu and Herstein (1953).
he Gerschenkron effect is discussed in more detail in Nuxoll (1994) and Hill (1995).
PX
(a)
Figure 2. The Gerschenkron Effect
5.2. Averuge Price Methods
All Average Price methods calculate the quantity index and PPP between countries h and k as follows:
where ~ f ; . ~ is the Laspeyres quantity index defined in (9, while PL is the Paasche PPP defined in (6).12 Alternatively, (25) may be written thus:
Neither Qk/Qh nor Pk/Ph as defined in (25) depends on the quantity vector qx of country X. Therefore Average Price methods need only define an average price vector px. Van Ijzeren (1987) calls methods of this type, "p-combining" methods.
Unweighted Averuge Prices
The unweighted average price counterparts to the unweighted average basket formulae in (19), (20) and (2 1 ) are given below.I3 The average prices pxi and Paasche PPPs P ; ~ are obtained by solving the system of N + K simultaneous
" ~ o m ~ a r i n g (IS) with (25) it can be seen that a symmetrical relationship exists between Average Basket and Average Price methods. Average Basket methods use a Paasche quantity index and a Laspeyres PPP, while Average Price methods use a Laspeyres quantity index and a Paasche PPP.
I I Again rescaling the average price vector has no effect on the results. Hence the presence of an arbitrary positive constant a in each average price formula.
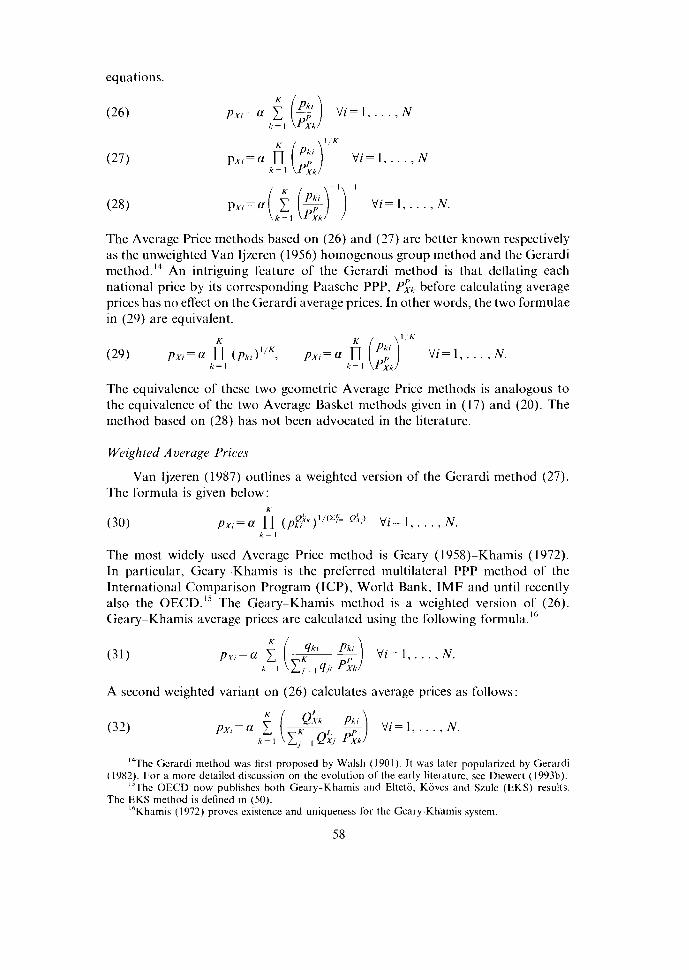
equations.
K
p ($1 V i = l , . . . , H k - l PXk
The Average Price methods based on (26) and (27) are better known respectively as the unweighted Van Ijzeren (1 956) homogenous group method and the Gerardi method.14 An intriguing feature of the Gerardi method is that deflating each national price by its corresponding Paasche PPP, P ; ~ before calculating average prices has no effect on the Gerardi average prices. In other words, the two formulae in (29) are equivalent.
The equivalence of these two geometric Average Price methods is analogous to the equivalence of the two Average Basket methods given in (17) and (20). The method based on (28) has not been advocated in the literature.
Weighed Average Prices
Van Ijzeren (1987) outlines a weighted version of the Gerardi method (27). The formula is given below:
The most widely used Average Price method is Geary (1958)-Khamis (1972). In particular, Geary-Khamis is the preferred multilateral PPP method of the International Comparison Program (ICP), World Bank, IMF and until recently also the OECD.'~ The Geary-Khamis method is a weighted version of (26). Geary-Khamis average prices are calculated using the following formula.'"
A second weighted variant on (26) calculates average prices as follows:
14 The Gerardi method was first proposed by Walsh (1901). It was later popularized by Gerardi (1982). For a more detailed discussion on the evolution of the early literature, see Diewert (1993b).
15 The OECD now publishes both Geary-Khamis and Eltetii, Kiives and Szulc (EKS) results. The EKS method is defined in (50).
16 Khamis (1972) proves existencc and uniqueness for the Geary-Khaniis system.
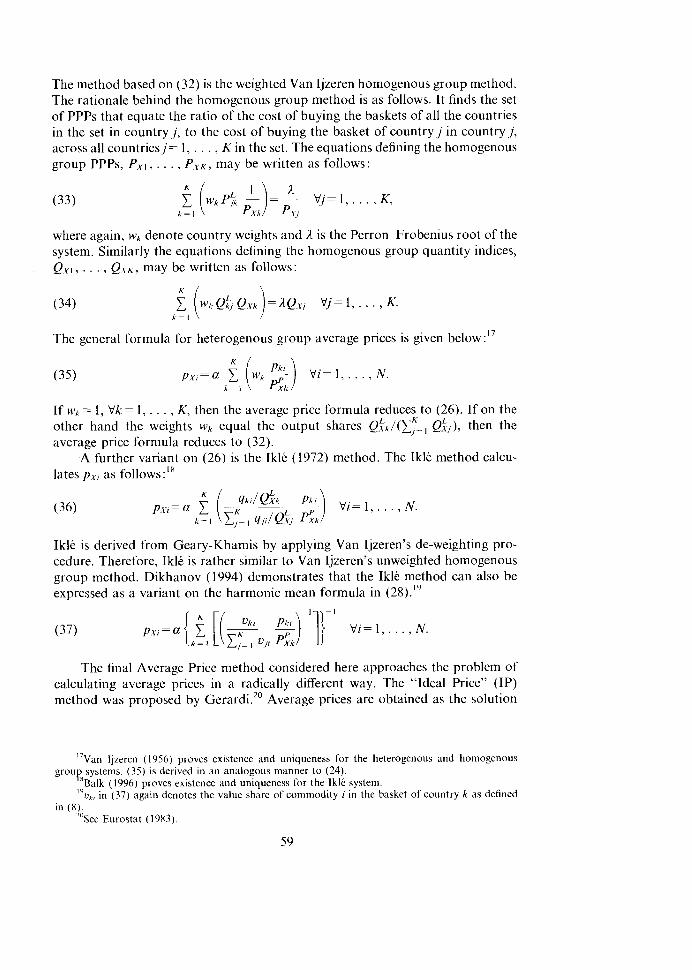
The method based on (32) is the weighted Van Ijzeren homogenous group method. The rationale behind the homogenous group method is as follows. It finds the set of PPPs that equate the ratio of the cost of buying the baskets of all the countries in the set in country j, to the cost of buying the basket of country j in country j, across all countries j= 1, . . . , Kin the set. The equations defining the homogenous group PPPs, P,, , . . . , P,,, may be written as follows:
where again, wk denote country weights and ;1 is the Perron-Frobenius root of the system. Similarly the equations defining the homogenous group quantity indices, (2x1 , . . . , QxK, may be written as follows :
The general formula for heterogenous group average prices is given below :I7
If wk= 1, Vk= 1, . . . , K, then the average price formula reduces to (26). If on the other hand the weights wk equal the output shares Q~;~/(C;=, ~ f ; ~ ) , then the average price formula reduces to (32).
-A further variant on (26) is the Ikle (1972) method. The Ikle method calcu- lates p,, as follows : I 8
Ikle is derived from Geary-Khamis by applying Van Ijzeren's de-weighting pro- cedure. Therefore, IkE is rather similar to Van Ijzeren's unweighted homogenous group method. Dikhanov (1994) demonstrates that the Ikli method can also be expressed as a variant on the harmonic mean formula in (28).19
The final Average Price method considered here approaches the problem of calculating average prices in a radically different way. The "Ideal Price" (IP) method was proposed by ~ e r a r d i . ~ ' Average prices are obtained as the solution
17 Van Ijzeren (1956) proves existence and uniqneness for the heterogenous and homogenous grou systems. (35) is derived in an analogous manner to (24).
'';a;k (1996) proves existence and uniqueness for the lk l i system. 19
u,, in (37) again denotes the value share of commodity i in the basket of country k as defined in (8).
"'see Eurostat (1983).
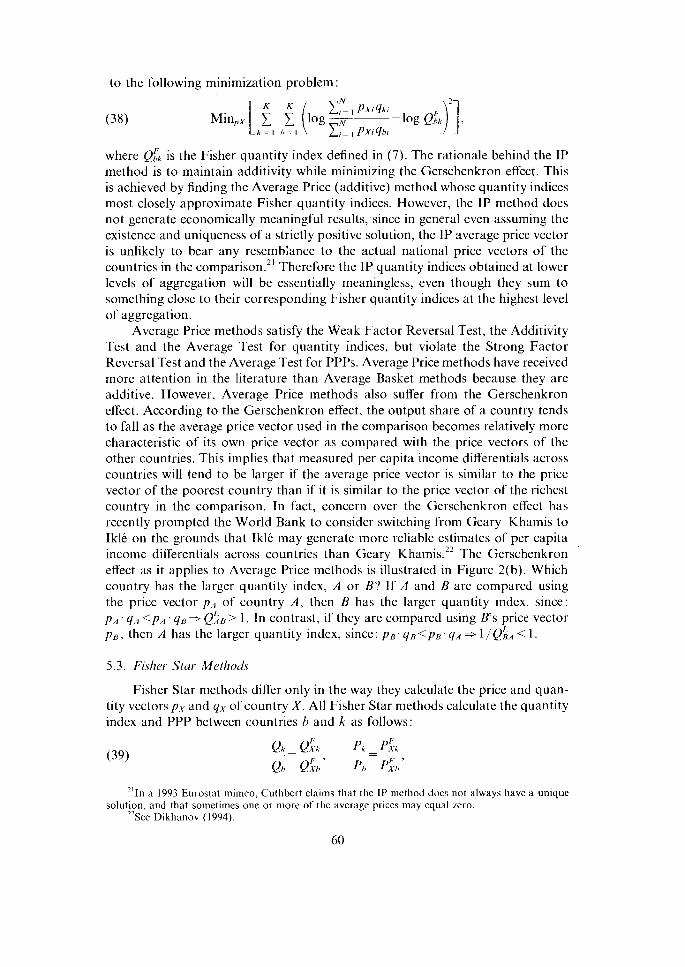
to the following minimization problem :
where eCk is the Fisher quantity index defined in (7). The rationale behind the IP method is to maintain additivity while minimizing the Gerschenkron effect. This is achieved by finding the Average Price (additive) method whose quantity indices most closely approximate Fisher quantity indices. However, the IP method does not generate economically meaningful results, since in general even assuming the existence and uniqueness of a strictly positive solution, the IP average price vector is unlikely to bear any resembiance to the actual national price vectors of the countries in the ~ o m ~ a r i s o n . ~ ' Therefore the IP quantity indices obtained at lower levels of aggregation will be essentially meaningless, even though they sum to something close to their corresponding Fisher quantity indices at the highest level of aggregation.
Average Price methods satisfy the Weak Factor Reversal Test, the Additivity Test and the Average Test for quantity indices, but violate the Strong Factor Reversal Test and the Average Test for PPPs. Average Price methods have received more attention in the literature than Average Basket methods because they are additive. However, Average Price methods also suffer from the Gerschenkron effect. According to the Gerschenkron effect, the output share of a country tends to fall as the average price vector used in the comparison becomes relatively more characteristic of its own price vector as compared with the price vectors of the other countries. This implies that measured per capita income differentials across countries will tend to be larger if the average price vector is similar to the price vector of the poorest country than if it is similar to the price vector of the richest country in the comparison. In fact, concern over the Gerschenkron efrect has recently prompted the World Bank to consider switching from Geary Khamis to Ikle on the grounds that Ikle may generate more reliable estimates of per capita income difrerentials across countries than Geary hami is.^^ The Gerschenkron effect as it applies to Average Price methods is illustrated in Figure 2(b). Which country has the larger quantity index, A or B? If A and B are compared using the price vector p, of country A, then B has the larger quantity index, since: pa. q, <p,. q~ * eLB> 1. In contrast, if they are compared using B's price vector y,, then A has the larger quantity index, since: p,.q,<p,.q, * I/Q;, < 1.
5.3. Fisher Star Methods
Fisher Star methods differ only in the way they calculate the price and quan- tity vectors p, and yx of country X. All Fisher Star methods calculate the quantity index and PPP between countries b and k as follows:
"1n a 1993 Eurostat mimeo, Cuthbert claims that the IP method does not always have a unique solution, and that sometimes one or more of thc average prices may equal Lero.
"see Dikhanov (1994).

where Q;k and ~ $ k denote the Fisher Alternatively, (39) may be written thus
quantity index and PI'P defined in (7).
A comparison of (40) with (15) and (25) reveals that any Fisher Star quantity index (PPP) may be expressed as the geometric mean of a pair of Average Basket and Average Price quantity indices (PPPs).
A plethora of Fisher Star methods may be generated by combining pairs of Average Basket and Average Price methods. However, for a Fisher Star method to be meaningful, its respective Average Basket and Average Price methods must have the same weighting structure. As an example of a "bad" Fisher Star method consider combining the ECLAC method (16) with the Gerardi method (27). The Gerardi method gives all countries in the comparison equal weight. In contrast the ECLAC method gives larger countries larger weights. The Fisher Star method formed by combining these two methods is a confused mixture of weighting schemes. On the other hand, the Fisher Star method formed by combining the Geometric Average Basket (17) and Gerardi methods has a consistent weighting structure since both of its constituent methods give all countries equal weights. This method could be called the Geometric Fisher Star method. Similarly the Fisher Star method formed by combining the ECLAC and Geary-Khamis (31) methods also has a consistent weighting structure, since both methods give count- ries with larger baskets larger weights. This method could be called the Weighted Arithmetic Fisher Star method.
From (40) it follows that all Fisher Star methods can be decomposed into a pair of Average Basket and Average Price methods. However, this process of decomposition is not always straightforward. If the average basket formula of a Fisher Star method is a function of average prices, while simultaneously average prices are a function of the average basket, then it may be difficult to disentangle the Average Basket and Average Price methods from each other. An example of such a Fisher Star method is Van Ijzeren's (1956) balanced method.
Van Ijzeren's balanced method exploits the fact that the Perron-Frobenius roots in (22) and (33) arc the same. This is because the matrix of Laspeyres indices in (33) is the transpose of the matrix of Laspeyres indices in (22) and hence has the same eigenvalues. Therefore (22) and (33) may be combined as follows:
Similarly, (24) and (34) may be combined as follows
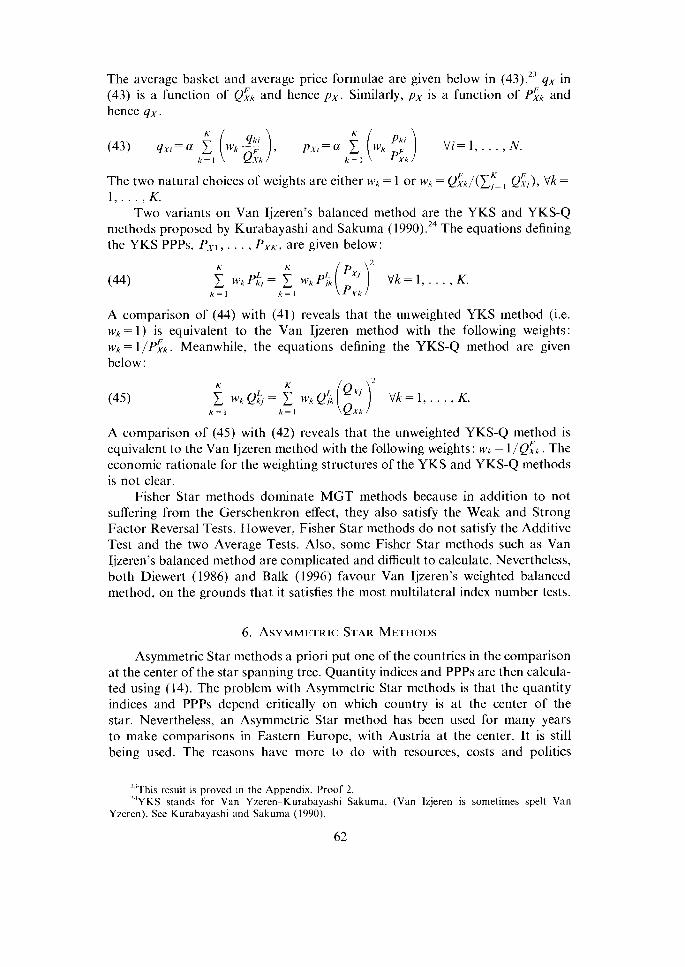
The average basket and average price formulae are given below in (43).23 qx in (43) is a function of QCk and hence p,. Similarly, p, is a function of pIk and hence q,.
The two natural choices of weights are either w k = 1 or M'A = QC~/ (~ ;= , Q;,), Vk =
1, . . . , K. Two variants on Van Ijzeren's balanced method are the YKS and YKS-Q
methods proposed by Kurabayashi and Sakuma (1990) .~~ The equations defining the YKS PPPs, P,, , . . . , P,,, are given below:
A comparison of (44) with (41) reveals that the unweighted YKS method (i.e. wk= 1) is equivalent to the Van Ijzeren method with the following weights: wk= l /~ ;k . Meanwhile, the equations defining the YKS-Q method are given below :
A comparison of (45) with (42) reveals that the unweighted YKS-Q method is equivalent to the Van Ijzeren method with the following weights: wk = l / ~ f ; ~ . The economic rationale for the weighting structures of the YKS and YKS-Q methods is not clear.
Fisher Star methods dominate MGT methods because in addition to not suffering from the Gerschenkron effect, they also satisfy the Weak and Strong Factor Reversal Tests. However, Fisher Star methods do not satisfy the Additive Test and the two Average Tests. Also, some Fisher Star methods such as Van Ijzeren's balanced method are complicated and difficult to calculate. Nevertheless, both Diewert (1986) and Balk (1996) favour Van Ijzeren's weighted balanced method, on the grounds that it satisfies the most multilateral index number tests.
Asymmetric Star methods a priori put one of the countries in the comparison at the center of the star spanning tree. Quantity indices and PPPs are then calcula- ted using (14). The problem with Asymmetric Star methods is that the quantity indices and PPPs depend critically on which country is at the center of the star. Nevertheless, an Asymmetric Star method has been used for many years to make comparisons in Eastern Europe, with Austria at the center. It is still being used. The reasons have more to do with resources, costs and politics
his result is proved in the Appendix, Proof 2. ' 4 ~ ~ ~ stands for Van Yzeren-Kurabayashi Sakuma, (Van Izjeren is sometimes spelt Van
Yzeren). See Kurabayashi and Sakuma (1990).

than with methodology. Austria can be seen as a link between Eastern and Western Europe and the Austrian Statistical Office has invested large resources in these comparisons.
Mean Asymmetric Star methods proceed by placing sequentially each country at the center of the star. Hence K sets of quantity indices are obtained. Each set is associated with a different center country. Mean Asymmetric Star quantity indices are then obtained by taking a symmetric or weighted mean of these K sets of quantity indices. Four possible general functional forms for a Mean Asymmet- ric Star method are given below in equations (46) to (49).
In the above equations, Q,k denotes a generic bilateral quantity index, while M> I (QIA ) denotes a symmetric or weighted mean of the bilateral quantity indices between country k and each of the countries in the set. m( . , . ) denotes a symmetric mean over its two arguments. If QIk satisfies the Country Reversal Test defined in (9), then (48) reduces to (46), while (49) reduces to (47).
7.1. Geometric Mean Asymmetric Star Methods
Suppose both M and m denote geometric means. Under this scenario, equa- tions (48) and (49) are equivalent. In addition suppose that the bilateral quantity index satisfies the Country Reversal Test. Under this scenario, all four general forms are equivalent. EKS quantity indices are obtained then by using the Fisher quantity index. The EKS quantity index and PPP formulae may be written thus:
The EKS method was first proposed by Gini (1931), although credited to Elteto and Koves (1964) and Szulc (1964). It is the preferred method of Eurostat, and increasingly also of the OECD. A weighted version of the EKS method due to Van Ijzeren (1983) calculates quantity indices and PPPs as follows:
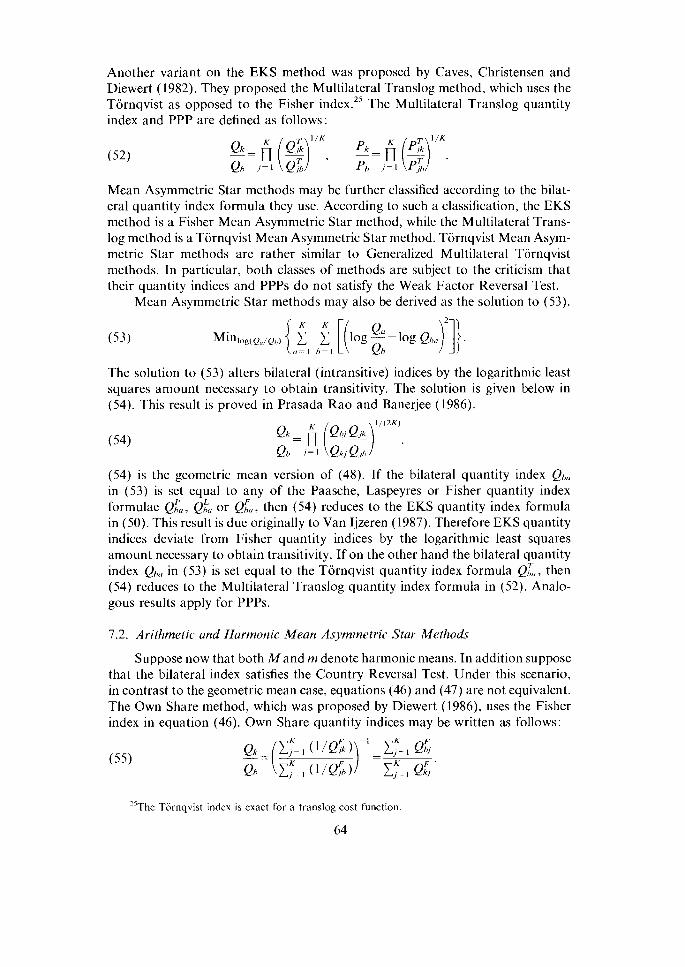
Another variant on the EKS method was proposed by Caves, Christensen and Diewert (1982). They proposed the Multilateral Translog method, which uses the Tornqvist as opposed to the Fisher index.25 The Multilateral Translog quantity index and PPP are defined as follows:
Mean Asymmetric Star methods may be further classified according to the bilat- eral quantity index formula they use. According to such a classification, the EKS method is a Fisher Mean Asymmetric Star method, while the Multilateral Trans- log method is a Tornqvist Mean Asymmetric Star method. Tornqvist Mean Asym- metric Star methods are rather similar to Generalized Multilateral Tiirnqvist methods. In particular, both classes of methods are subject to the criticism that their quantity indices and PPPs do not satisfy the Weak Factor Reversal Test.
Mean Asymmetric Star methods may also be derived as the solution to (53).
The solution to (53) alters bilateral (intransitive) indices by the logarithmic least squares amount necessary to obtain transitivity. The solution is given below in (54). This result is proved in Prasada Rao and Banerjee (1986).
Q ~ - fi (Q~,Q,~ --
Q ,= I Qk, Q,h
(54) is the geometric mean version of (48). If the bilateral quantity index Qh,
in (53) is set equal to any of the Paasche, Laspeyres or Fisher quantity index formulae QfU, Q~L, or Q;, then (54) reduces to the EKS quantity index formula in (50). This result is due originally to Van Ijzeren (1987). Therefore EKS quantity indices deviate from Fisher quantity indices by the logarithmic least squares amount necessary to obtain transitivity. If on the other hand the bilateral quantity index Qh, in (53) is set equal to the Tornqvist quantity index formula Q;, then (54) reduces to the Multilateral Translog quantity index formula in (52). Analo- gous results apply for PPPs.
7.2. Arithmetic and Harmonic Mean Asymmetric Stur Methods
Suppose now that both M and m denote harmonic means. In addition suppose that the bilateral index satisfies the Country Reversal Test. Under this scenario, in contrast to the geometric mean case, equations (46) and (47) are not equivalent. The Own Share method, which was proposed by Diewert (1986), uses the Fisher index in equation (46). Own Share quantity indices may be written as follows:
he Tornqvist index is exact for a translog cost function
64

It is interesting to note from (55) that the Own Share method could equally well be defined using an arithmetic mean in equation (47). Similarly, using a harmonic mean in equation (47) is equivalent to using an arithmetic mean in (46). This variant on the Own Share method may be written as follows:
Mean Asymmetric Star methods do not suffer from the Gerschenkron effect. In fact, Mean Asymmetric Star methods that use the Fisher index are rather similar to Fisher Star methods. They satisfy the Weak and Strong Factor Reversal Tests, but violate the Additivity Test and both Average Tests.
The multilateral international comparison literature has a well defined struc- ture. All the main methods can be divided into five classes called here Multilateral Generalized Tornqvist, Average Basket, Average Price, Fisher Star and Mean Asymmetric Star. The taxonomic structure is depicted in Figure 3.
Methods in the same class share many of the same properties as illustrated in Table 1. Therefore, the taxonomy should help practitioners to appreciate the range of alternative methods for making multilateral international comparisons, and the relative merits of each method. Table 2 lists all the methods discussed in the paper with their corresponding equation numbers, according to their classifi- cation within the taxonomy.
As regards the issue of weighting, both Diewert (1986) and Balk (1996) favour weighted methods since they satisfy Diewert's Irrelevance of tiny countries test, which essentially states that small countries must not unduly influence the output shares of large countries. Furthermore, certain weighted methods
Multilateral Methods
Multilateral Star Methods Generaljzed Tornqvlst
S mmetric Mean szar Asymmetric
Star
Avera e Average Fisher ~ a s k e & Price Star
Figure 3. Taxonomic Structure

TABLE 1
STRENGTHS A N D WEAKNESSES OF EACH CLASS OF METHOD
W F R T SFRT Add AVO AvP G E E
M G T x x x x x J Av. Basket J x x x J x Av. Price J x J J x x Fisher Star J J x x x Fisher MAS J
J J x x x J
Note: A J indicates that the class of methods in question satisfies this particular test, or in the case of GEff, that the class is not subject to the Gerschenkron effect. The abbreviations in Table I are as follows: WFRT-Weak Factor Reversal Test, SRFT-Strong Factor Reversal Test, A d d Additivity Test, AvQ--Average Test for Quantity Indices, AvP Average Test for PPPs, GEfLGerschenkron Effect, MGT-Multilateral Generalized Tornqvist, Av. Basket-Average Basket, Av. Price-Average Price, Fisher MAS-Fisher Mean Asymmetric Star.
TABLE 2
M G T General formula-Section 3 : (1 1 ) Walsh: (12), Walsh with arithmetic weights: (13)
Av. Basket General formula Section 5.1: (15) ECLAC Scrope-Weighted Van ljzeren heterogenous group: (16) Geometric Average Basket: ( 1 7) and (20) Harmonic Average Basket : ( 18) Unweighted Van ljzeren heterogenous group: (19) Unweighted Harmonic Average Basket: (21)
Av. Price General f o r m u l a Section 5.2: (25) Unweighted Van Ijzeren homogenous group: (26) Geometric Average Price- G e r a r d i : (29) Unweighted Harmonic Average Price: (28) Weighted Gcrardi: (SO), Geary Khamis: (31) Weighted Van Ijzeren homogenous group: (32) Ikle: (36) and (37). Ideal Price (IP): (38)
Fisher Star General formula-Section 5.3: (39) Geometric Fisher Star: Uses both (17) and (27) Weighted Arithmetic Fisher Star: Uses both (16) and (31) Van ljzeren balanced : (43), YKS : (44), Y KS-Q: (45)
MAS General formula-Section 7 : Either (46) or (47) EKS: (50), Weighted EKS: (51), Multilateral translog: (52) Own share: (55), Variant on own share: (56)
also satisfy Diewert's Country partitioning In particular, Van Ijzeren's weighted balance method defined in (43), ECL,AC defined in (16) and Geary- Khamis defined in (31) all satisfy this test, while the weighted EKS method defined in (51) does not. Ultimately both Diewert and Balk prefer Van Ijzeren's
"'According to this test. if country k with quantity vector qh is partitioned into two parts r and s with quantity vectors q,=pqh and q , = ( I p ) q , , and both r and s still face the same price vector, i.e. p, = p , = p h , then the quantity indices of k, r and s should be related as follows: Q,=pQk, and Q, = (1 p ) Q h . The quantity indices of all the other countries in the comparison should be unaffected.
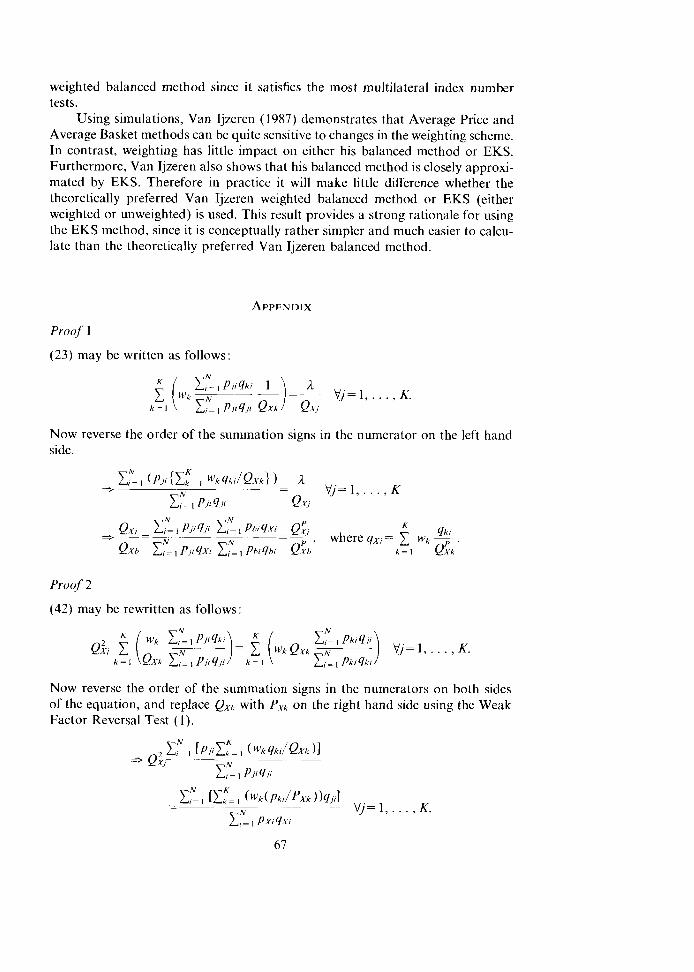
weighted balanced method since it satisfies the most multilateral index number tests.
Using simulations, Van Ijzeren (1987) demonstrates that Average Price and Average Basket methods can be quite sensitive to changes in the weighting scheme. In contrast, weighting has little impact on either his balanced method or EKS. Furthermore, Van Ijzeren also shows that his balanced method is closely approxi- mated by EKS. Therefore in practice it will make little difference whether the theoretically preferred Van Ijzeren weighted balanced method or EKS (either weighted or unweighted) is used. This result provides a strong rationale for using the EKS method, since it is conceptually rather simpler and much easier to calcu- late than the theoretically preferred Van Ijzeren balanced method.
Proof 1
(23) may be written as follows:
Now reverse the order of the summation signs in the numerator on the left hand side.
N N
Qx, X , = 1 PJL 911 I, = Phi YXL - Q/ K *-=- - -
q k N N , where q,, - C wk --I
Qxh 1 , - I PJ! XI XI , 1 Pht qhr ~ $ h k = I ~ $ k
Proof 2
(42) may be rewritten as follows
Now reverse the order of the summation signs in the numerators on both sides of the equation, and replace Qx,, with PXk on the right hand side using the Weak Factor Reversal Test (1).
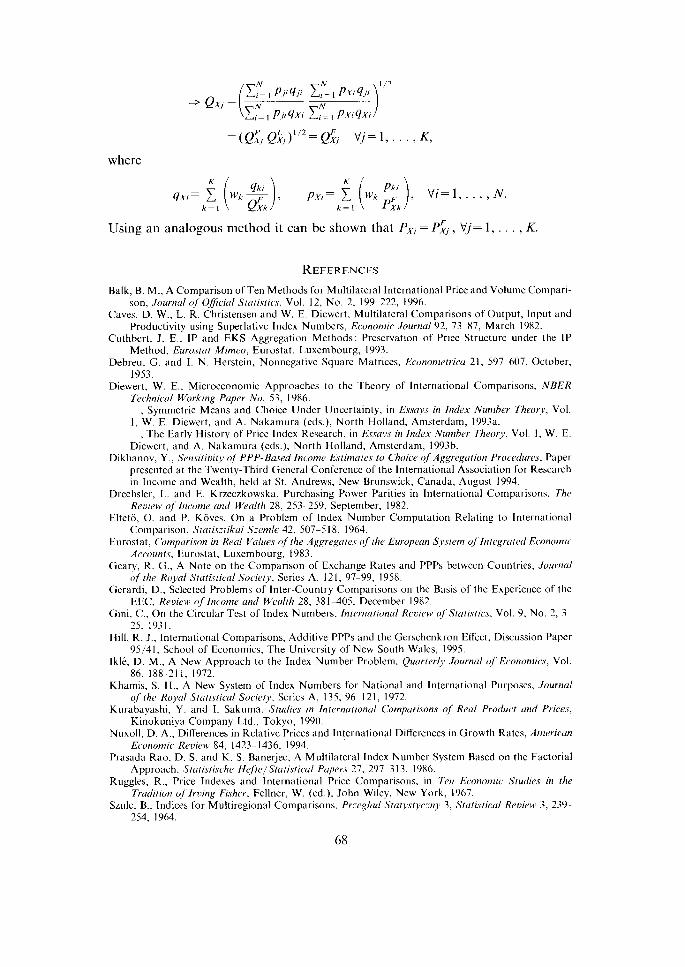
where
Using an analogous method it can be shown that P,, = P;, , V j = 1 , . . . , K.
Balk, B. M., A Comparison of Ten Methods for Multilateral International Price and Volume Compari- son, Journcrl of Official Statistics, Vol. 12, No. 2, 199 222, 1996.
Caves, D. W., L. R . Christensen and W. E. Diewert, Multilateral Comparisons of Output, Input and Productivity using Superlative Index Numbers, Economic Journal 92, 73 87, March 1982.
Cuthbert, J. E., IP and EKS Aggregation Methods: Preservation of Price Structure under the IP Method, Eurostnt Mimeo, Eurostat, Luxembonrg, 1993.
Debreu, G . and I. N. Herstein, Nonnegative Square Matrices, Ecunometrica 21, 597 607, October, 1953.
Diewert, W. E., Microeconomic Approaches to the Theory of lntzrnational Comparisons, NBER Technicul Working Paper No. 53, 1986.
-, Symmetric Means and Choice Under Uncertainty, in Essay.s in Index Number Theory, Vol. I, W. E. Diewert, and A. Nakamura (eds.), North Holland, Amsterdam, 1993a.
, The Early History of Price lndex Research, in Essays in Index Number Theory, Vol. 1, W. E. Diewert, and A. Nakamura (eds.), North Holland, Amsterdam, 1993b.
Dikhanov, Y., Sensitivity of'PPP-Based I ~ z c o r ? ~ Estimutcs to Choice ($Aggregation Procedures, Paper presented at the Twenty-Third General Conference of the International Association for Research in Income and Wealth, held at St. Andrews, New Brunswick, Canada, August 1994.
Drechsler, L. and E. Krzeczkowska, Purchasing Powcr Parities in International Comparisons, The Review of lncome and W d r h 28, 253 259. September, 1982.
Elteto, 0. and P. Koves, On a Problem of lndex Number Computation Relating to International Comparison. Sta~isztikai Szemle 42, 507-5 18, 1964.
Eurostat, Cumpcrrison in Real Values o f the A ~ g r e ~ u t c s o f thc~ European System qf ' lntegrutf~l Cvnomic Accounrs. Eurostat, Luxembourg, 1983.
Geary, R. G., A Note on the Comparison of Exchange Rates and PPPs between Countries, Journal of tlw Royul S~uti.sticu1 Society, Scries A. 12 1, 9 7 99, 1958.
Gerardi, D., Selected Problems of Inter-Country Comparisons on the Basis o r the Experience of the EEC, Revicw qf' Inc,ume and Wenlt/z 28, 38 1-405, December 1982.
Gini, C., On the Circular Test of Index Numbers, Inrc~rnrrtic~nal Rcview of'Stati.stic.s, Vol. 9. No. 2, 3 25, 1931.
Hill, R. J., lnternational Comparisons, Additive PPPs and the Gerschenkrcn Ef ic t , Discussion Paper 95/41, School of Economics, The University of New South Wales, 1995.
Ikle, D. M., A New Approach to the Index Number Problem, Quarterly Journal of Economics, Vol. 86, 188 211, 1972.
Khamis, S. H.. A New System of Index Numbers for National and International Purposes, Journal of tlze Ruy(11 S tu~is~ icu l Society, Series A, 135, 9 6 12 1, 1972.
Kurabayashi, Y. and I. Sakuma, Studies in Inrcrnutional Cbmpurisons qf Real Product and Pricc,s, Kinokuniya Company Ltd., Tokyo, 1990.
Nuxoll, D. A,, Differences in Relative Prices and International Differences in Growth Rates, Anzrricun Emnotnic Review 84, 1423 - 1 436, 1094.
Prasada Rao, D. S. and K. S. Banerjec, A Multilateral Index Number System Based on the Factorial Approach, Srurisfischc f I ~ f f e / S t u ~ i s t i c u l Pupc~rs 27. 297~-313, 1986.
Ruggles, R., Price Indexes and International Price Comparisons, in Ten Ewnomic Studies in the Tradition of Irving Fisher, Fellner, W. (ed.), John Wiley, New York, 1967.
Szulc, B., Indices for Multiregional Comparisons. Przegl(id Stuty.styczny 3, Srrrristicul Revirw 3, 239- 254, 1964.

Van Ijzeren, J., Thrce Methods of Comparing the Purchasing Power of Currencies, Stutislical Studies No. 7, The Netherlands Central Bureau of Statistics, The Hague, 1956.
- - , Index Numbers for Binary and Multilateral Comparison, Stutisricul Studies No. 34, The Netherlands Central Bureau of Statistics, The Hague, 1983.
-, Bius in Internarionul Index Numbers: A Muthemutical Elucirkrlion, Dissertation submitted to the Committee of Scientific Qualifications of the Hungarian Academy of Sciences for award of the degree of Candidate of Sciences (Ph.D) in Economics, 1987.
Walsh, C. M., The Meuszrrernent of General Exchange Value,, Macmillan and Co., New York, 1901.