Embed Size (px)
Citation preview
METHODS PAPER
A Technique for the Experimental Determination of the Lengthand Strength of Adhesive Interactions Between Effectively RigidMaterials
Tevis D. B. Jacobs1 • Joel A. Lefever2 • Robert W. Carpick3
Received: 23 March 2015 / Accepted: 20 April 2015
� Springer Science+Business Media New York 2015
Abstract To describe adhesion between bodies of known
arbitrary shape and known elastic properties, contact me-
chanics models require knowledge or assumptions of a
minimum of two parameters, the strength of the adhesive
interaction (characterized by the intrinsic work of adhesion
Wadh,int) and the length scale of the interaction (described
by the range of adhesion z0). One parameter can easily be
measured if the other is estimated or assumed, but ex-
perimental techniques for determining both simultaneously
are lacking. Here, we demonstrate a novel technique—
called the Snap-in/pull-off Numerical Adhesion Parameter
method—for experimentally determining both parameters
simultaneously using adhesion measurements performed
with an atomic force microscope probe whose geometry
has been characterized. The method applies to materials
that approach the rigid limit (high elastic moduli). The
technique is explained and validated analytically for simple
shapes (flat punch, paraboloid, and right cone), and trends
in results are compared against prior literature. This ap-
proach allows calculation of the adhesion parameters to
enable prediction of adhesion behavior, including for ad-
vanced technology applications.
Keywords Adhesion � Nanoscale � Work of adhesion �Range of adhesion AFM � TEM
1 Introduction
The fundamental physics governing adhesion are well un-
derstood; however, the direct measurement of adhesive
parameters between two surfaces remains difficult, espe-
cially when surfaces are not simply shaped (e.g., smooth
spheres or planes). Yet accurate knowledge of adhesion
between technologically relevant surfaces is critical for
research, development, and commercialization of nanos-
cale devices.
1.1 Mathematical Parameters Describing Adhesion
Between Planar Surfaces
The work of adhesion Wadh between two surfaces is the
energy per unit area required to separate two planar sur-
faces from equilibrium contact to infinite separation. It is
defined as:
Wadh ¼ ci þ cj� �
� cij; ð1Þ
where ci is the surface energy of surface i and cij is the
interfacial energy between surfaces i and j. In accordance
with prior literature on adhesion and roughness [1], the
intrinsic work of adhesion Wadh,int is the work of adhesion
between perfectly flat, planar surfaces. While Wadh,int is a
continuum concept, it maps robustly onto an atomistic
description of a perfectly flat, single crystal surface. The
& Tevis D. B. Jacobs
& Robert W. Carpick
1 Department of Mechanical Engineering and Materials
Science, University of Pittsburgh, 538-E Benedum Hall, 3700
O’Hara St., Pittsburgh, PA 15261, USA
2 Department of Materials Science and Engineering, University
of Pennsylvania, 3231 Walnut St., Philadelphia, PA 19104,
USA
3 Department of Mechanical Engineering and Applied
Mechanics, University of Pennsylvania, 229 Towne Bldg,
220 S. 33rd St., Philadelphia, PA 19104, USA
123
Tribol Lett (2015) 59:1
DOI 10.1007/s11249-015-0539-9
effective work of adhesion Wadh,eff is defined as the work of
adhesion for the same material pair in the case where one
or both planar surfaces contain local surface roughness.
The distinction between Wadh,int and Wadh,eff is shown
schematically in Fig. 1. The Wadh,int is determined by the
identity of the materials in contact and the environment,
whereas Wadh,eff is a function of Wadh,int and the local
surface topography. For hard, nonconforming materials,
Wadh,eff is typically much smaller than Wadh,int because the
roughness increases the effective separation between the
materials and decreases their area of intimate contact. This
increased separation makes the interfacial energy cij larger
(i.e., the interface is less energetically favorable since the
roughness prevents it from adopting a more favorable state
of intimate bonding). This distinction is drawn because
many experimental techniques exist to measure Wadh,eff
(for example, using microfabricated beam tests [2]), but
generally applicable techniques to deduce the Wadh,int do
not exist. The latter quantity Wadh,int is required for the
prediction of adhesion in a particular scientific or techno-
logical application. Therefore, this paper offers an ex-
perimental method for determining Wadh,int for stiff,
nonconforming materials.
Further, while knowledge of Wadh,int is useful, it is in-
sufficient for prediction of adhesive force given an arbi-
trary contact geometry. Rather, a complete description of
adhesion using continuum contact mechanics requires—at
a minimum—knowledge of two parameters that describe
the force–separation interaction of the materials: the
strength of adhesion, such as Wadh,int; and the length scale
of adhesion, such as z0. Physically, z0 describes the equi-
librium separation distance between perfectly flat surfaces,
i.e., the separation distance at which their interaction force
is zero. When only two parameters are used to describe the
adhesive interaction, z0 will also describe the length scale
of the interaction. Accordingly, in many mathematical
descriptions of adhesion (for instance, Refs. [3–6]), z0 is
presented and used as the governing parameter to scale the
distance over which adhesion acts for a particular material.
Therefore, the parameter z0 is referred to in this paper as
the ‘‘range of adhesion,’’ (in accordance with J.
A. Greenwood [3], who calls it the ‘‘range of action of the
surface forces’’). When combined with knowledge of the
shape and elastic properties of the bodies, a complete de-
scription of the contact mechanics behavior (pull-off force,
contact area, contact displacement, and contact stresses vs.
applied load) can be determined.
Other mathematical descriptions of adhesion use dif-
ferent variables, but still contain independent parameters
describing a strength of adhesion and a length scale, e.g., eand r in Eq. 7.6 of [7] for Lennard–Jones, or A and D0 in
Eq. 13.37 of [7] for a van der Waals interaction with a
cutoff, or Wadh,int and h in [8]. In all cases, the two pa-
rameters from one description can be written in terms of
the two from another; Wadh,int and z0 have been written in
terms of e and r in [7], in terms of A and D0 in [7], and in
terms of Wadh,int and h in [4]. It has been shown [9, 10] that
the adhesion between realistic shapes depends primarily on
choice of parameters and only secondarily on the exact
form of the model. The work on adhesion and roughness by
Persson et al. [1] requires only one parameter, Wadh,int, but
assumes that all adhesion is taking place at the contact
interface, with no adhesive interaction for material that is
near to contact, but not touching (equivalent to the JKR
limit of contact [8]). Their method can be generalized to
materials outside of this limit, but requires an additional
description of interaction forces at nonzero separation and
thus knowledge of the length scale of these interactions (as
discussed in [11]). Further, their method applies only to
surfaces with self-affine topography. In summary, while the
present paper uses the specific adhesive framework of
Greenwood [3] and others [4–6], the results can be gen-
eralized to measure the relevant parameters required for
other mathematical two-parameter treatments of adhesion.
1.2 Contact Mechanics Models Describing Adhesion
Between Arbitrarily Shaped Surfaces
The adhesion models described above can all be generalized
to predict the adhesive force between bodies of arbitrary
shape. For the special case of adhesive spheres under limiting
case conditions, only Wadh,int is required [12]. For example,
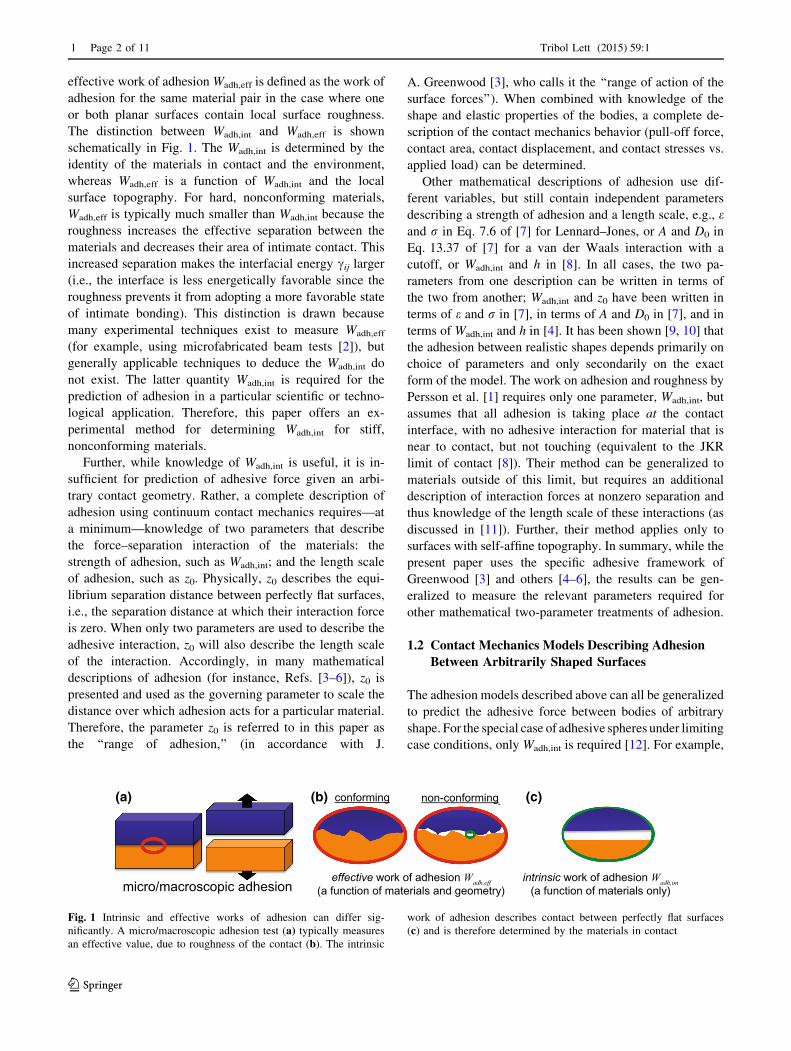
(c)(b)(a)
micro/macroscopic adhesioneffective work of adhesion Wadh,eff
(a function of materials and geometry)intrinsic work of adhesion Wadh,int
(a function of materials only)
conforming non-conforming
Fig. 1 Intrinsic and effective works of adhesion can differ sig-
nificantly. A micro/macroscopic adhesion test (a) typically measures
an effective value, due to roughness of the contact (b). The intrinsic
work of adhesion describes contact between perfectly flat surfaces
(c) and is therefore determined by the materials in contact
1 Page 2 of 11 Tribol Lett (2015) 59:1
123
stiff spheres with long-range adhesion (essentially, z0 is in-
finite) are described by the famous Derjaguin–Muller–To-
porov (DMT) model and compliant spheres with short-range
adhesion (z0 = 0) are described by the Johnson–Kendall–
Roberts (JKR) model. But even in these cases, the z0 pa-
rameter is required to determine the appropriate limit. Fur-
ther, in the more general case of bodies with nonspherical
shapes [13] or spheres that do not fall into one of the limiting
cases [8], knowledge of both Wadh,int and z0 is explicitly
required.
Specifically, adhesion in these more general cases is
mathematically described using a traction–separation re-
lation for two materials, which defines the adhesive stress
(force per unit area) between two flat surfaces as a function
of separation distance. Under the Derjaguin approximation
(discussed in more detail in [3]), the adhesion force be-
tween two bodies of arbitrary shape can be calculated by
integrating this traction–separation relation over the ge-
ometry of the contact.
One traction–separation relation in common use [3–6] is
the Lennard–Jones surface interaction. For two semi-infinite
parallel surfaces separated by a distance z, the normal stress
rnormal acting between the two surfaces is written in the
following form [3]:
rnormal zð Þ ¼ Fsurf
Asurf
¼ � 8Wadh;int
3z0
z0
z
� �3
� z0
z
� �9" #
ð2Þ
where Fsurf is the total load acting on surfaces of area Asurf,
and the shape of the traction–separation relation is gov-
erned by Wadh,int and z0. This Lennard–Jones traction–
separation relation can be derived by integrating the Len-
nard–Jones interatomic potential over a flat surface [14].
Note that the attractive term (*z-3) is derived from van
der Waals attraction, which is the primary attractive force
in many technologically relevant systems (conductive and
electronically neutral materials in dry environments under
low applied loads). The repulsive term (*z-9) derives
from an empirical approximation to account for Pauli and
electrostatic repulsion of surface electrons. As discussed,
the adhesive force depends primarily on choice of Wadh,int
and z0 and only secondarily on the specific traction–
separation relation chosen [9, 10], so the present technique
should be generalizable.
1.3 Experimental Difficulties Involved in Measuring
Intrinsic Adhesion Properties
Despite the importance of accurate knowledge ofWadh,int and
z0, these parameters are difficult to simultaneously measure
experimentally. While pull-off forces can easily be mea-
sured—for instance by using an atomic force microscope
(AFM)—it is normally not possible to extract both Wadh,int
and z0 solely from this measurement. One approach is to
modify the AFM [15–18] or use other instruments like the
Interfacial Force Microscope to avoid snap-in [19]. How-
ever, if tip shape is not measured then only effective values
can be measured using these techniques. A typical approach
is to assume that the apex of the AFM tip is a sphere of known
radius Rtip; and then to apply adhesive-sphere contact me-
chanics (such as the DMT, JKR or Maugis models [8]) to
extract a work of adhesion (this method is described in Ref.
[20]). However, this approach requires assuming or other-
wise determining the length scale of the adhesive interaction
in order to select an appropriate contact model (as discussed
in [8]). Furthermore, this approach is highly sensitive to er-
rors in tip radius estimation. For nonspherical bodies, (such
as those described by high-order power-law shapes) the pull-
off force will also depend strongly on both Wadh,int and z0
[13]. Therefore, to investigate adhesion using an ex-
perimental measurement of pull-off force, it is necessary to
assume a value for one variable (usually z0) and then solve for
the value of the other (Wadh,int). The measured value of
Wadh,int is only as reliable as the assumption of z0. It is
common in contact mechanics literature to approximate z0
based on intuition and order of magnitude arguments
[21–23]. Further, a wide range of values for z0 have been
proposed or measured in previous literature, ranging from
0.15 [20] to 5 nm [5]. The present technique is proposed for
experimentally measuring both adhesion parameters simul-
taneously, in order to accurately establish these heretofore-
undetermined quantities.
1.4 Summary of the SNAP Method
and the Structure of this Paper
The Snap-in/pull-off Numerical Adhesion Parameter
method (or SNAP method) enables simultaneous determi-
nation of Wadh,int and z0, using geometrical characterization
of an AFM tip, coupled with adhesion measurements using
the same tip. More specifically, three measurements are
taken for a tip/sample pair: (1) the pull-off force; (2) the
snap-in distance; and (3) the fine-scale shape of the AFM
tip. Then, a traction separation law can be integrated over
the measured geometry with Wadh,int and z0 as fitting pa-
rameters. These parameters are adjusted until the calcu-
lated values for pull-off force and snap-in distance match
the measured values. The technique is valid for measuring
adhesion between any hard, nonconforming materials. The
novel aspects of this technique are: (a) the use of measured
tip geometry instead of the assumption of a shape that
matches an analytical function (sphere, flat punch, etc.) and
(b) the use of the snap-in distance as an additional data
point to enable simultaneous extraction of z0.
The structure of the present article is as follows—
Sect. 2 describes general ways of determining tip shape,
Tribol Lett (2015) 59:1 Page 3 of 11 1
123
snap-in distance, and pull-off force (the needed inputs to
calculate adhesion parameters). Section 3 discusses the
mathematical framework for extracting Wadh,int and z0 us-
ing these inputs, including an illustrative example. In
Sect. 4, a validation of this method is presented, where
adhesion parameters are calculated and back-calculated for
simple, geometric shapes (a flat punch, a paraboloid, and a
right cone); this ensures self-consistency, assesses self-
consistency of the technique, and allows comparison
against trends in previous literature. The final section
presents concluding remarks. Application of the present
technique to in situ experimental data is presented else-
where [24].
2 Technique for Determining Tip Geometryand Adhesion Measurements
Several methods exist for characterizing the geometry of an
AFM tip, for instance: direct imaging using electron mi-
croscopy; direct imaging of the tip apex in an AFM using a
sharper AFM tip; tip reconstruction algorithms that extract
tip shape from AFM scans of a known surface; and de-
structive characterization (after adhesion testing) using
atom probe tomography. The present technique can be
applied regardless of how the AFM tip geometry is mea-
sured; however, we suggest that characterization using
high-resolution TEM represents the best combination of
ease and reliability. In particular, the AFM chip can be
mounted in the TEM using simple custom fixtures, as was
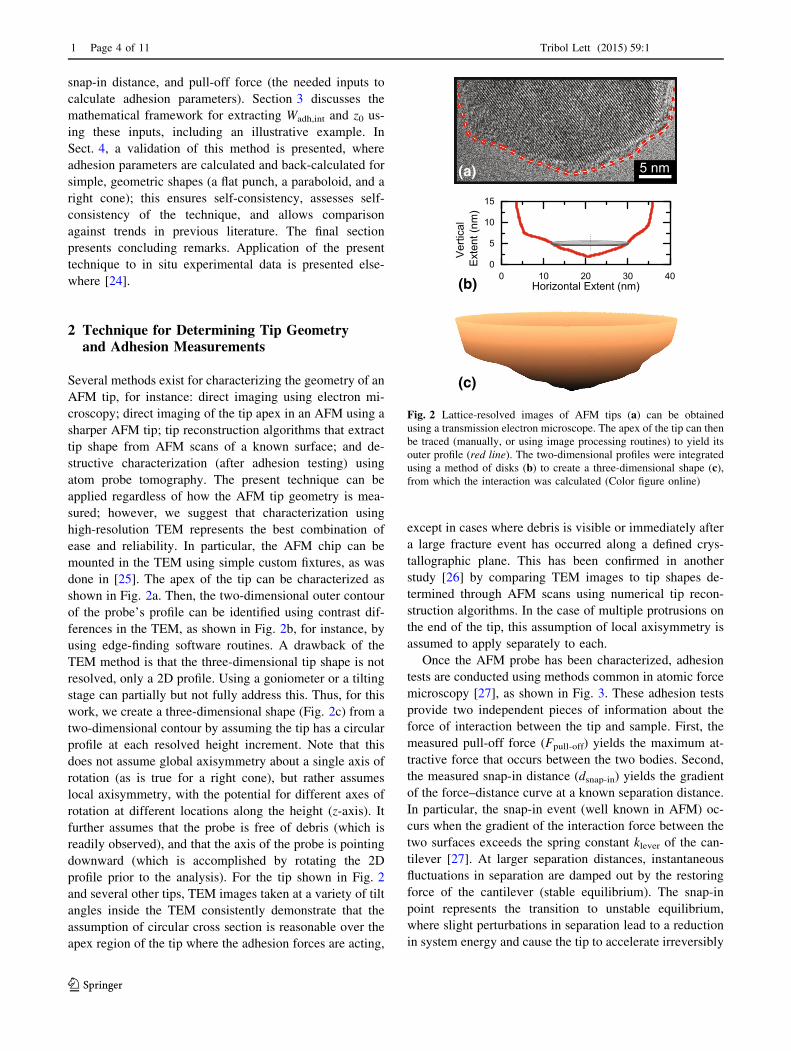
done in [25]. The apex of the tip can be characterized as
shown in Fig. 2a. Then, the two-dimensional outer contour
of the probe’s profile can be identified using contrast dif-
ferences in the TEM, as shown in Fig. 2b, for instance, by
using edge-finding software routines. A drawback of the
TEM method is that the three-dimensional tip shape is not
resolved, only a 2D profile. Using a goniometer or a tilting
stage can partially but not fully address this. Thus, for this
work, we create a three-dimensional shape (Fig. 2c) from a
two-dimensional contour by assuming the tip has a circular
profile at each resolved height increment. Note that this
does not assume global axisymmetry about a single axis of
rotation (as is true for a right cone), but rather assumes
local axisymmetry, with the potential for different axes of
rotation at different locations along the height (z-axis). It
further assumes that the probe is free of debris (which is
readily observed), and that the axis of the probe is pointing
downward (which is accomplished by rotating the 2D
profile prior to the analysis). For the tip shown in Fig. 2
and several other tips, TEM images taken at a variety of tilt
angles inside the TEM consistently demonstrate that the
assumption of circular cross section is reasonable over the
apex region of the tip where the adhesion forces are acting,
except in cases where debris is visible or immediately after
a large fracture event has occurred along a defined crys-
tallographic plane. This has been confirmed in another
study [26] by comparing TEM images to tip shapes de-
termined through AFM scans using numerical tip recon-
struction algorithms. In the case of multiple protrusions on
the end of the tip, this assumption of local axisymmetry is
assumed to apply separately to each.
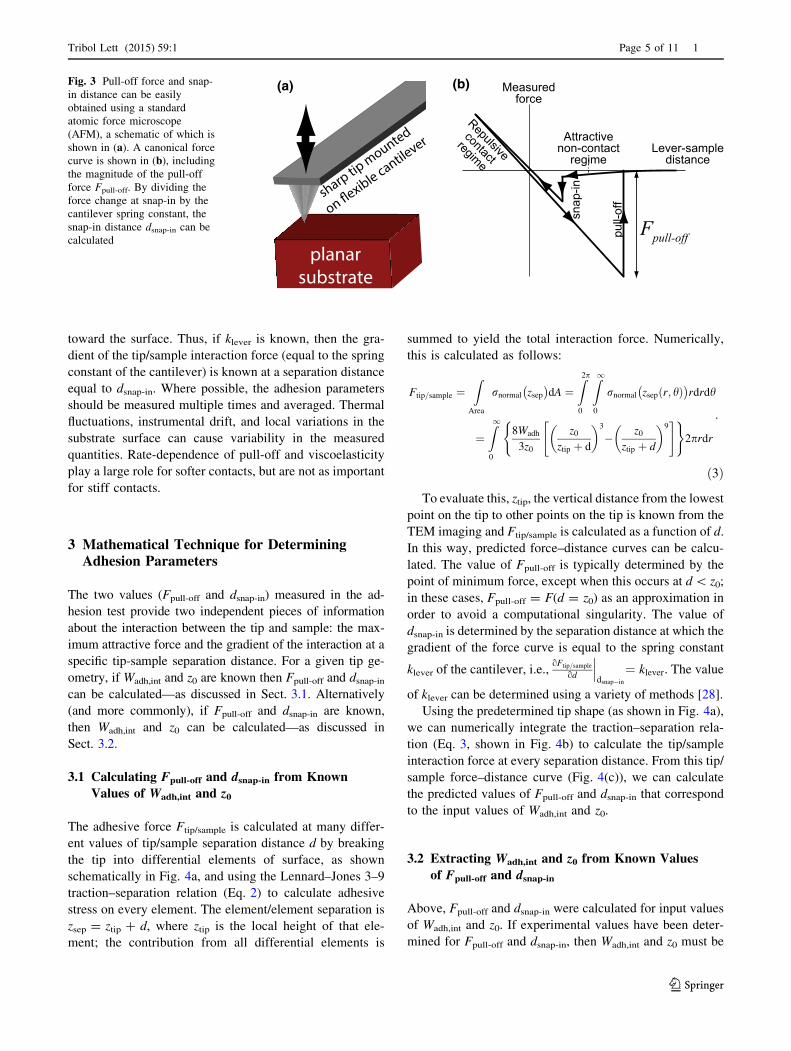
Once the AFM probe has been characterized, adhesion
tests are conducted using methods common in atomic force
microscopy [27], as shown in Fig. 3. These adhesion tests
provide two independent pieces of information about the
force of interaction between the tip and sample. First, the
measured pull-off force (Fpull-off) yields the maximum at-
tractive force that occurs between the two bodies. Second,
the measured snap-in distance (dsnap-in) yields the gradient
of the force–distance curve at a known separation distance.
In particular, the snap-in event (well known in AFM) oc-
curs when the gradient of the interaction force between the
two surfaces exceeds the spring constant klever of the can-
tilever [27]. At larger separation distances, instantaneous
fluctuations in separation are damped out by the restoring
force of the cantilever (stable equilibrium). The snap-in
point represents the transition to unstable equilibrium,
where slight perturbations in separation lead to a reduction
in system energy and cause the tip to accelerate irreversibly
5 nm(a)
(b)
(c)
Fig. 2 Lattice-resolved images of AFM tips (a) can be obtained
using a transmission electron microscope. The apex of the tip can then
be traced (manually, or using image processing routines) to yield its
outer profile (red line). The two-dimensional profiles were integrated
using a method of disks (b) to create a three-dimensional shape (c),
from which the interaction was calculated (Color figure online)
1 Page 4 of 11 Tribol Lett (2015) 59:1
123
toward the surface. Thus, if klever is known, then the gra-
dient of the tip/sample interaction force (equal to the spring
constant of the cantilever) is known at a separation distance
equal to dsnap-in. Where possible, the adhesion parameters
should be measured multiple times and averaged. Thermal
fluctuations, instrumental drift, and local variations in the
substrate surface can cause variability in the measured
quantities. Rate-dependence of pull-off and viscoelasticity
play a large role for softer contacts, but are not as important
for stiff contacts.
3 Mathematical Technique for DeterminingAdhesion Parameters
The two values (Fpull-off and dsnap-in) measured in the ad-
hesion test provide two independent pieces of information
about the interaction between the tip and sample: the max-
imum attractive force and the gradient of the interaction at a
specific tip-sample separation distance. For a given tip ge-
ometry, if Wadh,int and z0 are known then Fpull-off and dsnap-in
can be calculated—as discussed in Sect. 3.1. Alternatively
(and more commonly), if Fpull-off and dsnap-in are known,
then Wadh,int and z0 can be calculated—as discussed in
Sect. 3.2.
3.1 Calculating Fpull-off and dsnap-in from Known
Values of Wadh,int and z0
The adhesive force Ftip/sample is calculated at many differ-
ent values of tip/sample separation distance d by breaking
the tip into differential elements of surface, as shown
schematically in Fig. 4a, and using the Lennard–Jones 3–9
traction–separation relation (Eq. 2) to calculate adhesive
stress on every element. The element/element separation is
zsep = ztip ? d, where ztip is the local height of that ele-
ment; the contribution from all differential elements is
summed to yield the total interaction force. Numerically,
this is calculated as follows:
Ftip=sample ¼Z
Area
rnormal zsep
� �dA ¼
Z2p
0
Z1
0
rnormal zsep r; hð Þ� �
rdrdh
¼Z1
0
8Wadh
3z0
z0
ztip þ d
� �3
� z0
ztip þ d
� �9" #( )
2prdr
:
ð3Þ
To evaluate this, ztip, the vertical distance from the lowest
point on the tip to other points on the tip is known from the
TEM imaging and Ftip/sample is calculated as a function of d.
In this way, predicted force–distance curves can be calcu-
lated. The value of Fpull-off is typically determined by the
point of minimum force, except when this occurs at d\ z0;
in these cases, Fpull-off = F(d = z0) as an approximation in
order to avoid a computational singularity. The value of
dsnap-in is determined by the separation distance at which the
gradient of the force curve is equal to the spring constant
klever of the cantilever, i.e.,oFtip=sample
od
���dsnap�in
¼ klever. The value
of klever can be determined using a variety of methods [28].
Using the predetermined tip shape (as shown in Fig. 4a),
we can numerically integrate the traction–separation rela-
tion (Eq. 3, shown in Fig. 4b) to calculate the tip/sample
interaction force at every separation distance. From this tip/
sample force–distance curve (Fig. 4(c)), we can calculate
the predicted values of Fpull-off and dsnap-in that correspond
to the input values of Wadh,int and z0.
3.2 Extracting Wadh,int and z0 from Known Values
of Fpull-off and dsnap-in
Above, Fpull-off and dsnap-in were calculated for input values
of Wadh,int and z0. If experimental values have been deter-
mined for Fpull-off and dsnap-in, then Wadh,int and z0 must be
Attractivenon-contact
regime
Repulsivecontact
regime
snap
-in
pull-
off
Fpull-off
Lever-sampledistance
Measuredforce
sharp tip m
ounted
planarsubstrate
(a) (b)Fig. 3 Pull-off force and snap-
in distance can be easily
obtained using a standard
atomic force microscope
(AFM), a schematic of which is
shown in (a). A canonical force
curve is shown in (b), including
the magnitude of the pull-off
force Fpull-off. By dividing the
force change at snap-in by the
cantilever spring constant, the
snap-in distance dsnap-in can be
calculated
Tribol Lett (2015) 59:1 Page 5 of 11 1
123
calculated. There is no analytical expression for extracting
adhesion parameters (Wadh,int, z0) from known values of
Fpull-off and dsnap-in. Rather, once values have been deter-
mined for Fpull-off and dsnap-in, a search algorithm must be
used to find best-fit values of Wadh,int and z0. To accomplish
this, candidate values for (Fpull-off, dsnap-in) are calculated
using a range of values for (Wadh,int, z0)—typically
Wadh,int = [0.001, 1] J/m2 and z0 = [0.05, 1.1] nm. The
correct values of (Wadh,int, z0) are chosen as those where the
calculated values of (Fpull-off, dsnap-in) best match the input
values. For general arbitrarily shaped tips, there will only
be one specific pair of (Wadh,int, z0) that make the predicted
values of Fpull-off and dsnap-in match the experimental val-
ues; we take these parameters to be the correct values of
Wadh,int and z0.
To clearly illustrate the method, an example is shown in
Fig. 5 for a tip with arbitrarily chosen values of pull-off
force and snap-in distance. Note that this is simulated data
used for purposes of illustration only; to see the method
applied to experimental data, refer to Ref. [24]. Using the
tip profile from Fig. 2, force–distance curves, like those
shown in Fig. 4c, were calculated for a variety of input
pairs (Wadh,int, z0). From these curves, values of pull-off
force Fpull-off and snap-in distance dsnap-in were calculated
for each input pair of (Wadh,int, z0). These were
compared against the chosen values of Fpull-off = 5 nN and
dsnap-in = 1.8 nm (which otherwise would be measured in
the experiment). Pull-off forces corresponding to a wide
range of (Wadh,int, z0) pairs are plotted in Fig. 5a. It is
apparent that several different pairs of values can
dztipzsep 0 0.5 1 1.5 2
−10
−5
0
5
10
Tip/sample distance d (nm)
Tip/
sam
ple
forc
e F tip
/sam
ple
(nN
)
z0
Fpull-off
dsnap-in
0 0.2 0.4 0.6 0.8
−1
−0.5
0
0.5
1
Element separation z sep (nm)
Nor
mal
stre
ss σ
norm
al(M
Pa)
z0
(c)(b)(a)
Fig. 4 Numerically, the traced tip profile (a) is broken into differ-
ential elements (indicated schematically with horizontal black bars),
each of which has a separation from the surface equal to zsep. The
Lennard–Jones surface potential [Eq. 2, shown in (b) (with
Wadh,int = 0.25 J/m2, z0 = 0.2 nm)] is applied to each element. As
d is varied, the tip/sample interaction force Ftip/sample can be
calculated at each position (c). From these, the predicted pull-off
force and snap-in distance can be calculated for each pair of values for
(Wadh,int, z0)
0.05 0.1 0.15 0.2 0.25 0.30
2
4
6
8
10
Cal
cula
ted
pull−
off f
orce
Fpu
ll−of
f (nN
)
Input value for z0 (nm)
0.05 0.1 0.15 0.2 0.25 0.30
0.5
1
1.5
2
2.5
3
3.5
Cal
cula
ted
snap
−in
dis
tanc
e d sn
ap−
in (
nm)
Input value for z0 (nm)
Measured valueCalculated values:Wadh,int=0.40 J/m2
0.35 J/m2
0.30 J/m2
0.25 J/m2
0.20 J/m2
0.15 J/m2
0.10 J/m2
Measured valueCalculated values:Wadh,int=0.40 J/m2
0.35 J/m2
0.30 J/m2
0.25 J/m2
0.20 J/m2
0.15 J/m2
0.10 J/m2
(b)(a)
Fig. 5 The present method is demonstrated for a real tip (shown in
Fig. 2) using artificially chosen values of pull-off force and snap-in
distance. Pull-off force values for a wide range of (Wadh,int, z0) pairs
are shown in (a)—these are compared against the ‘‘measured’’ value
of pull-off force (black, dashed line). It is apparent that the solution is
not unique—the four circles indicate different possible pairs of
(Wadh,int, z0) that accurately predict this pull-off force for the given tip
geometry. In (b), circles of corresponding color are calculated for the
same four pairs of (Wadh,int, z0) that were identified in (a). Three of the
four do not match the snap-in distance, while the fourth does. Thus, in
this example, Wadh,int = 0.25 J/m2 and z0 = 0.2 nm (Color figure
online)
1 Page 6 of 11 Tribol Lett (2015) 59:1
123
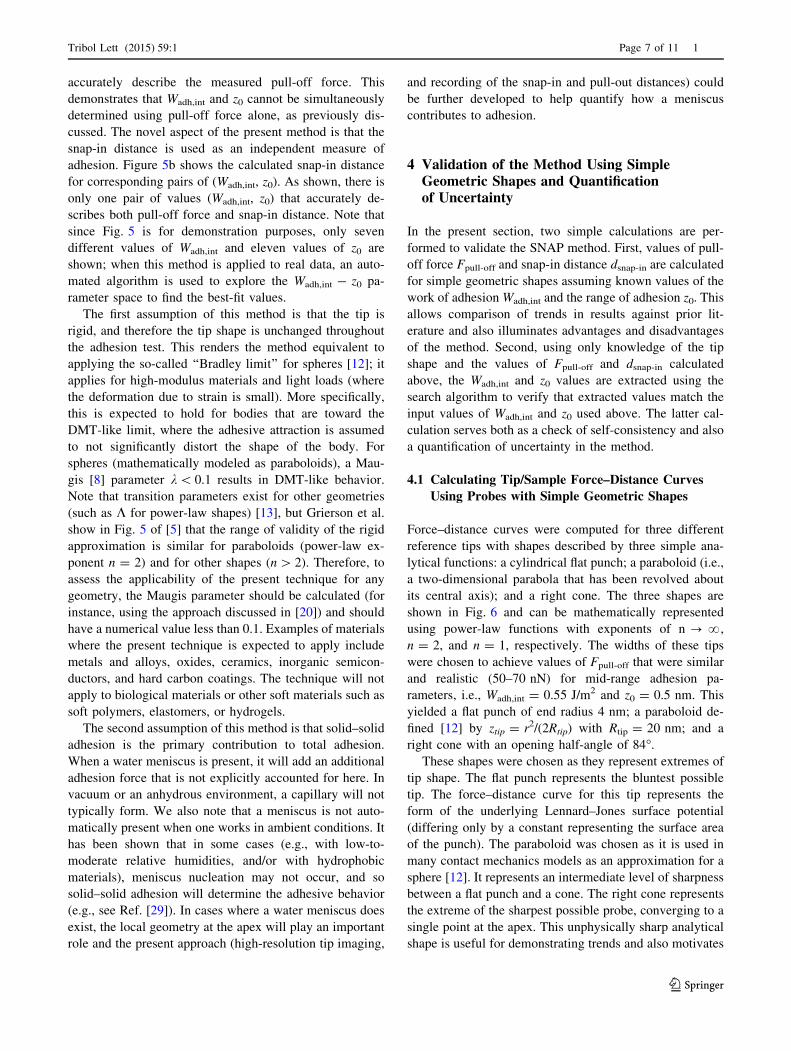
accurately describe the measured pull-off force. This
demonstrates that Wadh,int and z0 cannot be simultaneously
determined using pull-off force alone, as previously dis-
cussed. The novel aspect of the present method is that the
snap-in distance is used as an independent measure of
adhesion. Figure 5b shows the calculated snap-in distance
for corresponding pairs of (Wadh,int, z0). As shown, there is
only one pair of values (Wadh,int, z0) that accurately de-
scribes both pull-off force and snap-in distance. Note that
since Fig. 5 is for demonstration purposes, only seven
different values of Wadh,int and eleven values of z0 are
shown; when this method is applied to real data, an auto-
mated algorithm is used to explore the Wadh,int - z0 pa-
rameter space to find the best-fit values.
The first assumption of this method is that the tip is
rigid, and therefore the tip shape is unchanged throughout
the adhesion test. This renders the method equivalent to
applying the so-called ‘‘Bradley limit’’ for spheres [12]; it
applies for high-modulus materials and light loads (where
the deformation due to strain is small). More specifically,
this is expected to hold for bodies that are toward the
DMT-like limit, where the adhesive attraction is assumed
to not significantly distort the shape of the body. For
spheres (mathematically modeled as paraboloids), a Mau-
gis [8] parameter k\ 0.1 results in DMT-like behavior.
Note that transition parameters exist for other geometries
(such as K for power-law shapes) [13], but Grierson et al.
show in Fig. 5 of [5] that the range of validity of the rigid
approximation is similar for paraboloids (power-law ex-
ponent n = 2) and for other shapes (n[ 2). Therefore, to
assess the applicability of the present technique for any
geometry, the Maugis parameter should be calculated (for
instance, using the approach discussed in [20]) and should
have a numerical value less than 0.1. Examples of materials
where the present technique is expected to apply include
metals and alloys, oxides, ceramics, inorganic semicon-
ductors, and hard carbon coatings. The technique will not
apply to biological materials or other soft materials such as
soft polymers, elastomers, or hydrogels.
The second assumption of this method is that solid–solid
adhesion is the primary contribution to total adhesion.
When a water meniscus is present, it will add an additional
adhesion force that is not explicitly accounted for here. In
vacuum or an anhydrous environment, a capillary will not
typically form. We also note that a meniscus is not auto-
matically present when one works in ambient conditions. It
has been shown that in some cases (e.g., with low-to-
moderate relative humidities, and/or with hydrophobic
materials), meniscus nucleation may not occur, and so
solid–solid adhesion will determine the adhesive behavior
(e.g., see Ref. [29]). In cases where a water meniscus does
exist, the local geometry at the apex will play an important
role and the present approach (high-resolution tip imaging,
and recording of the snap-in and pull-out distances) could
be further developed to help quantify how a meniscus
contributes to adhesion.
4 Validation of the Method Using SimpleGeometric Shapes and Quantificationof Uncertainty
In the present section, two simple calculations are per-
formed to validate the SNAP method. First, values of pull-
off force Fpull-off and snap-in distance dsnap-in are calculated
for simple geometric shapes assuming known values of the
work of adhesion Wadh,int and the range of adhesion z0. This
allows comparison of trends in results against prior lit-
erature and also illuminates advantages and disadvantages
of the method. Second, using only knowledge of the tip
shape and the values of Fpull-off and dsnap-in calculated
above, the Wadh,int and z0 values are extracted using the
search algorithm to verify that extracted values match the
input values of Wadh,int and z0 used above. The latter cal-
culation serves both as a check of self-consistency and also
a quantification of uncertainty in the method.
4.1 Calculating Tip/Sample Force–Distance Curves
Using Probes with Simple Geometric Shapes
Force–distance curves were computed for three different
reference tips with shapes described by three simple ana-
lytical functions: a cylindrical flat punch; a paraboloid (i.e.,
a two-dimensional parabola that has been revolved about
its central axis); and a right cone. The three shapes are
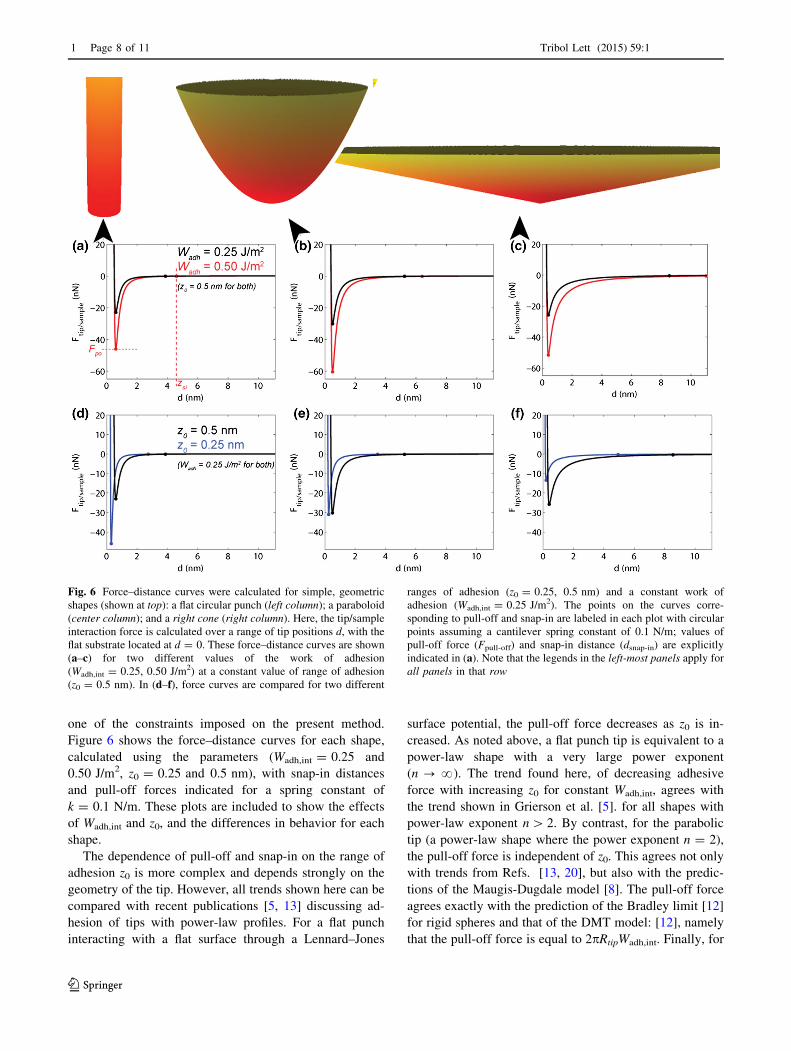
shown in Fig. 6 and can be mathematically represented
using power-law functions with exponents of n ? ?,
n = 2, and n = 1, respectively. The widths of these tips
were chosen to achieve values of Fpull-off that were similar
and realistic (50–70 nN) for mid-range adhesion pa-
rameters, i.e., Wadh,int = 0.55 J/m2 and z0 = 0.5 nm. This
yielded a flat punch of end radius 4 nm; a paraboloid de-
fined [12] by ztip = r2/(2Rtip) with Rtip = 20 nm; and a
right cone with an opening half-angle of 84�.These shapes were chosen as they represent extremes of
tip shape. The flat punch represents the bluntest possible
tip. The force–distance curve for this tip represents the
form of the underlying Lennard–Jones surface potential
(differing only by a constant representing the surface area
of the punch). The paraboloid was chosen as it is used in
many contact mechanics models as an approximation for a
sphere [12]. It represents an intermediate level of sharpness
between a flat punch and a cone. The right cone represents
the extreme of the sharpest possible probe, converging to a
single point at the apex. This unphysically sharp analytical
shape is useful for demonstrating trends and also motivates
Tribol Lett (2015) 59:1 Page 7 of 11 1
123
one of the constraints imposed on the present method.
Figure 6 shows the force–distance curves for each shape,
calculated using the parameters (Wadh,int = 0.25 and
0.50 J/m2, z0 = 0.25 and 0.5 nm), with snap-in distances
and pull-off forces indicated for a spring constant of
k = 0.1 N/m. These plots are included to show the effects
of Wadh,int and z0, and the differences in behavior for each
shape.
The dependence of pull-off and snap-in on the range of
adhesion z0 is more complex and depends strongly on the
geometry of the tip. However, all trends shown here can be
compared with recent publications [5, 13] discussing ad-
hesion of tips with power-law profiles. For a flat punch
interacting with a flat surface through a Lennard–Jones
surface potential, the pull-off force decreases as z0 is in-
creased. As noted above, a flat punch tip is equivalent to a
power-law shape with a very large power exponent
(n ? ?). The trend found here, of decreasing adhesive
force with increasing z0 for constant Wadh,int, agrees with
the trend shown in Grierson et al. [5]. for all shapes with
power-law exponent n[ 2. By contrast, for the parabolic
tip (a power-law shape where the power exponent n = 2),
the pull-off force is independent of z0. This agrees not only
with trends from Refs. [13, 20], but also with the predic-
tions of the Maugis-Dugdale model [8]. The pull-off force
agrees exactly with the prediction of the Bradley limit [12]
for rigid spheres and that of the DMT model: [12], namely
that the pull-off force is equal to 2pRtipWadh,int. Finally, for
Fig. 6 Force–distance curves were calculated for simple, geometric
shapes (shown at top): a flat circular punch (left column); a paraboloid
(center column); and a right cone (right column). Here, the tip/sample
interaction force is calculated over a range of tip positions d, with the
flat substrate located at d = 0. These force–distance curves are shown
(a–c) for two different values of the work of adhesion
(Wadh,int = 0.25, 0.50 J/m2) at a constant value of range of adhesion
(z0 = 0.5 nm). In (d–f), force curves are compared for two different
ranges of adhesion (z0 = 0.25, 0.5 nm) and a constant work of
adhesion (Wadh,int = 0.25 J/m2). The points on the curves corre-
sponding to pull-off and snap-in are labeled in each plot with circular
points assuming a cantilever spring constant of 0.1 N/m; values of
pull-off force (Fpull-off) and snap-in distance (dsnap-in) are explicitly
indicated in (a). Note that the legends in the left-most panels apply for
all panels in that row
1 Page 8 of 11 Tribol Lett (2015) 59:1
123
the conical shape, the pull-off force increases as z0 is in-
creased for a constant Wadh,int. This trend for a conical
shape (a power-law shape where the power exponent
n = 1) is in agreement with the so-called DMT-n limit
described by Zheng and Yu [13].
In summary, for the probe shapes shown in Fig. 6 and
other shapes tested (not shown), consistent trends of be-
havior hold: For shapes blunter than a paraboloid (n[ 2),
the pull-off force decreases as z0 increases; for shapes
sharper than a paraboloid (n\ 2), the pull-off force in-
creases with z0; and for a paraboloid (n = 2), the pull-off
force is unaffected by changes in z0. (Note that, for rigid
tips, the JKR limit (with its modified pull-off force) is not
reached.)
The dependence of pull-off force on adhesive range can
be understood as a competition between two factors: as the
range of adhesion is increased for a constant work of ad-
hesion, a larger section of the probe contributes to the
adhesive interaction, but the adhesive stress at a given
separation distance is decreased. This can be visualized in
Fig. 4b, where an increase in z0 stretches the curve along
the x-axis; in order to maintain a constant integrated area
(Wadh,int), the strength of the interaction at a given
separation (shown on the y-axis) must be decreased. The
‘‘winner’’ of this competition depends on the geometry of
the body. For blunt shapes with steep sidewalls—like a
punch—an increase in z0 decreases the pull-off force. This
is because relatively little additional material is interacting
due to the increased range of adhesion; instead, the primary
effect is simply to reduce the adhesive stress on the ma-
terial in close proximity. By contrast, for tapered shapes—
like a cone—the increase in material that is interacting
overwhelms the weakening of the adhesive stress and an
increase in z0 leads to a larger pull-off force. A parabola
represents the shape where these competing effects exactly
balance, regardless of the chosen traction–separation rela-
tion [21]. In this case, the pull-off force depends only on
the work of adhesion Wadh,int.
Another important result emerges from Fig. 6: Without
some modification, a simple integration of the Lennard–
Jones surface potential leads to an unphysical result for
ultra-sharp tips when the finite rigidity and strength of the
materials are considered. Specifically, for the punch and
parabola shapes in Fig. 6, the separation distance corre-
sponding to the minimum force (Fpull-off) is equal to or
larger than the equilibrium flat-on-flat separation z0.
However, for the cone shape, the separation at Fpull-off is
smaller than z0. Note that z0 rigorously designates the
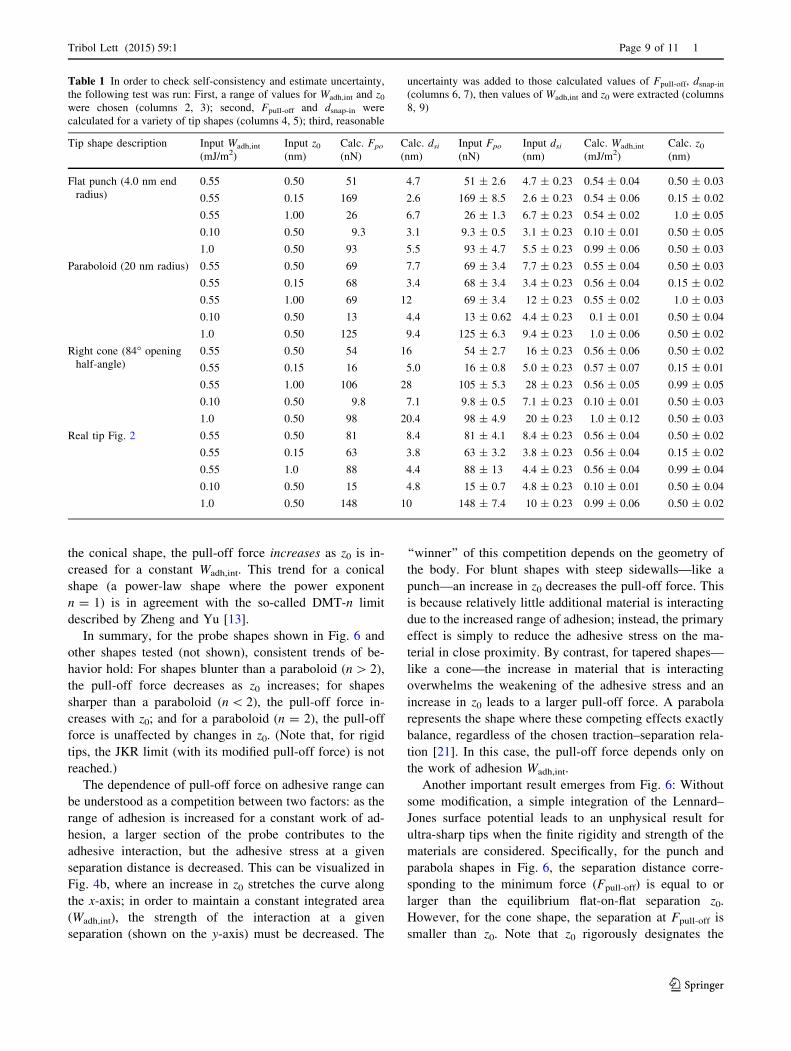
Table 1 In order to check self-consistency and estimate uncertainty,
the following test was run: First, a range of values for Wadh,int and z0
were chosen (columns 2, 3); second, Fpull-off and dsnap-in were
calculated for a variety of tip shapes (columns 4, 5); third, reasonable
uncertainty was added to those calculated values of Fpull-off, dsnap-in
(columns 6, 7), then values of Wadh,int and z0 were extracted (columns
8, 9)
Tip shape description Input Wadh,int
(mJ/m2)
Input z0
(nm)
Calc. Fpo
(nN)
Calc. dsi(nm)
Input Fpo
(nN)
Input dsi(nm)
Calc. Wadh,int
(mJ/m2)
Calc. z0
(nm)
Flat punch (4.0 nm end
radius)
0.55 0.50 51 4.7 51 ± 2.6 4.7 ± 0.23 0.54 ± 0.04 0.50 ± 0.03
0.55 0.15 169 2.6 169 ± 8.5 2.6 ± 0.23 0.54 ± 0.06 0.15 ± 0.02
0.55 1.00 26 6.7 26 ± 1.3 6.7 ± 0.23 0.54 ± 0.02 1.0 ± 0.05
0.10 0.50 9.3 3.1 9.3 ± 0.5 3.1 ± 0.23 0.10 ± 0.01 0.50 ± 0.05
1.0 0.50 93 5.5 93 ± 4.7 5.5 ± 0.23 0.99 ± 0.06 0.50 ± 0.03
Paraboloid (20 nm radius) 0.55 0.50 69 7.7 69 ± 3.4 7.7 ± 0.23 0.55 ± 0.04 0.50 ± 0.03
0.55 0.15 68 3.4 68 ± 3.4 3.4 ± 0.23 0.56 ± 0.04 0.15 ± 0.02
0.55 1.00 69 12 69 ± 3.4 12 ± 0.23 0.55 ± 0.02 1.0 ± 0.03
0.10 0.50 13 4.4 13 ± 0.62 4.4 ± 0.23 0.1 ± 0.01 0.50 ± 0.04
1.0 0.50 125 9.4 125 ± 6.3 9.4 ± 0.23 1.0 ± 0.06 0.50 ± 0.02
Right cone (84� opening
half-angle)
0.55 0.50 54 16 54 ± 2.7 16 ± 0.23 0.56 ± 0.06 0.50 ± 0.02
0.55 0.15 16 5.0 16 ± 0.8 5.0 ± 0.23 0.57 ± 0.07 0.15 ± 0.01
0.55 1.00 106 28 105 ± 5.3 28 ± 0.23 0.56 ± 0.05 0.99 ± 0.05
0.10 0.50 9.8 7.1 9.8 ± 0.5 7.1 ± 0.23 0.10 ± 0.01 0.50 ± 0.03
1.0 0.50 98 20.4 98 ± 4.9 20 ± 0.23 1.0 ± 0.12 0.50 ± 0.03
Real tip Fig. 2 0.55 0.50 81 8.4 81 ± 4.1 8.4 ± 0.23 0.56 ± 0.04 0.50 ± 0.02
0.55 0.15 63 3.8 63 ± 3.2 3.8 ± 0.23 0.56 ± 0.04 0.15 ± 0.02
0.55 1.0 88 4.4 88 ± 13 4.4 ± 0.23 0.56 ± 0.04 0.99 ± 0.04
0.10 0.50 15 4.8 15 ± 0.7 4.8 ± 0.23 0.10 ± 0.01 0.50 ± 0.04
1.0 0.50 148 10 148 ± 7.4 10 ± 0.23 0.99 ± 0.06 0.50 ± 0.02
Tribol Lett (2015) 59:1 Page 9 of 11 1
123
equilibrium separation of surface area elements, but is not
the same as the equilibrium separation of tip and sample.
For a very sharp shape, this could lead to high compressive
stress in the closest elements—which are not accommo-
dated in the present method in which the bodies are as-
sumed to be rigid. To eliminate the unphysically large
Lennard–Jones stresses on the tip apex, an additional
constraint was added to the method: In calculating the pull-
off force, the tip-sample minimum separation distance is
not allowed to fall below the value of z0 chosen for that
simulation (i.e., d C z0). This simple constraint introduces
hard-wall repulsion when the minimum separation of the
bodies is z0. This avoids resorting to a much more complex
and time-consuming analysis that takes elasticity and
plasticity into account, such as in Ref. [30].
4.2 Extracting Adhesion Parameters Using
Standard Geometric Shapes: Checking Self-
consistency and Quantifying the Uncertainty
Above, values of Fpull-off and dsnap-in were calculated for
standard geometric shapes using specified typical adhesion
parameters (i.e., Wadh,int = 0.3 or 0.6 J/m2 and z0 = 0.1 or
0.3 nm). Here, the self-consistency of the method is
checked along with its uncertainty. For calculating the
uncertainty of the present method, a simple propagation of
uncertainty cannot be used since analytical expressions do
not exist. Instead, values for (Wadh,int, z0) were calculated
after the addition of reasonable uncertainty to the input
values of Fpull-off and dsnap-in.
First, Fpull-off and dsnap-in were calculated for a wide
range of possible adhesion parameters (Wadh,int = {0.1,
0.55, 1.0} J/m2 and z0 = {0.15, 0.5, 1.0} nm) for the three
geometric shapes discussed above and for a real tip. Then,
uncertainty was added to these calculated values of Fpull-off
and dsnap-in: ±5 % for Fpull-off due to uncertainties in
calibration of the cantilever spring constant [28]
and ± 0.23 nm for dsnap-in as an upper bound on the ac-
curacy of height measurements in an AFM [28] or TEM
[31]. Then, these values—with uncertainty—were used to
extract a range of Wadh,int and z0 for each case. All results
are reported in Table 1. The maximum variation in calcu-
lated values is reported in the final columns of Table 1, as
an uncertainty of the ‘‘calculated’’ Wadh,int and z0. It is
demonstrated that, for a wide range of adhesion values and
tip shapes, the uncertainty of the method is typically less
than 10 % for both Wadh,int and z0, and up to 12 % in
certain cases.
The primary conclusion from the calculations in this
section is that the present technique works well for a
wide range of shapes and physical parameters. The
method is self-consistent, and the trends in the results
agree with previously published reports investigating
adhesion of probes with standard shapes defined by
analytical functions. These results demonstrate that the
pull-off force and snap-in distance depend on the work
of adhesion and range of adhesion in significantly dif-
ferent ways for different classes of tip geometry. Further,
using reasonable values, the uncertainty in the present
method for determining Wadh,int and z0 from measure-
ments of Fpull-off and dsnap-in is estimated to be less than
12 % for both values.
5 Conclusions
A current limitation in prediction of adhesive forces stems
from a lack of reliable data for the intrinsic work of ad-
hesion Wadh,int and, even more so, for the range of adhesion
z0 for a given pair of materials. The novel advancement of
the present method is to introduce a technique for simul-
taneously measuring these two parameters for effectively
rigid materials. This technique requires knowledge of the
tip shape (which can be measured using a number of
techniques) and measurement of the pull-off force and
snap-in distance (both of which can be easily measured in
an AFM adhesion test). Then the experimental data can be
fit to the model to extract Wadh,int and z0. The method has
been validated analytically using simple geometric shapes
and is found to be self-consistent, reproducing trends in
behavior established in previous numerical and simulation
studies. The uncertainty in the technique has been esti-
mated at no more than 12 % for a wide range of reasonable
geometric and physical parameters, and is typically less
than 10 %. Overall, the method is widely applicable for
characterizing the adhesion parameters between a variety
of material pairs, as shown, for example, for a sili-
con/diamond interface [24].
Acknowledgments The authors acknowledge useful discussions
with K. Turner and D. Grierson. R.W.C and T.D.B.J. acknowledge
support from National Science Foundation under award No.
CMMI12-00093. R.W.C., T.D.B.J., and J.A.L. acknowledge support
from the UPenn MRSEC Program of the National Science Foundation
under award No. DMR11-20901. R.W.C acknowledges support from
AFOSR under Contract No. FA2386-14-1-4071 AOARD.
References
1. Persson, B.: Adhesion between elastic bodies with randomly
rough surfaces. Phys. Rev. Lett. 89, 245502 (2002)
2. Mastrangelo, C.H., Hsu, C.H.: A simple experimental technique
for the measurement of the work of adhesion of microstructures.
5th Technical Digest, IEEE Solid–State Sensor and Actuator
Workshop, pp. 208–212 (1992)
3. Greenwood, J.A.: Adhesion of small spheres. Philos. Mag. 89,
945–965 (2009)
1 Page 10 of 11 Tribol Lett (2015) 59:1
123
4. Yao, H., Ciavarella, M., Gao, H.: Adhesion maps of spheres
corrected for strength limit. J. Colloid Interface Sci. 315,
786–790 (2007)
5. Grierson, D.S., Liu, J., Carpick, R.W., Turner, K.T.: Adhesion of
nanoscale asperities with power-law profiles. J. Mech. Phys.
Solids 61, 597–610 (2013)
6. Feng, J.Q.: Adhesive contact of elastically deformable spheres: a
computational study of pull-off force and contact radius. J. Col-
loid Interface Sci. 238, 318–323 (2001)
7. Israelachvili, J.N.: Intermolecular and Surface Forces. Academic
Press, San Francisco, CA (2011)
8. Maugis, D.: Adhesion of spheres: the JKR-DMT transition using
a Dugdale model. J. Colloid Interface Sci. 150, 243–269 (1992)
9. Pastewka, L., Robbins, M.O.: Contact between rough surfaces
and a criterion for macroscopic adhesion. Proc. Natl. Acad. Sci.
111, 3298–3303 (2014)
10. Barthel, E.: On the description of the adhesive contact of spheres
with arbitrary interaction potentials. J. Colloid Interface Sci. 200,
7–18 (1998)
11. Mulakaluri, N., Persson, B.: Adhesion between elastic solids with
randomly rough surfaces: comparison of analytical theory with
molecular-dynamics simulations. EPL (Europhysics Letters). 96,
66003 (2011)
12. Johnson, K.L.: Contact Mechanics. Cambridge University Press,
Cambridge (2011)
13. Zheng, Z., Yu, J.: Using the Dugdale approximation to match a
specific interaction in the adhesive contact of elastic objects.
J. Colloid Interface Sci. 310, 27–34 (2007)
14. Yu, N., Polycarpou, A.A.: Adhesive contact based on the Len-
nard–Jones potential: a correction to the value of the equilibrium
distance as used in the potential. J. Colloid Interface Sci. 278,
428–435 (2004)
15. Jarvis, S.P., Oral, A., Weihs, T.P., Pethica, J.B.: A novel force
microscope and point contact probe. Rev. Sci. Instrum. 64, 3515
(1993)
16. Jarvis, S.P., Yamada, H., Yamamoto S.-I., Tokumoto, H.: A new
force controlled atomic force microscope for use in ultrahigh
vacuum. Rev. Sci. Instrum. 67, 2281 (1996)
17. Ashby, P.D., Chen, L.W., Lieber, C.M.: Probing intermolecular
forces and potentials with magnetic feedback chemical force
microscopy. J. Am. Chem. Soc. 122, 9467 (2000)
18. Giessibl, F.J.: Advances in atomic force microscopy. Rev. Mod.
Phys. 75, 949–983 (2003)
19. Joyce, S.A., Houston, J.E.: A new force sensor incorporating
force-feedback control for interfacial force microscopy. Rev. Sci.
Instrum. 62, 710 (1991)
20. Grierson, D., Flater, E., Carpick, R.: Accounting for the JKR-
DMT transition in adhesion and friction measurements with
atomic force microscopy. J. Adhes. Sci. Technol. 19, 291–311
(2005)
21. Greenwood, J.: Adhesion of elastic spheres. Proc. Roy. Soc. A
453, 1277–1297 (1997)
22. Tabor, D.: Surface forces and surface interactions. J. Colloid
Interface Sci. 58, 2–13 (1977)
23. Persson, B.: Nanoadhesion. Wear 254, 832–834 (2003)
24. Jacobs, T.D.B., Lefever, J.A., Carpick, R.W.: Measurement of the
length and strength of adhesive interactions in a nanoscale silicon-
diamond interface. Adv. Mater. Interfaces (2015). doi:10.1002/
admi.201400547
25. Chung, K., Lee, Y., Kim, D.: Characteristics of fracture during
the approach process and wear mechanism of a silicon AFM tip.
Ultramicroscopy 102, 161–171 (2005)
26. Liu, J., Notbohm, J.K., Carpick, R.W., Turner, K.T.: Method for
characterizing nanoscale wear of atomic force microscope tips.
ACS Nano 4, 3763–3772 (2010)
27. Cappella, B., Dietler, G.: Force-distance curves by atomic force
microscopy. Surf. Sci. Rep. 34, 1–104 (1999)
28. Ohler, B.: Cantilever spring constant calibration using laserDoppler vibrometry. Rev. Sci. Instrum. 78, 063701 (2007)
29. Greiner, C., Felts, J.R., Dai, Z., King, W.P., Carpick, R.W.:
Controlling nanoscale friction through the competition between
capillary adsorption and thermally activated sliding. ACS Nano 6,
4305–4313 (2012)
30. Hui, C.-Y., Long, R.: Direct extraction of work of adhesion from
contact experiments: generalization of JKR theory to flexible
structures and large deformation. J Adhes. 88, 70–85 (2012)
31. Jacobs, T.D.B., Ryan, K.E., Keating, P.L., Grierson, D.S., Le-
fever, J.A., Turner, K.T., Harrison, J.A., Carpick, R.W.: The ef-
fect of atomic-scale roughness on the adhesion of nanoscale
asperities: a combined simulation and experimental investigation.
Tribol. Lett. 50, 81–93 (2013)
Tribol Lett (2015) 59:1 Page 11 of 11 1
123