Embed Size (px)
Citation preview

1
A temperature threshold to identify the driving climate forces of the
respiratory process in terrestrial ecosystems
Zhiyuan Zhang1, Renduo Zhang1,*, Yang Zhou1, 2, Alessandro Cescatti3, Georg Wohlfahrt4, Minmin
Sun1, Juan Zhu1, Vincenzo Magliulo5, Feng Tao1, and Guanhong Chen1 1School of Environmental Science and Engineering, Guangdong Provincial Key Laboratory of Environmental Pollution 5
Control and Remediat ion Technology, Sun Yat-sen University, Guangzhou 510275, China 2College of Environmental Science and Engineering, Peking University, Beijing 100871, China
3Institute for Environment and Sustainability, Climate Risk Management Unit, European Commission, Joint Research Centre,
Ispra 21027, Italy 4Institute of Ecology, University of Innsbruck, Sternwartestr 15, Innsbruck 6020, Austria 10
5Institute for Mediterranean Agricultural and Forest Systems, National Research Council, Erco lano (Napoli) 80040, Italy
Correspondence to: Renduo Zhang ([email protected])
Abstract. Terrestrial ecosystem respiration (Re) is the major source of CO2 release and constitutes the second largest carbon
flux between the biosphere and atmosphere. Therefore, climate-driven changes of Re may greatly impact on future
atmospheric CO2 concentration. The aim of this study was to derive an air temperature threshold for identify ing the driving 15
climate forces of the respiratory process in terrestrial ecosystems within different temperature zones. For this purpose, a
global dataset of 647 site-years of ecosystem flux data collected at 152 sites has been examined. Our analysis revealed an
ecosystem threshold of mean annual air temperature (MAT) of 11±2.3℃ . In ecosystems with the MAT below this threshold,
the maximum Re rates were p rimarily dependent on temperature and respiration was mainly a temperature -driven process.
On the contrary, in ecosystems with the MAT greater than 11±2.3℃, in addition to temperature, other driving fo rces, such as 20
water availab ility and surface heat flux, became significant drivers of the maximum Re rates and respiration was a mult i-
factor-driven process. The information derived from this study highlight the key role of temperature as main controlling
factor of the maximum Re rates on a large fraction of the terrestrial biosphere, while other driv ing forces reduce the
maximum Re rates and temperature sensitivity of the respiratory process. These findings are particularly relevant under the
current scenario of rapid g lobal warming, g iven that the potential climate-induced changes in ecosystem respiration may lead 25
to substantial anomalies in the seasonality and magnitude of the terrestrial carbon budget.
1 Introduction
Among the greenhouse gases, carbon dioxide (CO2) is the one that contributes mostly to the contemporary climate
change (IPCC, 2007) and characterized by large global fluxes between the atmosphere, the biosphere, and the
anthroposphere. Terrestrial ecosystem respiration (Re) is the major source of CO2 release and the second largest carbon flux 30
Biogeosciences Discuss., https://doi.org/10.5194/bg-2017-345Manuscript under review for journal BiogeosciencesDiscussion started: 21 August 2017c© Author(s) 2017. CC BY 4.0 License.

2
between the biosphere and atmosphere (Raich and Potter, 1995). Therefore, climate -induced change in Re may profoundly
impact the global carbon cycle (Yvon-Durocher et al., 2012).
The total ecosystem respiration is composed of heterotrophic respiration and autotrophic respiration, which may
response to different driving forces, including biotic and abiotic factors (Falge et al., 2002). However, among the major
ecological factors, temperature is prominent to determine the natural distribution of plants and to regulate activities of 5
microbial communit ies (Lipson et al., 2000). It has been shown that Re rates increase exponentially with temperature
(Enquist et al., 2003; Gillooly et al., 2001). However, the temperature dependence of respiration can be modified by many
variables at the ecosystem level (Allen et al., 2005; Luo, 2007; Mahecha et al., 2010). According t o the metabolic theory of
ecology, the temperature dependence of Re has been quantified by a constant activation energy (E = 0.60 eV) (Brown et al.,
2004; Enquist et al., 2003; Gillooly et al., 2001). By contrast, some other authors have shown varied average E values of Re 10
with ecosystem types and climate zones (Price and Sowers, 2004; Song et al., 2014). Similarly, inconsistent results of
temperature sensitivity of Re quantified by Q10, which is the proportional increase in respiration per 10℃ rise, have been
reported in the literature. A constant Q10 value of Re has been utilized in several ecosystem models (Xu and Qi, 2001).
Curiel Yuste et al. (2004) found that the Q10 values of soil respiration were similar among different vegetation types at short -
term t ime scale. Mahecha et al. (2010) showed that Q10 values of Re were independent of temperature and converged on 15
aconstant value across biomes. On the contrary, Q10 values have been shown to change with different ecosystem types or
even different vegetation types within an ecosystem (Lavigne et al., 2003; Melillo et al., 2002; Song et al., 2014; Zheng et al.,
2009).
Besides temperature, other environmental factors can affect Re values (Han et al., 2007; Schaefer et al., 2009; W iseman
and Seiler, 2004). Some micrometeorological factors can affect the assimilatory process of plants and therefore the substrate 20
quantitity and quality for respirat ion (Högberg et al., 2001; Rogers and Humphries, 2000; Sage and Kubien, 2007). In
particular water availability (e.g., soil water content and precipitation) is often reported as a key co -acting or controlling
factor of Re in different temperature reg imes (Conant et al., 2000; Li et al., 2006). The apparent inconsistency in the
literature about these processes are often due to the combined effect o f different driving forces on the respiratory process that
may u ltimately lead to different apparent temperature s ensitivities of Re rates. 25
The concept of ecological threshold has been widely recognized as an important paradigm to assess the effect of
environmental limit ing factors on bio logical processes (Holling, 1973; Larsen and Alp, 2015). As a turning point, the
ecological threshold divides the ecosystems into two groups, between which the driving forces of ecological process are
different (Andersen et al., 2009; Scheffer and Carpenter, 2003). The ecological threshold is also linked to alternatively
stable states in the structure and function of ecosystems. Therefore, the alternatively stable states represent different 30
combinations of ecosystem components (e.g., assemblage of species, productivity) and environmental condit ions that may
stably persist at certain spatial and temporal scales (Suding et al., 2004).
According to the review of Re and the concept of ecological threshold, here we hypothesize that there is a temperature
threshold that can be utilized to identify the driv ing climate forces of the respirato ry process in terrestrial ecosystems within
Biogeosciences Discuss., https://doi.org/10.5194/bg-2017-345Manuscript under review for journal BiogeosciencesDiscussion started: 21 August 2017c© Author(s) 2017. CC BY 4.0 License.

3
different temperature zones. Therefore, the object ives of this study were to investigate the effects of air temperature and
other micrometeoro logical factors, including greenhouse gases (e.g., atmospheric CO2 concentration and atmospheric H2O
content), heat flux (e.g., soil heat flux, sensible heat flux, and latent heat flux), and water availability (e.g., precip ita tion,
relative humidity, and soil water content), on Re at d ifferent latitude regions and to quantify the temperature threshold for
respiratory process in different terrestrial ecosystems. This study was carried out using a global dataset covering broad 5
environmental grad ients.
2 Materials and Methods
2.1 Data
In total, 647 site-years data were collected at 152 eddy fluxsites globally. Basic informat ion of the database, including
site ID, latitude, longitude, PFT, climate class, year of data collection, and reference of each data set, is listed Table S1 10
(Supplement). Annual ecosystem respirat ion rates were estimated from the mean NEE values measured during nighttime.
At least five data points for each day and at least 255 measurements in each site were required for the estimat ion (Mahecha
et al., 2010). Mean annual air temperatures (MAT) and other mean annual values of selected micrometeorological factors
(i.e ., greenhouse gases, heat flux, and water availab ility), including atmospheric CO2 concentration (denoted by CO2),
atmospheric H2O content (H2O), soil heat flux (G), sensible heat flux (H), latent heat flux (LE), precipitation (P), relat ive 15
humid ity (RH), and soil water content (SWC), over the same periods for CO2 flux measurements were used as the
corresponding data for analysis .
2.2 Data analysis
If temperature is the primary determinant of Re rates (i.e., temperature-driven pattern), the maximum realizab le Re rate
(i.e ., the upper bound of Re rate) should increase with MAT (Kätterer et al., 1998; Rustad et al., 2001). If other 20
micrometeoro logical factors in addit ion to temperature control Re rates, the change of maximum realizable Re rate with MAT
is expected to be different from that of the temperature-driven pattern (Flanagan and Johnson, 2005; Xu et al., 2004). Based
on the hypothesis above, the quantile regression was applied to evaluate relationships between Re rate and MAT, and other
micrometeoro logical factors (i.e ., CO2, H2O, G, H, LE, P, RH, and SWC). Following the procedure of Cade and Noon
(2003), we applied the quantile linear regress ion at the quantile levels of τ∈(0.90, 0.95, 0.99) to evaluate relationships of the 25
maximum realizab le Re rates vs. temperature and other micrometeorological factors. For a tested factor, if quantile slopes at
all τ levels are significantly different from zero, the maximum realizable Re rates are significantly correlated to the factor. If
the correlation (i.e ., positive or negative) trends between the maximum realizable Re rates and a factor at the three linear
quantiles are not consistent, the quantile linear regression should be further tested at more quantiles. Many changes in
ecological processes occur with gradual transitions (Sankaran et al., 2005). Thus, we used a bent-cable model as a more 30
Biogeosciences Discuss., https://doi.org/10.5194/bg-2017-345Manuscript under review for journal BiogeosciencesDiscussion started: 21 August 2017c© Author(s) 2017. CC BY 4.0 License.
4
flexib le model to describe the gradualchanges from one ecological state to another to form a piecewise linear model (Chiu et
al., 2006). The model was implemented in the 'quantreg' library in the statistical package R (http://www.r-pro ject.org).
In addition to analyzing patterns of the maximum Re rates, a regression tree analysis was conducted to determine the
effects of temperature and other micrometeorological factors on the mean realizable Re rates. After tree construction, cross -
validation procedures were used to refine the trees to better represent relationships among the variables (De'ath and Fabricius, 5
2000). The regression tree analysis was implemented in ‘rpart’ library in the statistical package R. Further details on the
methodology are provided in the Supplement.
3 Results
3.1 Relationship between the maximum realizable Re rate and MAT
Using the quantile p iecewise linear regression at τ = 0.99, we evaluated the upper bound of Re rates (i.e., the maximum 10
realizable Re rates) changing with MAT. As shown in Fig. 1, a threshold of MAT was identified as 11±2.3℃. Within a
MAT range below the threshold, the relationship between the maximum realizable Re rate and MAT was characterized with
a linear equation Re = 0.19(MAT) + 2.49. In ecosystems with MAT >11±2.3℃, the relat ionship between the maximum
realizable Re rates and MAT was characterized with a linear equation Re = 0.07(MAT) + 3.81.
According to the MAT threshold, terrestrial ecosystems across the globe can be divided into two regions (Fig. 2). 15
Basically, terrestrial ecosystems with MAT ≤ the threshold are within the high-latitude regions and terrestrial ecosystems
with MAT > the threshold are with in the lower-latitude regions.
3.2 Relationships between the maximum realizable Re rate and other micrometeorological factors
Based on the temperature threshold, the data was divided into two groups: one for sites with MAT ≤ the threshold and
another for sites with MAT > the threshold. The quantile linear regression at τ∈(0.90, 0.95, 0.99) was applied to evaluate 20
the relationships between the maximum realizable Re rates and MAT as well as the micrometeorological factors, or the
driving forces for the maximum realizable Re rates. In the ecosystems with MAT ≤ 11±2.3℃, the maximum realized Re
rates increased with MAT (Fig. 3a), but decreased with H (Fig. 3b). However, the maximum realized Re rates were not
significantly correlated with other micrometeorological factors of CO2, G, H2O, LE, P, RH, and SW C (Table 1, Fig. 3c-j).
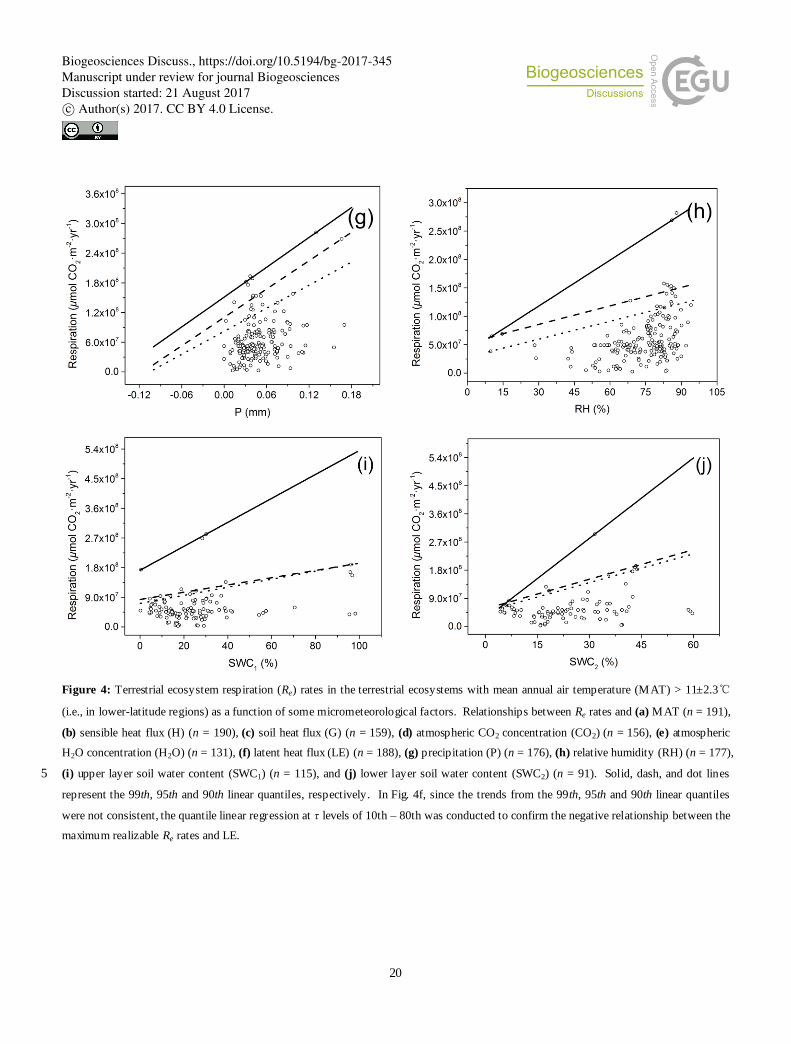
In sites with MAT > 11±2.3℃ (i.e., the lower-latitude sites), besides temperature, some micrometeorological factors 25
also profoundly affected the maximum realizable Re rate. As shown in Fig. 4 and Table 2, the maximum realizable Re rates
were positively correlated to MAT, H2O, and SWC, and negatively correlated to H and LE. For the data of maximum
realizable Re rates vs. LE, the quantile slopes at 90th, 95th and 99th percentiles were significantly different from zero (Table
2), but did not show consistently positive or negative relationships. Therefore, further quantile linear regressions at τ levels
Biogeosciences Discuss., https://doi.org/10.5194/bg-2017-345Manuscript under review for journal BiogeosciencesDiscussion started: 21 August 2017c© Author(s) 2017. CC BY 4.0 License.

5
of 10th– 80th were conducted, which confirmed the negative relationship between the maximum realizable Re rates and LE
(Fig. 4f).
Since temperature is a function of sensible heat (Lindau, 2001), the correlation between the maximum realizab le Re rate
and H indeed refers to the relationship of Re rate and temperature.
3.3 Effects of environmental factors on the mean realizable Re rate 5
A regression tree analysis of mean Re rates for a restricted subset of sites showed that MAT was the principal driving
force of respiratory process of terrestrial ecosystems (Fig. 5). In sites with MAT < 2.96℃ , the mean Re rates were typically
low and other micrometeorological factors rarely regulated the Re rates. In sites with MAT > 2.96℃ , RH became a
controlling factor to reduce Re rates below the MAT-controlled upper bound. At the next level in the tree, LE became a
relevant factor in regulating the mean Re rates. Within a certain RH value, a lower LE resulted in a h igher Re rate. The 10
sequence in Fig. 5 indicated that besides temperature, water availability and heat flux were the key factors to regulate the
respiratory process of terrestrial ecosystems.
4 Discussion
4.1 Patterns of Re response to temperature
Physiological processes of ecosystems are dependent on the enzyme kinetics, which are largely controlled by 15
temperature (Brown et al., 2004). Higher temperatures generally increase biochemical reaction rates, metabolic rates, and
rates of other biological activit ies (Brown et al., 2004). Although Re rates increased with temperature across all sites in this
study, Re rates in different regimes responded to temperature differently. In the high -lat itude region with low temperatures,
root respiration of plants and microbial metabolis m are primary controlled by temperature (Bond -Lamberty et al., 2004;
Lavigne et al., 2003). The decomposition rates of soil organic matter are relatively low in these regions so that substrate is 20
abundant (Davidson and Janssens, 2006). According to Michaelis -Menten kinetics (Michaelis and Menten, 1913), if
substrate is abundant and temperature does not exceed the optimum temperature, the reaction rate is determined by
temperature (Atkin and Tjoelker, 2003). This state of Re rates responding to temperature indicates that the maximum
realizable Re rates are primarily controlled by temperature.
In lower-lat itude regions with higher temperatures, besides temperature, other micrometeorological factors also affect 25
Re rates (Rustad et al., 2000). In these regions, the decomposition rates of soil organic matter are relatively h igh (Davids on
and Janssens, 2006), which results in low substrate availability. Water availability may also limit the substrate accessibility
of microbes. Therefore, besides temperature, substrate quality, availab ility, and accessibility become relevant for enzyme -
catalysed reaction rates (Berry and Raison, 1981; Davidson et al., 2006). Th is state of Re rates responding to temperature
implies that the respiratory process of terrestrial ecosystem is in a multi -factor-driven pattern. 30
Biogeosciences Discuss., https://doi.org/10.5194/bg-2017-345Manuscript under review for journal BiogeosciencesDiscussion started: 21 August 2017c© Author(s) 2017. CC BY 4.0 License.

6
At the ecosystem level, temperature changes may be associated with changes in the water balance via
evapotranspiration and altered precipitation reg imes (IPCC, 2007; Swann et al., 2016). Temperature increases enhance
evapotranspiration and reduce water availability.On the other hand, the physiolog ical response of plants to warming climate
with the stomatal conductance reduction may decrease water losses from the land surface (Swann et al., 2016). These two
opposite processes make the respiratory process of ecosystem more complicated in the high temperature regions (Balogh et 5
al., 2015; Kool et al., 2014). The temperature effect on microbial communit ies may also alter ecosystem carbon and nutrient
balances (Högberg et al., 2007; Karhu et al., 2014). Evidence shows that microbial communities and ac tivities are different
at the two end members of the temperature range (7-14℃) (Allison and Treseder, 2008; Crowther and Bradford, 2013;
Karhu et al., 2014; Nie et al., 2013).
4.2 Relationships between Re and other micrometeorological factors 10
Water availability influences autotrophic respiration by controlling p lant growth and development (i.e., production of
substrate), photosynthesis and carbon allocation patters (i.e., d istribution of substrate) (Flanagan and Johnson, 2005). Wat er
availability can also affect heterotrophic respiration through controlling microbial growth and development, and the supply
and quality of respiratory substrate provided by plants (Raich and Tufekciogul, 2000). Therefore, many studies have shown
that soil moisture can influence soil respiration (Curiel Yuste et al., 2003; Janssens and Pilegaard, 2003; Lav igne et al., 2004; 15
Reichstein et al., 2002). The thin soil water films in a dry condition should obstruct enzyme diffusion and reduce substrate
availability, while oxygen deficit in saturated soils creates anaerobic conditions. There is an optimal soil water content for
respiration (Davidson and Janssens, 2006). Generally, within a certain range of soil moisture content, soil respiration
increases with water content (Flanagan and Johnson, 2005; Reichstein et al., 2003). In semi-arid and arid reg ions, soil
moisture is the second most important abiotic variable for soil respirat ion (Qi and Xu, 2001). Even in Mediterranean 20
ecosystems, water availab ility is the main environmental constraint for plant growth and reproduction (Pausas, 1999) and
may become an even more limit ing resource under the increasing arid ity predicted for this region by most climate models
(Kéfi et al., 2007).
The effect o f precipitation on soil respiration extends beyond its direct effect via soil moisture (Reichstein et al., 2003).
Because of highly spatial and temporal variability of rainfall (Bowling et al., 2002; Curiel Yuste et al., 2003; Huxman et al ., 25
2004; Xu et al., 2004), we did not observe any relationship between the maximum realizable Re rate and precipitation.
Sensible and latent heat fluxes (H and LE) are non-radiative pathways for energy transfer from the Earth surface to the
atmosphere. Both H and LE are important components of the Earth’s surface energy budget (Rebmann et al., 2012). More
available energy of ecosystem partitioning to H leads to high vapour pressure deficit, which is a major impact factor on the
rate of net photosynthesis (Lambers et al., 1998). It has been shown that the vapour pressure deficit negatively affects Re 30
rates (Ekblad et al., 2005; Seneweera et al., 1998). Thus Re rates are negatively correlated to H. The evapotranspiration is a
function of LE (Gentine et al., 2007), and increased evapotranspiration will reduce water availability o f ecosystems.
Therefore, the Re rates are negatively correlated with LE.
Biogeosciences Discuss., https://doi.org/10.5194/bg-2017-345Manuscript under review for journal BiogeosciencesDiscussion started: 21 August 2017c© Author(s) 2017. CC BY 4.0 License.

7
As one of greenhouse gases (Rodhe, 1990), atmospheric H2O content (water vapour) increase may accelerate
respiratory process of terrestrial ecosystem (Wang et al., 2016). In addition, elevated H2O reduces the vapour pressure
deficit, resulting in higher Re rates(Ekblad et al., 2005; Seneweera et al., 1998). Therefore, Re rates are positively correlated
to H2O.
4.3 Temperature sensitivities under different temperature zones 5
Temperature is the primary factor in regulating respiratory process of terrestrial ecosystem. Since the regression tree in
Fig. 4 split data based on variance of the predictor variables, different temperature thresholds were obtained in the terminal
nodes. Several authors pointed out that Q10 values of Re rates decrease with temperature (Atkin and Tjoelker, 2003; Hamdi
et al., 2013; Schipper et al., 2014). Similarly, as indicated in Fig. 1, the temperature dependence of Re at low temperatures
(or in high-latitude regions) is stronger than that at high temperatures (or in lower-lat itude regions). In other words, the 10
temperature sensitivity of Re at low temperatures is higher than that at high temperatures. Biochemical reactions require
appropriate activation energies under different init ial ambient temperatures, according to the Arrhenius equation
(Blankenship, 2013; Laidler, 1996). More activation energy is required to complete the reaction at a lower temperature (Cai
et al., 2014). Re in response to a temperature change may be interpreted as respiration acclimat ion to temperature (Atkin and
Tjoelker, 2003). Temperature acclimation indicates that with increasing global temperature, plants and microorganis ms may 15
generate reversible changes in a way that can optimize their functioning under warmer environment, a process also described
as temperature adaptation (Saxe et al., 2001). Such adaptation mechanism may result in compensation of ecological
processes (e.g., Re) in response to a change in temperature and subsequently reduce the temperature sensitivity of ecological
processes (Luo et al., 2001; Tjoelker et al., 2008). Using field measurement data, Reich et al. (2016) demonstrated strong
acclimat ion of plant respiration to seasonal temperature increase. The acclimation mechanism reduces plant respiration rate 20
greatly and decreases Q10 values (Reich et al., 2016).
5 Conclusions
The results from this global scale analysis indicate that temperature is the main driving force of the maximum realizab le
Re rates in almost all terrestrial ecosystems, while other micrometeorological factors (e.g., water availability and heat flux)
reduce the maximum realizable Re rates in higher temperature reg ions. A temperature threshold was derived to identify the 25
driving forces of the respiratory process in terrestrial ecosystems under different climate regions. These findings highligh t
the key importance of climate drivers on the terrestrial carbon balance and may have important implications for the
benchmarking and refinement of biogeochemical land models (Flanagan and Johnson, 2005; Frank et al., 2010; Reynolds et
al., 2015). Better understanding of the driving forces of ecosystem respiration should enhance the capacity to accurately
estimate ecosystem carbon fluxes and predict future climate trajectories. 30
Biogeosciences Discuss., https://doi.org/10.5194/bg-2017-345Manuscript under review for journal BiogeosciencesDiscussion started: 21 August 2017c© Author(s) 2017. CC BY 4.0 License.

8
6 Data availability
The measured CO2 fluxes and meteorological data are obtained from the La Thuile Dataset, which are freely availab le
at the FLUXNET community (http://fluxnet.fluxdata.org/data/la-thuile-dataset/). The mean annual temperature data are
gathered from the MODIS subset product, and they are freely available at the MODIS subset website
(https://gmao.gsfc.nasa.gov/reanalysis/MERRA/). 5
Author Contributions
This study was conceived and designed by Z.Z., R.Z. Calculations and analysis was performed by Y.Z. The data were
collected by J.Z. Z.Z., R.Z., A.C., G.W. and V.M. wrote the paper, with contributions and comments from all other authors.
Acknowledgments
This study was supported by grants from the Chinese National Natural Science Foundation (Nos. 41471181 and 10
51179212). We also acknowledge all the principal investigators and data providers for sharing their flux data. The
following networks provided flux data: FLUXNET, AmeriFlux, AsiaFlux, ORNL DAAC, FFPRI Fluxnet (supported by
Forestry and Forest Products Research Institute), European Fluxes Database Cluster. This work used eddy covariance data
mostly acquired by the FLUXNET community, which is in part icular provided by the following networks: AmeriFlux [U.S.
Department of Energy, Biological and Environmental Research, Terrestrial Carbon Program (DE‐FG02‐04ER63917 and 15
DE‐FG02‐04ER63911)], AfriFlux, AsiaFlux, CarboAfrica, CarboEuropeIP, CarboItaly, CarboMont, ChinaFlux, Fluxnet
‐Canada (supported by CFCAS, NSERC, BIOCAP, Environment Canada, and NRCan), GreenGrass, KoFlux, LBA,
NECC, OzFlux, TCOS ‐ Siberia, USCCC. We acknowledge the financial support to the eddy covariance data
harmonizat ion provided by CarboEuropeIP, FAO‐GTOS‐TCO, iLEAPS, Max Planck Institute for Biogeochemistry,
National Science Foundation, University of Tuscia, Université Laval and Environment Canada and US Department of 20
Energy and the database development and technical support from Berkeley Water Center, Lawrence Berkeley National
Laboratory, Microsoft Research eScience, Oak Ridge Nat ional Laboratory, University of Californ ia-Berkeley, University of
Virgin ia.
References
Allen, A. P., Gillooly, J. F., and Brown, J. H.: Linking the global carbon cycle to individual metabolis m, Funct. Ecol., 19, 25
202-213, 2005.
Allison, S. D. and Treseder, K. K.: Warming and drying suppress microbial activity and carbon cycling in boreal forest soils,
Biogeosciences Discuss., https://doi.org/10.5194/bg-2017-345Manuscript under review for journal BiogeosciencesDiscussion started: 21 August 2017c© Author(s) 2017. CC BY 4.0 License.

9
Global Change Bio l., 14, 2898-2909, 2008.
Andersen, T., Carstensen, J., Hernández-García, E., and Duarte, C. M.: Eco logical thresholds and regime shifts: approaches
to identification, Trends Eco l. Evol., 24, 49-57, 2009.
Atkin, O. K. and Tjoelker, M. G.: Thermal acclimation and the dynamic response of plant respiration to temperature, Trends
in Plant Science, 8, 343-351, 2003. 5
Balogh, J., Fóti, S., Pintér, K., Burri, S., Eugster, W., Papp, M., and Nagy, Z.: Soil CO2 efflux and production rates as
influenced by evapotranspiration in a dry grassland, Plant So il, 388, 157-173, 2015.
Berry, J. A. and Raison, J. K.: Responses of Macrophytes to Temperature. In: Physiological Plant Ecology I: Responses to
the Physical Environment, Lange, O. L., Nobel, P. S., Osmond, C. B., and Ziegler, H. (Eds.), Springer Berlin
Heidelberg, Berlin, Heidelberg, 277-338 pp., 1981. 10
Blankenship, R. E.: Molecular mechanisms of photosynthesis, John Wiley & Sons, 2013.
Bond-Lamberty, B., Wang, C., and Gower, S. T.: Contribution of root respiration to soil surface CO2 flux in a boreal b lack
spruce chronosequence, Tree Physiol., 24, 1387-1395, 2004.
Bowling, D. R., McDowell, N. G., Bond, B. J., Law, B. E., and Ehleringer, J. R.: 13
C content of ecosystem respiration is
linked to precipitation and vapor pressure deficit, Oecologia, 131, 113-124, 2002. 15
Brown, J. H., Gillooly, J. F., Allen, A. P., Savage, V. M., and West, G. B.: Toward a metabolic theory of ecology, Eco logy, 85,
1771-1789, 2004.
Cade, B. S. and Noon, B. R.: A gentle introduction to quantile regression for ecologists, Front. Ecol. Environ., 1, 412-420,
2003.
Cai, J., Wu, W., and Liu, R.: An overview of d istributed activation energy model and its application in the pyrolysis of 20
lignocellulosic biomass, Renew. Sust. Energ. Rev., 36, 236-246, 2014.
Chiu, G., Lockhart, R., and Routledge, R.: Bent-Cable regression theory and applications , J. Am. Stat. Assoc., 101, 542-553,
2006.
Conant, R. T., Klopatek, J. M., and Klopatek, C. C.: Environmental factors controlling soil respiration in three semiarid
ecosystems, Soil Sci. Soc. Am. J., 64, 383-390, 2000. 25
Crowther, T. W. and Bradford, M. A.: Thermal acclimation in widespread heterotrophic soil microbes, Ecol. Lett., 16, 469-
477, 2013.
Curiel Yuste, J., Janssens, I. A., Carrara, A., and Ceulemans, R.: Annual Q10 of soil respirat ion reflects plant phenological
patterns as well as temperature sensitivity, Global Change Biol., 10, 161-169, 2004.
Biogeosciences Discuss., https://doi.org/10.5194/bg-2017-345Manuscript under review for journal BiogeosciencesDiscussion started: 21 August 2017c© Author(s) 2017. CC BY 4.0 License.

10
Curiel Yuste, J., Janssens, I. A., Carrara, A., Meiresonne, L., and Ceulemans, R.: Interactive effects of temperature and
precipitation on soil respirat ion in a temperate maritime pine forest, Tree Physiol., 23, 1263-1270, 2003.
Davidson, E. A. and Janssens, I. A.: Temperature sensitivity of soil carbon decomposition and feedbacks to climate change,
Nature, 440, 165-173, 2006.
Davidson, E. A., Janssens, I. A., and Luo, Y.: On the variab ility of respiration in terrestrial ecosystems: moving beyond Q10, 5
Global Change Bio l., 12, 154-164, 2006.
De'ath, G. and Fabricius, K. E.: Classification and regression tree: A powerful yet simple technique for ecological data
analysis, Ecology, 81, 3178-3192, 2000.
Ekblad, A., Boström, B., Holm, A., and Comstedt, D.: Forest soil respirat ion rate and δ13
C is regulated by recent above
ground weather conditions, Oecologia, 143, 136-142, 2005. 10
Enquist, B. J., Economo, E. P., Huxman, T. E., A llen, A. P., Ignace, D. D., and Gillooly, J. F.: Scaling metabolism from
organisms to ecosystems, Nature, 423, 639-642, 2003.
Falge, E., Baldocchi, D., Tenhunen, J., Aubinet, M., Bakwin, P., Berbig ier, P., Bernhofer, C., Burba, G., Clement, R., Davis,
K. J., Elbers, J. A., Goldstein, A. H., Grelle, A., Gran ier, A., Guðmundsson, J., Hollinger, D., Kowalski, A. S., Katul,
G., Law, B. E., Malh i, Y., Meyers, T., Monson, R. K., Munger, J. W., Oechel, W., Paw U, K. T., Pilegaard, K., 15
Rannik, Ü., Rebmann, C., Suyker, A., Valentini, R., Wilson, K., and Wofsy, S.: Seasonality of ecosystem respiration
and gross primary production as derived from FLUXNET measurements, Agr. Forest Meteorol., 113, 53-74, 2002.
Flanagan, L. B. and Johnson, B. G.: Interacting effects of temperature, soil moisture and plant biomass production on
ecosystem respirat ion in a northern temperate grassland, Agr. Forest Meteorol., 130, 237-253, 2005.
Frank, D. C., Esper, J., Raib le, C. C., Buntgen, U., Trouet, V., Stocker, B., and Joos, F.: Ensemble reconstruction constrain ts 20
on the global carbon cycle sensitivity to climate, Nature, 463, 527-530, 2010.
Gentine, P., Entekhabi, D., Chehbouni, A., Boulet, G., and Duchemin, B.: Analysis of evaporative fraction diurnal behaviour,
Agr. Forest Meteorol., 143, 13-29, 2007.
Gillooly, J. F., Brown, J. H., West, G. B., Savage, V. M., and Charnov, E. L.: Effects of size and temperature on metabolic
rate, Science, 293, 2248-2251, 2001. 25
Hamdi, S., Moyano, F., Sall, S., Bernoux, M., and Chevallier, T.: Synthesis analysis of the temperature sensitivity of soil
respiration from laboratory studies in relation to incubation methods and soil conditions, Soil Bio l. Biochem., 58,
115-126, 2013.
Han, G., Zhou, G., Xu, Z., Yang, Y., Liu, J., and Shi, K.: Biotic and abiotic factors controlling the spatial and temporal
variation of soil respirat ion in an agricultural ecosystem, So il Bio l. Biochem., 39, 418-425, 2007. 30
Biogeosciences Discuss., https://doi.org/10.5194/bg-2017-345Manuscript under review for journal BiogeosciencesDiscussion started: 21 August 2017c© Author(s) 2017. CC BY 4.0 License.

11
Högberg, M. N., Högberg, P., and Myrold, D. D.: Is microbial community composition in boreal forest soils determined by
pH, C-to-N ratio, the trees, or all three?, Oecologia, 150, 590-601, 2007.
Högberg, P., Nordgren, A., Buchmann, N., Taylor, A. F. S., Ekblad, A., Högberg, M. N., Nyberg, G., Ottosson -Lofvenius, M.,
and Read, D. J.: Large-scale forest girdling shows that current photosynthesis drives soil respiration, Nature, 411,
789-792, 2001. 5
Holling, C. S.: Resilience and stability of ecological systems, Annu. Rev. Ecol. Evol. S., 4, 1-23, 1973.
Huxman, T. E., Snyder, K. A., Tissue, D., Leffler, A. J., Ogle, K., Pockman, W. T., Sandquist, D. R., Potts, D. L., and
Schwinning, S.: Precipitation pulses and carbon fluxes in semiarid and arid ecosystems, Oecologia, 141, 254-268,
2004.
IPCC: Contribution of Working Group I to the Fourth Assessment Report of the Intergovernmental Panel on Climate Change. 10
In: Climate Change 2007: The Physical Science Basis, Cambridge University Press, Cambridge, UK and New York,
NY., 2007.
Janssens, I. A. and Pilegaard, K. I. M.: Large seasonal changes in Q10 of soil respiration in a beech forest, Global Change
Biol., 9, 911-918, 2003.
Karhu, K., Auffret, M. D., Dungait, J. A. J., Hopkins, D. W., Prosser, J. I., Singh, B. K., Subke, J. -A., Wookey, P. A., Agren, 15
G. I., Sebastia, M.-T., Gouriveau, F., Bergkvist, G., Meir, P., Nottingham, A. T., Salinas, N., and Hart ley, I. P.:
Temperature sensitivity of soil respiration rates enhanced by microbial community response, Nature, 513, 81 -84,
2014.
Kätterer, T., Reichstein, M., Andrén, O., and Lomander, A.: Temperature dependence of organic matter decomposition: a
critical review using literature data analyzed with different models, Biol. Fert. So ils, 27, 258-262, 1998. 20
Kéfi, S., Rietkerk, M., Alados, C. L., Pueyo, Y., Papanastasis, V. P., ElAich, A., and de Ruiter, P. C.: Spatial vegetation
patterns and imminent desertificat ion in Mediterranean arid ecosystems, Nature, 449, 213-217, 2007.
Kool, D., Agam, N., Lazarovitch, N., Heitman, J. L., Sauer, T. J., and Ben -Gal, A.: A rev iew of approaches for
evapotranspiration partition ing, Agr. Forest Meteorol., 184, 56-70, 2014.
Laidler, K. J.: A g lossary of terms used in chemical kinetics, including reaction dynamics (IUPAC Recommendations 1996), 25
Pure Appl. Chem., 68, 149-192, 1996.
Lambers, H., Chapin, F. S., and Pons, T. L.: Photosynthesis, Respiration, and Long -Distance Transport. In: Plant
Physiological Ecology, Lambers, H., Chapin, F. S., and Pons, T. L. (Eds.), Springer New York, New York, NY, 10-
153 pp., 1998.
Larsen, S. and Alp, M.: Ecological thresholds and riparian wetlands: an overview for environmental managers, Limnology, 30
Biogeosciences Discuss., https://doi.org/10.5194/bg-2017-345Manuscript under review for journal BiogeosciencesDiscussion started: 21 August 2017c© Author(s) 2017. CC BY 4.0 License.

12
16, 1-9, 2015.
Lavigne, M. B., Boutin, R., Foster, R. J., Goodine, G., Bernier, P. Y., and Robitaille , G.: So il respiration responses to
temperature are controlled more by roots than by decomposition in balsam fir ecosystems, Can. J. Forest Res ., 33,
1744-1753, 2003.
Lavigne, M. B., Foster, R. J., and Goodine, G.: Seasonal and annual changes in soil respiration in relation to soil temperature, 5
water potential and trenching, Tree Physiol., 24, 415-424, 2004.
Li, Y., Xu, M., and Zou, X.: Heterotrophic soil respiration in relation to env ironmental factors and microbial biomass in two
wet tropical forests, Plant Soil, 281, 193-201, 2006.
Lindau, R.: Sensible Heat Flux. In : Climate Atlas of the Atlantic Ocean : Derived from the Comprehensive Ocean
Atmosphere Data Set (COADS), Lindau, R. (Ed .), Springer Berlin Heidelberg, Berlin, Heidelberg, 383-397 10
pp.,2001.
Lipson, D. A., Schmidt, S. K., and Monson, R. K.: Carbon availability and temperature control the post -snowmelt decline in
alpine soil microbial biomass, Soil Biol. Biochem., 32, 441-448, 2000.
Luo, Y., Wan, S., Hui, D., and Wallace, L. L.: Acclimatization of soil respiration to warming in a tall grass prairie, Nature ,
413, 622-625, 2001. 15
Luo, Y.: Terrestrial carbon-cycle feedback to climate warming, Annu. Rev. Eco l. Evol. S., 38, 683-712, 2007.
Mahecha, M. D., Reichstein, M., Carvalhais, N., Lasslop, G., Lange, H., Seneviratne, S. I., Vargas, R., Ammann, C., Arain,
M. A., Cescatti, A., Janssens, I. A., Mig liavacca, M., Montagnani, L., and Richardson, A. D.: Global convergence in
the temperature sensitivity of respiration at ecosystem level, Science, 329, 838-840, 2010.
Melillo, J. M., Steudler, P. A., Aber, J. D., Newkirk, K., Lux, H., Bowles, F. P., Catricala, C., Magill, A., Ahrens, T., and 20
Morrisseau, S.: Soil warming and carbon-cycle feedbacks to the climate system, Science, 298, 2173, 2002.
Michaelis, L. and Menten, M. L.: Die kinetik der invertin wirkung, Biochem. Z ., 49, 334-336, 1913.
Nie, M., Pendall, E., Bell, C., Gasch, C. K., Raut, S., Tamang, S., and Wallenstein, M. D.: Positive climate feedbacks of soil
microbial communities in a semi-arid grassland, Ecol. Lett., 16, 234-241, 2013.
Pausas, J. G.: Response of plant functional types to changes in the fire regime in Mediterranean ecosystems: A simulation 25
approach, J. Veg. Sci., 10, 717-722, 1999.
Price, P. B. and Sowers, T.: Temperature dependence of metabolic rates for microbial growth, maintenance, and survival, P.
Natl. Acad. Sci. USA, 101, 4631-4636, 2004.
Qi, Y. and Xu, M.: Separating the effects of moisture and temperature on soil CO2 efflux in a coniferous forest in the Sierra
Biogeosciences Discuss., https://doi.org/10.5194/bg-2017-345Manuscript under review for journal BiogeosciencesDiscussion started: 21 August 2017c© Author(s) 2017. CC BY 4.0 License.

13
Nevada mountains, Plant So il, 237, 15-23, 2001.
Raich, J. W. and Potter, C. S.: Global patterns of carbon dioxide emissions from soils, Global Biogeochem. Cy., 9, 23-36,
1995.
Raich, J. W. and Tufekciogul, A.: Vegetation and soil respiration: Correlations and controls, Biogeochemistry, 48, 71 -90,
2000. 5
Rebmann, C., Kolle, O., Heinesch, B., Queck, R., Ibrom, A., and Aubinet, M.: Data acquisit ion and flux calcu lations. In:
Eddy Covariance: A practical guide to measurement and data analysis, Aubinet, M., Vesala, T., and Papale, D. (Eds.),
Springer Science & Business Media, 79-80 pp., 2012.
Reich, P. B., Sendall, K. M., Stefanski, A., Wei, X., Rich, R. L., and Montgomery, R. A.: Boreal and temperate trees show
strong acclimat ion of respiration to warming, Nature, 531, 633-636, 2016. 10
Reichstein, M., Rey, A., Freibauer, A., Tenhunen, J., Valentin i, R., Banza, J., Casals, P., Cheng, Y., Grünzweig, J. M., Irvine,
J., Joffre, R., Law, B. E., Loustau, D., M iglietta, F., Oechel, W., Ourcival, J.-M., Pereira, J. S., Peressotti, A., Ponti,
F., Qi, Y., Rambal, S., Rayment, M., Romanya, J., Rossi, F., Tedeschi, V., Tirone, G., Xu, M., and Yakir, D.:
Modeling temporal and large-scale spatial variability of soil respiration from soil water availability, temperature and
vegetation productivity indices, Global Biogeochem. Cy., 17, 1104, 2003. 15
Reichstein, M., Tenhunen, J. D., Roupsard, O., Ourcival, J.-M., Rambal, S., Mig lietta, F., Peressotti, A., Pecchiari, M., Tirone,
G., and Valentini, R.: Severe drought effects on ecosystem CO2 and H2O fluxes at three Mediterranean evergreen
sites: revision of current hypotheses?, Global Change Biol., 8, 999-1017, 2002.
Reynolds, L. L., Johnson, B. R., Pfeifer-Meister, L., and Bridgham, S. D.: Soil respirat ion response to climate change in
Pacific Northwest prairies is mediated by a reg ional Mediterranean climate gradient, Global Change Biol., 21, 487-20
500, 2015.
Rodhe, H.: A comparison of the contribution of various gases to the greenhouse effect, Science, 248, 1217, 1990.
Rogers, A. and Humphries, S. W.: A mechanistic evaluation of photosynthetic acclimat ion at elevated CO2, Global Change
Biol., 6, 1005-1011, 2000.
Rustad, L. E., Huntington, T. G., and Boone, R. D.: Controls on soil respirat ion: Implications for climate change, 25
Biogeochemistry, 48, 1-6, 2000.
Rustad, L., Campbell, J., Marion, G., Norby, R., Mitchell, M., Hartley, A., Cornelissen, J., Gurev itch, J., and Gcte, N.: A
meta-analysis of the response of soil respiration, net n itrogen mineralization, and aboveground plant growth to
experimental ecosystem warming, Oecologia, 126, 543-562, 2001.
Sage, R. F. and Kubien, D. S.: The temperature response of C3 and C4 photosynthesis, Plant Cell Environ., 30, 1086-1106, 30
Biogeosciences Discuss., https://doi.org/10.5194/bg-2017-345Manuscript under review for journal BiogeosciencesDiscussion started: 21 August 2017c© Author(s) 2017. CC BY 4.0 License.
14
2007.
Sankaran, M., Hanan, N. P., Scholes, R. J., Ratnam, J., Augustine, D. J., Cade, B. S., Gignoux, J., Higgins, S. I., Le Roux, X.,
Ludwig, F., Ardo, J., Banyikwa, F., Bronn, A., Bucini, G., Cay lor, K. K., Coughenour, M. B., Diouf, A., Ekaya, W.,
Feral, C. J., February, E. C., Frost, P. G. H., Hiernaux, P., Hrabar, H., Metzger, K. L., Prins, H. H. T., Ringrose, S.,
Sea, W., Tews, J., Worden, J., and Zambatis, N.: Determinants of woody cover in African savannas, Nature, 438, 5
846-849, 2005.
Saxe, H., Cannell, M. G. R., Johnsen, Ø., Ryan, M. G., and Vourlitis, G.: Tree and forest functioning in response to global
warming, New Phytol., 149, 369-399, 2001.
Schaefer, D. A., Feng, W., and Zou, X.: Plant carbon inputs and environmental factors strongly affect soil respirat ion in a
subtropical forest of southwestern China, So il Bio l. Biochem., 41, 1000-1007, 2009. 10
Scheffer, M. and Carpenter, S. R.: Catastrophic regime shifts in ecosystems: linking theory to observation, Trends Ecol.
Evol., 18, 648-656, 2003.
Schipper, L. A., Hobbs, J. K., Rutledge, S., and Arcus, V. L.: Thermodynamic theory exp lains the temperature optima of soil
microbial p rocesses and high Q10 values at low temperatures, Global Change Biol., 20, 3578-3586, 2014.
Seneweera, S. P., Ghannoum, O., and Conroy, J.: High vapour pressure deficit and low soil water availability enhance shoot 15
growth responses of a C4 grass (Panicum coloratum cv. Bambatsi) to CO2 enrichment, Funct. Plant Biol., 25, 287-
292, 1998.
Song, B., Niu, S., Luo, R., Luo, Y., Chen, J., Yu, G., Olejn ik, J., Wohlfahrt, G., Kiely, G., Noormets, A., Montagnani, L.,
Cescatti, A., Magliulo, V., Law, B. E., Lund, M., Varlagin, A., Raschi, A., Peichl, M., Nilsson, M. B., and Merbold,
L.: Divergent apparent temperature sensitivity of terrestrial ecosystem respiration, J. Plant Eco l-UK., 7, 419-428, 20
2014.
Suding, K. N., Gross, K. L., and Houseman, G. R.: Alternative states and positive feedbacks in restoration ecology, Trends
Ecol. Evol., 19, 46-53, 2004.
Swann, A. L. S., Hoffman, F. M., Koven, C. D., and Randerson, J. T.: Plant responses to increasing CO2 reduce estimates of
climate impacts on drought severity, P. Natl. Acad. Sci. USA, 113, 10019-10024, 2016. 25
Tjoelker, M. G., Oleksyn, J., Reich, P. B., and ŻYtkowiak, R.: Coupling of respiration, nitrogen, and sugars underlies
convergent temperature acclimation in Pinus banksiana across wide-ranging sites and populations, Global Change
Biol., 14, 782-797, 2008.
Wang, W., Smith, J. A., Ramamurthy, P., Baeck, M. L., Bou-Zeid, E., and Scanlon, T. M.: On the correlation of water vapor
and CO2: Application to flux partition ing of evapotranspiration, Water Resour. Res ., 52, 9452-9469, 2016. 30
Biogeosciences Discuss., https://doi.org/10.5194/bg-2017-345Manuscript under review for journal BiogeosciencesDiscussion started: 21 August 2017c© Author(s) 2017. CC BY 4.0 License.

15
Wiseman, P. E. and Seiler, J. R.: Soil CO2 efflux across four age classes of plantation loblolly p ine (Pinus taeda L.) on the
Virginia Piedmont, Forest Eco l. Manag., 192, 297-311, 2004.
Xu, L., and D. D. Baldocchi (2004), Seasonal variation in carbon dioxide exchange over a Mediterranean annual grassland in
California, Agr. Forest Meteorol., 123(1–2), 79-96.
Xu, L., Baldocchi, D. D., and Tang, J.: How soil moisture, rain pu lses, and growth alter the response of ecosystem respiratio n 5
to temperature, Global Biogeochem. Cy., 18, GB4002, 2004.
Xu, M. and Qi, Y.: Soil-surface CO2 efflux and its spatial and temporal variations in a young ponderosa pine plantation in
northern Californ ia, Global Change Biol., 7, 667-677, 2001.
Yvon-Durocher, G., Caffrey, J. M., Cescatti, A., Dossena, M., Giorgio, P. d., Gasol, J. M., Montoya, J. M., Pu mpanen, J.,
Staehr, P. A., Trimmer, M., Woodward, G., and A llen, A. P.: Reconciling the temperature dependence of respiration 10
across timescales and ecosystem types, Nature, 487, 472-476, 2012.
Zheng, Z., Yu , G., Fu, Y., Wang, Y., Sun, X., and Wang, Y.: Temperature sensitivity of soil respiration is affected by
prevailing climat ic conditions and soil organic carbon content: A trans -China based case study, Soil Bio l. Biochem.,
41, 1531-1540, 2009.
15
Figure 1: Analysis of the terrestrial ecosystem respiration (Re) rate as a function of mean annual air temperature (MAT) using data of 647
site-years across the globe. The maximum realizable Re rates (i.e., the upper bound of Re) are represented using the 99th quantile
piecewise linear regression. The regression analysis identifies a turning point (i.e., the threshold) at the MAT of 11±2.3℃. An equation 20
for the line quantifying the maximum realizable Re rates in ecosystems with MAT ≤ the threshold is Re = 0.19(MAT) + 2.49. An equation
for the line quantifying the maximum realizable Re rates in ecosystems with MAT > the threshold is Re = 0.07(MAT) + 3.81.
Biogeosciences Discuss., https://doi.org/10.5194/bg-2017-345Manuscript under review for journal BiogeosciencesDiscussion started: 21 August 2017c© Author(s) 2017. CC BY 4.0 License.

16
Figure 2: Distributions of patters of terrestrial ecosystem respiration (Re)rate responses to temperature across the globe. The grey line
denotes boundary of the patterns, and the data of MAT were from MERRA (Modern Era Retrospective-Analysis for Research and
Application) with 5-year (from 2009-2013) mean values (https://gmao.gsfc.nasa.gov/reanalysis/MERRA/). 5
Biogeosciences Discuss., https://doi.org/10.5194/bg-2017-345Manuscript under review for journal BiogeosciencesDiscussion started: 21 August 2017c© Author(s) 2017. CC BY 4.0 License.

17
Biogeosciences Discuss., https://doi.org/10.5194/bg-2017-345Manuscript under review for journal BiogeosciencesDiscussion started: 21 August 2017c© Author(s) 2017. CC BY 4.0 License.

18
Figure 3: Terrestrial ecosystem respiration (Re) rates in the terrestrial ecosystems with mean annual air temperature (MAT) ≤ 11±2.3℃
(i.e., in the high-latitude regions) as a function of some micrometeorological factors. Relationships between Re rates and (a) MAT (n =
456), (b) sensible heat flux (H) (n = 451), (c) soil heat flux (G) (n = 311), (d) atmospheric CO2 concentration (CO2) (n = 374), (e)
atmospheric H2O concentration (H2O) (n = 359), (f) latent heat flux (LE) (n = 449), (g) precipitation (P) (n = 432), (h) relative humidity
(RH) (n = 435), (i) upper layer soil water content (SWC1) (n = 234), and (j) lower layer soil water content (SWC2) (n = 214). Solid, dash, 5
and dot lines represent the 99th, 95th, and 90th linear quantiles, respectively.
Biogeosciences Discuss., https://doi.org/10.5194/bg-2017-345Manuscript under review for journal BiogeosciencesDiscussion started: 21 August 2017c© Author(s) 2017. CC BY 4.0 License.

19
Biogeosciences Discuss., https://doi.org/10.5194/bg-2017-345Manuscript under review for journal BiogeosciencesDiscussion started: 21 August 2017c© Author(s) 2017. CC BY 4.0 License.
20
Figure 4: Terrestrial ecosystem respiration (Re) rates in the terrestrial ecosystems with mean annual air temperature (MAT) > 11±2.3℃
(i.e., in lower-latitude regions) as a function of some micrometeorological factors. Relationships between Re rates and (a) MAT (n = 191),
(b) sensible heat flux (H) (n = 190), (c) soil heat flux (G) (n = 159), (d) atmospheric CO2 concentration (CO2) (n = 156), (e) atmospheric
H2O concentration (H2O) (n = 131), (f) latent heat flux (LE) (n = 188), (g) precipitation (P) (n = 176), (h) relative humidity (RH) (n = 177),
(i) upper layer soil water content (SWC1) (n = 115), and (j) lower layer soil water content (SWC2) (n = 91). Solid, dash, and dot lines 5
represent the 99th, 95th and 90th linear quantiles, respectively. In Fig. 4f, since the trends from the 99th, 95th and 90th linear quantiles
were not consistent, the quantile linear regression at τ levels of 10th – 80th was conducted to confirm the negative relationship between the
maximum realizable Re rates and LE.
Biogeosciences Discuss., https://doi.org/10.5194/bg-2017-345Manuscript under review for journal BiogeosciencesDiscussion started: 21 August 2017c© Author(s) 2017. CC BY 4.0 License.

21
Figure 5: Regression tree showing generalized relationships between the mean Re rates and the micrometeorological factors. The tree is
divided into seven terminal nodes. Branches are labeled with criteria used to segregate data. Values in terminal nodes represent mean Re
rates of sites grouped within the cluster.
Biogeosciences Discuss., https://doi.org/10.5194/bg-2017-345Manuscript under review for journal BiogeosciencesDiscussion started: 21 August 2017c© Author(s) 2017. CC BY 4.0 License.

22
Table 1: P values of the null hypothesis test for quantile regression slopes in 90th, 95th, and 99th quantiles on mean annual air
temperatures (MAT) of terrestrial ecosystems below 11±2.3℃.
Quantile MAT CO2 G H H2O LE P RH SWC1 SWC2
90th <0.0001 0.49 0.80 <0.0001 0.64 0.003 0.06 0.05 0.18 0.80
95th <0.0001 0.25 0.98 <0.0001 0.73 0.03 <0.0001 0.22 0.15 0.73
99th <0.0001 0.67 <0.0001 0.002 0.22 0.54 0.66 0.93 0.01 0.64
MAT is mean annual air temperature. Micrometeorological factors include CO2: atmospheric CO2 concentration, G: soil heat flux, H:
sensible heat flux, H2O: atmospheric H2O content, LE: latent heat flux, P: precipitation, RH: relative humidity, SWC1: upper layer soil
water content, and SWC2: lower layer soil water content. P < 0.05 indicates that quantile slope is significantly different from zero. 5
Table 2: P values of the null hypothesis test for quantile regression slopes in 90th, 95th, and 99th quantiles on mean annual air
temperatures (MAT) of terrestrial ecosystems above 11±2.3℃. 10
Quantile MAT CO2 G H H2O LE P RH SWC1 SWC2
90th <0.0001 0.86 0.51 <0.0001 <0.0001 <0.0001 0.17 0.06 0.01 <0.0001
95th <0.0001 0.98 0.56 0.03 0.03 0.02 0.04 0.07 0.01 <0.0001
99th <0.0001 0.002 <0.0001 0.03 0.03 <0.0001 0.003 0.09 <0.0001 <0.0001
Biogeosciences Discuss., https://doi.org/10.5194/bg-2017-345Manuscript under review for journal BiogeosciencesDiscussion started: 21 August 2017c© Author(s) 2017. CC BY 4.0 License.