Embed Size (px)
Citation preview

A Theory of Competitive Authoritarian Institutitonsand Democratic Transition
Mario Chac�on�
October 8, 2009
Abstract
This paper develops a model to study the e�ects of electoral competition in nonde-mocratic regimes. In this model, an authoritarian government can introduce a systemof fraudulent elections anticipating a democratic transition. If a government allowsthis sort of competition, it will undertake some investments, a portion of which aresunk costs, in setting up the organizational capacity to mobilize voters. This orga-nization is complementary to the institutions of democracy, hence, once a reformhas occurred, the authoritarian elite is more willing to tolerate democracy in the fu-ture. Comparative statics suggests that when elections under a dictatorship are morecompetitive, democracy is more likely. This result is investigated empirically usinga panel of countries from 1972 to 2002. The evidence shows that, controlling fortime invariant di�erences as well as global and regional trends, an increase in thecompetitiveness of the electoral system in a dictatorship increases the probability of atransition to democracy in the following period. This e�ect is robust and consistentwith the theory.
�Department of Political Science, Yale University, P.O. Box 208301 New Haven, CT 06520-8301 (e-mail:[email protected]). I would like to thank Elizabeth Dickinson, Thad Dunning, James Robinson, JohnRoemer, Frances Rosenbluth, Nicholas Sambanis, Jonah Schulhofer-Wohl and Ragnar Torvik for theiradvice and helpful comments. I also thank workshop participants at Yale, MIT and Duke.
1
1 Introduction
The last quarter of the twentieth century was a period of political liberalization across the
world. This transformation included not only an important number of political systems
that transitioned from nondemocratic to democratic governments, but also, minor liber-
alizations in countries that did not become fully democratic (Huntington 1991: 14-15).
For example, the proportion of regimes having an elected legislature but widely considered
as nondemocratic went from 58 percent in 1975 to more than 80 percent in 2002 (Keefer
2007). Similarly, the proportion of nondemocratic regimes with more than one autonomous
party in the legislature rose from 20 percent in 1972 to 63 percent in 1996 (Gandhi and
Przeworski 2006). Hence, a salient empirical regularity resulting from this global trend is
the proliferation of regimes that combine seemingly democratic institutions with elements
of authoritarianism.1
An important question is how these reforms, which have taken place in nondemocratic
societies, a�ect the likelihood of future regime change and democratization. Recent research
on comparative politics suggests that changes in political institutions during dictatorship
ought to have signi�cant e�ects on the political development of such regimes. In particular,
the introduction of institutions promoting the participation and representation of opposi-
tion sectors should negatively a�ect a transition toward democracy (Magaloni 2006; Gandhi
and Przeworski 2007; Boix and Svolik 2008). In this view, an autocratic government can
credibly commit to future policy concessions and redistribution by allowing legislatures and
some degree of electoral competition. Since these policy and material concessions are su�-
cient to maintain or co-opt a ruling coalition, a liberalization should enhance the political
survival of a dictatorship, making democracy less likely.2
However, the empirical evidence on the stabilizing e�ect of liberalization is inconclusive.
The idea that seemingly democratic institutions promote the survival of dictatorships seems
to contradict a number of studies showing that di�erent types of dictatorships have di�erent
propensities for survival and for democratization. On one hand, during the post-war period,
1The emergence and proliferation of this type of regimes is documented by Carothers (2002), Diamond(2002), Gandhi (2008:Ch 1), Hadenious and Teorell (2007), Huntington (1991), Levitsky and Way (2002),Ottaway (2003) and Schedler (2002,2006a,2006b) among others.
2The idea that some political institutions during dictatorship can be used to co-opt the opposition isalso suggested in the early literature on authoritarian regimes (e.g., Linz 1973, 1975, O'Donnell 1973 andHermet, Rose, and Rouqui�e 1978).
2

legislatures and party competition do not seem to a�ect the tenure of dictators (Gandhi
2008:175-177), or if they do, they have a negative e�ect on the lifespan of the regime
(Hadenious and Teorell 2007:151). Second, cross-sectional analyses for the period 1972-
2002 indicate that autocratic governments without a single dominant party are more likely
than other nondemocratic regimes to become democracies (Hadenious and Teorell 2007;
Brownlee 2009). Lastly, recent research focusing on the e�ect of elections on regime change
�nds evidence consistent with the theory that elections during dictatorship may promote
democratization (Lindberg 2006, 2007; Howard and Roessler 2006).
In this paper, I argue that the reason why we fail to observe a positive e�ect of liber-
alizations on regime stability is because the theories predicting such an e�ect are seriously
incomplete. These theories fail to recognize that any ruling elite would like to preserve
its interest across time not only under dictatorship but also under democracy. Thus, if
some of the actions taken during dictatorship in uence the prospects of democracy and a
transition is a possibility, a liberalization may have the opposite e�ect over regime change.
This consideration allows for a di�erent rationale for the incidence of liberalizations under
authoritarian rule and accounts for the recent increase in the number of democracies around
the world.
An autocratic government facing an organized opposition may attempt to block political
change by force. Democracy will emerge in this context when the costs of repression are
high relative to the costs of having a democratic system. In cases in which repression is
costly such that democracy is preferred, the ruling elite would want to preserve their power
by successfully contesting elections. If electoral competition during dictatorship reduces
the potential costs of democracy in the future, a liberalization can be a preventive measure
taken by an autocratic regime anticipating a democratization. Thus, an autocratic elite
may use institutional reforms not only to co-opt challengers but also to preserve some form
of power in an eventual democracy.
Even if a liberalization is introduced to co-opt an opposition movement today, the ac-
tions taken as a response to the new political environment may alter the incentives to
tolerate democracy tomorrow. For example, some organizations created during a liberal-
ization persist and are valuable assets in a democracy. If the creation of this organizational
capacity is associated with irreversible investments, the incentives to repress or democra-
tize after a liberalization are thereby altered. Thus, a liberalization that is accompanied by
3

some degree of electoral competition can alter the willingness to either introduce or block
democracy in the future.
To illustrate these ideas, I develop a simple dynamic model that combines elements of the
probabilistic voting model introduced by Lindbeck and Weibull (1987) with elements of the
democratization model pioneered by Acemoglu and Robinson (2000, 2001). In this model,
an authoritarian government can introduce a system of fraudulent elections anticipating a
democratic opposition in the future. If this form of competition is allowed, the government
will undertake some investments, a portion of which are sunk costs, in setting up the
organizational capacity to mobilize voters. In periods in which democracy is demanded,
an authoritarian government can repress the opposition or it can democratize. In the
latter case, this government will try to compete in free and fair elections. This simple set
up allows us to capture the mechanism by which the introduction of electoral competition
during dictatorship alters the intertemporal incentives to oppose or accept a regime change.
The model shows how under certain circumstances, the introduction of electoral com-
petition during dictatorship induces history dependence in the sense that the decision to
allow or block democracy is in uenced by past actions. Speci�cally, under certain cir-
cumstances, a democratic transition occurs only if the authoritarian regime was liberalized
in the past. The intuition for this result is straightforward. Since some of the organiza-
tions created during a liberalization are complementary to the institutions of democracy,
a ruling elite in a liberalized dictatorship is more willing to tolerate a democratic system.
This means that in some cases, democratization is more likely in a liberalized dictatorship
than in a closed regime. This prediction contrasts with current interpretations of political
institutions under dictatorship. As mentioned, these interpretations focus on the stabiliz-
ing e�ects of liberalization without considering the dynamics of electoral competition and
regime change.
In addition to showing precisely how di�erent political arrangements in a nondemoc-
racy a�ect the likelihood of future regime change and democratization, the model o�ers a
number of comparative static results. One that is particularly noteworthy is the relation-
ship between the degree of political competitiveness in a liberalized dictatorship and the
likelihood of democracy. In cases in which elections in a dictatorship are more competitive,
a liberalization of this regime is more likely to in uence the decision to democratize in the
future. This is the case because the di�erential value between a closed and a liberalized
4

dictatorship increases the more competitive elections are. Thus, the \lock-in" e�ect of
having a liberalized dictatorship as opposed to a fully authoritarian regime is greater for
cases in which elections under dictatorship are more fair and competitive. Consequently,
the competitiveness of the electoral system conditions the e�ect of liberalizations on regime
change.
The rest of the paper investigates empirically the e�ects of political liberalization under
dictatorship. This analysis focuses on the conditions under which electoral competition
under dictatorship in uences the likelihood of democratization and regime change. I explore
these conditions using panel data from a cross-section of nondemocratic regimes during the
period 1972-2008.
My empirical strategy is to exploit the within-country variation in the data, controlling
for time-constant unobserved e�ects. This strategy is particularly useful to eliminate a
potential source of omitted-variable bias in an econometric model of transitions and insti-
tutional characteristics. The econometric results shows that, controlling for these country-
speci�c e�ects, an increase in the competitiveness of the electoral system in a dictatorship
has a positive and signi�cant e�ect on the probability of a transition to democracy in the
following period. This means that reforms allowing electoral competition and representa-
tion in nondemocratic regimes have a positive e�ect on the likelihood of democratization.
This result is consistent with the motivating theory and robust across samples, regime
classi�cations and model speci�cations.
Even if within-country comparisons are an important improvement over the sectional
analyses prevalent in the literature, the estimates reported may not represent the causal of
political competitiveness on democratic transitions. The presence of time-varying omitted
variables a�ecting the likelihood of transition and correlated with the main explanatory
variable cannot be ruled out. Nevertheless, the conditional correlations uncovered are
robust to global and region-speci�c time trends in democracy and to some of the time-
varying covariates explored in the literature.
In addition to the works cited above, this paper is related to a number of formal models
of nondemocratic politics and democratization such as Feng and Zak (1999), Rosendor�
(2001), Conley and Timimi (2001) and Lizzeri and Persico (2004). Somewhat closer to the
model presented, is that of Llavador and Oxoby (2005). These authors emphasize the role of
elite competition over economic interests as a major factor explaining the extension of voting
5

rights in nineteenth century Europe. Although elite competition is an important element
in the argument, the main contribution is to emphasize how some of the organizations
resulting from this competition in uence the intertemporal incentives to democratize. To
the best of my knowledge, no previous study has formalized the role of organizations and
irreversible investments in a context of democratization.
On a broader level, this paper also relates to a large literature in political science
studying the dynamics of authoritarian politics and democratization (see, e.g., Huntington
and Moore 1970; Rustow 1970; O'Donnell 1973; Linz and Stepan 1996). Some of the
arguments proposed in this literature are consistent with the idea that some degree of
electoral competition may precede a full democratization. For instance, inspired by the
political histories of England and Sweden, Dahl (1971) argues that the path most likely to
produce a stable transition toward democracy is one in which:
...the rules, the practices, and the culture of competitive politics developed
�rst among a small elite, and the critical transition from nonparty politics to
party competition also occurred initially within the restricted group. (pp. 36)
Similarly, case studies and cross national analyses about political transitions in more
recent years suggest that democratization is less resisted in countries with legacies of po-
litical competition (see, e.g., Collier and Collier 1991; Remmer 1989; Mainwaring 1999;
Mahoney 2001). For example, explaining the domestic conditions that conditioned the
democratization of some African countries in the early 1990s, Bratton and van de Walle
(1997) argue that
Getting democracy is easier from a regime in which competition is encour-
age and the main challenge is to broaden participation; getting to democracy
is much more di�cult from a regime that has no tradition of political competi-
tion...(pp. 273)
Since these studies seldom explain how competitive politics or electoral competition
alter the incentives in a way that is conducive to democracy, this paper complements these
studies by providing explicit micro-foundations and a mechanism explaining how some of
these institutional legacies a�ect the prospects of democratization.
6

The paper proceeds as follows. Section 2 presents a simple dynamic model formalizing
the main theoretical contribution. Section 3 presents the econometric model, the cross-
section of countries used in the empirical analysis, and the econometric results. Section 4
o�ers some conclusions, and Section 5 (the Appendix) presents all the proofs from Section
2.
2 The Model
In this section I formalize the main argument in a dynamic model of political competition.
The model features two groups competing for power under di�erent political regimes. The
initial regime is a dictatorship controlled by one of these groups. The incumbent group
in this regime enjoys a monopoly of violence so that any opposition can be met with
repression. As an alternative to repression, the dictatorship can liberalize the regime and
allow competition. If the regime is liberalized, these groups will invest some resources in the
establishment of organizations that are speci�c to electoral competition. Given that some
of these investments are irreversible, any liberalization during dictatorship will alter the
incentives to introduce or block democracy in the future. This framework provides some
useful comparative statics results about the exact conditions under which the liberalization
of a nondemocratic regime will in uence the probability of a democratic transition in the
future.
2.1 The Environment
Consider an in�nite-horizon model of political competition between two groups, A and B.
The competition between these groups is Downsian in the sense that they do not have policy
preferences and only care about holding o�ce. The economy consists only of the production
of a natural resource good which creates some rents labeled Rt: All rents are collected by
the government, thus the incumbent group at time t enjoys rents in the amount Rt from
holding power. For simplicity, suppose Rt = R so the production of natural resources is
constant across time.
Voters are modeled as two groups, the elite superscripted E and the citizens (or poor)
superscripted P , with a continuum of individuals within each group. Let E and P denotethese two sets of voters, respectively. The mass of voters is normalized to unity, and the
7

share of total voters in each group is given by �E and �P . These groups are such that �E <
12< �P so the voters in E are a minority in the population.Each generation of voters is alive for only one period. As in the standard probabilistic
voting model of Lindbeck andWeibull (1987), voter's preferences consist of two components:
economic and ideological. All voters within each group share the same economic preferences
but they di�er in their ideological support for a regime ruled by any given party. Formally,
the utility of a representative voter i in group j when A is in power during a generic time
period t is:
Ui (q; xA) = uj(i)(q) + f(jxA � xij) + �t; (1)
where uj(i) is an indirect utility function, j(i) means that individual i is a voter in group
j = E ;P and q 2 Q � RK is a vector of economic policies where K � 1: The function uj(i)is strictly concave and di�erentiable. The term f(:) represents the utility that individuals
derive from intrinsic characteristics of A and B. This a�nity between the citizens and the
groups competing can be explained in terms of a partisan, ethic or religious a�liation. The
function f is monotone decreasing, thus xA represents the ideological bliss point of A; and
xi is the ideological bliss point of individual i. Lastly, �t represents the average (relative)
popularity of A in the population at time t.
In each period, the competition between A and B is conditioned by the political regime.
The society starts in a dictatorship ruled by A. In this regime, both B and the voters are
excluded from the political process, so there is no competition. This status quo is not stable
since the voters can organize and demand democracy. Following Acemoglu and Robinson
(2001, 2006), assume that the mobilization capacity of the voters is stochastic and uctuates
over time. Explicitly, in every period in which the regime is not democratic, the voters
organize, posing a credible threat to the existing regime with probability p: Periods in
which the citizens organize are labeled as \high threat" periods. A popular mobilization
may not lead to a democratization since the group enjoying the monopoly of violence can
employ repression and stop the movement. If repression is used, it is always a successful
strategy, and the group repressing pays a deterministic cost � > 0. For simplicity, suppose
that only A can repress and that the capacity to do so is not dependent upon A holding
o�ce.3
3This can be interpreted as a case in which A is a military group or the case in which the militaryis a perfect agent of group A. An alternative speci�cation is to assume some form of \institutionalized"
8

To analyze how di�erent levels of competition in a dictatorship in uence the incentives
to repress or to democratize, I consider an additional political regime. In this regime,
elections are introduced, and B is allowed to compete for the popular vote. The main
di�erence between this system and a democracy is that, in the former, the incumbent can
manipulate the outcome of the election. In this process, the regime gives less electoral
weight to groups that are expected to have low electoral support for the incumbent group.
This political regime based on lopsided elections is called \competitive authoritarian".
The next subsection explains in detail the following: the economic mechanism that
explains why competitive authoritarian institutions in uence the willingness to introduce
democracy, a rationale for why a dictatorial regime may introduce such institutions, and
the probability of victory for each group in each regime
2.2 Regimes and Electoral Competition
The political regime in any period t is treated as a state variable denoted st: This variable
can take three values: dictatorship (M); competitive authoritarian (C); and democracy
(D): A dictatorship of A is modeled in a simple way by assuming that B is banned from
the political process. In such a regime, the government is not accountable to the voter
population so there are no elections. In a competitive authoritarian and in a democratic
regime, voters participate, elections are held and the winner captures all rents from the
natural resource and becomes the next period incumbent.
The introduction of electoral competition is modeled as a process analogous to the
adoption of a technology. As any standard production function, this electoral technology
is associated with some stochastic costs, labeled �; part of which are sunk investment
costs. This means that that once these costs have been expended, they need not to be
repeated and nor can they be recovered. These costs represent the resources necessary to
develop some organizations that are speci�c to electoral competition. For example, � could
represent the costs of setting up a clientelistic network or establishing a party ideology
in the population.4 The irreversibility of �; or at least a part of �; is important for the
repression so only the group in power can repress. In this case the military acts like a perfect agent of theregime. This alternative would complicate the analysis without changing any of the substantive results.
4These organization are just some of the organizations inherent to any electoral competition. Forinstance, to guarantee the fairness of the election, the introduction of competition may require the creationof an independent electoral entity. The resources invested in this organization are not the ones highlighted
9

argument since the organizations associated with � are complementary to the institutional
framework of a democracy. This means that once these costs have been incurred by A, this
group will be less likely to repress and more willing to tolerate democracy in the future.
The level of � depends on how sti� the electoral environment is. In particular, suppose
that in periods in which the citizens are organized, political competition is more intense
relative to periods in which they are not. Let �l represent the level of party formation
costs involved in a low threat period, and �h the costs for a high threat period. These
costs are such that 0 � �l < �h so the introduction of electoral competition in periods in
which citizens solve their collective action dilemma and organize are associated with higher
investments.
In any regime in which elections are held, A and B can credibly commit to any economic
policy, but they cannot make credible commitments regarding their ideological position.
Then, a voter i type j(i) will vote for A when
uj(i)(qA) + F (xi) + �t > uj(i)(qB); (2)
where qA and qB are the policy platforms o�ered by A and B, and
F (xi) � f(jxA � xij)� f(jxB � xij):
Following Lindbeck and Weibull (1987), Dixit and Londregan (1995, 1996) and Persson
and Tabellini (2000), voter turnout is modelled as a probabilistic process. In particular,
F (xi) is an iid random variable uniformly distributed over Ii where
Ii =
([� 1
2�; 12�] for all i 2 E
[���; 1��
�] for all i 2 P . :
The ideological distribution in the population is such that � 2 (12; 1] so that a fraction �
of the citizens have a bias against a regime controlled by group A. To capture aggregate
uncertainty during elections assume that �t is a random variable characterized by a uniform
distribution with support [� 12 ; 12 ]. Hence, conditional on the realization of �t; and given
the distributional assumptions, the fraction of elite voters supporting party A is
Z 1=2�
��uE��t�di =
1
2+ � [uE(qA)� uE(qB) + �t] ; (3)
in the model since a dictatorship would not want to invest in such entity (it would lower their payo�s in acompetitive authoritarian regime).
10

where �uE � uE(qA)�uE(qB): Similarly, the fraction of poor voters supporting A is givenby
Z (1��)=�
��uP��t�di = 1� �+ � [uP (qA)� uP (qB) + �t] (4)
where �uP � uP (qA)� uP (qB):
As mentioned, an incumbent group in a competitive authoritarian regime can rig the
outcome of elections. Naturally, a rational incumbent in this regime would like to give less
importance to the votes of groups favoring the opposition. This process is captured in a
reduced-form way assuming that the incumbent can in uence directly the proportion of
supporters within each group. Speci�cally, an incumbent in a competitive authoritarian
regime can set a variable such that the e�ective population weights during elections are
~�E = �E + and ~�P = �P � : This variable can take two values, � and ; where � �E
and � �P :5 The parameter is interpreted as a proxy of how much power A has vis-�a-vis
the opposition group. For cases in which is high, an incumbency of A will have more
power to manipulate the electoral process relative to cases in which is low.
Then, assuming a majoritarian rule and conditioning on the decision , party A0s prob-
ability of winning in any period of a competitive authoritarian regime is simply6
�C(qA; qBj ) = Pr
8<:~�E 12 + ~�P (1� �) + �X
j2fP;Eg
~�j(�uj + �t) >1
2
9=; : (5)
In a democracy the regime cannot manipulate the electoral process, so we have the
standard probabilistic model of political competition. Given that in a democracy we have
the same two parties competing, the number of supporters from each group in a democracy
is given by (3) and (4). The corresponding probability for A in a democratic regime is
given by
�D(qA; qB) = Pr
8<:�E 12 + �P (1� �) + �X
j2fP;Eg
�j(�uj + �t) >1
2
9=; : (6)
5A more exible speci�cation would be to allow for a continuum of . Yet, given that there are only twogroups of voters, the restriction on is without loss of generality. In Chacon (2009), I propose a continuumcase extension of this model.
6The assumption of majoritarian rule is not crucial. If the objective of the parties is instead the maxi-mization of the vote share (an objective that would correspond to a system of proportional representation)the results would be exactly the same.
11

Lastly, A and B have identical preferences represented by EtP1
k=0 �kU g
t+k for g = A;B;
where � is the discount rate, U gt is the utility of party g at time t and Et is a standard
expectation operator (conditional on the information available at time t). The expected
utility for each party at any given period depends on the political regime and on the
decisions taken within each period. These actions, and how they a�ect the evolution of
regimes across time, are explained below.
2.3 Timing of Events and Equilibrium Concept
The order of moves within a generic period t is as follows:
1. If the citizens mobilize and the society is in a dictatorship, A decides whether to
repress or to democratize. If there is repression, A collects R, pays �; and the stage
game ends. If democracy is introduced, A and B pay the cost �h
2. If the citizens mobilize and the regime is competitive authoritarian, A decides whether
to repress or to democratize. If there is repression, A pays � and the regime remains
competitive authoritarian.
3. If the citizens do not mobilize and the regime is a dictatorship, the incumbent group
decides whether to introduce competitive authoritarian institutions: If competitive
authoritarian institutions are introduced, the incumbent chooses 2 f�� ; � g andboth A and B pay a cost �l:
4. In a competitive authoritarian or in a democratic regime, A and B simultaneously
and noncooperatively announce their electoral promises qA and qB. The value �t is
realized and elections held. The winner of the election implements his announced
policy, collects all rents for o�ce and becomes the incumbent in the next period.
5. Consumption takes place, and the stage game ends.
The standard solution concept in this type of in�nite horizon game is subgame perfect
equilibrium. In this concept, strategies may depend on the entire history of the game. To
simplify the analysis, I focus on pure strategy Markov-perfect equilibria (MPE). In this
concept, the strategies players play are restricted to those that depend only on the current
state of the world and not on the entire history of play (except for relevant within-period
12

histories). The state of the system in any stage game consists of a political regime st and
a variable ot 2 fl; hg indicating whether or not the citizens are organized. To simplify thenotation, let sh denote a political state during a period in which the citizens mobilize and
demand democracy, and sl a state in which they do not. Thus, sh is a political regime of
type s facing a \high threat" from the citizens. Given that the citizens can only mobilize
if the state is not a democracy, the set of states is S = fM l;Mh; C l; Ch; Dg:A strategy for A is a function �A(s). This strategy determines the action pro�le f!;
c; ; qAg. The variable ! denotes the decision to repress, which applies only in statesMh and
Ch: ! = 1 means repression and ! = 0 means no repression. The variable c represents the
decision to introduce competitive authoritarian institutions, a decision that applies only in
state M l: Following the same notation, c = 1 implies the introduction of such institutions,
and c = 0 means no introduction. 2 f� ; g denotes the decision of how to manipulatean election, a decision which applies only when c = 1: Lastly, qA is a policy announcement
during elections which happens only in states C l and D: Similarly, a strategy for B is �B(s)
and it determines the pro�le f ; qBg where is the decision to manipulate the election instate C l; and qB is a policy announcement for B and applies only in states C l and D: A
strategy combination (��A; ��B) is a pure strategy MPE if �
�A and �
�B are best responses to
each other for all s in S.The transition between states is as follows. Starting fromMh; if there is repression then
the state switches to M l; and if there is no repression the state becomes D; which is an
absorbing state. From Ch; if there is repression, the state transits to C l; and if there is no
repression, the state transits to D:Finally, starting from M l; if competitive authoritarian
institutions are introduced (i.e., c = 1), the state transits to C l. If these institutions are
not introduced, the state remains in M l: The law of motion between high and low states
is summarized in Figure 1 and Figure 2.
2.4 Characterization of Equilibria
The MPE pro�les are characterized by backward induction in any stage game beginning at
some arbitrary date t and taking future plays as given. The choice over is straightforward.
Since the citizens have a bias against any regime ruled by A (� is bigger than one half),
any period in which there is a competitive authoritarian regime ruled by A; this group will
give more electoral power to the elite voters. Thus, in any period in which s = C l and A
13

is in power, they will choose � = : To simplify the analysis, suppose that once the level
of electoral manipulation is chosen it remains �xed for the rest of the game. Taking this
decision to manipulate the elections as given, let us focus on the equilibrium policies in
any electoral regime. Let �s = (�A(s); �B(s)) a MPE policy combination during elections in
state s where �g : S !Q for g = A;B: Then, the relevant Bellman equation describing the
equilibrium discounted value for A in a dictatorship when the citizens are not organized is
given by
V A(M lj�D) = R + ��(1� p)V A(M lj�D) + pV A(Mh)
�; (7)
where � 2 (0; 1) is the discount rate and p is the probability of the popular mobilizationde�ned previously. The interpretation of (7) is straightforward. Since there is no competi-
tion in a dictatorship, A enjoys all rents from o�ce and holds power with probability one in
the current period. In the next period, with probability 1� p the citizens do not mobilize,so the value V A(M lj�D) recurs. In the last term, with probability p the citizens mobilize,
so the continuation value is V A(Mh); the value of a threatened dictatorship. V A(Mh) is
not necessarily equal to V A(M l) since the equilibrium value in this case is a function of the
decision to repress or to democratize. Formally, V A(Mh) can be expressed as
V A(Mh) = max!2f0;1g
!(V A(M lj�D)� �) + (1� !)(V A(Dj�D)� �h);
where ! = 1 implies repression and ! = 0 implies democratization. The decision to
democratize depends crucially on the costs of repression � and on the costs of introducing
democratic institutions in a high state �h. For the case in which there is no repression, the
(gross) value of democracy for A is given by V A(Dj�D):Using the same recursive form, the equilibrium value functions for A and B in a com-
petitive authoritarian regime where citizens do not mobilize (ignoring party formation costs
and taking the decision as given) are expressed as
V A(C lj�Cl ; �D) = maxq2Q
f�C(q; �B)R + �[(1� p)V A(C lj�Cl ; �D) + pV A(Ch)g (8)
and
V B(C lj�Cl ; �D) = maxf[1� �C(�A; q)]R + �[(1� p)V B(C lj�Cl ; �D) + pV B(Ch)]g (9)
14

where �C(:) is given by (5). The main di�erence between V A(C l) and V A(M l) is that in a
competitive regime, A captures power in the current period with probability �C < 1: This
probability depends not only on the behavior of the voters, but also on the interaction with
party B. The values V A(C lj�Cl ; �D) and V B(C lj�Cl ; �D) take into account the \one-step-ahead deviation" principle, since it is assumed that both A and B will follow the same
optimal strategies tomorrow if they face the same state as today. By the same logic as
before, V A(Ch) and V B(Ch) are given by
V A(Ch) = max!2f0;1g
!(V A(C lj�Cl ; �D)� �) + (1� !)V A(Dj�D)
VB(Ch) = !V B(C lj�Cl ; �D) + (1� !)V B(Dj�D):
The value for A in the case in which the citizens challenge a competitive authoritarian
regime depends on their own choice about whether or not to repress. On the other hand,
since A enjoys the monopoly of repression, the value for B depends on A0s decision to
repress. If A represses, so ! = 1; they get the same payo� V A(C lj�Cl ; �D) and pay the cost �.For the case in which there is no repression, A and B �nd themselves in a democracy. Notice
how �h plays no role in this decision; given that the regime is competitive authoritarian,
this cost was incurred in a previous period.
The following lemma characterizes the MPE policies in a competitive authoritarian
regime (all proofs are contained in the Appendix).
Lemma 1 In any MPE, the unique electoral equilibrium in a competitive authoritarian
regime involves �A(Cl) = �B(C
l) � q�C : For the case in which the equilibrium is interior and
the regime is controlled by A, q�C is characterized by
(�e + � )ruE(q�C) + (�c � � )ruP (q�C) = 0; (10)
where ruj(q) denotes the gradient vector (@uj@q1; ::;
@uj@qK)T :
Lemma 1 highlights two important points. The �rst is that in a competitive authori-
tarian regime the unique electoral equilibrium involves both parties converging to the same
platform. The intuition for this result is that since parties do not have policy preferences,
the objective function of B is symmetric to that of A. Thus, parties face exactly the same
maximization problem (see proof in the Appendix). As it is well know, this result is not
15
so general and is a consequence of the fact that parties do not have policy preferences.
Policy convergence between parties is not important for the main result, but it simpli�es
the analysis.
Second, and more important, the equilibrium policy caters to the preferences of the
elite and the citizens. This is easy to see from (10), but it is also true for the case in which
the solution is not in the feasible set. The interior solution characterization is useful since
it corresponds to the solution of a weighted utilitarian social welfare function, with weights
(�e + � ) and (�c � � ). As we see, both the elite and the citizens have \electoral power" ina competitive authoritarian election. Yet, this power depends not only on the primitives
of the population (their numbers and ideological heterogeneity) but on the capacity of the
incumbent to manipulate the outcome of the election. In this state, the ruling group can
decrease (or increase) the power of the citizens depending on how this a�ects their electoral
prospects. In the case in which A controls the government, given that A has a negative
popularity among the citizens, the equilibrium institutions in a competitive authoritarian
regime will give disproportionate power to the elite voters. As a result, the minority group
in the population has more power in a competitive authoritarian regime ruled by A than
in a democracy.
Lastly, using the fact that democracy is an absorbing state, the values for A and B in
a democracy are
V A(Dj�D) = maxq2Q
��D(q; �B(D))R
1� �
�(11)
V B(Dj�D) = maxq2Q
(�1� �D(�A(D); q)
�R
1� �
):
The following result is analogous to Lemma 1, and it characterizes the equilibrium policies
in a democracy.
Lemma 2 In any MPE, the unique electoral equilibrium in a democracy involves �A(D) =
�B(D) � q�D: For the case of interior equilibrium, policy is characterized by
�eruE(q�D) + �cruP (q�D) = 0 (12)
The characterization result of Lemma 2 shows that in a democracy, both parties will
converge to the same policy. The intuition for this result is similar to the one explained
previously. Also, equation (12) shows how the economic policy in a democracy is catered
16

according to the size of each group, with bigger groups having more electoral power. Given
that the poor voters constitute a majority in the population, they will have more power in
a democracy than the elite voters.
As mentioned, the decision to democratize depends crucially on repression cost � and
on the party formation cost �h: For cases in which � and �h are too high, A will never
repress but also, they would not want to invest in a party to compete in elections. More
interesting are cases in which, given that electoral competition is introduced, A will always
�nd it optimal to compete. A su�cient condition for this is to be true is
Assumption 1: �D(�D)R1�� � �h > 0.
This assumption is simply a \participation constraint" for A in a democratic state.
Given that there is an average negative popularity for A in the population, �D(�D) is
smaller than 1 � �D(�D): This implies that if Assumption 1 holds, the participation con-straint for B in a democracy also holds.
We now de�ne some values necessary to describe equilibrium strategies. In particular,
we focus on some critical values for � that will determine the decision to repress or democ-
ratize in di�erent states of the game. To derive the equilibrium value in a dictatorship,
suppose that A is playing a strategy of always repressing every time there is popular mo-
bilization. Then, V A(Mh) = V A(M lj�D)� �: Substituting this value in (7) and solving forVA(M
lj:) we get
V A(M lj:; �) = R� �p�
1� �: (13)
The interpretation of this value is straightforward. This value is the per-period return
from having an in�nitely-lived dictatorship discounted to the present. It takes into account
the fact that the regime will pay the cost of repression � a proportion p of future periods.
This value is conditioned on � for presentation purposes. Let �� be a repression cost such
that in any high state, a dictatorship ruled by A is indi�erent between repression and
democratizing. This threshold is implicitly given by V A(M lj:; ��)� �� = V A(Dj�D)� �h:7
7This derivation is without loss of generality since any conjectures we make about future actions are notimportant. If instead we use a \one-shot deviation" principle approach, assuming that repression wouldtake place today and never in the future, we would get exactly the same repression threshold ��. This isa property of this type of games and of dynamic programing more generally (see Fudenberg and Tirole1991).
17

Using (11), (13) and the result of Lemma 2, solving for �� we get
�� =1
1� �(1� p)
�(1� �D(�D))R + (1� �)�h
�; (14)
where �D = (q�D; q�D): Replacing the MPE platforms in (6) we get
�D(�D) =1
2�
�[1
2� �E
1
2� �P (1� �)]: (15)
Comparative statics on �� reveals that if � and p are high, which means that the dictator
cares about the future and the citizens are well organized across time, repression is less
attractive and democracy more likely. More interesting is the relationship between � and
��: An increase in �; holding all other variables constant, decreases the probability of victory
in a democracy. Thus, an increase in � increases the region of the parameter space in which
repression takes place, so democratization is less likely. A bigger �h also makes democracy
less likely through the same mechanism.
Using a similar approach, we derive V A(C lj�Cl ; �D) assuming that A will always repressin a high state. This strategy implies that V A(Ch) = V A(C lj�Cl ; �D) � �. Replacing this
value in (8) and using the result of Lemma 1, V A(C l; :) becomes
V A(C lj�Cl ; �D; �) = �C(�Cl)R� �p�
1� �(16)
where �Cl= (q�C ; q
�C). For the case in which A is the stage game incumbent, the probability
of victory in a competitive authoritarian regime induced by the equilibrium platforms is
�C(�Cl
) = �D(�D) +
�� (�� 1
2); (17)
where �D(�D) is given by (15).
Let ��� denote a repression cost such that for � < ��� it is optimal for a competitive
authoritarian regime ruled by A to repress in a case of high threat. For � > ��� democracy
is preferred. This critical threshold is given implicitly by V A(C lj:; ���)� ��� = V A(Dj�D):This equality implies that
��� =1
1� �(1� p)
h�C(�C
l
)� �D(�D)iR; (18)
where �C(�Cl) is given by (17).
18

It is clear to see that ��� < ��: This means that the critical cost of repression that makes
partyA indi�erent between repressing and democratizing is lower if the citizens mobilize in a
competitive authoritarian regime (as opposed to the case when the regime is a dictatorship).
This is partly caused by the costs sunk in a previous period -the period in which competitive
institutions were introduced. The di�erence in these thresholds highlights the mechanism
by which electoral competition in uences the likelihood of democratization. In this setting,
the introduction of electoral competition at any point in time alters the willingness to
introduce democracy in the future.
Lastly, we de�ne a critical value for � such the A; acting as an incumbent, is indi�erent
between competitive authoritarianism and dictatorship. For the purpose of the presenta-
tion, suppose � 2 (���; ��): Implicitly, this value is given by
V A(C lj��)� �l = V A(M l); (19)
where
V A(C lj��) = �C(�Clj��)R + �pV A(Dj��)1� �(1� p)
,
and V A(M l) is given by (13). The value V A(C lj��) takes into account that for � 2 (���; ��);the introduction of electoral competition in dictatorship will lead to a democratization in
the future. Since VA(Cl) is monotonically decreasing and continuous in �, we know there
exists a unique �� satisfying (19). This means that for � < ��; a dictatorship ruled by
A will liberalize the regime knowing that this will inevitably lead to a democracy in the
future. On the other hand, for � > ��; electoral competition during authoritarian rule is
too costly, so a dictatorship of A will not liberalize even if this means that it will have to
pay the cost of repression in every period in which the citizens organize.
Before I present the main proposition, I introduce a participation constraint for both
parties in a competitive authoritarian state ruled by A. A su�cient condition is given by
Assumption 2: �C(�Cl)R+�pV A(Dj�D)1��(1�p) � �l > 0 and
[1��C(�Cl )]R+�pV B(Dj�D)1��(1�p) � �l > 0:
This assumption is analogous to Assumption 1. It implies that if competitive authori-
tarian institutions are introduced, it would be worth while for both A and B to invest in
a party and compete in elections.
Given the previous analysis, we can now characterize the MPE outcomes in di�erent
parts of the parameter space. The following proposition summarizes the result.
19

Proposition 1: Suppose that Assumption 1 and 2 hold, and let ��; ��� and �� be de�ned by
(14), (18) and (19) respectively. If � 2 (���; ��) and the society starts in a dictatorshipby A, any MPE is such that:
i) If � � ��; competitive authoritarian institutions are introduced in the �rst period
of low threat, the society democratizes in the �rst period the citizens mobilize, and
repression is never used.
ii) If � > ��; competitive authoritarian institutions are never introduced, repression
is used in every period the citizens mobilize and society remains a dictatorship.
The characterization of Proposition 1 has two important properties. First, for medium
levels of �; namely for � 2 (���; ��); democracy is introduced at any point in time if and onlyif competitive institutions were introduced in the past. Otherwise repression will always
take place. Then, in this region of the parameter space, we identify two equilibrium paths,
one with early competitive authoritarianism and democracy and the other with a persistent
dictatorship and repression. In the �rst path, the introduction of competitive authoritar-
ianism at any point in time can be identi�ed as causing democracy to be implemented in
the future.
Second, for medium levels of �; competitive authoritarianism is introduced only when
s = Ml and � � ��: This means that a dictatorship of A needs a minimum level of
support from the citizens so that a system of fraudulent elections is su�ciently attractive.
Moreover, the condition � � �� is necessary but not su�cient for the liberalization of a
dictatorship, since this decision can only take place in a low threat period. This means that
even if � � �� holds, the citizens will be repressed if they organize and demand democracy
in the �rst and subsequent periods. Thus, a �rst period of low mobilization from the
citizens can be interpreted as a \window of opportunity" for the introduction of some
democratic elements during dictatorship. This opportunity, together with the resources
invested in political organization that are speci�c to the political competition, explain the
two diametrical equilibrium paths.
2.5 State Dependence and Regime Change
The thresholds �� and ���; given by (14) and (18) respectively, are useful to describe the
cases in which political liberalizations during dictatorship matter for political transitions.
20

For cases in which � < ���; repression costs are so low that independently of the state,
repression is always a best response when the citizens mobilize. Hence, independently of
the state, a nondemocratic regime ruled by A will always repress. This parameterization
is interpreted as countries ruled by closed dictatorships with no history of democratic
competition.8 On the other hand, cases in which the cost of repression is such that � > ��;
repression is too costly, so independently of the state, democracy is always introduced in a
high threat period.9 This means that for this region of the parameter space, the e�ect of pre-
democratic competition cannot be identi�ed (since democratization takes place regardless
of whether or not the regime is competitive authoritarian). Thus, for � < ��� or � > ��; the
mechanism by which a liberalization a�ects the incentives to democratize does not operate.
More interesting are cases for which ��� < � < ��: In these cases, the incumbent group
will repress if and only if the state is a dictatorship and never otherwise. This implies that
a democratic state can only emerge in a competitive authoritarian regime. As a result, for
this region of the parameter space there is a particular \path dependence" process in the
sense that the state of the system at time t is a function of the state at time t�1.10 Hence,the causal e�ect of electoral competition on regime change can only be identi�ed for cases
in which � 2 (���; ��):This characterization result suggests that the e�ect of institutions promoting competi-
tion on a possible regime change is heterogenous, and it depends crucially on how costly it
is for a dictatorship to repress the citizens. For cases in which the cost of repression is too
low (or too high) the e�ect is null.
In order to derive some comparative statics results, I focus on the cases in which pre-
democratic competition ought to have a positive e�ect on democratization. In particular, I
de�ne a critical region of the parameter space in which the proposed mechanism operates.
The idea is to compare how this region changes depending on di�erent values of some
8For this region of the parameter space liberalizations don't occur on the equilibrium path. Given thatthe bene�ts from having a preventive liberalization are never realized, competitive authoritarian institutionsare never introduced.
9For these cases, liberalizations will occur on the equilibrium depending on the relative gain from payingthe low �l today or the high cost �h in the future. If �l is su�ciently low, an equilibrium liberalizationwill occur in the �rst low threat state.10See Page (2006) for a taxonomy and a detailed discussion of other types of history dependence in
dynamic games.
21

parameters. Formally, the region of state dependence is given by
�� � �� � ���;
where �� and ��� are de�ned by (14) and (18). Replacing for each threshold and simplifying
we get
�� =1
1� �(1� p)
�(1� �C(�Dj )R + (1� �)�h
�: (20)
As we see, the region of state dependence depends on: how patient the group in power
is, the probability of popular mobilization, the probability of victory in a competitive
authoritarian regime, the gross rents from holding power and the cost of building a party
in a high state. The following lemma summarizes some comparative statics for the case in
which A is the �rst period dictator.
Proposition 2: The region of state dependence �� is such that
@��
@R> 0;
@��
@� < 0 and
@��
@�h> 0:
Interestingly, when the natural resource rents are higher, it is more likely that compet-
itive institutions in a dictatorship will have an e�ect on democratization. The intuition
for this result is the following. Holding everything constant, as rents increase, the value of
holding power in a dictatorship increases more relative to the value of doing so in a com-
petitive authoritarian regime. Then, conditional on being in a competitive authoritarian
state, the incentives to repress increase, but they increase \less" relative to the case in
which the state is a full dictatorship. This result shows how an exogenous, nontax revenue,
creates di�erent incentives depending on the type of authoritarian regime.
An important comparative result is the relationship between � ; the degree of electoral
manipulation in a competitive authoritarian regime, and the likelihood of democracy. As
Proposition 2 shows, holding everything constant, a higher � will decrease the region of
state dependence. This means that in cases in which the ruling party in a dictatorship
has a strong in uence on the electoral process, competitive authoritarian institutions are
less likely to in uence the decision to democratize. This result indicates that the level
of competition and the degree of electoral fraud in a competitive authoritarian regime
condition the e�ects that these institutions have on the likelihood of democracy. Based on
this, we would expect that the more competitive and the less corrupt the the dictatorship
is, the more likely that a liberalization will in uence the decision to democratize.
22

3 Empirical Evidence
This section presents cross country evidence consistent with the idea that conditional on
some country characteristics, the competitiveness of a nondemocratic regime in uences the
likelihood of democratization. The theory advanced in the previous section does not o�er
strong insights on how to specify the econometric model. Yet, the model suggests that the
e�ect of political liberalization during dictatorship is heterogenous and depends crucially
on the costs of repression. Moreover, the comparative statics results suggest that this e�ect
is stronger for cases in which the incumbent group in a dictatorship exerts less control over
the electoral process. Thus, the empirical test focuses on these conditional e�ects. I start
by explaining the empirical strategy and the identifying assumptions of the econometric
exercise.
3.1 Empirical Strategy
The empirical strategy followed is based on within-country comparisons across time. This
approach is particularly useful to deal with time-invariant unobserved factors that a�ect
both the competitiveness of a political system at any given point in time and the occurrence
of a political transition. For example, it is widely believed in the political economy liter-
ature that historical legacies play an important role in determining the long run political
equilibrium of colonized countries (see Engerman and Sokolo� 1997 and Engerman, Mari-
cal and Sokolo� 1998). If these historical factors are correlated with the main explanatory
variable and are omitted, this may lead to serious biases in a regression analysis. The main
idea of the empirical strategy is to eliminate these unobserved e�ects by using either within
transformations or �rst di�erencing.
Even if within-country comparisons are an important improvement over a pure cross
sectional analysis, the estimates presented may not re ect the true causal e�ect of political
competitiveness on democratic transitions. In particular, the presence of time-varying
unobserved factors correlated with the explanatory variables will lead to the typical omitted
variable bias. In the absence of a valid instrument or a structural model with valid exclusion
restrictions, there is no easy way to get around this issue. To address this concern, the
model is conditioned on some of the time-varying covariates that have been highlighted in
the literature.
23

Another di�culty arises from the global increase in political liberty and the proliferation
of democracies during the post-war period. If the econometric model does not account for
these time trends, the e�ect of competition during dictatorship will be identi�ed from the
over-time variation in the data. In this case, the estimate would correspond to the global
increase in democracy and liberalizations in nondemocracies and not to the causal e�ects
of competition. To address this problem, all the models presented include time e�ects and
region-speci�c time trends.
Therefore, the econometric model used should be interpreted as an approximation of
a transitional probability conditional on all time-constant, country-speci�c, unobserved
variables and other observed time-varying characteristics. With all the caveats discussed,
this conditional probability takes a causal interpretation.
3.2 Econometric Model
Consider a linear model with an additive unobserved e�ect of the form:
dit = pcit�1 + x0it�1� + �i + �t + rit+ "it; (21)
where dit is an indicator function taking the value of one if country i is classi�ed as an
autocracy in time t � 1 and as a democracy in time t; and a value of zero otherwise.pcit�1 is the level of political competition at time t � 1; so the coe�cient will be themain parameter of interest. The vector x0it�1 contains a set of control variables, �i is the
unobserved heterogeneity for country i, �t is a time e�ect capturing common shocks in the
likelihood of democratization, ri is a regional dummy so that rit represents a region-speci�c
time trend and "it is the idiosyncratic error.
As mentioned, the linear model (21) approximates a conditional probability of transi-
tion. Even if this speci�cation is not the best description of the conditional probability of
interest, it is a convenient approximation since we can deal with unobserved heterogeneity
in a natural way.11 This linear speci�cation will be the main model for all our samples, but
we also check the robustness of the results using some of the non-linear (fully parametric)
11A common critique to this approach is that for some values of the explanatory variables the predictedprobability will lie outside the unit interval. This can be avoided by using a non-linear speci�cation (e.g.Logit or Probit). Since many of these non-linear models cannot accommodate �xed and time e�ects, thelinear model is preferable and the
24

models suggested in the literature. Non-linear models are relevant not only because they
might provide a better approximation, but also because they have been heavily used by
previous studies. Then, we use non-linear models to check the robustness of the results
and also to draw comparisons with the existing literature.
3.3 Data
Our main measure of democratic transitions comes from the \Freedom in the World 2008
Survey " produced by Freedom House (2008). The status variable of this survey, which is
available from 1972 to 2008, is used to identify years of transition between nondemocracy
and democracy. The status of each country corresponds to the combination of various
ratings, and it indicates the general state of political rights and civil liberties in the political
system. For our purposes, we code a democratic transition when a country is labeled as
\partly free" or \not free" at time t � 1 becomes \free" during time t. To check the
robustness of the results, a second indicator was created in which a political transition is
coded only for countries going from \not free" to \free". According to the methodology of
Freedom House, movements from \not free" to \free" correspond to more drastic political
reforms compared with movements from \partly free" to \free", which should be interpreted
as minor democratic transitions.
To check the consistency and the robustness of the transition years identi�ed by Freedom
House, a second classi�cation was used: the \Democracy and Development Extended Data
Set" by Alvarez, Cheibub, Limongi, Przeworski (2002). This taxonomy is used extensively
by Przeworski et al. (2000). As opposed to the Freedom House taxonomy, this classi�ca-
tion is more minimalist in the sense that it focuses on some key requirements regarding the
level of contestation. To construct our second indicator of democratic transition, we used
the regime classi�cation variable reg which is coded 1 for dictatorship and 0 for democracy.
According to this classi�cation, a country is a dictatorship if the legislature (or the execu-
tive) is not elected, if there is no more than one party or if there is no alternation in power
(see Przeworski et al. 2000, 14-22). The original classi�cation covers the period 1950-1990
and is updated for the 1990-2002 period by Cheibub and Gandhi (2004). It is worth men-
tioning that even though the Przeworski index is based on the type of government and on
the level of contestation and the Freedom House classi�cation on political and civil liberty
25

characteristics, the timing and the number of transitions are quite similar (see Table 1).12
To measure how competitive an authoritarian regime is, we rely on both qualitative
and observable characteristics. Our main qualitative index is the Polcom variable, con-
structed by Marshall and Jaggers (2004). This variable is a seven point scale measuring
the competitiveness of elections and participation. Countries in which opposition parties
are repressed and participation is restricted receive low Polcomp scores. Countries with
institutionalized party competition in the absence of coercion are coded with high scores.
To check the robustness of our qualitative indexes, observable characteristics are used as
proxy for competitiveness. Speci�cally, we use the distribution of seats in the lower cham-
ber of the legislature. As a proxy for competitiveness, we take the percentage of seats in
parliament held by all minority parties and independents. In cases in which the legislature
composition and party information is not available, the vote share of all the small parties
is used, as in Vanhanen (2002). This data is mainly from Vanhanen (2002) and Banks
(2008). To facilitate the analysis, both measures of political competition are normalized to
lie in the zero-one interval.
Finally, in order to specify the most parsimonious model possible, only two control
variables are chosen, real GDP per capita (in 2000 Constant Prices) and total population.
These variable are taken from Alan Heston, Robert Summers, and Bettina Atten (2002).
The e�ect of income per capita is of special interest given the importance it has received
in the literature. We include total population in the model since we want to control for
changes in demographics that could have an e�ect on the over-time variation of democracy.
Table 2 summarizes the descriptive statistics of the main samples used in the estimation.
3.4 Estimation
There are several procedures to estimate (21). A common approach in the literature is to
put �i in the error term and estimate the model using pooled OLS or by random e�ects
methods.13 The validity of these approaches depends crucially on the statistical relationship
12For the period 1972-2002, Przeworski and his coauthors report a total of 72 democratic transitions. Onthe other hand, the Freedom House system reports 76 transitions during the same time span. See Table 1for details.13In addition to ignoring �i; the vast majority of works assume a fully parametric model for the composite
error �i + "it � vit and estimate (1) by maximum likelihood. Since the identi�cation of in this setupcomes mainly from the cross sectional variation, these models are analogous to pooled OLS estimation(with the caveat that a maximum likelihood model is less robust since identi�cation also depends on form
26

between �i and pcit. For the case in which �i is correlated with pcit (or with any other
element in xit), ignoring �i will lead to biased and inconsistent estimates. For this reason,
the orthogonality of �i and pcit is crucial in this context. �i can be interpreted as a random
variable containing all the unobserved, time-invariant, country characteristics that a�ect
the likelihood of transition in country i across time. If these unobserved characteristics are
important in explaining the path of political development, it is natural to think that they
are not independent of the level of competitiveness of the political system at any point in
time. Thus, the identifying assumption of a random e�ect model seems particularly strong
in this context.
To have a more exible speci�cation, we prefer to place no restriction on the correlation
between �i and pcit: Formally, we do this by applying a simple demeaning transformation.
For simplicity, suppose xit is a scalar. Subtracting a �rst averaging equation from the linear
model (21) we get the following estimating equation
~dit = p~cit�1 + �~xit�1 + ~�t + ~"it; (22)
where ~dit = dit � 1T
PTt=1 dit; p~cit�1 = pcit�1 � 1
T
PTt=1 pcit; ~xit�1 = xit�1 � 1
T
PTt=1 xit
and ~"it = "it � 1T
PTt=1 "it: In this equation, we take each observation and subtract its
country mean. Given that �i is constant across time, this procedure eliminates this kind
of unobserved e�ects so they can be arbitrarily correlated with pcit�1 (or with any other
variable included in xit�1): Then, estimation of using (22) and OLS is certainly more
robust than the estimation of (21) by pooled OLS or by random e�ects estimation (e.g.,
Generalized Least Squares). The critical identifying assumption is that conditioning on �i;
all other components of ~"it are uncorrelated with pcit�s, for all t = 1; 2; ::T and s = 1; 2; :; t:
The econometric model is estimated for the base line period 1972-2002. The base line
panel takes observations every �fth year. As a robustness test, we also construct ten-year
and twenty-year panels. The choice of having a time dimension of �ve years corresponds
to the interpretation we give to a generic period in the theoretical model. Given that we
want to capture the e�ect of competition that entails the development of some political
organizations, a time span of �ve (or even ten) years seems more appropriate than a time
span of one year. Even if a �ve-year, or a ten-year, speci�cation is preferable, as a robustness
test, we also estimate one-year panels -with the caveat that serial correlation could a�ect
of the distribution assumed).
27

the relationship of interest.14
3.5 Results
Table 3 and Table 4 present the results for the base line sample 1972-2002 ignoring the
potential heterogeneity discussed in the theoretical section. Table 3 uses the regime clas-
si�cation proposed by Freedom House and Table 4 uses the taxonomy of Przeworski and
his coauthors. The standard errors in all models are robust to arbitrary heteroskedasticity
and are clustered at the country level.
The �rst column in these tables uses the political competitiveness index from Polity
and the second the percentage of seats (votes) in parliament held by all minorities parties.
These models show that lagged competitiveness has a positive, statistically signi�cant, ef-
fect on the likelihood of democratization. This result is robust to using di�erent regime
classi�cations. The point estimate in column 1, Table 3, implies that holding everything
else constant, a one standard deviation rise in this index increases the chances of democ-
ratization in the next �ve-year period by approximately (0.2*0.37)*100�7,5 percentagepoints. Similarly, using the percentage of votes for minority parties as a proxy for compet-
itiveness gives a slightly bigger e�ect of (0.289*0.37)*100�10,7 percentage points (Column2). Given that transitions are rare events, this e�ect is also signi�cant from a quantitative
perspective. The models in columns 3 and 4 control for income per capita and population
size. The inclusion of these variables does not e�ect the magnitude or signi�cance of the
result. This implies that the e�ect of liberalization is robust to some time-varying charac-
teristics such as income and demographics. Lagged GDP per capita has a positive e�ect on
democratic transitions even though this e�ect is neither robust nor statistically signi�cant.
This is consistent with recent empirical �ndings about the relationship between income and
democracy (Acemoglu et al. 2008, 2009). Lastly, population has a negative and signi�cant
e�ect. This relationship is interesting on its own and to the best of my knowledge has not
been explored in the literature.
The remaining columns of Table 3 and Table 4 explore how the result depends on
the length of the time period taken. Columns 5 and 6 show that the result holds if we
14Another di�culty in a one-year panel comes from the possibility of a long transition such that theincrease in competitiveness is coming from the transition itself. This possibility, the serial correlationissues, and the theoretical motivation, tilt the balance in favor of the 5-year and 10-year panels.
28

take annual observations instead of 5-year observations. The marginal e�ect of lagged
competition in these models is naturally smaller since a transition in this speci�cation is
even more rare than in a 5-year panel. Also, the estimates are more precise since the
number of observations are in ated by using a higher frequency in the data. To address
concerns of serial correlation this annual model is also estimated using �ve lags of all the
explanatory variables. Column 7 reports the p-value of an F-test of joint signi�cance of
these variables. The �ve year lags of the competitiveness index are signi�cant at standard
levels only for the Freedom House classi�cation (the same is true for the vote share measure,
but the result is not reported). Finally, columns 8 and 9 explore the result using a lower
frequency in the data. The result for the 10-year panel are similar and consistent to the
ones obtained using the 5-year panel speci�cation.
Table 5 and Table 6 explore the results using di�erent time periods and di�erent samples.
In Table 5, following a collection of empirical works in the literature, I explore the result
taking a sample of nondemocracies for the entire post-war period (see e.g., the in uential
work of Przeworski et al. 2000). Lagged competitiveness is highly signi�cant for this period
and the e�ect is robust to the inclusion of income per capita and (log) population. Given
that the time period is longer, in the sample I also estimated a panel taking observations
every 20 years (see columns 7 and 8). In this panel, almost 50 percent of the variation
in the transition function is explained just by lagged competitiveness and by country and
time e�ects. The point estimate suggests that a rise of one standard deviation in the
competitiveness measure increase the probability of a democratic transition in the next 20-
year period by (0.692*0.37)*100�25.7 percentage points. Lastly, Table 6 studies how theestimate varies across regions. In this sensitivity analysis, the e�ect is particularly strong
for Latin America and consistent with the overall �ndings.
3.6 Competitiveness and Repression
According to the theoretical model advanced in Section 2, the e�ect of institutions pro-
moting electoral competition is heterogenous and depends crucially on how costly it is for
a dictatorship to repress a mobilized opposition. For cases in which the costs associated
with repression are too low (or too high) the e�ect should be smaller compared to cases in
which these costs are \intermediate". In this subsection I propose a proxy measuring the
costs of repression and test this proposition.
29
It is particularly di�cult to �nd good proxies for the costs associated with repression
during dictatorship. We could use some country-speci�c characteristics that could be cor-
related with these costs. For example, the cost of employing violence against a popular
opposition may be bigger in a wealthy society relative to a less developed one.15 This
approach is somewhat challenging since income, in this case, is potentially correlated with
many other factors that could in uence the decision of an authoritarian government to
repress its opposition. Arguably a better proxy is the observed level of state repression.
The idea is that countries in which repression is widely used are countries associated with
low costs of repression. Similarly, regimes with no record of state violence against civilians
are assumed to be cases in which the costs of such strategy are very high. Thus, we use
the state repression scale developed by Gibney and Dalton (1996). This measure is appro-
priate for the analysis since it focuses on state (or its organizations) behavior and excludes
societal and other types of violence. The scale goes from 1 to 5 and measures the magni-
tude of violations carried out by any state, and it includes torture, extrajudicial killings,
physical abuses, disappearances, and political imprisonments. The data for this measure
comes from annual reports of the U.S. Department of State and Amnesty International.
To approach the idea that the costs of repression conditions the e�ect of competition
assume a decreasing monotone relationship between the cost of repression and the observed
levels of repression. This means that countries with high levels of observed repression are
associated with low repression costs. Similarly, dictatorships in which repression never
takes place, are assumed to be cases in which the costs of such a strategy are high. Thus, I
categorize each country according to the state repression scale of Wood and Gibney (2008).
For each country, the average score received between 1980 and 2007 is calculated. Then,
countries with an average score between the 10th and the 90th centile of the world average
are classi�ed as \medium repression". Similarly, countries with an average score below the
10th centile and above the 90th are classi�ed as low and high repression respectively.16
Table 7 presents the results exploring the relationship between the competitiveness and
repression. Column 1 replicates the results of the model using the political competitiveness
index, column 2 estimates the same model restricting the sample to countries classi�ed as
15This theory is advanced by Acemoglu and Robinson (2001) and Br�uckner and Ciccone (2008).16The results taking the 20th and the 80th percentile, instead of 10th and 90th percentile, are pretty
similar.
30

\medium repression". The results are consistent with the theory, in countries with medium
levels of repression (assumed to be associated with medium repression costs), the marginal
e�ect of competition is higher relative to the complete sample. A similar result is found
using the composition of legislature measure and by taking 10-year observations instead of
5-year. To the extent that there could be other relationship between observed repression
and the costs of such activity, these results are tentative evidence of a heterogenous e�ect
of competition in dictatorship conditioned by the costs of repression.
4 Conclusion
In this paper I developed a simple dynamic model to study the e�ects of political liberal-
izations under dictatorship. The model emphasizes the role of sunk costs and irreversible
investments as important factors explaining di�erent propensities for democratization. The
theory explains how a reform during dictatorship may alter the incentives to tolerate democ-
racy in the future. The comparative statics of the model and the econometric evidence
suggest that when elections during dictatorship are more competitive, liberalizations are
more likely to a�ect the decision to democratize.
5 Appendix
PROOF LEMMA 1
Using the distribution of �, the probability of victory for A in any period of a competitive
authoritarian regime is
�C(qA; qB) =1
2�
�W (qA; qB);
where
W (qA; qB) �1
2� (�E+ )[1
2+�(uE(qA)�uE(qB))]� (�P � )[(1��)+�(uP (qA)�uP (qB))]
(23)
Now, the electoral problem for A in any period in which there is a competitive authoritarian
state is
maxq2Q
n�C(q; �B(:))R + �[(1� p)V A(C lj�Cl ; �D) + pV A(Ch)]
o: (24)
31

Similarly, B0s problem is
maxq2Q
n[1� �C(�A(:); q)]R + �[(1� p)V B(C lj�Cl ; �D) + pV B(Ch)]
o(25)
An electoral equilibrium in this state is a policy combination (q�A; q�B) that solves (24)
and (25) simultaneously. Taking future plays as given, the problem for A reduces to the
maximization of �C(:):Given that each uj for j = P;E is di�erentiable, the �rst order
conditions for A (in the interior solution case) are
(�E + )ruE(q�A) + (�P � )ruP (q�A) = 0;
where ruj is the gradient function de�ned in Lemma 1. By the same logic, the problemfor B reduces to the maximization of 1� �C(:): Thus, �rst order conditions for B, in thecase in which the solution is interior, are given by
(�E + )ruE(q�B) + (�P � )ruP (q�B) = 0
As we see, the �rst order conditions for A and B are exactly the same. Given the strict
concavity of each uj; we have that the solution is unique so q�A = q�B � q�C : Then, any MPE
involves �A(Cl) = �B(C
l) � q�C : Lastly, replacing these policies in �C(:) we get that the
equilibrium probability for A in a competitive authoritarian regime is
�C(q�C ; q�C) =
1
2+
�
��E1
2+ �P (1� �) + (�� 1
2)� 1
2
�:
Since � > 12, �C(q�C ; q
�C) is strictly increasing in . Then, in any period in which A controls
a competitive authoritarian regime any MPE involves = � : Replacing this in the �rst
order condition for q�C we get the characterization presented in Lemma 1.
PROOF LEMMA 2
This proof follows the same logic as the Lemma 1's proof. In a democracy, the proba-
bility of victory for A is given by
�D(qA; qB) =1
2�
�Y (qA; qB);
where
Y (qA; qB) �1
2� �E[
1
2+ �(uE(qA)� uE(qB))]� �P [(1� �) + �(uP (qA)� uP (qB))]:
32

The problem for A in any period of democracy is
maxq2Q
�D(q; �B(D))R
1� �: (26)
Similarly, the problem for B is
maxq2Q
�1� �D(�A(D); q)
�R
1� �: (27)
An electoral equilibrium in a democracy is a policy combination (q�A; q�B) that solves (26) and
(27) simultaneously. By the logic used in the previous proof, the MPE equilibrium is unique
and involves policy convergence. Denote q�D the policy to which both parties converge. The
�rst order condition for the interior solution case satis�es
�EruE(q�D) + �PruP (q�D) = 0:
Hence, in any MPE �D = (�A(D); �B(D)) = (q�D; q
�D): This completes the proof.
References
[1] Acemoglu, Daron, and James A. Robinson. 2000. \Why Did the West Extend the
Franchise? Democracy, Inequality and Growth in Historical Perspective." Quarterly
Journal of Economics, 115(4): 1167-1199.
[2] Acemoglu, Daron, and James A. Robinson. 2001. \A Theory of Political Transitions."
American Economic Review, 91(4): 938{963.
[3] Acemoglu, Daron, and James A. Robinson. 2006. Economic Origins of Dictatorship
and Democracy. Cambridge, MA: Cambridge University Press.
[4] Acemoglu, Daron, Simon Johnson, James A. Robinson, and Pierre Yared. 2007.
\Reevaluating the Modernization Hypothesis." Unpublished.
[5] Acemoglu, Daron, Simon Johnson, James A. Robinson, and Pierre Yared. 2008. \In-
come and Democracy." American Economic Review, 98:3: 808{842.
[6] Banks, Arthur S. 2008. \Cross-National Time-Series Data Archive User's Manual."
Unpublished Manuscript.
33
[7] Boix, Carles, and Milan Svolik. 2008. \The Foundations of Limited Authoritarian Gov-
ernment: Institutions and Power-Sharing in Dictatorships." Unpublished manuscript,
Princeton University.
[8] Bratton, Michael, and Nicholas van de Walle. 1997. Democratic Experiments in Africa:
Regime Transitions in Comparative Perspective; New York: Cambridge University
Press.
[9] Brownlee, Jason. 2009. \Portents of Pluralism: How Hybrid Regimes A�ect Demo-
cratic Transitions." American Journal of Political Science, Vol. 53 (3): 515{532
[10] Br�uckner, Markus and Antonio Ciccone. 2008. \Rain and The Democratic Window of
Opportunity." Unpublished paper, Department of Economics, Pompeu Fabra.
[11] Carothers, Thomas. 2002 . \The End of the Transition Paradigm." Journal of Democ-
racy, 13(1): 5-21.
[12] Chacon, Mario. 2009. \Competitive Authoritarianism and Democratic Transition:
Theory and Evidence from the Third Wave." Ph.D. Dissertation, Yale University.
[13] Cheibub, J. A. and J. Gandhi. 2004. \Classifying political regimes: a six-fold measure
of democracies and dictatorships." Manuscript, American Political Science Association
Annual Meeting, Chicago.
[14] Dahl, Robert A. 1971. Polyarchy: Participation and Opposition. New Haven, CT: Yale
University Press.
[15] Diamond, Larry. 2002. \Thinking About Hybrid Regimes." Journal of Democracy,
13(2): 21-35.
[16] Dixit, Avinash and John Londregan. 1995. "Redistributive Politics and Economic Ef-
�ciency." American Political Science Review, 89 (4): 856-866.
[17] Dixit, Avinash and John Londregan. 1996. "The Determinants of Success of Special
Interests in Redistributive Politics." Journal of Politics, 58 (4): 1132-1155.
34
[18] Engerman, Stanley L., and Kenneth L. Sokolo�. 1997. \Factor Endowments, Institu-
tions, and Di�erential Paths of Growth among New World Economies," in Stephen
Haber, ed., How Latin America Fell Behind. Stanford, CA: Stanford University Press.
[19] Engerman, Stanley L., Elisa Mariscal and Kenneth L. Sokolo�. 1998. \Schooling, Suf-
frage, and the Persistence of Inequality in the Americas, 1800{1945." Unpublished
paper, Department of Economics, UCLA.
[20] Freedom House. 2008. Freedom in the World: Political Rights and Civil Liberties 2008.
New York: Freedom House.
[21] Fudenberg, Drew, and Jean Tirole. 1994. Game Theory. Cambridge, MA: MIT Uni-
versity Press.
[22] Gandhi, Jennifer and Adam Przeworski. 2006. \Cooperation, Cooptation and Rebel-
lion Under Dictatorships." Economics and Politics, 18(1):1-25.
[23] Gandhi, Jennifer. 2008. Political Institutions under Dictatorship. New York, NY: Cam-
bridge University Press.
[24] Geddes, Barbara. 1999. \What Do We Know About Democratization After Twenty
Years?" Annual Review of Political Science, 2, 115-44.
[25] Gibney, Mark and Matthew Dalton. 1996. "The Political Terror Scale." in David Louis
Cingranelli (ed.) Human Rights and Developing Countries. Greenwich, CT: JAI Press.
[26] Hadenious, Axel and Jan Teorell. 2007. \Pathways from Authoritarianism." Journal
of Democracy, 18(1): 143-156.
[27] Heston, Alan, Robert Summers, and Bettina Aten. 2002. Penn World Tables Version
6.1. Philadelphia: Center for International Comparisons at the University of Pennsyl-
vania.
[28] Hermet, Guy, Richard Rose and Alain Rouqui�e (eds). 1978. Elections without choice.
New York : Wiley.
35

[29] Howard, Marc Morje, and Philip G. Roessler. 2006. \Liberalizing Electoral Outcomes
in Competitive Authoritarian Regimes." American Journal of Political Science, 50(2):
365{81.
[30] Huntington, Samuel P. 1968. Political Order in Changing Societies; New Haven: Yale
University Press.
[31] Huntington, Samuel P. 1991. The Third Wave: Democratization in the Late Twentieth
Century; Normal OK: University of Oklahoma Press.
[32] Keefer, Philip. 2007. \Database of Political Institutions: Changes and Variable De�n-
itions." Manuscript, The World Bank. Washington, DC.
[33] Levitsky, Way and Lucan A. Way. 2002. \The Rise of Competitive Authoritarianism."
Journal of Democracy, 13 (2): 51-65.
[34] Lindbeck, Assar and J�orgen Weibull. 1987. \Balanced-Budget Redistribution as the
Outcome of Political Competition." Public Choice, LII: 272-297.
[35] Lindberg, Sta�an. 2006. Democracy and Elections in Africa. Baltimore, Johns Hopkins
University Press.
[36] Linz, Juan. 1973. \Opposition to and under an authoritarian regime: The case of
Spain." In Robert Dahl (Ed.), Regimes and oppositions. New Haven, CT: Yale Uni-
versity Press.
[37] Linz, Juan J., and Alfred Stepan. 1996. Problems of Democratic Transitions and Con-
solidation: Southern Europe, South America, and Post-Communist Europe. Baltimore:
Johns Hopkins University Press.
[38] Marshall, Monty G. and Keith Jaggers. 2004. "Political Regime Characteristics and
Transitions, 1800-2002." Polity IV Project, University of Maryland.
[39] Magaloni, Beatriz. 2006. Voting for Autocracy:Hegemonic Party Survival and Its
Demise in Mexico. New York: Cambridge University Press.
[40] Magaloni, Beatriz. 2009. \
36

[41] O'Donnell, Guillermo. 1973. Modernization and bureaucratic-authoritarianism: Stud-
ies in South American politics. Berkeley, CA: Institute of International Studies.
[42] Ottaway, Marina. 2003. Democracy Challenged: The rise of Semi-Authoritarianism.
Washington, DC: Carnegie Endowment for International Peace.
[43] Page, Scott. 2006. \Path Dependence." Quarterly Journal of Political Science, 1: 87-
115.
[44] Persson, Torsten and Tabellini, Guido. 2000. Political economics: Explaining economic
policy, Zeuthen Lecture Book Series. Cambridge and London: MIT Press.
[45] Przeworski, A., M. Alvarez, J. A. Cheibub, and F. Limongi. 2000. Democracy and De-
velopment: Political Institutions and Well-Being in the World, 1950{1990, Cambridge
University Press, New York.
[46] Rustow, Dankwart A. 1970. \Transitions to Democracy: Toward a Dynamic Model."
Comparative Politics, 2(3): 337-363.
[47] Schedler, Andreas. 2002. \The Menu of Manipulation." Journal of Democracy, 13(2):
36-50.
[48] Schedler, Andreas, ed. 2006a. Electoral Authoritarianism: The Dynamics of Unfree
Competition. Boulder: Lynne Rienner.
[49] Schedler, Andreas. 2006b. \The Logic of Electoral Authoritarianism." In Andreas
Schedler, ed. Electoral Authoritarianism: The Dynamics of Unfree Competition. Boul-
der: Lynne Rienner.
[50] Stepan, Alfred. 1986. \Paths Toward Redemocratization: Theoretical and Compara-
tive Considerations," in Guillermo O'Donnell, P. Schmitter and L. Whitehead (eds.).
Transitions from Authoritarian Rule: Comparative Perspectives; Baltimore: Johns
Hopkins University Press.
[51] Vanhanen, Tatu. 2002. \Measures of Democratization 1999-2000." Unpublished Man-
uscript.
37

Figure 1.
Transition in a High State
Figure 2.
Transition in a Low Threat Dictatorship
𝐷
𝐷
𝑠ℎ 𝑠ℎ
𝑠𝑙
𝑠𝑙
t t+1
𝑀ℎ
𝑀𝑙 𝑀𝑙
𝑀𝑙 𝐶ℎ
𝐶𝑙
𝐶𝑙
t t+1
𝜔 = 0
𝜔 = 1
𝑝
1− 𝑝
𝑐 = 0
𝑐 = 1
𝑝
1− 𝑝
𝑝
1− 𝑝

Table 1
Democratic Transitions 1972-2000
Period Freedom House Przeworski et al. (2000)
1973-1980 Argentina (73), Botswana (73), Dominican Rep (78), Ecuador (79), Ghana
(80) Greece (74) Grenada (77), India (77), Maldives I. (74), Nigeria (79),
Papua NG (76), Peru (80), Portugal (76), Spain (77), Sri Lanka (76),
Thailand (75), Turkey (74), Burkina F (78).
Argentina (73), Bolivia (79), Brazil (79), Ecuador (79), Ghana (79), Greece
(74), Nigeria (79), Peru (80), Portugal (76), Spain (77), Thailand (75),
Uganda (80)
1981-1985 Argentina (84), Brazil (85), Grenada (85), Honduras (84), Uruguay (85) Argentina (83), Bolivia (82), Cyprus (83), El Salvador (84) Grenada (84),
Honduras (82), Nicaragua (84), Thailand (83), Turkey (83), Uruguay (85)
1986-1990 Chile (90), Czechoslovakia (90) Gambia (89), Hungary (90), Korea Rep.
(88), Malta (87), Namibia (90), Philippines (87), Poland (90), Suriname
(88), Thailand (89), Vanuatu (89), W. Samoa (89)
Bulgaria (90), Chile (90), Comoro I (90), Czechoslovakia (90), Guatemala
(86), Hungary (90), Korea rep. (88), Panama (89), Philippines (86), Poland
(89), Romania (90), Sri Lanka (89), Sudan (86), Suriname (88)
1991-1995 Bangladesh (91), Benin (91), Bulgaria (91), C Verde I (91), Estonia (93),
Guyana (93), Latvia (94), Malawi (94), Mali (92), Mali (95), Mongolia
(91), Nepal (91), Panama (94), Sao T/P (91), Slovak Rep. (94), S. Africa
(94), Zambia (91)
Albania (92), Bangladesh (91), Benin (91), Burundi (93), C. Verde I (91),
Central Af. Rep. (93), Congo (92), Ghana (93), Guyana (92), Haiti (94),
Lesotho (93), Madagascar (93), Malawi (94), Mali (92), Mongolia (92),
Nepal (91), Niger (93), Sao T/P (91), S. Africa (94), Suriname (91),
Thailand (92), Zambia (91)
1996-2000 Bolivia (96), Croatia (00), Dominican rep (98), Ecuador (98), el Salvador
(97), Fiji (99), Ghana (00), Honduras (97), India (98), Mexico (00), Papua
NG (98), Philippines (96), Romania (96), Slovak Rep.(98), Suriname (00),
Taiwan (96), Thailand (98), Venezuela (96)
Cote d’I (00), Guinea-B (00), Indonesia (99), Kenya (98), Mexico (00),
Moldova (96), Niger (00), Nigeria (99), Senegal (00), Sierra L. (96), Sierra
L. (98), Taiwan (96)
Notes: Using the Freedom House taxonomy, a country experiences a democratic transition in years in which the country is classified as “free” in that year conditional on being
classified as “not free” or as “partially free” in the previous year. Similarly, for the Przeworski index, the country reports a democratization for year in which the country is
classified as a democracy in that year conditional on being classified as a dictatorship in the previous year. The exact year in which the transition takes place is reported in
parenthesis.

Table 2
Descriptive Statistics
Transitions Transitions
Freedom House PACL (2000)
(1) (2)
Period 1972-2002
Democratic Transition Indicator 0.09 0.09
(0.28) (0.28)
Countries 158 146
Observations 649 682
Panel A
Democratic Transition Indicator 0.09 0.10
(0.28) (0.31)
Political Competitiveness Indext-1 0.18 0.14
(0.28) (0.25)
Countries 134 124
Observations 565 525
Panel B
Democratic Transition Indicator 0.09 0.11
(0.29) (0.31)
Percentage votes (seats) for 0.12 0.09
minorities partiest-1 (0.19) (0.16)
Countries 148 131
Observations 636 575
Panel C
Ln GDP per capitat-1 7.86 7.83
(1.03) (1.05)
Ln populationt-1 15.60 15.45
(1.78) (1.74)
Countries 135 118
Observations 570 515
Notes: The numbers reported are averages during sample period. Standard errors are reported in parenthesis.
The first row report the values for the entire 1972-2002 period. The first column of Panel A refers to the
sample used in column 1 of Table 3. Similarly, the second column of this panel refers to the sample of column
1 Table 5. The first column of Panel B refers to the sample used in Table 3, column 2 and the second to the
sample of Table 5, column 2. Panel C, column 1 refers to the sample of Table 3, column 4. Panel C, column 2
refers to the sample used in Table 5, column 4. The observations refer to the total number of observations and
the countries to the total number of countries used in each panel. The democratic transition indicator takes a
vale one if a country is classified as a democracy conditional on being classified as an autocracy in the
previous period. In column 1 the classification of regimes is taken from Freedom House (2008) and in column
2 from Przeworski et al. (2000). Real GDP per capita (in 2000 Constant Prices) and total population are taken
from Heston, Summers, and Atten (2002).

Table 3
Transitions to Democracy Freedom House
Fixed effects OLS, sample 1972-2002
Five-year data Annual data Ten-year data
(1) (2) (3) (4) (5) (6) (7) (8) (9)
Political Competitiveness 0.203 0.201 0.094 [0.02] 0.329
Indext-1 (0.075) (0.078) (0.025) (0.127)
% votes (seats) for minority 0.289 0.255 0.135 0.449
partiest-1 (0.112) (0.111) (0.042) (0.195)
Ln GDP per capitat-1 0.069 0.048 0.003 -0.006 [0.56] 0.076 0.062
(0.035) (0.034) (0.008) (0.010) (0.067) (0.058)
Ln populationt-1 -0.264 -0.315 -0.029 -0.092 [0.45] -0.421 -0.486
(0.107) (0.111) (0.026) (0.034) (0.161) (0.170)
Observations 565 636 504 570 2336 2702 2083 244 279
No. Countries 134 148 122 135 135 142 122 108 122
R -squared (within) 0.085 0.101 0.103 0.116 0.034 0.033 0.044 0.234 0.227
Notes: the standard errors reported in parenthesis are robust to arbitrary heteroskedasticity and are clustered at the country level. All models include
year effects. Dependent variable in all models is a transition function taking the value of 1 if a country is classified as “free” in time t conditional on
being classified as “not free” or as “partially free” in period t-1. This classification is taken from Freedom House (2008). Sample in 1-4 is an
unbalanced panel with observations taken every 5 years, sample in 5-7 is an unbalanced panel with annual observations and sample in 8-9 is an
unbalanced panel with data is taken every 10 years. In column 7 the p-value from an F-test of joint significance of all 5 lags is reported in brackets.

Table 4
Transitions to Democracy Przeworski et al. (2000)
Fixed effects OLS, sample 1972-2002
Five-year data Annual data Ten-year data
(1) (2) (3) (4) (5) (6) (7) (8) (9)
Political Competitiveness 0.248 0.259 0.073 [0.31] 0.454
Indext-1 (0.096) (0.098) (0.034) (0.172)
% votes (seats) for minority 0.358 0.37 0.109 0.559
partiest-1 (0.145) (0.149) (0.057) (0.306)
Ln GDP per capitat-1 0.054 0.015 -0.001 -0.006 [0.50] -0.019 0.004
(0.048) (0.044) (0.011) (0.012) (0.099) (0.074)
Ln populationt-1 -0.306 -0.284 -0.071 -0.101 [0.14] -0.486 -0.347
(0.109) (0.101) (0.029) (0.034) (0.185) (0.142)
Observations 525 575 464 515 2242 2517 2008 232 259
No. Countries 124 131 110 118 113 122 109 102 111
R -squared (within) 0.144 0.144 0.145 0.145 0.047 0.046 0.054 0.292 0.241
Notes: the standard errors reported in parenthesis are robust to arbitrary heteroskedasticity and are clustered at the country level. All models include
year effects. Dependent variable in all models is a transition function taking the value of 1 if a country is classified as a democracy at time t conditional
on being classified as a dictatorship in period t-1. This classification is taken from Preworski et al. (2000). Sample in 1-4 is an unbalanced panel with
observations taken every 5 years, sample in 5-7 is an unbalanced panel with annual observations and sample in 8-9 is an unbalanced panel with data is
taken every 10 years. In column 7 the p-value from an F-test of joint significance of all 5 lags is reported in brackets.

Table 5
Transitions to Democracy Post-war Sample
Fixed effects OLS, sample 1946-2002
Five-year data Annual data Ten-year data Twenty-year data
(1) (2) (3) (4) (5) (6) (7) (8)
Political Competitiveness 0.168 0.174 0.055 0.055 0.29 0.291 0.692 0.541
Indext-1 (0.070) (0.075) (0.021) (0.024) (0.120) (0.129) (0.226) (0.245)
Ln GDP per capitat-1 0.054 0.003 -0.004 0.022
(0.043) (0.012) (0.079) (0.194)
Ln populationt-1 -0.305 -0.044 -0.515 -0.618
(0.105) (0.021) (0.183) (0.610)
Observations 797 606 4046 3100 368 293 157 125
No. Countries 128 129 129 117 124 105 105 91
R -squared (within) 0.119 0.134 0.037 0.042 0.261 0.281 0.496 0.506
Notes: the standard errors reported in parenthesis are robust to arbitrary heteroskedasticity and are clustered at the country level. All models
include year effects. Dependent variable in models (1)-(8) is a transition function taking the value of 1 if a country is classified as a democracy at
time t conditional on being classified as a dictatorship in period t-1. This classification is taken from Preworski et al. (2000). Sample in 3-4 is an
unbalanced panel with annual observations. Samples in 1-2, 5-6 and 7-8 are unbalanced panels with observations taken every 5, 10 and 20 years
respectively.

Table 6
Robustness Checks and Sensitivity Analysis
Fixed effects OLS, five-year data
Sample 1972-2002,
without without without
all Sub-Saharan Latin ex-soviet
countries Africa America countries Sample 1972-2008 Sample 1800-2002
(1) (2) (3) (4) (5) (6) (7) (8)
Political Competitiveness 0.203 0.244 0.139 0.214 0.185 0.115
Indext-1 (0.075) (0.115) (0.079) (0.077) (0.067) (0.037)
% votes (seats) for minority 0.19 0.132
partiest-1 (0.097) (0.056)
Ln GDP per capitat-1 0.054 0.031
(0.031) (0.028)
Ln populationt-1 -0.094 -0.186
(0.074) (0.086)
Region-specific time [0.00] [0.01] [0.00] [0.00]
effects F test
Observations 565 353 490 497 587 666 1931 1770
No. Countries 134 92 114 108 123 137 156 149
R -squared (within) 0.085 0.103 0.082 0.072 0.133 0.124 0.167 0.168
Notes: the standard errors reported in parenthesis are robust to arbitrary heteroskedasticity and are clustered at the country level. All models include year effects.
Dependent variable in models (1)-(6) is a is a transition function taking the value of 1 if a country is classified as “free” in time t conditional on being classified as
“not free” or as “partially free” in period t-1. This classification is taken from Freedom House. Dependent variable in models (7) and (8) is an indicator function
taking the value of one if a country is classified as a liberal democracy in time t conditional on being classified as a dictatorship in t-1. This regime classification is
taken from Boix and Rosato (2006). All samples are unbalanced panels with observations taken every five years. The p-value from an F test of joint significance
for all the regional-specific time trends is reported in brackets. The regions used to construct these trends are Latin America, Sub-Saharan Africa, North Africa and
Middle East and East Asia.
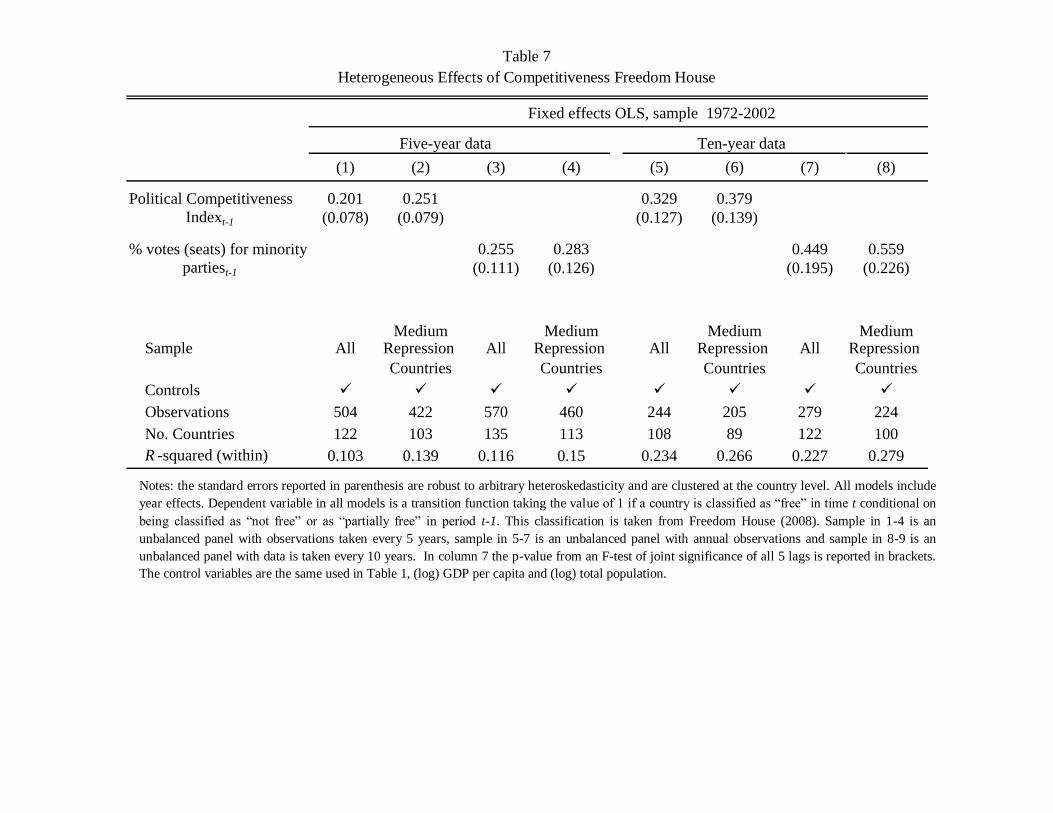
Table 7
Heterogeneous Effects of Competitiveness Freedom House
Fixed effects OLS, sample 1972-2002
Five-year data Ten-year data
(1) (2) (3) (4) (5) (6) (7) (8)
Political Competitiveness 0.201 0.251 0.329 0.379
Indext-1 (0.078) (0.079) (0.127) (0.139)
% votes (seats) for minority 0.255 0.283 0.449 0.559
partiest-1 (0.111) (0.126) (0.195) (0.226)
Medium Medium Medium Medium Sample All Repression All Repression All Repression All Repression
Countries Countries Countries Countries
Controls
Observations 504 422 570 460 244 205 279 224
No. Countries 122 103 135 113 108 89 122 100
R -squared (within) 0.103 0.139 0.116 0.15 0.234 0.266 0.227 0.279
Notes: the standard errors reported in parenthesis are robust to arbitrary heteroskedasticity and are clustered at the country level. All models include
year effects. Dependent variable in all models is a transition function taking the value of 1 if a country is classified as “free” in time t conditional on
being classified as “not free” or as “partially free” in period t-1. This classification is taken from Freedom House (2008). Sample in 1-4 is an
unbalanced panel with observations taken every 5 years, sample in 5-7 is an unbalanced panel with annual observations and sample in 8-9 is an
unbalanced panel with data is taken every 10 years. In column 7 the p-value from an F-test of joint significance of all 5 lags is reported in brackets.
The control variables are the same used in Table 1, (log) GDP per capita and (log) total population.