Embed Size (px)
Citation preview

THE FEASIBILITY OF NATURAL GAS AS A FUEL SOURCE FOR MODERN
LAND-BASED DRILLING RIGS
A Thesis
by
ANDREW HOWARD NUNN
Submitted to the Office of Graduate Studies of Texas A&M University
in partial fulfillment of the requirements for the degree of
MASTER OF SCIENCE
December 2011
Major Subject: Petroleum Engineering

THE FEASIBILITY OF NATURAL GAS AS A FUEL SOURCE FOR MODERN
LAND-BASED DRILLING RIGS
A Thesis
by
ANDREW HOWARD NUNN
Submitted to the Office of Graduate Studies of Texas A&M University
in partial fulfillment of the requirements for the degree of
MASTER OF SCIENCE
Approved by:
Chair of Committee, F.E. Beck Committee Members, Jerome Schubert Zenon Medina Cetina Head of Department, Steve Holditch
December 2011
Major Subject: Petroleum Engineering

iii
ABSTRACT
The Feasibility of Natural Gas as a Fuel Source for Modern Land-Based Drilling Rigs.
(December 2011)
Andrew Howard Nunn, B.S., Oregon Institute of Technology
Chair of Advisory Committee: Dr. Gene Beck
The purpose of this study is to determine the feasibility of replacing diesel with
natural gas as a fuel source for modern drilling rigs. More specifically, this thesis (1)
establishes a control baseline by examining operational characteristics (response, fuel
usage, and cost) of an existing diesel-powered land rig during the drilling of a well in the
Haynesville Shale; (2) estimates operational characteristics of a natural gas engine under
identical conditions; and (3) draws a comparison between diesel and natural gas engines,
determining the advantages and disadvantages of those fuel sources in drilling
applications. Results suggest that diesel engines respond to transient loads very
effectively because of their inherently higher torque, especially when compared with
natural gas engines of a similar power rating. Regarding fuel consumption, the engines
running on diesel for this study were more efficient than on natural gas. On a per-Btu
basis, the natural gas engines consumed nearly twice as much energy in drilling the same
well. However, because of the low price of natural gas, the total cost of fuel to drill the
well was lowered by approximately 54%, or 37,000 USD. Based on the results, it is
possible to infer that the use of natural gas engines in drilling environments is feasible,

iv
and in most cases, an economical and environmental advantage. First, when compared
with diesel, natural gas is a cleaner fuel with less negative impact on the environment.
Second, fuel cost can be reduced by approximately half with a natural gas engine. On the
other hand, natural gas as a fuel becomes less practical because of challenges associated
with transporting and storing a gas. In fact, this difficulty is the main obstacle for the use
of natural gas in drilling environments. In conclusion, because of its minimal drawback
on operations, it is recommended that in situations where natural gas is readily available
near current market prices, natural gas engines should be utilized because of the cost
savings and reduced environmental impact. In all other cases, particularly where
transport and storage costs encroach on the cost benefit, it may still be advantageous to
continue powering rigs with diesel because of its ease of use.

v
DEDICATION
To my friend Priscila, for her persistence, help, guidance, and patience

vi
ACKNOWLEDGMENTS
This thesis would not have been possible without the help of my committee
members and the faculty of the Texas A&M Department of Petroleum Engineering. I
would like to whole heartedly thank them for their help and guidance.
vii
TABLE OF CONTENTS
Page
ABSTRACT ................................................................................................................ iii
DEDICATION ............................................................................................................ v
ACKNOWLEDGMENTS........................................................................................... vi
TABLE OF CONTENTS ............................................................................................ vii
LIST OF FIGURES..................................................................................................... ix
LIST OF TABLES ...................................................................................................... x
CHAPTER
I INTRODUCTION.................................................................................. 1
II OVERVIEW .......................................................................................... 4
Drilling Rigs..................................................................................... 4 Engine Types.................................................................................... 8 Performance Characteristics............................................................. 11 Common Applications...................................................................... 13 Regulation ........................................................................................ 15
III DIESEL ENGINES ................................................................................ 28
Methodology .................................................................................... 30 Transient Response .......................................................................... 36 Discussion ........................................................................................ 42
IV NATURAL GAS SOLUTIONS............................................................. 44
Emissions from Natural Gas Engines............................................... 45 Products of Combustion ................................................................... 46 Engine Types.................................................................................... 48 Natural Gas Engine Solutions .......................................................... 51 Natural Gas Sources, Transport, and Storage .................................. 57 Methodology .................................................................................... 62 Discussion ........................................................................................ 64
viii
CHAPTER Page
V COMPARISON AND CONCLUSION ................................................. 65
Methodology of the Comparison...................................................... 65 Operational Constraints and Benefits............................................... 65 Engine Efficiency............................................................................. 69 Fuel Usage........................................................................................ 73 Economic Analysis........................................................................... 74 Discussion ........................................................................................ 80 REFERENCES............................................................................................................ 81
VITA ........................................................................................................................... 84

ix
LIST OF FIGURES
FIGURE Page
1 View of a Land-Based Drilling Rig ........................................................... 5 2 Dip and Overshoot Due to Transient Loads (Caterpillar 2006a) ............... 12 3 Hours Versus Load for Gensets in Island and Tandem Mode ................... 33 4 Hours Versus Load for Gensets ................................................................. 34 5 Fuel Usage Versus Load for Diesel Gensets in Island and
Tandem Mode. ........................................................................................... 35
6 Diesel Engine Efficiency............................................................................ 36 7 Drilling Operations..................................................................................... 37
8 Drilling Load Profile .................................................................................. 38 9 Circulating Load Profile............................................................................. 39 10 Tripping Load Profile................................................................................. 41
11 Back-Reaming Load Profile....................................................................... 42 12 NG Engine Emission Production ............................................................... 49
13 Field Gas Processing Unit (Hill et al. 2011) .............................................. 60 14 Fuel Usage Versus Load for an NG Engine............................................... 63 15 NG Engine Efficiency ................................................................................ 64 16 Diesel Engine Efficiency in Btu................................................................. 70 17 NG Engine Efficiency in Btu ..................................................................... 71
18 Diesel and NG Engine Efficiency in Btu Versus ekW............................... 72 19 Bi-Fuel NG Versus Diesel Fuel Mix.......................................................... 78

x
LIST OF TABLES
TABLE Page 1 CFR Numbering System ............................................................................ 17 2 Nonroad CI RICE Tiers 1 to 3 Emission Standards (g/kW-hr).................. 19 3 Nonroad CI RICE Tier 4 Interim Emission Standards (g/kW-hr).............. 20 4 Nonroad CI RICE Tier 4 Exhaust Emission Standards (g/kW-hr) ............ 21 5 Manufacturers Flexibility Program General Availability of Allowances .. 22 6 Nonroad SI ICE Tier 1 Emission Standards (g/kW-hr) ............................. 23 7 Nonroad SI ICE Tier 2 Emission Standards (g/kW-hr) ............................. 24 8 Stationary SI ICE Emissions Standards ..................................................... 27 9 Economic Comparison ............................................................................... 75

1
CHAPTER I
INTRODUCTION
A natural gas (NG) engine is a mechanical machine that consumes NG as a fuel
source and converts it into mechanical work. Most are spark-ignited (SI) reciprocating
internal combustion engines (RICEs); however, gas-fired turbines are another common
device that can also fall under the above definition. They can vary in output from a
fraction of an hp to many thousands.
NG engines, both RICEs and turbine engines, are commonplace throughout both
the upstream and downstream oil and gas industry; however, they are typically installed
and operated in specific applications. This is primarily because of how well the engine’s
physical and performance characteristics match with the application, but the fuel source
may also become a factor during specification (Caterpillar 2006a).
Historically, the use of NG as a fuel source to power prime movers in land
drilling rigs has not been common. The vast majority of drilling rigs worldwide have
their power supplied by diesel engines (Hill et al. 2011). While NG applications can and
have been implemented, the operational characteristics of an NG engine are not ideal for
the conditions imposed in drilling applications. When compared with traditional diesel-
fueled engines, the operational limitations make them uneconomical and difficult to use
(Caterpillar 2010a).
This dissertation follows the style of SPE Journal of Petroleum Technology.

2
Recently, the rising cost of diesel fuel and the tightening of emissions regulations
have forced the drilling industry to take another look at this application. The relative
lower cost of NG could save the industry money, and NG also burns cleaner than diesel,
lowering harmful emissions and making it easier and cheaper to meet emission
requirements (Caterpillar 2010a).
With advances in technology both on the drilling rigs themselves and in the
distribution and storage of NG, the operational disadvantages of the past can either be
managed or eliminated altogether. The repowering of the land drilling rig fleet to NG
engines could have a substantial impact in lowering the overall cost of drilling a well.
Therefore, the purpose of this study is to examine and identify the critical
operational characteristics required of a modern diesel-fueled drilling rig and then
determine the operational drawbacks, if any, of using NG solutions. Changes in rig
performance characteristics and the impact on operation are presented, in addition to an
economic analysis on the overall cost of drilling a well with the presented solution.
In order to accomplish this, this thesis (1) investigates specific regulations for
different types of rig engines; (2) examines the operational characteristics (response, fuel
usage, and cost) of an existing diesel-powered land rig to establish a control baseline; (3)
estimates operational characteristics (fuel usage and cost) of an NG engine in a drilling
environment; and (4) establishes a comparison of diesel and NG engines, indicating the
feasibility of using an NG engine.
Chapter II provides an overview of drilling rigs as well as the various engine
types used in the oil and gas industry and their common applications. Past, current, and

3
future emission legislation is also presented.
Chapter III examines a well drilled in the Haynesville Shale play of northern
Louisiana using a modern variable-frequency-drive (VFD) diesel-powered land drilling
rig to establish a baseline of existing operations. The engine load, fuel consumption, and
time are analyzed and related to various rig operations.
Chapter IV discusses the various NG solutions and how they are implemented.
The performance characteristics of each solution are predicted and compared with the
existing data presented in Chapter III.
Chapter V provides a general discussion of the findings, comparing the various
NG solutions, and discusses operational pros and cons when compared with traditional
diesel-fueled rigs. A total cost of ownership for various NG solutions is calculated based
on equipment and operational cost, including fuel and regular maintenance. This cost is
presented alongside economic data, indicating the feasibility of using NG engines in
drilling applications and supporting a recommendation.

4
CHAPTER II
OVERVIEW
Chapter II presents an overview and history of drilling rigs, engine types used in
the oil and gas industry, their common oil and gas applications, and emissions
regulations for these engine types.
Drilling Rigs
Drilling rigs are used to drill a well into the earth from which oil and gas can be
extracted. All rigs are portable, but vary greatly in size, mobility, and capability. Drilling
rigs can be based either on land or offshore. An example of a land-based rig is shown in
Fig. 1.
Drilling rigs are characterized as either mechanical or electric. Older rigs were
mechanically driven, with the engine powering rig equipment through a transmission
comprising either a clutch or a torque converter. While mechanical rigs are still in use
today, most modern drilling rigs are electrically powered. Electric drilling rig engines
are coupled to electric generators, in what is called a generator set, or genset, which
creates electricity that powers electric motors driving the rig equipment. Because electric
motors can be controlled electronically, these rigs do not require the use of
transmissions.

5
Fig. 1—View of a land-based drilling rig.
The major rig components are the drillstring, draw-works, rotary table/top drive,
and mud pumps. The drillstring is the length of pipe on which the bit and other
downhole tools are mounted. It is composed of individual sections of approximately 30
ft in length called joints. It is often stacked on the rig in 90-ft lengths of three joints each
called stands. The draw-works comprises the cable reel and winch; it serves as the lifting
mechanism for the drillstring. It can also be used as an accessory to connect makeup or
disconnect breakout joints or stands; however, on many modern rigs, there is now
dedicated equipment, known commonly as iron roughnecks, to perform this task. The
rotary table has been used as the traditional means of rotating the drillstring. The table is

6
located in the rig floor and, using a special rectangular pipe called a kelly attached to the
drillstring, it rotates the drillstring while allowing for vertical movement as the wellbore
deepens. On modern rigs, the rotary table and kelly have been replaced with a top drive,
which provides rotation while moving vertically with the drillstring. The mud pumps are
piston-type, high-pressure, positive displacement pumps used to circulate drilling fluid
or drilling mud down the drillstring and back to surface (Caterpillar 2006a).
Electric drilling rigs can be categorized into either direct current (DC) or
alternating current (AC), depending on the type of electricity the rig generators produce.
Electric motors power the draw-works, top drive, mud pumps, and other systems with
electricity provided by the rig generators. The electric motors used for these operations
must be capable of producing high torque at zero rpm, as well as at variable speeds
(Caterpillar 2006a).
DC rigs are the oldest type of electric drilling rigs. The generators on DC rigs
produce DC that powers DC motors. These DC motors provide the desirable
characteristics required for hoisting, drilling, and pumping. The speed of motors is
controlled by varying the voltage the motor receives. This variance is accomplished
through the use of variable resistors placed directly in line between the generator and
motor. As the load on the motor increases, the motor will draw more current. To
maintain its speed, the supplied voltage will also need to be increased (Caterpillar
2006a).
DC generators regulate voltage and current by varying the current through the
field windings and increasing the strength of the magnetic field. A commentator and

7
carbon brushes are integral parts of the DC generator and are subject to wear. They also
produce voltage fluctuations that may require additional components for voltage
regulation. While DC drilling rigs are still common, the problems associated with the
technology have led to the DC rig being phased out (Caterpillar 2006a).
The next generation of the electric drilling rig came with the introduction of the
AC rig. AC generators have less moving parts and therefore require less maintenance
than their DC counterparts. They also produce more constant electric voltage because
AC voltage fluctuates by nature (Caterpillar 2006a).
These AC rigs are able to take advantage of the more desirable characteristics of
AC generators while maintaining the benefits of DC motors. This is done by converting
the AC to DC through the use of a silicon-controlled rectifier (SCR) (Caterpillar 2006a).
Currently, most electric drilling rigs are the AC SCR type. The generators are
usually 600-V AC rectified to 800-V DC for use with the variable speed DC motors.
SCR drives require special oversized generators that allow for fluctuation in the power
factor (PF), which is caused by the modulation of the DC motors. DC motors operating
at low speeds cause a low PF where DC motors operating at high speeds cause a high
PF. Generators used in an SCR application are typically oversized to a 0.6 or 0.7 PF and
have a higher kV amperage (KVA) rating than should be required (Caterpillar 2006a).
Simply oversizing the generator to compensate for a variable PF is not enough.
The generator needs to be mechanically reinforced to compensate for the increased
forces exerted on the winding due to the SCR operation. SCR operation also increases
heat generated in the winding, which needs to be compensated for. If the generators are

8
improperly sized or not designed for use with an SCR, their use may result in circuit
breaker tripping and short generator life (Caterpillar 2006b).
The newest technology in electric drilling rigs utilizes both AC generators and
AC motors. This is accomplished through the use of VFDs. With an AC VFD rig, 600-V
AC or 690-V AC is rectified to 800-V DC using front-end diode technology, which
reduces voltage fluctuation caused by SCR systems. This DC is then made available to a
VFD, which converts it back to AC and feeds it to variable speed AC motors. AC motor
speed is controlled by the VFD, varying the frequency of the AC rather than varying
voltage as on a DC motor (Caterpillar 2006a).
The use of the VFD greatly reduces the amount of stress on the generator
associated with the SCR and results in increased generator life; however, PF fluctuation
is still present, requiring the same special AC generators that are used on an SCR rig
(Caterpillar 2006b).
Engine Types
While the RICEs described below exist in both two-stroke and four-stroke
configurations, two-stroke engines are not used in large industrial applications, such as
drilling, and are therefore outside the scope of this study. All RICEs discussed are four-
stroke.
9
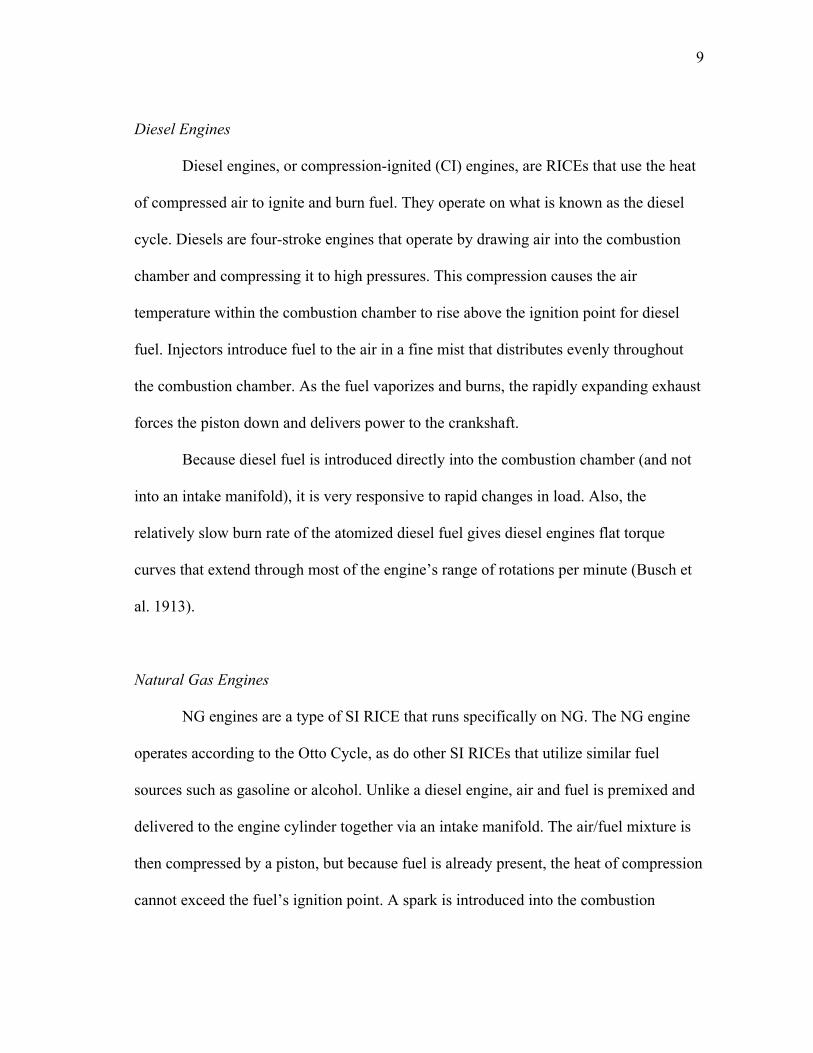
Diesel Engines
Diesel engines, or compression-ignited (CI) engines, are RICEs that use the heat
of compressed air to ignite and burn fuel. They operate on what is known as the diesel
cycle. Diesels are four-stroke engines that operate by drawing air into the combustion
chamber and compressing it to high pressures. This compression causes the air
temperature within the combustion chamber to rise above the ignition point for diesel
fuel. Injectors introduce fuel to the air in a fine mist that distributes evenly throughout
the combustion chamber. As the fuel vaporizes and burns, the rapidly expanding exhaust
forces the piston down and delivers power to the crankshaft.
Because diesel fuel is introduced directly into the combustion chamber (and not
into an intake manifold), it is very responsive to rapid changes in load. Also, the
relatively slow burn rate of the atomized diesel fuel gives diesel engines flat torque
curves that extend through most of the engine’s range of rotations per minute (Busch et
al. 1913).
Natural Gas Engines
NG engines are a type of SI RICE that runs specifically on NG. The NG engine
operates according to the Otto Cycle, as do other SI RICEs that utilize similar fuel
sources such as gasoline or alcohol. Unlike a diesel engine, air and fuel is premixed and
delivered to the engine cylinder together via an intake manifold. The air/fuel mixture is
then compressed by a piston, but because fuel is already present, the heat of compression
cannot exceed the fuel’s ignition point. A spark is introduced into the combustion

10
chamber to ignite the fuel. As in all RICEs, the rapidly expanding exhaust forces the
piston down and delivers power to the crankshaft.
Because the air and fuel are mixed upstream of the cylinder, a small amount of
time is required for the fuel to reach the cylinder once a change in fuel delivery is
required for a change in load. For this reason, an NG engine does not react as quickly to
load changes as a diesel. Also, NG burns much more rapidly than diesel fuel; therefore,
engine torque peaks at a narrow band high in the rpm range (Caterpillar 2010a).
Turbines
Turbines are internal combustion engines (ICEs) that use rotation rather than
reciprocation to generate power. Gas turbines operate on the Brayton Cycle. A turbine
consists of three main parts: the compressor, the combustor, and the turbine sections. Air
is drawn into the inlet and compressed. Fuel is then continuously injected and burned in
the combustor. The rapidly expanding exhaust gas is passed over blades in the turbine
and converted to rotating power.
Turbines display performance properties specific to this type of engine. They
possess a very high power-to-weight ratio, but do not respond as quickly to varying
loads as a RICE. Turbines have the ability to run on various fuel types, and their
performance characteristics change as a result. Typically, however, torque peaks at low
rpm and drop off in a linear fashion with increasing rotational speed.
A turbine’s main advantage in most applications is its light weight and
portability. However, unless used in a combined cycle configuration, where the waste

11
heat is used to make steam, they are typically not as efficient as a RICE. Turbine
efficiency is also directly related to inlet air temperature (Solar Turbine 2009). As the
ambient temperature rises, the efficiency falls sharply (Witherspoon 2011). This fall may
make the use of turbines much more attractive in arctic conditions; however, they
become much less desirable for use in the southern United States.
The emissions of a turbine are also difficult to control. They can produce higher
levels of hazardous emissions than a RICE, and emission warranties are not typically
offered (Witherspoon 2008). There are also currently no specific regulations pertaining
to the emissions of a turbine in a nonroad application such as on a drilling rig. Only
regulations for stationary sources are available, which may make permitting difficult.
For these reasons, the use of turbines as a power source in drilling applications will not
be further pursued in this thesis; however, it may warrant further research.
Performance Characteristics
Regardless of type, an engine must be properly sized to deliver the power
required by the specific application. The load response characteristics of the engine must
meet the load demands of the equipment being driven. In power generation applications,
load acceptance, stability, and response are crucial to sustained operation. As generators
are constant speed applications, torque rise and acceleration capabilities are not required.
However, the ability of an engine to maintain constant rpm is vital to the proper
operation of the generators and any associated electronics (Caterpillar 2006b).

12
When load is applied or removed from a genset operating at a steady-state
condition, the speed of the engine is temporally changed. This change in speed has a
knock-on effect on the voltage and frequency of the electricity being produced. The
engine is forced to recover, or respond, to the change in load returning to a new steady-
state condition. This response is known as transient response (Caterpillar 2006a).
When a significant load is applied to a genset, both the engine and generator
speeds are reduced, causing a drop in both frequency and voltage. This drop is known as
frequency and voltage dip. The opposite is true when a load is removed, causing what is
known as frequency and voltage overshoot. An example of this dip and overshoot due to
transient load is show in Fig. 2. The associated electrical equipment has a tolerance for
accepting fluctuations; however, if the dip or overshoot is too great, it can result in
damage to the equipment or cause it to trip offline (Caterpillar 2006a).
Fig. 2—Dip and overshoot due to transient loads (Caterpillar 2006a).

13
When selecting a motor to power a generator, three application-specific criteria
must be addressed:
1) What is the acceptable percent of frequency and voltage dip?
2) How long can the dip last?
3) What are the load steps and how quickly are they applied?
The acceptable tolerances for the above criteria will be dependent on the application, and
the suitable motor and generator must be able to react to transient loads effectively
enough to stay within these set parameters (Caterpillar 2006b).
Common Applications
Both diesel and NG engines are commonplace in the petroleum industry;
however, they are typically installed and operated in specific applications. Diesel
engines are typically installed for drilling, well servicing, and emergency power
applications. NG engines, on the other hand, are often utilized for gas compression drive,
production power, and production pumping. The use of diesel versus NG is dependent
on many factors, including the availability of the fuel source and the performance
characteristics of the engine itself.
Before selecting an engine for a particular application, it is important to
understand the specific demands and requirements imparted on these engines under each
application.

14
Gas Compressors
Compressor plants compress low-pressure NG for field gas/liquid separation and
transportation before being pumped down a pipeline to a processing facility. Depending
on the distance between the wellhead and the refinery, there may be several compressor
stations placed along a pipeline. The loads placed on the engines are relatively
consistent, and NG can be directly extracted from the pipeline to fuel the engine. Both
NG RICEs and gas turbines are readily used in this application.
Production Power and Pumping
Production facilities require electricity to run anything from electric motors to
controls to appliances. If production facilities are required to produce their own electric
power, then engine power is often utilized to drive electric generators. Often, this
electric power is used to turn electric motors on mechanical pumps used throughout the
production facility; however, direct drive pumps are also common. Similar to the
compressors, the loads placed on the engines are relatively consistent. Because these are
stationary applications, permanent NG lines can be installed to provide fuel; therefore,
both NG RICEs and gas turbines are readily used in this application as well.
Service Rigs
Service rigs often use large engines to power equipment used in the underground
maintenance or repair of a well. Typically, these engines are used to power pumping
operations such as cementing, acidizing, or hydraulic fracturing. Workover and

15
intervention with coiled tubing operations are other examples of well servicing
operations. Service rigs are often truck-mounted portable units where a single engine
may be used as primary source of mobility, as well as to power the well servicing
equipment. A transmission is utilized to transfer power from the wheels to the various
equipment mounted on the rig. Because of its mobile nature, diesel-fueled RICEs are
common in this application.
Drilling Equipment
Electric drilling rigs are generally powered by skid-mounted generator packages
utilizing engines to drive the generators. Typical generator package configurations
consist of banks of two to four generator sets, each mounted on individual skids. These
skids also house a radiator and controls and are almost exclusively diesel powered.
Regulation
Code of Federal Regulation
As is the case with nearly every industry, the oil and gas exploration and
production (E&P) industry, including the drilling industry, is required to follow a
specific set of rules set by government regulators. According to the National Archives
and Records Administration, the Code of Federal Regulations (CFR) is the codification
of these rules published in the Federal Register by the executive departments and
agencies of the federal government. It is divided into 50 titles that cover the areas subject

16
to federal regulation and is updated on an annual basis (National Archives and Records
Administration 1999).
Each title is divided into numbered chapters (Chapters I, II, III…), which are
further divided into numbered parts (Parts 1, 2, 3…). Many of these parts are further
divided into alphabetically labeled subparts (Subparts A, B, C…) (National Archives and
Records Administration 1999).
The section is the basic unit of the CFR. Sections are numbered beginning with
the corresponding part number and separated by a period (Sections 1.1, 1.2, 1.3…).
Please note that the sections are numbered low to high within each part, with
independent grouping under each subpart. Each title, part, and subpart bears its own title,
which describes the specific regulatory area covered. Each section is further divided
using a descending level of units referred to as paragraphs, which are noted using a
range of letters, numbers, roman numerals, and italics. Please see Table 1 for an
illustration of the CFR numbering system. As an example, CFR, Title 40, Part 89,
Subpart A, Section 1, Paragraph B, Subsection 3, Sub-Subsection ii would be noted as
40 CFR 89.1(b)(3)(ii) (National Archives and Records Administration 1999).

17
TABLE 1— CFR NUMBERING SYSTEM
Name Title Chapter Part Subpart Section Paragraph
Designation 1-50 I - VII 1 - 1799 A, B, C,
etc.
Part 1, 2,
3, etc.
See below
Paragraph
Name Level 1 Level 2 Level 3 Level 4 Level 5 Level 6
Designation (a), (b),
(c), etc.
(1), (2),
(3), etc.
(i), (ii),
(iii), etc.
(A), (B),
(C), etc.
(1), (2),
(3), etc.
(i), (ii),
(iii), etc.
Title 40. Title 40 (40 CFR) is the set of regulations created by the United States
Environmental Protection Agency (EPA) to protect the environment. According to the
organization’s website, it is a department in the executive branch of government that has
been delegated authority by the legislative branch (congress) to write and enforce
regulations necessary to implement pertaining laws (EPA 2011a). The Clean Air Act is
one such law. Passed by congress with its subsequent amendments and extensions, it
authorizes the EPA to create national ambient air quality standards (NAAQs) “and to
regulate emissions of hazardous air pollutants” (HAPs) (EPA 2011b).
Under 40 CFR are the performance and emissions standards regulating the
various prime movers used in the gensets that are part of this study. RICEs are
categorized in the CFR as CI engines or SI engines. For the purpose of this study, the
only CI engines examined are diesel-fired engines, the only SI engines examined are

18
NG-fired engines, and all RICEs are considered to be nonroad engines. The final genset
prime mover type to be discussed in this study is combustion turbines.
Definitions. For the purpose of this study, the following definitions apply:
Nonroad engine means an internal combustion engine that, by itself or in or on a
piece of equipment, is portable or transportable, meaning designed to be and
capable of being carried or moved from one location to another. Indicia of
transportability include, but are not limited to, wheels, skids, carrying handles,
dolly, trailer, or platform.
SI means relating to a gasoline-fueled engine or other engines with a spark plug
(or other sparking device) and with operating characteristics significantly similar
to the theoretical Otto combustion cycle. SI engines usually use a throttle to
regulate intake air flow to control power during normal operation.
CI means relating to a type of reciprocating, internal combustion engine that is
not an SI engine, with operating characteristics that are significantly similar to
the theoretical diesel cycle.
Title 40 specifies specific emissions criteria for engines by type and size. Drilling rigs
vary in size; however, this study will focus on modern triples with high power ratings.
These triples are very large pieces of equipment that require immense amounts of power
to operate. Because of this, the gensets used are well above the highest power rating
outlined in Title 40, greater than 560 kW. All emission values shown in Tables 2 to 4
are not-to-exceed (NTE) standards.

19
Nonroad Compression-Ignited Engines (Diesel Engines)
Tiers 1 to 3. Emission regulations in Tiers 1 to 3 began in January 1996 with the
first implementation. Beginning with Tier 1 regulations, the regulations introduced
stringent emission requirements phased-in over time, with Tier 2 following Tier 1 and
finally Tier 3, which came into full effect for all power categories in 2008. For the power
rating category relating to drilling rig gensets greater than 560 kW, there is no Tier 3.
Tier 2 is the most stringent standard and came into effect in 2006. Please see Table 2 for
the Tiers 1 to 3 emissions standards (National Archives and Records Administration
2011).
TABLE 2—NONROAD CI RICE TIERS 1 TO 3 EMISSION STANDARDS (g/kW-hr)
Rated
power
(kW) Tier
Model
year
Oxides
of
nitrogen
(NOx)
Hyrdocarbon
(HC)
Nonmethane
hydrocarbon
(NMHC) +
NOx
Carbon
monoxide
(CO)
Particulate
matter
(PM)
Tier 1 2000 9.2 1.3 - 11.4 0.54 kW >
560 Tier 2 2006 - - 6.4 3.5 0.2
Tier 4. The final piece of emissions regulation to be implemented is Tier 4. The
Tier 4 legislation itself is phased-in over time in two steps: Tier 4 Interim and Tier 4
Final. Tier 4 creates an additional power category for engines greater than 900 kW and
makes a distinction in between engines that are part of a genset and those that are not.

20
This distinction is in contrast to Tiers 1 to 3, which make no distinction. Tier 4 is
significant because where Tiers 1 to 3 emission standards were achievable with
improvements in engine design and control, meeting Tier 4 standards requires exhaust
after-treatment, similar to today’s modern on-road engines (National Archives and
Records Administration 2011).
Tier 4 Interim takes the place of the nonexistent Tier 3 for the greater-than-560-
kW category. Beginning in 2011, engines in this category must comply with the
emissions criteria, shown in Table 3 (National Archives and Records Administration
2011).
TABLE 3—NONROAD CI RICE TIER 4 INTERIM EMISSION STANDARDS (g/kW-hr)
Model years
Maximum
engine power Application PM NOx NMHC CO
2011 to 2014 560 < kW < 900 All 0.1 0.5 0.4 0.5
kW > 900 Gensets 0.1 0.67 0.4 0.5
All except
gensets 0.1 0.5 0.4 0.5
Tier 4 Final is currently the most stringent emissions regulation in the United
States for nonroad CI engines and is effective 1 January 2014. Please see Table 4 for the
criteria (National Archives and Records Administration 2011).

21
TABLE 4 —NONROAD CI RICE TIER 4 EXHAUST EMISSION STANDARDS (g/kW-hr)
Maximum
engine power Application PM NOx NMHC CO
kW > 560 Gensets 0.03 0.67 0.19 0.5
All except gensets 0.04 0.5 0.19 0.5
Manufacturer Flexibility Program. The Tier 4 Interim was written to allow
manufacturers of large equipment, above 560 kW, to phase-in the Tier 4 Final
performance standards in a similar way to manufacturers of smaller engines falling
under Tier 3. The added cost associated with research and development (R&D) and
testing, however, has led most the major engine manufacturers to skip Tier 4 Interim and
work directly toward meeting Tier 4 Final in 2014. With previous greater-than-560-kW
engines being only Tier 2–compliant and Tier 4 Interim effective in 2011, a void has
been left. Tier 2 engines can no longer be manufactured and sold under Tier 4 Interim
legislation, so sales of greater-than-560-kW engines will cease under Tier 4 Interim until
the Tier 4 Final engines enter production nearer to 2014 (National Archives and Records
Administration 2011).
The only exception to Tier 4 Interim is the Equipment Manufacturers Flexibility
Program. This program is an exemption option intended to provide flexibility and relief
in the Tier 4 Interim legislation to equipment manufacturers who purchase and install
nonroad compression engines in the equipment they manufacture. For a timeframe
exceeding Tier 4 Interim and extending into Tier 4 Final, equipment manufacturers will
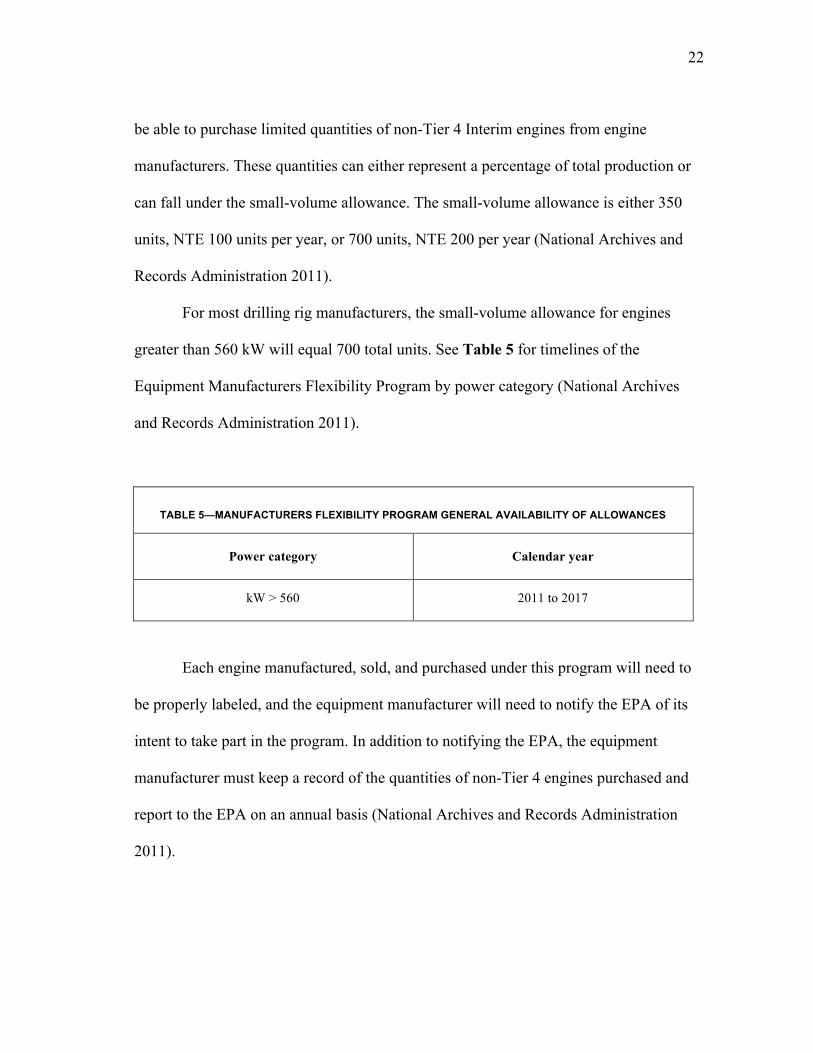
22
be able to purchase limited quantities of non-Tier 4 Interim engines from engine
manufacturers. These quantities can either represent a percentage of total production or
can fall under the small-volume allowance. The small-volume allowance is either 350
units, NTE 100 units per year, or 700 units, NTE 200 per year (National Archives and
Records Administration 2011).
For most drilling rig manufacturers, the small-volume allowance for engines
greater than 560 kW will equal 700 total units. See Table 5 for timelines of the
Equipment Manufacturers Flexibility Program by power category (National Archives
and Records Administration 2011).
TABLE 5—MANUFACTURERS FLEXIBILITY PROGRAM GENERAL AVAILABILITY OF ALLOWANCES
Power category Calendar year
kW > 560 2011 to 2017
Each engine manufactured, sold, and purchased under this program will need to
be properly labeled, and the equipment manufacturer will need to notify the EPA of its
intent to take part in the program. In addition to notifying the EPA, the equipment
manufacturer must keep a record of the quantities of non-Tier 4 engines purchased and
report to the EPA on an annual basis (National Archives and Records Administration
2011).

23
Nonroad Large Spark-Ignited Engines (Natural Gas Engines)
Emissions regulations for nonroad large SI engines came into effect 1 January
2004. Although different variations of these engines exist using different fuel sources,
such as alcohol or ethanol, this type of engine typically refers to gasoline- or NG-driven
engines. Gasoline- or alternative fuel–powered engines are out of the scope of this study
and therefore, for the purpose of this thesis, all nonroad large SI engines will be NG
engines (National Archives and Records Administration 2011).
Tier 1 standards for NG engines originally required steady-state testing only. Tier
1 steady-state testing exhaust emission standards are shown in Table 6. Tier 2 came into
effect with the 2007 model year and currently requires further transient and field testing
(National Archives and Records Administration 2011).
TABLE 6—NONROAD SI ICE TIER 1 EMISSION STANDARDS (g/kW-hr)
Testing HC + NOx CO
Certification and production-line testing 4 50
In-use testing 5.4 50
Tier 2 emission standards for both steady-state and transient testing require the
same numerical emission standards; however, the transient test is not required for
engines greater than 560 kW. Tier 2 field testing requirements are determined using

24
either the standard or alternative method referenced in Table 7 (National Archives and
Records Administration 2011).
Because NG is composed of primarily methane, NMHC emissions are virtually
zero from NG engines. Furthermore, because NG burns nearly completely, total
hydrocarbon (THC) emissions are very low as well. It is for this reason that, for NG
engines, the HC component of the numerical formulas can be assumed to be zero. The
Tier 2 emission standards are shown below in Table 7 (National Archives and Records
Administration 2011).
TABLE 7—NONROAD SI ICE TIER 2 EMISSION STANDARDS (g/kW-hr)
General emission standards Alternate emission standards
Testing HC + NOx CO
(HC + NOx) ×
(0.791) CO HC + NOx CO
Steady-state
/ Transient
testing 2.7 4.4 Not applicable
Not
applicable
Not
applicable
Field testing 3.8 6.5 16.78 3.8 31
In addition to the emission standards described above, a provision exists for
exempting large NG engines. In order to qualify for this exemption, the engine must
operate solely on NG and have an engine power at or above 250 kW. Additionally, the
engine must be part of an engine family that complies with Tiers 1 to 4 for diesel engines

25
as previously described. If these criteria are met, the engine may be exempted from the
NG requirements and may be certified under Tiers 1 to 4 standards. This could be an
advantage if the NG engine is able to meet the Tiers 1 to 4 diesel requirements (National
Archives and Records Administration 2011).
Many major manufacturers are not compliant with the Tier 4 Interim standards
currently in effect and have instead chosen to direct their efforts toward Tier 4 Final
compliance. Consequently, this had led to these manufacturers currently offering
noncompliant large diesel engines under the Manufacturers Flexibility Program.
Therefore, the current offering of non-Tier-4-compliant engine families fails the criteria
for the NG engine exemption and will continue to do so until the Tier 4 Final–compliant
engines are offered in the future (National Archives and Records Administration 2011).
Stationary Spark-Ignited Internal Combustion Engines
Stationary SI ICEs can be physically similar or identical engines to the nonroad
large SI engines previously discussed. The primary difference is in the application rather
than the design. Stationary engines are located at a stationary source for more than 1
year, and in the NG configuration, are much more common than nonroad large SI
engines. Certifying an engine or engine family is a time-consuming and costly endeavor.
With a currently low return on investment, engine manufacturers have not committed the
resources for certifying their products to the nonroad SI engine standard for NG engines
(National Archives and Records Administration 2011).

26
This has resulted in confusion in the industry as how to correctly procure and
apply nonroad large SI engines. One possible solution may to be to apply for an
exception from the local governing agency and use an engine certified for stationary use
in a mobile nonroad application. This could prove to be a relatively straightforward
process because many of the NG engines described in the stationary SI ICE standards
refer back to the nonroad large SI engine standard (National Archives and Records
Administration 2011).
The stationary SI ICE standard makes a distinction between rich-burn and lean-
burn engines. Engines over 19 kW ordered after 12 June 2006 in a rich-burn NG
configuration must comply with the nonroad large SI standard. Lean-burn NG engines
over 75 kW ordered between12 June 2006 and 1 January 2011 have the option of
complying with the nonroad large SI standard or the limits shown in Table 8. Engines
ordered after 1 January 1 2011 in lean-burn configuration must comply with the limits in
Table 8 (National Archives and Records Administration 2011).
The stationary SI RICE standard is also the only NG engine standard that directly
addresses the use of wellhead gas to power an NG engine. It states that on a case-by-case
basis, an operator of an SI RICE using wellhead gas as a power source can apply for
approval to meet emission standards that deviate from the rest of the SI RICE standard,
provided the emissions do not exceed the emission standards for emergency SI RICEs
greater than 19 kW and less than 100 kW presented in Table 8 (National Archives and
Records Administration 2011).

27
TABLE 8—STATIONARY SI ICE EMISSION STANDARDS
This chapter has presented how both diesel and NG are regularly applied in the
oil and gas industry alongside the requirements of a land-based drilling rig. The
following chapters will discuss each fuel type further and how they may be applied to a
drilling application. However, it must be noted that, not only the physical challenges
must be overcome, but all working solutions must be engineered to fit within the
framework of the pertinent legislation.

28
CHAPTER III
DIESEL ENGINES
Diesel has been the main source of fuel in the land-based drilling industry since
the inception of modern machinery. It has been a dependable and affordable fuel supply
that can be easily stored and transported. Combined with the reliable and proven diesel
engine performance, it has remained the primary source of power for drilling rigs, from
the mechanically driven rigs of the past to today’s modern electric drilling rigs. Diesel
engines were chosen as the baseline comparison of this study because they are the most
commonly used and are the power source for the drilling rig selected for this thesis (Hill
et al. 2011).
Diesel engines, or CI engines, are RICEs that use the heat of compressed air to
ignite and burn fuel. They operate on what is known as the diesel cycle. Diesels are four-
stroke engines that operate by drawing air into the combustion chamber and compressing
it to high pressures. This compression causes the air temperature within the combustion
chamber to rise above the ignition point for diesel fuel. Injectors introduce fuel to the air
in a fine mist that distributes evenly throughout the combustion chamber. As the fuel
vaporizes and burns, the rapidly expanding exhaust forces the piston down and delivers
power to the crankshaft (Busch et al. 1913).
Diesel engines’ high compression ratios cause them to have the highest thermal
efficiency of all the RICEs. Where most SI RICEs are only efficient to a maximum of
approximately 30 to 40%, diesel engines can reach efficiencies exceeding 50% in some

29
cases (Busch et al. 1913; Takaishi et al. 2008; United States Department of Energy
2003).
Because diesel fuel is introduced directly into the combustion chamber (and not
into an intake manifold), it is very responsive to rapid changes in load. Also, the
relatively slow burn rate of the atomized diesel fuel gives diesel engines flat torque
curves that extend through most of the engines’ rpm range. It is these characteristics that
allow diesel engines to effectively handle large transient loads (Busch et al. 1913).
Because of the high torque produced by diesel engines, the components must be
built to withstand heavy loads. While this results in making a diesel engine very robust,
it also makes them heavy. This can be a detractor where weight is a factor.
A major concern when burning diesel is its inherently dirty emissions. For
example, diesel engines produce large quantities of HAPs, volatile organic compounds,
and other air pollutants that are a threat to public health and contribute to the formation
of ozone. They also produce large quantities of particulate matter, which is a lung
irritant, and burning diesel fuel containing sulfur produces sulfuric acid, which can
contribute to acid rain.
To establish a baseline for this study, two approaches are used for analyzing data:
one looks at rig fuel consumption and efficiency, which will later be used to perform an
economic analysis, and the other looks at transient load response, an important factor for
smooth and consistent operations under various load conditions. Because of its
importance, rig operations that incur high transient loads are identified and further
discussed.

30
Methodology
Rig Fuel Consumption and Efficiency
Data. Data were collected from a modern VFD rig drilling a horizontal well in a
Haynesville Shale play. The rig was equipped with three gensets; however, no more than
two generators at a time were used to drill this well over the course of 27 days.
Using the rig’s data collection and management system, data were acquired
showing each gensets performance. These data consisted of the rig’s fuel usage in
gal/hour and corresponding percent load. The percent load is a percentage of the
maximum load that can be applied to a genset or the maximum output the genset can
achieve. The system acquired data every 10 seconds for the drilling of the well. Some
data disruptions were observed, and these data are omitted.
The data were sorted by percent load in 1% increments, and the time spent at
each percent load was summed to show the amount of time in hours each generator spent
at that particular load. Percent load on the generator and the corresponding fuel usage
rate in gal/hour were collected for each of the three gensets in 10-second increments.
Procedure and Results
Although three gensets were available, no more than two were required at any
one time during the drilling operation; consequently, the top third of the rig capacity was
never utilized. This is normal, however, because while this capacity is available, the
primary function of the third genset is for redundancy and backup rather than for regular
use.

31
Normal operation calls for the rig running on one genset until the load reaches, or
is expected to reach, a load that exceeds the generator’s capacity. When this occurs, a
second genset is required and will be brought online with the first. Once synchronized,
they will operate together and share the load approximately equally. This operation is
left to the driller’s discretion.
In order to compare between engine types, the operational parameters that the
drilling rig works under must be understood. The fuel consumption change with respect
to change in load was determined, as well as the effects of operating in island versus
tandem mode. It is also important to understand under what load conditions the engines
operate and for what length of time. Once these parameters were known, the fuel
consumption rate per percent load point and rig efficiency was determined.
Generator operation was separated by island mode and tandem mode. The time
spent in hours at each percent load point was determined for both modes by summing the
time spent at each percent load point. This data were then used to plot Fig. 3.
Fig. 3 shows the amount of time in hours that each generator ran at each percent
load. The data shows that throughout the drilling of this well, the rig ran 25% of the time
on one genset and 75% of the time on two. The figure is segmented into when the genset
was operating in island mode and when it was working in conjunction with another
genset. When operating in island mode, the genset spent the greatest amount of time at
approximately 35 to 45% with a less significant amount of time spent around 80 to 90%,
where, when operating in tandem, the greatest amount of time was spent between 30 to
40% and another significant amount of time spent around 50 to 60%.

32
None of the gensets spent time operating below 24%. This represents the
maximum turndown due to engine idle. Operationally, the time spent at 35 to 45%
represents the load demand just off idle. This is mostly standby power used to maintain
controls, lights, air conditioning, and other support systems when the rig is not actively
engaged in drilling operations. Some examples of these operations are when rigging-up
or -down rig components, testing, repair, cementing, nippling-up or -down blow out
preventers (BOPs), and conditioning mud.
The second major range of time spent on one generator is in the 80 to 90% range.
It is at this point where the second generator is brought online, and as the total load
continues to grow, the two generators now share the load equally. The load imposed on
each generator is approximately half of what was imposed on the single generator. This
transitions into the range shown for two generators between 30 to 40%. The final range
between 50 to 60% on two generators shows the majority of the time spent by the
generators on the rig.
It is beyond the scope of this study to attempt to identify the operations
performed that contribute to each of the load ranges identified. These could be attributed
to one operation or a combination of several that overlap, leading to these ranges of
heavy use. The purpose of the creation of these figures is simply to identify at what load
and for how long each engine is operating.

33
Fig. 3—Hours versus load for gensets in island and tandem mode.
Giving double weight to the tandem mode by multiplying it by two and adding it
to the island mode hours, a total hours for all the generators at a given percent load point
was determined and used to create Fig. 4. This figure is simply an addition to Fig. 3 and
shows the total amount of time each generator operates for each percent load, regardless
of whether it is operating in island mode or in tandem. This reveals two bands of heavy
operation similar to Fig. 3. The majority of the generator’s time was spent between 30 to
65% load with major subgroups within that time span, plus or minus 35 and 55% load.
Using these data, a clear picture can be formed to show how the generators are used in
drilling this well.
0
5
10
15
20
25
30
35
0 20 40 60 80 100
Hou
rs
% Load
Hrs vs. Load
1 Gen
2 Gens

34
Fig. 4—Hours versus load for gensets.
Because of internal friction, a RICE operating at a given load is generally more
efficient than two engines operating at half that load; however, the partial load fuel
efficiency (mass burned per energy produced) of a diesel engine is a nearly linear
relationship and remains almost constant.
Other types of SI RICEs do not exhibit a constant partial load efficiency, and for
this reason, it is important to understand under what loading conditions the gensets
operated when drilling this well.
A plot of the fuel usage versus percent load when running one and two
generators is shown in Fig. 5. This figure shows a nearly linear relationship between the
engine load and the fuel usage. This further reinforces the diesel performance
characteristics previously discussed: that the operating efficiency of a diesel engine
remains relatively consistent throughout the operating range. It also shows that two
0
10
20
30
40
50
60
70
80
0 20 40 60 80 100
Hou
rs
% Load
Hrs vs. Load

35
generators running together exhibit nearly the same performance characteristics as one
running in island mode.
Fig. 5—Fuel usage versus load for diesel gensets in island and tandem mode.
Fig. 5 does show a slight increase in fuel consumption per unit output as the load
increases. To determine the rig’s efficiency curve, the rig’s total average fuel usage at
each percent load point was divided by the corresponding percent load point to yield the
data displayed in Fig. 6. Fig. 6 suggests that running two generators at a lower load is
more efficient that running one at a higher load. Where this may be identified as a way
to increase fuel efficiency, the additional wear and tear on the second engine, resulting in
additional maintenance costs, may offset any observed savings in fuel.
0
10
20
30
40
50
60
70
80
0 20 40 60 80 100
GPH
% Load
Fuel Usage vs. Load
1 Gen
2 Gens

36
Fig. 6—Diesel engine efficiency.
Transient Response
Procedure
In order to identify critical operations regarding transient response, the raw data
for percent load versus time are investigated for repetitively high transient loads. A
graphical representation of the load versus time was obtained for the entire well and
examined for periods of high load. Whenever these were found, the date and time were
noted. By cross-referencing the graph with the daily tower sheets over the same time
interval, four critical operations were identified: drilling, circulating, tripping, and
reaming. These operations are shown as a percent of rig time for the well in Fig.7.
Within these operations, periods of rapid change were identified and are analyzed for
transient loads.
0
0.5
1
1.5
2
2.5
0 20 40 60 80 100
GPH
/% Loa
d
% Load
Efficiency

37
Fig. 7—Drilling operations.
Drilling
Approximately 47% of the rig time for this well was spent drilling. This well was
drilled using a mud motor imposing differential pressure that consumes pump hp.
Consequently, in order to build and maintain well trajectory, time spent drilling was split
between alternating periods of rotating and sliding. Both of these operations rely heavily
on the mud pumps, where only the rotating periods require constant use of the top drive.
Little load change was observed when switching between these periods, which suggests
that the majority of the increased load above the baseline during drilling operations is
because of power demand from the mud pumps. An example of the drilling operation
load profile is shown in Fig. 8.
The mud pumps operate consistently and load increases slightly with depth as a
primary result of increased internal drillpipe friction and equivalent circulating density
47%
6% 11%
12%
24%
Drilling Opera>ons
Drilling
Circula:ng
Tripping
Back Reaming
Other

38
(ECD) as the drillstring lengthens. The figure shows intermittent breaks in the constant
load approximately every 90 ft (one stand) to make a connection. This operation
required stopping the mud pumps, which drops the load demand; however, it also
requires the draw-works, which creates a momentary spike in demand. Negating the
connections, drilling creates a constant load with little variation and low transient load.
In this example, the load averages approximately 86% load, but only varies by
approximately 7%.
Fig. 8—Drilling load profile.
Circulating
Approximately 6% of the rig time for this well was spent circulating, and an
example load profile is shown in Fig. 9. This operation shows an operation similar to
drilling as it is almost exclusively dependent on the mud pumps; however, the overall
load is slightly lower in the absence of weight on bit, causing the differential pressure
80 81 82 83 84 85 86 87 88 89 90
0 2 4 6 8 10
% load
Time (min)
Drilling

39
across the mud motor to be reduced. Also, because the drillstring is stationary, there are
no connections to make, which eliminates the sporadic troughs and spikes shown in the
drilling charts. This operation shows the most consistent load with lowest transient
loading of the four targeted operations. In this case, the load averages approximately
65% load, but only varies by approximately 2% load.
Fig. 9—Circulating load profile.
Tripping
Approximately 11% of the rig time on this well was spent tripping, an example
load profile of which is shown in Fig.10. A tripping operation requires extensive use of
the draw-works, and as it is considered nonproductive rig time, a tripping operation is
generally done as quickly as the rig and well conditions will allow. As can be seen by
the figure, tripping involves very high and rapid increase in load when the drillstring is
being hoisted, followed by an equally rapid decrease when the load is set on the slips and
60 61 62 63 64 65 66 67 68 69 70
0 2 4 6 8 10
% load
Time (min)
Circula>ng

40
the block is lowered to retrieve another stand. These operations call for the engines to
respond to high transient loads created from load fluctuations varying from
approximately 30% load to 80% load in less than 20 seconds.
These trip times of approximately 25 stands per hour (or one stand every 2.5
minutes) are not uncommon and create a repetitive and cyclical loading and high
transient load. When tripping in, intermittent discontinuities are seen every 25 stands
where the tripping operation is paused and the mud pumps are brought online to fill the
pipe for well control reasons to maintain bottomhole pressure.
It is important to note that tripping can be in or out of the hole. Tripping out
creates the highest load because it requires the draw-works to lift the drillstring,
overcoming both weight and drag. Tripping in creates the same cyclic profile with high
transient loads; however, the loads are less because of running the blocks up nearly
empty and slacking off weight to run the pipe into the hole.

41
Fig. 10—Tripping load profile.
Back-Reaming
Approximately 12% of the rig time on this well was spent reaming. An example
load profile of this operation is shown in Fig. 11. Reaming down is a process that very
closely resembles drilling, but with slightly lower loads due to reduced differential on
the mud motor caused by low weight on bit. Back-reaming, however, incorporates the
both the draw-works and mud pumps, creating high sustained loads. The loads are
cyclic, as both the pumps must be stopped and the block lowered to make a connection.
The transient loading is high, ranging from approximately 35% load to 70% load, but
this 35% increase occurs over the course of several minutes and the frequency of
connections are not rapid like during tripping operations, taking approximately 8
minutes to complete a cycle.
30
40
50
60
70
80
90
0 2 4 6 8 10
% load
Time (min)
Tripping

42
Fig. 11—Back-reaming load profile.
Other Operations
The other rig operations not identified as critical consist of other operations such
as nippling-up or -down BOPs, waiting on cement, rig repair, rig maintenance, cut and
slip drill line, and other rig operations that are not directly related to drilling. These are
all lumped together as other operations and are generally low-power operations where a
single genset is run at or near idle.
Discussion
Diesel has been the primary source of fuel for drilling rigs for years. Because of
its prominent stance in the industry, it was chosen to be the baseline of this study. A well
drilled by a diesel-powered modern VFD land-based drilling rig was selected and
30 35 40 45 50 55 60 65 70 75 80
0 10 20 30 40 50 60
% load
Time (min)
Back Reaming

43
analyzed. The engine fuel usage and loading during the drilling of this well was
determined, and critical operations were identified.
Based on the results, diesel engine fuel usage is nearly directly proportional to its
percent load, with the fuel efficiency dropping off slightly as the percent load increases.
The drilling rig operates with two generators the majority of the time at loads below half
capacity. This does increase fuel efficiency; however, it is primarily a result of rig power
requirements. The highest power requirements and transient loads were found to be
primarily a result of four basic rig operations: drilling, tripping, circulating, and back-
reaming. It will be these four operations that are of major importance when performing
an engine comparison. Similar characteristics are analyzed for NG engines in the
following chapter.

44
CHAPTER IV
NATURAL GAS SOLUTIONS
As previously discussed, the use of NG as a fuel in the oil and gas industry is not
new; however, the application of using it as a fuel source for drilling applications can be
seen as an emerging technology. NG is an abundant, economical, clean, and
environmentally friendlier alternative fuel, and it is the cleanest of all the HC fuels. It
burns cleaner than diesel, reducing emissions of harmful air pollutants. NG is also an
abundant domestic energy source. Because it can be produced in vast quantities within
the United States, utilizing it can help reduce dependence on foreign sources of energy
(Hill et al. 2011).
Current market conditions have driven up the cost of diesel; however, at the same
time, NG prices have dropped substantially. The current market price for diesel is at
approximately 2.60 USD/gal, and NG is currently at around 4.50 USD/MMcf. Because
diesel is a liquid and NG exists as a gas at standard conditions, it can be difficult to
compare the quantities of the two directly. This is overcome by normalizing the units on
a per-Btu basis. Assuming that 1 scf of NG contains approximately 1,000 Btu and 1 gal
of #2 diesel contains 129,500 Btu, these units can be normalized on a per-Btu basis.
Both of these fuels are commodities and their prices change daily; however, currently,
on a per-Btu basis, #2 diesel costs approximately 21.1 USD/MMBtu and NG costs
approximately 4.50 USD/MMBtu. Another useful unit that helps relate these two fuels is
to refer to NG on a gal/US of diesel equivalent. This is that amount of NG that would

45
contain the same amount of energy in 1 gal of diesel. Normalizing these prices on a
gal/US of diesel equivalent brings the cost of NG to 0.59 USD/gal of diesel equivalent.
However it is presented, NG is currently less than 25% the cost of diesel fuel (United
States Department of Energy 2003).
Emissions from Natural Gas Engines
As outlined in the previous sections, the EPA has set out through regulation to
reduce the amount of harmful matter being emitted by nonroad engines in the United
States. NOx, CO, unburned HC, and PM are of primary concern. NG by default is a
cleaner burning fuel source than diesel, and the emissions from the engines that burn it
will be discussed here.
In an ideal world, the combustion of NG follows the following formula:
CH4 + 2O2 + 7.5N2 = 2H2O + CO2 + 7.52N2,
where CH4 is methane, O2 is oxygen, H2O is water vapor, CO2 is carbon dioxide, and N2
is nitrogen. This is referred to as stoichiometric combustion; however, this ideal
combustion is never the case in reality. Many factors come into play to cause deviation
from this ideal case. The previous equation is for pure methane, which even in pipeline-
quality gas, is accompanied by other gases such as ethane, propane, and butane.
Consequently, the formula differs, becomes more complex, and produces different and
undesirable products, the quantities of which vary greatly depending on operating
conditions, such as combustion temperature, air/fuel ratio, engine load, and engine
design (Caterpillar 2007).

46
If a pure methane fuel source could be obtained and ideal stoichiometric
combustion could be carried out in an internal combustion engine, the only byproducts
of combustion would be water vapor and carbon dioxide (Caterpillar 2007).
Products of Combustion
Water is a harmless, naturally occurring, nonpolluting byproduct in exhaust and
not an environmental concern. Carbon dioxide is inert and is a major natural component
of our atmosphere. It is used by plant life in photosynthesis to generate atmospheric
oxygen. While it is not considered a hazardous substance such as an irritant or
carcinogen, carbon dioxide’s possible tie to global warming has legislators working to
limit its emissions. Coincidently, NG as a fuel source produces the lowest quantity of
carbon dioxide per unit of energy of all the HC fuels (Caterpillar 2007).
Nitrogen is also a naturally occurring component of the atmosphere. As shown in
the aforementioned ideal combustion formula, under ideal combustion conditions, it
passes directly through the combustion process unchanged. In its natural form it is an
inert gas and has no adverse effects to warrant its regulation; however, when exposed to
high exhaust temperatures, it will combine with oxygen to form various oxides of
nitrogen. Nitrogen oxide is a general term primarily referring to nitric oxide (NO) and
nitrogen dioxide (NO2). Nitrogen oxide is a known lung irritant and contributes to the
formation of ozone (O3) (Caterpillar 2007).

47
Anytime combustion is not considered ideal, particles other than water and
carbon dioxide will form during the combustion process, many of which are harmful to
public health and the environment.
Carbon monoxide can form when there is not enough oxygen present to sustain
complete combustion and, as a consequence, incomplete combustion results. This
normally results when the air/fuel mixture is too rich or when it is so lean as to not allow
for complete combustion. Combustion chamber design can also contribute to the
formation of carbon monoxide. Carbon monoxide is a health risk to humans, and
inhaling it reduces the blood’s ability to deliver oxygen to the body (Caterpillar 2007).
When incomplete combustion occurs, unburned HCs pass through the
combustion chamber and enter the exhaust stream. The type of HC exhausted depends
on the type and composition of fuel being burned, and their reactivity varies greatly by
type. While some unburned HCs are nearly inert, others are highly volatile, and when
combined with nitrogen oxide and ultraviolet light form ozone and smog. Unburned HCs
are generally grouped into two categories: THC and NMHC. THCs comprise all NG
component gases, as well as any other higher chain HCs. NMHC comprise all THCs
with the exception of methane. NMHCs are often referred to as volatile organic
compounds (VOCs) and are more reactive then methane, which is highly unreactive.
Because NG is composed of primarily of methane, an NG engine’s THC emissions are
nearly equal to its NMHC emission levels. While methane’s nonvolatile nature limits its
ability to form smog, similar to carbon dioxide, it is considered a greenhouse gas and its
allowable emission levels are controlled (Caterpillar 2007).

48
HAPs are specific products of combustion that have been identified by the EPA
as having specific properties hazardous to human health. The type of HAP emitted is
dependent on the fuel type being burned, but of all the possible HAP emitted from an
engine, the majority consists of four aldehydes: formaldehyde, acrolein, methanol, and
acetaldhyde. Aldehydes are the product of incomplete combustion, and formaldehyde is
the most common. Aldehydes are often irritants, carcinogens, and/or corrosives
(Caterpillar 2007).
PM is tiny solid particles of matter suspended in the exhaust stream. It often
refers to soot or elemental carbon, but can also be composed of other products of
combustion such as sulfur dioxide (SO2). Although other classifications exist, the
classification of primary concern with emissions is PM10, less than 10 µm in diameter.
PM is a respiratory irritant and carcinogen (Caterpillar 2007).
Sulfur dioxide will be emitted in the exhaust stream when there is sulfur in the
fuel. Sulfur is a naturally occurring element produced with HCs; however, it is nearly
completely removed in the refining process. Modern fuels and engine oils will only have
trace levels of sulfur present to form sulfur dioxide in the combustion chamber. Sulfur
dioxide contributes to the formation or sulfuric acid in the atmosphere and,
consequently, acid rain (Caterpillar 2007).
Engine Types
NG RICEs can be either rich-burn or lean-burn, depending on which combustion
model they are designed to follow.

49
Rich-burn engines are designed to achieve stoichiometric combustion by using
the exact amount of air required to react with all the fuel. The goal is that after
combustion, there should be no oxygen or fuel left over in the exhaust. The results are
high combustion temperatures and corresponding high nitrogen oxide levels in the
exhaust. These same high combustion temperatures also drive down the levels of carbon
monoxide and HC in the exhaust. In general, nitrogen oxide levels are inversely
proportional to carbon monoxide and HC levels, as shown in Fig. 12. High levels of
nitrogen oxide can be counteracted by some form of exhaust after treatment. Rich-burn
engines are limited in power because of the high exhaust temperatures and are less
efficient than lean-burn engines (Caterpillar 2007).
Fig. 12—NG engine emission production.
Lean-burn engines operate with large amounts of excess air drawn into the
combustion chamber. The quantity of air varies, but can be as much as two times the
0
25
50
75
100
0 25 50 75 100
% Tem
p
% g/bhp-‐hr
Emission Produc>on
NOx
CO + HC

50
quantity required to achieve stoichiometric combustion. This excess air absorbs heat and
lowers the combustion temperature and pressure. This reduction in temperature and
pressure lowers the levels of nitrogen oxide in the combustion stream, but also raises
carbon monoxide and HC levels because they are inversely related. The introduction of
inert exhaust gas into the combustion chamber through the use of an exhaust gas
recirculation (EGR) valve absorbs heat in the combustion process and lowers nitrogen
oxide levels, as does retarding the ignition timing. Lean-burn engines are generally more
efficient than their rich-burn counterparts. The lower combustion temperatures raise the
specific heat ratio, which increases expansion work and therefore efficiency (Caterpillar
2007).
Lean-burn engines come in two different varieties: open-chamber and enriched-
prechamber. Open-chamber engines ignite the fuel/air mixture with a spark plug located
directly in the combustion chamber. The use of a spark limits how lean the fuel/air
mixture can be by increasing the chance of predetonation or misfire as the mixture is
leaned out. Enriched-prechamber engines use a small secondary chamber that is ignited
at near-stoichiometric conditions as a high-energy ignition source used to ignite even
leaner mixtures (Caterpillar 2007).

51
Natural Gas Engine Solutions
Dedicated Spark-Ignited Reciprocating Internal Combustion Engine Natural Gas
Engines
Most major engine manufacturers manufacture dedicated NG SI RICEs for
various industrial uses. These are proven technologies with well-known performance
characteristics.
When compared with a dedicated diesel engine, NG engines exhibit different
properties in both fit and function:
For the comparable power output, an NG engine must be larger in both footprint
and displacement. The drilling rig we are examining for this study currently uses
12-cylinder 52-L diesel engines. To get a comparable output from an NG engine
would require a 16-cylinder 69-L engine. The footprint would increase from
approximately 108 to 160 ft2, an increase of approximately 30% (Caterpillar
2009, 2010b).
NG engines also do not react as quickly to transient loads. Most NG engines
control throttle by either a carburetor or some type of gas mixing valve or
assembly. Similar to diesel engines, a control system calls for an adjustment on
the throttle depending on an increase or decrease in engine load; however. unlike
a diesel where fuel is delivered directly in to combustion chamber for immediate
power production, the distance and volume between the throttle assembly and the
combustion chamber creates a time difference between when the engine requires
additional fuel and when it receives it. This time gap creates a lag in the engine’s

52
response time and causes the consequent voltage and frequency dip and
overshoot associated with transient load.
Transient loads vary in both size and duration. If the load change is small and
brought on slowly, the lag may not be noticeable; however, if the load change is large
and drastic, the associated frequency and voltage dip or overshoot could cause
operational problems. If large enough, it could trip the circuits offline and cause a rig
blackout. The engine performance and the demand must both be known and matched
properly to avoid performance problems (Caterpillar 2006b, 2009, 2010b).
The problems NG engines have when responding to rapid and severe transient
loads can be mitigated by a modern drilling rig in one of two ways, the first of these
being the use of a load bank. A load bank puts an artificial load on a genset and keeps
the engine working at a higher output when the rig requirements are low. As the rig
demand increases, the load bank sheds the load and transfers it to the rig. The load bank
is electronically controlled and can shed and accept load almost instantaneously.
Because the load bank can shed and take load quicker than the engine can respond, the
engine is prevented from having to ramp up and down as severely and reduces voltage
and frequency dip and overshoot. The ideal operating environment for an NG engine
with a load bank is with an induced constant load of approximately 60% (Hill et al.
2011). While this makes the engine operate more smoothly, it also makes the engine
work harder than necessary. The load bank dissipates the extra work as heat, and it is
lost. This greatly reduces the efficiency of the engine, but only during operations where
transient loads are high. When under a constant load, the load bank would not be

53
required, and the engine could be allowed to operate on its own (Caterpillar 2010a,
2006b, Hill et al. 2011).
A second method of mitigating slow response to transient load is directly with
the rig’s automation system. When the system senses voltage and frequency dip or
overshoot, it will slow down the load transfer to allow the engine time to respond. Going
a step further, if the rig demands a transient load that exceeds the output capacity of the
genset, the control system can be set to temporarily scale back the demand from other
systems to prevent a blackout. For example, when drilling and the draw-works are
suddenly engaged, which puts a sudden load on the genset, the automation system could
momentary slow down the mud pumps to reduce power demand and prevent the voltage
and frequency dip from becoming so sever as to black out a rig (Hill et al. 2011,
Personal communication 20111).
Bi-Fuel Technology
Bi-fuel technology works on a diesel platform and could be used to partially take
advantage of the low cost of NG while still maintaining the flexibility and performance
of a diesel engine. This could be offered as an addition to new rigs or as a retrofit to an
existing diesel fleet. Bi-fuel technology is an external bolt-on retrofit that does not
require any modification to the internal components of the diesel engine or its control
system.
1 With an automation engineer, Victory Rig Equipment, Nisku, Alberta

54
It allows diesel engines to operate on a mixture of both NG and diesel. It works
by introducing NG into the intake air stream prior to the turbocharger. It replaces a
percentage of the diesel consumed with an equivalent quantity of NG in gal diesel
equivalent. This mixture of air and NG are mixed with diesel in the engine’s combustion
chamber. The mixture is ignited by a diesel pilot when diesel is injected onto
compressed air/gas mixture the combustion chamber. The NG is burned along with the
diesel and provides the required power output to maintain speed and load with a reduced
quantity of diesel consumed (Altronic 2011).
The system allows for combustion of up to 70% NG in continuous low-load
situations; however, 50 to 60% is more typical. As the load demand on the engine
increases, the quantity of NG is reduced and diesel increases up to approximately 80% of
the continuous rating of the engine. Once this load demand is reached, the engine will
run on 100% diesel up to its full load rating. The engine can be automatically and
seamlessly switched between diesel and gas during partial- or full-load conditions while
maintaining current speed, power, and stability. Engine response to transient or block
loading on bi-fuel is equal to the performance on diesel operation (Altronic 2011).
The allowable percentage of NG injected is limited by several external factors in
addition to load, including ambient air temperature and fuel quality. The control system
regulates the NG flow depending on either the engine vacuum, as determined by a
manifold air pressure (MAP) sensor or directly as a function of the load. An exhaust gas
temperature (EGT) and knock sensor continuously monitor the engine and provide
primary control over the activation and deactivation of the bi-fuel system. Control of the

55
diesel metering is maintained by the original engine control system. It will continue to
operate normally to maintain a constant rpm by metering back the diesel injection while
NG levels are increased. Therefore, no interface is required between the engine control
system and the bi-fuel system (Altronic 2011).
In the combustion process, gas is injected downstream of the air filters and
upstream of the turbochargers, and the normal diesel CI sequence is followed. At the
highest possible fuel injection rate of 70%, the NG comprises only 3% of the total
volume of gas drawn into the intake. Methane possesses a lower explosive limit (LEL)
of 5%. The high auto-ignited temperature of the lean mixture prevents predetonation
from occurring (Altronic 2011).
Ideality, compatible fuel consists of pipeline-quality gas consisting of
approximately 97% methane or greater. Lower-quality gas such as wellhead or
associated gas may contain varying levels of other HC gasses such as ethane, propane, or
butane, as well as other compounds such as carbon dioxide and hydrogen sulfide (H2S).
Levels of these gases in the fuel change the heating value and properties of the gas and
could result in a reduction of engine performance or gas substitution rate. In extreme
cases, some field gases can contain less than 50% methane. This “hot gas” can possess
heating values much higher than pipeline-quality gas. Other contaminants, such as sulfur
and water, in the gas can result in the formation of acid and damage system components
(Altronic 2011).
The engine efficiency is unaffected by the use of the bi-fuel system. The primary
economic advantage is the difference in the cost of the fuel per Btu. If NG is relatively
56
inexpensive as compared with diesel, the economic advantage of a bi-fuel system is
high; however, as NG prices near diesel, the advantage of such a system diminish
proportionally (Altronic 2011).
In addition to reduced fuel costs, this system comes with many other advantages.
The burning of NG will reduce overall emissions; however, it will not eliminate the
after-treatment requirements brought on by the Tier 4 emission standards. It does not
have any adverse effects on engine longevity or maintenance intervals; in fact, because
of the cleaner burning of NG, it may extend the life of parts and increase engine oil
change intervals. Operationally, the most distinct advantage is the system’s ability to
maintain the diesel characteristics of response to transient loading. Another important
advantage is the system’s ability to run on 100% diesel should NG supplies be
unavailable or uneconomical in a particular area.
Major disadvantages to this system are that it does not affect the need to comply
with Tier 4 emission standards, and, as it still burns diesel in varying quantities, it does
not take full advantage of the lower cost of NG.
While this is a viable way to take advantage of some of the benefits of NG, the
specific performance data are not available for this system in this particular application.
With these limited data, a direct comparison cannot be made. More research into this
system is required.

57
Dual-Fuel Engines
Dual-fuel engines can operate on two different fuels, but unlike bi-fuel, they only
run on one fuel at a time. They include two different fuel systems and can switch
seamlessly between the two fuels. They are generally SI RICEs, but engines that run on
diesel as a primary fuel source are also available. Dual-fuel engines are typically offered
in light- to medium-duty applications and are more common in the automotive industry.
Turbines are also available in dual-fuel configurations and can be set up to run on two or
more fuels. Dual-fuel applications are out of the scope of this thesis and will not be
discussed further (Hill et al. 2011).
Natural Gas Sources, Transport, and Storage
Important considerations when using NG as a fuel source for drilling applications
are where to obtain sufficient quantities and then how to transport and store it. There are
several major sources that have been identified that could be utilized for a drilling
application. They are pipeline gas, field gas, and compressed NG/ liquid NG
(CNG/LNG). All possess the ability to be a viable fuel source; however, they are not
without their drawbacks and limitations. All sources of NG vary in quality and makeup.
Engine performance and emissions will vary with the gas makeup and impurities. In
cases where gas quality varies greatly, adjustments to the engines may become
necessary.

58
Pipeline Gas
If supply lines of treated gas are available nearby, it may be possible to lay a new
temporary line directly to the drilling pad. In this case, the gas will be dry and of a high
consistent quality. NG gensets could be easily connected to this pipeline and fueled
directly (Hill et al. 2011).
Whether this is feasible is dependent on several factors. First, the distance from
the NG source will have a direct impact on the cost of installing the line. Natural
obstructions, property rights, and permitting are all challenges that need to be considered
before laying new lines. If the path a pipeline would have to take is not direct, the length
of the line could be much longer than the straight-line distance between the two points.
Second is the number of wells at the final location. If a number of wells are being drilled
near each other, or in the case of pad drilling with multiple lateral wells being drilled off
the same location, the time and cost of laying a dedicated pipeline will be more
economical then if only one well is being drilled at that location. The greater the quantity
of wells being drilled in the area, the more economical the dedicated line will be.
Field Gas
In mature or developed fields, a sufficient pipeline network may be available to
tap into existing gathering lines. In this case, the gas quality may be low, but the
composition will be known and consistent. If the gas contains liquids or is of low
quality, onsite field processing may be an option. This is also the case for wellhead gas.

59
If pad drilling and completed wells are onsite, NG could be brought directly from the
wellhead to the engines through a field processing unit (Hill et al. 2011).
An example schematic of a field processing unit is shown in Fig. 13. From a
wellhead or gathering line, the gas is routed through a series of separators, dehydrators,
and filters to remove liquids and impurities until the gas is of a sufficient quality to be
sent to the engines (Hill et al. 2011).
If the field gas is available, it could be a viable fuel source; however, some
considerations must be kept in mind. First, the gas being produced from a field is subject
to a lease, and several separate parties will have a stake in the production. Royalty
agreements and tax laws would have to be honored to access the field gas. Any cost
savings seen from using this method may be counter-balanced by legal costs and delays
in writing new agreements to allow for field gas use. Also, the field separator will need
to be purchased and maintained. Should mechanical problems be encountered, a
redundant system may be required to prevent costly downtime. The additional cost
associated with the field processing my make the use of field gas unattractive.

60
Fig. 13—Field gas processing unit (Hill et al. 2011).
Compressed Natural Gas/Liquid Natural Gas
If for any of the reasons discussed above, pipeline or field gas is not available or
economical, NG can be trucked into a location in the form of CNG or LNG.
CNG can be trucked to site in trailer-mounted tanks that contain NG compressed
to approximately 3,500 psi and can hold up to 350 Mcf of gas. For the rig used in this
study, running with two gensets at 50% load, this is only approximately 20 hours worth
of fuel. When near idle with one generator, running this same tank could last nearly 3
days. When drilling operations are taking place, multiple tanks would be required onsite
with shipments arriving daily. When compared with a diesel storage tank, which will
only require filling once every 7 to 14 days, the additional shipping costs can become
significant. Diesel is also generally more readily available, and the distances traveled to
source it can be much smaller. As a consequence, diesel shipments can be made more
frequently and in smaller volumes (Hill et al. 2011).

61
LNG is shipped to site in trailer-mounted cryogenic tanks. Because the gas is
liquefied rather than simply being compressed as with CNG, each tank contains a much
larger quantity of NG. Under the same conditions as the CNG discussed above, a single
tank of LNG would last approximately 2 days. This helps to alleviate some of the
shipping constraints of CNG, but is still far from resembling diesel in shipping
frequency. The availability of LNG is also a concern as it is not as readily available as
CNG or diesel and could require long shipping distances and times (Hill et al. 2011).
The use of LNG also requires additional equipment. The cryogenic tanks require
a dedicated evaporator unit to convert the LNG to a low-pressure gas that can then be
delivered to the NG engines. As is the case with all mechanical equipment, mechanical
failure is always a concern; therefore, the need for a redundant system to reduce the risk
of downtime should be considered. All these items have an associated cost and take up
space on the drilling pad.
Both CNG and LNG are composed of consistent-quality refined gas with known
properties. The use of either of these systems would make set up and operation of the
NG gensets relatively simple and consistent. No field processing of gas or adjustments to
the engines would be required; however, the cost of the fuel associated with the
CNG/LNG solution on a per-Mcf basis would be significantly higher than with field gas.

62
Methodology
Data
The closest comparable NG engine in size and output to the diesels used on the
drilling rig is a Caterpillar® G3516. This is a 16-cylinder engine built on the same
platform as the Caterpillar 3512 diesel used on this drilling rig. The 3516 performance
data for power output versus fuel consumption was obtained from manufacturer data
sheets.
Procedure and Results
The data sheets only provide fuel consumption data in scf/hr at three points:
50%, 75%, and 100% load. To compare with the diesel engine, though, all data points
between idle and full load (25 to 100%) were required (Caterpillar 2009). To obtain
them, the points were plotted to create Fig. 14. A line was fitted to the data points, and
the equation of that line was determined. That equation was used to interpolate all points
between 25 and 100%.

63
Fig. 14—Fuel usage versus load for an NG engine.
As the line is not linear, the NG engine efficiency changes with the percent load.
The fuel rate was divided by the percent load and plotted to show how the fuel
consumption changes with changing load. The results are shown in Fig. 15.
y = 313.76x0.8708
0 2000 4000 6000 8000
10000 12000 14000 16000 18000 20000
25 35 45 55 65 75 85 95
scf/hr
% Load
Fuel use vs. % load

64
Fig. 15—NG engine efficiency.
Discussion
NG as a fuel is an abundant, clean, and cheap alternative to diesel. Utilizing NG
in a drilling application can help reduce emissions and fuel costs. Transportation and
storage can be challenging, but methods exist to make its use feasible. It can be sourced
from a variety of locations and can be burned by an assortment of engine configurations.
Operational challenges do exist with NG engines, such as their response to transient
load, but can be overcome with advancements in technology.
150
160
170
180
190
200
210
220
25 35 45 55 65 75 85 95
scf/hr/%
load
% Load
Efficiency

65
CHAPTER V
COMPARISON AND CONCLUSION
Methodology of the Comparison
The goal of this chapter is to compare a diesel engine with a dedicated NG
solution, in both ability and economic operation, in order to draw conclusions about the
advantages and disadvantages of utilizing the NG engine on drilling rigs. For a better
understanding of the scenario, a comparison of each variable analyzed will be discussed:
operational constraints, efficiency, and cost.
Operational Constraints and Benefits
Transient Response
Operationally, NG engines do not respond as well as diesel engines to transient
loads. When high transient loads are experienced, such as when tripping or back-
reaming, if the engine is not able to respond quickly, the voltage and frequency dip or
overshoot could become severe enough to black out a rig. While this can and does occur
with current diesel gensets, the risk of it occurring with an NG genset is much higher
because of its inherit lower torque and slower response times. This can be overcome
with advances in the rig automation system that slow the transfer of the load to the
genset to within acceptable levels. If required, the automation system can temporarily
transfer power from one component to another to allow the genset time to ramp up. An
example of this is when back-reaming: when the draw-works are engaged, a high

66
transient load is transferred to the genset, and if the automation system automatically
slows the mud pumps simultaneously, it will slow the load transfer to the genset and
allow the NG engine more time to respond. To put this into perspective, if the gensets
are sized correctly, the difference in response time between a diesel and a comparable
NG engine would be measured in seconds rather than minutes. While the idea of regular
rig blackouts is operationally unacceptable, the extra time required when ramping up an
NG engine would be almost negligible.
During most rig operations, these extra seconds would have only a minor impact
on time; however, it may have an adverse effect on trip times as these operations cycle
greatly in both power required and frequency. For the rig examined, tripping occurred at
intervals of approximately one stand every 2 minutes with an instantaneous power
increase from approximately 35 to 80% load. Over the span of an entire tripping
operation, this ramp-up time could have some effect on trip times; however, swab/surge
constraints as well as safety concerns also limit these times and could make this effect
negligible.
Another method of increasing an NG engine’s transient response is through the
use of a load bank. A load bank places a dedicated load on the generator, which is
converted to heat and dissipated. When rig power demand is low, the engine power
output is kept artificially high by the load bank. When the rig requires additional power,
the load bank sheds the load off itself to the rig. While the rig is getting the
instantaneous cyclical power it requires, the genset does not see the full transient load
and operates continuously at or near the high output required by the rig. The rig

67
automation system is able to shed and take on load from the load bank nearly
instantaneously, which alleviates the need for the engine to respond as quickly.
While the use of a load bank greatly reduces the effect of an NG engine’s
transient response, it comes at the expense of efficiency. In this application, the engine
continuously operates at a high power output to accommodate the load put on it by the
load bank. This additional energy produced is converted to heat by the load bank and
lost. The effect is that the genset produces much more power than necessary to perform
the operation, and this energy is never recovered. It is likely, however, that the use of a
load bank would only be required during tripping operations because of the high
transient load associated with this operation. With only11% of the total rig time being
used for tripping, this loss in efficiency would only be incurred during that time interval,
which would not contribute significantly to the total fuel consumed for the NG engine.
Overall, while the transient response of an NG engine is substantially lower than
a diesel engine, technology available on modern land drilling rigs have made it possible
to overcome this obstacle. While technology cannot eliminate it completely, it can be
mitigated such that it does not significantly hinder rig performance.
Fuel Storage and Transport
From a transport and storage standpoint, diesel is a much more practical fuel
source. It is easy to transport by truck and can be stored onsite in normally pressurized
tanks. NG requires either a fuel source nearby, such as a wellhead or pipeline, or that the
NG be transported and stored as CNG or LNG. CNG requires the presence of highly

68
pressurized vessels onsite and requires space for the storage of multiple tanks. LNG
requires the presence of cryogenic tanks and evaporators. The amount of room required
per Mcf is much smaller with CNG than with LNG, but is still far greater than with
diesel tanks. Both CNG and LNG are not as widely available as diesel, which may make
logistics and transportation more difficult and costly.
Emissions and Regulation
Burning NG is more environmentally friendly than burning diesel. NG emits the
smallest amount of CO2 per unit of energy and far fewer other air pollutants that
contribute to atmospheric and public health damage than any other HC fuel. It does not
completely eliminate harmful emissions; however, it does greatly reduce them. It is this
property of NG that causes it to fall under different legislation and, in some cases, even
be exempted from certain air quality regulations.
From the standpoint of emissions and regulation compliance, NG is clearly
superior to diesel; however, there are still challenges associated with regulation
compliance that the industry needs addressed. Major engine manufactures are yet to
certify their NG engines to the mobile nonroad standards. Without these certifications,
the permitting process may be more difficult if not impossible. Also, as previously
discussed, the exemptions purposely built for NG engines cannot be taken advantage of
until Tier 4 Final–compliant diesel engines are available for distribution.

69
Engine Efficiency
In the previous chapters, the performance characteristics of both diesel engines
and NG engines were determined. The fuel usage for the diesel engine to drill a sample
well was empirically measured and used to determine the actual efficiency of the diesel
engines as used on a rig under field conditions. The resultant graph was presented in Fig.
6. A similar graph was created for the NG engine using manufacturer data and is shown
in Fig. 12.
Because diesel is in a liquid form, the fuel usage for a diesel engine is in gal/hr.
For an NG engine, the NG is in a gaseous state, and fuel usage is measured in scf. To
make a direct comparison of the two, the fuel usage units must first be converted to
common units. Both diesel and NG can be converted to Btu, and this unit will be used
for the final comparison.
One gallon of diesel contains 129,500 Btu; therefore, multiplying each point on
the graph in Fig. 6 in gal/hr/percent load by 129,500 Btu/gal yields Btu/hr/percent load.
The resultant graph is shown in Fig. 16.

70
Fig. 16—Diesel engine efficiency in Btu.
The process was repeated for the NG engine, and a similar graph was created for
the NG engine shown in Fig. 12. One scf of processed NG contains approximately 1,000
Btu; therefore, multiplying each point on the graph in Fig. 17 in scf/percent load by
1,000 Btu/scf yields Btu/hr/percent load.
0 10000 20000 30000 40000 50000 60000 70000 80000 90000
100000
0 20 40 60 80 100
btu/hr/%
Loa
d
% Load
Diesel Engine Efficiency

71
Fig. 17 – NG engine efficiency in Btu.
Once in the same form, the efficiencies of the two engines can be compared on a
per-percent-load basis. Unfortunately, the engines are not identical in output and
therefore, the identical percent load for each engine represents a slightly different power
output. In this case, the maximum electrical output capacity for the NG engine is larger
than the diesel. The equivalent electrical kilowatt (ekW) output for each percent load
was calculated for the diesel engine by dividing the maximum engine output by the
percent load. The ekW was divided by each percent load and multiplied by the
previously determined Btu /hr/percent load to yield Btu/hr/ekW. The process was
repeated for the NG engine. The results for both engine types are graphed on Fig. 18.
150
50150
100150
150150
200150
250150
25 35 45 55 65 75 85 95
btu/hr/%
load
% Load
NG Engine Efficiency

72
Fig. 18—Diesel and NG engine efficiency in Btu versus ekW.
Fig. 18 shows the diesel engine being more efficient at lower power demand than
at the upper limits of its operation. The NG engine, on the other hand, has the opposite
performance curve characteristics: as the load increases, the efficiency increases. This is
to be expected as they are both known properties of each type of engine. This can be
restated in this manner: as the load increases on a genset, if the prime mover is an NG
engine, the efficiency will increase, but if the prime mover is diesel engine, the
efficiency will decrease.
What must be noted, however, is the gap between the two performance curves.
Regardless of where on the curve each engine is performing, the curves never intersect.
Even at its most efficient point, the NG engine will never operate as efficiently as the
diesel engine.
0
2000
4000
6000
8000
10000
12000
14000
0 500 1000 1500 2000
btu/hr/ekW
ekW
Fuel Use vs. ekW
NG
Diesel

73
Fuel Usage
With both the diesel engine and NG engine performance calculated and graphed,
a comparison can be made between the total energy consumed to drill this well with the
diesel engine and an estimate of the energy consumed to drill the same well with an NG
engine. Again, because the fuel types are different and the engine efficiencies vary, each
will be converted to Btu before a comparison is made.
To calculate the Btu consumed with the diesel engine, the hours at each percent
load are multiplied by the fuel rate to yield gallons of diesel at each percent load point.
These are summed to give total gallons of diesel consumed and then multiplied by
129,500 Btu/gal of diesel to determine total Btu consumed to drill the well. The results
show that 26,105 gal of diesel was consumed during the drilling of this well, which
equates to approximately 3.38 billion Btu.
The process to calculate the estimated Btu required for the NG engine to drill the
same well was a very similar process; however, the fuel consumption in scf for an
equivalent diesel power output in ekW needs to be determined before an estimated fuel
total can be reached.
Using previously calculated data, a plot was created of the NG engine’s fuel rate
in scf/hr versus ekW output. A line-fit was performed on this curve, resulting in the
equation y = 26.197x.8708. This equation was then used to calculate the fuel rate in scf/hr
of the NG engine at each of the diesel engine’s percent load points by substituting the
power output of the diesel engine in ekW for each percent load point. With this
information, the fuel rate of the NG engine at each of the diesel engine’s percent load
74
points was multiplied by the time the diesel engine spent at that load, and the associated
scf consumed was acquired. These quintiles were summed and multiplied by 1,000
Btu/scf of NG, and the total estimated Btu required to drill the same well with the NG
engine was obtained. The results show that to drill the same well with an NG engine,
approximately 6.34 million scf (6336 MMcf) of NG would be consumed during the
drilling of this well, which equates to approximately 6.36 billion Btu.
The difference in efficiency discussed in the previous section has a direct effect
on the difference in Btu required to drill this well. As shown in Fig. 4, for the majority of
the time drilling the well, the generators were operating between 30 and 55% load. This
represents the area on Fig. 18 between 400 and 750 ekW. When operating in this range,
the two graphs are diverging and are nearing their farthest points from each other. As
the lines diverge, the difference in efficiency between the diesel and NG increases. This
is a contributing factor to the NG engine requiring nearly twice as much energy or Btu to
drill the same well as the diesel.
Economic Analysis
The question then becomes, can this gap in total Btu consumed be bridged with
dollars? Even though the NG engine requires more thermal energy to generate the same
amount of power, the price gap between NG and diesel per Btu may make the NG more
economical to operate from a fuel consumption perspective.
Diesel engines are more efficient on a per-Btu basis than their NG counterparts,
as was shown in the previous section. However, because of the low price per Btu of NG,

75
the gap in efficiency can be easily closed as NG prices drop. Despite their higher first
cost, the clean burning properties of NG engines also add to economic benefit because
they do not require additional after-treatment in the exhaust system to pass Tier 4
emissions standards.
Table 9 shows the comparison of cost of ownership between the NG and diesel
engines over a genset’s expected life span of 60,000 hours. The estimated purchase price
of the NG engine is approximately 60,000 USD, or 15% larger than the equivalent diesel
and is an upfront cost.
TABLE 9—ECONOMIC COMPARISON
Type
First cost
(USD)
Maintenance
(USD)
Emissions
equipment
(USD)
Operation
(USD) Total (USD)
Diesel 1,200,000 1,650,000 420,000 6,213,645 9,483,645
NG 1,380,000 690,000 0 2,898,551 4,968,551
Bi-fuel 1,350,000 1,650,000 420,000 4,549,780 7,969,780
Regular scheduled maintenance cost is spread over the life of the engine and
consists mainly of valve adjustments, cylinder head rebuilds, and one complete overhaul.
The overhaul cost for the diesel is much higher, mainly because of the necessary
replacement of parts of the fuel system including fuel injectors. These are costly items
that are not utilized in an NG engine fuel system, and therefore are not included in an
NG engine overhaul. Even though the NG engine is larger and has more cylinders, the
overhaul of the NG engine requires fewer and less expensive parts to be replaced, and

76
therefore the total cost of maintenance over the lifespan of the NG engine is substantially
lower. Another advantage of the NG engine is that is burns cleaner than a diesel, which
can increase the time interval between oil changes when the oil is monitored and tested.
The oil changes comprise a much smaller portion of the overall cost of maintenance, but
do have an effect on cost over the lifespan of the engine.
Although not currently required, when Tier 4 Final takes effect, exhaust after-
treatment will be required on all non-road diesel engines. While these systems are
currently available as aftermarket additions, the original equipment manufacturers will
be responsible for furnishing and installing these systems. The additional emissions
equipment is expected to increase the purchase price of diesel engines by approximately
30 to 40%, but NG engines do not require these emission controls.
Over the life of a genset, the operational cost, consisting of fuel consumption, is
by far the largest constituent of the total cost of ownership. For comparison purposes, the
calculated values were used for the diesel consumed and NG required for the same
operation.
The calculated value for the energy consumed while drilling this well is
approximately 3.4 billion Btu for the diesel engine and 6.3 billion Btu for the NG
engine. This shows that on a per-Btu basis, the NG engine requires much more energy to
deliver the same results. These numbers converted to gallons of gasoline equivalent
(GGE) are 29,654 GGE for diesel and 55,576 GGE for NG. Based on the price of
commercial #2 diesel at 2.60 USD/gal and the price of NG at 4.50 USD/Mcf (United
States Energy Information Administration 2011), the calculated fuel cost of drilling this

77
well is approximately 68,000 USD in diesel, and the calculated cost for NG is 31,000
USD.
If wells similar to the well examined in this study are to be repeatedly drilled for
the full 60,000-hour expected engine lifespan, the cost to the owner would be
approximately 7.3 million USD for a diesel genset, but only 3.6 million USD for the NG
equivalent. This number does not take rig move times into account, which would add
several days per well to the “other” category discussed earlier, but it shouldn’t have a
substantial effect on the overall cost of operation.
The first cost favors the diesel engine by approximately 60,000 USD per genset;
however, once emissions equipment is added, the NG engine becomes lower in first cost
by nearly 80,000 USD. After operating the rig for approximately 7 years (the estimated
lifespan of a genset), the difference in total cost of ownership between equivalent
gensets is approximately 4 million USD in favor of the NG engine.
It should be noted that the bi-fuel option presented in Chapter II is a means of
partially taking advantage of the economic benefit of NG without compromising the
flexibility and performance of diesel. If it can be assumed that the NG content of the Btu
consumed from 25% load (idle) to 80% load on the diesel engine varies linearly from
70% NG at idle to 0% NG at the top end above 80% load, the relative economic impact
of the bi-fuel system is shown in Table 9. A graphical representation of the fuel mixture
throughout the load range is shown in Fig. 19.

78
Fig. 19—Bi-fuel NG versus diesel fuel mix.
Because the bi-fuel system is installed on a diesel platform, it will increase the
first cost, but the remaining maintenance and emission equipment costs will remain
relatively consistent. The maintenance costs may actually decrease because of the
reduced wear and tear as an effect of burning NG, but this will need to be assessed on a
case-by-case basis and is not taken into account in the economic analysis. Compliance
with Tier 4 emission standards will still be necessary and therefore, all the after-
treatment equipment will be required.
Because the thermal efficiency of the diesel engine is not affected, the total Btu
consumed with the bi-fuel system is the same as with the diesel engine. When
accounting for the time the engine operates at each load point when drilling this well and
the corresponding quantity of NG substituted for diesel, the operational cost equates to a
diesel fuel savings of nearly 1.7 million USD over the same 60,000-hour period. This
0
20
40
60
80
100
0 20 40 60 80 100
% Fue
l
% Load
NG vs Diesel Fuel Mix
NG
Diesel

79
solution, however, is still subject to fuel price fluctuations and the issues discussed
earlier with transport and storage of NG without taking full advantage of the economic
advantages. Also, the assumptions made may not hold true when tested under field
conditions. For this reason, further research with empirical data is required to make an
effective direct comparison with the dedicated diesel and NG solutions presented here.
The economics are very price sensitive and are based on current market prices for
both diesel and refined NG. These are both commodities, and the prices of each are
subject to independent and volatile price fluctuations, which can severely affect the
economics if this application. If diesel prices were to remain constant, the price of NG
could increase to 1.22 USD GGE before it became uneconomical compared with diesel
over the life of an engine. It must be noted that the pricing data do not take external
factors into account that are associated with the sources of the fuel, such as transport and
equipment. These will be site-specific and must be factored in on a case-by-case basis.
If field gas is used, the purchase price will vary, as will the cost of field treatment
if required. If the CNG/LNG option is used, additional transport costs could be incurred,
as well as equipment purchase or rental. If a temporary pipeline is required, the cost of
installation will also have an effect on the onsite fuel costs. Transport can also have an
effect on diesel if the source of fuel is far or difficult to transport. All these factors need
to be considered before a decision on fuel type is made.

80
Discussion
Recommendations
In situations where NG is readily available and can be delivered to site at or near
current market prices, NG engines should be utilized because of the cost savings and
reduced environmental impact. In all other cases, particularly where transport costs may
encroach on the cost benefit, it may still be better to continue using diesel engines to
power drilling rigs because of the operational ease of use.
Limitations
While this study analyzed major characteristics of two source engines, one must
note that the NG engine data were taken from manufacturer data, which were most likely
measured under laboratory conditions and not in a real-world application like the diesel
engine rig data. However, because there are no field data available for NG-powered rigs,
an estimate of its feasibility based on a comparison with a diesel-powered rig drilling a
real well in the field is relevant.
Conclusions
The purpose of this study is to determine whether NG can be utilized as a viable
fuel source for modern land based drilling rig. Based on analysis of the operational
constraints and economic impact, I conclude that given the right economic environment,
NG-powered drilling rigs can be very beneficial to the industry. Obviously, further
studies with actual field results are needed.

81
REFERENCES
Altronic. 2011. GTI Bi-Fuel Systems for Heavy-Duty Diesel Engines, www.gti-
altronic.com (accessed 10 July 2011).
Busch, A., Suzer, G., and Diesel, R. 1913. The Diesel Engine. St. Louis, Missouri:
Diesel Engine Company (Busch-Sulzer Bros.).
Caterpillar. 2006a. Application and Installation Guide: Petroleum Applications.
Document LEBW4995-00, Columbia, South Carolina.
Caterpillar, 2006b. Application and Installation Guide: Petroleum Diesel Engine
Selection, Ratings & Configurations (3600, C175, 3500, C32, 3400, C18, C12,
C9, C7). Document LEBW4996-00, Columbia, South Carolina.
Caterpillar. 2007. Application and Installation Guide: Gas Engine Emissions (C3600,
G3500, G3400, G3300). Document LEBW4984-01, Columbia, South Carolina.
Caterpillar. 2009. Gas Generator Set. Document LEHE0024-00, Columbia, South
Carolina.
Caterpillar. 2010a. Application and Installation Guide: Gas Engine Power for Drilling.
Columbia, South Carolina.
Caterpillar, 2010b. Diesel Generator Set. Document 16297657, Columbia, South
Carolina.
Hill, D.G., Johnson, J., Bell, J., Mayer, N., Giberson, H., Hessler, R., and Matthews, W.
2011. Natural Gas as a Fuel in Drilling Operations - Analysis, Testing and
Implementation. Paper SPE 140357 presented at the SPE/IADC Drilling

82
Conference and Exhibition, Amsterdam, The Netherlands, 1–3 March. doi:
10.2118/140357-MS.
National Archives and Records Administration. 1999. Code of Federal Regulations –
Money and Finance: Treasury. http://www.archives.gov/federalregister/
tutorial/060.pdf (accessed 12 July 2011).
National Archives and Records Administration. 2011. Electronic Code of Federal
Regulations – Title 40: Protection of Environment, http://ecfr.gpoaccess.gov/cgi/t
/text/textidx?sid=6cc0cb9cffcc09fefcd470317869e7b9&c=ecfr&tpl=/ecfrbrowse/
Title40/40tab_02.tpl (accessed 12 July 2011).
Solar Turbines. 2009. Centaur 40 Gas Turbine and Generator Set: Oil and Gas
Applications. San Diego, California.
Takaishi, T., Numata, A., Nakano, R., and Sakaguchi, K. 2008. Approach to High
Efficiency Diesel and Gas Engines. Mitsubishi Heavy Industries Technical
Review 45 (1): 21–24.
United States Department of Energy. 2003. Just the Basics: Diesel Engine.
http://www1.eere.energy.gov/vehiclesandfuels/pdfs/basics/jtb_diesel_engine.pdf
(accessed 11 July 2011).
United States Energy Information Administration. 2011. US Energy Information
Administration. http://www.eia.gov/ (accessed 10 July 2011).
United States Environmental Protection Agency (EPA). 2011a. Summary of the Clean
Air Act. http://www.epa.gov/regulations/laws/caa.html (accessed March 2011).

83
United States Environmental Protection Agency (EPA). 2011b. Our Mission and What
We Do. http://www.epa.gov/aboutepa/whatwedo.html (accessed June 2011).
Witherspoon, L. 2008. SoloNOxTM Products: Emissions in Non-SoLoNOx Modes.
Product information letter 167, Revision 3a, Solar Turbines Incorporated, San
Diego, California (September 2008).
Witherspoon, L. 2011. Available SoloNOx Emissions Options New Equipment – Natural
Gas. Product information letter 233, Solar Turbines Incorporated, San Diego,
California (February 2011).

84
VITA
Name: Andrew Howard Nunn Address: Richardson Building, Room 401 Texas A&M University College Station, Texas 77843-4243 Email Address: [email protected] Education: B.S., Mechanical Engineering Technology, Oregon Institute of
Technology, 2000