Embed Size (px)
Citation preview
A Thesis Proposal on
STUDY ON NUTRITIONAL STATUS OF 6 MONTHS TO 59 MONTHS CHILDREN IN
PANCHGACHHI VDC AND FACTORS ASSOCIATED WITH IT
Submitted by: - Submitted to:-
Milan Dhakal Department of Nutrition and Dietetics
BND 4th
Year Central Campus of Technology
Roll no: - 07/067 Tribhuvan University
2
Proposal for a Bachelor Thesis
Attached is a proposal that I, Milan Dhakal submit for approval for partial fulfillment of
the requirements for a Bachelor degree in Nutrition and Dietetics.
Thesis Title:
STUDY ON NUTRITIONAL STATUS OF 6 MONTHS TO 59 MONTHS CHILDREN IN
PANCHGACHHI VDC AND FACTORS ASSOCIATED WITH IT
Approved by:-
…………………………………….
Shyam K. Mishra
Committee Chairperson
Date:

3
1. INTRODUCTION
1.1 Background to the study
Adequate Nutrition is the fundamental right of every human being. Poor nutrition is cited
as the major factor in more than half of all child deaths in Nepal - a significantly higher
proportion than those claimed by other infectious diseases. Malnutrition is not just a stark
manifestation of poverty, it is also the ‗non-income face of poverty‘ and it helps
perpetuate poverty (World Bank Report, 2012). Nutritional status is defined as the
condition of the body resulting from the intake, absorption and utilization of food. It is
determined by a complex interaction between internal/constitutional factors and external
environmental factors: Internal or constitutional factors like: age, sex, nutrition, behavior,
physical activity and diseases. External environmental factors like: food safety, cultural,
social and economic circumstances (Joshi et al, 2011).
Nepal is one of the least developed nations in South-East Asia Region (SEAR), which
was ranked 157among 187 countries in the Human Development Index (UNDP 2012).
According to 2011 census, the total population of Nepal is 26.6 million. More than 83%
of population resides in rural area. The infant and under five mortality rates are 64.2 and
91 per 1000 respectively. The population growth rate in 2011 is 1.41 %( NDHS 2011).
Panchgachhi VDC lies in Terai region and is located about 9Km south of Mahendra
highway on the bank of Kankai river. This VDC consists of people of different ethnic
group and different economic status. Mostly Rajbanshi, Tajpuriya, Musahar resides here
along with Brahmin, Chettri, Rai, Limbu etc. The major occupation of the place is
agriculture. But nowadays most of the people are dependent on remittance and also large
number of population work as labour in agriculture and construction. There are 2278
households, 12,301 total population and 959 children below five year of age.
(Panchgachhi VDC office)
1.2 Problem of statement and justification
Malnutrition refers to a pathological state resulting from a relative or absolute deficiency
or excess of one or more essential nutrients. It is a state of nutrition where the weight for
age, height for age and weight for height indices are below -2 Z-score of the NCHS
reference.
Malnutrition continues to be a major public health problem in developing countries. It is
the most important risk factor for the burden of disease causing about 300, 000 deaths per
year directly and indirectly responsible for more than half of all deaths in children [4].
Health and physical consequences of prolonged states of malnourishment among children
are: delay in their physical growth and motor development; lower intellectual quotient
(IQ), greater behavioral problems and deficient social skills; susceptibility to contracting
diseases [5]. Major types of nutritional problems in developing countries are under-
nutrition and nutritional disorders which are resulting from inadequate food intake both in
4
quality and quantity, particularly of calories, proteins, vitamins and minerals; and
parasitic infection and disease (6).
Malnutrition remains a serious obstacle to child survival, growth and development in
Nepal. Prevalence of malnutrition among under five children is high with 48.6% in the
country. Protein-energy malnutrition (PEM) and micronutrient deficiency are most
common types of malnutrition (7). In Nepal, 11 percent of children are wasted and 3
percent are severely wasted. Children whose weight-for-age is below minus two standard
deviations from the median of the reference population are considered underweight. The
measure reflects the effects of both acute and chronic under nutrition. Nearly three in ten
children (29 percent) are underweight and 8 percent are severely underweight (NDHS,
2011).Nepal suffers from extensive malnutrition, ranking in the top 10 countries with the
highest prevalence of stunting (less than -2 SD scores) (UNICEF 2009).
The prevalence of malnutrition imposes significant costs on the Nepalese economy as
well as society. The high mortality due to malnutrition leads to the loss of the economic
potential of the child .It affects children in many ways, predisposing them to different
infectious diseases, psychosocial maldevelopment, and cognitive deficiencies.
Therefore, this study is designed to assess the prevalence of malnutrition and associated
factors among children aged 6-59 months which can be used as a reference in priority
setting and designing effective nutritional programs at Panchgachhi VDC.
1.3 Purpose of the study
a) To find out magnitude and distribution of malnutrition.
b) To analyze the causes of malnutrition and the factors that are directly or indirectly
associated with the nutritional status.
c) To suggest corrective measures so that which could be intervened in order to
uplift current nutritional status.
d) To create ideas that will contribute to improve poor nutritional status of children
in accordance to their socio-economic status, religion, culture, livelihood etc.
e) To provide necessary information for the policy makers in the field of food and
nutrition.
f) To provide information regarding the nutritional situation of children below 5
year of age, to the governmental as well as non-governmental organization to
initiate steps to eradicate the problem.
g) To act as helpful guide for planning appropriate nutritional program in that
particular place.
1.4 Objectives of the study
1.4.1 General Objective
The main objective of this thesis work is to assess the nutritional status of children
between 6 – 60 months age, also to assess and analyze the factors that are directly
5
and indirectly associated with nutritional status and suggest appropriate measure
against the problem assessed in that area.
1.4.2 Specific Objectives
a) To determine the nutritional status of children aged 6-59 months at
Panchgachhi VDC.
b) To identify associated factors of malnutrition among children aged 6-59
months at Panchgachhi VDC.
1.5 Research Questions
a) What are the underlying factors that are associated with malnutrition on the children of
particular age group residing in these living areas and what parameters are responsible to
induce low food availability in household level to cause malnutrition in child.
1.6 Significance
The findings of the study will be helpful to
a) Encourage local people to improve current nutritional status by improving
feeding pattern and habit of children, pregnant and lactating women.
b) Serve as helpful guide to plan suitable nutritional and health programs for this
community based on the facts and figures discovered from this study.
c) Provide information to government and voluntary institution like NGOs and
INGOs about nutritional status as well as different demographic factors.
d) Encourage government and other stake holders for the development of
programs and policies related to nutrition.
e) Discover the problems related to nutrition, care practices and feeding behavior
of this community.
f) Act as tool to reflect sanitary condition, socio-economic variables, degree and
types of malnutrition and condition of 6 to 60 months age group child.
g) Identify individual or group of people who are at risk of being malnourished
and who need special care and attention.
1.7 Scope of the study
The scope of the study done will be supporting and informing policy dialogue, strengthen
knowledge and support policy development to implement intervention programs for the
improvement of nutritional status of said age group children. This study will be able to
categorize the severity of different form of malnutrition that had habitat in children. The
study of nutritional status in society give the real image of condition of household
occurrence of at national level and help to introduce intervention to uplift their status as
healthy living. It is the study which generate the level of education on health, hygiene,
sanitation, occupation, living standard, pattern care of children feeding , knowledge in
food habit food consumption situation in particular moment. Nutritional status related
survey is one of the best method to interact directly with people and most applicable
method to bring out change in the faulty living practices.
6
1.8 Limitations
a) Instrumental and personal errors may arise while measuring and recording
anthropometric data.
b) Difficulties may be encountered in assessing socio-economic information like
family income, family property, expenditure on food and non-food items, food
consumption pattern etc. as they are considered to be related with the family
prestige.
c) Correct age or birth date of child may not be obtained in some illiterate families
and some tribal groups.
d) Uneven floor surface for weight and height measurement and other
circumstances for measuring weight and height might cause error.
e) Problem may arise in measuring mid upper arm circumference.
1.9 Assumptions
It is assumed that majority of children under five year of age in Panchgachhi VDC are
malnourished. The causes of malnutrition are assumed to be low economic status of
family, low education of parents, unhygienic care practices, infectious diseases, improper
feeding practices, discontinued breast feeding etc.
2. LITERATURE REVIEW
2.1. Nutritional Status
Nutrition has been defined as the food at work in the body. Nutrition includes everything
that happens to food from the time it is eaten until it is used for various functions in the
body (Srilakshmi 2002).Nutrition is a core pillar of human development and concrete
large scale programming not only can reduce the burden of under nutrition and
deprivation but also advances the progress of nations (Medical Gazzette, 2012)
Nutritional status is the state of our body as a result of the foods consumed and their use
by the body. Nutritional status can be good, fair or poor (Mudambi et al, 2012)
Currently, the infant mortality rate in Nepal is 46 deaths per 1,000 live births for the five
year period before the survey, just two deaths below the infant mortality reported in 2006.
Under-five mortality is 54 deaths per 1,000 live births, down from 61 deaths per 1,000 in
2006. Mortality rates are much higher in rural than urban areas. For example, infant
mortality is 55 deaths per 1,000 live births in rural areas compared to only 38 in urban
areas. According to the 2011 NDHS, 87% of Nepalese children age 12–23 months have
received all recommended vaccines—one dose each of BCG and measles and three doses
each of DPT and polio. Only 3% of children did not receive any of the recommended
vaccines. Almost half (46%) of Nepalese children age 6-59 months are anemic. Eighteen
percent of children have moderate anemia, and 1% are severely anemic. More than 70%
of children age 6-17 months are anemic compared with 25% of children age 48- 59
months. Vitamin A, which prevents blindness and infection, is particularly important for
children and new mothers. In the 24 hours before the survey, 47% of children age 6–23
7
months ate fruits and vegetables rich in vitamin A. Nine in ten children age 6–59 months
received a vitamin A supplement (NDHS key findings, 2011)
According to the WHO, in 2011 over 101 million children under the age of 5 were
underweight (low weight for age), 165 million were stunted (low height for age), and
approximately 52 million were wasted (low weight for height)
2.1.1.1. Factors affecting nutritional status
The factors affecting nutritional status are mother‘s food security, breast feeding
practices, types of food given to young children, feeding frequency, status of women and
child nutrition and last but not the least who feeds the child and how the child eats
(NMICS, 2010).
There are many other factors that influence the nutritional status some of which are food
availability and its distribution system, consumption of food, income source and
purchasing power, family size, illiteracy, sociocultural and religious belief,
environmental sanitation and health facility.
2.1.1.2. Food Availability and Nutritional Status
Food is not just something to eat; it is an integral part of culture of a community, region,
or nation. Food is a relative concept. Good health depends on an adequate food supply
and this in turn on sound agricultural policy and a good system of food distribution (Adel
P.den Hartog et al, 2006)
For the achievement of nutrition adequacy, increased production of food groups making
the national diet balanced is one of the most important measures. Adverse consequences
are manifested themselves if the national diet are deficient in nutrients. Vitamin A
deficiency followed by iron deficiency, blindness among children, PEM and so on which
could be overcome by supplying or consuming diets rich in these nutrients (Gyawali,
Rajiv 2002)
2.2. Nutritional Requirements
Nutritional Requirements refers to the amount of food, energy and nutrient needed on an
average per day by specific group and sex categories to meet the needs of healthy
individuals for normal functioning of the body for work and growth (Burk, 1984).The
energy supplies seem to occur important in those developing countries where the staple
commodities are either very low in protein content or the protein is of very low quality.
Most of the people of developing countries depend upon starchy food and derived their
80% of total calories from them. The people of those country are able to obtain about
87% of calorie intake and 79% of gross protein intake and they receive only 6.4% of their
8
calories and 8.9% of their protein from the consumption of meat, egg, milk and milk fats
combined ( Yadav DK,1994).
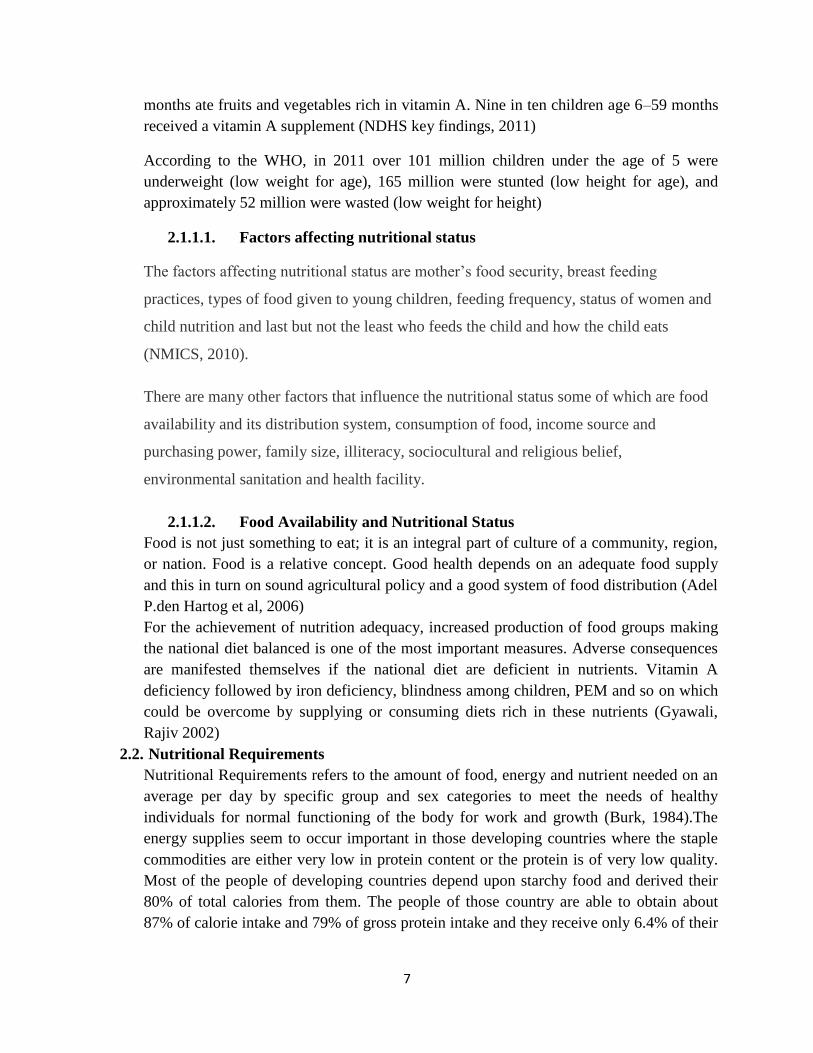
The recommended daily allowance (RDA) of nutrients for preschool children (1-5 years
is shown in table below :
Fig:- Table no.1 RDA of preschoolers. (Srilakhsmi B, 2011)
2.3. Nutrition, Health promotion and Human Development
Nutrition and health education has been defined as educational measures for including
desirable behavioural changes for the ultimate improvement in the nutritional and health
status of individual. This is one of the most commonly implemented measures, not only of
the health sector, but of other sector concerned with development of human resources.
Growth is influenced by nutrition. Frequent attacks of infectious diseases affect their
growth and increase the requirements of various nutrients. (Srilakhsmi B 2011)
NUTRIENTS
YEARS
1-3 4-6
Calories (Kcal)
Protein (g)
Fat(g)
Calcium(mg)
Iron(mg)
Vitamin A( µg)
Thiamine(mg)
Riboflavin(mg)
Nicotinic acid(mg)
Pyridoxine(mg)
Ascorbic acid(mg)
Folic acid(µg)
Vitamin B12(µg)
1240
22
25
400
12
400
0.6
0.7
8
0.9
40
30
0.2-1
1690
30
25
400
18
400
0.9
1.0
11
0.9
40
40
0.2-1
9
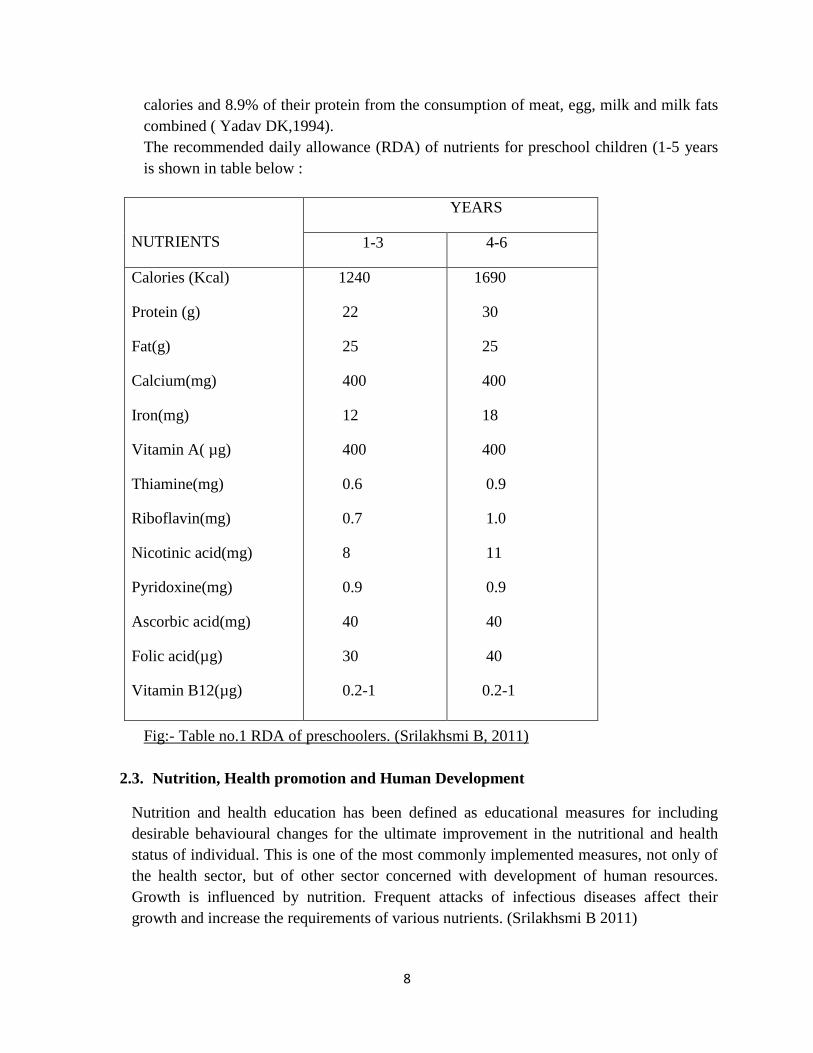
As we know nutritional status of individual has direct impact upon ones development and as
a whole on the productivity too. It is hampered because of under nutrition and good nutrition
is not possible with low productivity as it results in low living standard. Thus the developing
and under developed countries generally have a vicious cycle of poverty resulting in
malnutrition (Dahal P 2002)
Fig: 1.1 The vicious cycle of poverty
(Source: National Nutrition Policy Government of India, Department of Women and child
Development, Ministry of Human resource Development, New Delhi, 1993.)
2.4. Malnutrition
Nepal suffers from extensive malnutrition, ranking in the top 10 countries with the
highest prevalence of stunting (less than -2 SD scores) and the top 20 countries by
number of stunted children less than five years of age worldwide (UNICEF, 2009).
When the person is not getting enough food or not getting the right sort of food,
malnutrition is just around the corner. Even if people get enough to eat, they will become
malnourished if the food they eat does not provide the proper amount of micronutrient-
vitamins and minerals-to meet the daily nutritional requirement (UN‘s WFP).
Undernutrition Repeated
Nutrition related
diseases
Stunted development of Children and growth
faltering
Small body Size of
adults
Impaired productivity
Low earning capacity
Poverty
Low intake of food and
nutrients
10
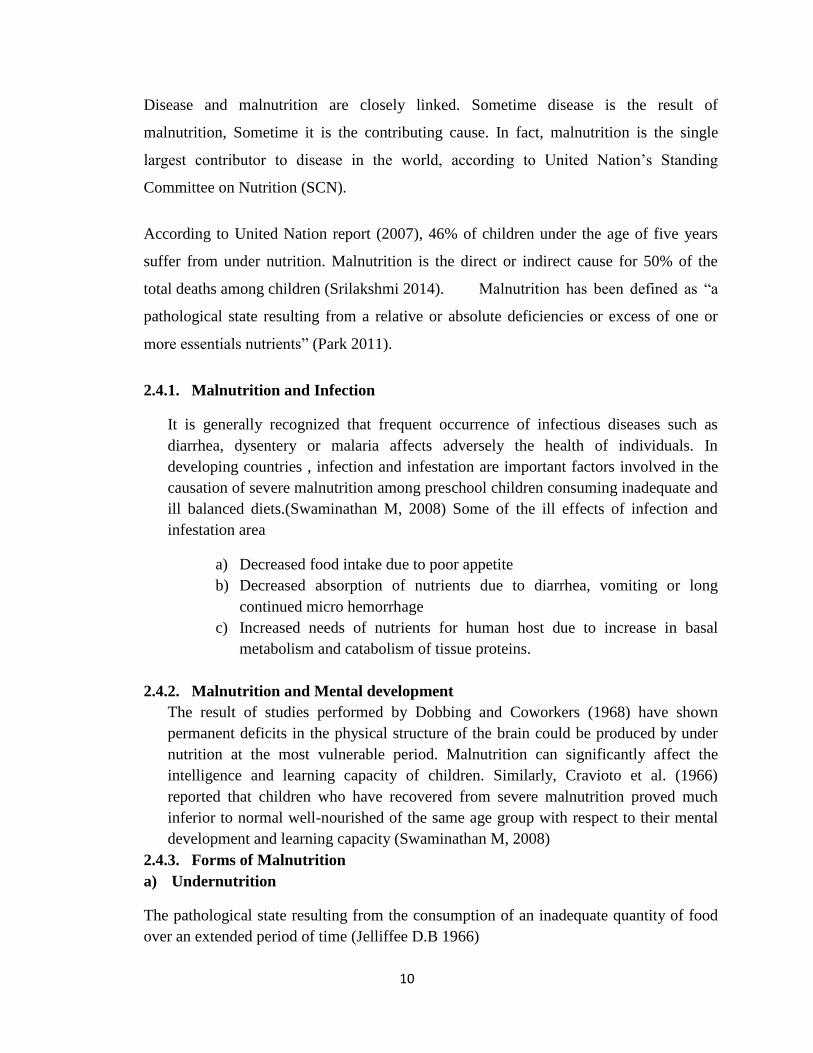
Disease and malnutrition are closely linked. Sometime disease is the result of
malnutrition, Sometime it is the contributing cause. In fact, malnutrition is the single
largest contributor to disease in the world, according to United Nation‘s Standing
Committee on Nutrition (SCN).
According to United Nation report (2007), 46% of children under the age of five years
suffer from under nutrition. Malnutrition is the direct or indirect cause for 50% of the
total deaths among children (Srilakshmi 2014). Malnutrition has been defined as ―a
pathological state resulting from a relative or absolute deficiencies or excess of one or
more essentials nutrients‖ (Park 2011).
2.4.1. Malnutrition and Infection
It is generally recognized that frequent occurrence of infectious diseases such as
diarrhea, dysentery or malaria affects adversely the health of individuals. In
developing countries , infection and infestation are important factors involved in the
causation of severe malnutrition among preschool children consuming inadequate and
ill balanced diets.(Swaminathan M, 2008) Some of the ill effects of infection and
infestation area
a) Decreased food intake due to poor appetite
b) Decreased absorption of nutrients due to diarrhea, vomiting or long
continued micro hemorrhage
c) Increased needs of nutrients for human host due to increase in basal
metabolism and catabolism of tissue proteins.
2.4.2. Malnutrition and Mental development
The result of studies performed by Dobbing and Coworkers (1968) have shown
permanent deficits in the physical structure of the brain could be produced by under
nutrition at the most vulnerable period. Malnutrition can significantly affect the
intelligence and learning capacity of children. Similarly, Cravioto et al. (1966)
reported that children who have recovered from severe malnutrition proved much
inferior to normal well-nourished of the same age group with respect to their mental
development and learning capacity (Swaminathan M, 2008)
2.4.3. Forms of Malnutrition
a) Undernutrition
The pathological state resulting from the consumption of an inadequate quantity of food
over an extended period of time (Jelliffee D.B 1966)
11
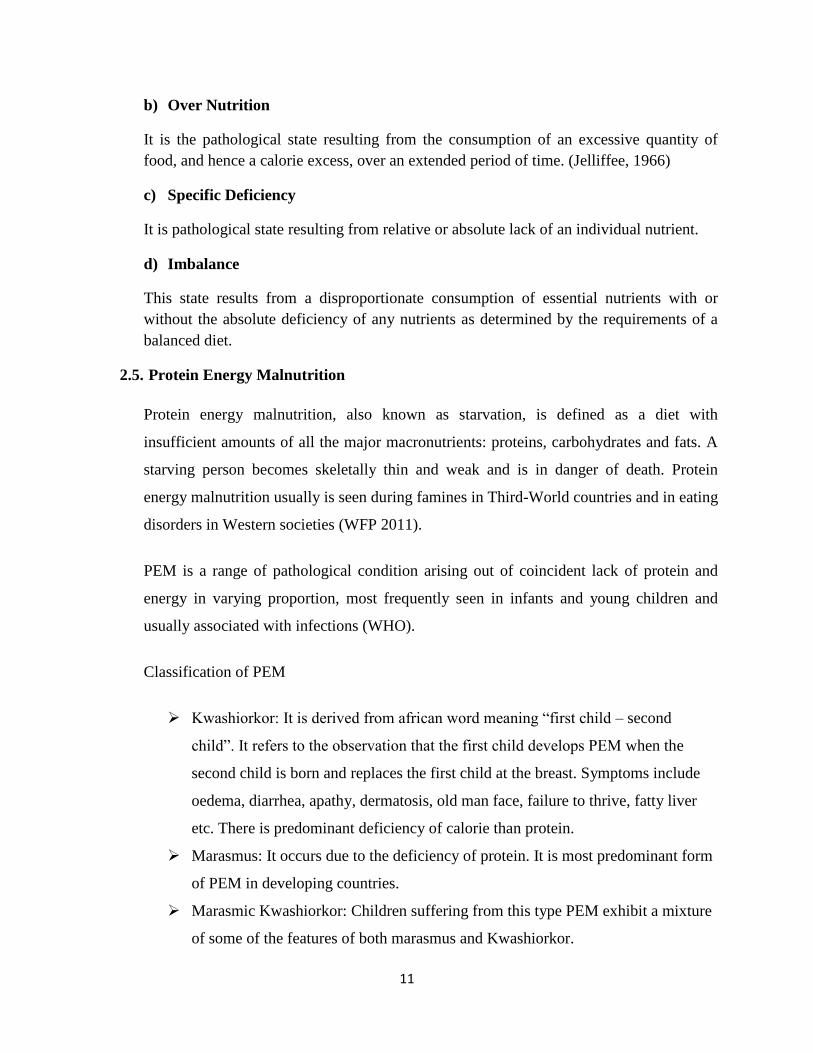
b) Over Nutrition
It is the pathological state resulting from the consumption of an excessive quantity of
food, and hence a calorie excess, over an extended period of time. (Jelliffee, 1966)
c) Specific Deficiency
It is pathological state resulting from relative or absolute lack of an individual nutrient.
d) Imbalance
This state results from a disproportionate consumption of essential nutrients with or
without the absolute deficiency of any nutrients as determined by the requirements of a
balanced diet.
2.5. Protein Energy Malnutrition
Protein energy malnutrition, also known as starvation, is defined as a diet with
insufficient amounts of all the major macronutrients: proteins, carbohydrates and fats. A
starving person becomes skeletally thin and weak and is in danger of death. Protein
energy malnutrition usually is seen during famines in Third-World countries and in eating
disorders in Western societies (WFP 2011).
PEM is a range of pathological condition arising out of coincident lack of protein and
energy in varying proportion, most frequently seen in infants and young children and
usually associated with infections (WHO).
Classification of PEM
Kwashiorkor: It is derived from african word meaning ―first child – second
child‖. It refers to the observation that the first child develops PEM when the
second child is born and replaces the first child at the breast. Symptoms include
oedema, diarrhea, apathy, dermatosis, old man face, failure to thrive, fatty liver
etc. There is predominant deficiency of calorie than protein.
Marasmus: It occurs due to the deficiency of protein. It is most predominant form
of PEM in developing countries.
Marasmic Kwashiorkor: Children suffering from this type PEM exhibit a mixture
of some of the features of both marasmus and Kwashiorkor.
12
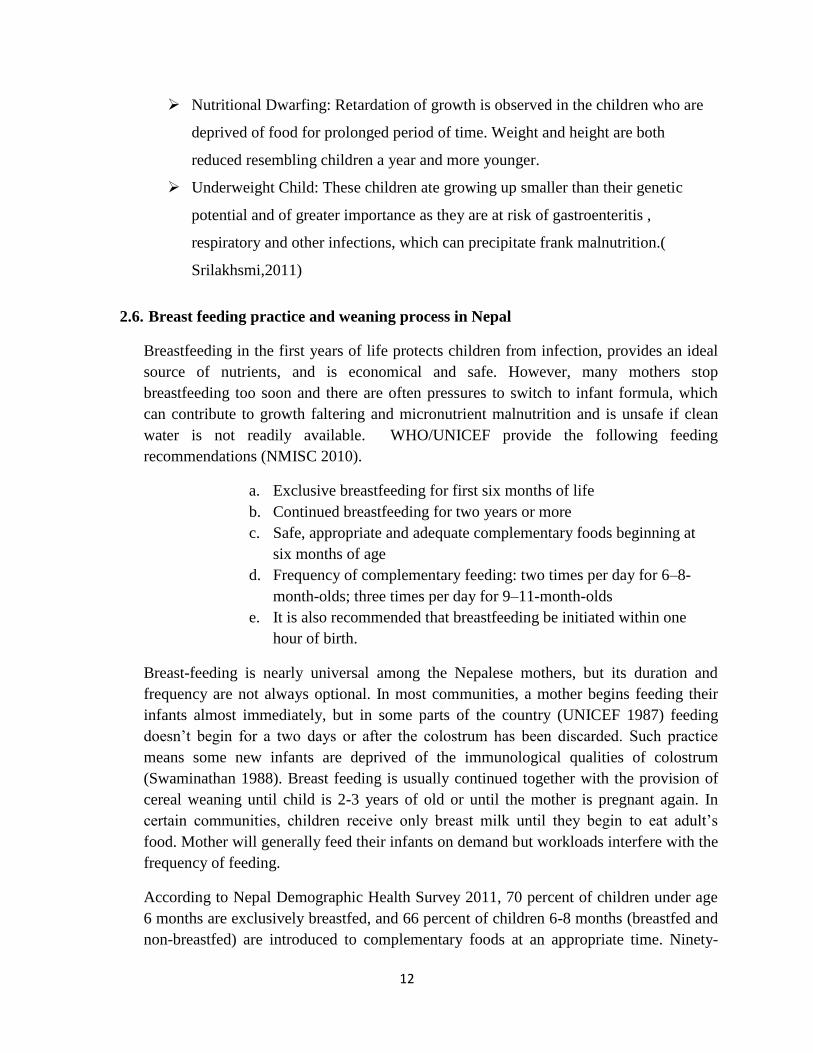
Nutritional Dwarfing: Retardation of growth is observed in the children who are
deprived of food for prolonged period of time. Weight and height are both
reduced resembling children a year and more younger.
Underweight Child: These children ate growing up smaller than their genetic
potential and of greater importance as they are at risk of gastroenteritis ,
respiratory and other infections, which can precipitate frank malnutrition.(
Srilakhsmi,2011)
2.6. Breast feeding practice and weaning process in Nepal
Breastfeeding in the first years of life protects children from infection, provides an ideal
source of nutrients, and is economical and safe. However, many mothers stop
breastfeeding too soon and there are often pressures to switch to infant formula, which
can contribute to growth faltering and micronutrient malnutrition and is unsafe if clean
water is not readily available. WHO/UNICEF provide the following feeding
recommendations (NMISC 2010).
a. Exclusive breastfeeding for first six months of life
b. Continued breastfeeding for two years or more
c. Safe, appropriate and adequate complementary foods beginning at
six months of age
d. Frequency of complementary feeding: two times per day for 6–8-
month-olds; three times per day for 9–11-month-olds
e. It is also recommended that breastfeeding be initiated within one
hour of birth.
Breast-feeding is nearly universal among the Nepalese mothers, but its duration and
frequency are not always optional. In most communities, a mother begins feeding their
infants almost immediately, but in some parts of the country (UNICEF 1987) feeding
doesn‘t begin for a two days or after the colostrum has been discarded. Such practice
means some new infants are deprived of the immunological qualities of colostrum
(Swaminathan 1988). Breast feeding is usually continued together with the provision of
cereal weaning until child is 2-3 years of old or until the mother is pregnant again. In
certain communities, children receive only breast milk until they begin to eat adult‘s
food. Mother will generally feed their infants on demand but workloads interfere with the
frequency of feeding.
According to Nepal Demographic Health Survey 2011, 70 percent of children under age
6 months are exclusively breastfed, and 66 percent of children 6-8 months (breastfed and
non-breastfed) are introduced to complementary foods at an appropriate time. Ninety-
13
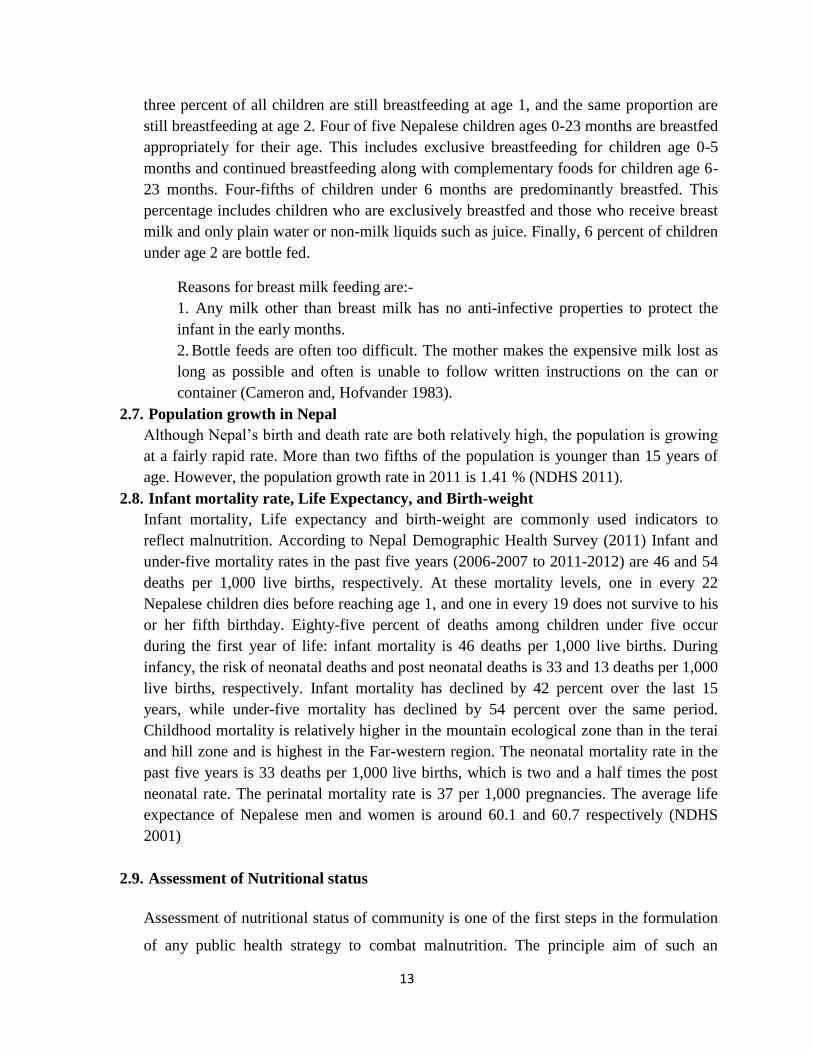
three percent of all children are still breastfeeding at age 1, and the same proportion are
still breastfeeding at age 2. Four of five Nepalese children ages 0-23 months are breastfed
appropriately for their age. This includes exclusive breastfeeding for children age 0-5
months and continued breastfeeding along with complementary foods for children age 6-
23 months. Four-fifths of children under 6 months are predominantly breastfed. This
percentage includes children who are exclusively breastfed and those who receive breast
milk and only plain water or non-milk liquids such as juice. Finally, 6 percent of children
under age 2 are bottle fed.
Reasons for breast milk feeding are:-
1. Any milk other than breast milk has no anti-infective properties to protect the
infant in the early months.
2. Bottle feeds are often too difficult. The mother makes the expensive milk lost as
long as possible and often is unable to follow written instructions on the can or
container (Cameron and, Hofvander 1983).
2.7. Population growth in Nepal
Although Nepal‘s birth and death rate are both relatively high, the population is growing
at a fairly rapid rate. More than two fifths of the population is younger than 15 years of
age. However, the population growth rate in 2011 is 1.41 % (NDHS 2011).
2.8. Infant mortality rate, Life Expectancy, and Birth-weight
Infant mortality, Life expectancy and birth-weight are commonly used indicators to
reflect malnutrition. According to Nepal Demographic Health Survey (2011) Infant and
under-five mortality rates in the past five years (2006-2007 to 2011-2012) are 46 and 54
deaths per 1,000 live births, respectively. At these mortality levels, one in every 22
Nepalese children dies before reaching age 1, and one in every 19 does not survive to his
or her fifth birthday. Eighty-five percent of deaths among children under five occur
during the first year of life: infant mortality is 46 deaths per 1,000 live births. During
infancy, the risk of neonatal deaths and post neonatal deaths is 33 and 13 deaths per 1,000
live births, respectively. Infant mortality has declined by 42 percent over the last 15
years, while under-five mortality has declined by 54 percent over the same period.
Childhood mortality is relatively higher in the mountain ecological zone than in the terai
and hill zone and is highest in the Far-western region. The neonatal mortality rate in the
past five years is 33 deaths per 1,000 live births, which is two and a half times the post
neonatal rate. The perinatal mortality rate is 37 per 1,000 pregnancies. The average life
expectance of Nepalese men and women is around 60.1 and 60.7 respectively (NDHS
2001)
2.9. Assessment of Nutritional status
Assessment of nutritional status of community is one of the first steps in the formulation
of any public health strategy to combat malnutrition. The principle aim of such an
14
assessment is to determine the type, magnitude and distribution if malnutrition in
different geographic areas to identify at risk groups and to determine the contributory
factors. In addition fractural evidence of the exact magnitude of malnutrition is essential
to sensitize administrators and politicians to obtain allocation of materials and human
resources and to plan appropriately (Srilakshmi 2002)
The nutritional assessment may require encompassing nations, communities, vulnerable
segments of communities or individuals. It may be done as a part of an exercise to
document current status as compared with post status or as specific attempt to evaluate
the, impact of an intervention program. (Ramchandran, 1987).
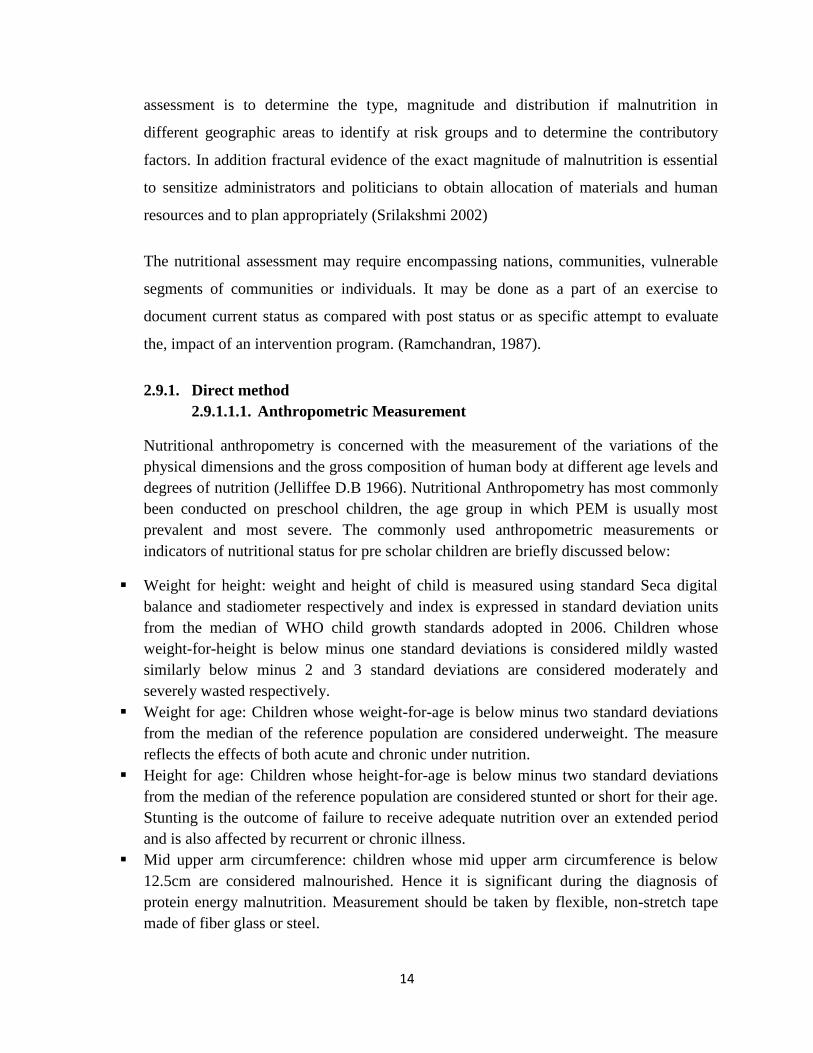
2.9.1. Direct method
2.9.1.1.1. Anthropometric Measurement
Nutritional anthropometry is concerned with the measurement of the variations of the
physical dimensions and the gross composition of human body at different age levels and
degrees of nutrition (Jelliffee D.B 1966). Nutritional Anthropometry has most commonly
been conducted on preschool children, the age group in which PEM is usually most
prevalent and most severe. The commonly used anthropometric measurements or
indicators of nutritional status for pre scholar children are briefly discussed below:
Weight for height: weight and height of child is measured using standard Seca digital
balance and stadiometer respectively and index is expressed in standard deviation units
from the median of WHO child growth standards adopted in 2006. Children whose
weight-for-height is below minus one standard deviations is considered mildly wasted
similarly below minus 2 and 3 standard deviations are considered moderately and
severely wasted respectively.
Weight for age: Children whose weight-for-age is below minus two standard deviations
from the median of the reference population are considered underweight. The measure
reflects the effects of both acute and chronic under nutrition.
Height for age: Children whose height-for-age is below minus two standard deviations
from the median of the reference population are considered stunted or short for their age.
Stunting is the outcome of failure to receive adequate nutrition over an extended period
and is also affected by recurrent or chronic illness.
Mid upper arm circumference: children whose mid upper arm circumference is below
12.5cm are considered malnourished. Hence it is significant during the diagnosis of
protein energy malnutrition. Measurement should be taken by flexible, non-stretch tape
made of fiber glass or steel.
15
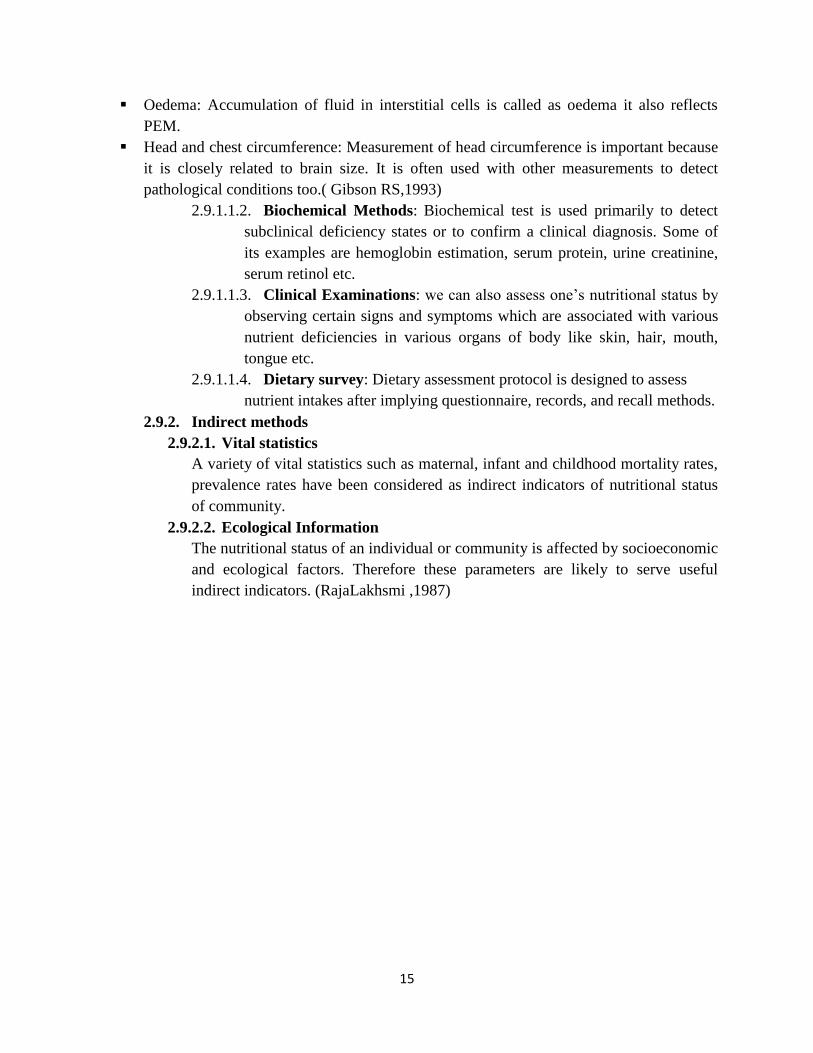
Oedema: Accumulation of fluid in interstitial cells is called as oedema it also reflects
PEM.
Head and chest circumference: Measurement of head circumference is important because
it is closely related to brain size. It is often used with other measurements to detect
pathological conditions too.( Gibson RS,1993)
2.9.1.1.2. Biochemical Methods: Biochemical test is used primarily to detect
subclinical deficiency states or to confirm a clinical diagnosis. Some of
its examples are hemoglobin estimation, serum protein, urine creatinine,
serum retinol etc.
2.9.1.1.3. Clinical Examinations: we can also assess one‘s nutritional status by
observing certain signs and symptoms which are associated with various
nutrient deficiencies in various organs of body like skin, hair, mouth,
tongue etc.
2.9.1.1.4. Dietary survey: Dietary assessment protocol is designed to assess
nutrient intakes after implying questionnaire, records, and recall methods.
2.9.2. Indirect methods
2.9.2.1. Vital statistics
A variety of vital statistics such as maternal, infant and childhood mortality rates,
prevalence rates have been considered as indirect indicators of nutritional status
of community.
2.9.2.2. Ecological Information
The nutritional status of an individual or community is affected by socioeconomic
and ecological factors. Therefore these parameters are likely to serve useful
indirect indicators. (RajaLakhsmi ,1987)
16
Part II
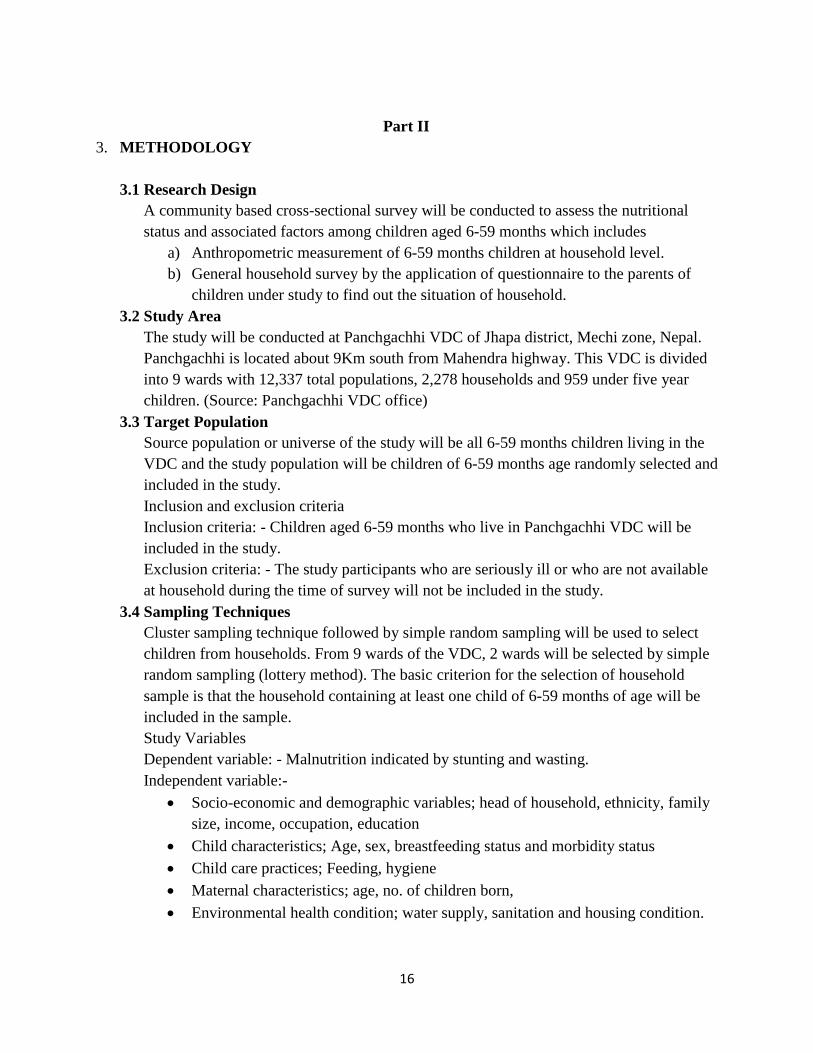
3. METHODOLOGY
3.1 Research Design
A community based cross-sectional survey will be conducted to assess the nutritional
status and associated factors among children aged 6-59 months which includes
a) Anthropometric measurement of 6-59 months children at household level.
b) General household survey by the application of questionnaire to the parents of
children under study to find out the situation of household.
3.2 Study Area
The study will be conducted at Panchgachhi VDC of Jhapa district, Mechi zone, Nepal.
Panchgachhi is located about 9Km south from Mahendra highway. This VDC is divided
into 9 wards with 12,337 total populations, 2,278 households and 959 under five year
children. (Source: Panchgachhi VDC office)
3.3 Target Population
Source population or universe of the study will be all 6-59 months children living in the
VDC and the study population will be children of 6-59 months age randomly selected and
included in the study.
Inclusion and exclusion criteria
Inclusion criteria: - Children aged 6-59 months who live in Panchgachhi VDC will be
included in the study.
Exclusion criteria: - The study participants who are seriously ill or who are not available
at household during the time of survey will not be included in the study.
3.4 Sampling Techniques
Cluster sampling technique followed by simple random sampling will be used to select
children from households. From 9 wards of the VDC, 2 wards will be selected by simple
random sampling (lottery method). The basic criterion for the selection of household
sample is that the household containing at least one child of 6-59 months of age will be
included in the sample.
Study Variables
Dependent variable: - Malnutrition indicated by stunting and wasting.
Independent variable:-
Socio-economic and demographic variables; head of household, ethnicity, family
size, income, occupation, education
Child characteristics; Age, sex, breastfeeding status and morbidity status
Child care practices; Feeding, hygiene
Maternal characteristics; age, no. of children born,
Environmental health condition; water supply, sanitation and housing condition.
17
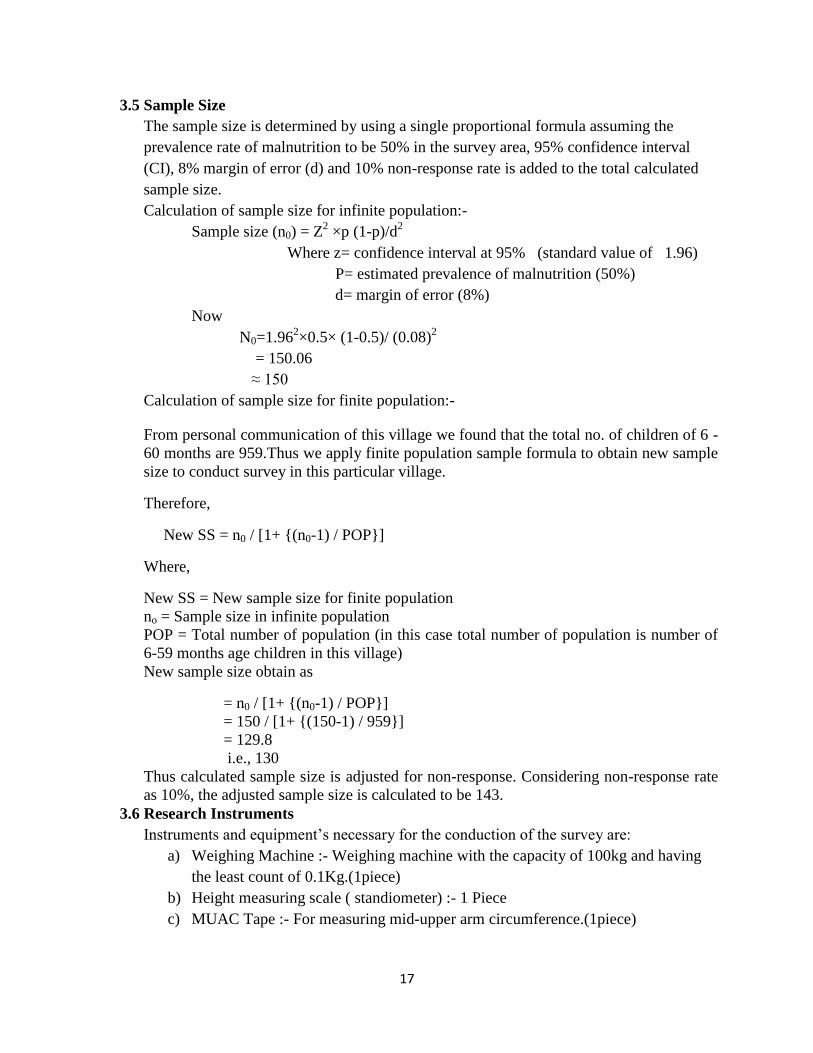
3.5 Sample Size
The sample size is determined by using a single proportional formula assuming the
prevalence rate of malnutrition to be 50% in the survey area, 95% confidence interval
(CI), 8% margin of error (d) and 10% non-response rate is added to the total calculated
sample size.
Calculation of sample size for infinite population:-
Sample size (n0) = Z2 ×p (1-p)/d
2
Where z= confidence interval at 95% (standard value of 1.96)
P= estimated prevalence of malnutrition (50%)
d= margin of error (8%)
Now
N0=1.962×0.5× (1-0.5)/ (0.08)
2
= 150.06
≈ 150
Calculation of sample size for finite population:-
From personal communication of this village we found that the total no. of children of 6 -
60 months are 959.Thus we apply finite population sample formula to obtain new sample
size to conduct survey in this particular village.
Therefore,
New SS = n0 / [1+ {(n0-1) / POP}]
Where,
New SS = New sample size for finite population
no = Sample size in infinite population
POP = Total number of population (in this case total number of population is number of
6-59 months age children in this village)
New sample size obtain as
= n0 / [1+ {(n0-1) / POP}]
= 150 / [1+ {(150-1) / 959}]
= 129.8
i.e., 130
Thus calculated sample size is adjusted for non-response. Considering non-response rate
as 10%, the adjusted sample size is calculated to be 143.
3.6 Research Instruments
Instruments and equipment‘s necessary for the conduction of the survey are:
a) Weighing Machine :- Weighing machine with the capacity of 100kg and having
the least count of 0.1Kg.(1piece)
b) Height measuring scale ( standiometer) :- 1 Piece
c) MUAC Tape :- For measuring mid-upper arm circumference.(1piece)
18
d) Questionnaire: - A well designed and pretested set of questionnaire to collect
household information.
3.7 Pre-Testing
The prepared sets of questionnaire and anthropometric instruments will be pre-tested
among few parents/caretakers of 6-59 months children and 6-59 months children
respectively who are under sampling plan. Pre-testing should be conducted in order to
maintain accuracy and clarity of questionnaire, to check the consistency in interpretation
of questions by respondents and to identify ambiguous item. After pre- testing all the
ambiguous, misleading and wrongly interpreted questions will be omitted and
questionnaire will be revised in accordance with the findings of pre-testing.
3.8 Validity and Reliability
To ascertain the degree to which the data collection instruments will measure what they
purposed to measure, the instruments will be validated at Central Campus of Technology,
Central department of Nutrition and Dietetics. The expected testes in the questionnaire
would also be drawn according to the available literature in nutrition education for young
children. The questionnaire would also be pre-tested prior to data collection to ascertain
content and face validity.
Reliability refers to quality control measure of data collected. Before data collection,
detailed study will be based on the objectives of the study and on data collection
techniques. Questionnaire will be checked daily for completeness, consistency and clarity
as mentioned earlier. In addition, the thesis supervisors may also visit the research site
periodically to monitor the process of data collection.
3.9 Data Collection Techniques
Data will be collected using structured questionnaire and anthropometric measurement.
Interview will be conducted with parents/care takers of the children to fill the
questionnaire. In households with more than one children of age between 6-59 months,
one child will be collected by lottery method.
3.10 Data Analysis
First the data will be checked for completeness and consistency. Then it will be coded
and entered in the computer using statistical software. Likewise qualitative data will be
transcribed and coded by assigning labels to various categories. Verified test parameters
will be used to establish the relationships between the variables and nutritional status of
students.
3.11 Logistic and Ethical Considerations
Ethical clearance will be obtained from Central Campus of Technology, Department of
Nutrition and Dietetics and office of the Village Development Committee of Panchgachhi
VDC. Verbal consent from parents/care taker of study subjects will be obtained and the
objective of the study was explained to them. Privacy and confidentiality of collected
information will be ensured at all level.
19
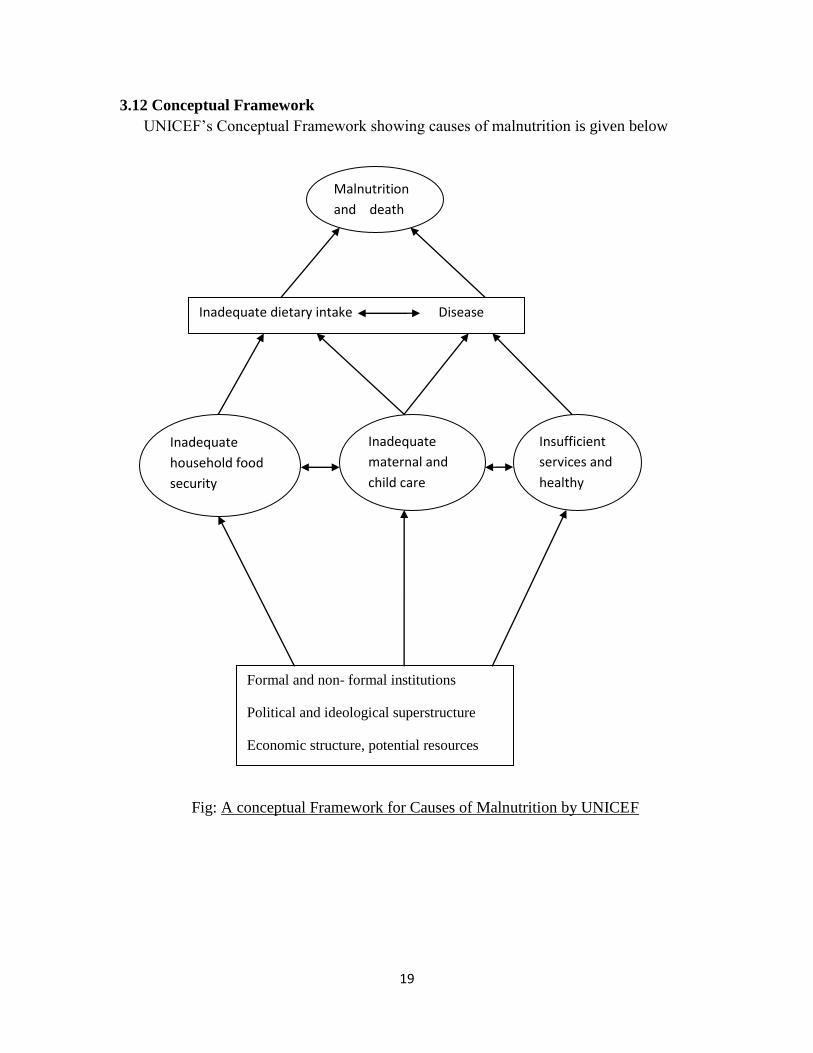
3.12 Conceptual Framework
UNICEF‘s Conceptual Framework showing causes of malnutrition is given below
Fig: A conceptual Framework for Causes of Malnutrition by UNICEF
Formal and non- formal institutions
Political and ideological superstructure
Economic structure, potential resources
Inadequate
household food
security
Inadequate
maternal and
child care
Insufficient
services and
healthy
Malnutrition
and death
Inadequate dietary intake Disease
20
4. REFERENCES
1. World Bank Report, 2012. Nutrition in Nepal- Documents and Reports 8th May
2012.
2. Joshi PC, 2012. ―Malnutrition in children‖ A serious health issue in Nepal
3. UNDP, 2013. The World Bank, World Development indicators 2013/ UNDP: Human
Development Report
4. Müller O, Krawinkel M (2005) Malnutrition and health in developing countries.
CMAJ 173: 279-286.
5. Black RE, Morris SS, Bryce J (2003) Where and why are 10 million children
dying every year? Lancet 361: 2226-2234.
6. Burk, M. (1984). Brief introduction for food economics to nutrition problems.
Integration Nutrition into Agriculture and Rural Development project. A manual
nutrition in agriculture: FAO.
7. Acharya et al, 2013. Factors associated with Nutritional status of under five children
in Rupendehi District of Nepal, 2013 : Vol- 3 no.1 page no.56-59
8. NDHS,2011. Nepal Demographic and Health Survey Report, Nutritional status of
children
9. UNICEF, 2009. State of world‘s children Report
10. Srilakshmi, B. (2002). Nutrition Science. 1st edition New Age International (P)
Limited, Publisher, Delhi, India.
11. Medical Gazzette, 2012. Various Anthropometric Method of Assessment of
Nutritional status in Under five children; Department of Committee, Medicine Navale
Medical College, Pune September 2012
12. Mudambi et al, 2012. Fundamental of Food nutrition and diet therapy 6th
edition,
New Age International P ltd. Publisher,Delhi India, Food, nutrition and health page
no. 5-6
13. NDHS,2011. Key findings; Household Composition
14. NMISC, (2010). Preliminary-Report; Breastfeeding and Infant and Young child
feeding in Nepal.
15. Adel P. den Hartog, 2006. Food habit and Consumption in Developing countries,
Food culture 1st edition Wageningen Academic Publisher, 2006 The Netherland page
no.19
16. Gyawali Rajiv, 2002. Nutritional survey of satar community at Lakhanpur VDC,
Jhapa B Tech.Food Dissertation, Central Campus of Technology Tribhuvan
University Nepal
17. Yadav DK, 1994. Nutritional survey of Bhutanese refugee camp Beldangi ext-2(
Damak, Municipality Jhapa) B Tech.Food Dissertation, Central Campus of
Technology Tribhuvan University Nepal
21
18. Dahal P, 2002. Diagnosis of Malnutrition Problem and its treatment through dietary
supplements in under six age chamar children of madhesa VDC, Sunsari B Tech.Food
Dissertation, Central Campus of Technology Tribhuvan University Nepal
19. UNICEF'S (2009). state of the World's Children Report.
20. Srilakshmi, B. (2014). Dietetics. 7th
edition. New Age International (P) Limited,
Publisher, Delhi, India; Nutritional and Food Requirement for Infants;
21. Park K. park‘s Textbook of Preventive and social medicine Nutrition and Health 21st
Ed. India: Bhanol publisher 2011.P.568, 602-603, 611.
22. Swaminathan M, 2008. Advanced Textbook on Food & Nutrition: 2nd
edition, vol-2
Bangalore Printing & Publishing Co. ltd. Page no. 317-325.
23. Jelliffee DB, 1966. Assessment of nutritional status of community, WHO Monograph
series no.35 pp 176-207
24. WFP, (2011). Forms of Malnutrition.
25. NMISC, (2010). Preliminary-Report; Breastfeeding and Infant and Young child
feeding in Nepal.
26. Cameron, M. and Hofvander, Y.C. (1993). ―Manual on Feeding Infants.‖ (Cited in
Ojha, k. (2003). An Area Nutrition Survey of Pre- School Children of Musahar
Community in Narsing VDC Sunsari; B.Tech. (Food) Dissertation, Central Campus
of Technology, Tribhuvan University Nepal).
27. NDHS, (2011). Nutrition of Children and Women, Breast feeding status by Age.
28. Srilakshmi, B. (2002). Nutrition Science. 1st edition New Age International (P)
Limited, Publisher, Delhi, India.
29. Ramchandran, P. (1987). ―Use of Socio-economic and Mortality Data for Assessment
of Nutritional Staus.‖ Nutirtion; Monitoring and Assessment , Gopaldas and
S.Seshadri(eds). Oxford University, Press, India .
30. Rajalakhsmi, 1987. Applied Nutrition Oxford and IBH publishing com. Pvt. Ltd.
India, 3rd edition pp 387.
22
APPENDICES
Questionnaires:
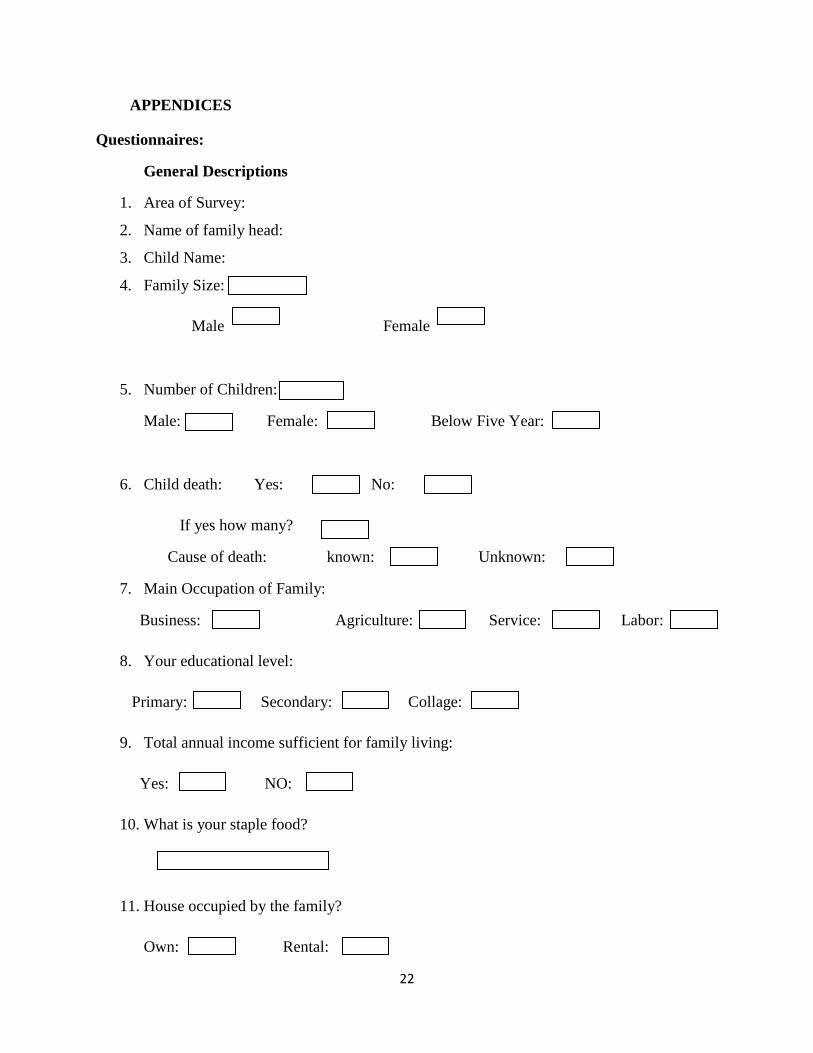
General Descriptions
1. Area of Survey:
2. Name of family head:
3. Child Name:
4. Family Size:
Male Female
5. Number of Children:
Male: Female: Below Five Year:
6. Child death: Yes: No:
If yes how many?
Cause of death: known: Unknown:
7. Main Occupation of Family:
Business: Agriculture: Service: Labor:
8. Your educational level:
Primary: Secondary: Collage:
9. Total annual income sufficient for family living:
Yes: NO:
10. What is your staple food?
11. House occupied by the family?
Own: Rental:
23
12. House type?
Temporary: Permanent:
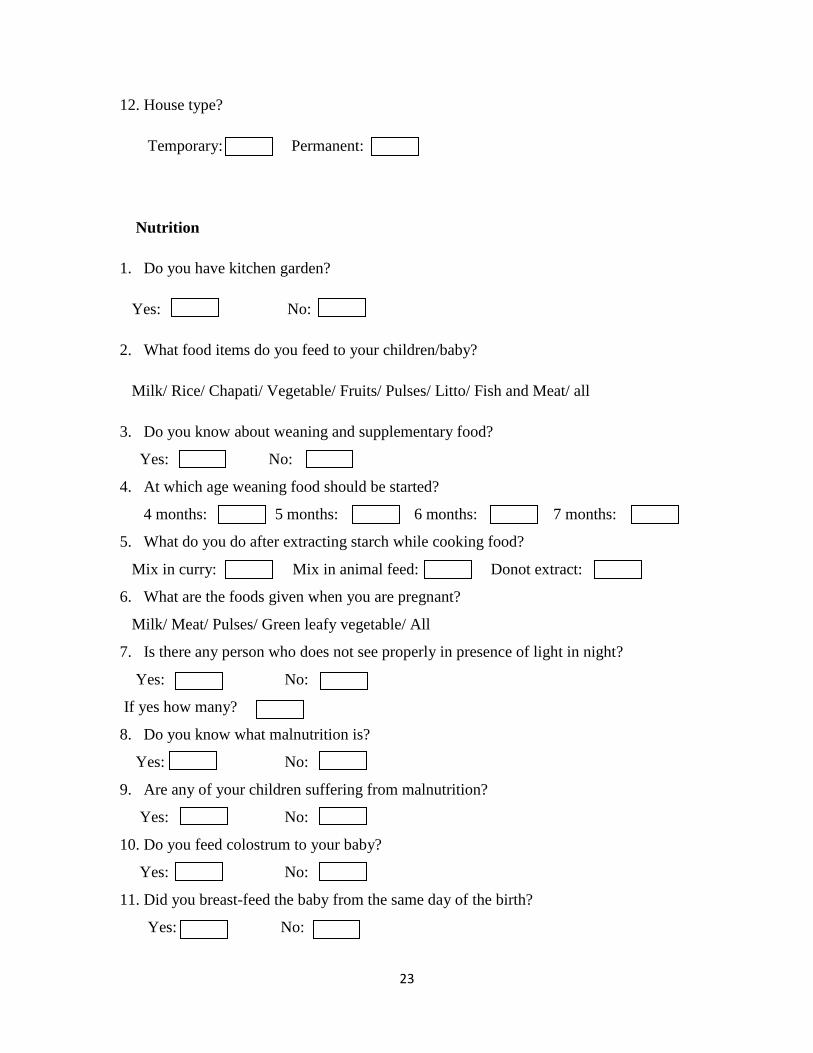
Nutrition
1. Do you have kitchen garden?
Yes: No:
2. What food items do you feed to your children/baby?
Milk/ Rice/ Chapati/ Vegetable/ Fruits/ Pulses/ Litto/ Fish and Meat/ all
3. Do you know about weaning and supplementary food?
Yes: No:
4. At which age weaning food should be started?
4 months: 5 months: 6 months: 7 months:
5. What do you do after extracting starch while cooking food?
Mix in curry: Mix in animal feed: Donot extract:
6. What are the foods given when you are pregnant?
Milk/ Meat/ Pulses/ Green leafy vegetable/ All
7. Is there any person who does not see properly in presence of light in night?
Yes: No:
If yes how many?
8. Do you know what malnutrition is?
Yes: No:
9. Are any of your children suffering from malnutrition?
Yes: No:
10. Do you feed colostrum to your baby?
Yes: No:
11. Did you breast-feed the baby from the same day of the birth?
Yes: No:

24
12. When do you stop breast-feeding?
Immunization
1. Is your child being immunized?
Yes: No:
2. Are you being vaccinated during pregnancy?
Yes: No:
3. If yes what vaccine have you taken? 0r would you take?
DPT/ BCG/ POLIO/ T.T
5.1.4 Environmental Sanitation
1. How do you dispose the garbage disposal?
2. Toilet Facility?
Yes: No:
3. How do you use the water?
By Filtration/ by Boiling/ Without any Treatment
5.1.5 Mother and Child Health (MCH)
1. Have you ever been to Health Post to take information for any pregnant women in your
family?
2. How do you manage to feed the food when anybody in your family is pregnant?
a) Give more food than usual
b) Less than usual
c) In the same ratio as usual
3. Do you feed colostrum to your baby?
Yes: No:
4. Is it necessary for pregnant women to take rest?
25
Yes: No:
5. Do you know the method of preparing oral rehydration solution (ORS)?
Yes: No: