Embed Size (px)
Citation preview
Ore mineralogy and uraninite trace element chemistry of hydrothermal polymetallic U-
Ag-(Co-Ni-As-Bi-Sb-Cu) vein deposits, Eldorado Mine, Port Radium, NWT
By
Matthew Bailey
A Thesis Submitted to Saint Mary’s University, Halifax, Nova Scotia in Partial
Fulfillment of the of the Requirements for the Degree of Geology.
May 1st, 2017, Halifax Nova Scotia
©Matthew Bailey, 2017
Approved: Dr. Jacob Hanley
Associate Professor
Department of Geology
Date: May 1st, 2017
2
Ore mineralogy and uraninite trace element chemistry of hydrothermal polymetallic
U-Ag-(Co-Ni-As-Bi-Sb-Cu) vein deposits, Eldorado Mine, Port Radium, NWT
Matthew Bailey
ABSTRACT
The paragenetic sequence of uranium enriched polymetallic deposits at the Eldorado mine
in the N.W.T, Canada, is poorly understood. Few studies have used modern analytical
techniques to characterize the deposit. This study aims to update paragenetic models by
use of petrographic work as well as SEM analysis. This data will be used in conjunction
with LA-ICPMS to characterize the trace element composition of uraninite (interpreted to
be UO2, U3O8 mixture). The data show that there are alternating sequences of
coprecipitation between uraninite and Co-Ni arsenides. This indicates that the fluid is
carrying multiple metals (U, Ni and Co) simultaneous and that a major factor in their
precipitation is an increase in fO2. Our paragenetic sequence closely follows previous
models
Date: May 1 2017
3
Table of Contents:
Figures list……………………………………………………………………………….4
Table list…………………………………………………………………………………5
1.0 Introduction…………………………………………………………………………6
1.1 Geological Setting…………………………………………………………...9
2.0 Methods………………………………………………………….…..……………...11
2.1 Petrography…………………………………………………………………12
2.2 SEM………………………………………………………………………….12
2.3 LA-ICPMS…………………………………………………………………..12
2.4 Raman Spectroscopy………………………………………………………..13
3.0 Results……………………………………………………………………………….14
3.1 Models……………………………………………………………………….14
3.2 Ore Mineralogy and Textures……………………………………………..14
3.3 Mineral Chemistry…………………………………………………………23
3.4 Uranium phase Chemistry………………………………………………....26
4.0 Discussion…………………………………………………………………………...38
4.1 Paragenetic sequence……………………………………………………….38
4.1.1 Stage 1: uraninite ± sulfarsenides…………………...………..…38
4.1.2 Stage 2: arsenides ± Ag, Bi………………………………….……43
4.1.3 Stage 3: sulphide ± U, Ag and carbonates………………………43
4.2 Comparison to previous models………………………………….………..45
4.3 Implications……………………………………………………………...….46
5.0 References…………………………………………………………………………..47
6.0 Acknowledgements…………………………………………………………………49
7.0 Appendix…………………....……………………………………………………….50
4
Figure List:
Figure 1: Area Map……………………………………………………………………...8
Figure 2: Fault bounded vein mineralization map…………………………………….10
Figure 3: Uraninite occurrences and textures………………………………………...16
Figure 4: Coffinite alteration of repetitive uraninite…………………………………18
Figure 5: Dendrite evolution………………………………………………………...…20
Figure 6: Sulphide and silver associated textures…………………………………….21
Figure 7: Arsenide ternary plots……………………………………………………….24
Figure 8: Carbonate and Ca-carbonate ternary diagrams………………………..…25
Figure 9: Spot analysis REE spider diagrams for world deposits…………………...28
Figure 10: Spot analysis REE + trace metal spider diagrams of uraninite…………..29
Figure 11: Breakdown of Figure 10 by sample and occurrence………………………30
Figure 12: Variations in characteristics of the uraninite zones……………………..32
Figure 13: Inclusion zone sketch, natural and enhanced SEM BSE images. ………33
Figure 14: Inclusion shape and size…………………………………………………...34
Figure 15: LA-ICPMS map location…………………………………………………..35
Figure 16: Trace element maps in botryoidal uraninite……………………………...36
Figure 17: SEM element map for coffinite alteration of uraninite and sulpharsenide
cycle……………………………………………………………………………………...47
Figure 18: Raman analysis of UUP…………………………………………………….40
5
Table List:
Table 1: Production of mines in the Eldorado, Echo Bay and Camsell River area …..7
Table 2: Model summary…………………………………………………………….…15
Table 3: Mineral composition …………………..………………………………….…..22
Table 4: Variations in the chemistry of uraninite and associated inclusions………..27
Table 5: Updated paragenetic sequences ……………………………………………...39
Table 6: Paragenetic sequence of uraninite of enchanced image…………………….41
Table 7: Uranium phases …….……………………...……………………………….....44
6
1.0 Introduction
The Eldorado mine, located at Port Radium, NWT, is one of several mines comprising
the Echo Bay-Eldorado-Camsell River (‘EEC’) mining district within the Great Bear Lake
magmatic zone. Mineralization at the Eldorado comprises a polymetallic vein system of
the “five metals” association (e.g., Cobalt and Thunder Bay districts, Ontario) with a
substantial enrichment in uranium. While uncommon for this style of deposit globally, such
uranium enrichment is not unique to the Eldorado mine (e.g., Jachymov deposit, Czech
Republic; Alexandre et al. 2015). Other deposits in the EEC (e.g., Echo Bay, Terra/Silver
Bear and Norex Deposits) are not uranium rich and were mined only for their substantial
former reserves of silver (Kissin, 1992).
G.A LaBine first discovered the Eldorado deposit in 1930 with production of the mine
occurring between 1933 and 1960 by the Eldorado Mining Company. The mine produced
radium with uranium as a by-product for the pharmaceutical industry, followed by a focus
in uranium production during the 1940s, and eventually produced silver as an additional
commodity (Jory, 1964). The Eldorado mine Canada’s only uranium producer from 1938
to 1955 and produced approximately 6000 tonnes of uranium over 22 years from (Ruzicka
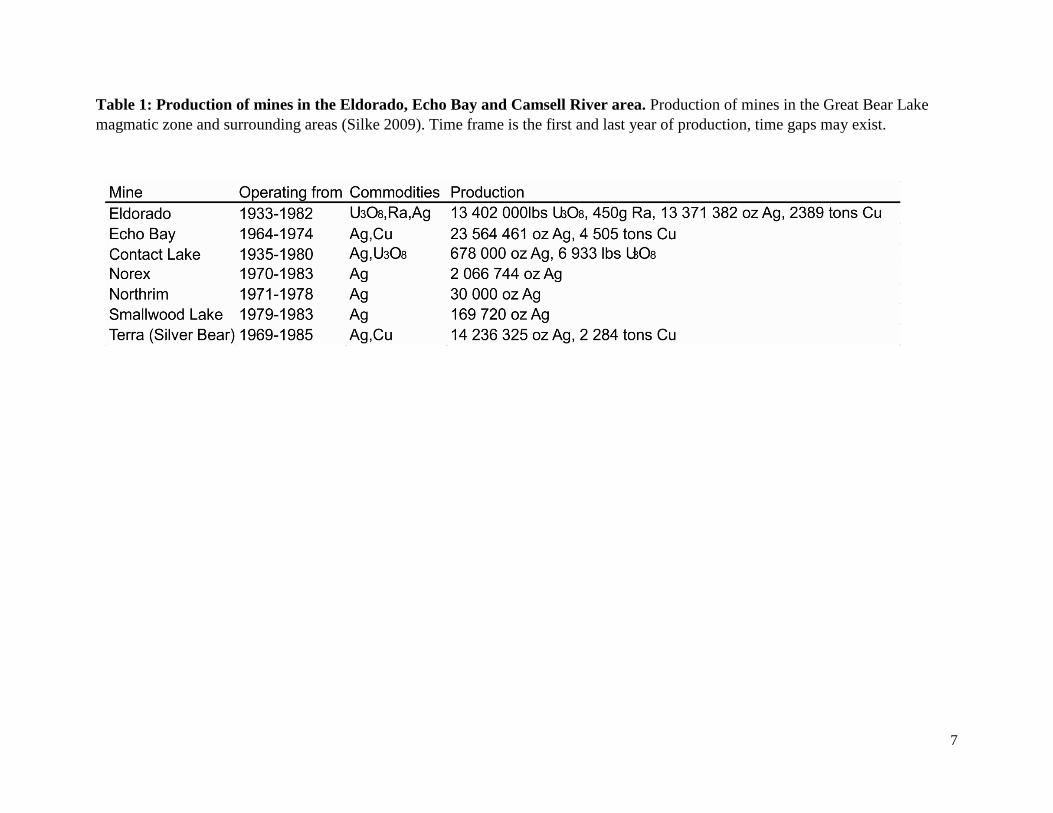
and Thorpe, 1996). Compared to the surrounding mines in the area, Eldorado produced
larger quantities of its commodities (Table 1) (Silke, 2009). Eldorado also produced Ni, Co
and Pb and these metals were sold off as a by product
This deposit has seen very little in terms of modern interpretation or analysis by
modern methods since Kidd and Haycock (1932). A more recent paper constrains the age
of deposition between the 1.72 Ga Cleaver Dikes and the 1.59 Ga Western Channel Sheets
(Gandhi et al., 2013). This study aims to determine the paragenesis of the Eldorado ores to
characterize the mineralization events and to determine if the mineralization events were
produced by similar or different fluids. To achieve this, we will be using petrographic
observations and scanning electron microscope to identify minerals and examine
microscopic texture, and a laser ablation inductively coupled plasma mass spectrometer
(LA-ICPMS) to determine trace element abundances in uraninite, with a goal of
determining textural chemical variations to identify specific phases.
7
Table 1: Production of mines in the Eldorado, Echo Bay and Camsell River area. Production of mines in the Great Bear Lake
magmatic zone and surrounding areas (Silke 2009). Time frame is the first and last year of production, time gaps may exist.
8
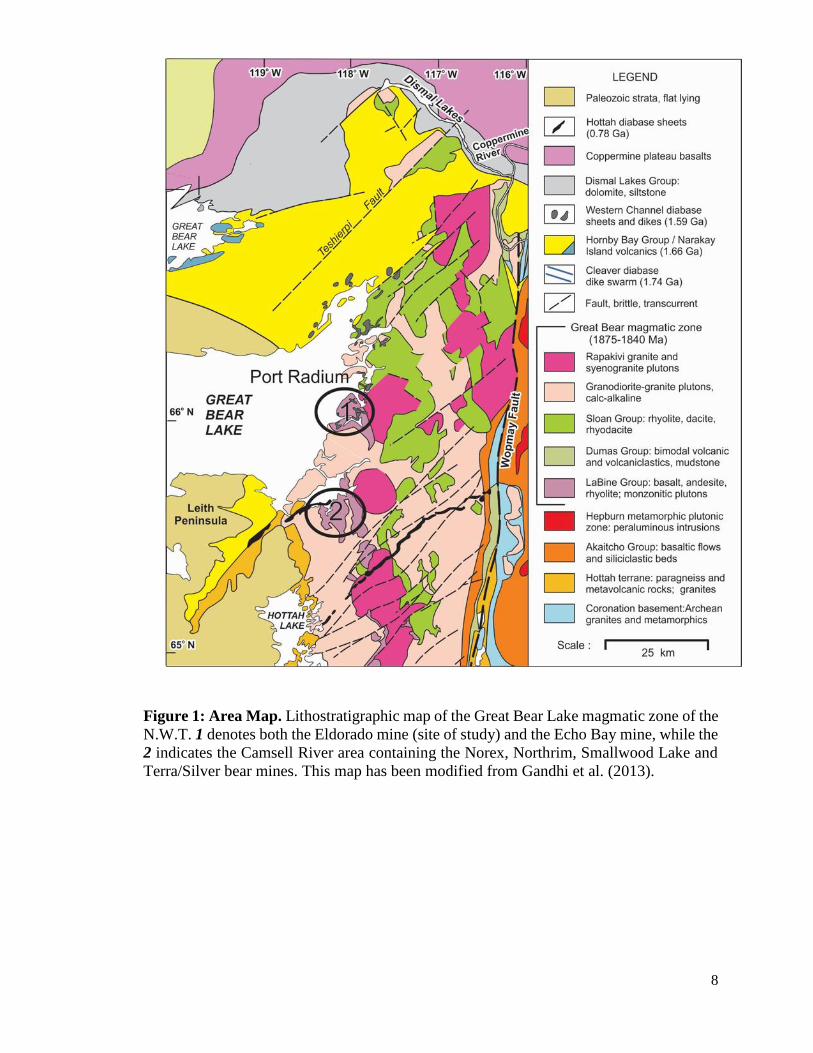
Figure 1: Area Map. Lithostratigraphic map of the Great Bear Lake magmatic zone of the
N.W.T. 1 denotes both the Eldorado mine (site of study) and the Echo Bay mine, while the
2 indicates the Camsell River area containing the Norex, Northrim, Smallwood Lake and
Terra/Silver bear mines. This map has been modified from Gandhi et al. (2013).
9
A trace element database of uraninite from multiple worldwide deposits will be
created to compare of differences in uraninite composition from different deposits. By
use of petrography and LA-ICPMS we will determine the paragenesis and compare our
sequence with the “5 stages” of deposition.
1.1 Geological setting
The Great Bear Lake magmatic zone (GBLMZ) is an ~100km wide area comprising
mainly volcanics and volcanoclastics of predominantly intermediate compositions. This
zone represents an ancient calk-alkaline continental arc setting on the western edge of the
Wopmay Orogen. (Gandhi et al., 2013). It includes both mafic/felsic flows, tholeiitic
basalts and ash flows. These units were subsequently intruded by numerous plutons and
sills (Reardon, 1992) with U-Pb age of zircons between 1875 Ma to 1850 Ma. (Changkakoti
et al., 1986)
The area of interest is located within a 10km thick section known as the McTavish
Supergroup. This supergroup comprises the LaBine, the Sloan and the Dumas group. The
LaBine Group, comprises the Port Radium, Echo Bay and the Cameron Bay formation
which are successions of intermediate lava flows, pyroclastics and sedimentary rocks.
(Reardon, 1992). The LaBine group was later intruded by plutons of quartz monzonite and
by syenogranites (~1858 to 1843 Ma (Gandhi et al., 2013)).
The oldest formation present in the GBLMZ is Port Radium, which contains
predominantly sedimentary rocks, from fine-grain coarsening upwards to subaerial
conglomerates with pyroclastics (Reardon, 1992).
The Echo Bay Formation comprises of andesitic flows, epiclastic rocks and
breccias, which lie over the Port Radium formation. This formation begins as a mixture of
clastic rocks and flows and evolves into being dominated solely by flows (Reardon, 1992).
The epiclastic rocks present consists of volcanic sediments, conglomerates, tuffs and debris
flows. The andesitic flows contain plagioclase phenocrysts with several of the flows
showing amygdules and flow top breccias. (Reardon, 1992).
10
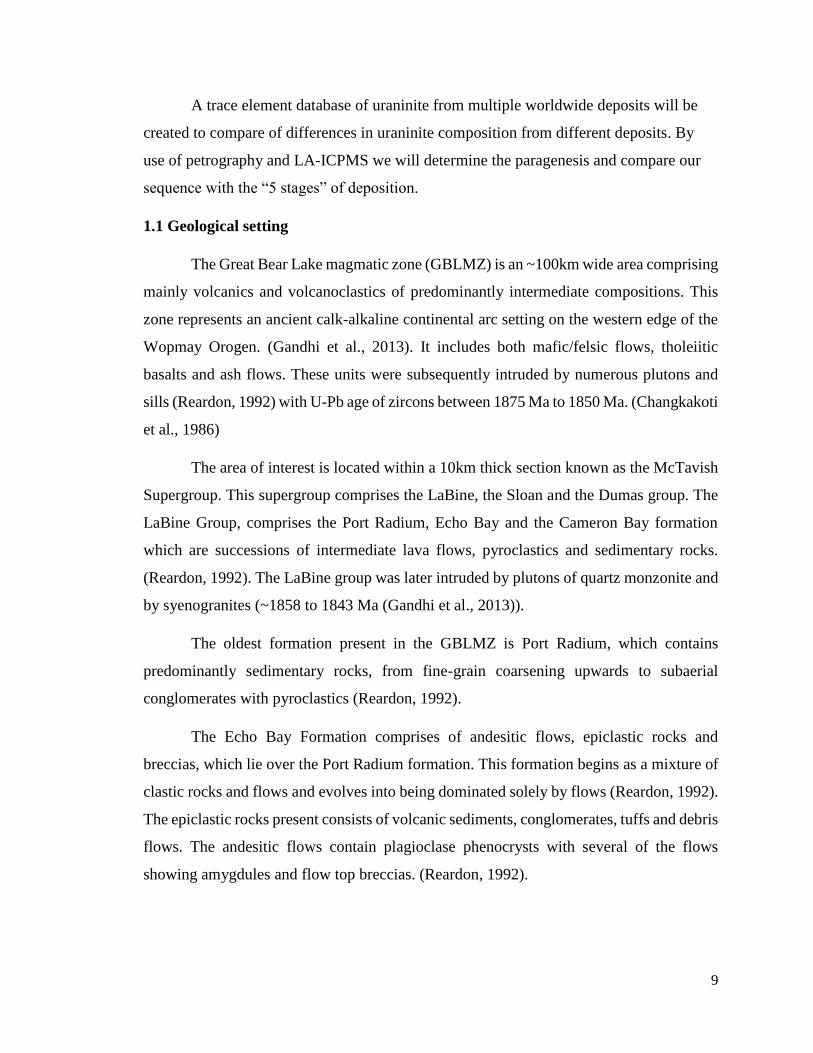
Figure 2: Fault bounded vein mineralization map. Distribution map of the Eldorado/Echo Bay mine in Port Radium, N.W.T.
Modified from Gandhi et al. (2013).
11
These formations were intruded several times after deposition. Two of these are of
great interest to the area as they constrain the timing of deposition. The first is the Cleaver
dyke swarm, at an age of approximately 1.74 Ga. This is a northwest trending, steeply
dipping system of diabase dykes throughout the Echo Bay area. This set of dykes predates
the ore mineralization, as it occurs as fragments in mineralized breccias (Gandhi et al.,
2013). The second is the 1.59 Ga Western Channel diabase present in the town of Port
Radium. This is an east dipping swarm which intrudes the Cleaver dykes and the
formations overlying the LaBine Group (Gandhi et al., 2013).
The samples were sourced from the Eldorado mine, located in Port Radium which
has outcrops from both the Port Radium and Echo Bay Formations (Fig 1). The mine
contains fault hosted quartz veins trending in a NE direction. These faults are believed to
be related to the McDonald fault system, which resulted from the accretion of the Nahanni-
Fort Simpson terranes (or an event farther west) on the western side of Hottah Terrane
(Gandhi et al., 2013). These faults were reactivated after the emplacement of the Cleaver
dykes allowing for the 5 stages of mineralization (Gandhi et al., 2013). Fig. 2 shows the
distribution of the mineralization stages in the faults in the area of interest. Ore host veins
within the fault system have varying characteristics. Vein thickness varies from an inch
thick to 30ft thick and some veins occur in ore breccias. Gangue minerals include
predominantly quartz, carbonates chlorites and white micas as the most dominant.
2.0 Methods:
The rock samples were collected by Professor J. Hanley and MSc candidate Corwin
Trottier from a storage facility at the Geological Society of Canada, Ottawa. The samples
were originally collected in the field by D.F. Kidd and M.H. Haycock. The samples were
chosen to represent varying stages of mineralization and different veins present at the Port
Radium mine.
All samples were cut at Saint Mary’s University. Due to the nature of the samples,
some being radioactive, the cut radioactive samples were sent to SRC (Saskatchewan
Research Council) and the non-radioactive samples were sent to Vancouver Petrographics
to be made into both thin and thick sections.
12
The samples were investigated using several analytical methods. These methods
included petrographic study, Scanning Electron Microscope (SEM), Laser Ablation
Inductively Coupled Plasma Mass Spectrometry (LA-ICPMS) and Raman Spectroscopy.
2.1 Petrography
A petrographic microscope was used to identify minerals in both transmitted and
reflected light and to classify and understand the paragenetic relationships/textures shown
by ore and gangue minerals between the samples.
2.2 SEM
A TESCAN MIRA 3 LMU Variable Pressure Schottky Field Emission Scanning
Electron Microscope (SEM) at the Regional Analytical Centre at Saint Mary’s University
was used to quantify major elements in ore and accessory minerals, and image mineral
textures l associations. Back-scattered electron (BSE) image of the grains in a carbon-
coated polished thin section were produced to examine mineral textures. The SEM has a
maximum resolution of 1.2 at 30kv. Energy dispersive spectrometry (EDS) was used to
determine mineral composition and to identify minerals. It is equipped with an INCA X-
max 80 mm2 silicon-drift detector (SDD) EDS system. The data was interpreted by INCA
software, giving data in weight percent. Once data was collected, the values were
recalculated after the removal of Carbon and Oxygen values. Carbon due to true values
being inseparable from the carbon coating and oxygen was removed due to the minerals of
interested being arsenides and sulphides.
2.3 LA-ICPMS
Comprehensive trace element (LILE, HFSE, transition metals and semi metals, and
REE) analyses (spot and rastered maps) of uraninite were obtained by laser ablation
inductively-coupled plasma mass spectrometry (LA-ICPMS) at the Department of Earth
Sciences, University of New Brunswick. The measurements were acquired using a pulsed
(20 ns) 193 nm ArF Excimer laser ablation system (Resonetics RESOlution M-50) coupled
to an Ar- plasma quadrupole ICP-MS (Thermo Scientific X Series II). The ablation system
employs a two-volume Laurin Technic sample cell. Measurements were done with a 10 ms
dwell time for each analyte isotope, a forward torch power of 1450 W, gas flow rates of 0.8
13
l/min, 0.65 l/min and 6 ml/min for Ar, He and N2, respectively, and laser fluence of 6
J/cm2. The raw data (in cps vs. time) were quantified using the Iolite software package
(Paton et al. 2011), with synthetic NIST SRM 610 glass used as an external reference
material to calibrate analyte sensitivities and mean value U (70 wt. % determined by SEM-
EDS) as the internal standard for uraninite. This value is slightly off of the true values for
uraninite which are show to be 65 wt % ± 5% wt. The BHVO-2G reference glass was used
as a QC monitor. Three thick sections were analyzed to acquire trace element data (both
REE’s and metals) from uranium phases in the samples. Thick sections were used due to
the concern that thin sections might be too thin for laser ablation to be an effective means
of analysis.
Selected uraninite grains were also mapped using LA-ICPMS. To prepare for laser
ablation, the samples were cleaned, to ensure no carbon coating remained from when they
were subjected to SEM BSE. A short, wide radius beam was applied to the mapping area
prior to mapping to remove any arsenic coating/contamination from the area as it can
produce erroneous results from prolonged washout times.
2.4 Raman Spectroscopy
Preliminary Raman analyses were performed on an unknown uranium phase in
order to identify it. It was conducted at Saint Mary’s University using a Jobin-Yvon Horiba
LabRam HR confocal Raman microscope with an 800 mm spectrograph and Synapse 1024
x 256 pixel CCD detector. A 600 groves/mm grating and 15 µm confocal hole size were
used during spectrum collection, with a 532 nm (green) Nd-YAG laser (105 mW laser
power at objective) at 1% power, was used for excitation, directed through a 50x objective.
Pure silicon was used as a frequency calibration standard. Spectrum collection over the
range 100-4500 cm-1 was done at an acquisition of 20s per accumulation with 3
accumulations obtained per analysis.
3.0 Results
3.1 Models
Both uranium enriched and uranium absent five metal deposits (also known as
polymetallic) have been characterized, leading to the development of multiple models
14
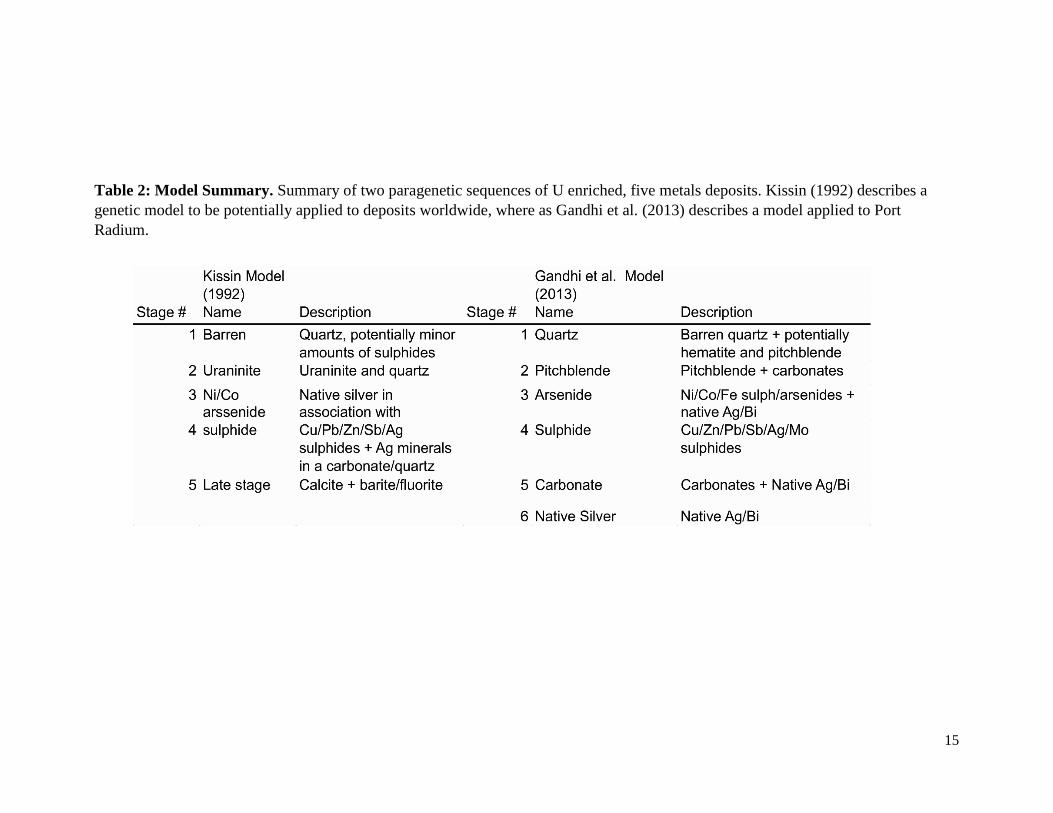
throughout the years (Gandhi et al., 2013; Kissin, 1992). We will be exclusively looking at
the models for the uranium-enriched five metal deposits. The models we will be using as a
basis, is that of Kissin (1992) and Gandhi et al. (2013). Table 2 summarizes the two
different paragenetic interpretations. The descriptions are the major minerals of each stage.
Other minor minerals may be present, such as quartz or carbonates.
3.2 Ore mineralogy and textures
A total of 18 polished sections (15 thin sections and 3 thick sections) of ore veins
and wall rock were examined using the petrographic microscope and SEM, and mineral
phases were identified. Native metals, sulphides, aresnides, sulpharsenides, carbonates,
quartz and several oxides were identified. They were based on the weight percent values
given by the INCA software and a comparison with mineral values from the Web Mineral
Mineral database.
Several wall rock phases are present; it is difficult to determine their mineralogy
due to alteration. Massive hematization and chloritization replaces the minerals and this
occurred before the precipitation of many of these following stages. We do know that these
are the volcanics from previous studies.
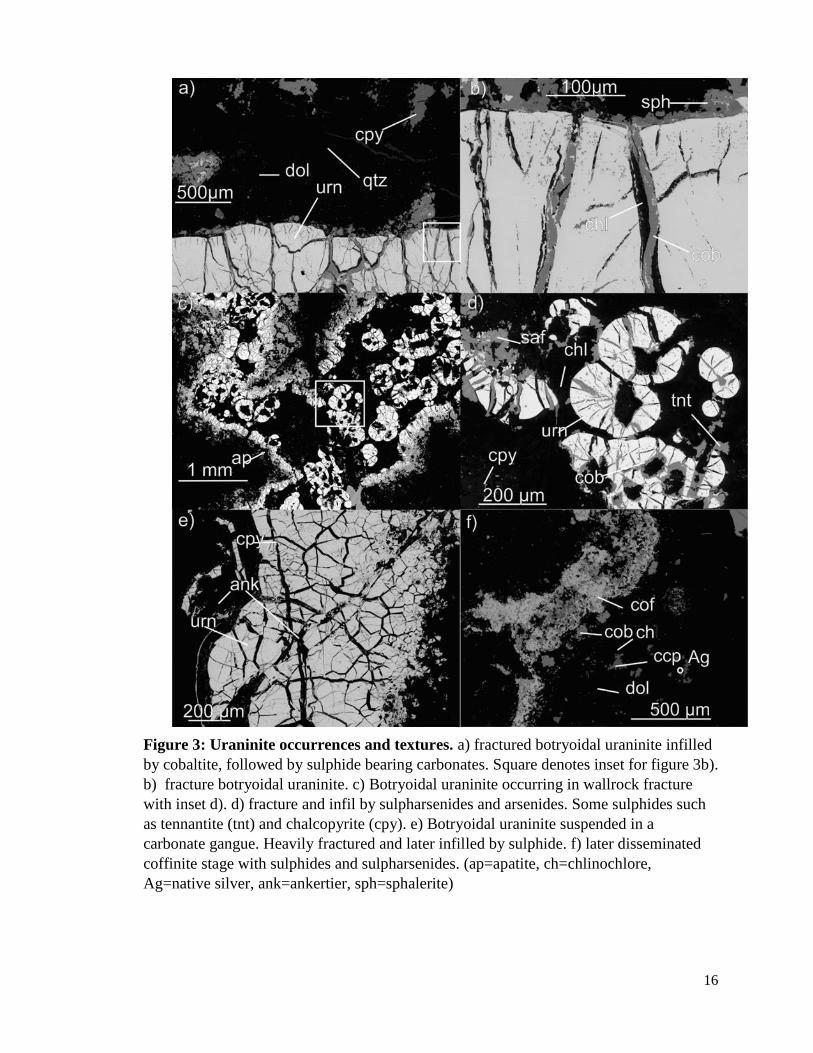
Multiple episodes have formed uraninite and coffinite, evident by textural and chemical
difference between them. Within this text, uranium phases will be referred to as primary
and secondary occurrences. Primary uranium phases are characterized by open growth
texture, which in this study is mainly botryoidal uraninite. Secondary uranium phases
which seem to be remobilisations characterized by disseminated uranium phases. Fig. 3a
to 3e show 3 occurrences of primary uraninite, with no spatial relationship between them.
Fig. 3b is the inset in Fig. 3a, giving a magnified view of the fractures and rim of the
botryoidal uraninite. Within the fractures and along the edge of the grains, there is cobaltite,
a cobalt sulpharsenide. Within the rim of the uraninite grain are inclusions that are not
associated with fractures. The nature of the inclusions will be discussed in a later section.
Within the carbonates and infilling voids in the sulpharsenides, chalcopyrite and sphalerite.
15
Table 2: Model Summary. Summary of two paragenetic sequences of U enriched, five metals deposits. Kissin (1992) describes a
genetic model to be potentially applied to deposits worldwide, where as Gandhi et al. (2013) describes a model applied to Port
Radium.
16
Figure 3: Uraninite occurrences and textures. a) fractured botryoidal uraninite infilled
by cobaltite, followed by sulphide bearing carbonates. Square denotes inset for figure 3b).
b) fracture botryoidal uraninite. c) Botryoidal uraninite occurring in wallrock fracture
with inset d). d) fracture and infil by sulpharsenides and arsenides. Some sulphides such
as tennantite (tnt) and chalcopyrite (cpy). e) Botryoidal uraninite suspended in a
carbonate gangue. Heavily fractured and later infilled by sulphide. f) later disseminated
coffinite stage with sulphides and sulpharsenides. (ap=apatite, ch=chlinochlore,
Ag=native silver, ank=ankertier, sph=sphalerite)
17
Fig. 3c and 3d are another primary occurrence, this time hosted within a fractured
wall rock. This uraninite is also botryoidal in nature, the main difference visually between
these images and the previous is the axis along which they are cut. With these samples,
however we can see a similar history, of fracturing and infilling by cobaltite and safflorite,
followed by sulphide bearing carbonates. This uraninite also has inclusions. Fig. 3e shows
a more heavily fractured occurrence of primary uraninite, the curvature indicative of
botryoidal texture is visible on the left-hand side of the image, with the right hand being
where the mineral was likely previously attached to the wall rock. The uraninite is
surrounded by ankerite. The sulphides found present in all occurrences are similar with
chalcopyrite being dominant. Fig. 3f shows one occurrence of a secondary coffinite,
disseminated with cobaltite within the dolomitic matrix.
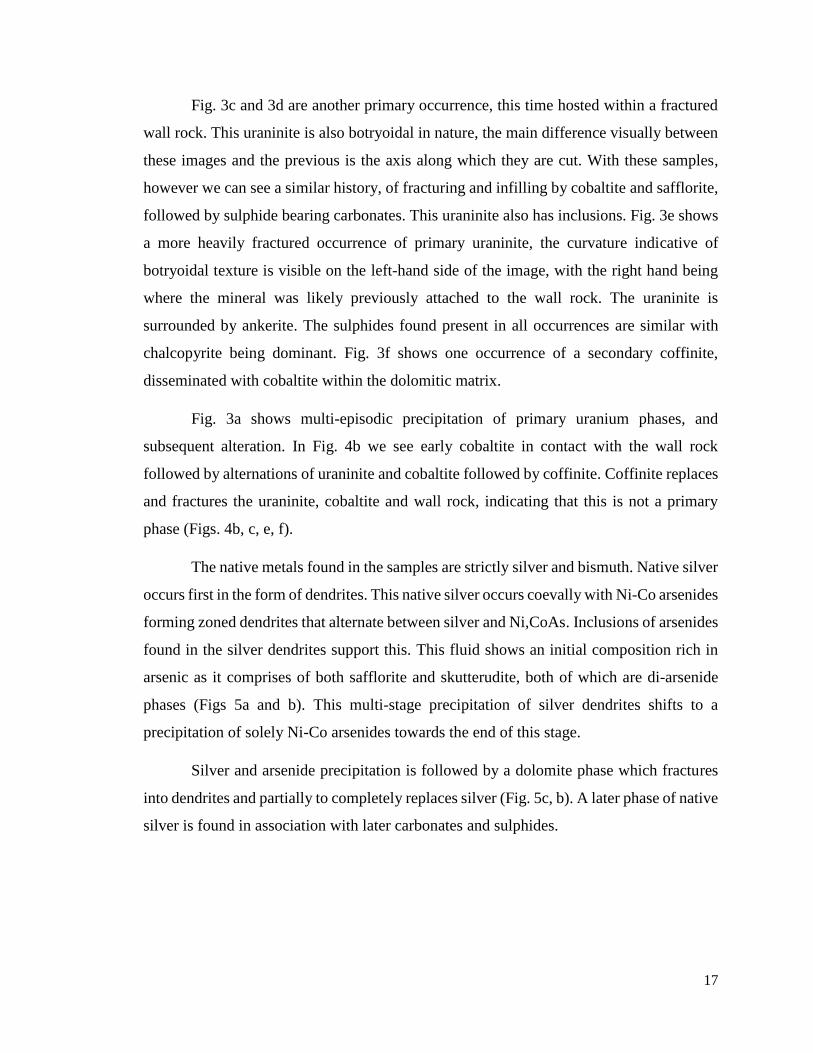
Fig. 3a shows multi-episodic precipitation of primary uranium phases, and
subsequent alteration. In Fig. 4b we see early cobaltite in contact with the wall rock
followed by alternations of uraninite and cobaltite followed by coffinite. Coffinite replaces
and fractures the uraninite, cobaltite and wall rock, indicating that this is not a primary
phase (Figs. 4b, c, e, f).
The native metals found in the samples are strictly silver and bismuth. Native silver
occurs first in the form of dendrites. This native silver occurs coevally with Ni-Co arsenides
forming zoned dendrites that alternate between silver and Ni,CoAs. Inclusions of arsenides
found in the silver dendrites support this. This fluid shows an initial composition rich in
arsenic as it comprises of both safflorite and skutterudite, both of which are di-arsenide
phases (Figs 5a and b). This multi-stage precipitation of silver dendrites shifts to a
precipitation of solely Ni-Co arsenides towards the end of this stage.
Silver and arsenide precipitation is followed by a dolomite phase which fractures
into dendrites and partially to completely replaces silver (Fig. 5c, b). A later phase of native
silver is found in association with later carbonates and sulphides.
18
Figure 4: Coffinite alteration of repetitive uraninite. Coffinite/Uraninite (cof/urn) along wall rock displayed in a). b) and e) show
coffinite replacing uraninite, displacing the cobaltite (cob) present. c) Botryoidal section showing the interactions of all phases +
ankerite (ank) matrix. d) and f) demonstrate the alternating sequences of sulpharsenides and uranium bearing phases with d) showing a
complete dissolution with only the cobaltite shell remaining.
19
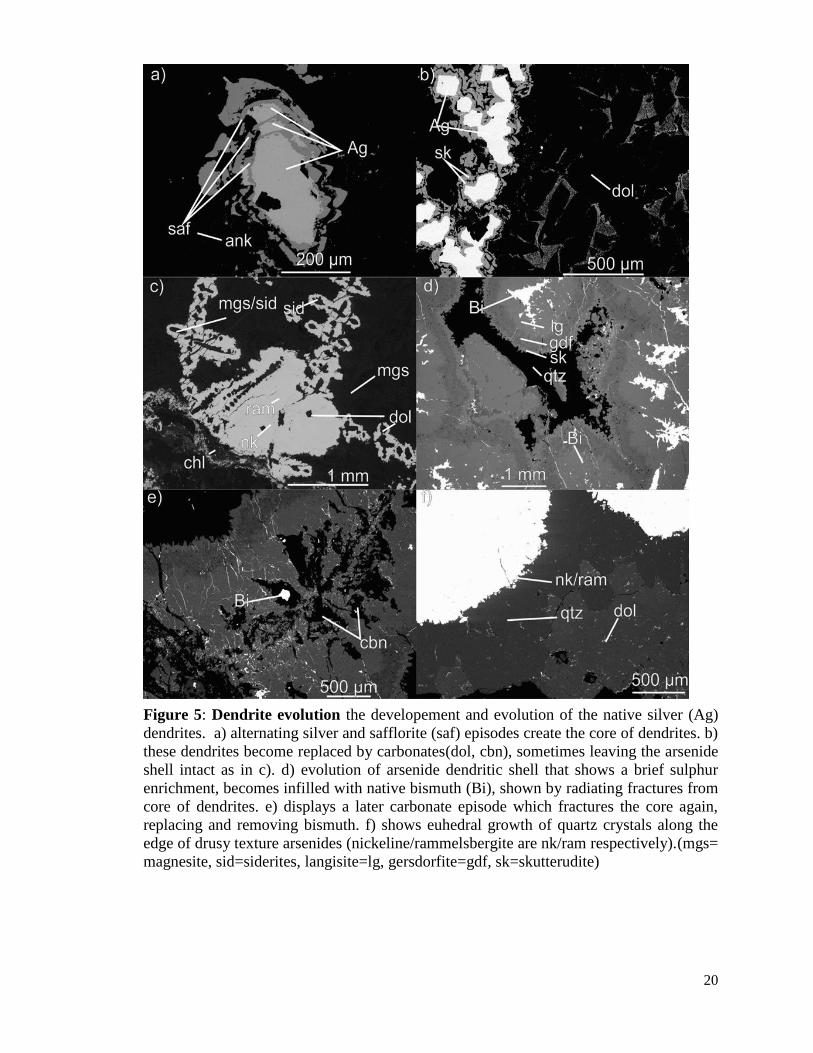
The composition of the arsenides is highly variable, however a trend is visible in
the larger grains. As we move rim-ward from the core dendrites, we see a gradational
change in the colour (Fig. 5d). We notice a bright phase change into a briefly darker phase
before a sharp contact between it and another bright phase. This darker portion represents
a brief enrichment of sulphur, resulting in a shift of mineralogy from the nickeline and
langisite to cobaltite and gersdorfite [endmembers having a composition of (Co,Ni)AsS].
This period is quite brief as it returns to a sulphur lacking, arsenic rich composition such
as rammelsbergite or skutterudite [ (Ni,Co)As3 and NiAs2 respectively].
Bismuth came at a later interval of the arsenide stage. Bismuth fractures the
dendrites and it removed the silver core of the dendrites and it heavily fractured the Ni-Co
arsenides phases surrounding it. This event is shown as well in Fig. 5d. The bismuth
composition has changed in the thin fractures increase in sulphur content increases to where
it becomes bismuthenite, this may be it removing the sulphur from the environment, but
this is interpretation is solely based on textural and chemical relationships.
Multiple quartz phases are present in the paragenetic sequence and these
characterized by texture. Several of the samples show large equant grains of quartz
followed by sulphide bearing carbonates infilling gaps between the crystals. Within the
large equant grains, we find open space filling, acicular hematite. Quartz can also occur as
small equant grains that surround the arsenides previously mentioned. They can also be
seen as reprecipitated quartz.
None-alteration based hematite is almost exclusively in acicular form, however it
does not interact with the calcite present so its relationship to timing is hard to infer. Coarse
grained quartz are follows by a grainy calcite phase that begins to fracture once again the
Ni-Co phase, this carbonate is low in calcium but high manganese. This phase remobilises
the bismuth and replaces it in the dendrite voids. This relationship has been seen before in
Fig. 5c (the small thin veins of magnesite cutting through the dendrites) and as well in Fig.
5e. This episode has been seen to cut across the quartz phases. The relationship between
the smaller quartz phases, carbonates and drusy arsenides can be seen in Fig. 5f.
20
Figure 5: Dendrite evolution the developement and evolution of the native silver (Ag)
dendrites. a) alternating silver and safflorite (saf) episodes create the core of dendrites. b)
these dendrites become replaced by carbonates(dol, cbn), sometimes leaving the arsenide
shell intact as in c). d) evolution of arsenide dendritic shell that shows a brief sulphur
enrichment, becomes infilled with native bismuth (Bi), shown by radiating fractures from
core of dendrites. e) displays a later carbonate episode which fractures the core again,
replacing and removing bismuth. f) shows euhedral growth of quartz crystals along the
edge of drusy texture arsenides (nickeline/rammelsbergite are nk/ram respectively).(mgs=
magnesite, sid=siderites, langisite=lg, gersdorfite=gdf, sk=skutterudite)
21
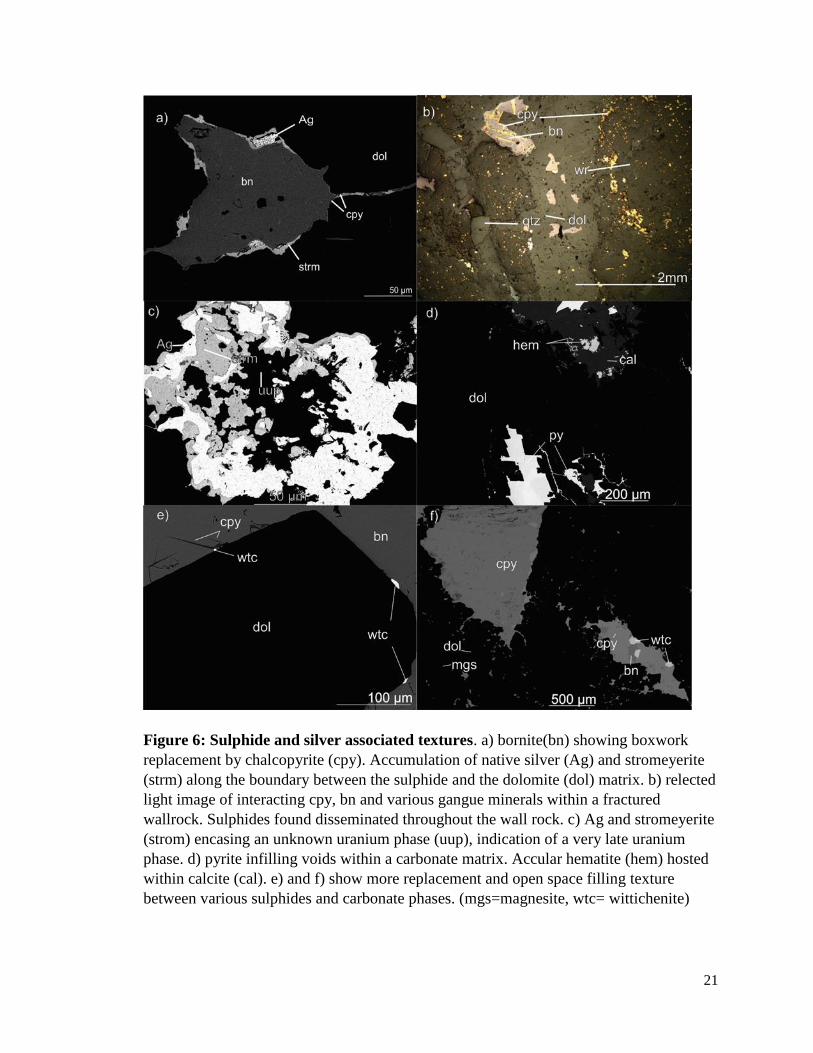
Figure 6: Sulphide and silver associated textures. a) bornite(bn) showing boxwork
replacement by chalcopyrite (cpy). Accumulation of native silver (Ag) and stromeyerite
(strm) along the boundary between the sulphide and the dolomite (dol) matrix. b) relected
light image of interacting cpy, bn and various gangue minerals within a fractured
wallrock. Sulphides found disseminated throughout the wall rock. c) Ag and stromeyerite
(strom) encasing an unknown uranium phase (uup), indication of a very late uranium
phase. d) pyrite infilling voids within a carbonate matrix. Accular hematite (hem) hosted
within calcite (cal). e) and f) show more replacement and open space filling texture
between various sulphides and carbonate phases. (mgs=magnesite, wtc= wittichenite)
22
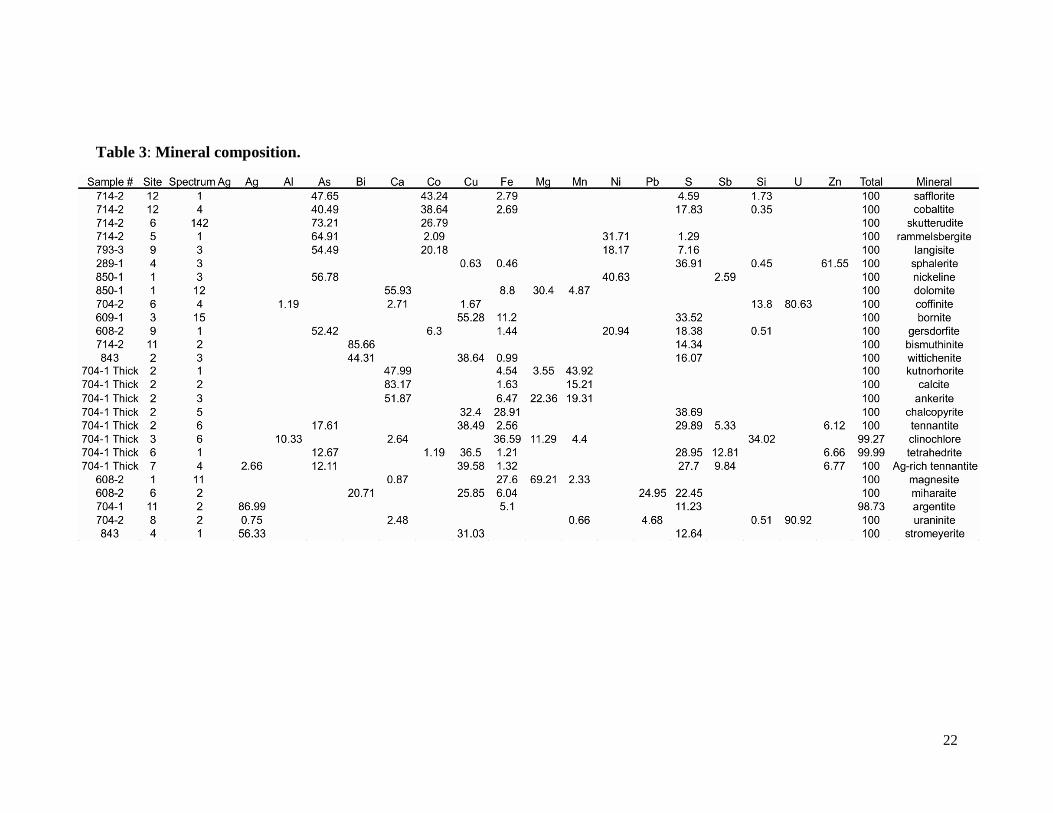
Table 3: Mineral composition.
23
The carbonate phases in this system are extremely varied in both textures and
compositions, the later which will be discussed in the following section. The carbonates
are displaying massive texture as well as clear equant grains of calcite of varying sizes.
Only one carbonate phase is described to be associated with sulphides, this being
the 4th stage in the models (Table 2). The sulphides range from chalcopyrite/bornite,
galena, tetrahedrite-tennantite as well as a more unique sulphide, wittichenite. The
chalcopyrite has been observed as both isolated grains and showing box-work texture with
the bornite. Multiple sulphide phases are seen to occur together within a single vein as in
Figure 6b.
These sulphides occur with a later silver phase, comprising of both native silver as
well as the appearance of stromeyerite (AgCuS) (Figure 6a). It is in this sulphide-silver
stromeyerite assemblage that we also see the unknown uranium phase (abbreviated to uup)
indicating another unique phase of remobilization. Figure 6c) shows the relationship of the
silver and stromeyerite encompassing the uup in the dolomite/sulphide matrix of stage 4.
The uup composition will be discussed in section 3.4. Pyrite (Fig. 6d) can be seen infilling
voids and fractures of the dolomite. In close proximity to the dolomite, acicular hematite
is encased in a calcite matrix. Sparse wittichenite, chalcopyrite and bornite are all see in
encompassing (Fig. 6e) or infilling (Fig. 6f) dolomite crystals or matrix. Table 3 shows a
summary of the major minerals found within the system.
3.3 Accessory Mineral Chemistry
A large variation in chemical composition of Ni-Co minerals and carbonates was
observed. The Ni-Co phases show variations between end-members (some inclusion of Fe
is present as well) as well as the inclusion of sulphur into the structure during the brief
enrichment period.
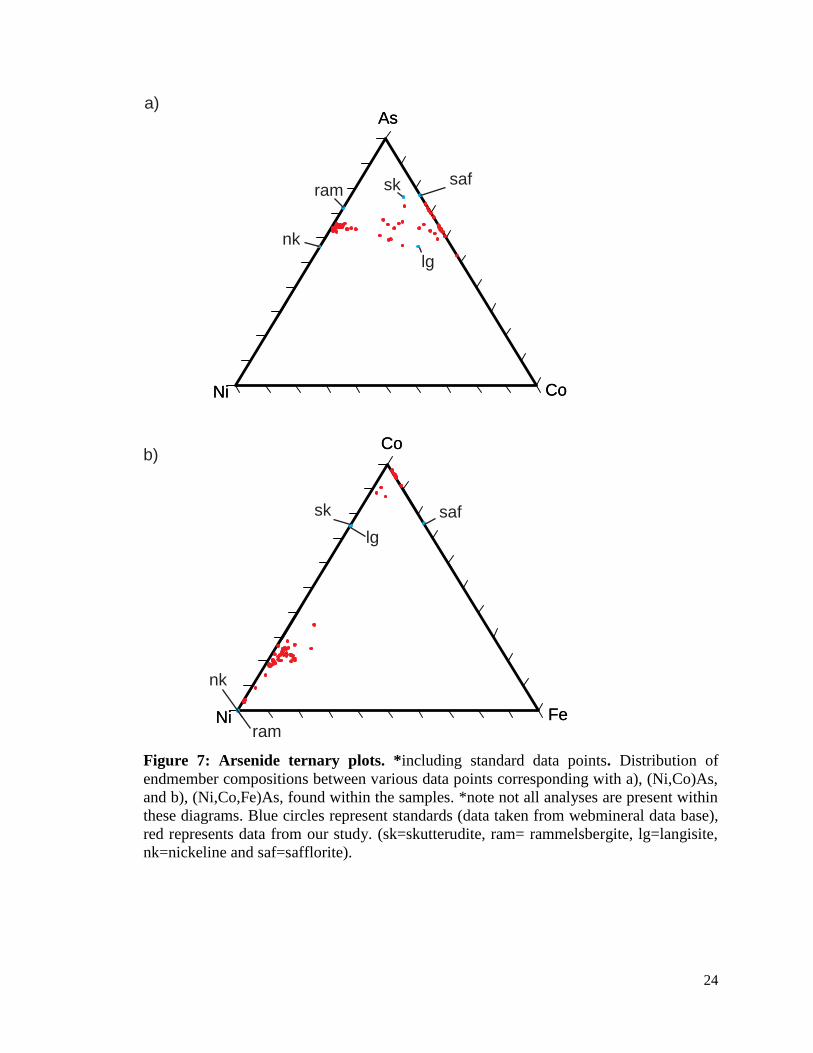
The Ni-Co aresnides have been plotted on two diagrams in Fig. 7. Figure 7a shows a triplot
diagram illustrating the relationship between nickel, cobalt and arsenic. It shows that many
samples plot between nickeline or rammelsbergite for nickel-rich samples or plotting near
Co-rich safflorite. A dozen samples plot in the middle of the diagram, representing Ni- rich
24
Co
FeNi
Co
FeNi
b)
a)As
CoNi
As
CoNi
saf
lg
skram
nk
nk
ram
sk
lg
saf
Figure 7: Arsenide ternary plots. *including standard data points. Distribution of
endmember compositions between various data points corresponding with a), (Ni,Co)As,
and b), (Ni,Co,Fe)As, found within the samples. *note not all analyses are present within
these diagrams. Blue circles represent standards (data taken from webmineral data base),
red represents data from our study. (sk=skutterudite, ram= rammelsbergite, lg=langisite,
nk=nickeline and saf=safflorite).
25
dolomite (Mg)
kutnohorite (Mn)ankerite (Fe)
magnesite (Mg)
rhodocrosite (Mn)siderite (Fe)
a)
b)
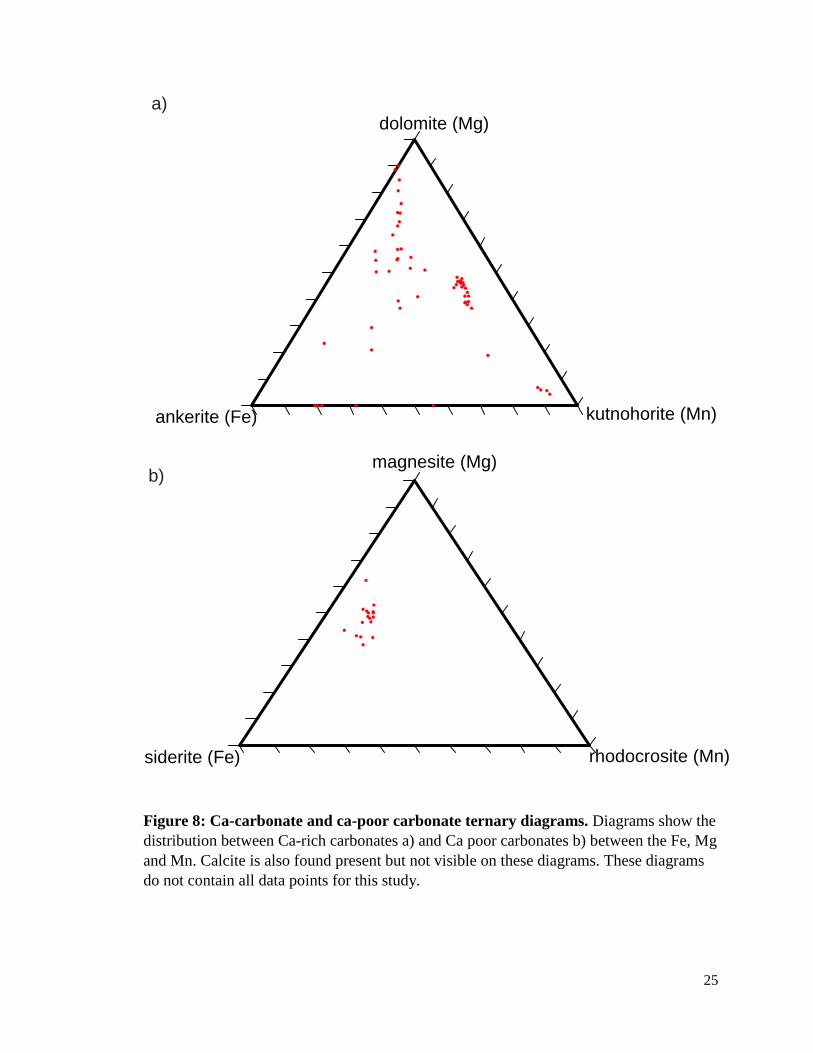
Figure 8: Ca-carbonate and ca-poor carbonate ternary diagrams. Diagrams show the
distribution between Ca-rich carbonates a) and Ca poor carbonates b) between the Fe, Mg
and Mn. Calcite is also found present but not visible on these diagrams. These diagrams
do not contain all data points for this study.
26
langisite. Fig 7b illustrates the relationship between Ni, Co and Fe. We see an obvious lack
in Fe within the arsenides, as the majority of analyses are near Ni or Co.
The carbonates in the system are Mg, Fe and/or Mn rich and either calcium-rich (such as
dolomite, calcite, etc.) or calcium poor (siderite, etc.). Fig. 8a shows the calcium
compositions from a portion of the samples and depict two groups. One group showing a
composition placed between dolomite and kutnohorite (the magnesium and manganese
endmembers respectively. The second group shows a movement from a mix of Mg and Fe-
rich carbonates to dolomite. Fig. 8b shows the composition of a small portion of the
calcium-poor carbonate samples, all of which have a similar composition between
magnesite and siderite.
3.4 Uranium mineral chemistry
An advantage this study has over some of the older studies of the area is access to
modern analytical techniques. One of these methods, LA-ICP-MS, has allowed us to
accurately determine the trace elements present in the uranium phases of Port Radium. Spot
analysis was done on three spatially distinct botryoidal occurrences. An element map was
generated using laser ablation from one of these botryoidal areas to see if the composition
varied within one depositional occurrence. Laser ablation was conducted solely on uranium
phases and when possible, avoided areas containing arsenides. This is due to the effect of
arsenic on the receptor as it contaminates it and has long washout times.
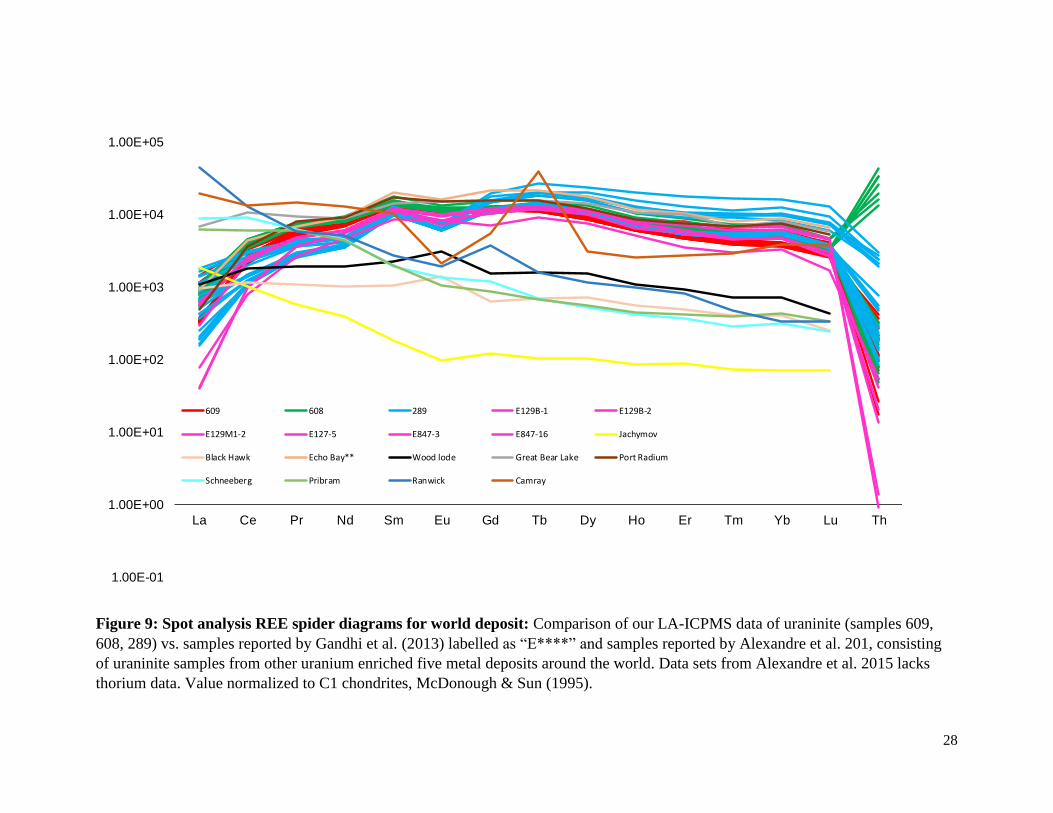
Primary uraninite examined in this study exhibits high HREEN/LREEN ratios with
slight negative Eu anomalies and variable Th contents (Fig. 9 and 10)
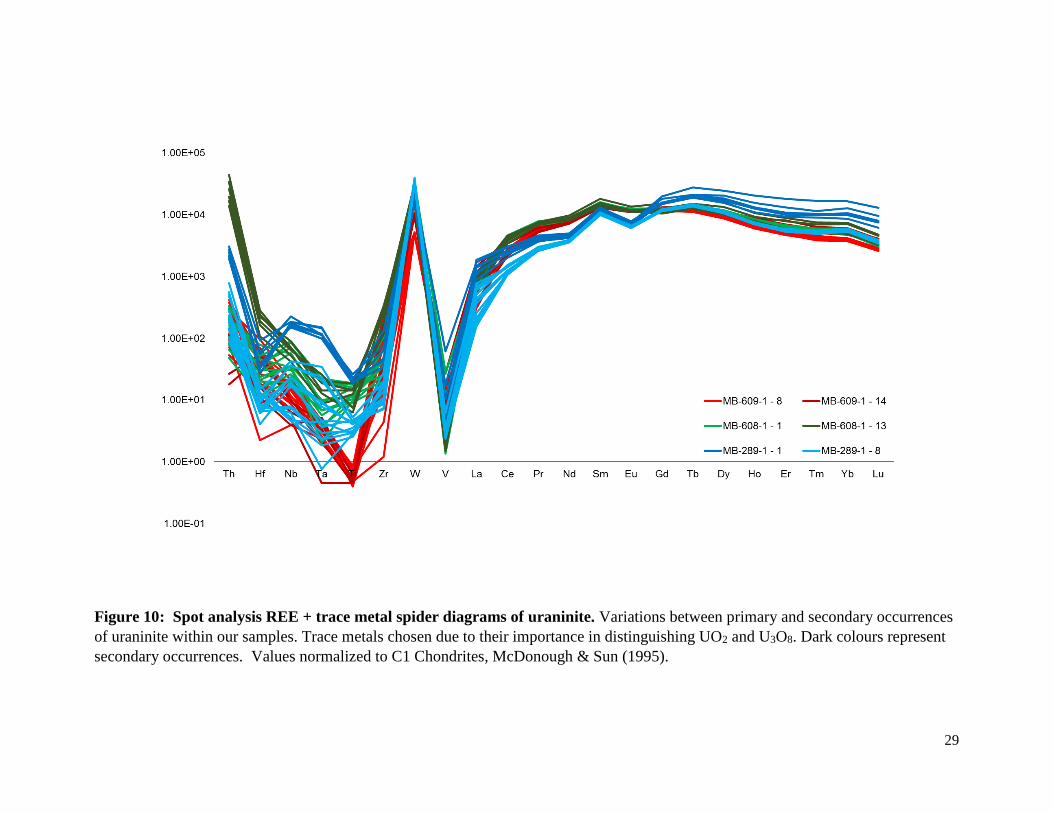
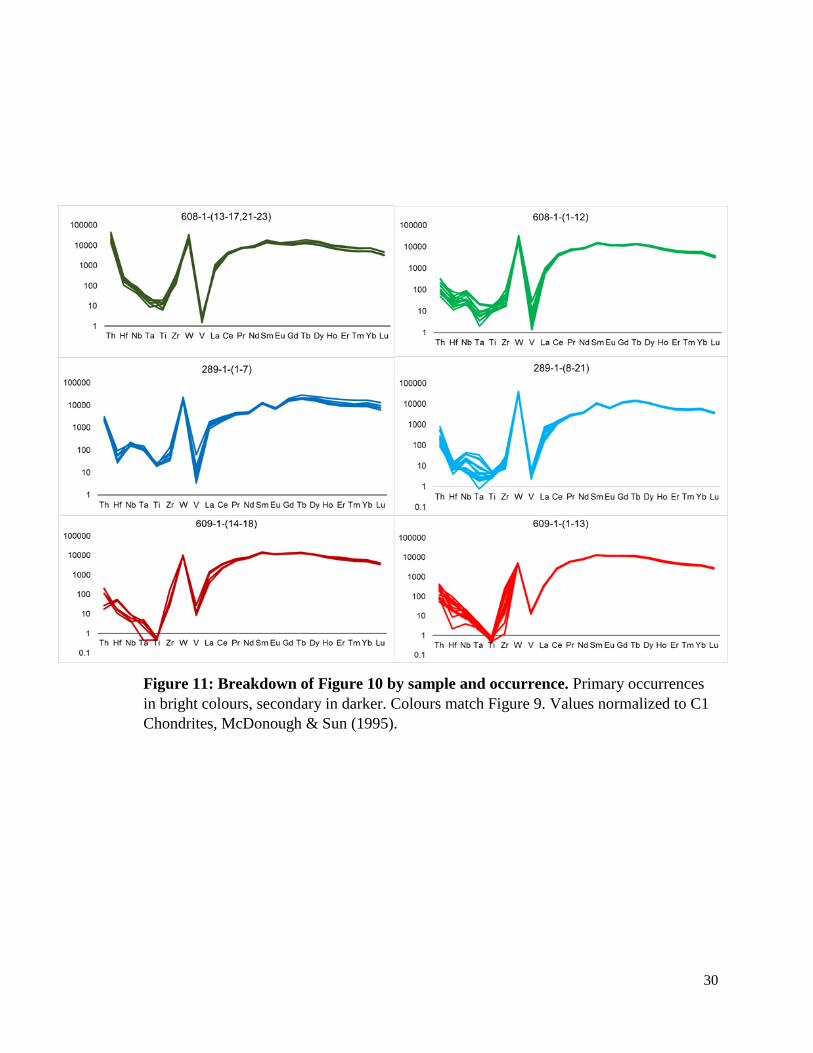
Fig. 10 and 11 show the chondrite normalized trace element patterns for both
primary and secondary uranium occurrences. Based off the data for REEs and trace
elements, all the primary uraninite data (brighter colours) show extremely similar trends in
HREE composition and some variation within the LREEs. Their trace metal composition
does vary (Fig. 10); some elements show orders of magnitude in differences such as Hf.
Data points from one of the occurrences show a difference of 1 to 2 orders of magnitude in
Ti concentrations when compared to the other samples.
27
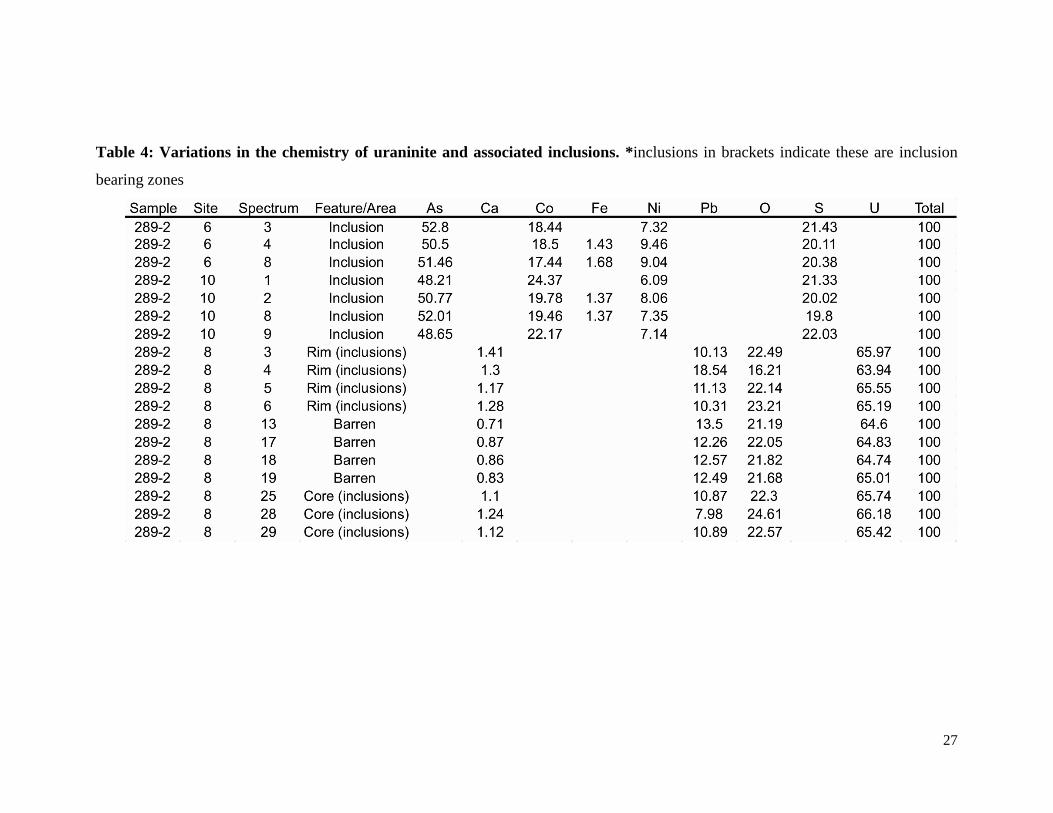
Table 4: Variations in the chemistry of uraninite and associated inclusions. *inclusions in brackets indicate these are inclusion
bearing zones
28
1.00E-01
1.00E+00
1.00E+01
1.00E+02
1.00E+03
1.00E+04
1.00E+05
La Ce Pr Nd Sm Eu Gd Tb Dy Ho Er Tm Yb Lu Th
609 608 289 E129B-1 E129B-2
E129M1-2 E127-5 E847-3 E847-16 Jachymov
Black Hawk Echo Bay** Wood lode Great Bear Lake Port Radium
Schneeberg Pribram Ranwick Camray
Figure 9: Spot analysis REE spider diagrams for world deposit: Comparison of our LA-ICPMS data of uraninite (samples 609,
608, 289) vs. samples reported by Gandhi et al. (2013) labelled as “E****” and samples reported by Alexandre et al. 201, consisting
of uraninite samples from other uranium enriched five metal deposits around the world. Data sets from Alexandre et al. 2015 lacks
thorium data. Value normalized to C1 chondrites, McDonough & Sun (1995).
29
Figure 10: Spot analysis REE + trace metal spider diagrams of uraninite. Variations between primary and secondary occurrences
of uraninite within our samples. Trace metals chosen due to their importance in distinguishing UO2 and U3O8. Dark colours represent
secondary occurrences. Values normalized to C1 Chondrites, McDonough & Sun (1995).
30
Figure 11: Breakdown of Figure 10 by sample and occurrence. Primary occurrences
in bright colours, secondary in darker. Colours match Figure 9. Values normalized to C1
Chondrites, McDonough & Sun (1995).
31
The darker graphs in Fig 10 and 11 reflect trace element compositions of secondary
uraninite occurrences. These uraninites show every similar REE patterns and
concentrations to the primary uraninite found in their respective samples. One exception is
the secondary uraninite in sample 289, which has consistently higher REE contents than
the primary event, while following a similar trend. Compared to primary uraninite,
secondary uraninite contains higher Th contents. The secondary uraninite in sample 289
shows higher Nb, Ti and Ta over its primary phase but follows the same trend.
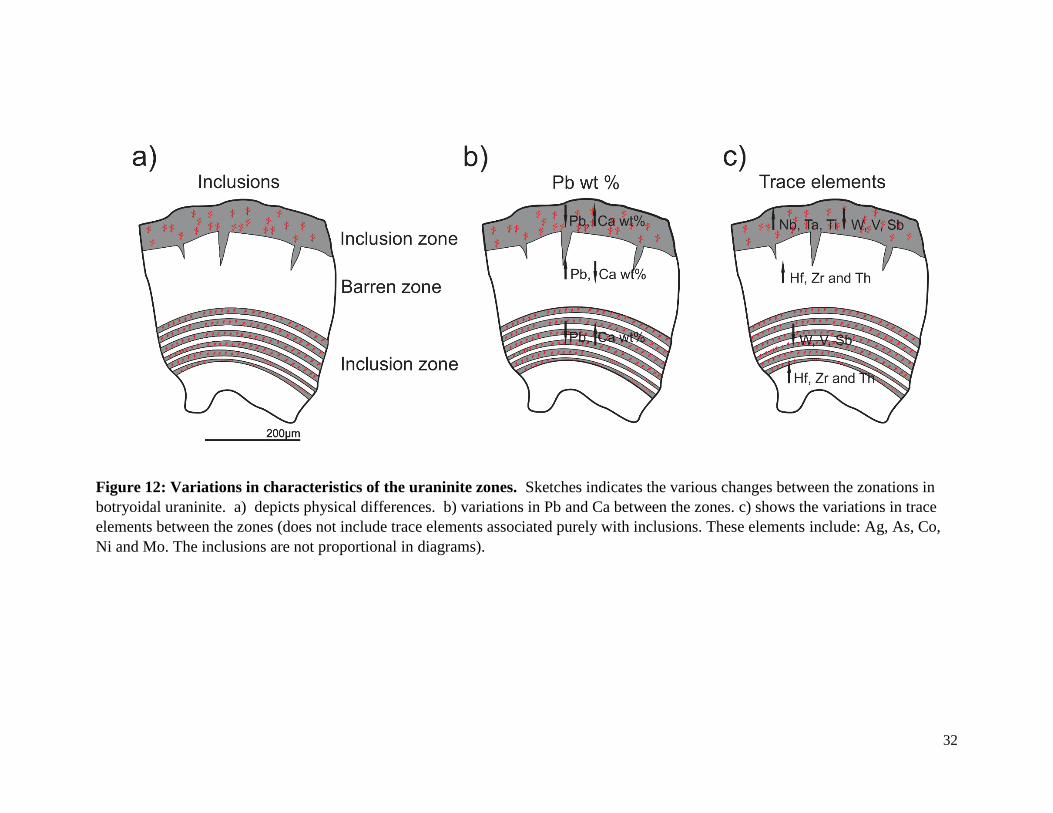
Primary botryoidal uraninite is zoned, with alternating dark and light zones
following its crystal habit. Dark areas were also observed along fractures. Darker zones
contain 9-12 wt% Pb and 1-2 wt% Ca as opposed to brighter areas that contain 12-15% wt
% Pb and less than 1 wt% Ca. Fig. 12 shows the distribution of these features and others.
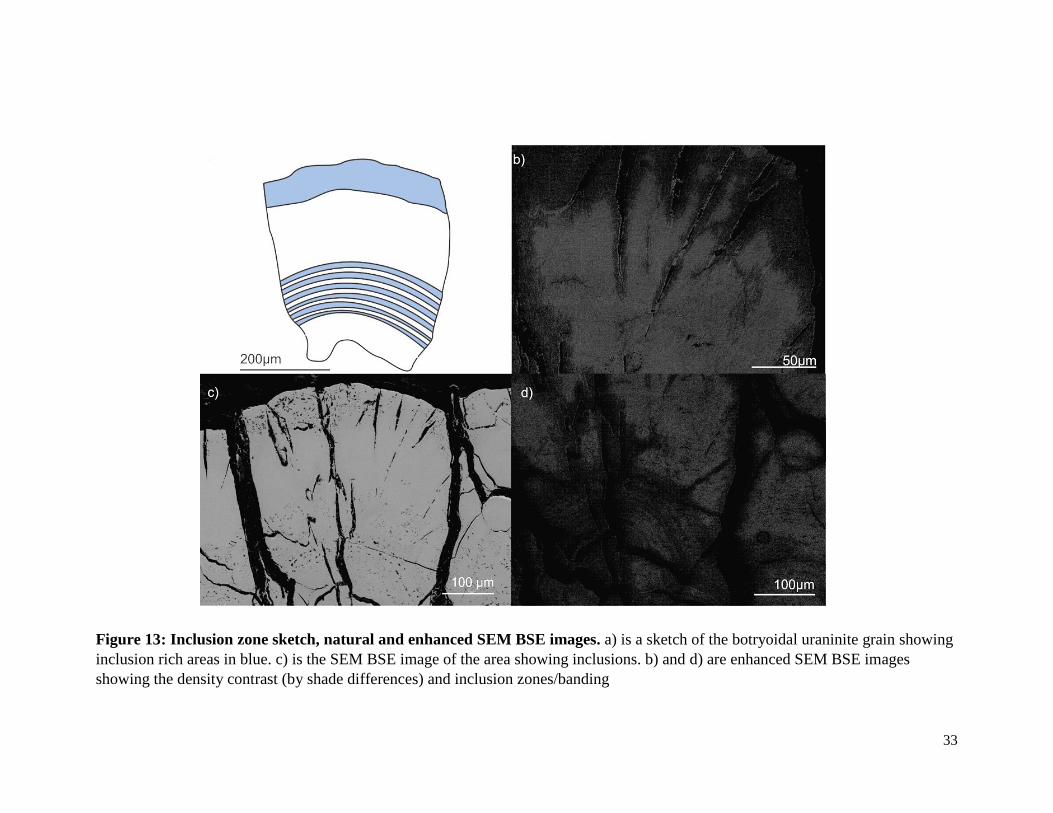
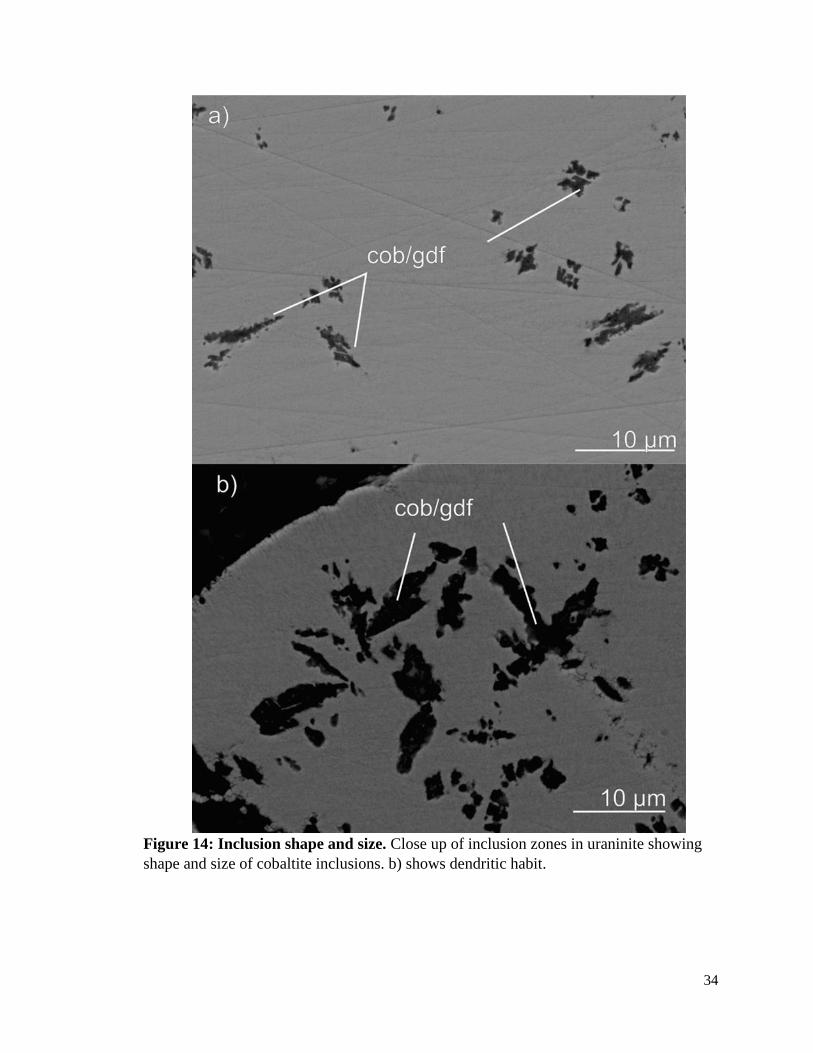
The darker areas that follow concentric growth zones are rich in inclusions of cobaltite
(Fig. 13). The inclusions are ~ 1 to 10 µm in size, exhibit dendritic habit and are also
distributed solely in the darker zones (Fig. 14). Table 4 shows the compositions of the
inclusions and the variations in Pb and Ca content between them.
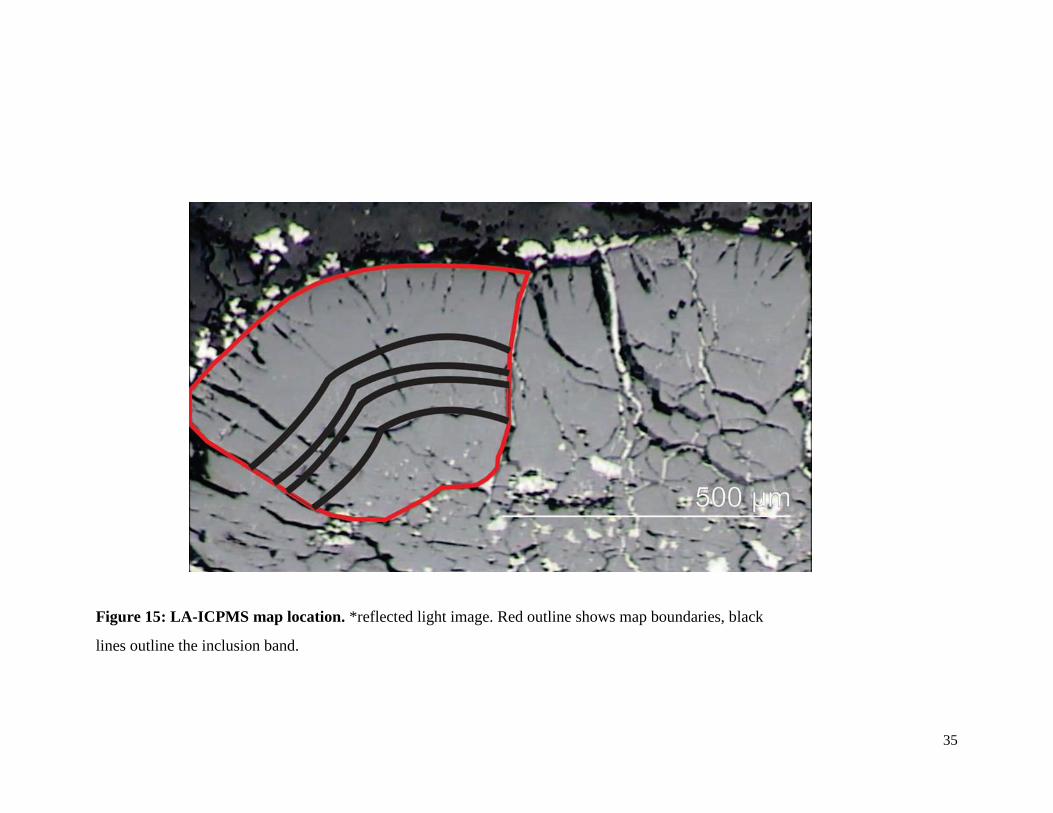
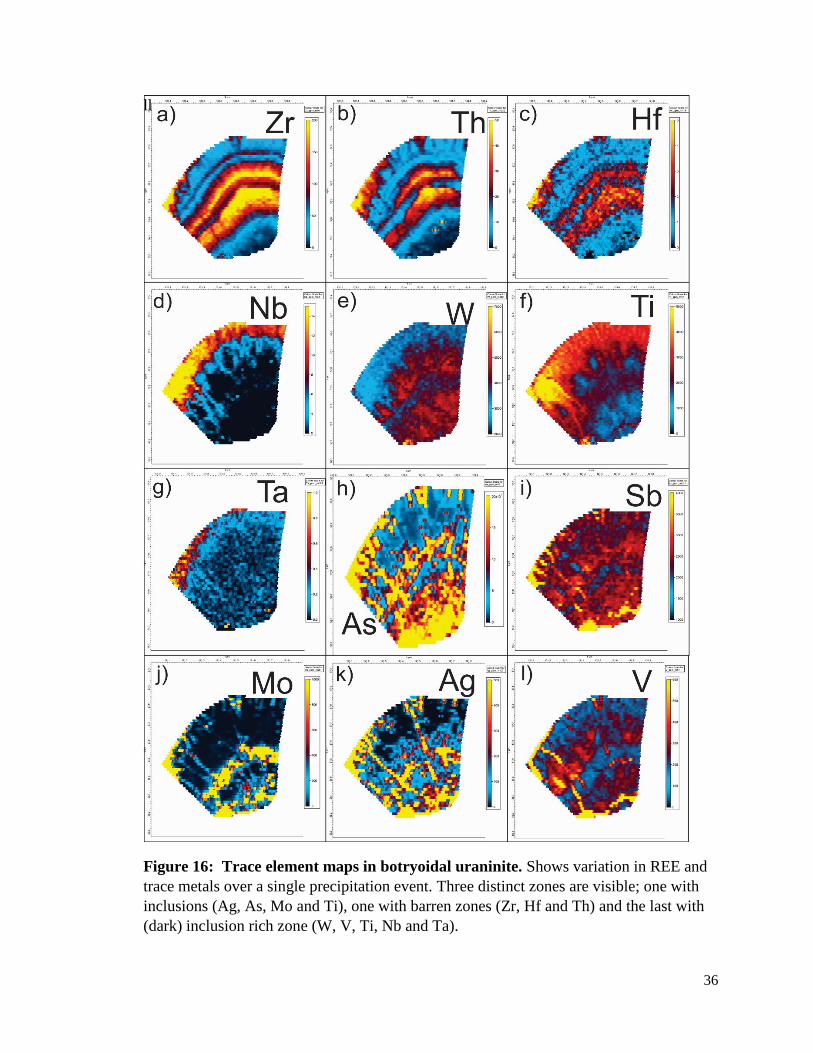
Laser ablation was conducted on large botryoidal section (Fig. 15). The element
maps show that bright, inclusionless zones contain high Th, Hf and Zr, whereas the darker
zones contain high Ti, Ta and Nb with low W, V and Sb. (Fig. 16). Metals such as Ag, As,
Co, Ni, Mo and Ti as associated with the inclusions present within the dark zones.
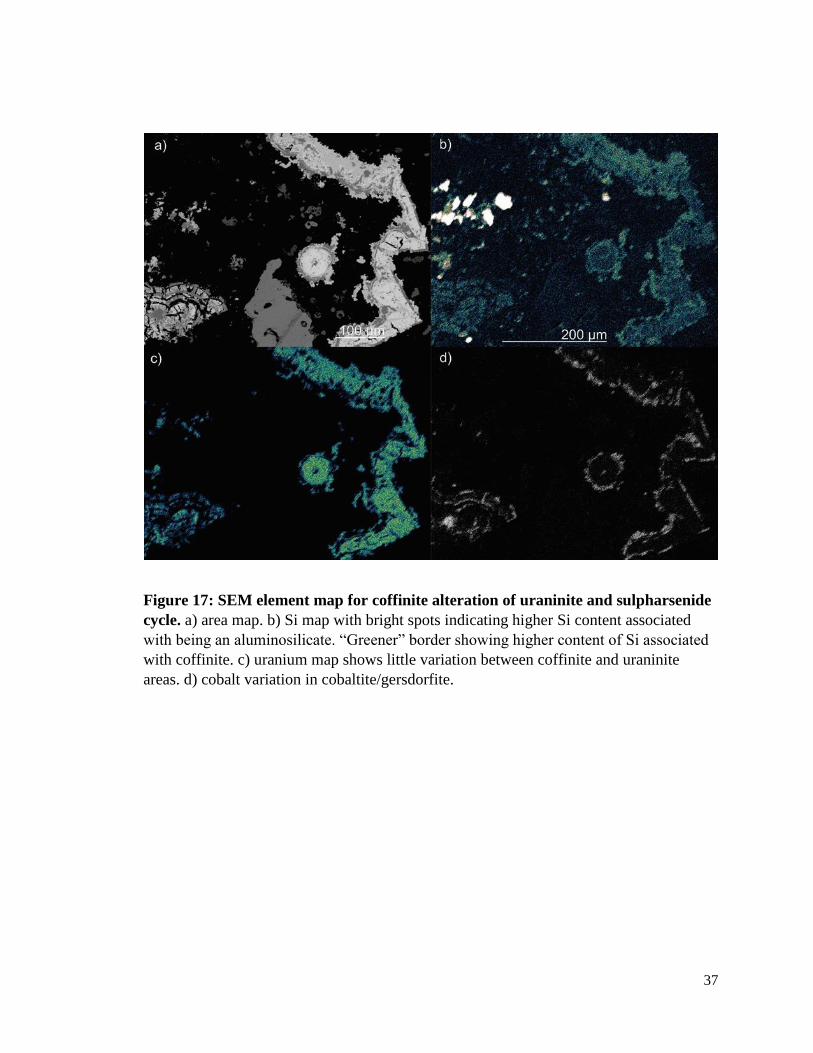
Uraninite altered by coffinite in Fig. 3 was mapped using the SEM (Fig. 17).
Coffinite shows very little variations in uranium contents compared to uraninite (Fig. 17c).
Coffinite contains slightly higher silica which is most notable around the edges of the wall
rock (Fig. 17b). The bright spots are associated with aluminosilicates within the gangue.
Later secondary occurrences of uranium have been noted, showing low U wt %
(approx. 30%) and high O compared to all other occurrences of an uranium bearing
mineral.
32
Figure 12: Variations in characteristics of the uraninite zones. Sketches indicates the various changes between the zonations in
botryoidal uraninite. a) depicts physical differences. b) variations in Pb and Ca between the zones. c) shows the variations in trace
elements between the zones (does not include trace elements associated purely with inclusions. These elements include: Ag, As, Co,
Ni and Mo. The inclusions are not proportional in diagrams).
33
Figure 13: Inclusion zone sketch, natural and enhanced SEM BSE images. a) is a sketch of the botryoidal uraninite grain showing
inclusion rich areas in blue. c) is the SEM BSE image of the area showing inclusions. b) and d) are enhanced SEM BSE images
showing the density contrast (by shade differences) and inclusion zones/banding
34
Figure 14: Inclusion shape and size. Close up of inclusion zones in uraninite showing
shape and size of cobaltite inclusions. b) shows dendritic habit.
35
Figure 15: LA-ICPMS map location. *reflected light image. Red outline shows map boundaries, black
lines outline the inclusion band.
36
ll
Figure 16: Trace element maps in botryoidal uraninite. Shows variation in REE and
trace metals over a single precipitation event. Three distinct zones are visible; one with
inclusions (Ag, As, Mo and Ti), one with barren zones (Zr, Hf and Th) and the last with
(dark) inclusion rich zone (W, V, Ti, Nb and Ta).
37
Figure 17: SEM element map for coffinite alteration of uraninite and sulpharsenide
cycle. a) area map. b) Si map with bright spots indicating higher Si content associated
with being an aluminosilicate. “Greener” border showing higher content of Si associated
with coffinite. c) uranium map shows little variation between coffinite and uraninite
areas. d) cobalt variation in cobaltite/gersdorfite.
38
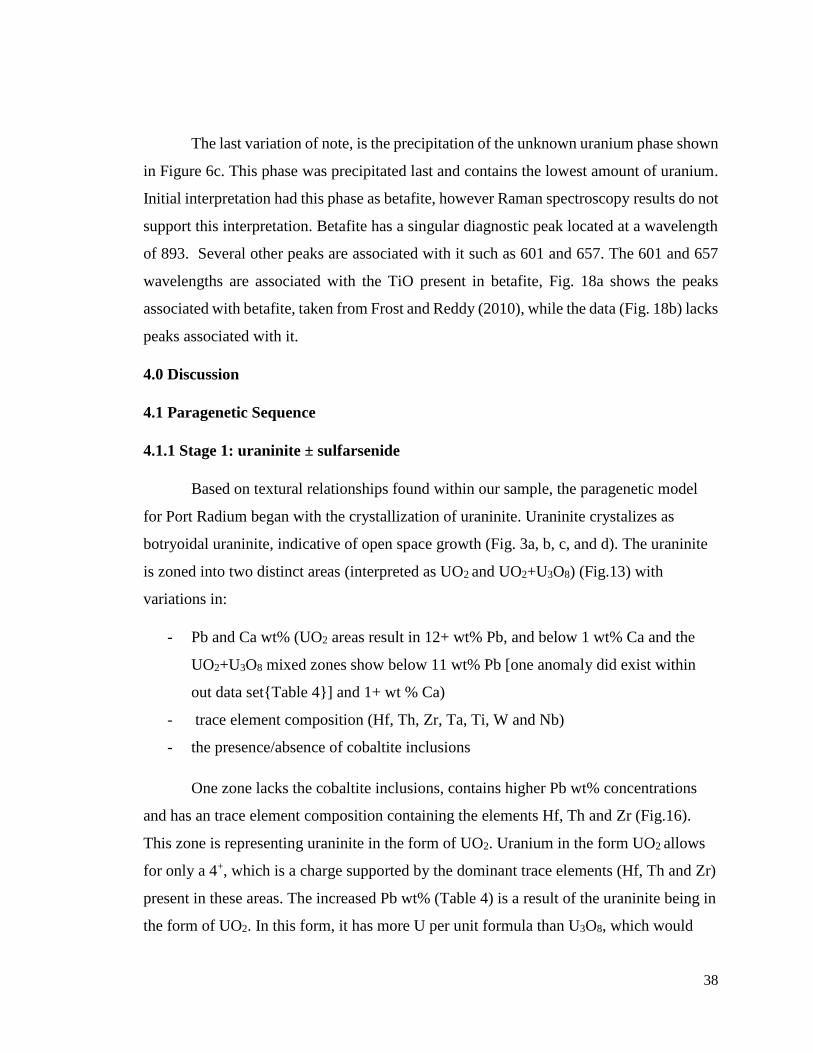
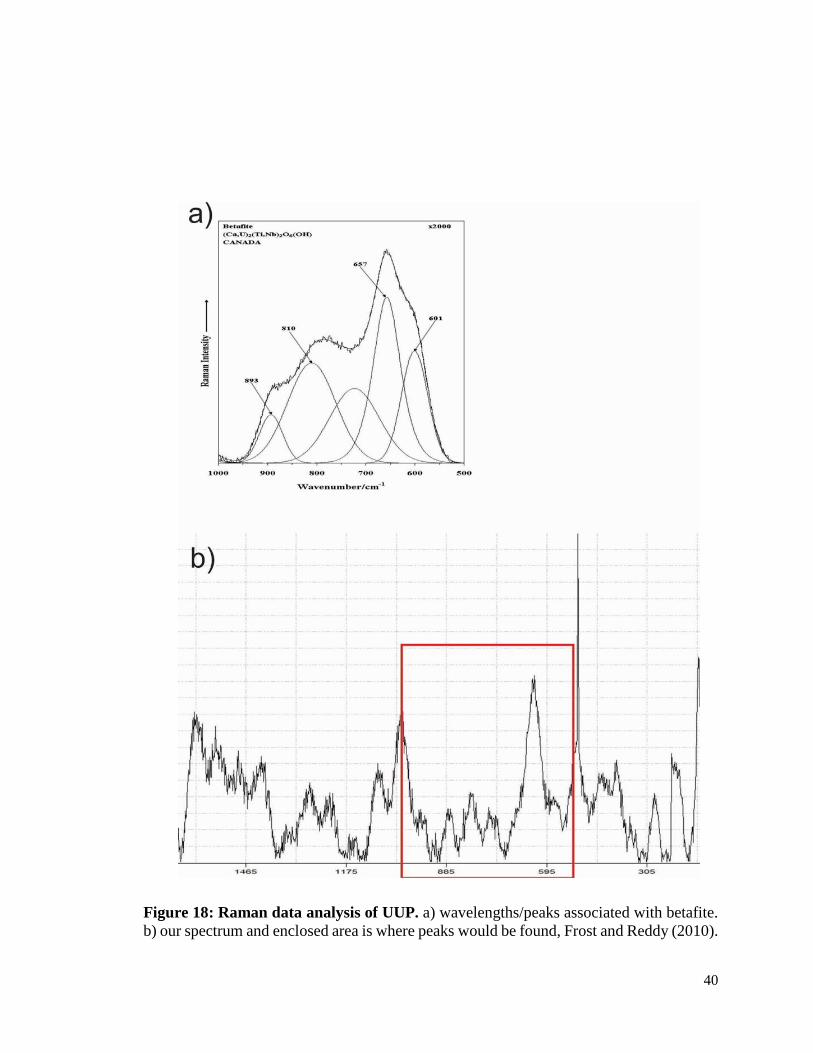
The last variation of note, is the precipitation of the unknown uranium phase shown
in Figure 6c. This phase was precipitated last and contains the lowest amount of uranium.
Initial interpretation had this phase as betafite, however Raman spectroscopy results do not
support this interpretation. Betafite has a singular diagnostic peak located at a wavelength
of 893. Several other peaks are associated with it such as 601 and 657. The 601 and 657
wavelengths are associated with the TiO present in betafite, Fig. 18a shows the peaks
associated with betafite, taken from Frost and Reddy (2010), while the data (Fig. 18b) lacks
peaks associated with it.
4.0 Discussion
4.1 Paragenetic Sequence
4.1.1 Stage 1: uraninite ± sulfarsenide
Based on textural relationships found within our sample, the paragenetic model
for Port Radium began with the crystallization of uraninite. Uraninite crystalizes as
botryoidal uraninite, indicative of open space growth (Fig. 3a, b, c, and d). The uraninite
is zoned into two distinct areas (interpreted as UO2 and UO2+U3O8) (Fig.13) with
variations in:
- Pb and Ca wt% (UO2 areas result in 12+ wt% Pb, and below 1 wt% Ca and the
UO2+U3O8 mixed zones show below 11 wt% Pb [one anomaly did exist within
out data set{Table 4}] and 1+ wt % Ca)
- trace element composition (Hf, Th, Zr, Ta, Ti, W and Nb)
- the presence/absence of cobaltite inclusions
One zone lacks the cobaltite inclusions, contains higher Pb wt% concentrations
and has an trace element composition containing the elements Hf, Th and Zr (Fig.16).
This zone is representing uraninite in the form of UO2. Uranium in the form UO2 allows
for only a 4+, which is a charge supported by the dominant trace elements (Hf, Th and Zr)
present in these areas. The increased Pb wt% (Table 4) is a result of the uraninite being in
the form of UO2. In this form, it has more U per unit formula than U3O8, which would
39
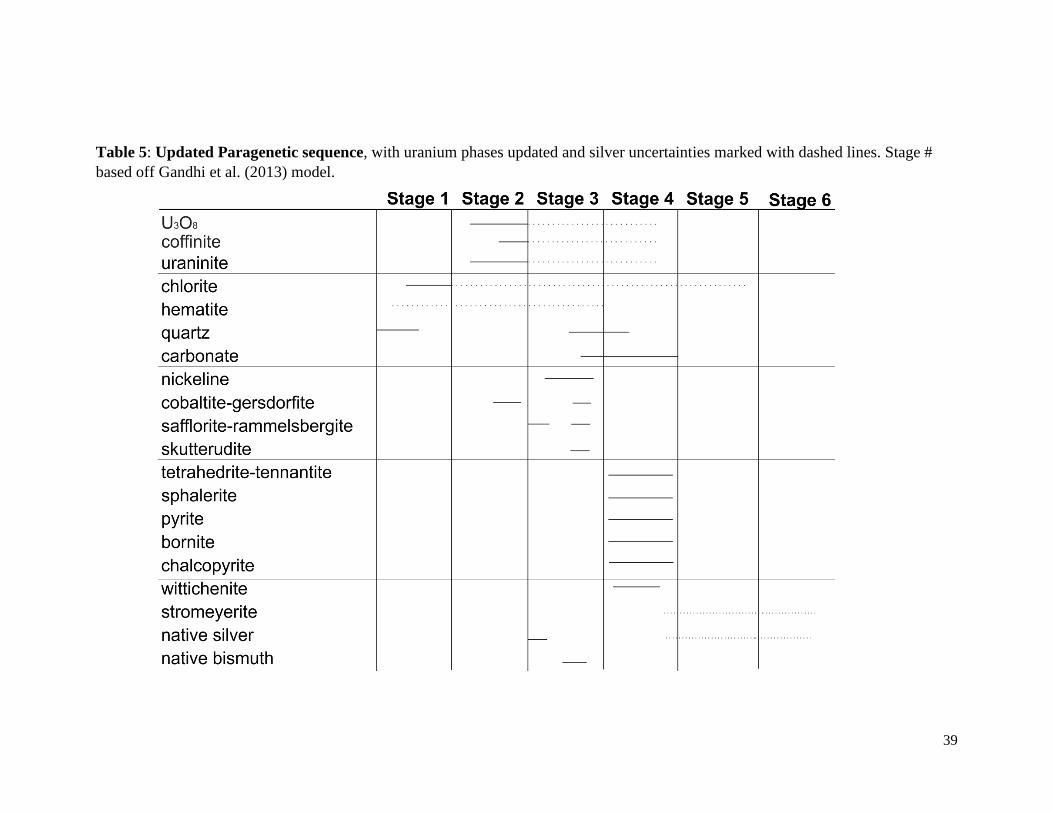
Table 5: Updated Paragenetic sequence, with uranium phases updated and silver uncertainties marked with dashed lines. Stage #
based off Gandhi et al. (2013) model.
40
Figure 18: Raman data analysis of UUP. a) wavelengths/peaks associated with betafite.
b) our spectrum and enclosed area is where peaks would be found, Frost and Reddy (2010).
41
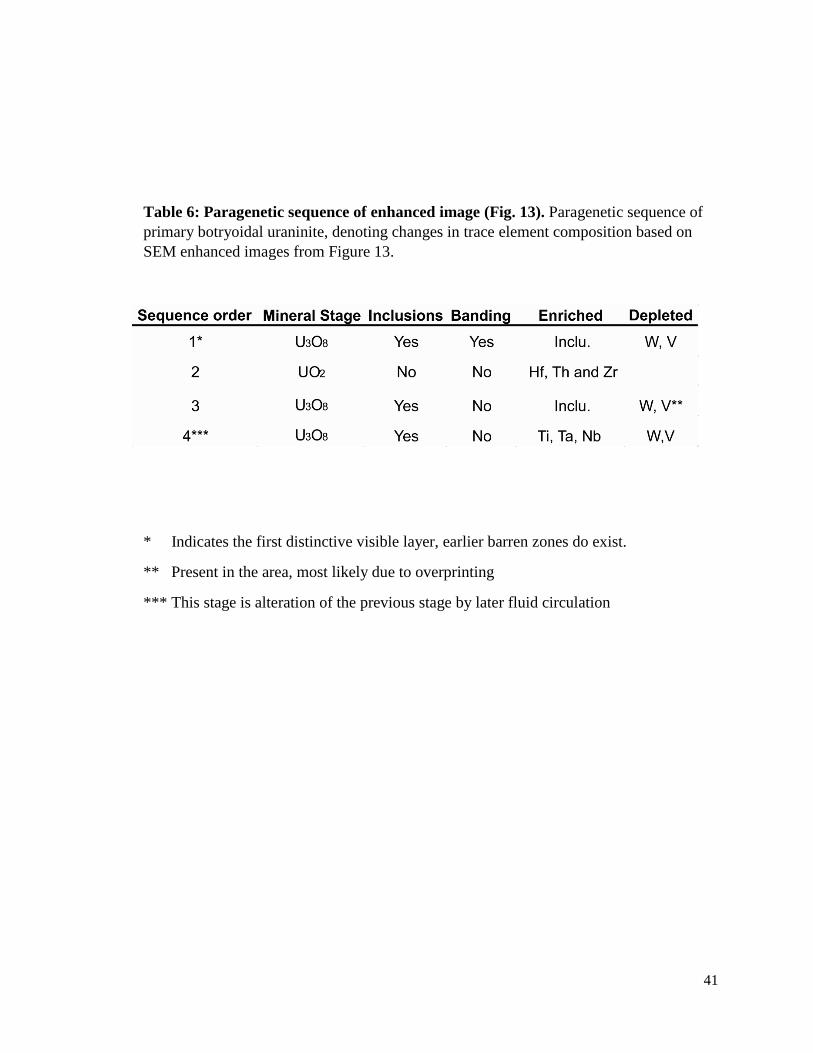
Table 6: Paragenetic sequence of enhanced image (Fig. 13). Paragenetic sequence of
primary botryoidal uraninite, denoting changes in trace element composition based on
SEM enhanced images from Figure 13.
* Indicates the first distinctive visible layer, earlier barren zones do exist.
** Present in the area, most likely due to overprinting
*** This stage is alteration of the previous stage by later fluid circulation
42
produce more Pb as it decays through time.This interpretation assumes that all Pb has
been the result of radioactive decay and that no reprecipitation of the uraninite has
occurred. The Ca wt% in these zones were all below 1 wt%, no explanation has been
found by this study.
The second zone seen is the zones with the inclusions. The uraninite in these
zones are interpreted as a mix of UO2 and U3O8. The presence of UO2 in these zones can
explain the presence of the Ti and W as their charges are all 4+ while the presence of
U3O8 could explain the Nb and Ta with the 5+/6+ charges. It can also explain the lower Pb
content as it contains less Pb due to it having less U per unit formula. The trace elements
associated with this zone have the charges 4+,5+ and 6+. We see an inverse relationship
(Fig. 16) present between W and Ti, both have a charge of 4+. We see a depletion in V in
these inclusions bearing zones and an enrichment in Nb and Ta. The depletions in the
middle of the grain of W and V are interpreted to be primary depletions as they are
present in the center of the grain in a uniform band where as the W/Ti relationship and
the Nb, Ta enrichments in the appear to be the result of later circulating fluids as they
follow fractures within the grain. These areas showed Ca wt % values above 1 wt%, once
again, no explanation can be given. The uraninite has been described to show two
different relationships with the sulfarsenides: as inclusions as well as bands within
uraninite (Fig 14 and 4 respectively). It is unknown if these occurrences are precipitated
from the exact same event. The uraninite associated with the sulfarsenide bands are noted
to have Si present within its structure and is seen being altered to coffinite (Fig. 17b),
while the uraninite with the inclusions lacks this association with Si.
The inclusions are cobaltite in composition and are of primary origin as they are
not restricted along fracture zones or show evidence to be precipitated with remobilised
uraninite. There are two possibilities of primary formation of these inclusions, they are
either the result of exsolution crystallization or are coeval. These inclusions display a
texture interpreted to be dendritic texture (Fig. 14), which is indicative of open space
growth. This indicates that the sulfarsenide inclusions co-precipitated with the uraninite.
There is a trace element composition associated with these sulfarsenides (Fig. 16)
showing enrichments in Ti, As, Mo and Ag as well as a depletion in Sb.
43
4.1.2 Stage 2: arsenides ± Ag, Bi
This stage begins with the precipitation of Ag dendrites. The Ag precipitation has
been in two different styles; once where silver was precipitated continuously until it was
followed by the formation of an arsenide shell (Fig. 5d), or there as an alternation
between Ag and an arsenide (Fig. 5a) creating multiple thin layers of each metal, then
moves into the formation of the arsenide shell. As the arsenide dendrites grow, their
composition becomes more Ni rich until they reach either a NiAs (nickeline) or NiAs2
(rammelsbergite) composition before their formation stops.
In some instances, a brief period of sulphur enrichment is visible around the rim
of these dendrites. This enrichment indicated by the abrupt change to a darker coloration
of the dendrite SEM images around the edge (Fig. 5d and 5e).
After the formation of the dendrites, they are later intruded by native Bi (Fig. 5e
and 5d) which replaces the Ag cores of the arsenide dendrites. This occurs after the full
formation of the dendrite as we can see small fractures cutting across the dendrite leaves,
but it occurs before the emplacement of the gangue minerals as the fractures halt at the
interaction between the gangue and dendrite (Fig. 5d).
4.1.3 Stage 3: sulphide ± U, Ag and carbonate
Sulphides are found disseminated in both the wall rock as well as in later forming
carbonate. Chalcopyrite is the dominant sulphide found disseminated in carbonate or in
conjunction with bornite showing box work texture (Fig.6b and 6e). Other sulphides found
include: sphalerite, pyrite, wittichenite (Cu3BiS3) and tetrahedrite-tennantite.
A late U phases, native Ag and stromeyerite (AgCuS) occur with the carbonate-
hosted sulfides. These minerals occur as an irregular zoned anhedral mass with Uup at the
core, mantled by stromeyerite and rimmed by Ag (Fig. 6c). Native Ag and stromeyerite
also occurs along the rim of a bornite chalcopyrite grains (Fig. 6a).
The carbonates within our system can be divided into two main groups; Ca-rich and Ca-
poor (Fig 8). The carbonates produced were dolomite, ankerite, kuthnorhorite, magnesite,
rhodochrosite, siderite and caclite. Each group is comprised of the same three
44
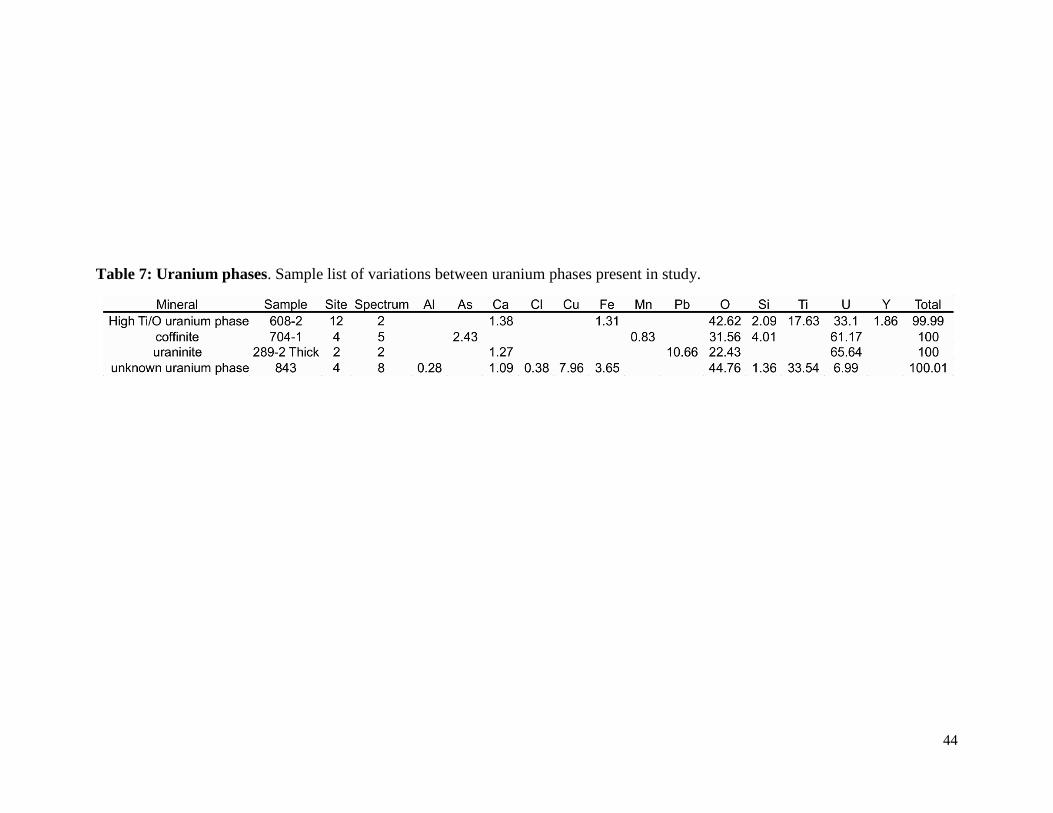
Table 7: Uranium phases. Sample list of variations between uranium phases present in study.
45
endmembers; Fe, Mg and Mn. Two trends were noted in their composition; the Ca-rich
contains a group of Mg-Mn rich carbonate and a Ca-poor trend of Fe-Mg composition. The
carbonates can be seen interacting with multiple phases, such as infilling cores of the
dendrites (Fig. 5c) or carrying the sulphides.
4.2 Comparisons to previous models
The reduction from 5+ stages to our three stages model occurred due to lack of
textural evidence of the presence of several stages as well as the overlap of precipitation
not previously mentioned in literature.
The first stage mentioned in the Gandhi et al. model (Table 2) is the barren quartz
stage. This stage is absent from our model due to the lack of textural evidence. Within
our samples, there exists large, euhedral grains of quartz, however there is no textural
relationship between it and another phase to confidently say it is the Stage 1: barren
quartz . The barren carbonate stage as well, could not be confidently identified in sample.
The final stage in the Gandhi et al. (2013) has been amalgamated with the
sulphide bearing stage as native Ag has been associated with an Ag-sulphide in all
instances within our samples (outside of our Stage 2 occurrences). Using the stages of the
Gandhi model, this relationship between native Ag and stromeyerite either extends the
precipitation of the sulphides into their Stage 6 or allows for the precipitation of native
Ag earlier than their stage 6. The presence of native Ag with the sulphides led to the
combination of the Stage 4 and 6 of the Gandhi model.
The uraninite within our samples displays a high HREEN/LREEN ratio (Fig. 10)
and displays similarities only with 2 grouping of samples when compared to sites from
around the world (Fig.9). The only samples to produce values similar too ours were the
samples from the Gandhi et al. (2013) study of Port Radium as well as the GBL
occurrence from the Alexandre et al. (2015) study. This GBL occurrence shows an
enrichment in Ce and La, as well it lacks the negative Eu anomaly that our samples
display (Fig.10).
46
4.3 Implications
The change within the individual uraninite grains from UO2 to U3O8 can likely be
attributed to a slight increase in fO2, such that the oxidation state changes from a 4+ to a
5+/6+ mix while still allowing for uraninite to precipitate. The role of pH on the chemistry
of the uraninite is unclear.
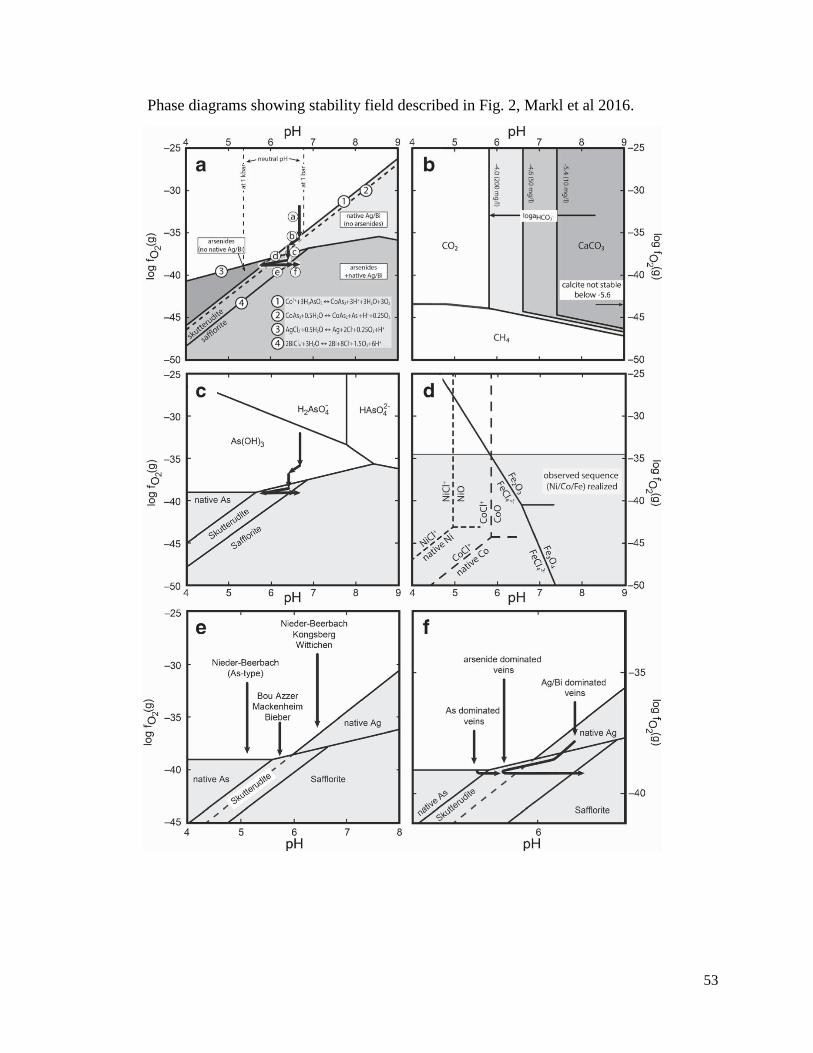
The overlap of the arsenides into the uranium phase is shown by the inclusions of
cobaltite within the uraninite grains. Arsenides require conditions of low fO2 and varying
pH levels to precipitate (see appendix, Markl et al. 2016). These inclusions coincide with
the U3O8 enriched zones within the uraninite. These inclusions are more likely the result
of coeval precipitation as the inclusions are portraying dendritic texture which is an open
growth texture. The other possibility is exsolution crystallization, however this is unlikely
as this would not result in dendritic texture. We see a change in composition of arsenides
and sulfarsenides as we move from these inclusions into the arsenide stage, Co to a more
Ni rich composition. Based off the phase diagrams shown in Markl et al., (2016) (see
appendix) this change results from a decrease in pH and require low fO2.
A mixing of fluids is a possible candidate to explain the relationships found within
this study, however the exact mechanism for precipitation is unknown and can only be
speculated as the mechanisms which force these phases (U3O8 and arsenides) are opposite
(increase in fO2 and low fO2 respectfully) and the purpose of this study was focused on
paragenetic sequence and
The very last stage of mineralization within the polymetallic model is native silver.
With the same phase diagrams from the Markl et al., (2016) paper, we see that to precipitate
native silver within these systems we need a shift back to more neutral levels of pH as well
as an increase in fO2 to precipitate the native Ag.
Our study indicates that the genesis of the polymetallic system at Port Radium
required a widely varying set of parameters it to precipitate. Future areas of study of this
environment could be analysis of the stable isotopes of uraninite to determine the fluid
source based off the isotope values of oxygen. Another area may be to determine the source
of the metals whether it be from a sedimentary basin or bitumen.
47
5.0 References:
Alexandre, P., Kyser, K., Layton-Matthews, D. and Joy, B., 2015, Chemical compositions
of natural uraninite, The Canadian Mineralogist, v. 53, p. 595-622.
Campbell, D.D., 1955, Geology of the pitchblende deposits of Port Radium, Great Bear
Lake, Northwest Territories: Unpublished Ph.D. thesis, Berkeley, U.S.A., California
Institute of Technology, 323 p.
Changkakoti, A., Morton, R.D. and Gray, J., 1986a, Hydrothermal environments during
the genesis of silver deposits in the Northwest Territories of Canada: Evidence from fluid
inclusions: Mineralium Deposita, v. 21, p. 63-69.
Corriveau, L., Montreuil, J. and Potter, E.G., 2016, Alteration Facies Linkages Among Iron
Oxide Copper-Gold, Iron Oxide-Apatite, and Affiliated Deposits in the Great Bear
Magmatic Zone, Northwest Territories, Canada: Economic Geology, v. 111, p. 2045-2072.
Frost, R. L. and Reddy, B. J, 2010, Raman spectroscopic study of the uranyl titanate
mineral betafite (Ca,U)2(Ti,Nb)2O6(OH)-Effect of metamictization, Radiation Effects and
Defects in Solids, v. 165(11), p 868-875.
Gandhi, S.S., Potter, E. and Fayek, M., New Constrains on genesis of the polymetallic
veins at Port Radium, Great Bear Lake, Northwest Canadian Shield. (Unpublished paper
26 p).
Gandhi, S.S., Potter, E. and Fayek, M., 2013, Polymetallic U-Ag veins at Port Radium,
Great Bear magmatic zone, Canada: main botryoidal pitchblende stage cuts 1.74 Ga
diabase dykes and has REE signatures diagnostic of unconformity-type deposits:
Geological Survey of Canada, Open File 7493, poster.
Jory, L.T., 1964, Mineralogical and isotopic relations in the Port Radium pitchblende
deposit, Great Bear Lake, Canada: Ph.D. thesis, Pasadena, California, California Institute
of Technology, 290 p.
Kidd, D.F. and Haycock, M.H., 1935, Mineragraphy of the Ores of Great Bear Lake:
Bulletin of the Geological Society of America, v. 46, p. 879-960.
48
Kissin, S.A., 1992, Five-element (Ni-Co-As-Ag-Bi) Veins: Journal of the Geological
Association of Canada, v. 19, p. 113-124.
Mercadier, J., Cuney M., Lach, P., Boiron, M.C.Bonhoure, J., Richard, A., Leisen, M., and
Kister, P., 2011, Origin of uranium deposits revealed by their rare earth element signature,
Terra Nova, v. 23.,p. 264-269
Markl, G., Burisch, M. and Neumann, U. 2016. Natural fracking and the genesis of five-
element veins, Mineralium Deposita
Reardon, N.C., 1992, Altered rocks and magnetite-apatite-actinolite deposits associated
with the mystery island intrusive suite, Echo Bay, district of Mackenzie. Mystery Island
intrusive suite final report. Geological Survey of Canada, Open file 2506, p 62
Silke, R, 2009, The operational history of mining in the Northwest Territories,
49
6.0 Acknowledgements
I would like to take this time to thank several individuals for their help and input through
this entire process. First off, I would like to thank Dr. Jacob Hanley (Saint Mary’s
University) for his tutelage and taking me on as an honours student for the past year. His
mentorship has formed the basis of my geological career. Secondly, I would like to thank
Dr. Erin Adlakha (Saint Mary’s University) for her input in conversations, for her help in
editing throughout the writing process. Without her this project would not be the same. The
third individual I would like to thank is Corwin Trottier, MSc candidate (Saint Mary’s
University). I consider the time he took to listen to my ideas, provide feedback and
constructive criticism to be invaluable. I would also like to thank the Geological Society
of Canada and its TGI-5 association for funding the project and providing samples.
And Wilson.
50
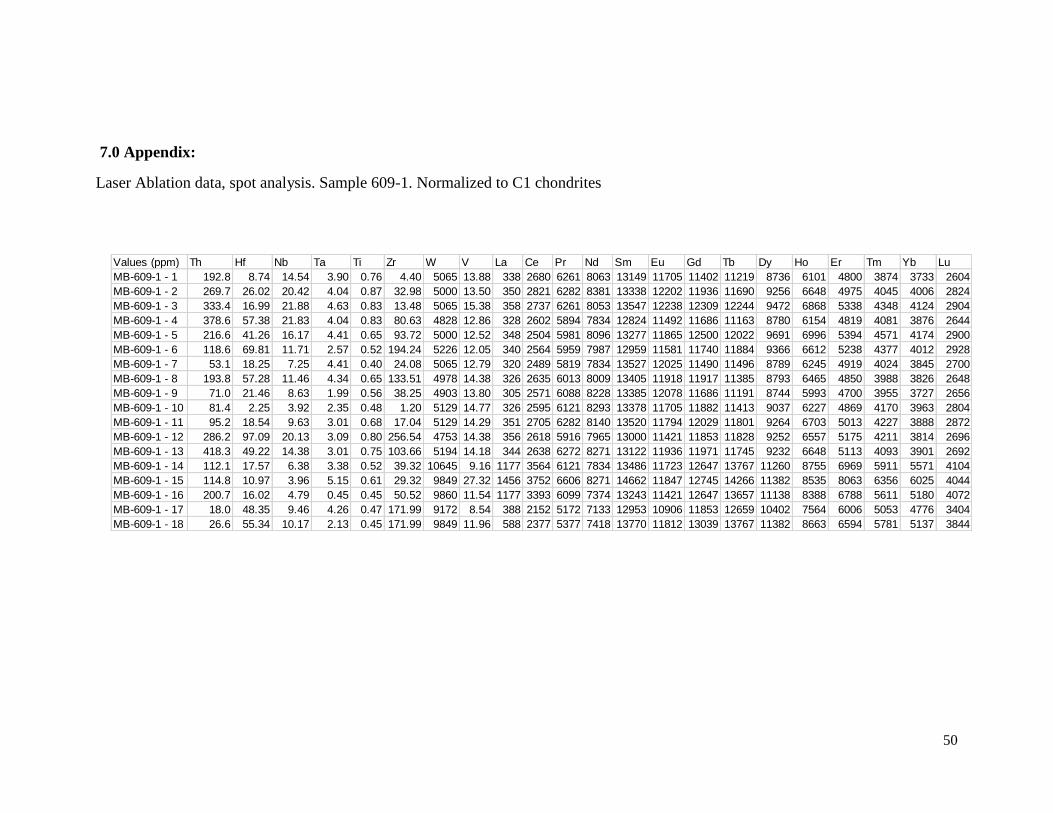
Values (ppm) Th Hf Nb Ta Ti Zr W V La Ce Pr Nd Sm Eu Gd Tb Dy Ho Er Tm Yb Lu
MB-609-1 - 1 192.8 8.74 14.54 3.90 0.76 4.40 5065 13.88 338 2680 6261 8063 13149 11705 11402 11219 8736 6101 4800 3874 3733 2604
MB-609-1 - 2 269.7 26.02 20.42 4.04 0.87 32.98 5000 13.50 350 2821 6282 8381 13338 12202 11936 11690 9256 6648 4975 4045 4006 2824
MB-609-1 - 3 333.4 16.99 21.88 4.63 0.83 13.48 5065 15.38 358 2737 6261 8053 13547 12238 12309 12244 9472 6868 5338 4348 4124 2904
MB-609-1 - 4 378.6 57.38 21.83 4.04 0.83 80.63 4828 12.86 328 2602 5894 7834 12824 11492 11686 11163 8780 6154 4819 4081 3876 2644
MB-609-1 - 5 216.6 41.26 16.17 4.41 0.65 93.72 5000 12.52 348 2504 5981 8096 13277 11865 12500 12022 9691 6996 5394 4571 4174 2900
MB-609-1 - 6 118.6 69.81 11.71 2.57 0.52 194.24 5226 12.05 340 2564 5959 7987 12959 11581 11740 11884 9366 6612 5238 4377 4012 2928
MB-609-1 - 7 53.1 18.25 7.25 4.41 0.40 24.08 5065 12.79 320 2489 5819 7834 13527 12025 11490 11496 8789 6245 4919 4024 3845 2700
MB-609-1 - 8 193.8 57.28 11.46 4.34 0.65 133.51 4978 14.38 326 2635 6013 8009 13405 11918 11917 11385 8793 6465 4850 3988 3826 2648
MB-609-1 - 9 71.0 21.46 8.63 1.99 0.56 38.25 4903 13.80 305 2571 6088 8228 13385 12078 11686 11191 8744 5993 4700 3955 3727 2656
MB-609-1 - 10 81.4 2.25 3.92 2.35 0.48 1.20 5129 14.77 326 2595 6121 8293 13378 11705 11882 11413 9037 6227 4869 4170 3963 2804
MB-609-1 - 11 95.2 18.54 9.63 3.01 0.68 17.04 5129 14.29 351 2705 6282 8140 13520 11794 12029 11801 9264 6703 5013 4227 3888 2872
MB-609-1 - 12 286.2 97.09 20.13 3.09 0.80 256.54 4753 14.38 356 2618 5916 7965 13000 11421 11853 11828 9252 6557 5175 4211 3814 2696
MB-609-1 - 13 418.3 49.22 14.38 3.01 0.75 103.66 5194 14.18 344 2638 6272 8271 13122 11936 11971 11745 9232 6648 5113 4093 3901 2692
MB-609-1 - 14 112.1 17.57 6.38 3.38 0.52 39.32 10645 9.16 1177 3564 6121 7834 13486 11723 12647 13767 11260 8755 6969 5911 5571 4104
MB-609-1 - 15 114.8 10.97 3.96 5.15 0.61 29.32 9849 27.32 1456 3752 6606 8271 14662 11847 12745 14266 11382 8535 8063 6356 6025 4044
MB-609-1 - 16 200.7 16.02 4.79 0.45 0.45 50.52 9860 11.54 1177 3393 6099 7374 13243 11421 12647 13657 11138 8388 6788 5611 5180 4072
MB-609-1 - 17 18.0 48.35 9.46 4.26 0.47 171.99 9172 8.54 388 2152 5172 7133 12953 10906 11853 12659 10402 7564 6006 5053 4776 3404
MB-609-1 - 18 26.6 55.34 10.17 2.13 0.45 171.99 9849 11.96 588 2377 5377 7418 13770 11812 13039 13767 11382 8663 6594 5781 5137 3844
7.0 Appendix:
Laser Ablation data, spot analysis. Sample 609-1. Normalized to C1 chondrites
51
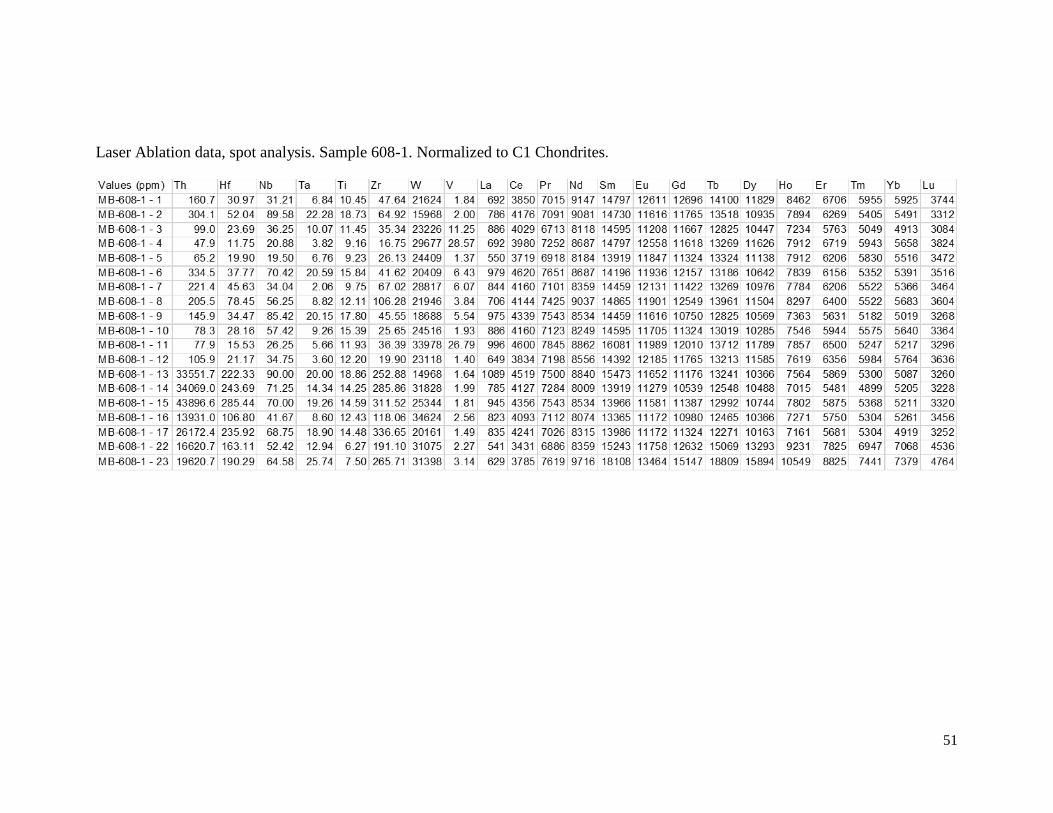
Laser Ablation data, spot analysis. Sample 608-1. Normalized to C1 Chondrites.
52
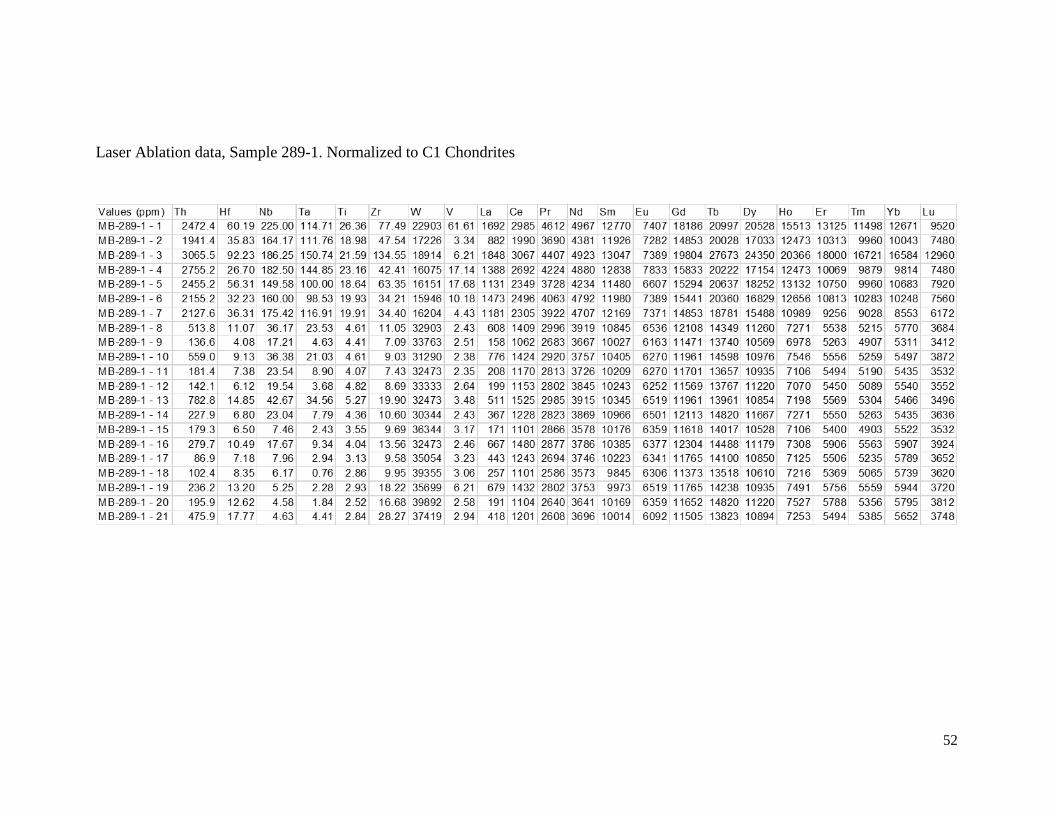
Laser Ablation data, Sample 289-1. Normalized to C1 Chondrites
53
Phase diagrams showing stability field described in Fig. 2, Markl et al 2016.

54