Embed Size (px)
Citation preview
JOURNAL OF QUATERNARY SCIENCE (2009) 24(5) 437–449Copyright � 2009 John Wiley & Sons, Ltd.Published online in Wiley InterScience
(www.interscience.wiley.com) DOI: 10.1002/jqs.1302A thousand-year record of temperature variationsfor Germany and Central Europe based ondocumentary dataRUDIGER GLASER* and DIRK RIEMANNInstitute of Physical Geography, University of Freiburg, Germany
Glaser, R. and Riemann, D. 2009. A thousand-year record of temperature variations for Germany and Central Europe based on documentary data. J. Quaternary Sci.,Vol. 24 pp. 437–449. ISSN 0267-8179.
Received 3 March 2008; Revised 6 May 2009; Accepted 6 May 2009
ABSTRACT: This paper presents a temperature reconstruction of the past 1000 years for CentralEurope, based on chronological records. The advantages and limitations of this hermeneutic,text-based approach are discussed and the statistic methodology is introduced. Historical documentsrepresent direct observation of weather and atmospheric conditions with highest temporal resolutionavailable and precise dating. A major advantage of these extensive data is that they allow thereconstruction of large numbers of variables such as winter temperature, precipitation, pressurepatterns or climate extremes as well as floods or storms. Within this hermeneutic climatological
research approach, even human impacts and social dimensions of climate development can beexamined. In order to quantify the historical information, statistical methods are applied, based on anindex approach. Copyright # 2009 John Wiley & Sons, Ltd.KEYWORDS: temperature reconstruction; 1000 years; historical sources; Central Europe; monthly resolution.
Introduction
There are now several time series concerning climatic changesin Europe over the past 1000 years which are based ondocumentary records. Some of them allow conclusions aboutthe entire time span (Buismann, 1996; van Engelen et al., 2000,2001; Glaser, 2008), while others cover separate phases(Alexandre, 1987; Brazdil and Kotyza, 1995) or are part ofregional case studies (Munzar, 1995; Pfister, 1999; Deutschand Rost, 2005; Mudelsee et al., 2006).
For certain periods, historical sources can provide climateinformation with up to daily resolution for all seasons and aretherefore an excellent basis to understand natural variabilityand circulation dynamics. Notably, it is possible to date theinformation explicitly and, above all, the approaches allow thereconstruction of different variables such as winter tempera-ture, precipitation or pressure patterns. Furthermore, historicalsources allow a long time perspective of (modern) extremeswhen viewed in comparison with historical documented cases,whereas natural proxies generally do not reflect extreme eventsto a similar degree of accuracy (Brazdil et al., 2006; Burgeret al., 2006).
An existing database for Germany and Central Europe(Glaser, 2008) has here been updated with new data, makingit possible to reconstruct temperature for the last millennium.
* Correspondence to: R. Glaser, Institute of Physical Geography, University ofFreiburg, Werthmannstraße 4, D-79085 Freiburg, Germany.E-mail: [email protected]
For this purpose, a modified calibration method was used.Furthermore, a method to estimate the error caused by theprocess of indexing was developed. The resulting newlyderived temperature reconstruction provides insight intonatural temperature variability in Europe from a hermeneuticperspective.
Data and methods
The majority of data originate from different sources scatteredover the area where German is or was the predominantlanguage in the historical context. Under the assumptionthat this region is homogeneous for monthly and seasonallyresolved temperature (Rapp, 2000; Glaser, 2008), sources fromdifferent places were used as indicators for a temperature seriesof the whole area; for instance, a ‘cold winter’ in one region wasassumed to have been a cold winter in the rest of Germany/Central Europe too. The temporal and spatial distribution anddensity of information that are included in the database areshown in Fig. 1. For the following analysis only data fromCentral Europe were used.
Historical data
There is a wide range of historical sources available for thearea under consideration. Numerous annals, town chronicles,

438 JOURNAL OF QUATERNARY SCIENCE
harvest records and diaries provide direct and indirect climate-related information (Pfister, 1999; Brazdil et al., 2005; Glaser,2008).
At least five periods can be distinguished concerninghistorical climate information in Central Europe:
1. T
Figinfper
Cop
he oldest sources, from the 8th century until the11th century, are more or less sporadic, describing single
ure 1 Spatial and temporal distribution and density of information in the datormation per region. The two time series show the absolute number of items of
year
yright � 2009 John Wiley & Sons, Ltd.
events, especially catastrophic extremes such as floods,droughts and severe winters, as well as earthquakes, auroraborealis, etc. For the period around AD 1000 some of theannals as well as some chronicles cannot be located exactly.The modern name of the source does not reveal the originalhistorical location, but rather the finding place. There aresome fluctuations concerning the abundance and varietyof the sources which can be related to the overall political
abase HISKLID. The grey scale on the map represents the number ofinformation per year and the number of covered seasons and months
J. Quaternary Sci., Vol. 24(5) 437–449 (2009)DOI: 10.1002/jqs
Cop
A THOUSAND-YEAR RECORD OF TEMPERATURE VARIATIONS FOR GERMANY 439
and cultural changes. For the period after AD 1000, withthe establishment of the Ottonian dynasty (in AD 936),cultural development spread, with an increased interestin writing and documentation. At the beginning of the11th century the variety and complexity of sourcesincreased, with a higher reliability and differentiation thanfor the period before.
2. F
rom the Late Medieval Period (around AD 1300) onwardsthere is more continuous information of winter and summerconditions available, as well as an increasing amount ofinformation about spring and autumn. Again, the number ofannals and chronicles rose significantly. The MonumentaGermaniae Historica (MGH), an edition of medievalsources, which is partly digitised and available through avirtual Library (Pertz, 1826) and the Chronik DeutscherStadte (CDS, Chronicles of German Cities), covering wideparts of the historic Holy Roman Empire stretching overEurope, is some sort of ‘backbone’ for large parts of thereconstructions. The sources – many in Latin, the others inold German regional languages – provide differentiatedinformation about seasons, single events, extremes andphenological dates, as well as impacts on society (seeGlaser, 2008).3. S
tarting from AD 1500, there are such an number of sourcesavailable that it is possible to derive monthly descriptions.Printing technology had been developed by Gutenberg inAD 1458, the paper industry was growing and more peoplecould read and write. During this period, so-called astro-logical calendars became quite popular – an important basisfor daily weather descriptions. Textual sources and obser-vations became much more sophisticated. Priors of mon-asteries and even peasants kept their diaries, describingthe relation between weather situation and the status ofthe agriculture and harvest results as well as prices. Townchronicles describe in detail damage due to weatherextremes and their costs.4. F
or Central Europe, early instrumental readings are availablesince AD 1680; most of them are sporadic, rather exper-imental and far from being standardised or homogenised.Following the first attempts and examples of the RoyalSociety, the Royale Societe de Medicine de Paris and theAcademia de Cimento, for a short time from AD 1781 to1793 the network of the Societas Meteorologica Palatinawas established, stretching from North America into Russia,with the first set of standardised measurements. All theseearly instrumental readings came along with daily weatherdescriptions. With the Age of Enlightenment a new scientificperspective on climate was established (Schneider-Carius,1955; Korber, 1987).5. S
ince the mid 19th century, several climatological societieshave been founded and some regional and national net-works have been established. The First International Meteor-ological Congress, held in Vienna in AD 1873, resulted in amajor breakthrough in the history of meteorology, includingthe establishment of national meteorological services withtheir respective networks of weather observation stations.These station records form the basis for modern instrumentalclimatology.Much of the historical written data and a compilation ofthe weather references used for this study were published byGlaser and Militzer (Glaser and Militzer, 1993; Glaser, 2001,2008). Significant parts (approximately 60%) of the data canbe accessed via the web interface www.hisklid.de (HistorischeKlimadatenbank Deutschland – historical climate databaseGermany). The sources for the data used are included inthis database. The website and database also include thermal
yright � 2009 John Wiley & Sons, Ltd.
and hygric indices and a sea ice index for the Western Balticfrom AD 1500 onwards (Koslowski and Glaser, 1999). Thesecompilations and the entire database are under permanentdevelopment so that the 1000-year long temperature seriespresented here is an updated version of an earlier one publishedby Glaser (2001).
To calibrate the temperature indices based on the documen-tary evidence to temperature values, instrumental data wereused. Since the study area was assumed to be homogeneous fortemperature, we used the updated Mean Temperature series forGermany (MTG) as derived by Rapp (2000), which wasoriginally presented in a report of the ‘Deutscher Wetterdienst’(German weather service – Schonwiese et al., 1993; Rapp,2000). This series, which was homogenised for urban warmingtrends, starts in AD 1761 and is composed of different data indifferent sub-periods. The data for AD 1761–1890, for instance,are from four stations (three before AD 1776) – one eachfrom the Netherlands, Germany, Austria and Switzerland(Rapp, 2000).
Quantifying historical documents
From the written sources it is possible to derive temperature-related indices (e.g. Brazdil et al., 2005). For this purpose, ina first step a critical source analysis was applied which is oneof the leading principles of hermeneutics. Besides the criticalexamination and interpretation of the historical source, furthercriteria for the evaluation, based on climatological and thusphysical characteristics of climate, can be used; with respect toclimate, the reconstructed temperature fields, pressure patternsor atmospheric conditions must be consistent. To achieve this,beyond hermeneutics natural scientific facts can also beincluded in the evaluation of the raw information (Glaser,2008).
One important reason why historical observations arereliable is that the economic success or even the survival ofagriculture-based societies depended highly on the harvest,which again depended on the weather. The dating was veryprecise with the year was structured by holy days of obligation.Therefore the historical observers – peasants, astrologers,guards who watched for fires from the city towers, chroniclersand scientists – were highly aware of weather and climate. Alldescriptions show very impressive efforts to justify their entrieswhile comparing them to the phenological status, bringing theinformation into a temporal context while comparing it toearlier events and date the observation in a calendar.
From AD 1500 onward, there are a sufficient number ofsources available to allow the derivation of monthly tempera-ture indices, which are available until AD 1750. For this,a seven-point scale was employed, ranging from �3 for‘extremely cold’ to 0 for ‘normal’, to þ3 for ‘extremely hot’. Inorder to improve the objectivity of this classification, semanticprofiles for each source were created in which the hierarchicalmeanings of the specific expressions and terms describingweather and climate that were used by single authors wereranked and assigned to the indices. The abundance of sourcesmakes it possible to draw a very detailed picture of theconditions of certain periods that can also be used to validatethe quality of sources. For instance, as modern observationsshow, there is a high correlation between the ratio of snowy torainy days with winter temperatures (Flohn, 1949, 1979). Thus,weather diaries with daily entries on precipitation types allowfor checking the plausibility of statements on winter tempera-tures. The comparison with regular weather patterns is anotherway to adjust and validate the gathered information (Lenke,
J. Quaternary Sci., Vol. 24(5) 437–449 (2009)DOI: 10.1002/jqs

440 JOURNAL OF QUATERNARY SCIENCE
1960, 1968). For the period before AD 1500, only seasonalindices with an unweighted three-term classification fortemperature were used even if, for some periods, data ofhigher resolution are available. This loss of information andthus of variability, in the actual periods, was accepted in favourof homogeneity of the time series during AD 1000–1500.
Several studies in historical climatology have shown a linearrelation between temperature indices derived from documen-tary evidence and instrumentally observed temperature (Lamb,1977; Bradley and Jones, 1992; Brazdil et al., 2005;Dobrovolny et al., 2008; Glaser, 2008). Here we present anapproach to derive approximate temperature values from theindices: the frequency distributions of both the MTGmeasurements for the period AD 1760–1950 (expressed asanomalies from its long-term mean, and binned into sevenclasses to facilitate direct comparison with the historicalindices) and the indices for the period AD 1500–1750 show asimilar shape (Fig. 2). Neither the instrumental data nor theindices show a normal distribution if applying a statistical test(e.g. Kolmogorov–Smirnov). The deviations in skewness andkurtosis can be explained, on the one hand, as artefacts due tothe reduction to seven classes, but on the other hand also asa reflection of the climate characteristics. The qualitativelybroadly similar shapes of the instrumental versus index datadistributions can be considered as an indicator for the reliabilityof the method of quantifying narrative sources.
The reduction to a seven-point scale leads to a loss ofinformation compared to the instrumentally observed tem-peratures: the indices suppress small variations from themean since the zero class describes variations within almostone standard deviation (STD). They also neglect a concisedifferentiation of the full range of extremes as they assignall events above a certain level to the same extreme class
Figure 2 Distribution of indices derived from historical sources (AD 1500–1each month
Copyright � 2009 John Wiley & Sons, Ltd.
(�3 and 3). To obtain a realistic level of variance in the finaltemperature reconstruction in spite of this fact, we used asimple variance scaling technique to calibrate the data. Forthis purpose the annual mean of the monthly indices wascalculated, thus gaining more than seven possible classes tokeep variability that is similar to the natural variability withinthe calibrated series. Before calculating the annual mean,the monthly indices were weighted with the STDs of thecorresponding monthly mean temperature series derived fromthe instrumental measurements (MTG) for AD 1761–1970 toassure an appropriate weight of each monthly index value.After normalising (by dividing by its STD) the resulting annuallyresolved time series for the period AD 1500–1750, it wasmultiplied by the STD of the annual mean (sa) of theinstrumental data (MTG) in the period AD 1761–1970. Thisprocedure generates a time series of the reconstructed annualtemperature anomalies:
D~Trecon
X12
m¼1
sm~im
" #norm
sa
where sm is the STD for each month derived from theinstrumental readings and~im is the index series for each month.The data for the period AD 1000–1500 are treated similarly andwill be introduced later in this paper. This simple calibrationprocedure relies on the assumption that both the temperaturevariance and mean level remained constant over a long timeperiod. This is evidently a simplification and methodologicallydifferent from the traditional statistical calibration of climateproxy data against representative instrumental data based ondata in a long period of overlap between the two datasets. In ourcase, however, such a period of overlap is not available and
750) versus distribution of temperature measurements (Rapp, 2000) for
J. Quaternary Sci., Vol. 24(5) 437–449 (2009)DOI: 10.1002/jqs
A THOUSAND-YEAR RECORD OF TEMPERATURE VARIATIONS FOR GERMANY 441
therefore we are restricted to using non-overlapping data incombination with the assumption of long-term constant meanand variance. In order to take account of a wide range of naturalvariability for the calibration, a long period (AD 1761–1970) ofinstrumental temperature measurements for Germany (MTG)was used.
It cannot be estimated from instrumental data alone howserious the problem regarding the assumption of constant long-term variance and mean is. Long simulations with coupledatmosphere–ocean general circulation models, forced withchanging solar irradiance, can instead be used to give anindication. To obtain a rough estimate of how muchthe temperature variance in the region of interest can differbetween 250-year periods, temperature output from a 1000-year long forced simulation with the model ECHO-G Erik2(Gonzalez-Rouco et al., 2006), averaged over Central Europe,was used. The standard deviation of the moving 250-year STDseries for each month in the simulation range from 0.02 to0.078C, and 0.048C for the annual values. Compared to thefull variances in the observed MTG data, ranging from 1.38Cfor June to 2.88C for January (0.798C for the annual values),this long-term change in variance is very small. Therefore, thesimplifying assumption that the variance for long periodsremains constant seems reasonably valid for the lastmillennium. A similar analysis for the variability in thelong-term mean in the simulation shows that the STD ofmoving 250-year mean temperatures for each month varywithin a range from 0.118C for July to 0.258C for January(0.168C for the year). This provides an approximate estimate ofthe degree of uncertainty in the final calibrated temperaturereconstruction that is caused by our calibration approach basedon no overlap between instrumental and proxy data.
There are additional uncertainties in the final temperaturereconstruction that arise during the interpretation and mappingof the raw information onto the seven- or three-point indexscale.
It is reasonable to assume that people living in regionsof large temperature fluctuations, e.g. mountainous areas, arerelatively insensitive to small temperature fluctuations. Thus,for example, an index score of þ1 in the Alps would equate to ahigher temperature anomaly than a score of þ1 in a coastalregion. The same observation applies between seasons; wecannot assume that a score of þ1 in summer and þ1 in winterindicate the same absolute temperature anomaly. Consequen-tially, indices correlate with normalised temperatures, whichshow coherent patterns for the study area, thus supporting theuse of indices from different places. The effect of the uncertaintyin the indexing procedure is estimated later in this paper.
The question then is: how many degrees Celsius does anindex score of þ1 indicate, as a function of the month in theyear? To answer this, the linear relation between the indicesand the temperatures can be used to calculate the monthlytemperature anomalies as a fraction i (i.e. the index) of themonthly variability sm. Subsequently, the annual temperatureanomalies are calculated as the average of these monthlyanomalies:
D~Trecon ¼ a
12
X12
m¼1
sm~im
with the scaling factor a for the monthly values. Therefore,assuming the STDs of the annual anomalies are the same(srecon¼ sa), it is possible to estimate the scaling factor:
STDa
12
X12
m¼1
sm~im
!¼ sa , jaj ¼ sa
STD 112
P12
m¼1sm
~im
� �
Copyright � 2009 John Wiley & Sons, Ltd.
For the area and data under consideration a is approximately0.85; i.e. an index score of one relates to a temperatureanomaly of about one STD. The STDs of the monthlytemperatures range from about 1.38C for July to 2.88C forJanuary; therefore one index score relates to a distincttemperature difference.
The year-to-year signal of temperature variations is strongcompared to changes in the medium-term temperaturedevelopment that might have affected people’s perceptionof temperature. To estimate these medium-term changes the31-year moving average (following the climate normal period)of each month in the MTG series was calculated. The standarddeviation of this series ranges from 0.28C for July to 0.78C forJanuary, which is only 15–25% of the STD of the unsmoothedmonthly temperatures. Bearing in mind a high inter-annual andmonthly variability compared to low medium-term changes, itappears reasonable that people were able to clearly distinguishtemperature anomalies.
As already mentioned, the calibration method used here differsfrom previous approaches that use a calibration periodof overlapping proxy and instrumental data to estimate therelation between the proxy and the climate signal. The rationalebehind the presented method is (as already noted) based on twoassumptions: first, that there is a linear relation between theindices and temperature as shown in several studies (Lamb, 1977;Bradley and Jones, 1992; Brazdil et al., 2005; Dobrovolny et al.,2008; Glaser, 2008); second, that the temperature variability of along period (here more than 200 years) stays constant.
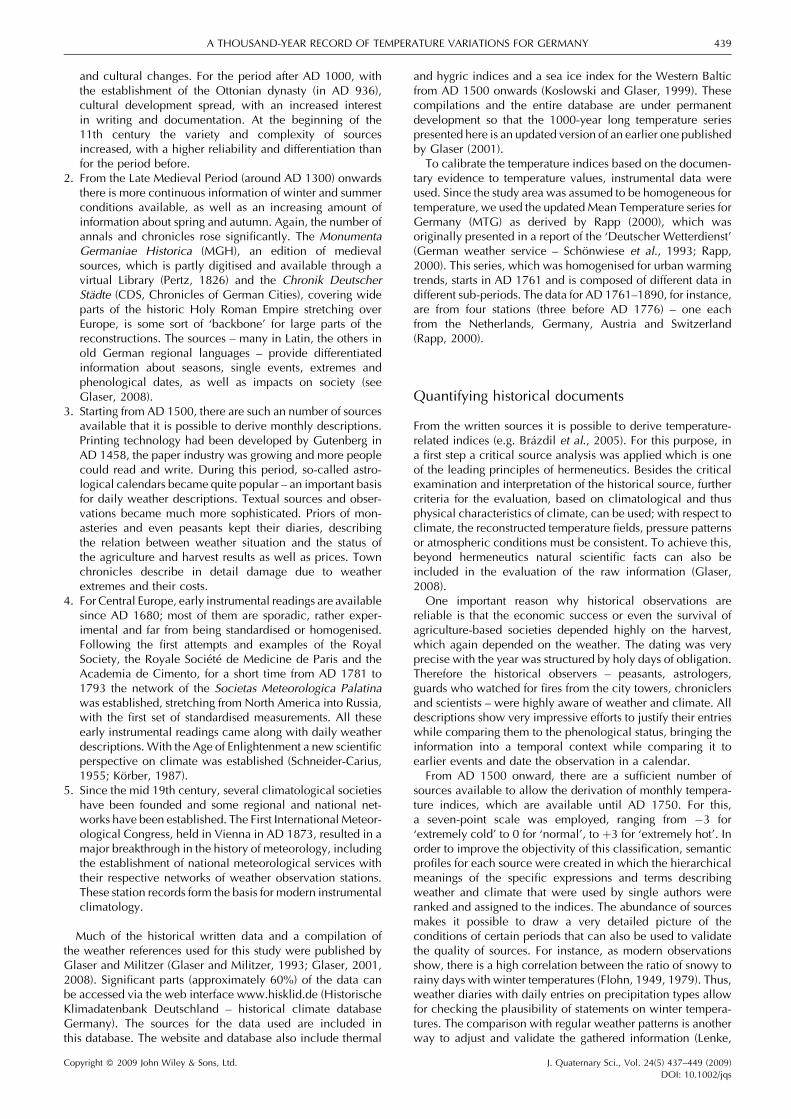
The question then is how single observations of historicalobservers can lead to a long-term signal. There is enoughevidence that historical observers were able to recognisedeviations on a monthly or seasonal scale because theobservations were related to manifold indicators of agriculturalpractise and environmental conditions. Since the observationscover a broad range of climate variability, these deviationsreflect distinct temperature differences. Long-term trends resultfrom accumulations of unidirectional temperature anomalies inseveral months. Even in instrumental records single months donot show a pronounced long-term signal (Fig. 3) but a highinter-annual variability. The long-term signal (as shown inFig. 4) results if many months in a longer period showanomalies with the same sign. The ability of the hermeneuticapproach to provide climate information in all seasons andmonths is a major advantage over many other proxies which aresensitive only to particular seasons of the year. Of particularimportance is information on winter temperatures, as theamplitude of variability is higher than in other seasons.Therefore winter temperatures have a greater impact on theoverall temperature signal. As Fig. 3 shows, there is aremarkably strong inter-annual variability for each month aswell as a high range of variability, especially for the wintermonths (the figure, though, does not allow direct comparison ofthe size of variability in different months as normalised data areplotted). As shown in Fig. 6, the variance of the historicalobservations using the described method leads to a long-termsignal.
For the period before AD 1500, when monthly index data arenot available, the calibration was performed using a furthersimplified approach, based on determining a decadal indexfor each season (Lamb, 1977; Glaser, 2008). To achieve this, arunning 11-year sum of indices for each season was calculated.Then, using the same method as for the monthly indices, thetime series of each season was calibrated so that it matched theSTD of the 11-year moving average of the same season inthe instrumental period. The 11-year annual mean was thencalculated, thus deriving a time series of the 11-year runningannual temperature anomalies.
J. Quaternary Sci., Vol. 24(5) 437–449 (2009)DOI: 10.1002/jqs

Figure 3 Normalised monthly temperature series for Germany (updated after Rapp, 2000). The reference period is AD 1770–1970
442 JOURNAL OF QUATERNARY SCIENCE
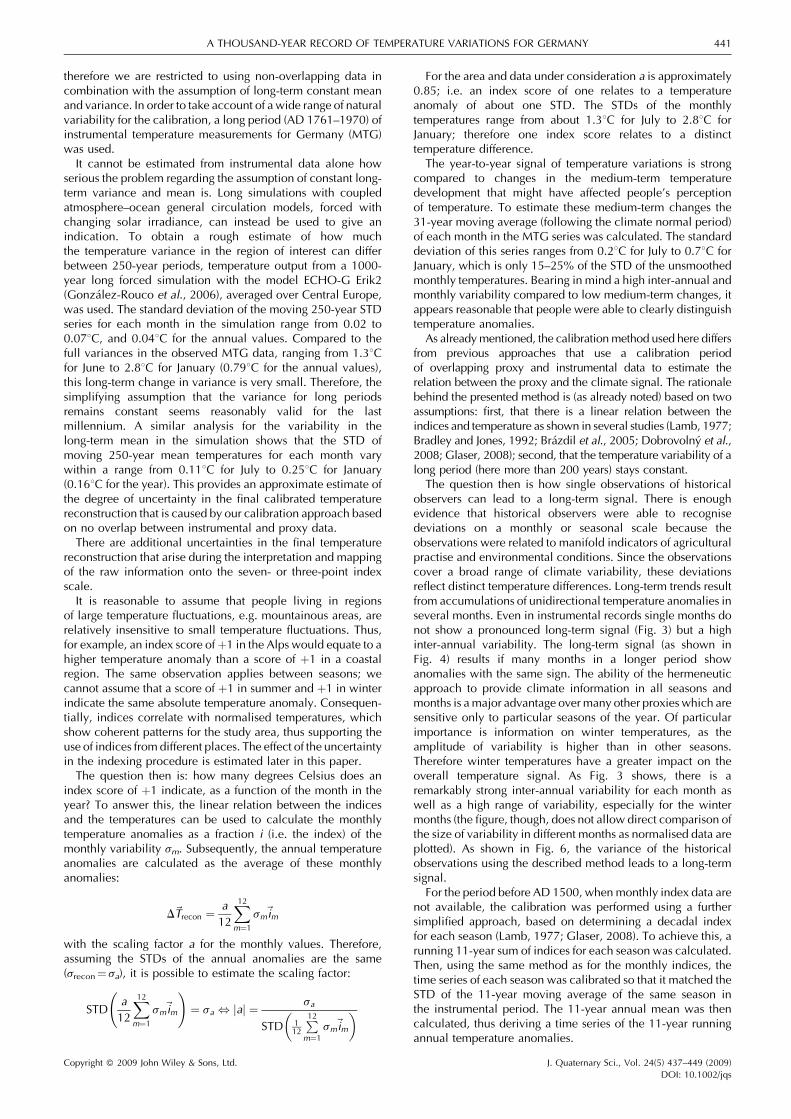
To check the loss of information when using the indexingmethod (compared to a continuous temperature scale), 3-pointand 7-point indices were calculated from the instrumentalrecords (MTG) and subsequently calibrated to temperatureusing the method described above (Fig. 4). This techniquewas also tested on simulated temperature data for CentralEurope derived from the model ECHO-G Erik 2 (Gonzalez-
Figure 4 Comparison of instrumental temperature data for Germany (updatinstrumental data after degradation onto a 7-point and 3-point index scale.
Copyright � 2009 John Wiley & Sons, Ltd.
Rouco et al., 2006). Figure 4 shows in principle a strongcapability of indices to describe long-term variations. Even withreduction to a 3-point scale and subsequent calibration back totemperature, thereby losing information, it is possible to keepthe low-frequency signal as shown by the 11-year meantemperatures.
ed after Rapp, 2000) with calibrated indices that were derived from theAll series are 11-year moving averages
J. Quaternary Sci., Vol. 24(5) 437–449 (2009)DOI: 10.1002/jqs
A THOUSAND-YEAR RECORD OF TEMPERATURE VARIATIONS FOR GERMANY 443
Error estimation
In order to assess important sources of uncertainties in thecalibrated series, a Monte Carlo (MC) method was used. For thispurpose, possible errors were added during the calibrationprocess, which was then repeated 1000 times. Possible errorsthat were investigated here emanate from:
1. th
Cop
e uncertainties related to the indices (indexing error);
2. th e uncertainties due to the reduction to seven/three classes(index class width); and
3. th e medium-term variability of the monthly/seasonal meantemperatures.
The individual errors were estimated as follows. Because oftwo subjective judgements on which the indices are based,there is an uncertainty related to the values: firstly, the sub-jectivity related to the observation and documentation of theperceived temperatures; and secondly the subjectivity of creat-ing an index based on this documentation. To estimate thisindexing error, every index value was randomly altered by oneindex step or left unchanged with an even probability for eachcase (i.e. 33% each) before calibration.
The error of the index class width can be thought of as theuncertainty related to the reduction of temperature to seven orthree classes. It is estimated as the product of the scaling factor aand the STD of the month/season ðamonth=season � smonth=seasonÞ.This error is assumed to be uniformly distributed in the range ofthe class width on the monthly/seasonal values.
In order to estimate the error related to the possibleadaptation of people’s perception, an arbitrary choice had tobe made: we used the climate normal period to estimatemedium-term changes in monthly/seasonal mean tempera-tures. Thus, the monthly/seasonal temperature series of MTGwere smoothed with a 31-year moving average. The STDs ofthese smoothed series were then set as the STDs of randomerrors with a normal distribution.
In order to calculate the overall error, in a first step theoriginal indices were randomly altered by one index step andsubsequently calibrated to monthly/seasonal temperatures asdescribed above (indexing error). The remaining two errors(index class width and medium-term variability) were thenrandomly varied and added to the monthly/seasonal tempera-tures. This procedure was repeated 1000 times, thus gaining1000 possible temperature series. Then, to construct acombined uncertainty range for the calibrated index-basedreconstruction, the double STD of these series was used as an‘error bar’, as this arguably roughly corresponds to a 95%confidence interval. This is about 0.718C for the annual values(hence about 0.28C for the 11-year means) for the period withmonthly resolved data (AD 1500–1750) and 0.498C for the 11-year moving average in the seasonally resolved period (AD1000–1500). The indexing error accounts for 60% of the overallerror when using monthly resolved data and for 70% whenusing seasonal resolved data. For the instrumental readings theerror for the monthly mean temperatures is �18C; thereforethe annual error is approximately 0.38C and the error in 11-yearaverages is about 0.098C.
Verification of the indexing method
The error estimation discussed above concerns various errorsthat are methodologically inherent to the construction ofindices. It does provide any information about the predictionskill of the derived calibrated indices. Therefore, to address this
yright � 2009 John Wiley & Sons, Ltd.
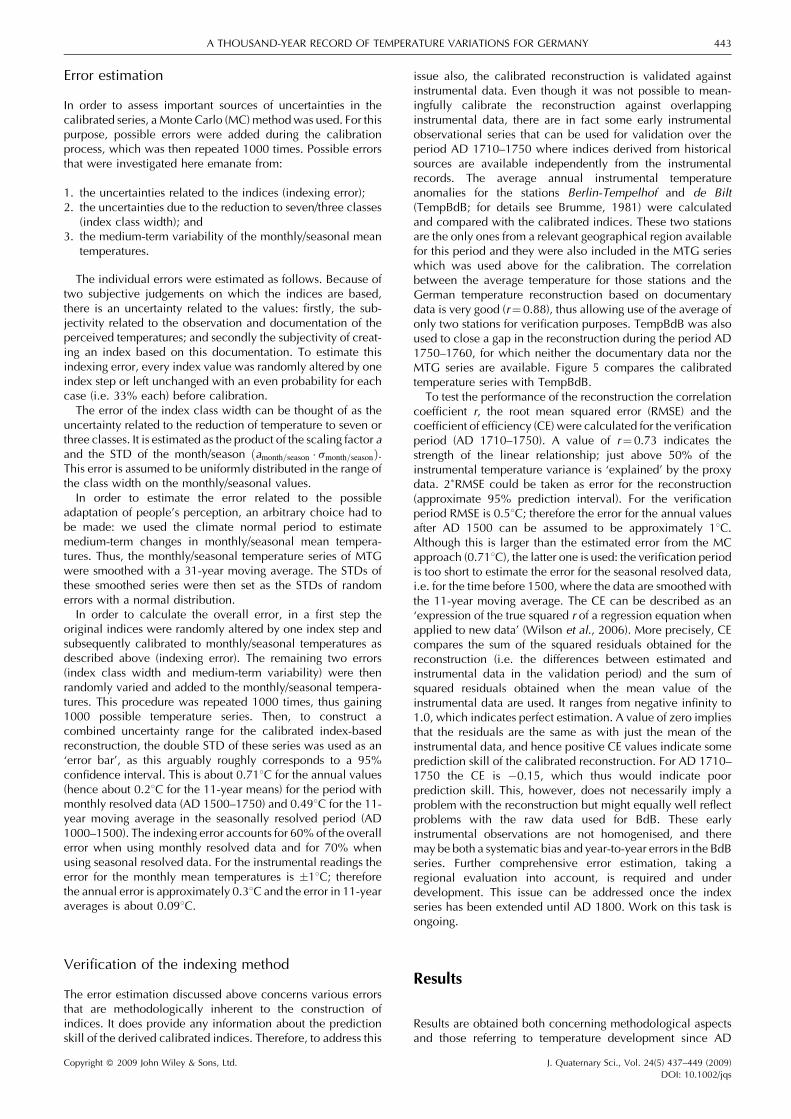
issue also, the calibrated reconstruction is validated againstinstrumental data. Even though it was not possible to mean-ingfully calibrate the reconstruction against overlappinginstrumental data, there are in fact some early instrumentalobservational series that can be used for validation over theperiod AD 1710–1750 where indices derived from historicalsources are available independently from the instrumentalrecords. The average annual instrumental temperatureanomalies for the stations Berlin-Tempelhof and de Bilt(TempBdB; for details see Brumme, 1981) were calculatedand compared with the calibrated indices. These two stationsare the only ones from a relevant geographical region availablefor this period and they were also included in the MTG serieswhich was used above for the calibration. The correlationbetween the average temperature for those stations and theGerman temperature reconstruction based on documentarydata is very good (r¼ 0.88), thus allowing use of the average ofonly two stations for verification purposes. TempBdB was alsoused to close a gap in the reconstruction during the period AD1750–1760, for which neither the documentary data nor theMTG series are available. Figure 5 compares the calibratedtemperature series with TempBdB.
To test the performance of the reconstruction the correlationcoefficient r, the root mean squared error (RMSE) and thecoefficient of efficiency (CE) were calculated for the verificationperiod (AD 1710–1750). A value of r¼ 0.73 indicates thestrength of the linear relationship; just above 50% of theinstrumental temperature variance is ‘explained’ by the proxydata. 2�RMSE could be taken as error for the reconstruction(approximate 95% prediction interval). For the verificationperiod RMSE is 0.58C; therefore the error for the annual valuesafter AD 1500 can be assumed to be approximately 18C.Although this is larger than the estimated error from the MCapproach (0.718C), the latter one is used: the verification periodis too short to estimate the error for the seasonal resolved data,i.e. for the time before 1500, where the data are smoothed withthe 11-year moving average. The CE can be described as an‘expression of the true squared r of a regression equation whenapplied to new data’ (Wilson et al., 2006). More precisely, CEcompares the sum of the squared residuals obtained for thereconstruction (i.e. the differences between estimated andinstrumental data in the validation period) and the sum ofsquared residuals obtained when the mean value of theinstrumental data are used. It ranges from negative infinity to1.0, which indicates perfect estimation. A value of zero impliesthat the residuals are the same as with just the mean of theinstrumental data, and hence positive CE values indicate someprediction skill of the calibrated reconstruction. For AD 1710–1750 the CE is �0.15, which thus would indicate poorprediction skill. This, however, does not necessarily imply aproblem with the reconstruction but might equally well reflectproblems with the raw data used for BdB. These earlyinstrumental observations are not homogenised, and theremay be both a systematic bias and year-to-year errors in the BdBseries. Further comprehensive error estimation, taking aregional evaluation into account, is required and underdevelopment. This issue can be addressed once the indexseries has been extended until AD 1800. Work on this task isongoing.
Results
Results are obtained both concerning methodological aspectsand those referring to temperature development since AD
J. Quaternary Sci., Vol. 24(5) 437–449 (2009)DOI: 10.1002/jqs
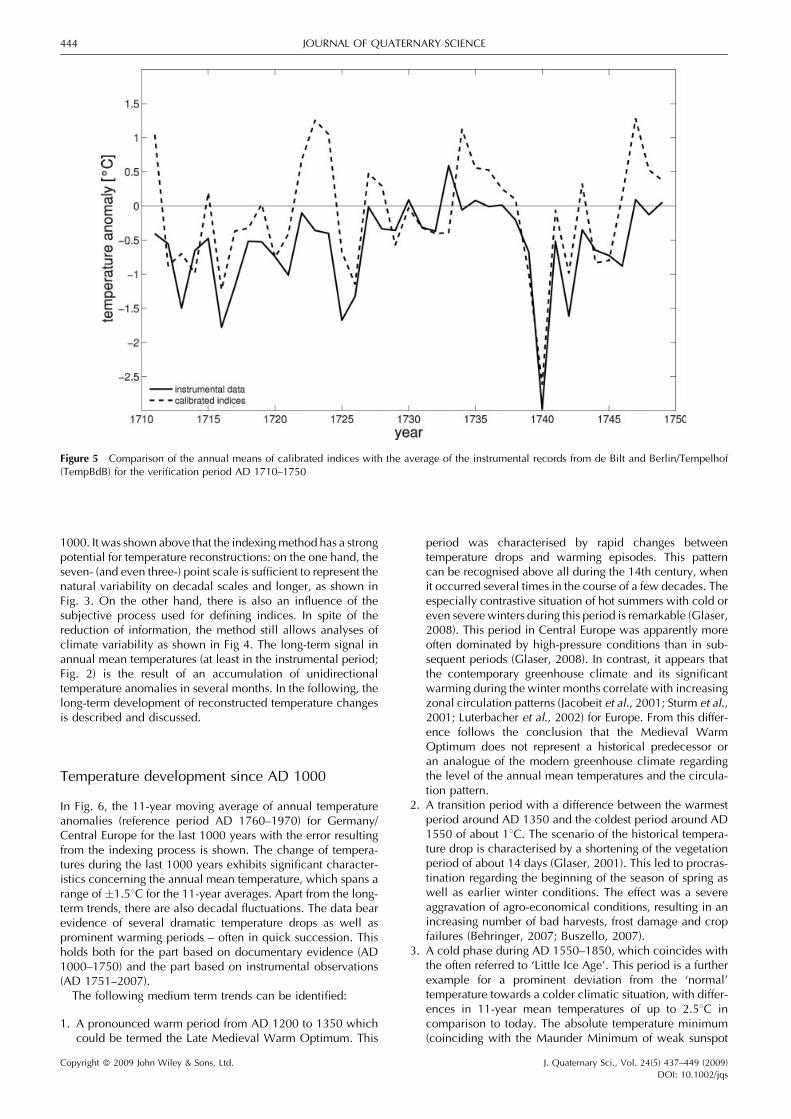
Figure 5 Comparison of the annual means of calibrated indices with the average of the instrumental records from de Bilt and Berlin/Tempelhof(TempBdB) for the verification period AD 1710–1750
444 JOURNAL OF QUATERNARY SCIENCE
1000. It was shown above that the indexing method has a strongpotential for temperature reconstructions: on the one hand, theseven- (and even three-) point scale is sufficient to represent thenatural variability on decadal scales and longer, as shown inFig. 3. On the other hand, there is also an influence of thesubjective process used for defining indices. In spite of thereduction of information, the method still allows analyses ofclimate variability as shown in Fig 4. The long-term signal inannual mean temperatures (at least in the instrumental period;Fig. 2) is the result of an accumulation of unidirectionaltemperature anomalies in several months. In the following, thelong-term development of reconstructed temperature changesis described and discussed.
Temperature development since AD 1000
In Fig. 6, the 11-year moving average of annual temperatureanomalies (reference period AD 1760–1970) for Germany/Central Europe for the last 1000 years with the error resultingfrom the indexing process is shown. The change of tempera-tures during the last 1000 years exhibits significant character-istics concerning the annual mean temperature, which spans arange of �1.58C for the 11-year averages. Apart from the long-term trends, there are also decadal fluctuations. The data bearevidence of several dramatic temperature drops as well asprominent warming periods – often in quick succession. Thisholds both for the part based on documentary evidence (AD1000–1750) and the part based on instrumental observations(AD 1751–2007).
The following medium term trends can be identified:
1. A
Cop
pronounced warm period from AD 1200 to 1350 whichcould be termed the Late Medieval Warm Optimum. This
yright � 2009 John Wiley & Sons, Ltd.
period was characterised by rapid changes betweentemperature drops and warming episodes. This patterncan be recognised above all during the 14th century, whenit occurred several times in the course of a few decades. Theespecially contrastive situation of hot summers with cold oreven severe winters during this period is remarkable (Glaser,2008). This period in Central Europe was apparently moreoften dominated by high-pressure conditions than in sub-sequent periods (Glaser, 2008). In contrast, it appears thatthe contemporary greenhouse climate and its significantwarming during the winter months correlate with increasingzonal circulation patterns (Jacobeit et al., 2001; Sturm et al.,2001; Luterbacher et al., 2002) for Europe. From this differ-ence follows the conclusion that the Medieval WarmOptimum does not represent a historical predecessor oran analogue of the modern greenhouse climate regardingthe level of the annual mean temperatures and the circula-tion pattern.
2. A
transition period with a difference between the warmestperiod around AD 1350 and the coldest period around AD1550 of about 18C. The scenario of the historical tempera-ture drop is characterised by a shortening of the vegetationperiod of about 14 days (Glaser, 2001). This led to procras-tination regarding the beginning of the season of spring aswell as earlier winter conditions. The effect was a severeaggravation of agro-economical conditions, resulting in anincreasing number of bad harvests, frost damage and cropfailures (Behringer, 2007; Buszello, 2007).3. A
cold phase during AD 1550–1850, which coincides withthe often referred to ‘Little Ice Age’. This period is a furtherexample for a prominent deviation from the ‘normal’temperature towards a colder climatic situation, with differ-ences in 11-year mean temperatures of up to 2.58C incomparison to today. The absolute temperature minimum(coinciding with the Maunder Minimum of weak sunspotJ. Quaternary Sci., Vol. 24(5) 437–449 (2009)DOI: 10.1002/jqs
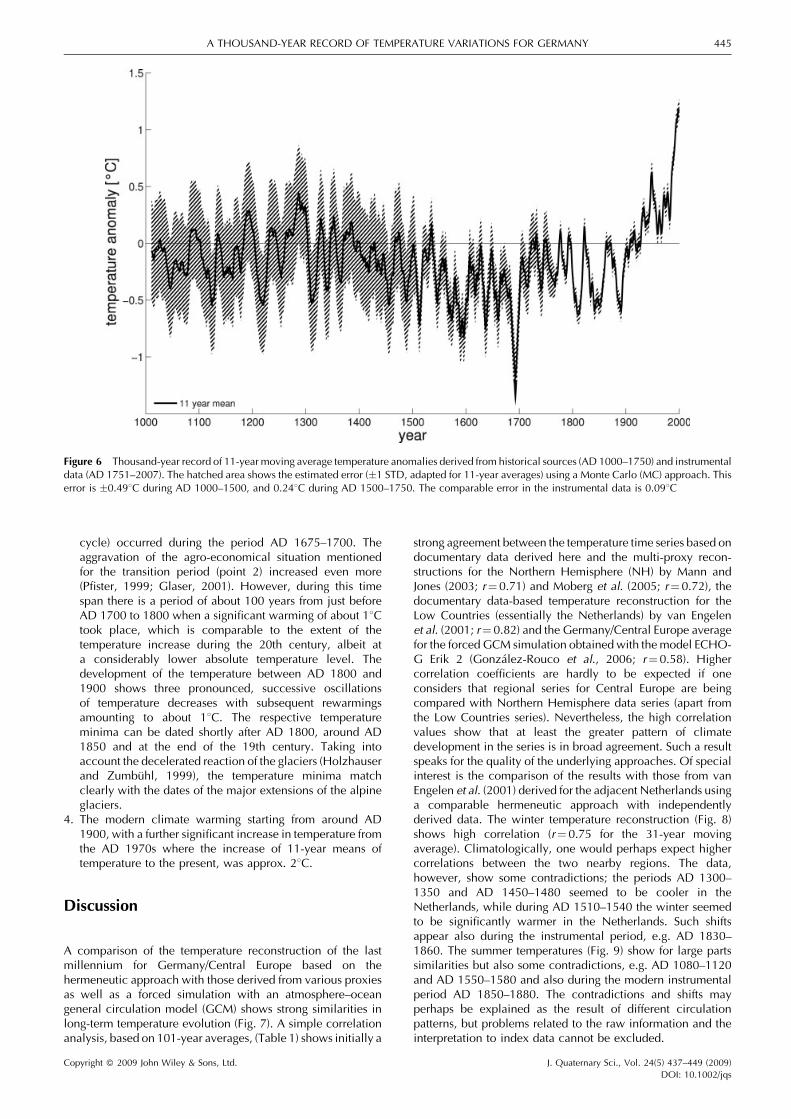
Figure 6 Thousand-year record of 11-year moving average temperature anomalies derived from historical sources (AD 1000–1750) and instrumentaldata (AD 1751–2007). The hatched area shows the estimated error (�1 STD, adapted for 11-year averages) using a Monte Carlo (MC) approach. Thiserror is �0.498C during AD 1000–1500, and 0.248C during AD 1500–1750. The comparable error in the instrumental data is 0.098C
Cop
A THOUSAND-YEAR RECORD OF TEMPERATURE VARIATIONS FOR GERMANY 445
cycle) occurred during the period AD 1675–1700. Theaggravation of the agro-economical situation mentionedfor the transition period (point 2) increased even more(Pfister, 1999; Glaser, 2001). However, during this timespan there is a period of about 100 years from just beforeAD 1700 to 1800 when a significant warming of about 18Ctook place, which is comparable to the extent of thetemperature increase during the 20th century, albeit ata considerably lower absolute temperature level. Thedevelopment of the temperature between AD 1800 and1900 shows three pronounced, successive oscillationsof temperature decreases with subsequent rewarmingsamounting to about 18C. The respective temperatureminima can be dated shortly after AD 1800, around AD1850 and at the end of the 19th century. Taking intoaccount the decelerated reaction of the glaciers (Holzhauserand Zumbuhl, 1999), the temperature minima matchclearly with the dates of the major extensions of the alpineglaciers.
4. T
he modern climate warming starting from around AD1900, with a further significant increase in temperature fromthe AD 1970s where the increase of 11-year means oftemperature to the present, was approx. 28C.Discussion
A comparison of the temperature reconstruction of the lastmillennium for Germany/Central Europe based on thehermeneutic approach with those derived from various proxiesas well as a forced simulation with an atmosphere–oceangeneral circulation model (GCM) shows strong similarities inlong-term temperature evolution (Fig. 7). A simple correlationanalysis, based on 101-year averages, (Table 1) shows initially a
yright � 2009 John Wiley & Sons, Ltd.
strong agreement between the temperature time series based ondocumentary data derived here and the multi-proxy recon-structions for the Northern Hemisphere (NH) by Mann andJones (2003; r¼ 0.71) and Moberg et al. (2005; r¼ 0.72), thedocumentary data-based temperature reconstruction for theLow Countries (essentially the Netherlands) by van Engelenet al. (2001; r¼ 0.82) and the Germany/Central Europe averagefor the forced GCM simulation obtained with the model ECHO-G Erik 2 (Gonzalez-Rouco et al., 2006; r¼ 0.58). Highercorrelation coefficients are hardly to be expected if oneconsiders that regional series for Central Europe are beingcompared with Northern Hemisphere data series (apart fromthe Low Countries series). Nevertheless, the high correlationvalues show that at least the greater pattern of climatedevelopment in the series is in broad agreement. Such a resultspeaks for the quality of the underlying approaches. Of specialinterest is the comparison of the results with those from vanEngelen et al. (2001) derived for the adjacent Netherlands usinga comparable hermeneutic approach with independentlyderived data. The winter temperature reconstruction (Fig. 8)shows high correlation (r¼ 0.75 for the 31-year movingaverage). Climatologically, one would perhaps expect highercorrelations between the two nearby regions. The data,however, show some contradictions; the periods AD 1300–1350 and AD 1450–1480 seemed to be cooler in theNetherlands, while during AD 1510–1540 the winter seemedto be significantly warmer in the Netherlands. Such shiftsappear also during the instrumental period, e.g. AD 1830–1860. The summer temperatures (Fig. 9) show for large partssimilarities but also some contradictions, e.g. AD 1080–1120and AD 1550–1580 and also during the modern instrumentalperiod AD 1850–1880. The contradictions and shifts mayperhaps be explained as the result of different circulationpatterns, but problems related to the raw information and theinterpretation to index data cannot be excluded.
J. Quaternary Sci., Vol. 24(5) 437–449 (2009)DOI: 10.1002/jqs
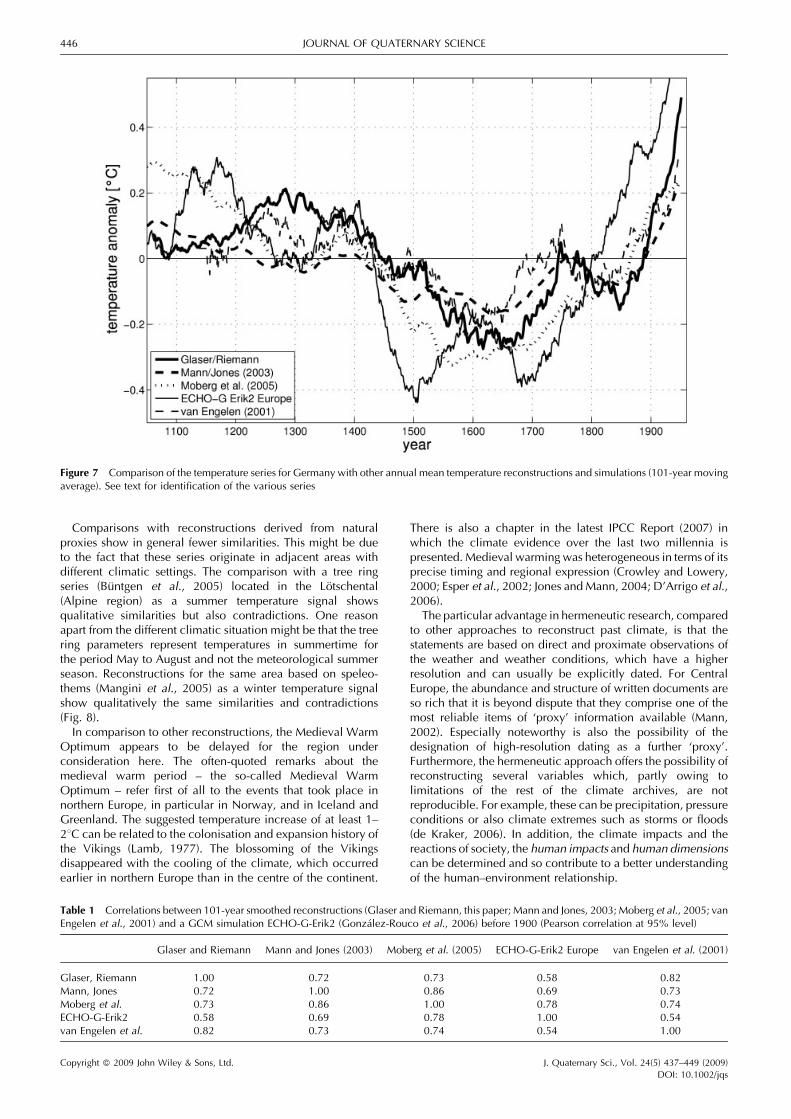
Figure 7 Comparison of the temperature series for Germany with other annual mean temperature reconstructions and simulations (101-year movingaverage). See text for identification of the various series
446 JOURNAL OF QUATERNARY SCIENCE
Comparisons with reconstructions derived from naturalproxies show in general fewer similarities. This might be dueto the fact that these series originate in adjacent areas withdifferent climatic settings. The comparison with a tree ringseries (Buntgen et al., 2005) located in the Lotschental(Alpine region) as a summer temperature signal showsqualitative similarities but also contradictions. One reasonapart from the different climatic situation might be that the treering parameters represent temperatures in summertime forthe period May to August and not the meteorological summerseason. Reconstructions for the same area based on speleo-thems (Mangini et al., 2005) as a winter temperature signalshow qualitatively the same similarities and contradictions(Fig. 8).
In comparison to other reconstructions, the Medieval WarmOptimum appears to be delayed for the region underconsideration here. The often-quoted remarks about themedieval warm period – the so-called Medieval WarmOptimum – refer first of all to the events that took place innorthern Europe, in particular in Norway, and in Iceland andGreenland. The suggested temperature increase of at least 1–28C can be related to the colonisation and expansion history ofthe Vikings (Lamb, 1977). The blossoming of the Vikingsdisappeared with the cooling of the climate, which occurredearlier in northern Europe than in the centre of the continent.
Table 1 Correlations between 101-year smoothed reconstructions (Glaser anEngelen et al., 2001) and a GCM simulation ECHO-G-Erik2 (Gonzalez-Rou
Glaser and Riemann Mann and Jones (2003) Mob
Glaser, Riemann 1.00 0.72Mann, Jones 0.72 1.00Moberg et al. 0.73 0.86ECHO-G-Erik2 0.58 0.69van Engelen et al. 0.82 0.73
Copyright � 2009 John Wiley & Sons, Ltd.
There is also a chapter in the latest IPCC Report (2007) inwhich the climate evidence over the last two millennia ispresented. Medieval warming was heterogeneous in terms of itsprecise timing and regional expression (Crowley and Lowery,2000; Esper et al., 2002; Jones and Mann, 2004; D’Arrigo et al.,2006).
The particular advantage in hermeneutic research, comparedto other approaches to reconstruct past climate, is that thestatements are based on direct and proximate observations ofthe weather and weather conditions, which have a higherresolution and can usually be explicitly dated. For CentralEurope, the abundance and structure of written documents areso rich that it is beyond dispute that they comprise one of themost reliable items of ‘proxy’ information available (Mann,2002). Especially noteworthy is also the possibility of thedesignation of high-resolution dating as a further ‘proxy’.Furthermore, the hermeneutic approach offers the possibility ofreconstructing several variables which, partly owing tolimitations of the rest of the climate archives, are notreproducible. For example, these can be precipitation, pressureconditions or also climate extremes such as storms or floods(de Kraker, 2006). In addition, the climate impacts and thereactions of society, the human impacts and human dimensionscan be determined and so contribute to a better understandingof the human–environment relationship.
d Riemann, this paper; Mann and Jones, 2003; Moberg et al., 2005; vanco et al., 2006) before 1900 (Pearson correlation at 95% level)
erg et al. (2005) ECHO-G-Erik2 Europe van Engelen et al. (2001)
0.73 0.58 0.820.86 0.69 0.731.00 0.78 0.740.78 1.00 0.540.74 0.54 1.00
J. Quaternary Sci., Vol. 24(5) 437–449 (2009)DOI: 10.1002/jqs

Figure 8 Winter temperature reconstructions for Germany, the Netherlands (Van Engelen et al., 2001, 2003), based on documentary data, and theAlps (Mangini et al., 2005), based on speleothems (z-score of 31-year moving average)
Figure 9 Summer temperature reconstructions for Germany, the Netherlands (Van Engelen et al., 2001, 2003), based on documentary data, and theAlps (Buntgen et al., 2005), based on tree ring parameters (z-score of 31-year moving average)
A THOUSAND-YEAR RECORD OF TEMPERATURE VARIATIONS FOR GERMANY 447
Conclusion
The hermeneutic approach, coupled with the indexing method,is suitable for deriving temperature series from documentarydata for Germany/Central Europe. The study shows that the
Copyright � 2009 John Wiley & Sons, Ltd.
presented method allows a reconstruction of long-term climatevariability, with the major advantages that the hermeneuticapproach covers all seasons and provides exact dating.Therefore, the data allow cross-validation with other indepen-dently derived proxies. Thus the methodological spectrum in
J. Quaternary Sci., Vol. 24(5) 437–449 (2009)DOI: 10.1002/jqs

448 JOURNAL OF QUATERNARY SCIENCE
palaeoclimatology can be enriched and more medium-scaleresults can be presented.
The results show good correlations with those derived fromother multi-proxy approaches, another documentary-databased reconstruction and a forced climate simulation. Never-theless there are some differences concerning the temperaturedevelopment in the first 250 years, which is often called theMedieval Warm Optimum. Further discussion of thesedifferences will inspire the debate on climate regionalisationand the temperature development for this period.
Besides, the hermeneutic approach offers many morepossibilities using the information on climatic impacts andclimatic vulnerability and the interaction with society. Thehigh-resolution climate and weather information of thedocumentary approach is unique.
If one considers that with the latest publication of the IPCC(IPCC, 2007) further temperature increase has gained plausi-bility and that, above all, the regional effects of climate changeare increasingly of importance, the stated advantages of thehermeneutic approach as compared to global and hemisphericmodels seem yet more important. Especially in the last fewyears, analyses with respect to various weather extremes havebeen conducted in which floods and climatic impacts were ofspecial interest (Glaser and Stangl, 2003; Thorndycraft et al.,2003). These European research activities can be related towork by Chinese and Japanese colleagues, who carry outresearch on typhoons, among other topics or, for example, toreconstructions of El Nino events (Diaz and Pulwarty, 1994) aswell as work in the Caribbean (Walsh and Reading, 1991), orthe Indian Ocean (Walsh et al., 1999). The hermeneuticapproach coupled with the indexing method opens furtherperspectives for regional climate reconstructions.
Acknowledgements We would like to thank the anonymous refereefor her/his tremendous efforts in helping to improve the article. DR isfunded by the European Community under research contract 017008-2Millennium.
References
Alexandre P. 1987. Le climat en Europe au Moyen Age. Ecole desHautes Etudes en Sciences Sociales: Paris.
Behringer W. 2007. Kulturgeschichte des Klimas. Von der Eiszeit bis zurglobalen Erwarmung. [Cultural history of climate. From the Ice Age toGlobal Warming]. Beck: Munich.
Bradley RS, Jones PD. 1992. Climate since A.D. 1500. Routledge:London.
Brazdil R, Kotyza O. 1995. History of Weather and Climate in theCzech Lands I: Period 1000–1500. ETH Geographisches Institut:Zurich.
Brazdil R, Pfister C, Wanner H, von Storch H, Luterbacher J. 2005.Historical climatology in Europe: the state of the art. Climatic Change70: 363–430.
Brazdil R, Kundzewicz ZW, Benito G. 2006. Historical hydrology forstudying flood risk in Europe. Hydrological Sciences Journal 51: 739–764.
Brumme B. 1981. Methoden zur Bearbeitung historischer Meß- undBeobachtungsdaten Berlin und Mitteldeutschland 1683–1770.[Methods for processing historical measurements and observations,Berlin and Central Germany 1683–1770]. Meteorology and Atmos-pheric Physics 29: 191–210.
Buismann J. 1996. Duizend Jaar Weer, Wind en Water in de LageLanden. Van Wijnen: Franeker.
Buntgen U, Esper J, Frank DC, Nicolussi K, Schmidhalter M. 2005.A 1052-year tree-ring proxy for Alpine summer temperatures. Cli-mate Dynamics 25: 141–153.
Copyright � 2009 John Wiley & Sons, Ltd.
Burger K, Dostal P, Seidel J, Imbery F, Barriendos M, Mayer H, Glaser R.2006. Hydrometeorological reconstruction of the 1824 flood event inthe Neckar River basin (southwest Germany). Hydrological SciencesJournal 51: 864–877.
Buszello H. 2007. Teuerung und Hungersnot am Ober- und Hochrheinim Spatmittelalter und in der fruhen Neuzeit (circa 1300–1800).[Death and Starvation at the Upper and Uppermost Rhine in the LateMedieval and the Early Modern Age (approx. 1300–1800)]. In DasMarkgraflerland. Kriege, Krisen und Katastrophen am Oberrhein vomMittelalter bis zur Fruhen Neuzeit. Geschichtsverein MarkgraflerLand: Schopfheim; 32–71.
Crowley TJ, Lowery T. 2000. How warm was the Medieval warmperiod? Ambio 29: 51–54.
D’Arrigo R, Wilson RJS, Jacoby G. 2006. On the long-term context forlate twentieth century warming. Journal of Geophysical Research111: D03103.
de Kraker A. 2006. Flood events in the southwestern Netherlands andcoastal Belgium, 1400–1953. Historical Hydrology 51: 913–929.
Deutsch M, Rost KT. 2005. Schwere Hochwasse in Mitteldeutschland(1500 bis 1900) und ihre soziookonomischen Folgewirkungen.[Heavy floods in Central Germany (1500–1900) and their socio-economic implications]. In Naturrisiken in der vorindustriellen Zeitund ihre Auswirkungen auf Siedlungen und Kulturlandschaft.Siedlungsforschung – Archaologie, Geschichte, Geographie, 23,Schenk W, Dix A (eds). Selbstverlag ARKUM e.V.: Bonn; 209–226.
Diaz HF, Pulwarty RS. 1994. An analysis of the time scales of variabilityin century-long Enso-sensitive records in the last 1000 years. ClimaticChange 26: 317–342.
Dobrovolny P, Moberg A, Pfister C, Bradzil R, Glaser R, Wilson R, vanEngelen A, Limanowka D, Kiss A, Halıckova M, Mackova J, RiemannD, Luterbacher J, Bohm R. 2008. Monthly and seasonal temperaturereconstructions for Central Europe derived from documentary evi-dence and instrumental records since AD 1500. Climatic Change (inreview).
Esper J, Cook ER, Schweingruber FH. 2002. Low-frequency signals inlong tree-ring chronologies for reconstructing past temperature varia-bility. Science 295: 2250–2253.
Flohn H. 1949. Klima und Witterungsablauf in Zurich im 16. Jahrhun-dert. [Climate and weather in Zurich in the 16th century]. Viertel-jahresschrift der Naturforschenden Gesellschaft in Zurich 94: 28–41.
Flohn H. 1979. Zwei bayerische Wetterkalender aus der Reformations-zeit. [Two Bavarian weather calendars from the time of Reformation].Wissenschafliche Mitteilung Meteorologisches Institut Munchen 35:173–177.
Glaser R. 2001. Klimageschichte Mitteleuropas: 1000 Jahre Wetter,Klima, Katastrophen. [History of Climate for Central Europe: 1000years of weather, climate and catastrophes]. Wissenschaftliche Buch-gesellschaft: Darmstadt.
Glaser R. 2008. Klimageschichte Mitteleuropas: 1200 Jahre Wetter,Klima, Katastrophen. [History of Climate for Central Europe: 1200years of weather, climate and catastrophes]. Wissenschaftliche Buch-gesellschaft: Darmstadt.
Glaser R, Militzer S. 1993. Daten zu Wetter, Witterung und Umwelt inFranken, Sachsen, Sachsen-Anhalt und Thuringen 1500–1700. [Dataon weather and environment in Franconia, Saxony, Saxony-Anhaltand Thuringia 1500–1700]. Reiner Hartmann: Sondheim.
Glaser R, Stangl H. 2003. Historical floods in the Dutch Rhine Delta.Natural Hazards and Earth System Sciences 3: 1–9.
Gonzalez-Rouco JF, Beltrami H, Zorita E, von Storch H. 2006. Simu-lation and inversion of borehole temperature profiles in surrogateclimates: spatial distribution and surface coupling. GeophysicalResearch Letters 33: L01703.
Holzhauser H, Zumbuhl HJ. 1999. Glacier fluctuations in the WesternSwiss and French Alps in the 16th century. Climatic Change 43: 223–237.
IPCC. 2007. Climate Change 2007: The Physical Science Basis. Con-tribution of Working Group I to the Fourth Assessment Report of theIntergovernmental Panel on Climate Change, Solomon S, Qin D,Manning M, Chen Z, Marquis M, Averyt KB, Tignor M, Miller HL(eds). Cambridge University Press: Cambridge, UK.
Jacobeit J, Wanner H, Luterbacher J, Beck C, Philipp A, Sturm K. 2001.Atmospheric circulation variability in the North-Atlantic–European
J. Quaternary Sci., Vol. 24(5) 437–449 (2009)DOI: 10.1002/jqs
A THOUSAND-YEAR RECORD OF TEMPERATURE VARIATIONS FOR GERMANY 449
area since the mid-seventeenth century. Climate Dynamics 20: 341–352.
Jones PD, Mann ME. 2004. Climate over past millennia. Reviews ofGeophysics 42: RG2002.
Korber HG. 1987. Vom Wetteraberglauben zur Wetterforschung.[From weather superstition to weather research]. Umschau:Frankfurt/Main.
Koslowski G, Glaser R. 1999. Variations in reconstructed ice winterseverity in the western baltic from 1501 to 1995. and their implica-tions for the North Atlantic oscillation. Climatic Change 41: 175–191.
Lamb HH. 1977. Climate: Present, Past and Future. Methuen: London.Lenke W. 1960. Klimadaten von 1621–1650 nach Beobachtungen des
Landgrafen Hermann IV. von Hessen. [Climate data for 1621–1650using observations of the landgrave Hermann IV. of Hesse]. Berichtedes deutschen Wetterdienst 63: 3–51.
Lenke W. 1968. Das Klima Ende des 16. und Anfang des 17. Jahrhun-derts nach Beobachtungen von Tycho de Brahe auf Hven, LeonhardIII. Treuttwein in Furstenfeld und David Fabricius in Ostfriesland.[The climate at the end of the 16th century and the beginning of the17th century using observations of Tycho de Brahe auf Hven,Leonard III. Treuttwein in Furstenfeld and David Fabricius in EastFrisia]. Berichte des deutschen Wetterdienst 15: 47.
Luterbacher J, Xoplaki E, Rickli R, Gyalistras D, Schmutz C, Wanner H.2002. Reconstruction of sea level pressure fields over the easternNorth Atlantic and Europe back to 1500. Climate Dynamics 18: 545–561.
Mangini A, Spotl C, Verdes P. 2005. Reconstruction of temperature inthe Central Alps during the past 2000 yr from a d18O stalagmiterecord. Earth and Planetary Science Letters 235: 741–751.
Mann ME. 2002. The value of multiple proxies. Science 297: 1481–1482.
Mann ME, Jones PD. 2003. 2,000 year hemispheric multi-proxytemperature reconstructions. IGBP PAGES/World Data Center forPaleoclimatology Data Contribution Series # 2003-051. In NOAA/NGDC Paleoclimatology Program, Boulder, CO.
Moberg A, Sonechkin DM, Holmgren K, Datsenko M, Karlen W. 2005.Highly variable Northern Hemisphere temperatures reconstructedfrom low- and high-resolution proxy data. Nature 433: 613–617.
Mudelsee M, Deutsch M, Borngen M, Tetzlaff G. 2006. Trends in floodrisk of the River Werra (Germany) over the past 500 years. Hydro-logical Sciences Journal 51: 818–833.
Copyright � 2009 John Wiley & Sons, Ltd.
Munzar J. 1995. Early 17th century weather in Prague after J. Kepler’sobservations. In Regional Workshop on Climate Variability andClimatic Change Vulnerability and Adaptation, Prague; 69–72.
Pertz. 1826. Monumenta Germaniae Historica. Pertz: Hannover.Pfister C. 1999. Wetternachhersage. [Weather retrodition]. Haupt: Bern.Rapp J. 2000. Konzeption, Problematik und Ergebnisse klimatolo-
gischer Trendanalysen fur Europa und Deutschland. [Conception,problems and results of climatological trend analysis for Europe andGermany]. Deutscher Wetterdienst: Offenbach.
Schneider-Carius K. 1955. Wetterkunde, Wetterforschung, Geschichteihrer Probleme und Erkenntnisse in Dokumenten aus drei Jahrhun-derten. [Meteorology, weather research, history of their problemsand results in documents from three centuries]. Freiburg: Munchen.
Schonwiese C-D, Rapp J, Fuchs T, Denhard M. 1993. Klimatrend-AtlasEuropa 1891-1990. [Climate trend atlas Europe 1891–1990].Zentrum fur Umweltforschung: Frankfurt.
Sturm K, Glaser R, Jacobeit J, Deutsch M, Brazdil R, Pfister C. 2001.Hochwasser in Mitteleuropa seit 1500 und ihre Beziehung zuratmospharischen Zirkulation. [Floods in Central Europe since1500 and their relation to atmospheric circulation dynamics].Petermanns Geographische Mitteilungen 145: 18–27.
Thorndycraft VR, Benito G, Barriendos M, Llasat MC. 2003. Palaeo-floods, historical data and climatic variability: applications in floodrisk assessment. Proceedings of the PHEFRA International Workshop,Barcelona
van Engelen AFV, Buisman J, IJnsen F. 2000. Reconstruction of the Lowcountries temperature series AD 764-1998. In International Confer-ence on Climate Change and Variability: Past, Present and Future,Mikami T (ed.) Tokyo Metropolitan University: Tokyo; 151–157.
van Engelen AFV, Buisman J, IJnsen F. 2001. A millennium of weather,winds and water in the Low Countries. In History and Climate:Memories of the Future?, Jones PD, Ogilvie AEJ, Davies TD,Briffa KR (eds). Kluwer: Dordrecht; 101–124.
Walsh R, Reading A. 1991. Historical changes in tropical cyclonefrequency within the Caribbean since 1500. Wurzburger Geogra-phische Arbeiten 80: 199–240.
Walsh RPD, Glaser R, Militzer S. 1999. The climate of Madras duringthe eighteenth century. International Journal of Climatology 19:1025–1047.
Wilson R, Tudhope A, Brohan P, Briffa K, Osborn T, Tett S. 2006. Two-hundred-fifty years of reconstructed and modeled tropical tempera-tures. Journal of Geophysical Research 111: C10007.
J. Quaternary Sci., Vol. 24(5) 437–449 (2009)DOI: 10.1002/jqs