Embed Size (px)
Citation preview
General rights Copyright and moral rights for the publications made accessible in the public portal are retained by the authors and/or other copyright owners and it is a condition of accessing publications that users recognise and abide by the legal requirements associated with these rights.
Users may download and print one copy of any publication from the public portal for the purpose of private study or research.
You may not further distribute the material or use it for any profit-making activity or commercial gain
You may freely distribute the URL identifying the publication in the public portal If you believe that this document breaches copyright please contact us providing details, and we will remove access to the work immediately and investigate your claim.
Downloaded from orbit.dtu.dk on: Apr 26, 2020
A three-dimensional approach to in vitro culture of immune-related cells
Hartmann, Sofie Bruun
Publication date:2016
Document VersionPublisher's PDF, also known as Version of record
Link back to DTU Orbit
Citation (APA):Hartmann, S. B. (2016). A three-dimensional approach to in vitro culture of immune-related cells. FrederiksbergC: National Veterinary Institute, Technical University of Denmark.
A three-dimensional approach to in vitro
culture of immune-related cells
PhD thesis • Sofie Bruun Hartmann • January 2016

2
Supervisors:
Professor Gregers Jungersen (main supervisor) National Veterinary Institute Technical University of Denmark Frederiksberg C, Denmark
Professor Jenny Emnéus Department of Micro- and Nanotechnology Technical University of Denmark Kgs. Lyngby, Denmark
Associate Professor Anders Wolff Department of Micro- and Nanotechnology Technical University of Denmark Kgs. Lyngby, Denmark
Assessment Committee:
Professor Niels Bent Larsen (chairperson) Department of Micro- and Nanotechnology Technical University of Denmark Kgs. Lyngby, Denmark
Senior scientist Jesper Eugen-Olsen Clinical Research Centre Copenhagen University Hospital Hvidovre Hvidovre, Denmark
Professor Mick Bailey School of Veterinary Science University of Bristol Bristol, UK
3
Table of Contents
Acknowledgements ..................................................................................................................................................5
Preface ......................................................................................................................................................................6
Abbreviations............................................................................................................................................................7
Summery...................................................................................................................................................................8
Sammendrag (Danish summery) ........................................................................................................................... 10
List of figures ......................................................................................................................................................... 12
Chapter 1 - General background ........................................................................................................................... 13
1.1 The immune system .................................................................................................................................... 13
1.1.1 Innate immunity ................................................................................................................................... 14
1.1.2 Adaptive immunity ............................................................................................................................... 14
1.2 CMI............................................................................................................................................................... 15
1.2.1 IFN-γ and IP10 ....................................................................................................................................... 17
1.3 Lymph nodes ............................................................................................................................................... 19
1.4 In vitro culture ............................................................................................................................................. 21
1.4.1 IFN-γ assay ............................................................................................................................................ 21
1.4.2 3D culture ............................................................................................................................................. 22
1.5 moDCs .......................................................................................................................................................... 22
Chapter 2 - General methods ................................................................................................................................ 24
2.1 Animals ........................................................................................................................................................ 24
2.2 PBMC purification ........................................................................................................................................ 24
2.3 Cell culture ................................................................................................................................................... 25
2.4 Flow cytometry ............................................................................................................................................ 27
2.5 IFN-γ specific ELISA ...................................................................................................................................... 27
2.6 Total RNA purification ................................................................................................................................. 28
2.7 cDNA synthesis ............................................................................................................................................ 28
2.8 qRT-PCR ....................................................................................................................................................... 29
2.9 Confocal microscopy ................................................................................................................................... 30
4
2.10 Light microscopy ........................................................................................................................................ 30
Chapter 3 - Study I (IGRA) ...................................................................................................................................... 31
3.1 Introduction ................................................................................................................................................. 31
3.2 Hypothesis ................................................................................................................................................... 31
3.3 Results ......................................................................................................................................................... 32
Paper I ................................................................................................................................................................ 32
Chapter 4 - Study II (3D IGRA) ............................................................................................................................... 53
4.1 Introduction ................................................................................................................................................. 53
4.2 Hypothesis ................................................................................................................................................... 53
4.3 Results ......................................................................................................................................................... 54
Chapter 5 - Study III (chip prototype) .................................................................................................................... 66
5.1 Introduction ................................................................................................................................................. 66
5.2 Hypothesis ................................................................................................................................................... 66
5.3 Results ......................................................................................................................................................... 66
Chapter 6 - Study IIII (differentiation of moDC) .................................................................................................... 74
6.1 Introduction ................................................................................................................................................. 74
6.2 Hypothesis ................................................................................................................................................... 74
6.3 Results ......................................................................................................................................................... 74
Paper II ............................................................................................................................................................... 77
Chapter 7 - General discussion ............................................................................................................................ 110
Chapter 8 - General conclusion ........................................................................................................................... 116
9 References ........................................................................................................................................................ 118
10 Appendices ..................................................................................................................................................... 126

5
Acknowledgements
This PhD project has been a journey for me. A journey full of excitement, frustration, learning, fun,
challenges and last but not least, this journey has blessed me with the privileged of working with
wonderful colleagues. I could not have completed this PhD without he help from numerous people.
First and foremost I would like to express my deepest gratitude to my supervisor, Gregers Jungersen.
Thank you for giving me the opportunity to work on this project and for your always positive inputs
and support. I would also like to thank my co-supervisors Jenny Emnéus and Anders Wolff for
competent guidance during the project. Also I owe a huge thank to members of the Bioanalytic’s and
BioLabChip groups, especially to Soumyaranjan Mohanty for providing me with 3D scaffolds and Carl
Esben Poulsen for helping me with the chip design. Also a big thank to Claus Højgård Nielsen and Tage
A. Larsen from DTU Danchip for expert assistance during the chip manufacture.
I spent most of my time at DTU Vet, where I have been surrounded by the best colleagues one could
wish for. I am deeply thankful for the way you have all welcomed me and made it very easy for me to
feel at home. Thanks to Jeanne Toft Jakobsen for always being the “go to” person whenever I needed
to solve a lab-related question - you are a star. I also owe a big thank to Panchale Olsen and Lien Thi
Minh Nguyen for help in the lab and to Ulla Riber for her flow cytometry guidance. A special thank
goes to Karin Tarp and Kerstin Skovgaard for their competent help with the PCR work and for always
having time for me when needed. I would also like to thank Mette Boye and Martin Weiss Nielsen for
help with the confocal microscope.
Thanks to all my fellow (now former) PhD students - Lasse Eggers Pedersen, Aneesh Thakur, Ann
Cathrine Findal Støy, Sarah Bøje, Lif Knudsen, and to my office mates - Heidi Mikkelsen Melvang,
Maria Rathmann Sørensen and Rikke Birgitte Lyngaa – you have all made it a joy to go work every day.
Last but not least I am grateful for my friends and family who has been patient with me during times
of intense workload. Thank you to my parents and mother-in-law for helping taking care of Josephine.
Of all the people that have helped me, I owe the biggest thank to my husband, Johan, for his endless
support, and for always being there for me whenever I need him.
6
Preface
The research presented in this thesis was performed under the supervision of Professor Gregers
Jungersen, Professor Jenny Emnéus and Associate Professor Anders Wolff. The practical work was
performed at the Section for Immunology and Vaccinology, National Veterinary Institute, Technical
University of Denmark and at the Department of Micro- and Nanotechnology, Technical University of
Denmark from December 2011 to January 2016. The project was financed by DTU.
The original aim of this thesis was to develop a diagnostic chip for detection of CMI responses in a
blood sample by recall antigen stimulation and direct IFN-γ detection as readout. This goal was not
reached, however, and the focus of the thesis changed into looking at optimization of conditions for
in vitro culture of primary immune cells. The work included in this thesis is presented in four studies.
Study I (chapter 3) looks at the effect of performing interferon-γ release assays using cultures of
whole blood or PBMCs and the study is presented in paper I. Study II (chapter 4) presents the results
from interferon-γ release assay-optimization by addition of a third dimension to the culture using
three dimensional scaffolds. Study III (chapter 5) presents the manufacture of a prototype chip. The
last study - study IIII (chapter 6) - looks at the effect of changing the culture environment when
studying the differentiation of monocytes to monocyte-derived dendritic cells in vitro. This is
presented in paper II.
This thesis contains two manuscripts:
Paper I:
Hartmann, S., Emnéus, J., Wolff, A. and Jungersen, G. “Revisiting the IFN-γ release assay: Whole blood
or PBMC cultures? - And other factors of influence”. Manuscript ready for submission.
Paper II
Hartmann, S., Mohanty, S., Skovgaard, K., Brogaard, L., Flagstad, F., Emnéus, J., Wolff, A.,
Summerfield, A. and Jungersen, G. “Investigating the role of surface materials and three dimensional
architecture on in vitro differentiation of porcine monocyte-derived dendritic cells”. Manuscript
submitted to PLOS ONE.
7
Abbreviations
2D Two dimensional
3D Three dimensional
APC Antigen presenting cell
BCR B cell receptor
CMI Cell-mediated immunity
CTL Cytotoxic T lymphocyte
ELISA Enzyme-linked immunosorbent assay
FCS Fetal calf serum
FRC Fibroblastic reticular cells
GW Glass wool
IFN-γ Interferon gamma
IGRA Interferon gamma release assay
IL Interleukin
IP10 Interferon gamma induced protein 10 (or CXCL10)
MAP Mycobacterium avium subsp. paratuberculosis
MHC Major histocompatibility complex
OD Optical density
PBMC Peripheral blood mononuclear cells
PBS Phosphate buffered saline
PCL polycaprolactone
PDMS Polydimethylsiloxane
pMHC Peptide:MHC complex
PP(S) Polypropylene (shavings)
PPDj Johnin purified protein derivative (a protein derivative from MAP)
PS Polystyrene
qRT-PCR Quantitative real time polymerase chain reaction
RT Room temperature
RPMI Roswell Park Memorial Institute (cell culture medium)
SEB Staphylococcal enterotoxin B
TCR T cell receptor
TH T helper cell
WB Whole blood
8
Summery
T lymphocytes are key players during the initiation of an adaptive immune response. The activation of
these cells in vivo requires migration within the lymph nodes until they encounter antigen presenting
cells (APCs) that can activate them to secrete IFN-γ which mediates downstream effector functions.
The in vitro reactivation of antigen-experienced T lymphocytes and detection of IFN-γ from cell
cultures can be used in a diagnostic assay to test for disease or vaccine efficacy. Practical procedures
of the IFN-γ release assay (IGRA) was investigated using bovine cells and whole blood cultures was
found preferable compared to PBMC cultures, partly due to the risk of losing cell subsets after
purification of PBMCs.
The development of in vitro culture systems for more than 50 years ago revolutionized the
biomedical world. It became possible to study cell behavior using cell lines or primary cells in culture
and to measure cell activity such as IGRA, as described above. The traditional way of culturing cells
are done using polystyrene (PS) plastic ware in flask-, Petri dish- or micro titer plate format. However,
these artificial two dimensional (2D) surfaces on which the cells grow, has shown to interfere with cell
morphology, gene expression and overall behavior and as such gives a poor reflection of in vivo cell
behavior. Therefore, it is believed that by mimicking the in vivo conditions within the cultures, this
would generate “closer-to-in vivo” results. For this purpose three dimensional (3D) culture setups
have been developed including artificial scaffolds and extracellular matrix gels.
Optimization of IGRA was attempted using solid 3D scaffolds in various formats. The purpose
of the 3D scaffolds was to facilitate T lymphocyte migration and subsequently activation due to
increased chances of T lymphocyte/APC encounter. However, it turned out that the addition of this
extra dimension to the cultures did not translate into increased de novo secretion of IFN-γ in these
cultures. Furthermore, we often observed a non-specific effect on the level of IFN-γ when cells were
cultures in 3D. This suggested that cells were sensitive to the geometry surrounding them and that
this was independent on antigen stimulation.
9
Based on these findings and a previous discovery that the polymer PDMS, gave rise to
increased differentiation of a nerve cell line in vitro, we tested the effect of PDMS on the
differentiation of porcine monocytes. Monocytes are immune cells of high plasticity, and thus we
speculated that they might be sensitive to culture conditions. Indeed, monocytes differentiated into
monocyte-derived DC (moDCs) when cultured conventionally (2D PS) in the presence of GM-CSF and
IL-4, but adopted a macrophage-like gene expression profile when cultured on PDMS. Further it was
found that 3D culturing resulted in increased activation of the monocyte-derived cells.
The work in this thesis covers several aspects within primary cell culture, but central to the
work is the investigation of 3D cell culture setups for improved activation/differentiation of immune
cells. Conclusively, this work highlights the importance of acknowledging the effect from external
factors when analyzing data generated from in vitro cultures. This being even more important when
working with immune cells since these cells adopt traits and functions simply based on the nature of
the culture system.
10
Sammendrag (Danish summery)
T-lymfocytter er centrale celler i aktiveringen af det adaptive immunrespons. Aktiveringen af disse
celler in vivo sker i lymfeknuderne og indebærer migration af T lymfocytterne indtil de støder på en
relevant antigen-præsenterende celle (APC), som kan aktivere dem. Herved responderer T-
lymfocytterne ved at udskille IFN-γ, som er med til at initiere andre dele af immunresponset. In vitro
reaktivering af primede T-lymfocytter og efterfølgende detektion af IFN-γ fra cellekulturer, kan
anvendes i et diagnostisk assay til sygdomsdetektion eller til at teste vaccineeffektivitet. Praktiske
procedurer omkring opsætningen af dette assay, kaldet IFN-γ release assay (IGRA), blev undersøgt
med immunceller fra kalve. Det viste sig, at fuldblod var bedre egnet end PBMC kulturer, dels på
grund af risikoen for at miste specielle celletyper under oprensningen af PBMC'erne.
Udviklingen af metoder til in vitro-dyrkning af celler for mere end 50 år siden, revolutionerede
den biomedicinske verden. Det blev bl.a. muligt at studere celler og deres adfærd vha. både cellelinjer
og primære celler, samt at måle celleaktivitet vha assays såsom IGRA. Den traditionelle måde at dyrke
celler på, har været vha. plastikprodukter såsom flasker, skåle eller flerbrøndsplader lavet i polystyren
(PS). Disse kunstige todimensionale (2D) overflader, hvorpå cellerne vokser, har dog vist sig at påvirke
cellemorfologien, genekspressionen og cellernes generelle opførsel, hvilket resulterer i en dårlig
afspejling af cellernes in vivo-adfærd. Det antages derfor, at man ville kunne opnå bedre resultater,
som i højere grad afspejler in vivo-forholdene, hvis der blev optimeret på cellekulturforholdene. Til
dette formål er tredimensionelle (3D) kulturer blevet udviklet, herunder kunstige matricer el netværk
samt ekstracellulær proteinholdige geler.
I denne afhandling blev IGRA forsøgt optimeret ved at tilføje 3D matricer i forskellige formater
til cellekulturerne. Formålet med 3D matricerne var at facilitere effektiv migration af T-lymfocytterne
og deres efterfølgende aktivering som følge af øget chancer for T-lymfocyt/APC interaktion. Det viste
sig dog, at tilføjelsen af denne ekstra dimension til kulturerne ikke resultere i en øget de novo
produktion af IFN-γ i disse kulturer. Vi observerede derimod en uspecifik påvirkning af IFN-γ niveauet
når cellerne var i 3D kulturer. Dette antydede, at cellerne var følsomme overfor cellekultur-
geometrien, og at dette var uafhængigt af antigenstimuleringen.
11
På baggrund af disse resultater, samt tidligere studier som viste at polydimethylsiloxane
(PDMS) gav anledning til øget in vitro differentiering af en nervecellelinje, satte vi os for at teste
virkningen af PDMS på differentieringen af monocytter oprenset fra svineblod. Monocytter er
immunceller med høj plasticitet, og dermed potentielt følsomme over for dyrkningsbetingelserne. Det
viste sig at monocytterne differentierede sig til monocyt-deriverede DCer (moDCer), når de blev
dyrket konventionelt (2D PS) med GM-CSF og IL-4, mens de fik en makrofag-lignende
genekspressionsprofil når de blev dyrket på PDMS. Yderligere fandt vi, at 3D dyrkning resulterede i
øget aktivering af disse monocyt-deriverede celler.
Arbejdet i denne afhandling dækker flere aspekter inden for primær cellekultur, men centralt
for arbejdet er undersøgelsen af 3D cellekulturenes effekt på aktiveringen/differentieringen af
immunceller. Konklusionsvis fremhæver dette arbejde, hvor vigtigt det er at anerkender virkningen af
eksterne faktorer når man analyserer data fra in vitro cellekulturer. Dette er især vigtigt, når der
arbejdes med immunceller, da disse celler har vist sig at være sensitive overfor ydre ændringer i
cellekulturopsættet.
12
List of figures
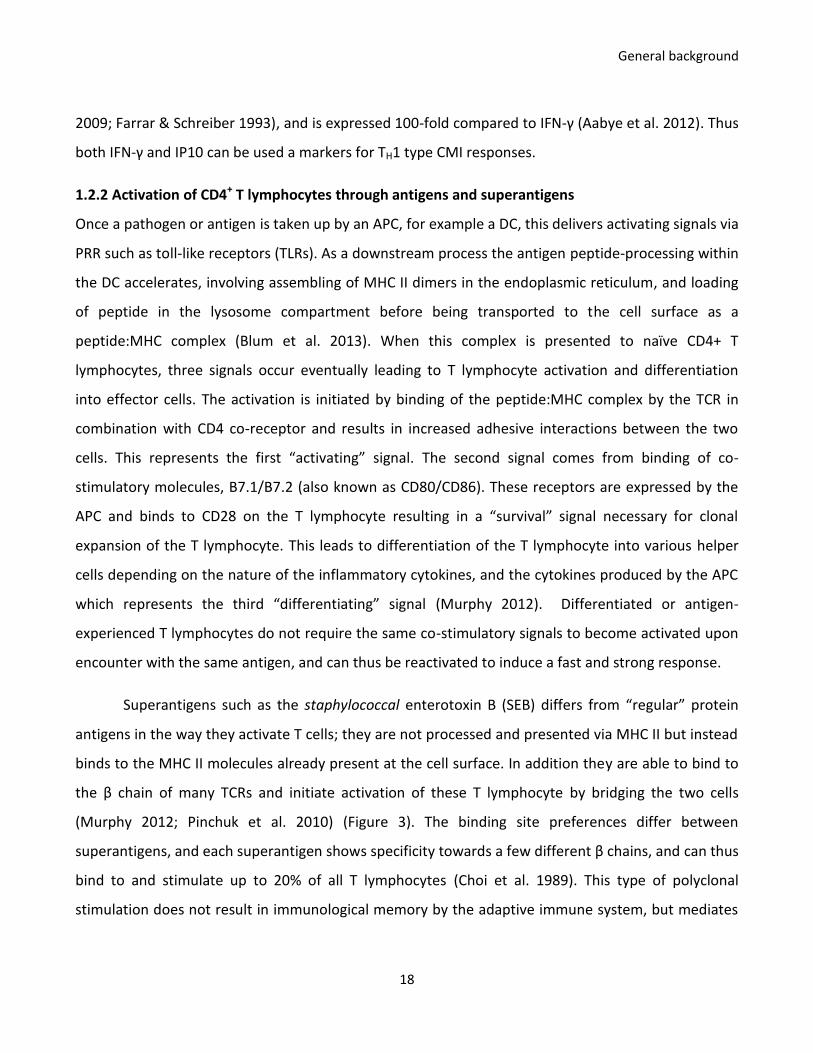
Figure 1: Overview of cells involved in the adaptive and innate immune system ................................................ 13
Figure 2: Cells and molecules important for innate and adaptive immune responses ........................................ 16
Figure 3: Concept of antigen vs. superantigen activation. .................................................................................... 19
Figure 4: Modes of T lymphocyte migration within the three dimensional network of a lymph node ................ 20
Figure 5: Overview of mononuclear phagocytes and their precursors. ................................................................ 23
Figure 6: Glass wool-mediated gravity flow culture setup. .................................................................................. 54
Figure 7: Glass wool-mediated gravity flow experiment.). ................................................................................... 55
Figure 8: Kinetics of IFNG and CXCL10 gene expression in 3D cultures. ............................................................... 56
Figure 9: IFN-γ protein expression in 3D cultures.. ............................................................................................... 57
Figure 10: Effect of well size and cell concentration on IFN-γ protein secretion.................................................. 58
Figure 11: Effect of 3D culture and cell concentration on IFN-γ protein secretion. ............................................. 59
Figure 12: 3D cultures of PDMS sugar cubes. ....................................................................................................... 60
Figure 13: 3D cultures using filter paper. .............................................................................................................. 62
Figure 14: 3D cultures coated with CCL21. ........................................................................................................... 63
Figure 15: Confocal Images of 3D PS scaffold (Alvetex®). ..................................................................................... 64
Figure 16: CD4+ T lymphocyte migration on 2D surface. ...................................................................................... 65
Figure 17: Chip design and fabrication. ................................................................................................................. 68
Figure 18: Cell flow and capture by microstructures on the chip prototype. ....................................................... 70
Figure 19: Images of T cells and monocytes within microstructures from the chip prototype. ........................... 71
Figure 20: Quantitation- and melting curve analysis of ACTB in titrated samples of goat blood.. ....................... 72
Figure 21: Purification of CD172a+ monocytes (A) and viability check of moDCs before and after LPS (B) ......... 75
13
Chapter 1 - General background
1.1 The immune system
We live in a world of daily exposure to millions of potential pathogenic microorganism through
inhalation, contact and digestion. Yet we manage to stay alive, and the reason for this can be ascribed
to our immune system. It consists of a diverse group of cells and molecules specialized in protecting
us from pathogens by identifying and targeting them or their products for destruction. The responses
carried out by the immune system needs to be tightly regulated in terms of type, intensity and
duration to effectively overcome an intruding pathogen, but doing so with minimal collateral tissue
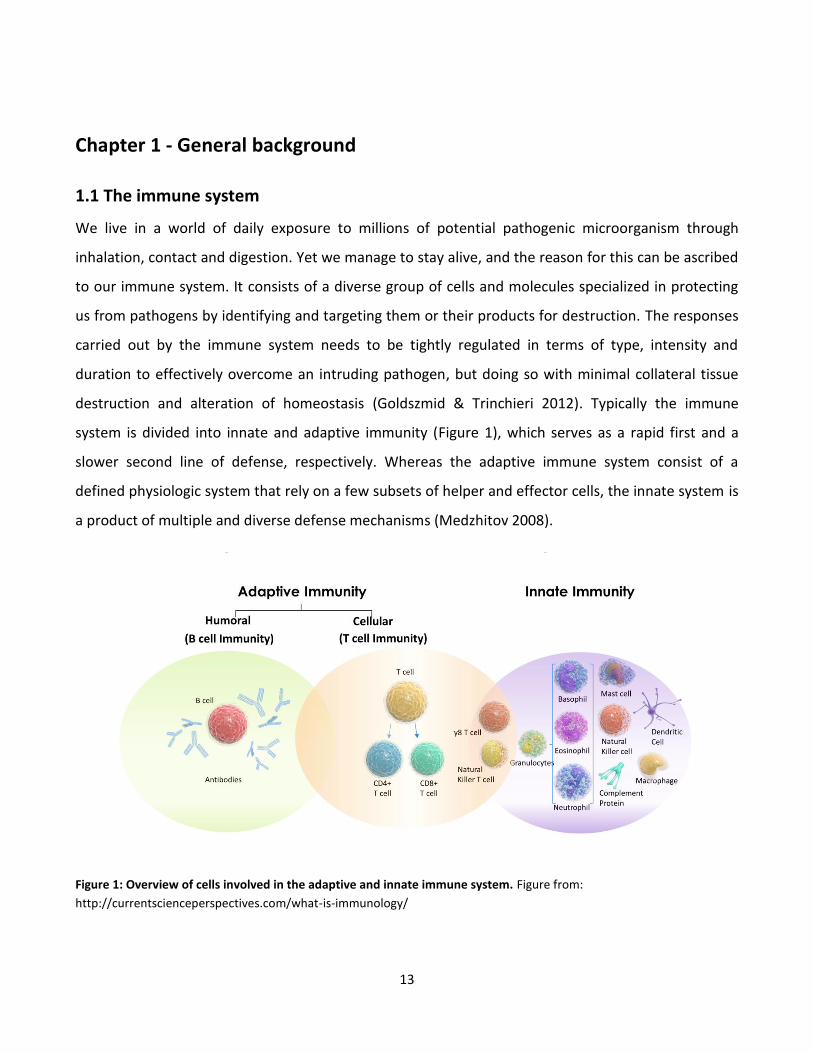
destruction and alteration of homeostasis (Goldszmid & Trinchieri 2012). Typically the immune
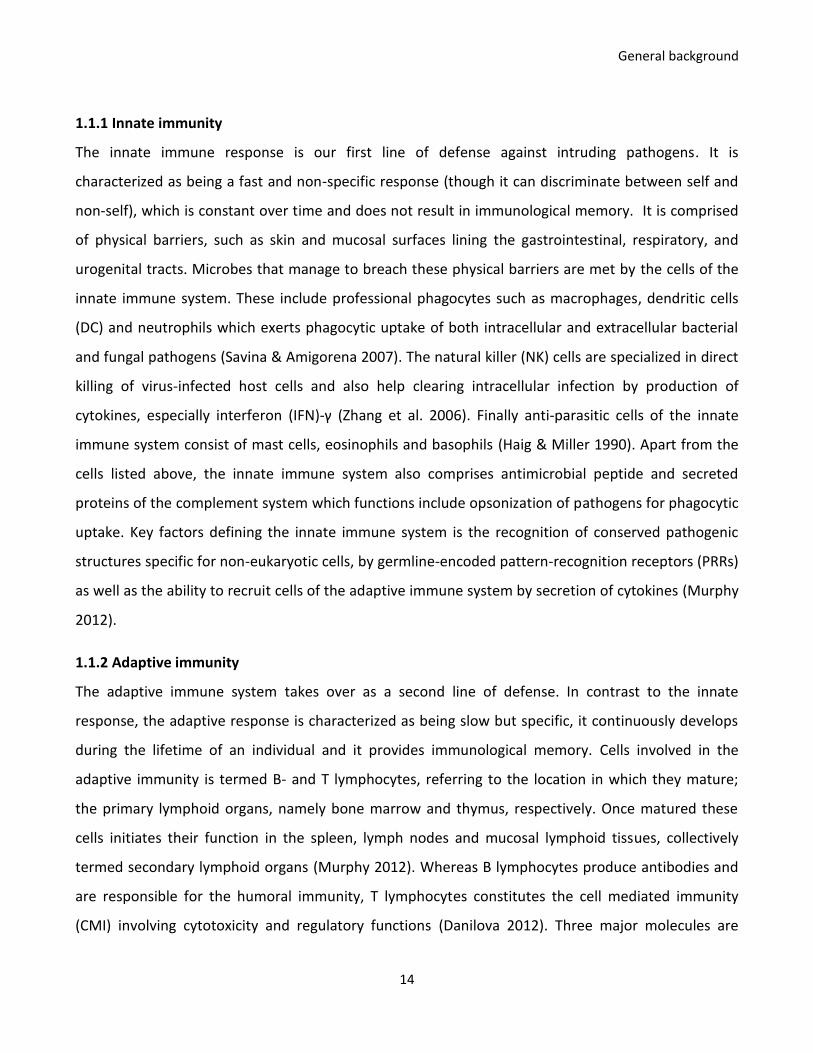
system is divided into innate and adaptive immunity (Figure 1), which serves as a rapid first and a
slower second line of defense, respectively. Whereas the adaptive immune system consist of a
defined physiologic system that rely on a few subsets of helper and effector cells, the innate system is
a product of multiple and diverse defense mechanisms (Medzhitov 2008).
Figure 1: Overview of cells involved in the adaptive and innate immune system. Figure from:
http://currentscienceperspectives.com/what-is-immunology/
General background
14
1.1.1 Innate immunity
The innate immune response is our first line of defense against intruding pathogens. It is
characterized as being a fast and non-specific response (though it can discriminate between self and
non-self), which is constant over time and does not result in immunological memory. It is comprised
of physical barriers, such as skin and mucosal surfaces lining the gastrointestinal, respiratory, and
urogenital tracts. Microbes that manage to breach these physical barriers are met by the cells of the
innate immune system. These include professional phagocytes such as macrophages, dendritic cells
(DC) and neutrophils which exerts phagocytic uptake of both intracellular and extracellular bacterial
and fungal pathogens (Savina & Amigorena 2007). The natural killer (NK) cells are specialized in direct
killing of virus-infected host cells and also help clearing intracellular infection by production of
cytokines, especially interferon (IFN)-γ (Zhang et al. 2006). Finally anti-parasitic cells of the innate
immune system consist of mast cells, eosinophils and basophils (Haig & Miller 1990). Apart from the
cells listed above, the innate immune system also comprises antimicrobial peptide and secreted
proteins of the complement system which functions include opsonization of pathogens for phagocytic
uptake. Key factors defining the innate immune system is the recognition of conserved pathogenic
structures specific for non-eukaryotic cells, by germline-encoded pattern-recognition receptors (PRRs)
as well as the ability to recruit cells of the adaptive immune system by secretion of cytokines (Murphy
2012).
1.1.2 Adaptive immunity
The adaptive immune system takes over as a second line of defense. In contrast to the innate
response, the adaptive response is characterized as being slow but specific, it continuously develops
during the lifetime of an individual and it provides immunological memory. Cells involved in the
adaptive immunity is termed B- and T lymphocytes, referring to the location in which they mature;
the primary lymphoid organs, namely bone marrow and thymus, respectively. Once matured these
cells initiates their function in the spleen, lymph nodes and mucosal lymphoid tissues, collectively
termed secondary lymphoid organs (Murphy 2012). Whereas B lymphocytes produce antibodies and
are responsible for the humoral immunity, T lymphocytes constitutes the cell mediated immunity
(CMI) involving cytotoxicity and regulatory functions (Danilova 2012). Three major molecules are
General background
15
central for the adaptive immunity: the T cell receptor (TCR), B cell receptor (BCR) and major
histocompatibility complex (MHC). The TCR and BCR are similar in structure; they are both dimers
with BCR being composed of a heavy and a light immunoglobulin chain, and TCR being composed of
an α and β chain (in αβT lymphocytes) or a γ and δ chain (in γδT lymphocytes) (Murphy 2012). Despite
the similarity of their receptors, B and T cells differ functionally in the way they recognize antigens; B
cells recognize antigens (non-self) directly via BCR, whereas T cells recognize “non-self” in
combination with “self” through antigen:MHC complexes via TCR (Danilova 2012). During the process
of maturation, BCR and TCR undergo somatic recombination of gene segments (Schatz 2004;
Tonegawa 1983) and through imprecise joining mechanisms a high degree of functionally important
for diversity is introduced, creating huge numbers of receptors with unique specificities (Murphy
2012). Through this genomic recombination, the diversity of TCRs with distinctive specificities exceeds
1015 (Davis & Bjorkman 1988). The specificities of BCR is even higher due to secondary processes of
somatic hypermutation and class switch recombination (Muramatsu et al. 2000; Liu & Schatz 2009)
which occur following antigen binding and B lymphocyte activation thus ensuring the production of
high affinity antibodies. B lymphocytes with BCRs specific for “self” antigens are negatively selected
during development in the bone marrow (Hartley et al. 1993; Gay et al. 1993). In the thymus, T
lymphocytes whose receptors interact weakly with antigen:MHC complexes is positively selected for
whereas T lymphocytes with strongly self-reactive receptors are negatively selected (Murphy 2012).
In this way, autoreactive lymphocytes are eliminated and the remaining pool of naïve (antigen-
unexperienced) B and T lymphocytes enter the blood stream and travels to peripheral lymphoid
tissues where they, following antigen recognition, become activated and clonally expands and
differentiates into antibody-producing plasma cells or cytotoxic/helper T lymphocytes, respectively
(Danilova 2012).
1.2 CMI
The immunological response performed by T lymphocytes is the CMI response. During development T
lymphocytes commits to expression of either cluster of differentiation (CD)-8 or CD4 co-receptor
molecules (Tanaka & Taniuchi 2014). CD8+ T lymphocytes recognize antigen in combination with MHC
class I expressed by all nucleated cells, and develops into cytotoxic T lymphocytes (CTLs) following
General background
16
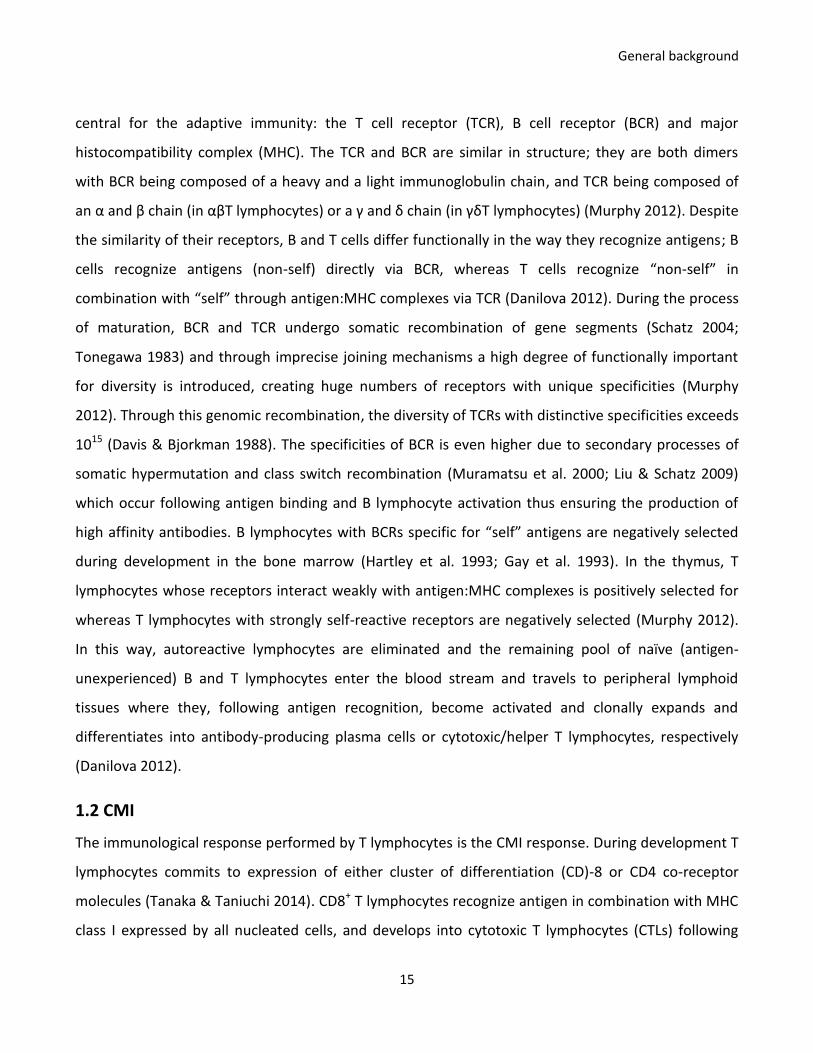
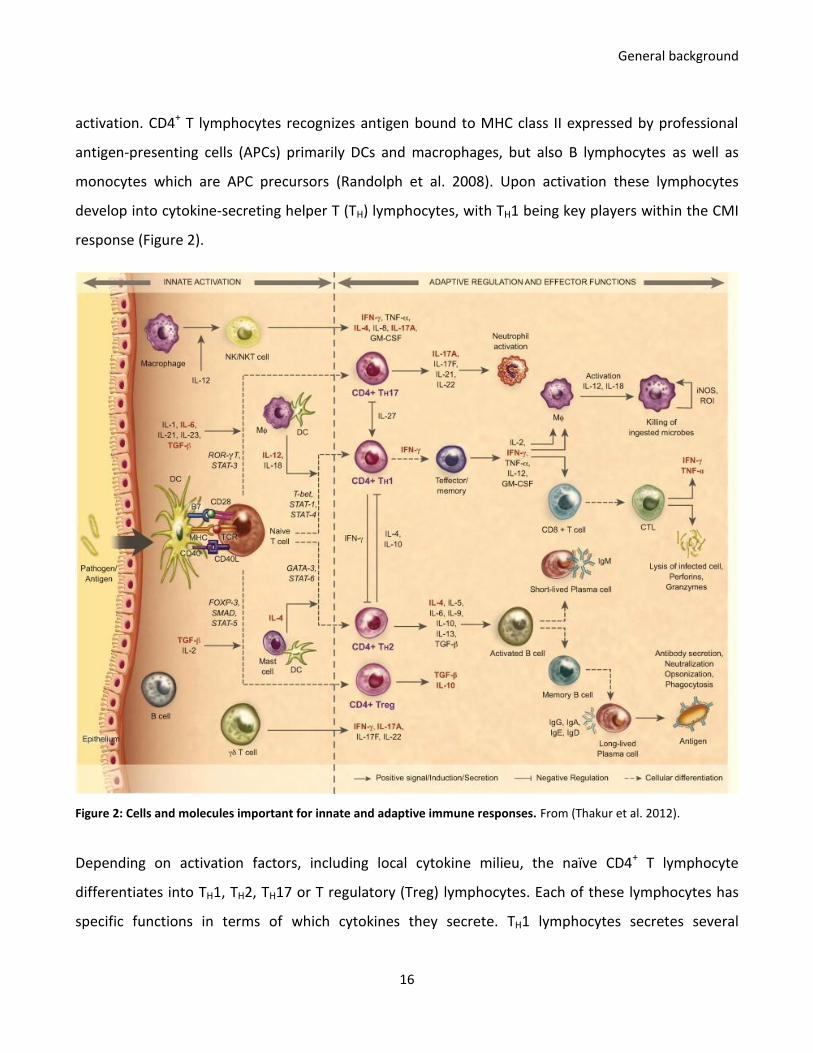
activation. CD4+ T lymphocytes recognizes antigen bound to MHC class II expressed by professional
antigen-presenting cells (APCs) primarily DCs and macrophages, but also B lymphocytes as well as
monocytes which are APC precursors (Randolph et al. 2008). Upon activation these lymphocytes
develop into cytokine-secreting helper T (TH) lymphocytes, with TH1 being key players within the CMI
response (Figure 2).
Figure 2: Cells and molecules important for innate and adaptive immune responses. From (Thakur et al. 2012).
Depending on activation factors, including local cytokine milieu, the naïve CD4+ T lymphocyte
differentiates into TH1, TH2, TH17 or T regulatory (Treg) lymphocytes. Each of these lymphocytes has
specific functions in terms of which cytokines they secrete. TH1 lymphocytes secretes several
General background
17
cytokines, but the primary one being IFN-γ (Romagnani 1994) that activates macrophages and CTLs
and enabling them to kill pathogens and induce apoptosis in infected cells, respectively. The function
of TH2 lymphocytes is to initiate humoral immunity by B lymphocyte activation, mediated primarily by
secretion of interleukin (IL)-4 (Romagnani 1994). TH17 and Treg lymphocytes are responsible for
neutrophils activation and immune regulation through IL-17A and IL-10/transforming growth factor
(TGF)-β secretions, respectively (Thakur et al. 2012). Together, these cells orchestrate a complicated
network of signals that eventually leads to development of long lived memory cells that due to their
antigen-experienced nature, are capable of triggering a strong and fast response upon reencounter
with the same antigen.
1.2.1 IFN-γ and IP10
IFN-γ is an 18.8 kD cytokine secreted by TH1 lymphocytes, however other cells are also capable of
producing IFN-γ. These cells includes CD8+ CTLs in the adaptive response as well as NK/NKT cells and
γδ T lymphocytes which are cells bridging the innate and adaptive immune system. The latter cells
have been shown to be a source of innate IFN-γ production in in vitro cultures of bovine cells (Olsen et
al. 2005; Kennedy 2002). γδ T lymphocytes have been shown to have immune regulatory functions
and are active during the early responses to infection (Hiromatsu et al. 1992; King et al. 1999). Of yet
unknown reasons, they are present in much higher numbers in cattle and pigs, especially in young
animals where they constitute app. 40% and 23-57% of total circulating T lymphocytes, respectively
(Wilson et al. 1996; Yang & Parkhouse 1996; Yang & Parkhouse 2000). IFN-γ has broad biological
functions which includes anti-viral activity, enhancement of antigen-presentation via MHC I/II
pathways, leucocyte trafficking, antibody isotype switching and immune regulation by means of TH2
commitment inhibition (Boehm et al. 1997; Schoenborn & Wilson 2007; Schroder et al. 2004).
IP10 (encoded by the CXCL10 gene) is a 7.4 kD small chemokine secreted by APCs (Moser & Loetscher
2001; Dhillon et al. 2007). It is expressed in pathogen-infected cells, but can also be induced at high
levels by cells of the adaptive immune response (Ruhwald et al. 2012). In this case, it is expressed by
APC in response to T lymphocyte-derived IFN-γ, but can also be induced by other cytokines. It is thus
considered to be a downstream marker to IFN-γ which is the typical CMI readout marker(Chen & Liu
General background
18
2009; Farrar & Schreiber 1993), and is expressed 100-fold compared to IFN-γ (Aabye et al. 2012). Thus
both IFN-γ and IP10 can be used a markers for TH1 type CMI responses.
1.2.2 Activation of CD4+ T lymphocytes through antigens and superantigens
Once a pathogen or antigen is taken up by an APC, for example a DC, this delivers activating signals via
PRR such as toll-like receptors (TLRs). As a downstream process the antigen peptide-processing within
the DC accelerates, involving assembling of MHC II dimers in the endoplasmic reticulum, and loading
of peptide in the lysosome compartment before being transported to the cell surface as a
peptide:MHC complex (Blum et al. 2013). When this complex is presented to naïve CD4+ T
lymphocytes, three signals occur eventually leading to T lymphocyte activation and differentiation
into effector cells. The activation is initiated by binding of the peptide:MHC complex by the TCR in
combination with CD4 co-receptor and results in increased adhesive interactions between the two
cells. This represents the first “activating” signal. The second signal comes from binding of co-
stimulatory molecules, B7.1/B7.2 (also known as CD80/CD86). These receptors are expressed by the
APC and binds to CD28 on the T lymphocyte resulting in a “survival” signal necessary for clonal
expansion of the T lymphocyte. This leads to differentiation of the T lymphocyte into various helper
cells depending on the nature of the inflammatory cytokines, and the cytokines produced by the APC
which represents the third “differentiating” signal (Murphy 2012). Differentiated or antigen-
experienced T lymphocytes do not require the same co-stimulatory signals to become activated upon
encounter with the same antigen, and can thus be reactivated to induce a fast and strong response.
Superantigens such as the staphylococcal enterotoxin B (SEB) differs from “regular” protein
antigens in the way they activate T cells; they are not processed and presented via MHC II but instead
binds to the MHC II molecules already present at the cell surface. In addition they are able to bind to
the β chain of many TCRs and initiate activation of these T lymphocyte by bridging the two cells
(Murphy 2012; Pinchuk et al. 2010) (Figure 3). The binding site preferences differ between
superantigens, and each superantigen shows specificity towards a few different β chains, and can thus
bind to and stimulate up to 20% of all T lymphocytes (Choi et al. 1989). This type of polyclonal
stimulation does not result in immunological memory by the adaptive immune system, but mediates
General background
19
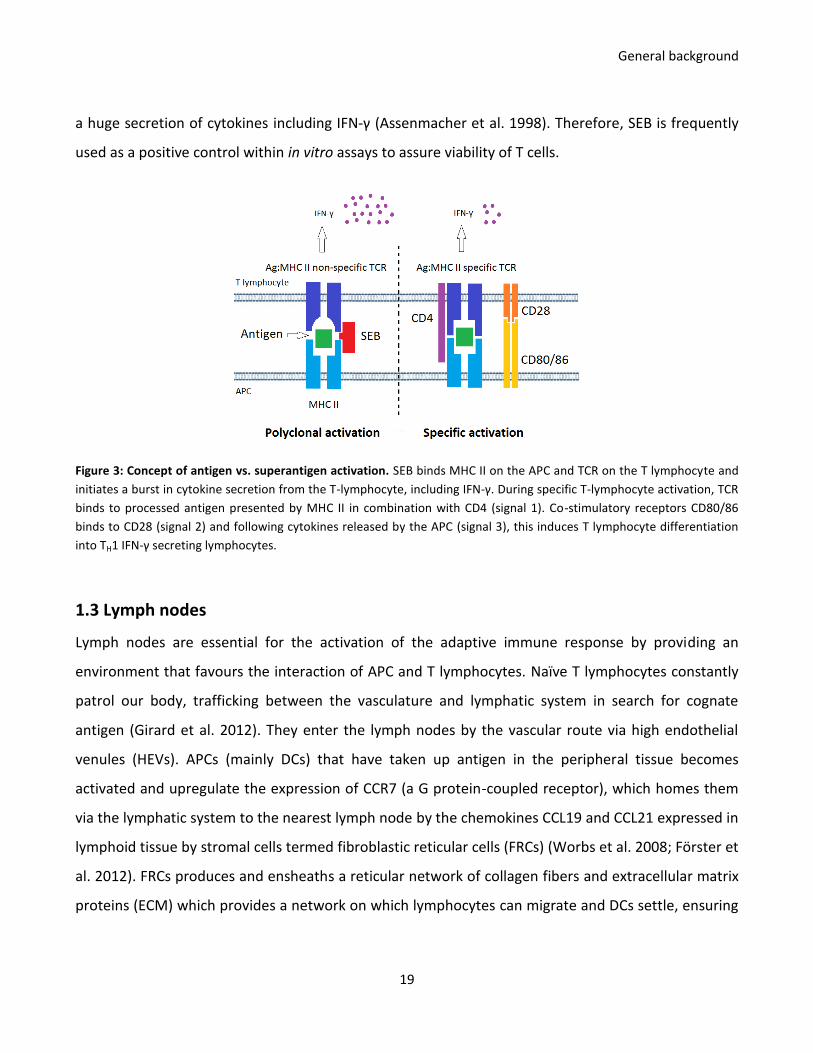
a huge secretion of cytokines including IFN-γ (Assenmacher et al. 1998). Therefore, SEB is frequently
used as a positive control within in vitro assays to assure viability of T cells.
Figure 3: Concept of antigen vs. superantigen activation. SEB binds MHC II on the APC and TCR on the T lymphocyte and
initiates a burst in cytokine secretion from the T-lymphocyte, including IFN-γ. During specific T-lymphocyte activation, TCR
binds to processed antigen presented by MHC II in combination with CD4 (signal 1). Co-stimulatory receptors CD80/86
binds to CD28 (signal 2) and following cytokines released by the APC (signal 3), this induces T lymphocyte differentiation
into TH1 IFN-γ secreting lymphocytes.
1.3 Lymph nodes
Lymph nodes are essential for the activation of the adaptive immune response by providing an
environment that favours the interaction of APC and T lymphocytes. Naïve T lymphocytes constantly
patrol our body, trafficking between the vasculature and lymphatic system in search for cognate
antigen (Girard et al. 2012). They enter the lymph nodes by the vascular route via high endothelial
venules (HEVs). APCs (mainly DCs) that have taken up antigen in the peripheral tissue becomes
activated and upregulate the expression of CCR7 (a G protein-coupled receptor), which homes them
via the lymphatic system to the nearest lymph node by the chemokines CCL19 and CCL21 expressed in
lymphoid tissue by stromal cells termed fibroblastic reticular cells (FRCs) (Worbs et al. 2008; Förster et
al. 2012). FRCs produces and ensheaths a reticular network of collagen fibers and extracellular matrix
proteins (ECM) which provides a network on which lymphocytes can migrate and DCs settle, ensuring
General background
20
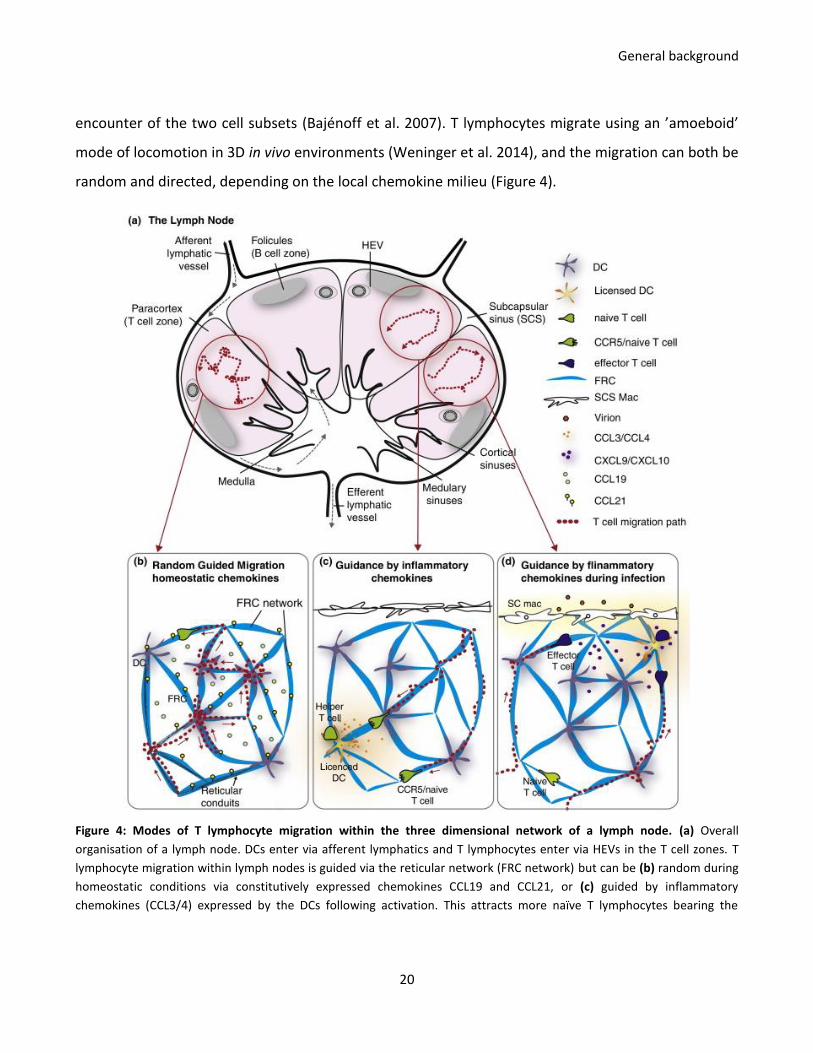
encounter of the two cell subsets (Bajénoff et al. 2007). T lymphocytes migrate using an ’amoeboid’
mode of locomotion in 3D in vivo environments (Weninger et al. 2014), and the migration can both be
random and directed, depending on the local chemokine milieu (Figure 4).
Figure 4: Modes of T lymphocyte migration within the three dimensional network of a lymph node. (a) Overall
organisation of a lymph node. DCs enter via afferent lymphatics and T lymphocytes enter via HEVs in the T cell zones. T
lymphocyte migration within lymph nodes is guided via the reticular network (FRC network) but can be (b) random during
homeostatic conditions via constitutively expressed chemokines CCL19 and CCL21, or (c) guided by inflammatory
chemokines (CCL3/4) expressed by the DCs following activation. This attracts more naïve T lymphocytes bearing the
General background
21
chemokine receptor CCR5. (d) Lymph-born pathogenic particles are captured by resident macrophages that become
activated and recruits effector T lymphocytes. From (Munoz et al. 2014).
1.4 In vitro culture
Cell culture became recognized as a research field when the Tissue Culture Commission (now known
as The Society for In Vitro Biology) was established in 1946 (Berthier et al. 2012). However, already in
1907 with the demonstration of nerve fiber outgrowth from a frog embryo on a glass dish (Harrison
1911), this marked the beginning of the cell culture discipline. In 1955 Harry Eagle established the first
widely used chemically defined medium (Eagle 1955). Glass was the choice for culture ware, but as
the field began to expand, glass became a limiting factor and thus alternative materials such as plastic
with properties that included reduction of the labor intensive cleaning as well as low production and
operational costs, was introduced (Berthier et al. 2012). The plastic industry expanded enormously
and companies such as Dow Corning and Falcon Plastics developed techniques decreasing the cost for
plastic fabrication, particularly for polystyrene (Teach & Kiessling 1960). Because of its low production
costs and other attractive properties such as optical clarity, mechanical strength and durability,
polystyrene became the material of choice for disposable cell culture ware. Furthermore, when
Falcon Plastics developed the oxygen plasma surface treatment, rendering the polystyrene surfaces
more hydrophilic, resulting in improved cell attachment and growth (Barker & LaRocca 1994; Curtis et
al. 1983), this cemented the use of polystyrene as in vitro culture ware, and from the 1960s it became
the dominant material produced by many manufacturers (Curtis et al. 1983). Today many options are
available, but the
1.4.1 IFN-γ assay
As a tool to measure CMI in vitro, the IFN-γ assay has been available for more than 25 years. Within
the field of veterinary medicine, bovine tuberculosis and paratuberculosis were the first infections
studied using this method (Wood et al. 1989; Wood et al. 1990; Rothel et al. 1990; Billman-Jacobe et
al. 1992). The principle of the test is to measure the level of de novo secreted IFN-γ by cells in
response to overnight culture with antigen. This is usually done by subtracting the concentrations of
IFN-γ obtained in non-stimulated cultures (background) from the concentrations obtained in antigen-
stimulated cultures. The assay can be based on whole blood cultures or cultures of purified peripheral
General background
22
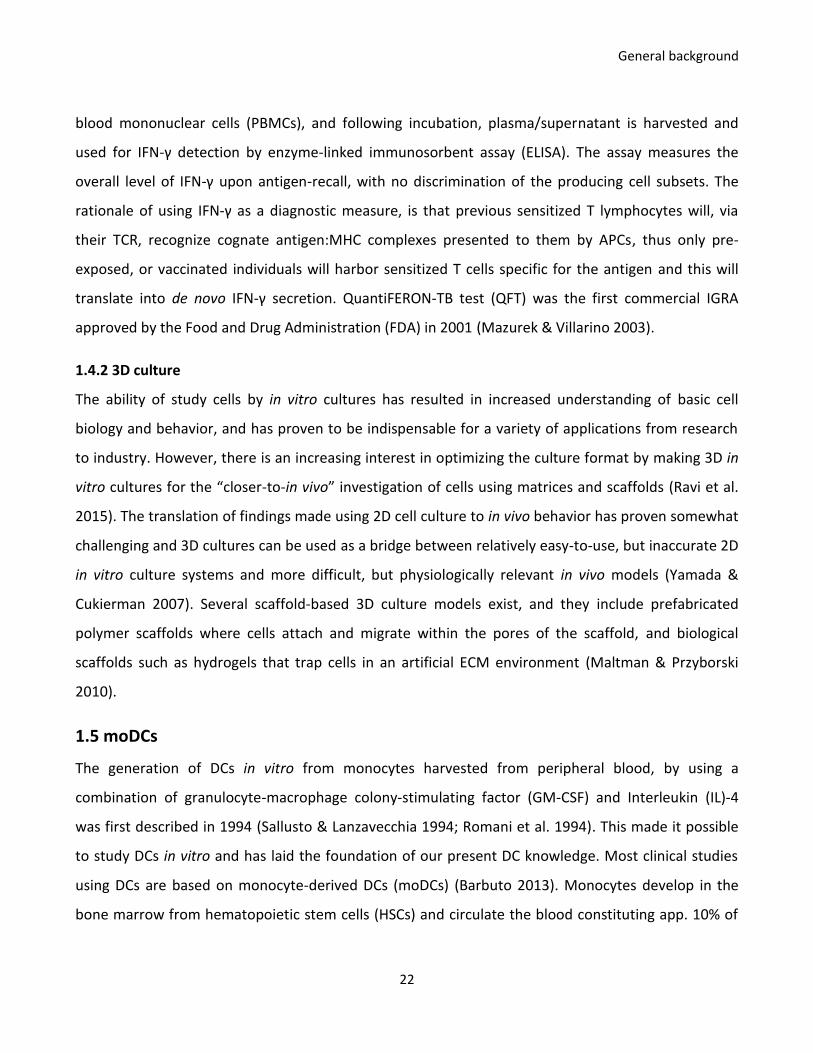
blood mononuclear cells (PBMCs), and following incubation, plasma/supernatant is harvested and
used for IFN-γ detection by enzyme-linked immunosorbent assay (ELISA). The assay measures the
overall level of IFN-γ upon antigen-recall, with no discrimination of the producing cell subsets. The
rationale of using IFN-γ as a diagnostic measure, is that previous sensitized T lymphocytes will, via
their TCR, recognize cognate antigen:MHC complexes presented to them by APCs, thus only pre-
exposed, or vaccinated individuals will harbor sensitized T cells specific for the antigen and this will
translate into de novo IFN-γ secretion. QuantiFERON-TB test (QFT) was the first commercial IGRA
approved by the Food and Drug Administration (FDA) in 2001 (Mazurek & Villarino 2003).
1.4.2 3D culture
The ability of study cells by in vitro cultures has resulted in increased understanding of basic cell
biology and behavior, and has proven to be indispensable for a variety of applications from research
to industry. However, there is an increasing interest in optimizing the culture format by making 3D in
vitro cultures for the “closer-to-in vivo” investigation of cells using matrices and scaffolds (Ravi et al.
2015). The translation of findings made using 2D cell culture to in vivo behavior has proven somewhat
challenging and 3D cultures can be used as a bridge between relatively easy-to-use, but inaccurate 2D
in vitro culture systems and more difficult, but physiologically relevant in vivo models (Yamada &
Cukierman 2007). Several scaffold-based 3D culture models exist, and they include prefabricated
polymer scaffolds where cells attach and migrate within the pores of the scaffold, and biological
scaffolds such as hydrogels that trap cells in an artificial ECM environment (Maltman & Przyborski
2010).
1.5 moDCs
The generation of DCs in vitro from monocytes harvested from peripheral blood, by using a
combination of granulocyte-macrophage colony-stimulating factor (GM-CSF) and Interleukin (IL)-4
was first described in 1994 (Sallusto & Lanzavecchia 1994; Romani et al. 1994). This made it possible
to study DCs in vitro and has laid the foundation of our present DC knowledge. Most clinical studies
using DCs are based on monocyte-derived DCs (moDCs) (Barbuto 2013). Monocytes develop in the
bone marrow from hematopoietic stem cells (HSCs) and circulate the blood constituting app. 10% of
General background
23
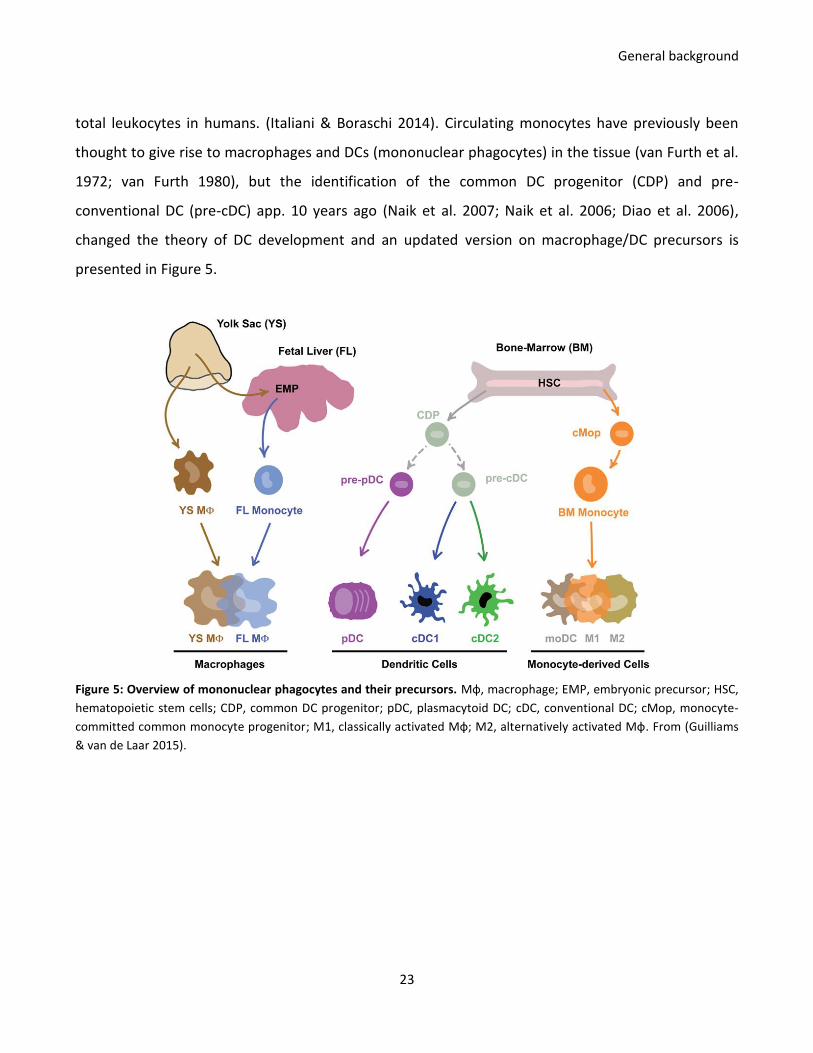
total leukocytes in humans. (Italiani & Boraschi 2014). Circulating monocytes have previously been
thought to give rise to macrophages and DCs (mononuclear phagocytes) in the tissue (van Furth et al.
1972; van Furth 1980), but the identification of the common DC progenitor (CDP) and pre-
conventional DC (pre-cDC) app. 10 years ago (Naik et al. 2007; Naik et al. 2006; Diao et al. 2006),
changed the theory of DC development and an updated version on macrophage/DC precursors is
presented in Figure 5.
Figure 5: Overview of mononuclear phagocytes and their precursors. Mф, macrophage; EMP, embryonic precursor; HSC,
hematopoietic stem cells; CDP, common DC progenitor; pDC, plasmacytoid DC; cDC, conventional DC; cMop, monocyte-
committed common monocyte progenitor; M1, classically activated Mф; M2, alternatively activated Mф. From (Guilliams
& van de Laar 2015).
24
Chapter 2 - General methods
In this chapter, methods used during the PhD studies are presented and the protocols described.
However, some protocols are described in detail in paper I and II and are therefore not explained in
detail in this section.
2.1 Animals
Blood from calves, pigs and goats was used for the experimental studies performed in this thesis.
Bovine blood was used for testing and optimization of IGRA (study I and II). For studying the flow and
capture of cells within the prototype chip, and for direct one-step blood qRT-PCR reaction
optimization (study III), both bovine and goat whole blood was used for practical reasons and since
the origin of the cells made no difference to the experiments. For the generation of moDCs (study IIII),
porcine cells were chosen over ruminant cells since the research within porcine models for human
diseases are expanding and because the DC biology in pigs and humans are similar, making the pig an
obvious choice for this particular experiment. All animals were housed at the Veterinary Institute,
Technical University of Denmark, except for a few calves (used for testing the effect of microtiter-
plates from different suppliers, presented in paper I) housed at a collaborating farm (Freerslev Kotel,
Gørløse, Denmark).
Most of the calves were enrolled in preexisting Paratuberculosis vaccine studies, and thus had
acquired antigen specific immune responses against Mycobacterium avium subsp. paratuberculosis
(MAP). The presence of an acquired immune response within the calves was exploited in this work.
These animals were used to test the effect of culture conditions on specific CMI responses by means
of IFN-γ release when restimulated with MAP antigens in the format of single antigen-peptide or
crude extract. Polyclonal activation by superantigen stimulation was used with control animals, or
animals with no acquired Paratuberculosis responses.
2.2 PBMC purification
Two protocols were applied for purification of PBMCs during the course of work presented in this
thesis. The first protocol is described in paper I and II and included a 1:2 dilution of fresh stabilized
General methods
25
whole blood with phosphate buffered saline (PBS) as a first step. The diluted whole blood was then
laid on Ficoll-Paque™ Plus (GE Healthcare) with room temperature (RT) in a 2:1 ratio (i.e. 8ml
blood/PBS:4ml Ficoll-Paque™ Plus) followed by centrifugation at 2500 rpm (≈1400 x g) for 15 min at
RT with low brake. In the second protocol, fresh stabilized whole blood was centrifuged at 2800 rpm
(≈1700 x g) for 5 min at RT with low brake. Approximately 2ml of the cloudy middle layer (buffy coat)
was harvested and laid on Ficoll-Paque™ Plus (1:2) and centrifuged as described for the first protocol.
In both protocols, PBMCs were recovered using Pasteur pipettes and washed twice in RPMI 1640
medium with GlutaMAX™ (Gibco, Life Technologies™) containing 1% heat inactivated fetal calf serum
(FCS) (Sigma). Cells were counted manually on a Olympus CH-2 microscope (Olympus Optical Co., Ltd.)
using an Improved Neubauer, bright-line hemocytometer chamber (Assistent®) or using an
automated cell counter (Nucleocounter® NC-200™, ChemoMetec), and diluted at appropriate
concentrations in medium containing 10% FCS. The second protocol (with buffy coat isolation) was
used for purifying PBMCs from young animals, since the PBMC fragment in these animals occasionally
were difficult to separate from the bottom red blood cell layer.
2.3 Cell culture
For testing the effect of culture conditions on specific responses, whole blood or PBMCs from
vaccinated or experimentally infected animals were used. For this purpose, cells were restimulated
with either a MAP latency peptide antigen called MAP9436c (herein referred to as MAP antigen) or
Johnin purified protein derivative (PPDj) which is a crude extract of undefined MAP antigens, often
used for restimulation in IGRAs (Jungersen et al. 2002; Jungersen et al. 2012). SEB stimulation was
used for the generation of CMI responses when no animals with specific MAP immune responses
were available, or for comparison of specific vs. polyclonal activation. Concentrations of antigens used
for stimulations (unless otherwise stated) was 1µg/ml MAP antigen, as well as 10µg/ml PPDj and 1
µg/ml SEB, concentrations that have previously been found to induce optimal responses (Jungersen et
al. 2002). Individual culture times, plate formats- and cell concentrations used for the different
culture setups, is described in the results sections of chapter 3-6. All 48 well-plates was from Cellstar®,
Greiner Bio-One, and 96 well-plates were from Costar, Corning.
General methods
26
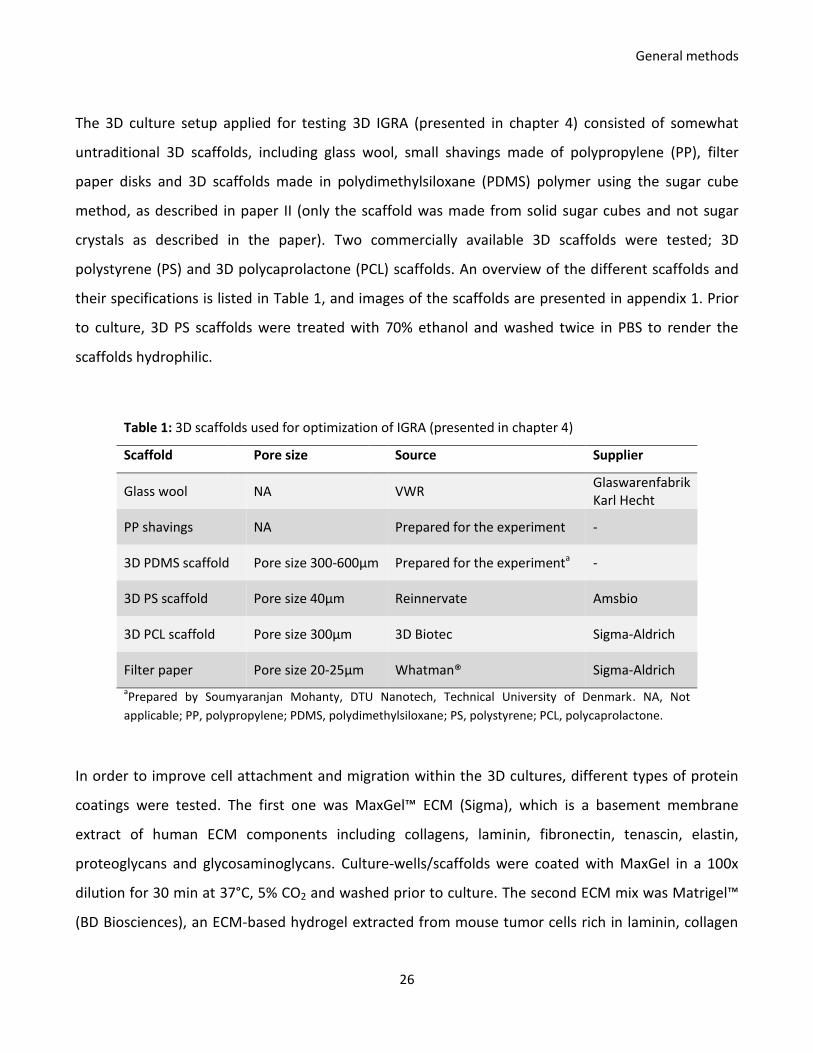
The 3D culture setup applied for testing 3D IGRA (presented in chapter 4) consisted of somewhat
untraditional 3D scaffolds, including glass wool, small shavings made of polypropylene (PP), filter
paper disks and 3D scaffolds made in polydimethylsiloxane (PDMS) polymer using the sugar cube
method, as described in paper II (only the scaffold was made from solid sugar cubes and not sugar
crystals as described in the paper). Two commercially available 3D scaffolds were tested; 3D
polystyrene (PS) and 3D polycaprolactone (PCL) scaffolds. An overview of the different scaffolds and
their specifications is listed in Table 1, and images of the scaffolds are presented in appendix 1. Prior
to culture, 3D PS scaffolds were treated with 70% ethanol and washed twice in PBS to render the
scaffolds hydrophilic.
Table 1: 3D scaffolds used for optimization of IGRA (presented in chapter 4)
Scaffold Pore size Source Supplier
Glass wool NA VWR Glaswarenfabrik Karl Hecht
PP shavings NA Prepared for the experiment -
3D PDMS scaffold Pore size 300-600µm Prepared for the experimenta -
3D PS scaffold Pore size 40µm Reinnervate Amsbio
3D PCL scaffold Pore size 300µm 3D Biotec Sigma-Aldrich
Filter paper Pore size 20-25µm Whatman® Sigma-Aldrich
aPrepared by Soumyaranjan Mohanty, DTU Nanotech, Technical University of Denmark. NA, Not
applicable; PP, polypropylene; PDMS, polydimethylsiloxane; PS, polystyrene; PCL, polycaprolactone.
In order to improve cell attachment and migration within the 3D cultures, different types of protein
coatings were tested. The first one was MaxGel™ ECM (Sigma), which is a basement membrane
extract of human ECM components including collagens, laminin, fibronectin, tenascin, elastin,
proteoglycans and glycosaminoglycans. Culture-wells/scaffolds were coated with MaxGel in a 100x
dilution for 30 min at 37°C, 5% CO2 and washed prior to culture. The second ECM mix was Matrigel™
(BD Biosciences), an ECM-based hydrogel extracted from mouse tumor cells rich in laminin, collagen
General methods
27
IV, heparin sulfate proteoglycans, entactin/nidogen including several growth factors. Culture
wells/scaffolds were coated with Matrigel in a 2-20x dilution and incubated for app. 1 hour at room
temperature (RT) and washed prior to culture. The last protein coating that was tested was
recombinant human CCL21 (BioLegend®), a chemokine that is highly expressed in lymph nodes.
Culture wells were coated with CCL21 at 0.01µg/well (Figure 13) or 0.02µg/well (Figure 14) and air
dried prior to cell culture.
2.4 Flow cytometry
Flow cytometry was used to identify the ratio of cell subpopulations present before and after PBMC
purifications (Chapter 3, paper I) and to characterize monocytes before and after culture with
differentiating cytokines (Chapter 6, paper II). This was done by staining cells for surface markers
using specific antibodies either directly conjugated to a fluorochrome or by the addition of
fluorochrome-conjugated secondary antibodies. Different fluorochromes emit light when hit by lasers
of particular wavelengths. Stained cells in suspension are led through different lasers one by one and
when hit by the laser light, one detector measures the forward scatter (FSC) which is a measure of cell
size, and another detector measures the side scatter (SSC) which is the granularity of the cells. Thus,
data generated for each cell includes: cell size, granularity and fluorescent labelling. A detailed
description on staining protocols is presented in paper I and II. All flow cytometry analysis were
performed on a BD FACSCanto™II flow cytometer (BD Biosciences) and the results were analyzed
using the BD FACSDiva software version 8.0.1.
2.5 IFN-γ specific ELISA
An in house-developed IFN-γ specific sandwich enzyme-linked immunosorbent assay (sandwich-ELISA)
was used to detect and quantify IFN-γ levels in supernatant/plasma harvested from PBMC or whole
blood cultures. The protocol is described in detail in paper I and it was slightly modified from the
protocol described in (Mikkelsen et al. 2009). In this assay, a monoclonal capture antibody specific
against the IFN-γ F(ab)2 fragment was coated in the wells of a micro-well plate. The
supernatant/plasma containing IFN-γ to be measured was added and as a following step, a
biotinylated anti-IFN-γ monoclonal antibody was added. Finally, enzyme-linked streptavidin was
General methods
28
added and the enzyme was converted to a detectable signal by addition of substrate. Quantity of IFN-
γ was measured as optical density (OD) and was calculated using linear regression on log transformed
OD values from dilution series of a reference SEB-stimulated plasma standard with known IFN-γ
concentrations included on each plate. All samples/standards were added in duplicate, including a
blank control.
2.6 Total RNA purification
The RNeasy Mini Kit (Qiagen) was used to purify total RNA from cultured moDCs (chapter 6, study IIII)
and purification was performed according to manufacturer’s instructions. Briefly, cell lysates were
homogenized using a QIAshredder spin column and ethanol was added to bind total RNA to the
RNeasy spin column. After a DNase treatment and a following washing step, total RNA could be eluted
and stored for cDNA synthesis.
The QIAamp RNA Blood Mini Kit (Qiagen) was used to purify total RNA from 3D-cultured whole blood
and PBMCs (chapter 4, study II) and purification was performed according to manufacturer’s
instructions. Briefly, the steps included lysing of erythrocytes followed by homogenization of cell
lysates using the QIAshredder spin column. Ethanol was then added to bind total RNA to the QIAamp
membrane and after three washes, total RNA could be eluted and stored for cDNA synthesis.
2.7 cDNA synthesis
QuantiTect® reverse Transcription Kit (Qiagen) was used to reverse transcribe 180-200ng total RNA
according to the manufacturer’s instructions. Briefly, 2µl gDNA Wipeout Buffer(7X) and various
volumes of total RNA and RNase-free water to a total volume of 14ml was mixed in a tube and
incubated in a Thermocycler (Qiagen) for 2 min at 42°C. A Mastermix was prepared containing 1µl
Reverse Transcriptase (RT), 1µl RT Primer mix and 4µl RT Buffer, and the mix was added to the tube
with RNA. Tubes were then incubated in the Thermocycler for 15 min at 42°C allowing the reverse
transcription to take place, followed by 3 min at 95°C in order to inactivate the reverse transcriptase.
cDNA was stored until qRT-PCR analysis.
General methods
29
2.8 qRT-PCR
Two platforms for detection of specific cDNA were used for the studies performed during the PhD. For
detection of IFNG (IFN-γ) and CXCL10 (IP10) in 3D cultures (chapter 4, study II) and for testing the
direct one-step blood qRT-PCR reaction (chapter 5, study III), the Rotor-Gene Q (Qiagen) qPCR
platform (Corbett research) with Rotor-Gene 4.4.1 software was applied. This platform is convenient
when testing the expression of a few genes. Testing the gene expression in moDCs (chapter 6 study
IIII) was done in a 96.96 Dynamic Array Integrated Fluidic Circuits (IFC) (Fluidigm) chip, placed in a
BioMark real time PCR instrument (Fluidigm) and analysis was done using the Fluidigm Real Time PCR
Analysis software 3.0.2 (Fluidigm). This high-throughput BioMark platform is ideal when analyzing
multiple genes and samples simultaneously. The protocol used for the BioMark platform, is described
in detail in paper II.
For the analysis of IFNG and CXCL10 gene expression in cells from 3D cultures using the Rotor-
Gene Q qPCR platform, 24µl reaction mix consisting of 12.5µl 2XMastermix (SYBR Green Jumpstart
Taq Readymix without MgCL2, Sigma), 3µl primer mix (5µM of each primer), 3µl MgCl2 and 5.5µl MiliQ
water was added in each PCR tube. Then 1µl of cDNA, pre-diluted 10x in miliQ water was added. A
non-template control (NTC) was included for each primer pair to test for non-specific amplification.
Tubes were placed in the Rotor-Gene Q instrument and the following cycle conditions were applied: 2
min at 50°C and 10 min at 95°C followed by 40 cycles with denaturation for 15 sec at 95° and
annealing/elongation for 1 min at 60°C. Melting curves were generated after each run to confirm a
single PCR product (from 50°C to 95°C, increasing 1°C/5 sec).
For testing the direct one-step blood qRT-PCR SYBR Green Kit (VitaNavi Technology), stabilized
whole blood from bovine or goat was directly added to the reaction mix containing 16µl Blood qRT-
PCR mix, 0.75µl Blood qRT-PCR polymerase mix, 0.5µl SYBR Green, 2.5µl primer mix (5µM of each
primer) and MiliQ to a final volume of 25µl. Blood concentrations of 2-10% was tested. A non-
template control (NTC) was included for each primer pair to test for non-specific amplification. For
the detection of IFNG and CXCL10, blood was pre-incubated with 1µg/ml SEB for two hours prior to
qRT-PCR analysis. Tubes were placed in the Rotor-Gene Q instrument and the following cycle
General methods
30
conditions were applied: 58°C for 30 min (reverse transcriptase step), 95°C for 5 min (initial
denaturation step), followed by 45 cycles of 94°C for 45 sec (denaturation step) and 63°C (or 60°C) for
90 sec (annealing/extension). A final melting curve analysis was performed to verify a single product,
with the temperature rising from 50°C to 99°C, increasing 1°C/5 sec. See appendix 2 for a list of
primers used for experiments analyzed on the Rotor-Gene Q qPCR platform.
2.9 Confocal microscopy
For visualization of cells within 3D PS scaffolds or in the prototype chip, bovine PBMCs were purified
as described in section 2.2, and cells were stained with Alexa Flour 647 (AF647)-conjugated anti-
bovine CD4 monoclonal IgG2a antibody (clone CC8, AbD Serotec) and AF488-conjugated anti-human
CD14 IgG2a antibody (cross-reactive to bovine) (clone M5E2, BioLegend®). 1x10⁶ cells in 100 µl were
stained with a cocktail of both antibodies in a 40x dilution, washed and resuspended in RPMI medium.
3D PS scaffolds (Alvetex®) were made hydrophilic by addition of 70% ethanol and washed in PBS prior
to cell plating/imaging. Scaffolds and cells were imaged on a Zeiss LSM 710 confocal microscope using
ZEN 2009 software. The microscope was inverted and equipped with an incubator for temperature
control and imaging was performed at 37°C. Prior to plating on the scaffold, cells were mixed with SEB
to a final concentration of 1µg/ml. Scaffolds, or scaffolds with SEB-stimulated cells, were placed
between two glass microscope slides and imaged. Z-stacks were recorded with (in average) 25 stacks
with 10 slices in each, and with app. 20 seconds in between stacks. Maximum projection images were
created to show the structure of the autofluorescent scaffold. Movies intending to show cell
migration in 2D and 3D surfaces was created using ImageJ/Fiji software.
2.10 Light microscopy
To visualize cell capture on the prototype chip during flow, PBMCs were purified from goat whole
blood, and heated to 37°C in an incubator. Using a sp260p syringe pump (WPI, Florida, USA) with a
20ml Luer syringe (Omnifix), elbow Luer connector and silicone tubing (Ibidi GmbH, Germany), cell
flow and capture was imaged on an inverted Leica DMIL contrasting microscope equipped with a Leica
DFC290 camera (Leica Microsystems).
31
Chapter 3 - Study I (IGRA)
3.1 Introduction
In vitro cultures of freshly isolated primary cells are being used for cytokine release assays. IGRA is an
assay testing the presence of a TH1-mediated CMI-response by detection of de novo produced IFN-γ
by the cultured cells upon antigen recall. In veterinary medicine, IGRA was first used to diagnose
infections of bovine tuberculosis and paratuberculosis (Wood et al. 1990; Rothel et al. 1992; Billman-
Jacobe et al. 1992). For this type of assay, either whole blood or purified PBMCs are typically used.
Cultures of PBMCs consist of a mix of lymphocytes (T lymphocytes, B lymphocytes and NK cells),
monocytes and dendritic cells, kept in synthetic media typically with a supplement of bovine serum
containing growth factors necessary for cell survival. Apart from the mentioned cell types, whole
blood also contains erythrocytes, platelets, and granulocytes (neutrophils, basophils and eosinophils).
Several cell types produce IFN-γ, including CD4+ T cells, CD8+ T cells, γδ T cells and NK cells. However,
upon antigen recall the major secretion of IFN-γ is believed to come from TH1 CD4+ T cells.
3.2 Hypothesis
Due to the presence of natural occurring activating and suppressive mediators such as cytokines,
hormones and growth factors in vivo, it is hypothesized that the activation profile of cells activated in
settings close to their natural environment (i.e. whole blood) will differ from the activation profile of
cells purified and kept in synthetic media with serum supplement (i.e. PBMCs).
32
3.3 Results
Paper I
Revisiting the IFN-γ release assay: Whole blood or PBMC cultures?
- And other factors of influence
Sofie Bruun Hartmanna, Jenny Emnéusb, Anders Wolffb and Gregers Jungersena#
aNational Veterinary Institute, Technical University of Denmark, Frederiksberg C, Denmark
bDepartment of Micro- and Nanotechnology, Technical University of Denmark, Kgs. Lyngby, Denmark
#Corresponding author
Manuscript ready for submission
In this study we investigate factors of influence for the validity of interferon-gamma release assays
performed with whole blood or peripheral blood mononuclear cells (PBMC) cultures. We find large
differences in the optimal diagnostic conditions with each individual animal and that PBMC cultures
are amenable to differences in cellular composition compared to whole blood. Finally, we were able
to show effect of culture plates from different suppliers, although this effect was not statistically
significant. We believe these studies highlight the need to include detailed descriptions of procedures
and warrant that different conditions infer different results in the same animal.
Paper I
33
Abstract
The interferon-gamma release assay is a widely used test for the presence of a cell-mediated immune
response in vitro. Factors potentially influencing the results when performing interferon-gamma
release assays in cultures of bovine whole blood and PBMCs, were investigated. It was found that
optimal culture conditions varied between individual animals; when polyclonal activated, cells from
whole blood cultures were most responsive, but when activated specifically half of the animals had
highest responses in whole blood cultures and half of them had highest responses in PBMC cultures. A
further investigation of the distribution of cell populations in PBMCs compared to whole blood was
conducted, and a significant (p<0.001) decrease in the percentage of CD3+ T cells within the PBMCs
was found. More specifically, this reduction was due to a significant (p<0.01) decrease in the
percentage of γδ+ T cells. Thus measuring immune responses on purified PBMCs might not give a
physiologically relevant output. Additionally, it was tested if the choice of incubation plate would
interfere with the level of secreted interferon-gamma in whole blood cultures. There was no
significant difference in the interferon-gamma levels from the six incubation plates tested, but it was
observed that six of eight calves had optimal interferon-gamma production in a flat bottom
polystyrene plate from Corning®. Altogether these findings highlight the potential weaknesses of the
interferon-gamma release assay in terms of the many variables that can influence the results, and
stresses the importance of documenting the precise assay conditions when publishing results of in
vitro interferon-gamma release assays.
1. Introduction
Cytokines are small signaling proteins produced by various cell types including cells of the immune
system. Since specific cytokines are associated with different types of cell-mediated immune (CMI)
responses, they can be used to characterize such responses. For example IFN-γ, IL-2, -12, -18, TNF-α,
GM-CSF, are all associated with a T helper (TH) 1 response, IL-4, -5, -6, -10, -13, and TGF-β with a TH2
response, IL-17, -21, -22 with TH17, and IL-10 and TGF-β with a T regulatory (Treg) response (1).
Paper I
34
Cytokines usually act in a paracrine or autocrine manner, thus being produced and taken up at local
sites where immune reactions take place. Therefore, most cytokine levels are too low for direct
detection in peripheral blood. Instead CMI can be analyzed in vitro by measuring the function of T
cells in terms of their ability to proliferate and to produce cytokines in response to antigen. The IFN-γ
release assay (IGRA) is based on the detection of de novo produced IFN-γ by cultured immune cells
including TH1 cells. This is used to measure the efficacy of a vaccine or as a diagnostic measure to test
if a subject is suffering from a specific intracellular pathogen, for example Mycobacterium bovis or M.
avian subsp. paratuberculosis (MAP) in cattle or Mycobacterium tuberculosis in humans. In the latter
case two FDA approved IGRAs exists (QuantiFERON-TB Gold in-Tube, Cellestis, Austria and T-Spot.TB,
Oxford Immunotec, UK). IGRAs (and cytokine release assays in general) can be performed using
cultures of whole blood or purified peripheral blood mononuclear cells (PBMCs). In the present study,
an investigation and discussion of the different factors potentially influencing the results when testing
CMI in vitro by means of IFN-γ secretion in cultures of whole blood or PBMCs is presented.
2. Materials and methods
2.1. Animals
For the purpose of this study, blood was drawn using heparinized vacutainer tubes from sixteen
Danish Jersey calves (#1-16) aged 16-22 weeks. The calves were enrolled in three preexisting
Paratuberculosis vaccine programs, and thus had obtained different levels of antigen-specific
immunity against a MAP peptide-antigen. The different vaccination regimes used were irrelevant for
the present study since immunological responses were merely used to test if assay conditions/cell
concentrations had an influence on the specific responses within each individual animal. The calves
were housed at the animal facility at the Veterinary Institute, Technical University of Denmark, or at a
collaborating farm and were, apart from the vaccinations, handled the same way. Not all calves were
used for all experiments and the numbering of the calves used for the individual experiments appears
on the figures/tables. All animals were handled in accordance with the Danish animal experiments
Paper I
35
legislation and registered in studies approved by the Danish Animal Experiments Inspectorate, license
number 2012-15-2934-00269.
2.2. Isolation of PBMCs
Fresh, heparinized whole blood was diluted 1:2 with PBS, laid on Ficoll-Paque™Plus (GE Healthcare)
and centrifuged 2500 rpm (≈1400 x g) for 15 min at room temperature (RT) with low brake. PBMCs
were recovered and washed twice in RPMI 1640 medium with GlutaMAX™ (Gibco, Life
Technologies™) containing 1% heat inactivated fetal bovine serum (FCS) (Sigma). Cells were counted
using Improved Neubauer, bright-line hemocytometer chamber (Assistent®) and diluted at different
concentrations in medium containing 10% FCS.
2.3. Stimulation and incubation of whole blood and PBMCs for comparison of IFN-γ-release
Fresh stabilized whole blood was drawn from eight vaccinated calves (#1-8) aged 16-22 weeks.
Samples were split in two; one half was used for PBMC purification (see above), the other half was
used for whole blood cultures. Non-diluted whole blood and whole blood diluted 1:2 with PBS was
plated in triplicates of 500µl in 48-well plates (Cellstar®, Greiner Bio-One). Prior to cell-plating, 50µl of
either PBS, the superantigen Staphylococcal enterotoxin B (SEB) (Sigma), or vaccine MAP antigen
(Statens Serum Institute) plus co-stimulatory antibodies anti-CD28 and anti-CD49d (clone TE1A and
FW3-218, respectively, Monoclonal Antibody Center, Washington State University) (2), all at a final
concentration of 1µg/ml, was added to the wells. Cultures were incubated for 20 hours at 37°C, 5%
CO2. PBMCs were purified from the other half using density gradient centrifugation, and cells were
diluted in media with 10% FCS to obtain final concentrations of 10, 5, 2.5, 1.25 and 0.625x10⁶ cells/ml.
PBMCs were stimulated and incubated the same way as whole blood samples. Plates were
centrifuged and approximately 350µl supernatant/plasma was harvested and stored at -20°C until
further analysis. The quantity of IFN-γ in the plasma and supernatant was measured by ELISA
Paper I
36
2.4. Stimulation and incubation of whole blood for testing the effect of micro-well plates
Fresh, heparinized whole blood from eight calves (#9-16) aged 18-22 weeks, was plated in double
triplicates of 200µl in the following six different 96-well plates: a) Nunc™, clear, flat-bottom,
Nunclon™ Delta surface, polystyrene, cat# 167008; b) Corning®, clear, flat-bottom, tissue culture
treated, polystyrene, cat# 3596; c) BD Falcon® Optilux, black, clear flat-bottom, tissue culture surface,
polystyrene, cat# 353948; d) Corning®, clear, flat-bottom, tissue culture treated, polystyrene, low
evaporation lid, cat# 3595; e) Corning®, clear, round-bottom, tissue culture treated, polystyrene, cat#
3799 and f) Cellstar® Greiner bio-one, clear, round bottom, tissue culture treated, polystyrene, cat#
650108. Prior to cell-plating, 20µl of PBS, SEB or vaccine MAP antigen (both at a final concentration of
1µg/ml) was added to the wells. Cultures were incubated for 20 hours at 37°C, 5% CO2. Plates were
centrifuged following the addition of 55µl heparin solution (at a final concentration of 10 IU/ml) to
avoid clotting when freezing. Approximately 140µl plasma was harvested from each well and double
triplicates were pooled resulting in 280µl plasma in triplicates from each calf and stimulus. Plasma
was stored at -20°C until further analysis.
2.5. Measurement of IFN-γ production by ELISA
The IFN-γ-secretion in plasma and supernatant was determined using an in-house developed
monoclonal sandwich ELISA, as described elsewhere (3), with a few modifications. Briefly, MaxiSorp™
microtiter plates (Nunc) were coated overnight with 100µl anti-bovine IFN-γ F(ab)2 monoclonal
antibody (clone 6.19) (National Veterinary Institute, Technical University of Denmark) at 0.49µg/ml.
After a one-hour blocking with 200 µl blocking buffer (PBS, 0.05% Tween 20, 0.1% Casein) followed by
5 washes with washing buffer (PBS, 0.05% Tween 20), 50µl blocking buffer and 50µl thawed
supernatant/plasma was added to the wells in duplicate. A two/three-fold standard dilution series
prepared from calf plasma stimulated with 0.2µg/ml SEB and with previously determined
concentrations of IFN-γ was also added in duplicate to each plate in order to generate a standard
curve used for quantification of IFN-γ levels after log-log transformation. The plates were incubated
for 1 hour at room temperature with gentle agitation followed by 5 washes. 100µl biotinylated
secondary anti-bovine IFN-γ monoclonal antibody (clone 6.22) (National Veterinary Institute,
Paper I
37
Technical University of Denmark) was added in final concentrations of 0.95µg/ml and 0.087µg/ml
(different batches for the ELISA used in the experiment comparing PBMC and whole blood cultures
(figure 1) and for the experiment testing different microwell plates (figure 3)) and incubated for 1
hour at room temperature with gentle agitation followed by 5 washes. Next, 100µl streptavidin-
horseradish peroxidase conjugate (Invitrogen) was added at a final concentration of 0.125µg/ml and
incubated for 1 hour at room temperature with gentle agitation followed by 5 washes. Finally, 100µl
TMB-Plus ready-to-use substrate (Kem-En-Tec Diagnostics) was added and the plates were incubated
at room temperature in the dark for app. 10-20 minutes. The enzyme reaction was stopped by adding
100µl 0.5 M H2SO4 and the optical density (OD) measured at 450 nm with 650 nm as a reference using
a Multiscan® EX reader (Thermo Scientific). The level of IFN-γ (pg/ml) was calculated by inserting the
log-transformed OD values in the equation obtained from linear regression of the log-transformed OD
values from the dilution series of a reference SEB stimulated plasma standard with known IFN-γ
concentrations.
2.6. Flow cytometry
For determination of the cell distribution before and after PBMC purification, cells were stained and
analyzed by flow cytometry. Tubes containing 100µl whole blood or PBMC (1x10⁷cells/ml) were
incubated with 20µl primary antibodies in the four cocktails as summarized in Table 1 for 30 minutes
in the dark at 5°C. One ml 1X BD FACS lysis solution was added to the whole blood tubes which were
incubated for ten minutes at room temperature in order to lyse the red blood cells. All cells were
washed in wash buffer (PBS, 0.1% sodium azide, 1% FCS) and incubated with a 20µl secondary
antibody cocktail (see Table 1) for 30 minutes in the dark at 5°C. Cells were washed twice in wash
buffer and resuspended in FACS sheath fluid containing 0.5% paraformaldehyde. For compensation
adjustments, pooled lysed whole blood cells were stained with primary staining cocktail 1 plus either
anti-mouse IgG1-PE or anti-mouse IgG2a-AF647 (Table 1). Cells were acquired on a BD FACSCanto™II
flow cytometer (BD Biosciences) with a lymphocyte gate based on FSC SSC profile and the results
were analyzed using the BD FACSDiva software version 8.0.1.
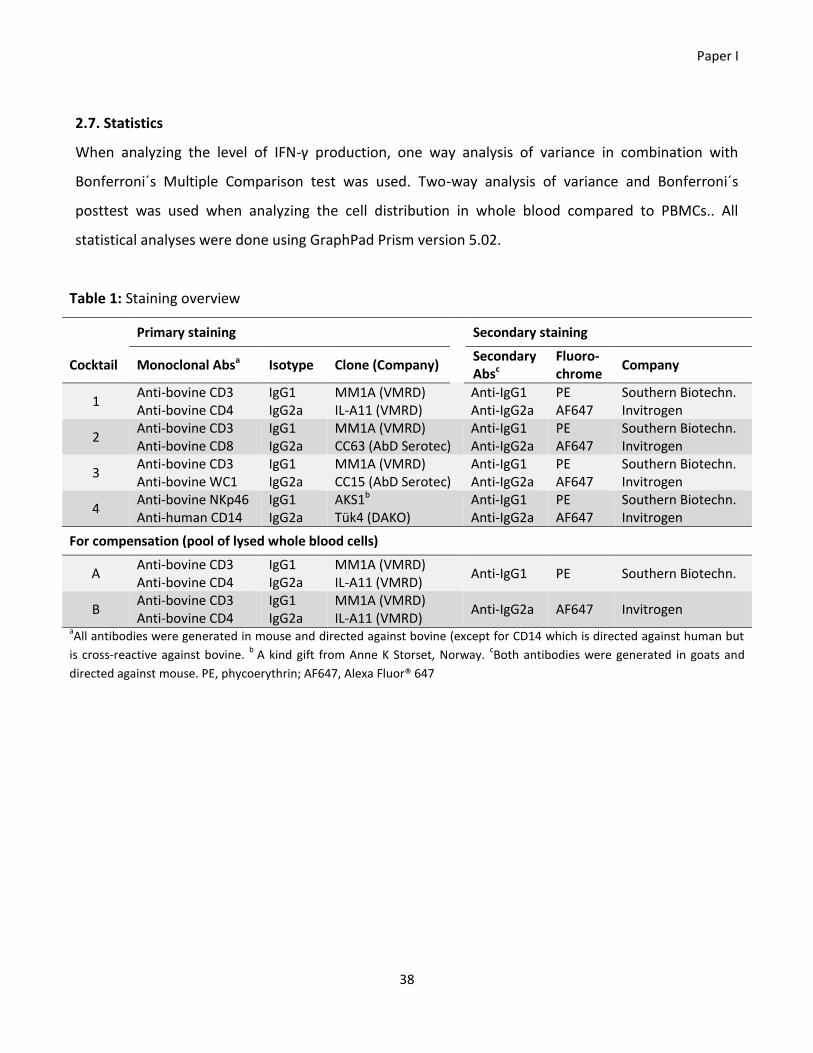
Paper I
38
2.7. Statistics
When analyzing the level of IFN-γ production, one way analysis of variance in combination with
Bonferroni´s Multiple Comparison test was used. Two-way analysis of variance and Bonferroni´s
posttest was used when analyzing the cell distribution in whole blood compared to PBMCs.. All
statistical analyses were done using GraphPad Prism version 5.02.
Table 1: Staining overview
Primary staining Secondary staining
Cocktail Monoclonal Absa Isotype Clone (Company) Secondary Absc
Fluoro-chrome
Company
1 Anti-bovine CD3 Anti-bovine CD4
IgG1 IgG2a
MM1A (VMRD) IL-A11 (VMRD)
Anti-IgG1 Anti-IgG2a
PE AF647
Southern Biotechn. Invitrogen
2 Anti-bovine CD3 Anti-bovine CD8
IgG1 IgG2a
MM1A (VMRD) CC63 (AbD Serotec)
Anti-IgG1 Anti-IgG2a
PE AF647
Southern Biotechn. Invitrogen
3 Anti-bovine CD3 Anti-bovine WC1
IgG1 IgG2a
MM1A (VMRD) CC15 (AbD Serotec)
Anti-IgG1 Anti-IgG2a
PE AF647
Southern Biotechn. Invitrogen
4 Anti-bovine NKp46 Anti-human CD14
IgG1 IgG2a
AKS1b Tük4 (DAKO)
Anti-IgG1 Anti-IgG2a
PE AF647
Southern Biotechn. Invitrogen
For compensation (pool of lysed whole blood cells)
A Anti-bovine CD3 Anti-bovine CD4
IgG1 IgG2a
MM1A (VMRD) IL-A11 (VMRD)
Anti-IgG1 PE Southern Biotechn.
B Anti-bovine CD3 Anti-bovine CD4
IgG1 IgG2a
MM1A (VMRD) IL-A11 (VMRD)
Anti-IgG2a AF647 Invitrogen
aAll antibodies were generated in mouse and directed against bovine (except for CD14 which is directed against human but
is cross-reactive against bovine. b
A kind gift from Anne K Storset, Norway. cBoth antibodies were generated in goats and
directed against mouse. PE, phycoerythrin; AF647, Alexa Fluor® 647
Paper I
39
3. Results
3.1. Culture conditions for optimal IFN-γ production varies from individual to individual
Using ELISA, quantity of IFN-γ was measured from overnight cultures of whole blood, diluted whole
blood or PBMCs at various cell concentrations (i.e. 10, 5, 2.5, 1.25, and 0.623x10⁶ cells/ml) from eight
calves (#1-8). Cells were incubated with MAP antigen+ co-stimulation, SEB or PBS (background).. In
the MAP antigen-stimulated samples (Ag-specific activation) four of eight tested calves had highest
IFN-γ production in non-diluted whole blood (calf # 2, 4, 5 and 7), two in PBMC cultures with 10x106
cells/ml (calf # 1 and 6) and finally two calves had highest production in PBMC cultures with 5x10⁶
cells/ml (calf # 3 and 8) (figure 1 A). Some of the calves had very low IFN-γ levels in all incubation
settings but they did show high levels when stimulated with SEB (polyclonal non-specific activation).
In this case, six of eight calves had highest IFN-γ levels in non-diluted whole blood (calf # 1, 2, 3, 4, 5
and 7), one in the diluted whole blood culture (calf # 6), and one had highest level in PBMC cultures
with 10x106 cells/ml (calf # 8) (figure 1 B). In general, the background concentration of IFN-γ was low
but there was a tendency of higher levels in whole blood cultures compared to PBMC cultures (figure
1 C).
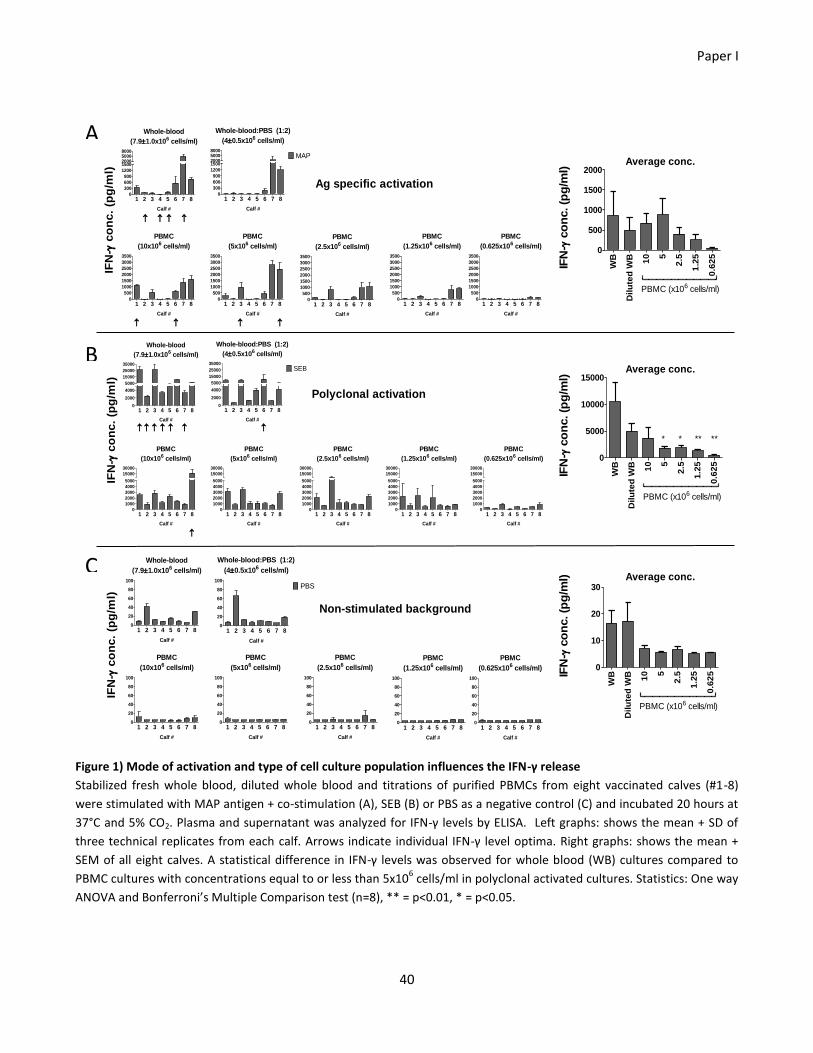
Paper I
40
Figure 1) Mode of activation and type of cell culture population influences the IFN-γ release
Stabilized fresh whole blood, diluted whole blood and titrations of purified PBMCs from eight vaccinated calves (#1-8)
were stimulated with MAP antigen + co-stimulation (A), SEB (B) or PBS as a negative control (C) and incubated 20 hours at
37°C and 5% CO2. Plasma and supernatant was analyzed for IFN-γ levels by ELISA. Left graphs: shows the mean + SD of
three technical replicates from each calf. Arrows indicate individual IFN-γ level optima. Right graphs: shows the mean +
SEM of all eight calves. A statistical difference in IFN-γ levels was observed for whole blood (WB) cultures compared to
PBMC cultures with concentrations equal to or less than 5x10⁶ cells/ml in polyclonal activated cultures. Statistics: One way
ANOVA and Bonferroni’s Multiple Comparison test (n=8), ** = p<0.01, * = p<0.05.
Whole-blood
(7.91.0x106 cells/ml)
1 2 3 4 5 6 7 80
20
40
60
80
100
Calf #
Whole-blood:PBS (1:2)
(40.5x10⁶ cells/ml)
1 2 3 4 5 6 7 80
20
40
60
80
100
PBS
Calf #
PBMC
(10x106 cells/ml)
1 2 3 4 5 6 7 80
20
40
60
80
100
Calf #
PBMC
(5x10⁶ cells/ml)
1 2 3 4 5 6 7 80
20
40
60
80
100
Calf #
PBMC
(2.5x10⁶ cells/ml)
1 2 3 4 5 6 7 80
20
40
60
80
100
Calf #
PBMC
(1.25x10⁶ cells/ml)
1 2 3 4 5 6 7 80
20
40
60
80
100
Calf #
PBMC
(0.625x10⁶ cells/ml)
1 2 3 4 5 6 7 80
20
40
60
80
100
Calf #
IFN
- c
on
c.
(pg
/ml)
Non-stimulated background
Whole-blood
(7.91.0x106 cells/ml)
1 2 3 4 5 6 7 80
2000
4000
5000
15000
25000
35000
Calf #
Whole-blood:PBS (1:2)
(40.5x10⁶ cells/ml)
1 2 3 4 5 6 7 80
2000
4000
5000
15000
25000
35000
SEB
Calf #
PBMC
(10x106 cells/ml)
1 2 3 4 5 6 7 80
1000
2000
3000
4000
5000
15000
30000
Calf #
PBMC
(5x10⁶ cells/ml)
1 2 3 4 5 6 7 80
1000
2000
3000
4000
5000
15000
30000
Calf #
PBMC
(2.5x10⁶ cells/ml)
1 2 3 4 5 6 7 80
1000
2000
3000
4000
5000
15000
30000
Calf #
PBMC
(1.25x10⁶ cells/ml)
1 2 3 4 5 6 7 80
1000
2000
3000
4000
5000
15000
30000
Calf #
PBMC
(0.625x10⁶ cells/ml)
1 2 3 4 5 6 7 80
1000
2000
3000
4000
5000
15000
30000
Calf #
IFN
- c
on
c.
(pg
/ml)
Polyclonal activation
A
B
C
WB
Dilu
ted
WB 10 5
2.5
1.2
5
0.6
25
0
500
1000
1500
2000
PBMC (x106 cells/ml)
WB
Dilu
ted
WB 10 5
2.5
1.2
5
0.6
25
0
5000
10000
15000
PBMC (x106 cells/ml)
** ****
WB
Dilu
ted
WB 10 5
2.5
1.2
5
0.6
25
0
10
20
30
PBMC (x106 cells/ml)
IFN
- c
on
c. (p
g/m
l)IF
N-
co
nc. (p
g/m
l)IF
N-
co
nc. (p
g/m
l)
Average conc.
Average conc.
Average conc.
Whole-blood
(7.91.0x106 cells/ml)
1 2 3 4 5 6 7 80
300
600
900
1200
1500200050008000
Calf #
Whole-blood:PBS (1:2)
(40.5x10⁶ cells/ml)
1 2 3 4 5 6 7 80
300
600
900
1200
1500200050008000
MAP
Calf #
PBMC
(10x106 cells/ml)
1 2 3 4 5 6 7 80
500
1000
1500
2000
2500
3000
3500
Calf #
PBMC
(5x10⁶ cells/ml)
1 2 3 4 5 6 7 80
500
1000
1500
2000
2500
3000
3500
Calf #
PBMC
(2.5x10⁶ cells/ml)
1 2 3 4 5 6 7 80
500
1000
1500
2000
2500
3000
3500
Calf #
PBMC
(1.25x10⁶ cells/ml)
1 2 3 4 5 6 7 80
500
1000
1500
2000
2500
3000
3500
Calf #
PBMC
(0.625x10⁶ cells/ml)
1 2 3 4 5 6 7 80
500
1000
1500
2000
2500
3000
3500
Calf #
IFN
- c
on
c.
(pg
/ml)
Ag specific activation
Paper I
41
3.2. Selective cell loss of γδ-T cells during PBMC purification
In order to investigate if isolation of PBMCs by density gradient centrifugation had an influence on cell
distribution, unstimulated whole blood and PBMCs from seven calves (same animals as above, only
samples from one animal (#4) was discarded due to technical errors) were stained for selected surface
markers and analyzed by flow cytometry (figure 2). A significant decrease in the percentage of CD3+ T
cells was observed within the mononuclear leukocyte population from PBMCs compared to whole
blood (from 64.5% to 55.3%). No difference in the distribution of NK cells and monocytes was
detected. Since the cells were gated on the mononuclear leukocytes the granulocytes present in
whole blood samples did not influence the relative levels. Further gating on the CD3+ T cells showed a
significant loss of γδ+ T cells in the PBMCs (from 28.8% to 22.9%) while no significant difference was
seen for the CD4+ - and CD8+ T cells.
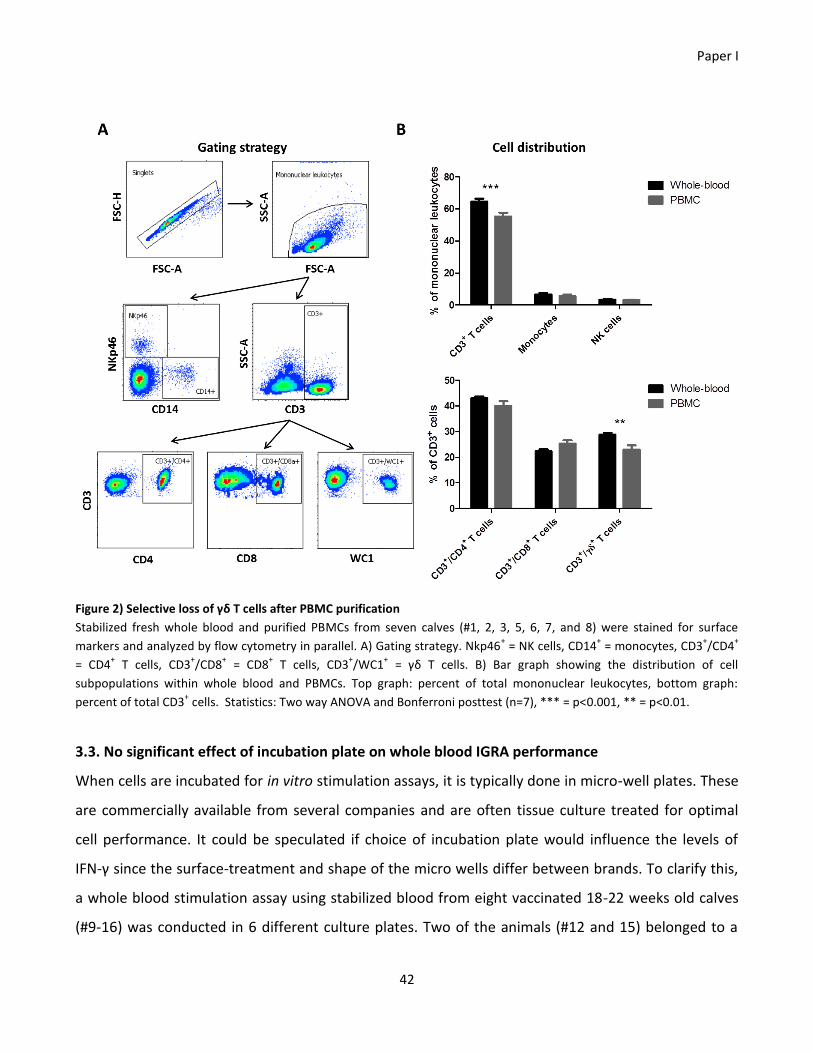
Paper I
42
Figure 2) Selective loss of γδ T cells after PBMC purification
Stabilized fresh whole blood and purified PBMCs from seven calves (#1, 2, 3, 5, 6, 7, and 8) were stained for surface
markers and analyzed by flow cytometry in parallel. A) Gating strategy. Nkp46+ = NK cells, CD14
+ = monocytes, CD3
+/CD4
+
= CD4+ T cells, CD3
+/CD8
+ = CD8
+ T cells, CD3
+/WC1
+ = γδ T cells. B) Bar graph showing the distribution of cell
subpopulations within whole blood and PBMCs. Top graph: percent of total mononuclear leukocytes, bottom graph:
percent of total CD3+ cells. Statistics: Two way ANOVA and Bonferroni posttest (n=7), *** = p<0.001, ** = p<0.01.
3.3. No significant effect of incubation plate on whole blood IGRA performance
When cells are incubated for in vitro stimulation assays, it is typically done in micro-well plates. These
are commercially available from several companies and are often tissue culture treated for optimal
cell performance. It could be speculated if choice of incubation plate would influence the levels of
IFN-γ since the surface-treatment and shape of the micro wells differ between brands. To clarify this,
a whole blood stimulation assay using stabilized blood from eight vaccinated 18-22 weeks old calves
(#9-16) was conducted in 6 different culture plates. Two of the animals (#12 and 15) belonged to a
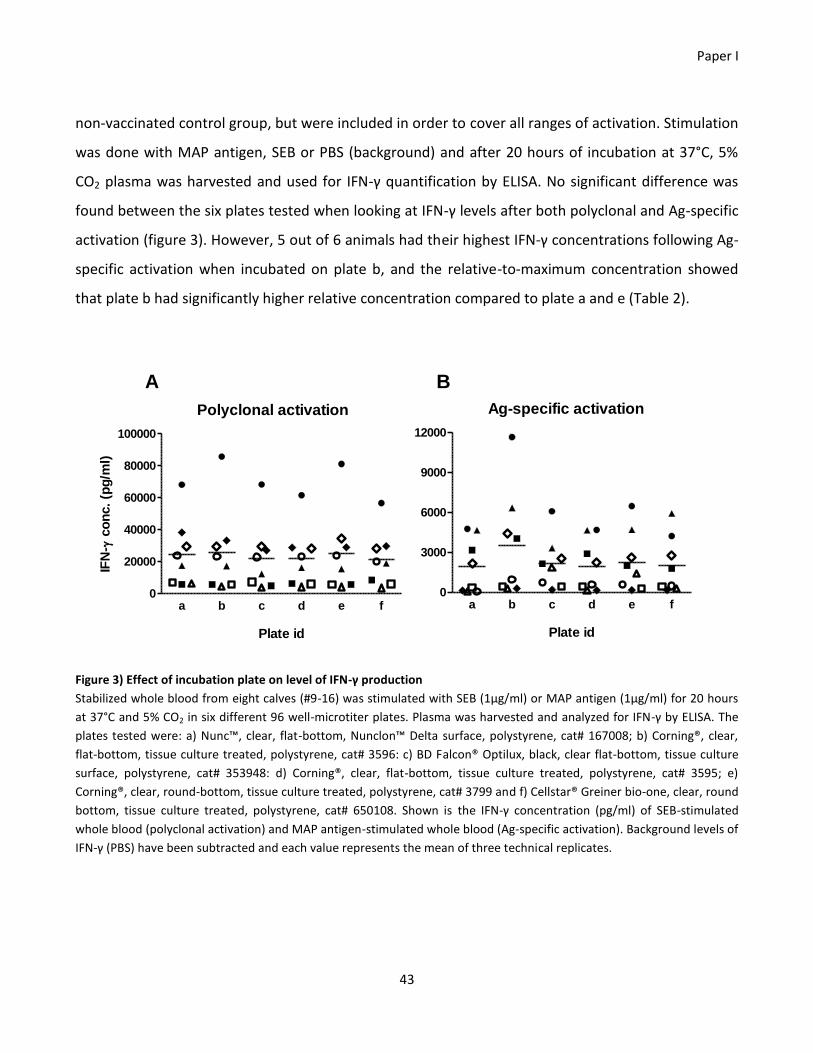
Paper I
43
non-vaccinated control group, but were included in order to cover all ranges of activation. Stimulation
was done with MAP antigen, SEB or PBS (background) and after 20 hours of incubation at 37°C, 5%
CO2 plasma was harvested and used for IFN-γ quantification by ELISA. No significant difference was
found between the six plates tested when looking at IFN-γ levels after both polyclonal and Ag-specific
activation (figure 3). However, 5 out of 6 animals had their highest IFN-γ concentrations following Ag-
specific activation when incubated on plate b, and the relative-to-maximum concentration showed
that plate b had significantly higher relative concentration compared to plate a and e (Table 2).
Polyclonal activation
a b c d e f0
20000
40000
60000
80000
100000
Plate id
IFN
- c
on
c.
(pg
/ml)
Ag-specific activation
a b c d e f0
3000
6000
9000
12000
Plate id
A B
Figure 3) Effect of incubation plate on level of IFN-γ production
Stabilized whole blood from eight calves (#9-16) was stimulated with SEB (1µg/ml) or MAP antigen (1µg/ml) for 20 hours
at 37°C and 5% CO2 in six different 96 well-microtiter plates. Plasma was harvested and analyzed for IFN-γ by ELISA. The
plates tested were: a) Nunc™, clear, flat-bottom, Nunclon™ Delta surface, polystyrene, cat# 167008; b) Corning®, clear,
flat-bottom, tissue culture treated, polystyrene, cat# 3596: c) BD Falcon® Optilux, black, clear flat-bottom, tissue culture
surface, polystyrene, cat# 353948: d) Corning®, clear, flat-bottom, tissue culture treated, polystyrene, cat# 3595; e)
Corning®, clear, round-bottom, tissue culture treated, polystyrene, cat# 3799 and f) Cellstar® Greiner bio-one, clear, round
bottom, tissue culture treated, polystyrene, cat# 650108. Shown is the IFN-γ concentration (pg/ml) of SEB-stimulated
whole blood (polyclonal activation) and MAP antigen-stimulated whole blood (Ag-specific activation). Background levels of
IFN-γ (PBS) have been subtracted and each value represents the mean of three technical replicates.
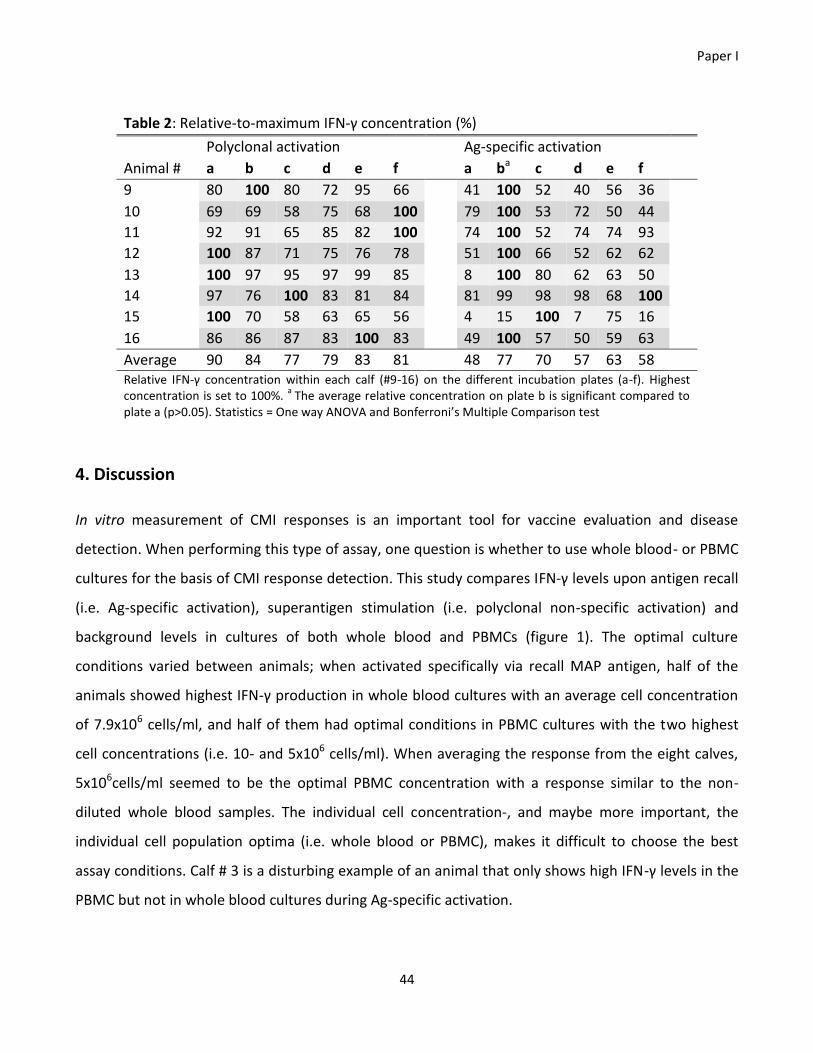
Paper I
44
Table 2: Relative-to-maximum IFN-γ concentration (%)
Polyclonal activation Ag-specific activation
Animal # a b c d e f a ba c d e f
9 80 100 80 72 95 66 41 100 52 40 56 36
10 69 69 58 75 68 100 79 100 53 72 50 44
11 92 91 65 85 82 100 74 100 52 74 74 93
12 100 87 71 75 76 78 51 100 66 52 62 62
13 100 97 95 97 99 85 8 100 80 62 63 50
14 97 76 100 83 81 84 81 99 98 98 68 100
15 100 70 58 63 65 56 4 15 100 7 75 16
16 86 86 87 83 100 83 49 100 57 50 59 63
Average 90 84 77 79 83 81 48 77 70 57 63 58
Relative IFN-γ concentration within each calf (#9-16) on the different incubation plates (a-f). Highest concentration is set to 100%.
a The average relative concentration on plate b is significant compared to
plate a (p>0.05). Statistics = One way ANOVA and Bonferroni’s Multiple Comparison test
4. Discussion
In vitro measurement of CMI responses is an important tool for vaccine evaluation and disease
detection. When performing this type of assay, one question is whether to use whole blood- or PBMC
cultures for the basis of CMI response detection. This study compares IFN-γ levels upon antigen recall
(i.e. Ag-specific activation), superantigen stimulation (i.e. polyclonal non-specific activation) and
background levels in cultures of both whole blood and PBMCs (figure 1). The optimal culture
conditions varied between animals; when activated specifically via recall MAP antigen, half of the
animals showed highest IFN-γ production in whole blood cultures with an average cell concentration
of 7.9x10⁶ cells/ml, and half of them had optimal conditions in PBMC cultures with the two highest
cell concentrations (i.e. 10- and 5x10⁶ cells/ml). When averaging the response from the eight calves,
5x10⁶cells/ml seemed to be the optimal PBMC concentration with a response similar to the non-
diluted whole blood samples. The individual cell concentration-, and maybe more important, the
individual cell population optima (i.e. whole blood or PBMC), makes it difficult to choose the best
assay conditions. Calf # 3 is a disturbing example of an animal that only shows high IFN-γ levels in the
PBMC but not in whole blood cultures during Ag-specific activation.
Paper I
45
In the polyclonal activated cultures, numerous CD4+ T cells are able to become activated since
SEB, as a superantigen, non-specifically cross-binds the variable part of the β-chain (Vβ) of the T cell
receptor and the MHC class II on the antigen presenting cell, resulting in activation and cytokine
release, especially IFN-γ (4, 5). Thus, higher cell concentration theoretically equals higher IFN-γ
release. In the present study the highest response was seen in the whole blood cultures, with the
exception of one calf which had optimum IFN-γ levels in the PBMC 10x106 cells/ml culture. On
average the PBMC did not have an optimal concentration comparable to whole blood samples as was
the case with the Ag-specific activation. Following the polyclonal activation, the whole blood assay
resulted in more than twice the amount of IFN-γ compared to the optimal PBMC assay (with 10x106
cells/ml). This indicates that factors other than the total cell number influence the IFN-γ production.
This could be due to granulocytes and platelets present in whole blood cultures but absent in PBMC
cultures, and studies have shown that both granulocytes and platelets are able to produce cytokines
(6–8). Other factors possibly present in the autologous plasma of the whole blood cultures include
cytokines, soluble cytokine receptors and antagonists and growth factors – elements that potentially
are important regulators of cell viability (9). In a study of apoptosis, Hodge and colleagues found a
greater level of leukocyte apoptosis in human PBMC cultures compared to whole blood cultures
following stimulation (9). Maybe not surprisingly they observed a decreased percentage of IFN-γ-
producing T cells in the Annexin V-positive apoptotic cells population compared to the viable
population. Thus, if the PBMCs have an increased tendency to become apoptotic during culture, this
may explain the lower levels of IFN-γ in cultures of PBMC compared to whole blood cultures seen in
the polyclonal non-specific activation assays.
This phenomenon of lower IFN-γ levels in cultures of PBMC, however, does not apply to the
assays of specific activation. One explanation could be that when cells are non-specifically stimulated
with a superantigen such as SEB they will be more prone to apoptosis as a result of exhaustion due to
the massive activation as compared to PBMCs that have undergone Ag-specific activation.
Interestingly, Hodge and colleagues found that the addition of plasma could protect PBMCs from
apoptosis (9). It is therefore likely that survival factors present in whole blood contribute to the higher
IFN-γ levels observed in these cultures.
Paper I
46
A concern when using PBMC cultures is the risk of losing cells during the purification process.
This could affect the overall distribution of cells in the sample, thus introducing a bias in the cell-
mediated response observed after in vitro stimulation. Therefore, the distribution of cells in PBMCs
and whole blood was compared, and a significant decrease in the percentage of γδ-T cells was found.
Since this cell type is an important early contributor to the IFN-γ production during a CMI response
after stimulation (10), the results obtained from in vitro-stimulated PBMC cultures may be somewhat
misleading. Other groups have also found selective cell loss after PBMC purification. De Groote et al.
describes a decreased ratio of monocytes:lymphocytes (monocytes concentrations being reduced)
after PBMC purification using ready-to-use leukoprep tubes (Becton Dickinson) (11). They speculate
that monocytes disappear due to adsorption to structures such as glass and gels used during the
purification process. Their isolation system is different from the one used in the present study (Ficoll-
Paque™Plus, GE Healthcare) which might explain the discrepancy in the type of cell-loss. Also they
look at human, not bovine cells. Another study by Hokland and Heron on purification of human
PBMCs reports selective cell loss of T cells when using Isopaque-Ficoll with a density of 1.076 g/ml
(12). They found that the cell-loss was due to autorosette formation in which some cells, primarily T
cells, were binding to red blood cells and were lost due to the higher density of the rosettes.
Numerous studies of bovine PBMCs have used Ficoll for separation with a density of 1.077 g/ml, as in
the present study (2, 13–16).
To our knowledge this is the first study reporting selective cell loss of bovine T cell subsets
during PBMC purification. It is a possibility, however, that the actual number of CD3+/γδ+ T cells
present after PBMC purification is not detected due to surface marker internalization. This has been
described in mice by Koenecke and colleagues who found that mAbs targeting the γδ+ T cells used in a
depletion model, actually did not result in γδ+ T cell depletion, but instead induced γδ T cell receptor
(TCR) internalization generating “invisible” cells (17). If the anti-γδ+ T cell antibody used in the present
study should result in internalization of the receptor, this does not explain the difference in the two
cell populations though. The internalization would have to happen after PBMC purification but before
staining in order to explain the difference. The same applies for the CD3 marker. If the decrease in γδ
TCR and CD3 is caused by internalization of multiple surface markers due to PBMC purification or in
Paper I
47
fact caused by loss of a cell subset during the purification process, can only be speculated. If the
former is the case, then the presence of cells being CD3 negative and γδ TCR positive (i.e. cells that
have internalized CD3 but not γδ TCR) would be expected, but this is not the case (data not shown).
The observation of selective cell loss during purification deserves attention and should be taken into
account when PBMC assays are used for measurement of CMI responses.
The variety of culture plates available for cell-incubation assays are plenty and the choice of
plate used in published studies is rarely described nor elaborated on. Therefore, a comparison of the
IFN-γ levels in antigen-specific and polyclonal activated whole blood cultures incubated in six
commercially available cell-incubation plates was performed. Even though the overall level of IFN-γ
did not differ significantly across the different plates in both cultures, it was observed that six out of
eight calves had highest specific IFN-γ levels when incubated on plate b (Corning®, clear, flat-bottom,
tissue culture treated, polystyrene, cat# 3596), and that this relative level was significant compared to
plate a, which was from Nunc™. Based on the present experiment it seems that flat bottom plates
from Corning® was the optimal plate, although it remains unresolved why polyclonal SEB stimulation
was less responsive than antigen-specific stimulation to the type of culture plate.
Choosing whether to use whole blood and PBMC assays or choosing which PBMC
concentration to use for in vitro stimulation experiments is complex due to individual cell
concentration optima. A number of studies have focused on comparing cytokine levels in cultures of
human whole blood and PBMCs measured by ELISA (18–20), cytokine arrays (11, 21, 22) or by
measuring the intracellular cytokine concentration using flow cytometry (9, 23). Most of these studies
come to the conclusion that whole blood assays correlates well with PBMC cultures and are even
preferable since this type of assay require no complex cell separation steps which saves both time and
money and only requires small amounts of blood. On the contrary, Silberer and colleagues who
compared cytokine release from cultures of diluted (1:5) whole blood and PBMCs (106 cells/well) in 25
human volunteers found no correlation of the IFN-γ levels in the two culture systems (24).
Additionally they observed a significant increase in IFN-γ levels in serum-free PBMC cultures
compared to PBMCs cultured in medium containing fetal bovine serum (FBS). Altogether they
Paper I
48
conclude that a standardized approach with clearly defined culture conditions is needed for better
comparability of cytokine data in the literature. The relevance of this request is further emphasized
with the data presented here. Table 3 summarizes the advantages and disadvantages of using whole
blood compared to PBMC cultures for IFN-γ release assays. If the purpose of the assay is to measure
CMI responses against e.g. vaccine antigens in order to assess the quality of a vaccine or for diagnostic
purposes, then whole blood cultures is preferable since the physiological conditions (such as cell-cell
communications, cell ratios, growth factors, cytokines and other regulators) are preserved. This can
be important since some cells rely on the presence of IL-2 for survival, and when removed they
undergo apoptosis (25). In respect to this, the whole blood assay thus reflects the in vivo milieu in the
most appropriate way. If long term incubation is needed, or if the purpose of the assay is to compare
the in vitro-effect of different drugs on an exact number of cells, then PBMC cultures could be
preferable.
In conclusion, this study shows the potential weaknesses of IFN-γ release assays in terms of
the many variables that can influence the results. A difference in the response when comparing whole
blood assays with PBMC assays was observed. The highest IFN-γ levels was found in a plate from
Corning® (cat# 3596) following specific activation in 6 out of 8 calves tested. Last but most
importantly, it was shown that purification of PBMC using Ficoll-Paque™Plus resulted in selective loss
of γδ T cells. This highlights the limitations of the assay and stresses the importance of documenting
the precise assay conditions when publishing results of in vitro IFN-γ release assays, or cytokine
release assays in general.
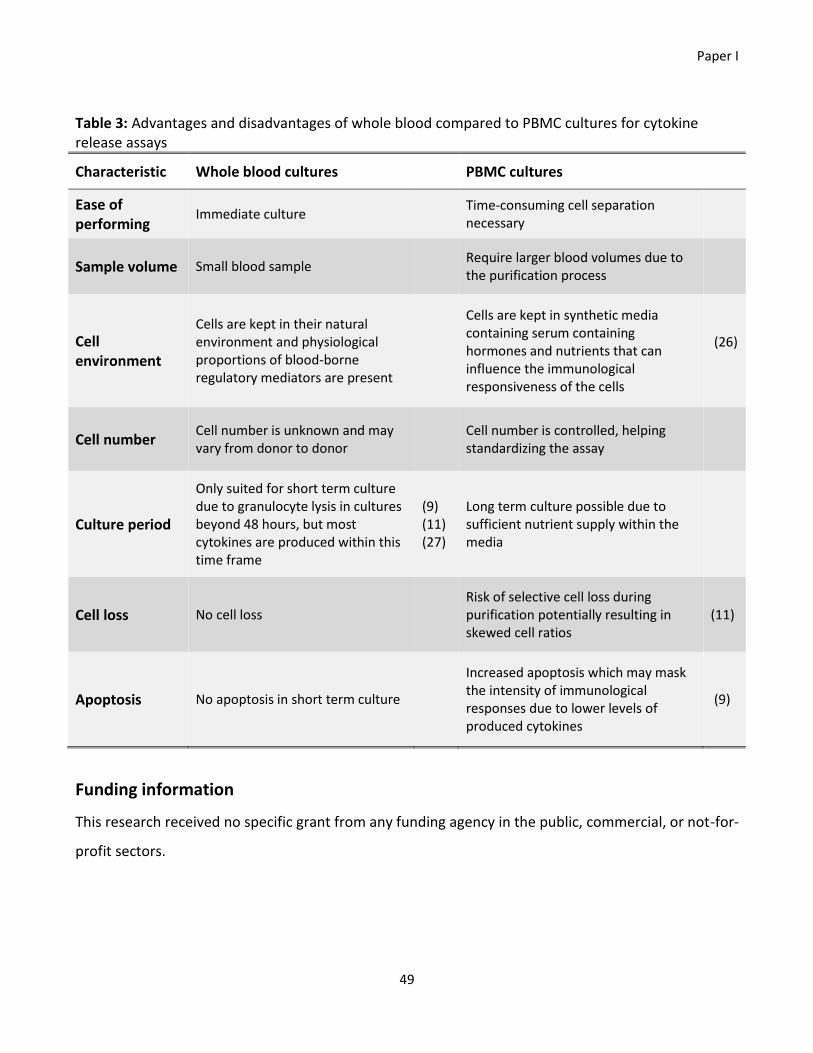
Paper I
49
Table 3: Advantages and disadvantages of whole blood compared to PBMC cultures for cytokine release assays
Characteristic Whole blood cultures PBMC cultures
Ease of performing
Immediate culture Time-consuming cell separation necessary
Sample volume Small blood sample Require larger blood volumes due to the purification process
Cell environment
Cells are kept in their natural environment and physiological proportions of blood-borne regulatory mediators are present
Cells are kept in synthetic media containing serum containing hormones and nutrients that can influence the immunological responsiveness of the cells
(26)
Cell number Cell number is unknown and may vary from donor to donor
Cell number is controlled, helping standardizing the assay
Culture period
Only suited for short term culture due to granulocyte lysis in cultures beyond 48 hours, but most cytokines are produced within this time frame
(9) (11) (27)
Long term culture possible due to sufficient nutrient supply within the media
Cell loss No cell loss Risk of selective cell loss during purification potentially resulting in skewed cell ratios
(11)
Apoptosis No apoptosis in short term culture
Increased apoptosis which may mask the intensity of immunological responses due to lower levels of produced cytokines
(9)
Funding information
This research received no specific grant from any funding agency in the public, commercial, or not-for-
profit sectors.
Paper I
50
Acknowledgement
A thank to Ulla Riber for assistance with the flow cytometry and to Jeanne Toft Jakobsen for
assistance in the lab.
References
1. Thakur A, Pedersen LE, Jungersen G. 2012. Immune markers and correlates of protection for
vaccine induced immune responses. Vaccine 30:4907–20.
2. Thakur A, Riber U, Davis WC, Jungersen G. 2013. Increasing the ex vivo antigen-specific IFN-γ
production in subpopulations of T cells and NKp46+ cells by anti-CD28, anti-CD49d and
recombinant IL-12 costimulation in cattle vaccinated with recombinant proteins from
Mycobacterium avium subspecies paratube. Vet Immunol Immunopathol 155:276–83.
3. Mikkelsen H, Jungersen G, Nielsen SS. 2009. Association between milk antibody and
interferon-gamma responses in cattle from Mycobacterium avium subsp. paratuberculosis
infected herds. Vet Immunol Immunopathol 127:235–241.
4. Schmaltz R, Bhogal B, Wang Y-Y, Petro T, Chen S-S. 1995. Staphylococcal Enterotoxin is a
Bovine T Cell Superantigen. Immunol Invest.
5. Schlievert PM. 1993. Role of Superantigens in Human Disease. J Infect Dis 167:997–1002.
6. Weyrich AS, Zimmerman GA. 2004. Platelets: signaling cells in the immune continuum. Trends
Immunol 25:489–95.
7. Allam O, Samarani S, Marzouk R, Ahmad A. 2012. Human platelets produce and constitute the
main source of IL-18 in the circulation. J Immunol 188:44.25.
8. Cassatella MA. 1995. The production of cytokines by polymorphonuclear neutrophils. Immunol
Today 16:21–26.
9. Hodge G, Hodge S, Han P. 2000. Increased levels of apoptosis of leukocyte subsets in cultured
PBMCs compared to whole blood as shown by Annexin V binding: relevance to cytokine
production. Cytokine 12:1763–8.
Paper I
51
10. Baldwin C., Sathiyaseelan T, Naiman B, White A., Brown R, Blumerman S, Rogers A, Black S.
2002. Activation of bovine peripheral blood γδ T cells for cell division and IFN-γ production. Vet
Immunol Immunopathol 87:251–259.
11. De Groote D, Zangerle PF, Gevaert Y, Fassotte MF, Beguin Y, Noizat-Pirenne F, Pirenne J,
Gathy R, Lopez M, Dehart I, Igot D, Baudrihaye M, Delacroix D, Franchimont P. 1992. Direct
stimulation of cytokines (IL-1β, TNF-α, IL-6, IL-2, IFN-γ and GM-CSF) in whole blood. I.
Comparison with isolated PBMC stimulation. Cytokine 4:239–248.
12. Hokland P, Heron I. 1980. The Isopaque-Ficoll Method Re-evaluated: Selective Loss of
Autologous Rosette-forming Lymphocytes during Isolation of Mononuclear Cells from Human
Peripheral Blood. Scand J Immunol 11:353–356.
13. Pearson TW, Roelants GE, Lundin LB, Mayor-Withey KS. 1979. The bovine lymphoid system:
Binding and stimulation of peripheral blood lymphocytes by lectins. J Immunol Methods
26:271–282.
14. Yang TJ, Jantzen PA, Williams LF. 1979. Acid alpha-naphthyl acetate esterase: presence of
activity in bovine and human T and B lymphocytes. Immunology 38:85–93.
15. Ioannou XP, Griebel P, Hecker R, Babiuk LA, van Drunen Littel-van den Hurk S. 2002. The
Immunogenicity and Protective Efficacy of Bovine Herpesvirus 1 Glycoprotein D plus Emulsigen
Are Increased by Formulation with CpG Oligodeoxynucleotides. J Virol 76:9002–9010.
16. Rankin R. 2002. CpG-containing oligodeoxynucleotides augment and switch the immune
responses of cattle to bovine herpesvirus-1 glycoprotein D*1. Vaccine 20:3014–3022.
17. Koenecke C, Chennupati V, Schmitz S, Malissen B, Förster R, Prinz I. 2009. In vivo application
of mAb directed against the γδ TCR does not deplete but generates “invisible” γδ T cells. Eur J
Immunol 39:372–379.
18. Antas PR, Cardoso FL, Oliveira EB, Gomes PK, Cunha KS, Sarno EN, Sampaio EP. 2004. Whole
blood assay to access T cell-immune responses to Mycobacterium tuberculosis antigens in
healthy Brazilian individuals. Mem Inst Oswaldo Cruz 99:53–55.
19. Deenadayalan A, Maddineni P, Raja A. 2013. Comparison of whole blood and PBMC assays for
T-cell functional analysis. BMC Res Notes 6:120.
Paper I
52
20. Damsgaard CT, Lauritzen L, Calder PC, Kjaer TMR, Frøkiaer H. 2009. Whole-blood culture is a
valid low-cost method to measure monocytic cytokines - a comparison of cytokine production
in cultures of human whole-blood, mononuclear cells and monocytes. J Immunol Methods
340:95–101.
21. Silva D, Ponte CGG, Hacker MA, Antas PRZ. 2013. A whole blood assay as a simple, broad
assessment of cytokines and chemokines to evaluate human immune responses to
Mycobacterium tuberculosis antigens. Acta Trop 127:75–81.
22. Stoddard MB, Pinto V, Keiser PB, Zollinger W. 2010. Evaluation of a whole-blood cytokine
release assay for use in measuring endotoxin activity of group B Neisseria meningitidis vaccines
made from lipid A acylation mutants. Clin Vaccine Immunol 17:98–107.
23. Godoy-Ramirez K, Franck K, Mahdavifar S, Andersson L, Gaines H. 2004. Optimum culture
conditions for specific and nonspecific activation of whole blood and PBMC for intracellular
cytokine assessment by flow cytometry. J Immunol Methods 292:1–15.
24. Silberer J, Ihorst G, Kopp MV. 2008. Cytokine levels in supernatants of whole blood and
mononuclear cell cultures in adults and neonates reveal significant differences with respect to
interleukin-13 and interferon-gamma. Pediatr Allergy Immunol 19:140–7.
25. Cohen JJ, Duke RC, Fadok VA, Sellins KS. 1992. Apoptosis and programmed cell death in
immunity. Annu Rev Immunol 10:267–93.
26. Albers R, Antoine J-M, Bourdet-Sicard R, Calder PC, Gleeson M, Lesourd B, Samartín S,
Sanderson IR, Van Loo J, Vas Dias FW, Watzl B. 2007. Markers to measure immunomodulation
in human nutrition intervention studies. Br J Nutr 94:452.
27. Sautois B, Fillet G, Beguin Y. 1997. Comparative cytokine production by in vitro stimulated
mononucleated cells from cord blood and adult blood. Exp Hematol 25:103–8.
53
Chapter 4 - Study II (3D IGRA)
4.1 Introduction
The initiation of CMI responses requires the presentation of antigen peptides by APCs to rare T
lymphocytes having TCRs specific for the unique antigen:MHC complex. This compares to finding a
needle in a haystack with frequencies of naïve epitope specific T lymphocytes ranging from 0.2-10 per
million naïve CD4+ T lymphocytes in humans (Kwok et al. 2012; Jenkins & Moon 2012). This challenge
is solved in vivo by the internal structures of lymph nodes. Lymphoid tissues consist of a scaffold of
fibers (or reticular network) enwrapped by fibroblastic reticular cells (FRC). The tissue contains ECM
proteins such as collagens, laminin, fibronectin, and tenascin, and enables T lymphocytes to migrate
whereas APCs settle within the network (Sobocinski et al. 2010). It has been estimated that DCs can
scan 0.5-5x10³ T lymphocytes per hour within the lymph node and thus the reticular network
constitutes an optimal structural geometry that promote APC/T lymphocytes contact (Bousso &
Robey 2003; Miller et al. 2004; Gretz et al. 1996).
When measuring CMI responses in vitro by IGRA it is not a primary activation that takes place in the
culture well, but a re-activation of memory cells. Thus the number of cognate T lymphocytes with
specificities toward the antigen:MHC complex presented by APCs is higher by around two orders of
magnitude (Kwok et al. 2012). Nevertheless, the cell-cell contact is essential and no special measures
are done to facilitate this contact in a conventional 2D culture setup.
4.2 Hypothesis
Cells cultured in vitro are placed in an environment that is very far from their natural milieu and thus
might behave somewhat different compared to in vivo. It is hypothesized that when measuring
cytokine responses from cells cultured on a 2D surface, the full potential of these cells is not obtained
as they are not able to migrate and engage in cell-cell contact in an optimal way. Therefore, we
speculated if culturing cells on a 3D surface would facilitate structured cell migration thus facilitating
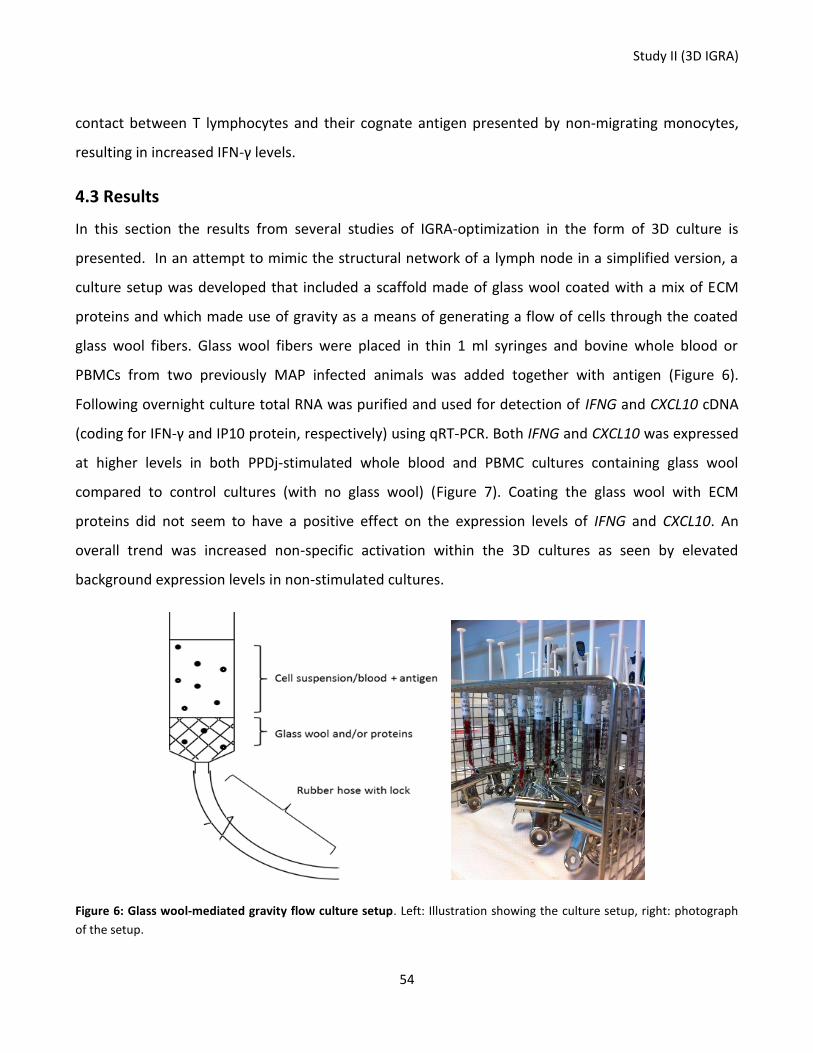
Study II (3D IGRA)
54
contact between T lymphocytes and their cognate antigen presented by non-migrating monocytes,
resulting in increased IFN-γ levels.
4.3 Results
In this section the results from several studies of IGRA-optimization in the form of 3D culture is
presented. In an attempt to mimic the structural network of a lymph node in a simplified version, a
culture setup was developed that included a scaffold made of glass wool coated with a mix of ECM
proteins and which made use of gravity as a means of generating a flow of cells through the coated
glass wool fibers. Glass wool fibers were placed in thin 1 ml syringes and bovine whole blood or
PBMCs from two previously MAP infected animals was added together with antigen (Figure 6).
Following overnight culture total RNA was purified and used for detection of IFNG and CXCL10 cDNA
(coding for IFN-γ and IP10 protein, respectively) using qRT-PCR. Both IFNG and CXCL10 was expressed
at higher levels in both PPDj-stimulated whole blood and PBMC cultures containing glass wool
compared to control cultures (with no glass wool) (Figure 7). Coating the glass wool with ECM
proteins did not seem to have a positive effect on the expression levels of IFNG and CXCL10. An
overall trend was increased non-specific activation within the 3D cultures as seen by elevated
background expression levels in non-stimulated cultures.
Figure 6: Glass wool-mediated gravity flow culture setup. Left: Illustration showing the culture setup, right: photograph
of the setup.
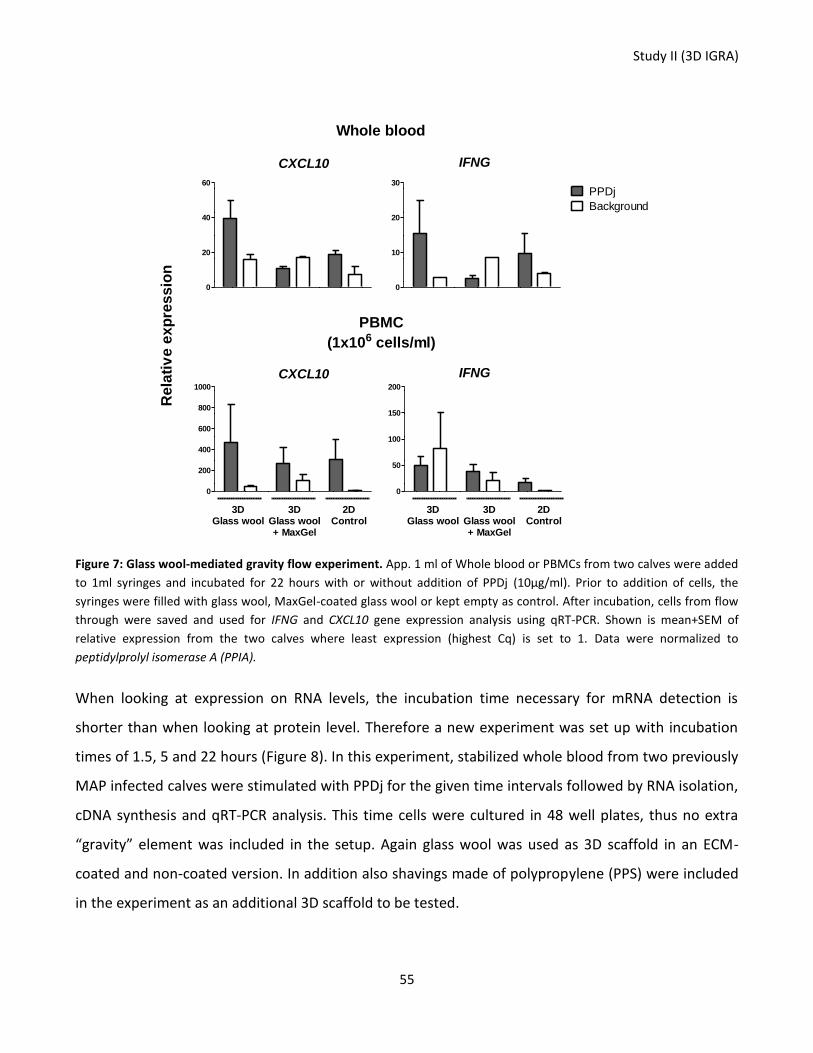
Study II (3D IGRA)
55
0
20
40
60
0
200
400
600
800
1000
0
10
20
30
PPDj
Background
0
50
100
150
200
Whole blood
PBMC
(1x10⁶ cells/ml)
Rela
tiv
e e
xp
res
sio
nCXCL10 IFNG
3DGlass wool
3DGlass wool+ MaxGel
2DControl
3DGlass wool
3DGlass wool+ MaxGel
2DControl
CXCL10 IFNG
Figure 7: Glass wool-mediated gravity flow experiment. App. 1 ml of Whole blood or PBMCs from two calves were added
to 1ml syringes and incubated for 22 hours with or without addition of PPDj (10µg/ml). Prior to addition of cells, the
syringes were filled with glass wool, MaxGel-coated glass wool or kept empty as control. After incubation, cells from flow
through were saved and used for IFNG and CXCL10 gene expression analysis using qRT-PCR. Shown is mean+SEM of
relative expression from the two calves where least expression (highest Cq) is set to 1. Data were normalized to
peptidylprolyl isomerase A (PPIA).
When looking at expression on RNA levels, the incubation time necessary for mRNA detection is
shorter than when looking at protein level. Therefore a new experiment was set up with incubation
times of 1.5, 5 and 22 hours (Figure 8). In this experiment, stabilized whole blood from two previously
MAP infected calves were stimulated with PPDj for the given time intervals followed by RNA isolation,
cDNA synthesis and qRT-PCR analysis. This time cells were cultured in 48 well plates, thus no extra
“gravity” element was included in the setup. Again glass wool was used as 3D scaffold in an ECM-
coated and non-coated version. In addition also shavings made of polypropylene (PPS) were included
in the experiment as an additional 3D scaffold to be tested.
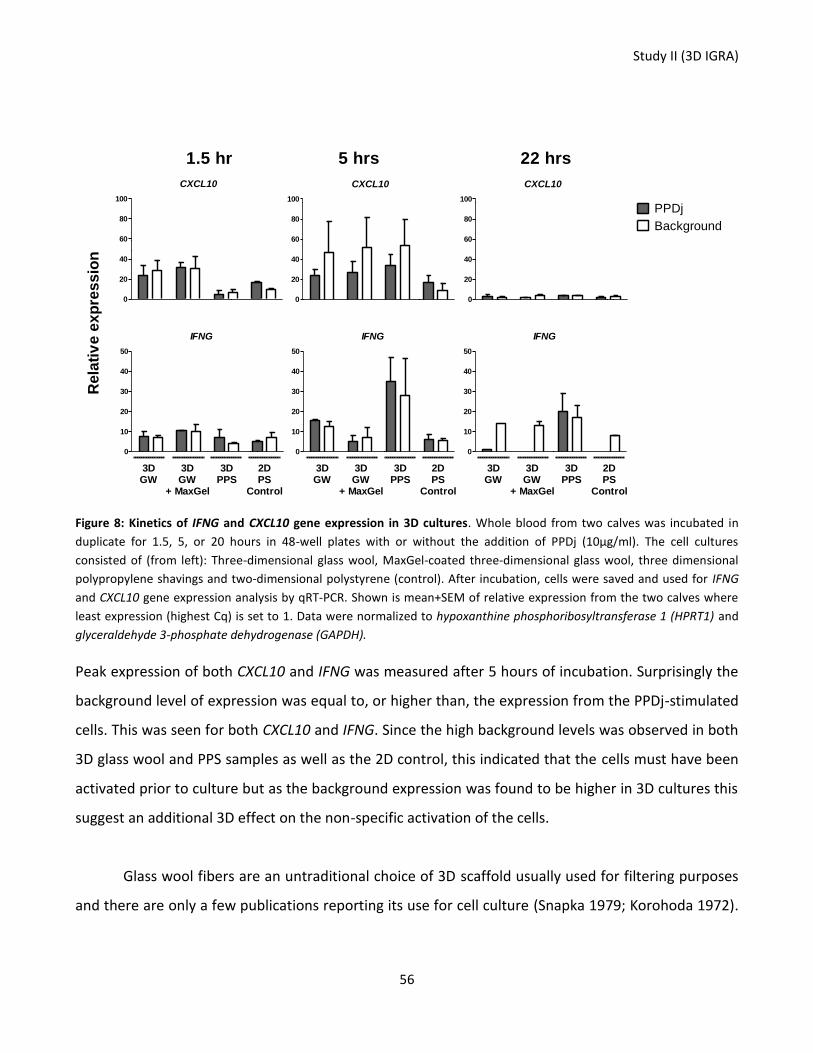
Study II (3D IGRA)
56
CXCL10
0
20
40
60
80
100
CXCL10
0
20
40
60
80
100
CXCL10
0
20
40
60
80
100
PPDj
Background
IFNG
0
10
20
30
40
50
IFNG
0
10
20
30
40
50
IFNG
0
10
20
30
40
50
Rela
tiv
e e
xp
res
sio
n
1.5 hr 5 hrs 22 hrs
3DGW
3DGW
+ MaxGel
3DPPS
2DPS
Control
3DGW
3DGW
+ MaxGel
3DPPS
2DPS
Control
3DGW
3DGW
+ MaxGel
3DPPS
2DPS
Control
Figure 8: Kinetics of IFNG and CXCL10 gene expression in 3D cultures. Whole blood from two calves was incubated in
duplicate for 1.5, 5, or 20 hours in 48-well plates with or without the addition of PPDj (10µg/ml). The cell cultures
consisted of (from left): Three-dimensional glass wool, MaxGel-coated three-dimensional glass wool, three dimensional
polypropylene shavings and two-dimensional polystyrene (control). After incubation, cells were saved and used for IFNG
and CXCL10 gene expression analysis by qRT-PCR. Shown is mean+SEM of relative expression from the two calves where
least expression (highest Cq) is set to 1. Data were normalized to hypoxanthine phosphoribosyltransferase 1 (HPRT1) and
glyceraldehyde 3-phosphate dehydrogenase (GAPDH).
Peak expression of both CXCL10 and IFNG was measured after 5 hours of incubation. Surprisingly the
background level of expression was equal to, or higher than, the expression from the PPDj-stimulated
cells. This was seen for both CXCL10 and IFNG. Since the high background levels was observed in both
3D glass wool and PPS samples as well as the 2D control, this indicated that the cells must have been
activated prior to culture but as the background expression was found to be higher in 3D cultures this
suggest an additional 3D effect on the non-specific activation of the cells.
Glass wool fibers are an untraditional choice of 3D scaffold usually used for filtering purposes
and there are only a few publications reporting its use for cell culture (Snapka 1979; Korohoda 1972).
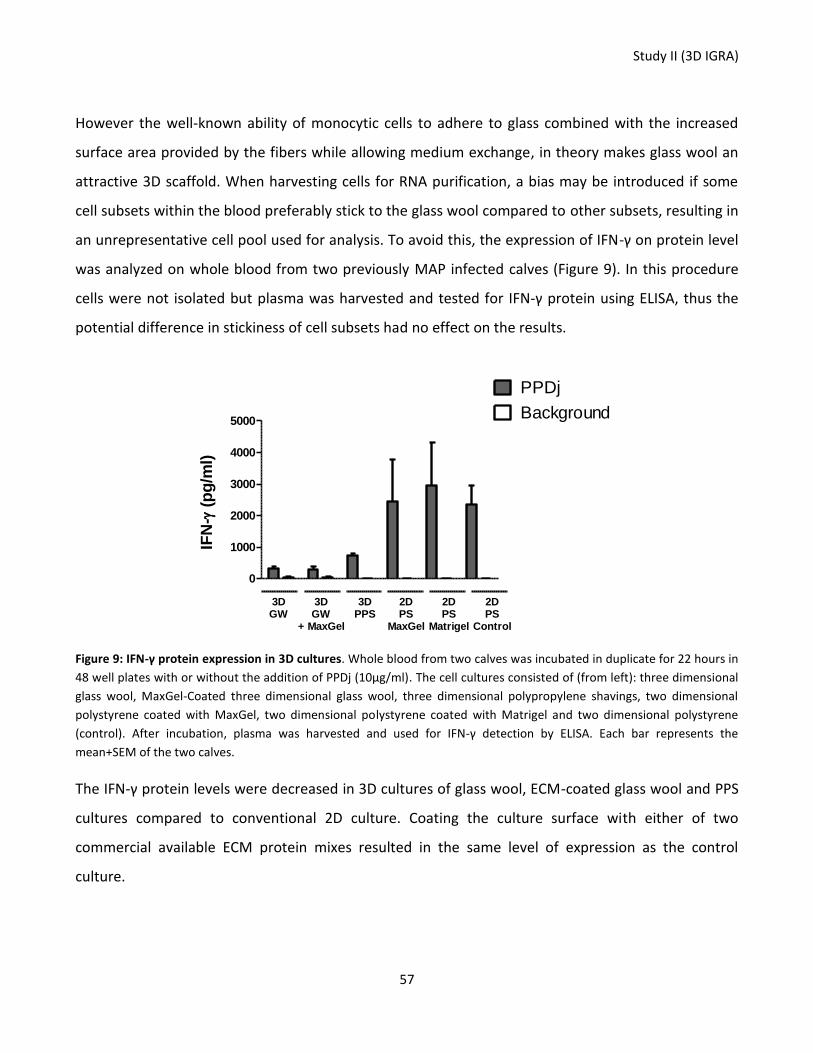
Study II (3D IGRA)
57
However the well-known ability of monocytic cells to adhere to glass combined with the increased
surface area provided by the fibers while allowing medium exchange, in theory makes glass wool an
attractive 3D scaffold. When harvesting cells for RNA purification, a bias may be introduced if some
cell subsets within the blood preferably stick to the glass wool compared to other subsets, resulting in
an unrepresentative cell pool used for analysis. To avoid this, the expression of IFN-γ on protein level
was analyzed on whole blood from two previously MAP infected calves (Figure 9). In this procedure
cells were not isolated but plasma was harvested and tested for IFN-γ protein using ELISA, thus the
potential difference in stickiness of cell subsets had no effect on the results.
0
1000
2000
3000
4000
5000
PPDj
Background
IFN
- (
pg
/ml)
3DGW
3DGW
+ MaxGel
2DPS
MaxGel
2DPS
Matrigel
3DPPS
2DPS
Control
Figure 9: IFN-γ protein expression in 3D cultures. Whole blood from two calves was incubated in duplicate for 22 hours in
48 well plates with or without the addition of PPDj (10µg/ml). The cell cultures consisted of (from left): three dimensional
glass wool, MaxGel-Coated three dimensional glass wool, three dimensional polypropylene shavings, two dimensional
polystyrene coated with MaxGel, two dimensional polystyrene coated with Matrigel and two dimensional polystyrene
(control). After incubation, plasma was harvested and used for IFN-γ detection by ELISA. Each bar represents the
mean+SEM of the two calves.
The IFN-γ protein levels were decreased in 3D cultures of glass wool, ECM-coated glass wool and PPS
cultures compared to conventional 2D culture. Coating the culture surface with either of two
commercial available ECM protein mixes resulted in the same level of expression as the control
culture.
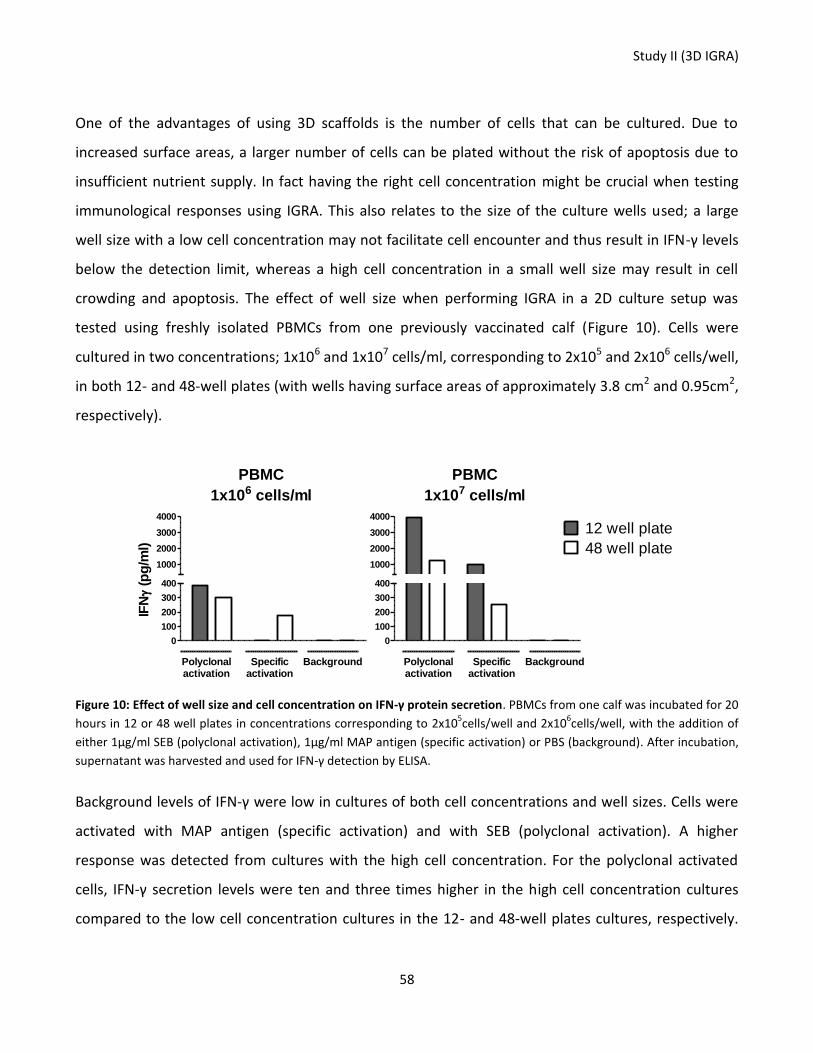
Study II (3D IGRA)
58
One of the advantages of using 3D scaffolds is the number of cells that can be cultured. Due to
increased surface areas, a larger number of cells can be plated without the risk of apoptosis due to
insufficient nutrient supply. In fact having the right cell concentration might be crucial when testing
immunological responses using IGRA. This also relates to the size of the culture wells used; a large
well size with a low cell concentration may not facilitate cell encounter and thus result in IFN-γ levels
below the detection limit, whereas a high cell concentration in a small well size may result in cell
crowding and apoptosis. The effect of well size when performing IGRA in a 2D culture setup was
tested using freshly isolated PBMCs from one previously vaccinated calf (Figure 10). Cells were
cultured in two concentrations; 1x10⁶ and 1x10⁷ cells/ml, corresponding to 2x10⁵ and 2x10⁶ cells/well,
in both 12- and 48-well plates (with wells having surface areas of approximately 3.8 cm2 and 0.95cm2,
respectively).
PBMC
1x10⁶ cells/ml
0
100
200
300
400
1000
2000
3000
4000
PBMC
1x10⁷ cells/ml
0
100
200
300
400
1000
2000
3000
4000
12 well plate
48 well plate
IFN
(pg
/ml)
Polyclonalactivation
Specificactivation
Background Polyclonalactivation
Specificactivation
Background
Figure 10: Effect of well size and cell concentration on IFN-γ protein secretion. PBMCs from one calf was incubated for 20
hours in 12 or 48 well plates in concentrations corresponding to 2x10⁵cells/well and 2x10
6cells/well, with the addition of
either 1µg/ml SEB (polyclonal activation), 1µg/ml MAP antigen (specific activation) or PBS (background). After incubation,
supernatant was harvested and used for IFN-γ detection by ELISA.
Background levels of IFN-γ were low in cultures of both cell concentrations and well sizes. Cells were
activated with MAP antigen (specific activation) and with SEB (polyclonal activation). A higher
response was detected from cultures with the high cell concentration. For the polyclonal activated
cells, IFN-γ secretion levels were ten and three times higher in the high cell concentration cultures
compared to the low cell concentration cultures in the 12- and 48-well plates cultures, respectively.
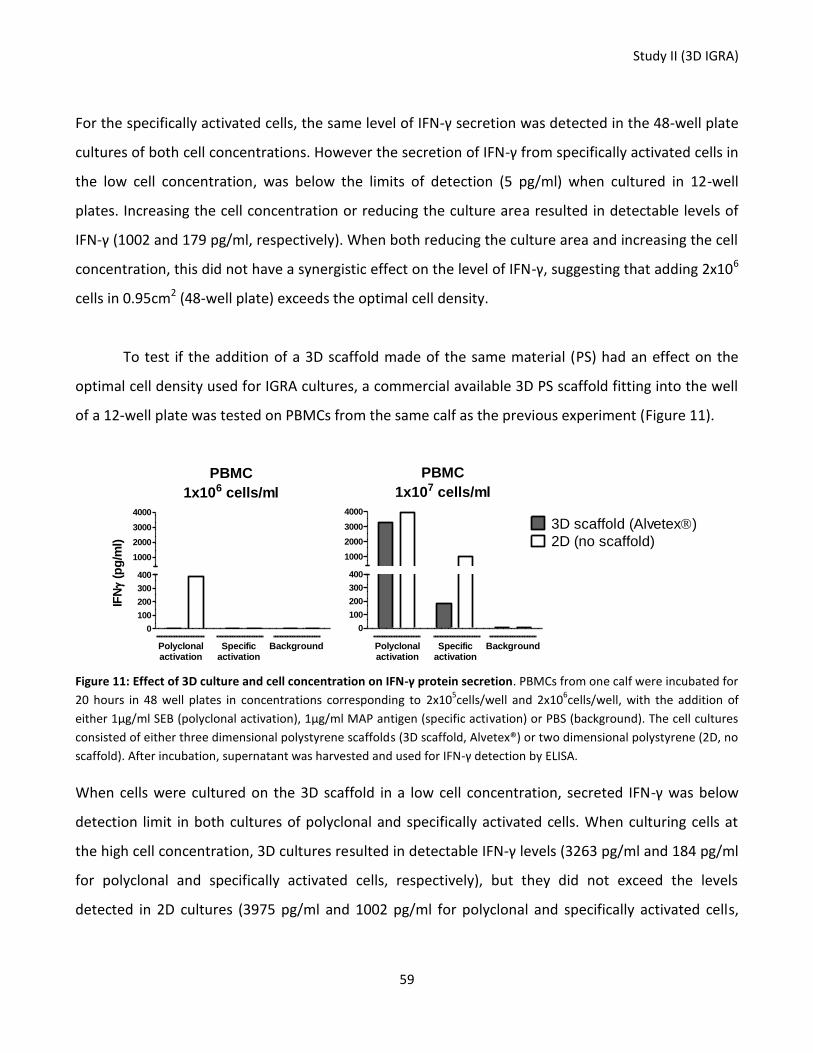
Study II (3D IGRA)
59
For the specifically activated cells, the same level of IFN-γ secretion was detected in the 48-well plate
cultures of both cell concentrations. However the secretion of IFN-γ from specifically activated cells in
the low cell concentration, was below the limits of detection (5 pg/ml) when cultured in 12-well
plates. Increasing the cell concentration or reducing the culture area resulted in detectable levels of
IFN-γ (1002 and 179 pg/ml, respectively). When both reducing the culture area and increasing the cell
concentration, this did not have a synergistic effect on the level of IFN-γ, suggesting that adding 2x10⁶
cells in 0.95cm2 (48-well plate) exceeds the optimal cell density.
To test if the addition of a 3D scaffold made of the same material (PS) had an effect on the
optimal cell density used for IGRA cultures, a commercial available 3D PS scaffold fitting into the well
of a 12-well plate was tested on PBMCs from the same calf as the previous experiment (Figure 11).
PBMC
1x10⁶ cells/ml
0
100
200
300
400
1000
2000
3000
4000
PBMC
1x10⁷ cells/ml
0
100
200
300
400
1000
2000
3000
4000
3D scaffold (Alvetex)
2D (no scaffold)
IFN
(pg
/ml)
Polyclonalactivation
Specificactivation
Background Polyclonalactivation
Specificactivation
Background
Figure 11: Effect of 3D culture and cell concentration on IFN-γ protein secretion. PBMCs from one calf were incubated for
20 hours in 48 well plates in concentrations corresponding to 2x10⁵cells/well and 2x10
6cells/well, with the addition of
either 1µg/ml SEB (polyclonal activation), 1µg/ml MAP antigen (specific activation) or PBS (background). The cell cultures
consisted of either three dimensional polystyrene scaffolds (3D scaffold, Alvetex®) or two dimensional polystyrene (2D, no
scaffold). After incubation, supernatant was harvested and used for IFN-γ detection by ELISA.
When cells were cultured on the 3D scaffold in a low cell concentration, secreted IFN-γ was below
detection limit in both cultures of polyclonal and specifically activated cells. When culturing cells at
the high cell concentration, 3D cultures resulted in detectable IFN-γ levels (3263 pg/ml and 184 pg/ml
for polyclonal and specifically activated cells, respectively), but they did not exceed the levels
detected in 2D cultures (3975 pg/ml and 1002 pg/ml for polyclonal and specifically activated cells,
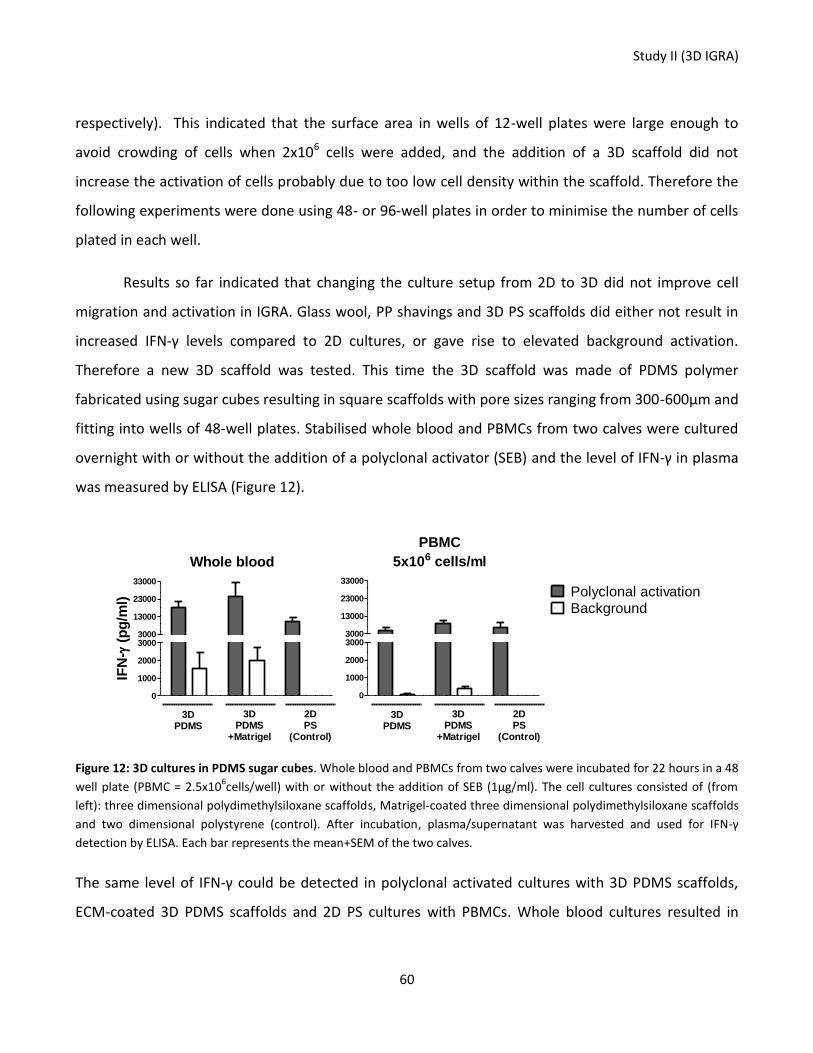
Study II (3D IGRA)
60
respectively). This indicated that the surface area in wells of 12-well plates were large enough to
avoid crowding of cells when 2x10⁶ cells were added, and the addition of a 3D scaffold did not
increase the activation of cells probably due to too low cell density within the scaffold. Therefore the
following experiments were done using 48- or 96-well plates in order to minimise the number of cells
plated in each well.
Results so far indicated that changing the culture setup from 2D to 3D did not improve cell
migration and activation in IGRA. Glass wool, PP shavings and 3D PS scaffolds did either not result in
increased IFN-γ levels compared to 2D cultures, or gave rise to elevated background activation.
Therefore a new 3D scaffold was tested. This time the 3D scaffold was made of PDMS polymer
fabricated using sugar cubes resulting in square scaffolds with pore sizes ranging from 300-600µm and
fitting into wells of 48-well plates. Stabilised whole blood and PBMCs from two calves were cultured
overnight with or without the addition of a polyclonal activator (SEB) and the level of IFN-γ in plasma
was measured by ELISA (Figure 12).
Whole blood
0
1000
2000
30003000
13000
23000
33000
IFN
- (
pg
/ml)
PBMC
5x10⁶ cells/ml
0
1000
2000
30003000
13000
23000
33000
Polyclonal activationBackground
3DPDMS
3DPDMS
+Matrigel
2DPS
(Control)
3DPDMS
3DPDMS
+Matrigel
2DPS
(Control)
Figure 12: 3D cultures in PDMS sugar cubes. Whole blood and PBMCs from two calves were incubated for 22 hours in a 48
well plate (PBMC = 2.5x10⁶cells/well) with or without the addition of SEB (1µg/ml). The cell cultures consisted of (from
left): three dimensional polydimethylsiloxane scaffolds, Matrigel-coated three dimensional polydimethylsiloxane scaffolds
and two dimensional polystyrene (control). After incubation, plasma/supernatant was harvested and used for IFN-γ
detection by ELISA. Each bar represents the mean+SEM of the two calves.
The same level of IFN-γ could be detected in polyclonal activated cultures with 3D PDMS scaffolds,
ECM-coated 3D PDMS scaffolds and 2D PS cultures with PBMCs. Whole blood cultures resulted in

Study II (3D IGRA)
61
increased IFN-γ levels compared to PBMC cultures, and 3D cultures had a slightly positive effect on
the IFN-γ levels. However, once again there was a noticeable increase in non-specific activation of
cells cultured in 3D compared to 2D.
For routine testing, the costs of IGRAs will have to be kept low as there is no point in
developing an improved 3D assay if the expense for performing the test makes it unattractive. With
that in mind, 3D scaffolds made of filter paper disks punched to fit into the wells of 96-well plates
were prepared. To increase the T cell motility and thus the chance of activation, disks were coated
with CCL21 chemokine. When coated onto culture surfaces, CCL21 have previously shown to trigger T
cell locomotion in vitro (Woolf et al. 2007), as well as being responsible for increased in vitro T cell
proliferation and activation after TCR stimulation (Gollmer et al. 2009). Therefore, an experiment was
set up testing the effect of 3D scaffolds made of filter paper combined with CCL21 in a coated and
soluble form, using stabilized whole blood or PBMCs from two calves (Figure 13).
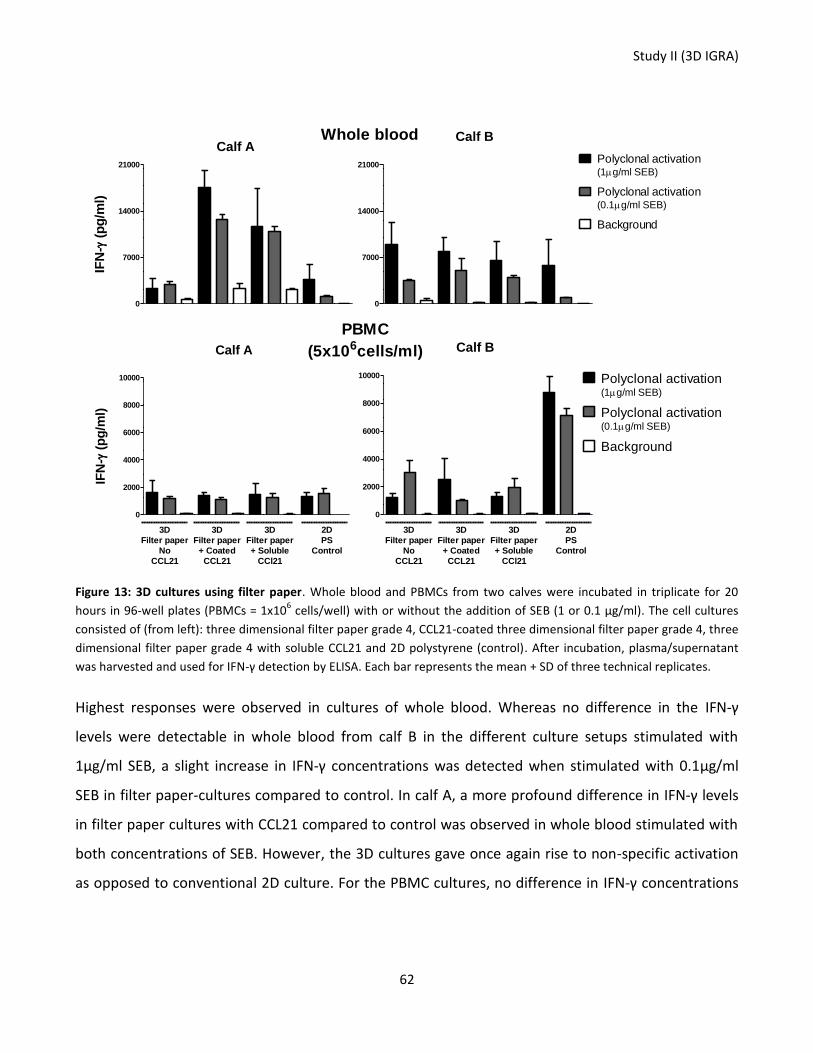
Study II (3D IGRA)
62
Calf A
0
7000
14000
21000
IFN
- (
pg
/ml)
Calf B
0
7000
14000
21000Polyclonal activation(1g/ml SEB)
Polyclonal activation(0.1g/ml SEB)
Background
Calf A
0
2000
4000
6000
8000
10000
IFN
- (
pg
/ml)
Calf B
0
2000
4000
6000
8000
10000 Polyclonal activation(1g/ml SEB)
Polyclonal activation(0.1g/ml SEB)
Background
Whole blood
PBMC
(5x10⁶cells/ml)
3D
Filter paper
+ Soluble
CCl21
3D
Filter paper
+ Coated
CCL21
3D
Filter paper
No
CCL21
2D
PS
Control
3D
Filter paper
+ Soluble
CCl21
3D
Filter paper
+ Coated
CCL21
3D
Filter paper
No
CCL21
2D
PS
Control
Figure 13: 3D cultures using filter paper. Whole blood and PBMCs from two calves were incubated in triplicate for 20
hours in 96-well plates (PBMCs = 1x10⁶ cells/well) with or without the addition of SEB (1 or 0.1 µg/ml). The cell cultures
consisted of (from left): three dimensional filter paper grade 4, CCL21-coated three dimensional filter paper grade 4, three
dimensional filter paper grade 4 with soluble CCL21 and 2D polystyrene (control). After incubation, plasma/supernatant
was harvested and used for IFN-γ detection by ELISA. Each bar represents the mean + SD of three technical replicates.
Highest responses were observed in cultures of whole blood. Whereas no difference in the IFN-γ
levels were detectable in whole blood from calf B in the different culture setups stimulated with
1µg/ml SEB, a slight increase in IFN-γ concentrations was detected when stimulated with 0.1µg/ml
SEB in filter paper-cultures compared to control. In calf A, a more profound difference in IFN-γ levels
in filter paper cultures with CCL21 compared to control was observed in whole blood stimulated with
both concentrations of SEB. However, the 3D cultures gave once again rise to non-specific activation
as opposed to conventional 2D culture. For the PBMC cultures, no difference in IFN-γ concentrations
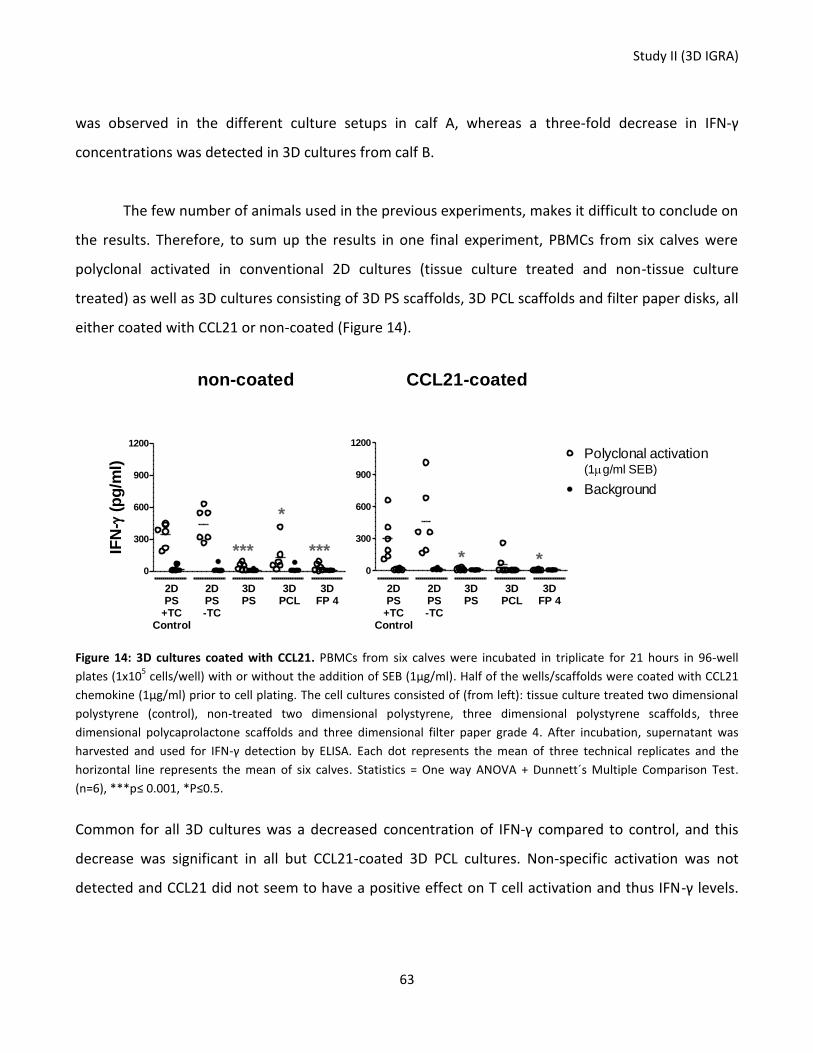
Study II (3D IGRA)
63
was observed in the different culture setups in calf A, whereas a three-fold decrease in IFN-γ
concentrations was detected in 3D cultures from calf B.
The few number of animals used in the previous experiments, makes it difficult to conclude on
the results. Therefore, to sum up the results in one final experiment, PBMCs from six calves were
polyclonal activated in conventional 2D cultures (tissue culture treated and non-tissue culture
treated) as well as 3D cultures consisting of 3D PS scaffolds, 3D PCL scaffolds and filter paper disks, all
either coated with CCL21 or non-coated (Figure 14).
0
300
600
900
1200
IFN
- (
pg
/ml)
0
300
600
900
1200
Polyclonal activation(1g/ml SEB)
Background
2DPS
+TCControl
2DPS-TC
3DPS
3DPCL
3DFP 4
2DPS
+TCControl
2DPS-TC
3DPS
3DPCL
3DFP 4
non-coated CCL21-coated
* **** ***
*
Figure 14: 3D cultures coated with CCL21. PBMCs from six calves were incubated in triplicate for 21 hours in 96-well
plates (1x10⁵ cells/well) with or without the addition of SEB (1µg/ml). Half of the wells/scaffolds were coated with CCL21
chemokine (1µg/ml) prior to cell plating. The cell cultures consisted of (from left): tissue culture treated two dimensional
polystyrene (control), non-treated two dimensional polystyrene, three dimensional polystyrene scaffolds, three
dimensional polycaprolactone scaffolds and three dimensional filter paper grade 4. After incubation, supernatant was
harvested and used for IFN-γ detection by ELISA. Each dot represents the mean of three technical replicates and the
horizontal line represents the mean of six calves. Statistics = One way ANOVA + Dunnett´s Multiple Comparison Test.
(n=6), ***p≤ 0.001, *P≤0.5.
Common for all 3D cultures was a decreased concentration of IFN-γ compared to control, and this
decrease was significant in all but CCL21-coated 3D PCL cultures. Non-specific activation was not
detected and CCL21 did not seem to have a positive effect on T cell activation and thus IFN-γ levels.
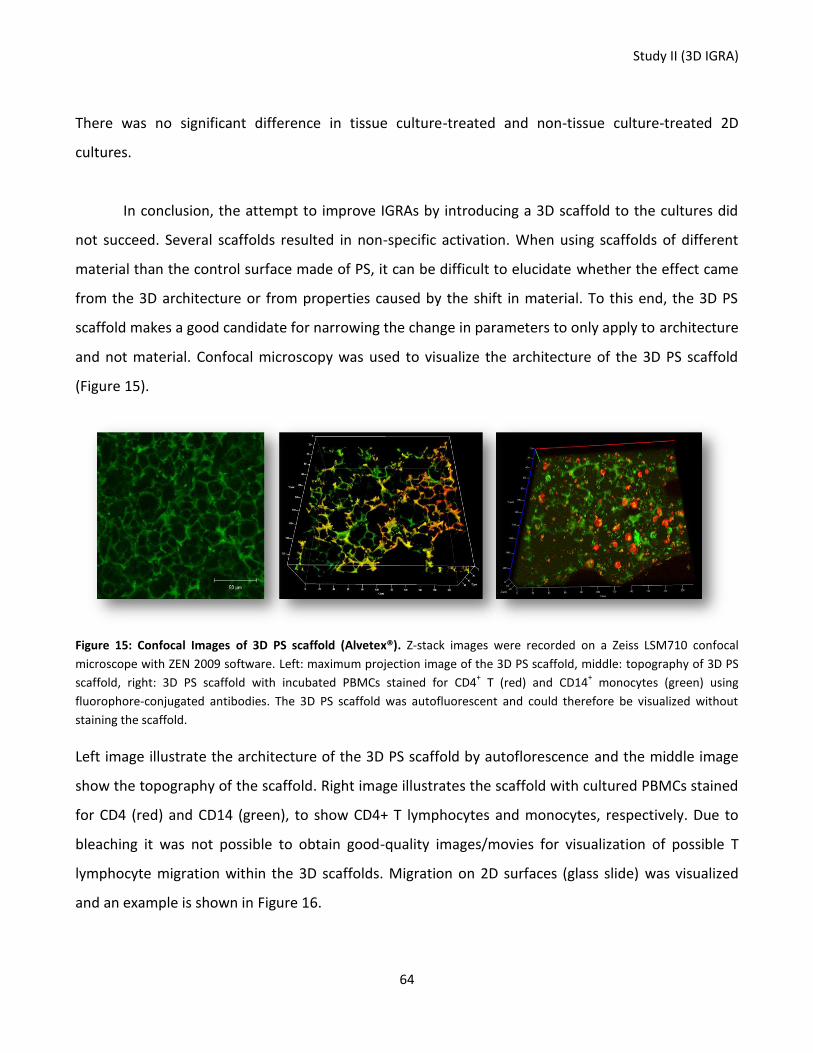
Study II (3D IGRA)
64
There was no significant difference in tissue culture-treated and non-tissue culture-treated 2D
cultures.
In conclusion, the attempt to improve IGRAs by introducing a 3D scaffold to the cultures did
not succeed. Several scaffolds resulted in non-specific activation. When using scaffolds of different
material than the control surface made of PS, it can be difficult to elucidate whether the effect came
from the 3D architecture or from properties caused by the shift in material. To this end, the 3D PS
scaffold makes a good candidate for narrowing the change in parameters to only apply to architecture
and not material. Confocal microscopy was used to visualize the architecture of the 3D PS scaffold
(Figure 15).
Figure 15: Confocal Images of 3D PS scaffold (Alvetex®). Z-stack images were recorded on a Zeiss LSM710 confocal
microscope with ZEN 2009 software. Left: maximum projection image of the 3D PS scaffold, middle: topography of 3D PS
scaffold, right: 3D PS scaffold with incubated PBMCs stained for CD4+ T (red) and CD14
+ monocytes (green) using
fluorophore-conjugated antibodies. The 3D PS scaffold was autofluorescent and could therefore be visualized without
staining the scaffold.
Left image illustrate the architecture of the 3D PS scaffold by autoflorescence and the middle image
show the topography of the scaffold. Right image illustrates the scaffold with cultured PBMCs stained
for CD4 (red) and CD14 (green), to show CD4+ T lymphocytes and monocytes, respectively. Due to
bleaching it was not possible to obtain good-quality images/movies for visualization of possible T
lymphocyte migration within the 3D scaffolds. Migration on 2D surfaces (glass slide) was visualized
and an example is shown in Figure 16.
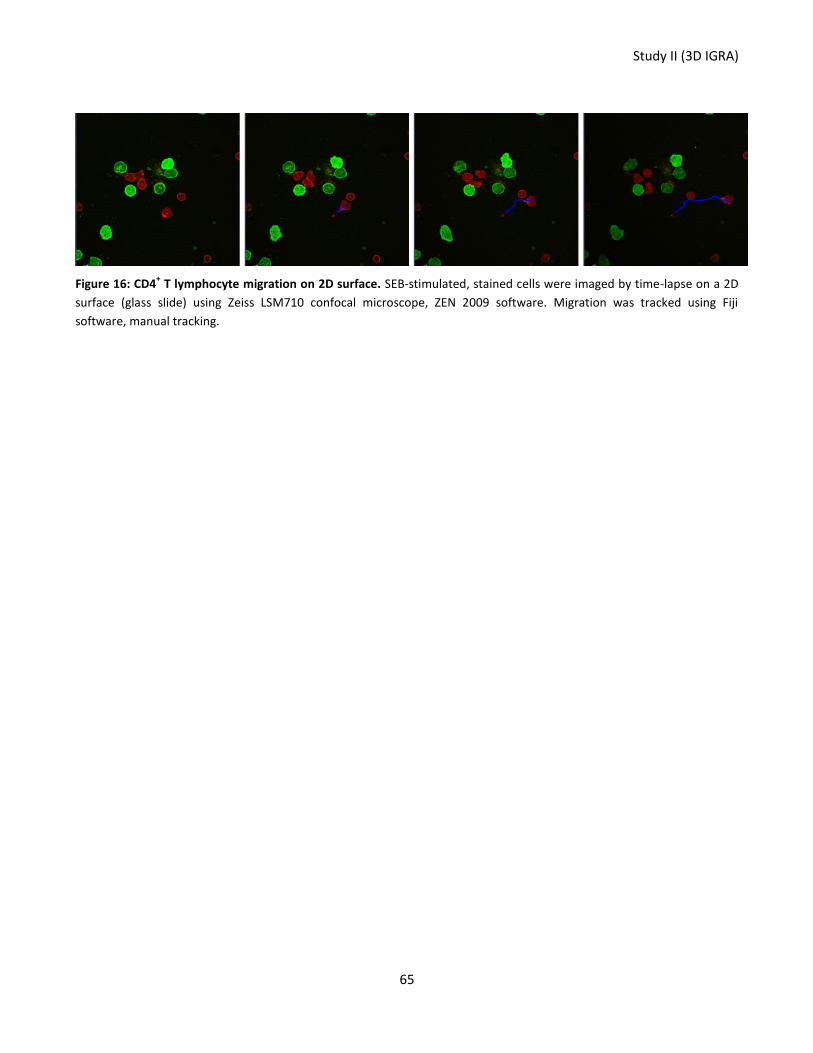
Study II (3D IGRA)
65
Figure 16: CD4+ T lymphocyte migration on 2D surface. SEB-stimulated, stained cells were imaged by time-lapse on a 2D
surface (glass slide) using Zeiss LSM710 confocal microscope, ZEN 2009 software. Migration was tracked using Fiji
software, manual tracking.
66
Chapter 5 - Study III (chip prototype)
5.1 Introduction
The miniaturization of tests and assays usually performed in the lab was first described in 1975 when
C.S Terry designed a miniaturized analytical device for gas chromatography as part of his PhD
dissertation (Terry 1975). Fifteen years later, in 1990, Manz and colleagues created the term “micro
total analysis system” or “µTAS” (Manz et al. 1990) and this was the beginning of the lab-on-a-chip
renaissance (Berthier et al. 2012). The idea with lab-on-a-chip is the integration of one or several
laboratory functions on a single chip. This has several advantages such as reduced sample and reagent
consumption, less sample handling and shorter analysis time (Menegatti et al. 2013). Developing a
fast and low-cost method for detection of diseases (or indirectly by detection of immune responses
against certain pathogenic microorganisms) would be desirable for the diagnostic of diseases in low-
income countries or where a one-time visit to the medical clinic would ease the logistics and result in
higher treatment rates and thus prevention of disease spreading.
5.2 Hypothesis
In this study, a low-cost microfluidic diagnostic chip was sought developed. The chip would combine
an optimized 3D cell chamber, facilitating cell migration and thus cell-cell contact and activation with
detection of IFN-γ or IP10 mRNA by direct blood qRT-PCR as a readout. The idea was that this lab-on-
a-chip device could diagnose the presence of a CMI response against intracellular pathogens (such as
Mycobacterium tuberculosis in humans) within the same day of blood sampling. It would thus be a
fast and cheap diagnostic solution ideal for developing countries where tuberculosis represents a
major cause of death.
5.3 Results
A thorough novelty search was conducted at the beginning of the study, concluding that no similar
invention had previously been described (as per February 2012); see the Novelty Search Report in
appendix 3. The practical work was split into three parts: (1) chip design and fabrication, involving the
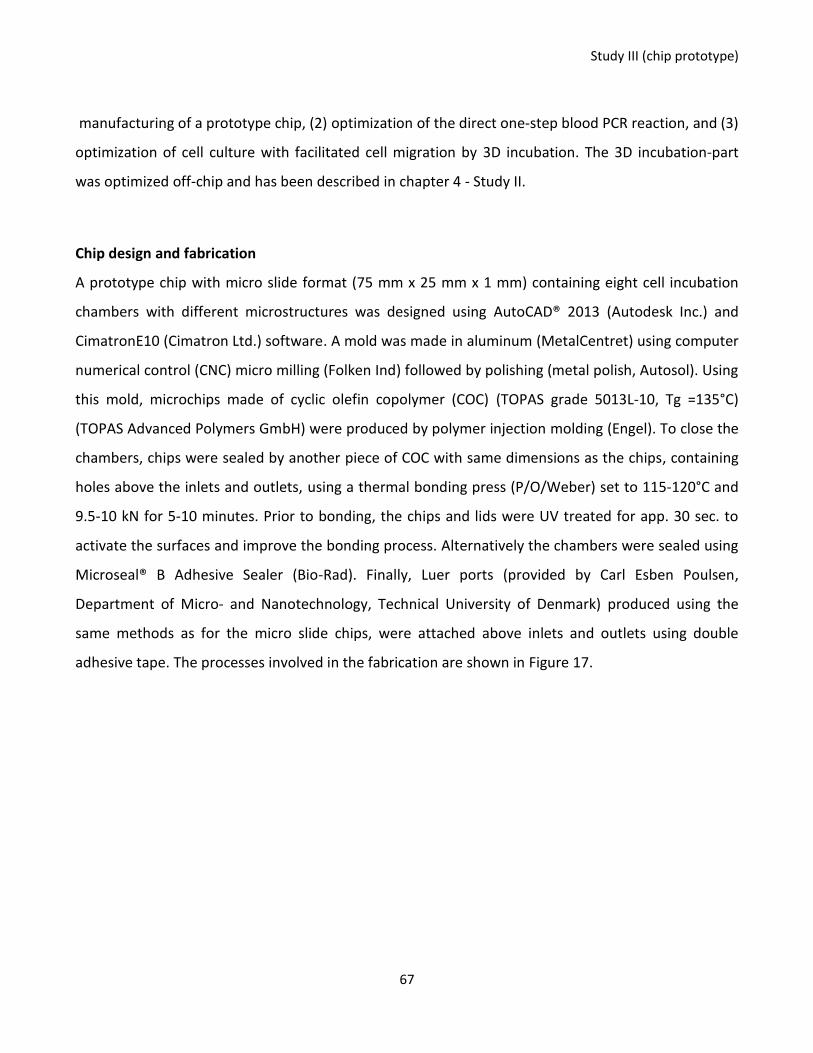
Study III (chip prototype)
67
manufacturing of a prototype chip, (2) optimization of the direct one-step blood PCR reaction, and (3)
optimization of cell culture with facilitated cell migration by 3D incubation. The 3D incubation-part
was optimized off-chip and has been described in chapter 4 - Study II.
Chip design and fabrication
A prototype chip with micro slide format (75 mm x 25 mm x 1 mm) containing eight cell incubation
chambers with different microstructures was designed using AutoCAD® 2013 (Autodesk Inc.) and
CimatronE10 (Cimatron Ltd.) software. A mold was made in aluminum (MetalCentret) using computer
numerical control (CNC) micro milling (Folken Ind) followed by polishing (metal polish, Autosol). Using
this mold, microchips made of cyclic olefin copolymer (COC) (TOPAS grade 5013L-10, Tg =135°C)
(TOPAS Advanced Polymers GmbH) were produced by polymer injection molding (Engel). To close the
chambers, chips were sealed by another piece of COC with same dimensions as the chips, containing
holes above the inlets and outlets, using a thermal bonding press (P/O/Weber) set to 115-120°C and
9.5-10 kN for 5-10 minutes. Prior to bonding, the chips and lids were UV treated for app. 30 sec. to
activate the surfaces and improve the bonding process. Alternatively the chambers were sealed using
Microseal® B Adhesive Sealer (Bio-Rad). Finally, Luer ports (provided by Carl Esben Poulsen,
Department of Micro- and Nanotechnology, Technical University of Denmark) produced using the
same methods as for the micro slide chips, were attached above inlets and outlets using double
adhesive tape. The processes involved in the fabrication are shown in Figure 17.
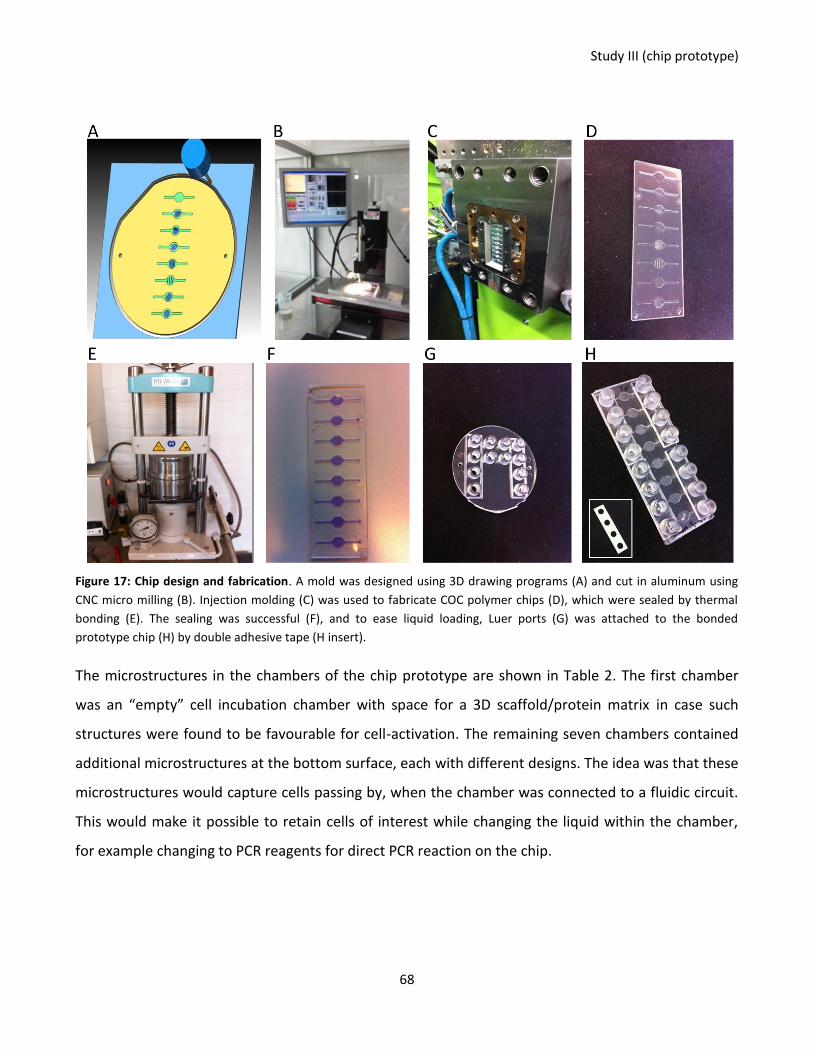
Study III (chip prototype)
68
Figure 17: Chip design and fabrication. A mold was designed using 3D drawing programs (A) and cut in aluminum using
CNC micro milling (B). Injection molding (C) was used to fabricate COC polymer chips (D), which were sealed by thermal
bonding (E). The sealing was successful (F), and to ease liquid loading, Luer ports (G) was attached to the bonded
prototype chip (H) by double adhesive tape (H insert).
The microstructures in the chambers of the chip prototype are shown in Table 2. The first chamber
was an “empty” cell incubation chamber with space for a 3D scaffold/protein matrix in case such
structures were found to be favourable for cell-activation. The remaining seven chambers contained
additional microstructures at the bottom surface, each with different designs. The idea was that these
microstructures would capture cells passing by, when the chamber was connected to a fluidic circuit.
This would make it possible to retain cells of interest while changing the liquid within the chamber,
for example changing to PCR reagents for direct PCR reaction on the chip.
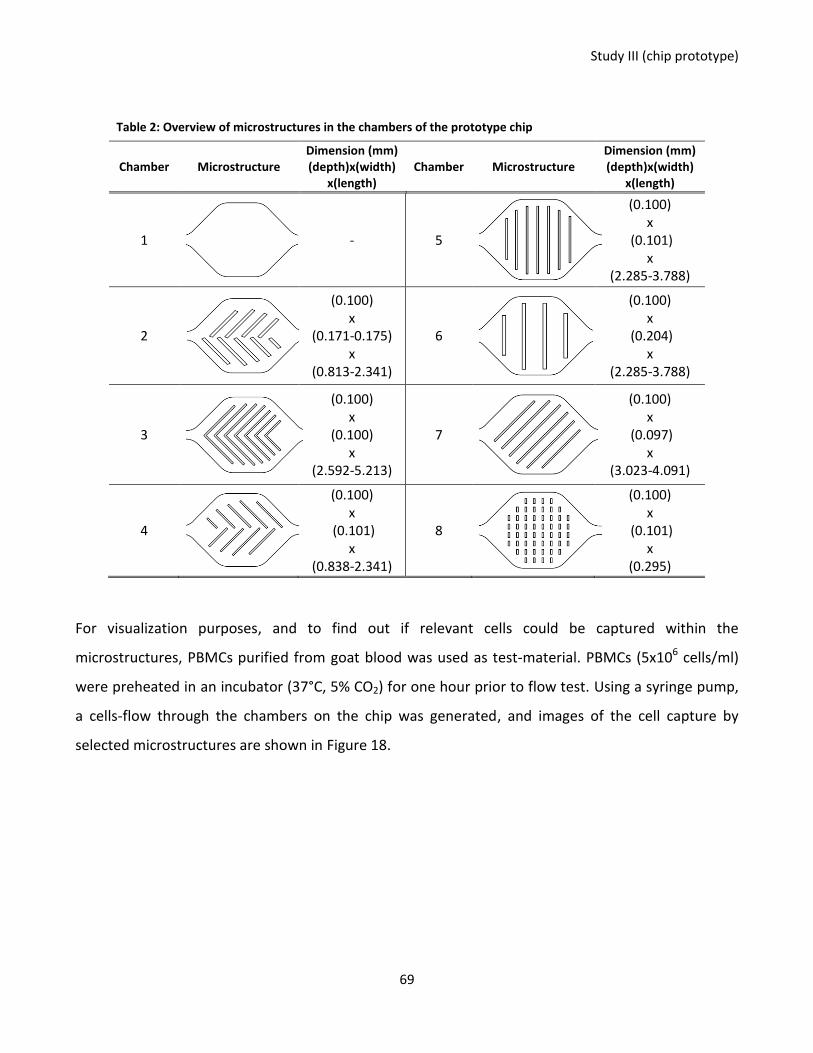
Study III (chip prototype)
69
Table 2: Overview of microstructures in the chambers of the prototype chip
Chamber Microstructure Dimension (mm) (depth)x(width)
x(length) Chamber Microstructure
Dimension (mm) (depth)x(width)
x(length)
1
- 5
(0.100) x
(0.101) x
(2.285-3.788)
2
(0.100) x
(0.171-0.175) x
(0.813-2.341)
6
(0.100) x
(0.204) x
(2.285-3.788)
3
(0.100) x
(0.100) x
(2.592-5.213)
7
(0.100) x
(0.097) x
(3.023-4.091)
4
(0.100) x
(0.101) x
(0.838-2.341)
8
(0.100) x
(0.101) x
(0.295)
For visualization purposes, and to find out if relevant cells could be captured within the
microstructures, PBMCs purified from goat blood was used as test-material. PBMCs (5x10⁶ cells/ml)
were preheated in an incubator (37°C, 5% CO2) for one hour prior to flow test. Using a syringe pump,
a cells-flow through the chambers on the chip was generated, and images of the cell capture by
selected microstructures are shown in Figure 18.
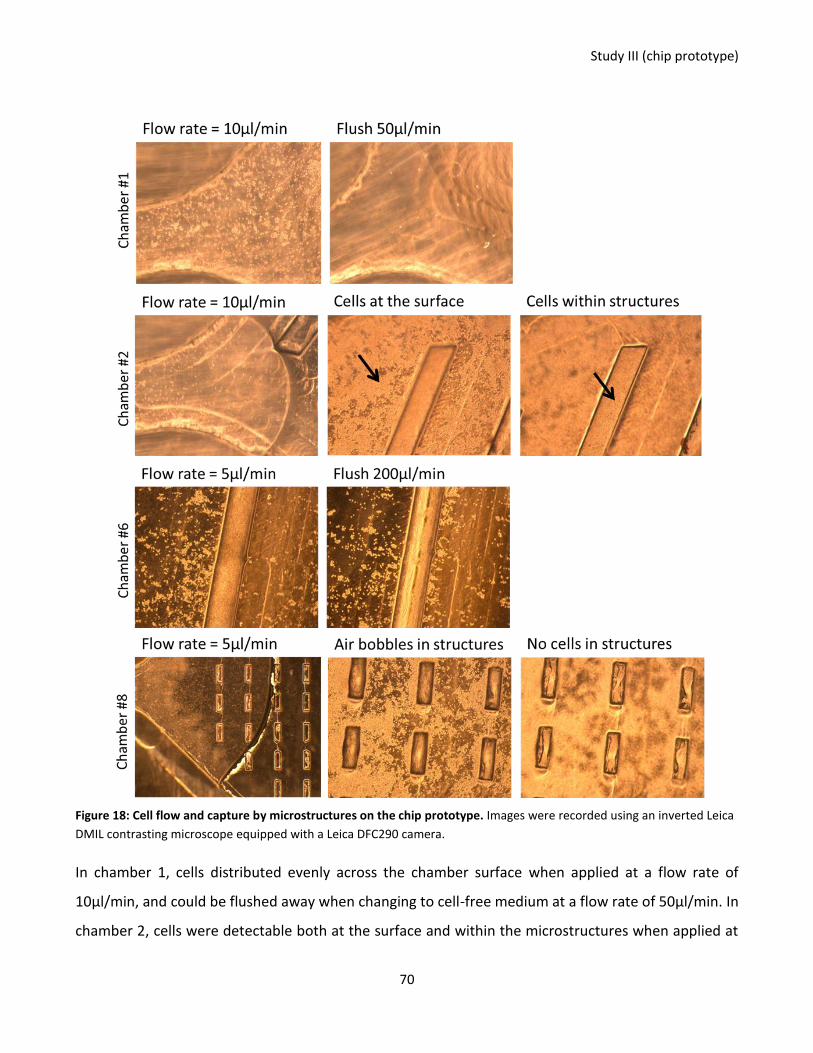
Study III (chip prototype)
70
Figure 18: Cell flow and capture by microstructures on the chip prototype. Images were recorded using an inverted Leica
DMIL contrasting microscope equipped with a Leica DFC290 camera.
In chamber 1, cells distributed evenly across the chamber surface when applied at a flow rate of
10µl/min, and could be flushed away when changing to cell-free medium at a flow rate of 50µl/min. In
chamber 2, cells were detectable both at the surface and within the microstructures when applied at
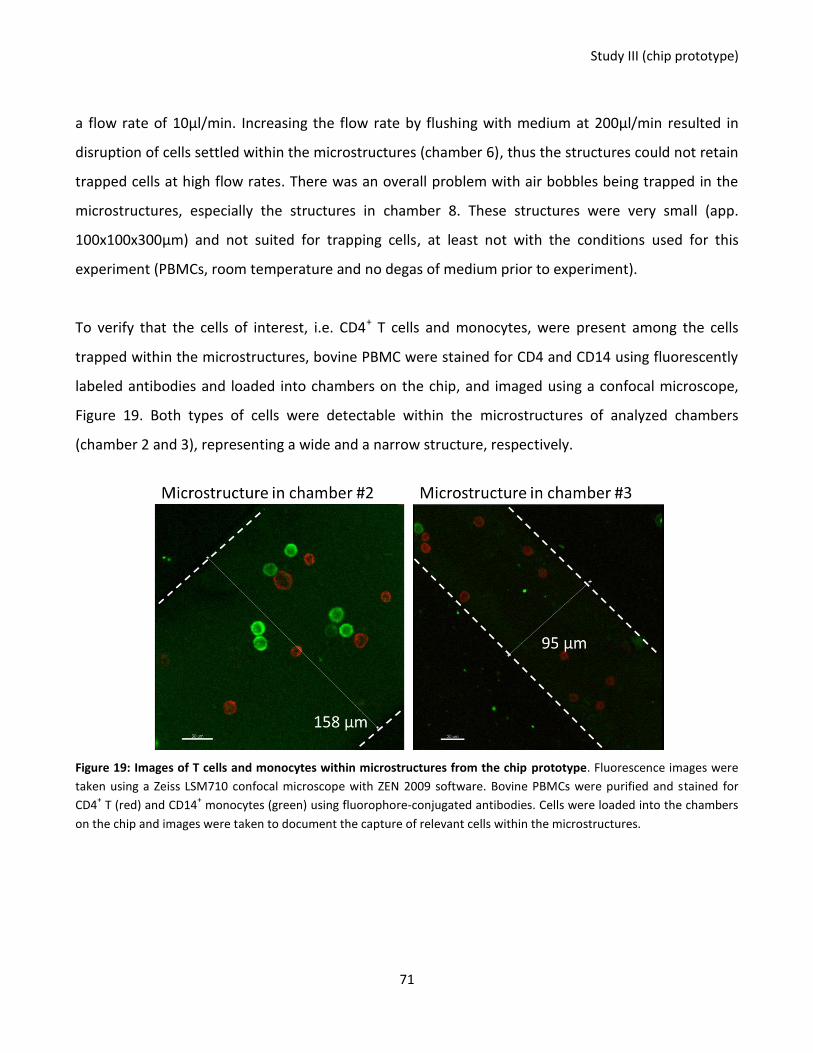
Study III (chip prototype)
71
a flow rate of 10µl/min. Increasing the flow rate by flushing with medium at 200µl/min resulted in
disruption of cells settled within the microstructures (chamber 6), thus the structures could not retain
trapped cells at high flow rates. There was an overall problem with air bobbles being trapped in the
microstructures, especially the structures in chamber 8. These structures were very small (app.
100x100x300µm) and not suited for trapping cells, at least not with the conditions used for this
experiment (PBMCs, room temperature and no degas of medium prior to experiment).
To verify that the cells of interest, i.e. CD4+ T cells and monocytes, were present among the cells
trapped within the microstructures, bovine PBMC were stained for CD4 and CD14 using fluorescently
labeled antibodies and loaded into chambers on the chip, and imaged using a confocal microscope,
Figure 19. Both types of cells were detectable within the microstructures of analyzed chambers
(chamber 2 and 3), representing a wide and a narrow structure, respectively.
Figure 19: Images of T cells and monocytes within microstructures from the chip prototype. Fluorescence images were
taken using a Zeiss LSM710 confocal microscope with ZEN 2009 software. Bovine PBMCs were purified and stained for
CD4+ T (red) and CD14
+ monocytes (green) using fluorophore-conjugated antibodies. Cells were loaded into the chambers
on the chip and images were taken to document the capture of relevant cells within the microstructures.
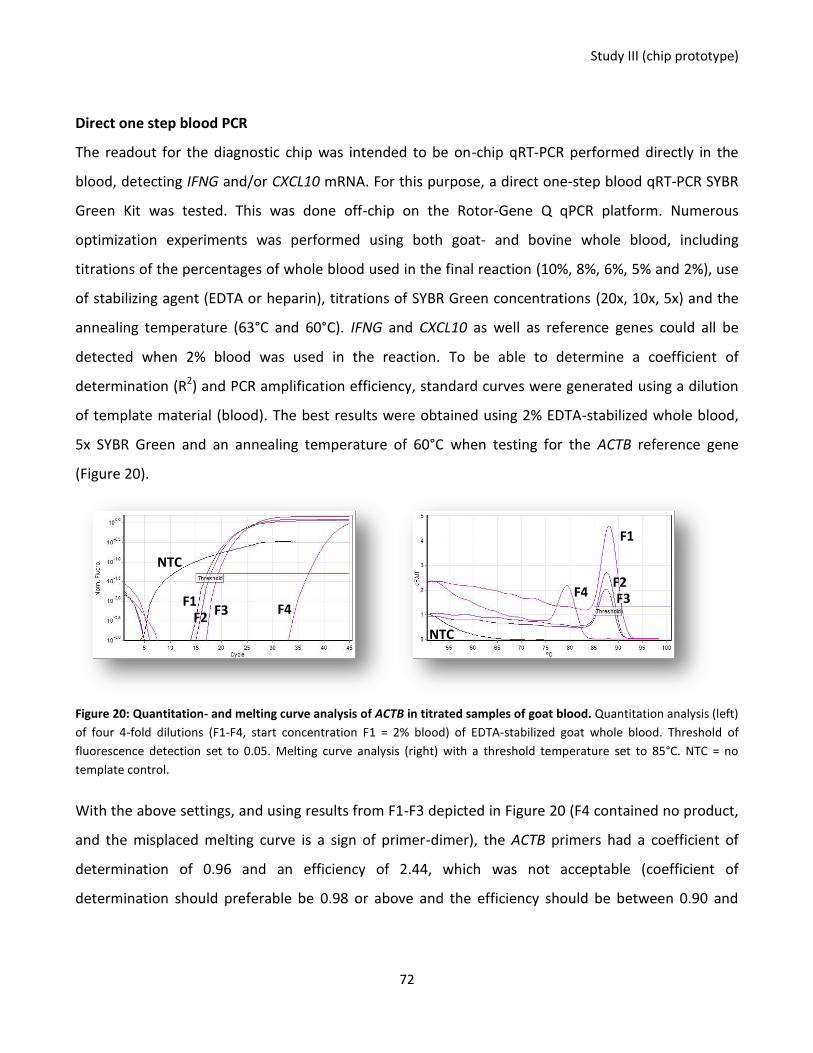
Study III (chip prototype)
72
Direct one step blood PCR
The readout for the diagnostic chip was intended to be on-chip qRT-PCR performed directly in the
blood, detecting IFNG and/or CXCL10 mRNA. For this purpose, a direct one-step blood qRT-PCR SYBR
Green Kit was tested. This was done off-chip on the Rotor-Gene Q qPCR platform. Numerous
optimization experiments was performed using both goat- and bovine whole blood, including
titrations of the percentages of whole blood used in the final reaction (10%, 8%, 6%, 5% and 2%), use
of stabilizing agent (EDTA or heparin), titrations of SYBR Green concentrations (20x, 10x, 5x) and the
annealing temperature (63°C and 60°C). IFNG and CXCL10 as well as reference genes could all be
detected when 2% blood was used in the reaction. To be able to determine a coefficient of
determination (R2) and PCR amplification efficiency, standard curves were generated using a dilution
of template material (blood). The best results were obtained using 2% EDTA-stabilized whole blood,
5x SYBR Green and an annealing temperature of 60°C when testing for the ACTB reference gene
(Figure 20).
Figure 20: Quantitation- and melting curve analysis of ACTB in titrated samples of goat blood. Quantitation analysis (left)
of four 4-fold dilutions (F1-F4, start concentration F1 = 2% blood) of EDTA-stabilized goat whole blood. Threshold of
fluorescence detection set to 0.05. Melting curve analysis (right) with a threshold temperature set to 85°C. NTC = no
template control.
With the above settings, and using results from F1-F3 depicted in Figure 20 (F4 contained no product,
and the misplaced melting curve is a sign of primer-dimer), the ACTB primers had a coefficient of
determination of 0.96 and an efficiency of 2.44, which was not acceptable (coefficient of
determination should preferable be 0.98 or above and the efficiency should be between 0.90 and
F1
F2 F3 F4
F1 F2
F3 F4
NTC
NTC

Study III (chip prototype)
73
1.10). Therefore, additional optimization was necessary, but due to time limitations this was not
pursued.
74
Chapter 6 - Study IIII (differentiation of moDC)
6.1 Introduction
The use of monocytes as DC precursors has been an attractive approach in the attempt to generate
competent APCs able to induce anti-cancer responses via immunotherapy. Immunotherapy has
advantages over traditional cancer treatments such as chemotherapy, including no or few side effects
(Janikashvili et al. 2010) and the treatment is personalized (DCs are loaded with antigens originating
from the patient’s own tumor). It is known that during cancer, DCs are negatively influenced by the
microenvironment and are not able to mature properly, resulting in poor induction of tumor-targeting
T lymphocytes (Barbuto 2013). Therefore, it is believed that the generation of DCs outside this
environment (i.e. by in vitro culture) would increase the functionality of the cells. A large number of
monocytes can be obtained relatively easy via blood and they can be loaded with tumor antigen
(Barbuto 2013). Despite this, the generation of effective immunotherapy for the treatment of cancer
patients using moDCs has not been very successful as moDC-based vaccines have not been able to
induce durable anti-cancer immunity, reviewed in (Wimmers et al. 2014). In addition, functionally
biased moDCs generating regulatory T cell responses in vitro has been reported (Ramos et al. 2012).
Therefore, optimization of the moDC differentiation protocol is needed.
6.2 Hypothesis
DCs act as cellular sensors and are able to respond to external stimuli coming from complex cellular
and molecular signals from their surroundings (Palucka & Banchereau 2012). In relation to this, it was
hypothesized that changing the surface material and architecture of cultures used for porcine moDC
differentiation would influence the gene expression profile of the cells, as the cell-to-surface and cell-
to-cell contact would be changed.
6.3 Results
Enrichment of monocytes was performed by positive selection of CD172a+ cells from PBMC using
magnetic separation technology (Miltenyi Biotec). The purity of the monocytes was measured by flow
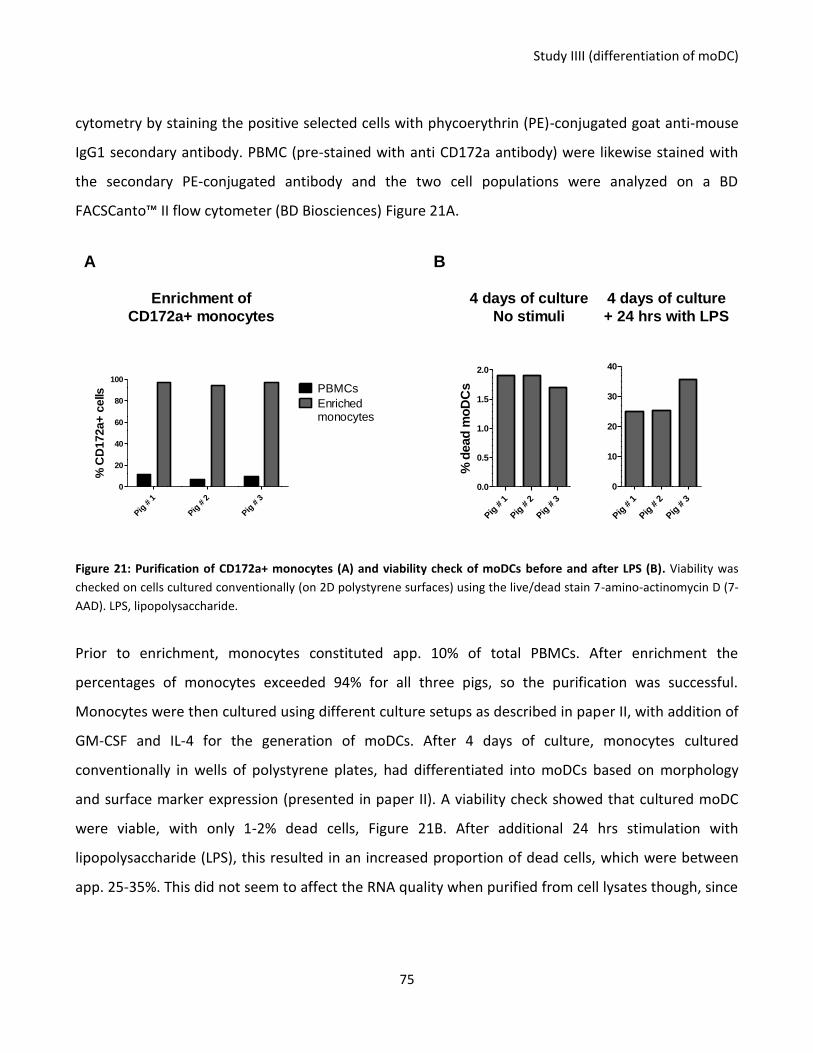
Study IIII (differentiation of moDC)
75
cytometry by staining the positive selected cells with phycoerythrin (PE)-conjugated goat anti-mouse
IgG1 secondary antibody. PBMC (pre-stained with anti CD172a antibody) were likewise stained with
the secondary PE-conjugated antibody and the two cell populations were analyzed on a BD
FACSCanto™ II flow cytometer (BD Biosciences) Figure 21A.
Pig
# 1
Pig
# 2
Pig
# 3
0
20
40
60
80
100
PBMCs
Enrichedmonocytes
% C
D172a+
cells
Pig
# 1
Pig
# 2
Pig
# 3
0.0
0.5
1.0
1.5
2.0
% d
ead
mo
DC
s
Pig
# 1
Pig
# 2
Pig
# 3
0
10
20
30
40
4 days of culture
No stimuli
4 days of culture
+ 24 hrs with LPS
Enrichment of
CD172a+ monocytes
A B
Figure 21: Purification of CD172a+ monocytes (A) and viability check of moDCs before and after LPS (B). Viability was
checked on cells cultured conventionally (on 2D polystyrene surfaces) using the live/dead stain 7-amino-actinomycin D (7-
AAD). LPS, lipopolysaccharide.
Prior to enrichment, monocytes constituted app. 10% of total PBMCs. After enrichment the
percentages of monocytes exceeded 94% for all three pigs, so the purification was successful.
Monocytes were then cultured using different culture setups as described in paper II, with addition of
GM-CSF and IL-4 for the generation of moDCs. After 4 days of culture, monocytes cultured
conventionally in wells of polystyrene plates, had differentiated into moDCs based on morphology
and surface marker expression (presented in paper II). A viability check showed that cultured moDC
were viable, with only 1-2% dead cells, Figure 21B. After additional 24 hrs stimulation with
lipopolysaccharide (LPS), this resulted in an increased proportion of dead cells, which were between
app. 25-35%. This did not seem to affect the RNA quality when purified from cell lysates though, since

Study IIII (differentiation of moDC)
76
this was found to be very high. The effect of culturing monocytes using different culture setups are
presented in paper II.
77
Paper II
Investigating the role of surface materials and three dimensional architecture on in
vitro differentiation of porcine monocyte-derived dendritic cells
Sofie Bruun Hartmanna, Soumyaranjan Mohantyb, Kerstin Skovgaarda, Louise Brogaarda, Frederikke
Bjergvang Flagstada, Jenny Emnéusb, Anders Wolffb, Artur Summerfieldc and Gregers Jungersena#
a National Veterinary Institute, Technical University of Denmark, Frederiksberg C, Denmark,
b Department of Micro- and Nanotechnology, Technical University of Denmark, Kgs. Lyngby, Denmark,
c Institute of Virology and Immunology (IVI), Mittelhäusern, Switzerland
# Corresponding author
Manuscript submitted to PLOS ONE
In this study we investigate the effect of culture conditions when generating porcine monocyte-
derived dendritic cells (moDC) in vitro. We compare traditional polystyrene (PS) culture surface
material with an untraditional culture surface made from polydimethylsiloxane (PDMS), a material
frequently used for lab-on-a-chip device fabrication. Additionally, we examine the effect on moDC
when cultured on three-dimensional scaffolds compared to two dimensional surfaces. Interestingly,
we were able to show that both the culture surface material (PS vs. PDMS) as well as the dimension
(2D vs. 3D) resulted in changes in gene expression. PDMS generated cells with a macrophage-like
phenotype and 3D cultures had a positive effect on the activation profile of the cells. With this study,
we show how sensitive moDCs are to their surrounding environment and that it is possible to
modulate the gene expression of these cells simply by changing the culture material and architecture.
Paper II
78
Abstract
In vitro generation of dendritic-like cells through differentiation of peripheral blood monocytes is
typically done using two-dimensional polystyrene culture plates. In the process of optimizing cell
culture techniques, engineers have developed fluidic micro-devises usually manufactured in materials
other than polystyrene and applying three-dimensional structures more similar to the in vivo
environment. Polydimethylsiloxane (PDMS) is an often used polymer for lab-on-a-chip devices but not
much is known about the effect of changing the culture surface material from polystyrene to PDMS.
In the present study the differentiation of porcine monocytes to monocyte-derived dendritic cells
(moDCs) was investigated using CD172apos pig blood monocytes stimulated with GM-CSF and IL-4.
Monocytes were cultured on surfaces made of two- and three-dimensional polystyrene as well as
two- and three-dimensional PDMS and carbonized three-dimensional PDMS. Cells cultured
conventionally (on two-dimensional polystyrene) differentiated into moDCs as expected.
Interestingly, gene expression of a wide range of cytokines, chemokines, and pattern recognition
receptors was influenced by culture surface material and architecture. Distinct clustering of cells,
based on similar expression patterns of 46 genes of interest, was seen for cells isolated from two- and
three-dimensional polystyrene as well as two- and three-dimensional PDMS. Changing the material
from polystyrene to PDMS resulted in cells with macrophage-like characteristics. When changing to
three-dimensional culture the cells became more activated in terms of IL6, IL8, IL10 and CCR5 gene
expression. Further stimulation with LPS resulted in a slight increase in the expression of maturation
markers (SLA-DRB1, CD86 and CD40) as well as cytokines (IL6, IL8, IL10 and IL23A) but the influence of
the surfaces was unchanged. These findings highlights future challenges of combining and comparing
data generated from microfluidic cell culture-devices made using alternative materials to data
generated using conventional polystyrene plates used by most laboratories today.
1. Introduction
Dendritic cells (DCs) are a heterogenic group of antigen presenting cells important for induction of
immunological responses. In vitro generation of DCs is a technique that has been practiced for
decades (1). It can be difficult to harvest sufficient quantities of DCs for characterization and study,
Paper II
79
and therefore in vitro generated monocyte-derived dendritic cells (moDCs) have been used as an
alternative. With this technique peripheral blood mononuclear cells (PBMCs) are harvested, and
monocytes isolated and cultured with growth factors, such as granulocyte macrophage colony-
stimulating factor (GM-CSF) and interleukin 4 (IL-4) (2). With the central role of DCs as immune
modulators and with the observation that cancer patients have DCs with reduced capacity to initiate
efficient Th1 immune responses (3,4), controlling the differentiation of DCs may result in generation
of cells able to activate in vivo immune responses against antigenic targets that otherwise are not
recognized as immunogenic. An example of this is Provenge® (Sipuleucel-T), an FDA registered
immunotherapy treatment for prostate cancer (5). Thus, in vitro culture systems for controlled DC
maturation, differentiation and immune priming hold promise for activation or deactivation of the
immune system against antigenic targets which are inaccessible with current immunization protocols.
In the present study, the pig was used as monocyte donor. The reason this animal was chosen
was because of the increasing interest in using porcine models for human diseases. The number of
research groups working with the porcine model has been steadily expanding for the last 50 years as
judged by the number of publications in PubMed within this area. Advantages using the pig over
rodents as animal models for human diseases have been summarized in (6) and includes comparable
organ size, large number of cells that can be harvested repeatedly, and blood physiology being similar
to humans. The porcine immune system also resembles the human immune system with respect to
toll-like receptors (TLR) and DC biology (7). Porcine DCs have been characterized in several studies (8–
14), and much information is already available making the use of this animal as a model for in vitro DC
differentiation more attractive.
Today most in vitro cell studies and cultures are performed using standard flat-bottom
polystyrene (PS) culture plates/flasks. This however, constitutes a very non-physiological environment
for the cells to grow in and therefore new three dimensional (3D) culture-systems for mammalian
cells are gaining increasing interest. Cells cultured in a 3D environment, are largely thought to behave
more like in vivo compared to cells cultured on a two dimensional (2D) surface, thus making data on
Paper II
80
gene expression, motility and activity more reliable and comparable to in vivo settings (reviewed in
(15,16)).
An emerging field within the cell culture area is the use of fabricated micro devices for the
study of cells or tissues. By the use of microfluidics, these lab-on-a-chip devices allows for the study of
cells using only a small fraction of reagents, and cell analysis can be performed directly in the chip
(17). However, these devises are typically not produced in PS due to difficulties of production,
including challenges associated with bonding of thermoplastic materials and production of molds
capable of resisting high temperatures and pressures used in hot embossing processes (18).
Alternative polymers with properties suitable for e.g. soft lithography are preferably used. One of
these polymers often used is polydimethylsiloxane (PDMS) (19). Since most reported in vitro results
on cell activity/behavior originates from cells cultured on PS surfaces, not much is known about the
effect of changing the culture surface material from PS to other materials more frequently used
within micro devise fabrication.
However, a few studies do exist, and it has previously been reported that PDMS affects the
gene expression of adrenal phaeochromocytoma (PC12) cells (20). The authors found that when cells
were cultured on polymethyl methacrylate (PMMA) 6 genes were up-regulated and 35 were down-
regulated compared to cells cultured on a PS surface. By contrast, when cells were cultured on a
perforated PMMA surface with a PDMS layer underneath 642 genes were up-regulated and 35 were
down-regulated compared to cells cultured on PS. They conclude that PDMS opposed to PMMA has a
major impact on the gene expression of PC12 cells. Many of the genes differently expressed in the
PC12 cells were involved in neuronal cell development and function and so it would be interesting to
find out if PDMS had a similar effect on the differentiation of porcine dendritic cells, thus giving rise to
cells with a more differentiated and activated phenotype. Therefore, in the present study the
differentiation of monocytes to moDCs was investigated using CD172apos pig blood monocytes
stimulated 4 days with GM-CSF and IL-4 followed by 24 hr activation with lipopolysaccharide (LPS).
Monocytes were cultured on PS, PDMS and a pyrolysed (carbonized) form of PDMS (21). Additionally,
2D culture surfaces were compared with 3D scaffolding variants. The purpose of this study was to
Paper II
81
explore possible changes in gene expression of moDCs when generated on alternative culture
surfaces, including materials preferably used for fabrication of micro devices, and 3D vs. 2D
architecture.
2. Materials and methods
2.1. Isolation of PBMCs
Fresh, heparinized whole blood was collected from three 7-8 weeks old pigs (Yorkshire-Landrace x
Duroc crossing) housed at the animal facility at The Veterinary Institute, Technical University of
Denmark. PBMCs were isolated using Ficoll-Paque™ Plus (GE Healthcare) and following two washes,
cells were counted using an automated cell counter (Nucleocounter® NC-200™, ChemoMetec) and
diluted in RPMI 1640 medium with GlutaMAX™ (Gibco, Life Technologies™) containing 10% heat
inactivated fetal calf serum (FCS). Animals were kept and sampled under approval by The National
Animal Experiments Inspectorate.
2.2. Monocyte enrichment
Enrichment of CD172a (SWC3) positive monocytes was done using the MACS magnetic separation
technology (Miltenyi Biotec). Briefly, PBMCs were resuspended in MACS buffer (PBS/5xEDTA/1%FCS)
and labelled with mouse anti-porcine CD172a IgG1 (clone 74-22-15) at 5.5 µg/106 target cells. After 20
min incubation on ice followed by two washes, MACS magnetic anti-mouse IgG microbeads was
added (2 µl/106 target cells) and cells were incubated on ice for 15 min and washed twice. The
CD172a positive cells were purified using equilibrated LS columns placed in a magnet on a MACS
multistand. The positive fraction was collected, washed, counted and resuspended in complete cell
culture medium (see below). The purity was confirmed by incubating with phycoerythrin (PE)-
conjugated goat anti-mouse IgG1 secondary antibody (Southern Biotechnology) followed by analysis
on a BD FACSCanto™ II flow cytometer (BD Biosciences, USA) and was found to be above 94% (data
not shown).
Paper II
82
2.3. Preparation of cell culture surfaces
The five different surfaces tested in the present experiment are listed in table 1. Microtiter plates
were from Corning Scientific and were either in 6-well (cat# 3516) or 24-well (cat# 3526) format for
the 2D and 3D incubations, respectively. They were made in polystyrene, thus empty well on the 6-
well plates represented 2D PS surfaces (control). The 3D PS surfaces were made by placing a porous
polystyrene 3D scaffold, Alvetex® (Reinnervate) in the bottom of the wells in 24-well plates. For the
2D PDMS surface, PDMS pre-polymer was mixed with a curing agent (10:1, w/w) according to the
manufacturer’s instructions (Sylgard® 184, Dow Corning Corporation) and poured in a thin layer into
the wells of 6 well plates followed by curing in an oven at 60°C for 4 hours.
The random pore 3D PDMS scaffolds were fabricated using particle leaching technique as
described previously (22,23) (Fig. 1). Briefly, 10 gram of sugar crystals of size ranging from 300-600µm
(Sigma-Aldrich) was mixed with 1ml of water on a 100 mm Petri dish. The mixture was placed in an
oven at 60°C to generate interconnections between the sugar crystals and to evaporate the excess
water. The hardened sugar cube was cooled at room temperature. The PDMS pre-polymer was mixed
with a curing agent (10:1, w/w) and poured into the Petri dish containing the sugar cube. The PDMS
covered sugar cube was placed in a vacuum desiccator for one hour to let the PDMS infiltrate into the
pores of the sugar cube. The PDMS was cured in an oven at 60 °C for 4-6 hours. The sugar particles
were then dissolved by soaking in water for 4 hours. After dissolving, random micro-porous 3D PDMS
scaffolds were cut to cylinders having a diameter of 6 mm and a height of 5 mm, fitting into wells of
24-well plates, using biopsy punches. Both the 2D PDMS surface and the 3D PDMS scaffolds were
treated with oxygen plasma (125 W, 13.5 MHz, 50 sccm, and 40 millitorr) to render their surface
hydrophilic and sterilized by autoclaving.
The pyrolysed 3D PDMS scaffolds were made by pyrolysing the 3D PDMS scaffolds made by
square sugar cubes in a furnace at 900°C for one hour in N2 atmosphere, resulting in highly porous
and hydrophilic square 3D carbonized scaffolds (21). The morphology and microstructure of PDMS
and carbonized PDMS porous scaffolds were examined using scanning electron microscopy (SEM)
(JEOL Ltd.). Prior to SEM analysis scaffolds were dried in an oven at 60°C overnight and sputter coated
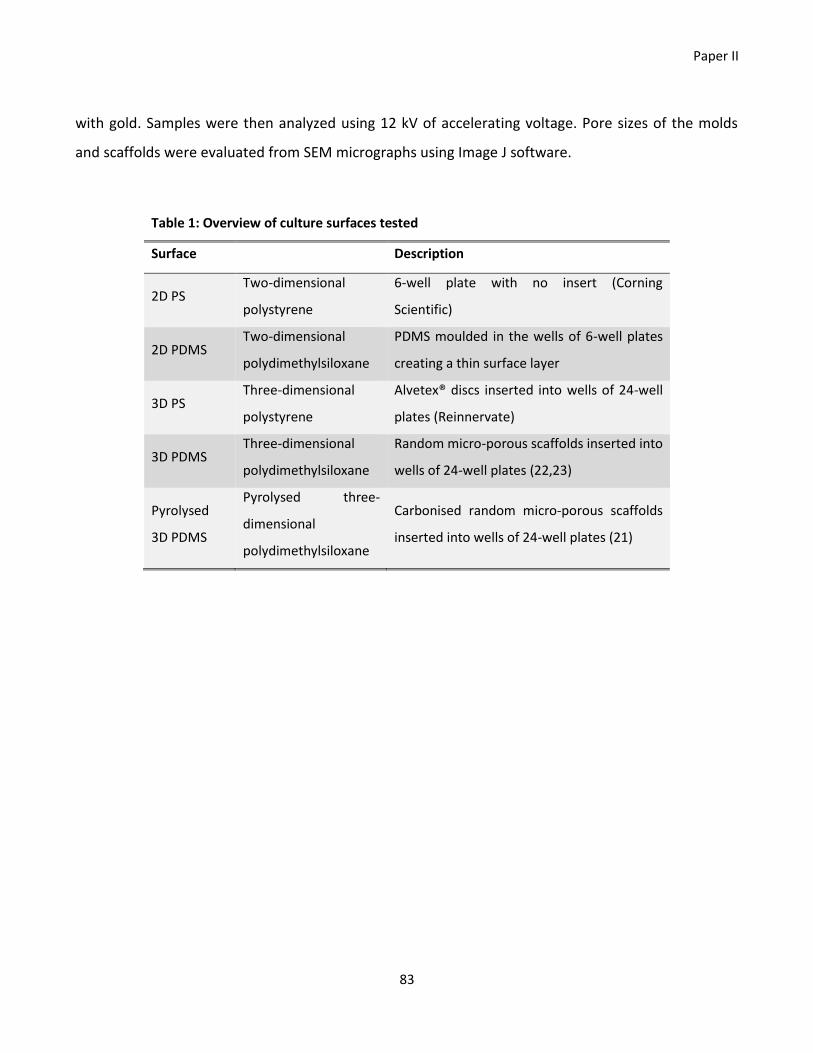
Paper II
83
with gold. Samples were then analyzed using 12 kV of accelerating voltage. Pore sizes of the molds
and scaffolds were evaluated from SEM micrographs using Image J software.
Table 1: Overview of culture surfaces tested
Surface Description
2D PS Two-dimensional
polystyrene
6-well plate with no insert (Corning
Scientific)
2D PDMS Two-dimensional
polydimethylsiloxane
PDMS moulded in the wells of 6-well plates
creating a thin surface layer
3D PS Three-dimensional
polystyrene
Alvetex® discs inserted into wells of 24-well
plates (Reinnervate)
3D PDMS Three-dimensional
polydimethylsiloxane
Random micro-porous scaffolds inserted into
wells of 24-well plates (22,23)
Pyrolysed
3D PDMS
Pyrolysed three-
dimensional
polydimethylsiloxane
Carbonised random micro-porous scaffolds
inserted into wells of 24-well plates (21)
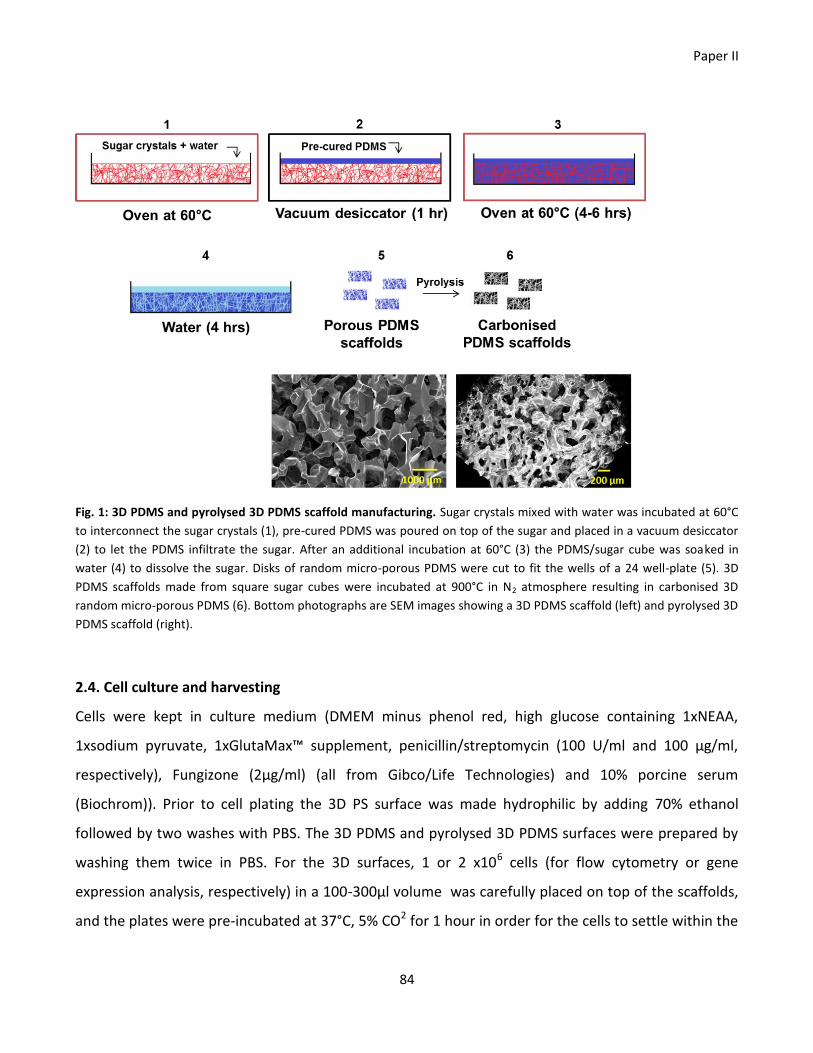
Paper II
84
Fig. 1: 3D PDMS and pyrolysed 3D PDMS scaffold manufacturing. Sugar crystals mixed with water was incubated at 60°C
to interconnect the sugar crystals (1), pre-cured PDMS was poured on top of the sugar and placed in a vacuum desiccator
(2) to let the PDMS infiltrate the sugar. After an additional incubation at 60°C (3) the PDMS/sugar cube was soaked in
water (4) to dissolve the sugar. Disks of random micro-porous PDMS were cut to fit the wells of a 24 well-plate (5). 3D
PDMS scaffolds made from square sugar cubes were incubated at 900°C in N2 atmosphere resulting in carbonised 3D
random micro-porous PDMS (6). Bottom photographs are SEM images showing a 3D PDMS scaffold (left) and pyrolysed 3D
PDMS scaffold (right).
2.4. Cell culture and harvesting
Cells were kept in culture medium (DMEM minus phenol red, high glucose containing 1xNEAA,
1xsodium pyruvate, 1xGlutaMax™ supplement, penicillin/streptomycin (100 U/ml and 100 µg/ml,
respectively), Fungizone (2µg/ml) (all from Gibco/Life Technologies) and 10% porcine serum
(Biochrom)). Prior to cell plating the 3D PS surface was made hydrophilic by adding 70% ethanol
followed by two washes with PBS. The 3D PDMS and pyrolysed 3D PDMS surfaces were prepared by
washing them twice in PBS. For the 3D surfaces, 1 or 2 x10⁶ cells (for flow cytometry or gene
expression analysis, respectively) in a 100-300µl volume was carefully placed on top of the scaffolds,
and the plates were pre-incubated at 37°C, 5% CO2 for 1 hour in order for the cells to settle within the
Paper II
85
scaffold. Media containing recombinant porcine GM-CSF and IL-4 (R&D Systems) at a final
concentration of 100 and 25ng/ml, respectively, was added to reach a final volume of 2ml per well.
Plating of cells on 2D surfaces was done similarly except for the 1 hour pre-incubation step. After
three days of incubation, additional 500µl of fresh medium containing GM-CSF and IL-4 was added to
all cultures. On day four, half of the cultures received 50µl of LPS (Sigma) at a final concentration of
1µg/ml and were incubated for additional 24 hours. After four days of incubation (five days for the
LPS stimulated cultures) cells were harvested by collecting the supernatant and adding ice-cold
PBS/5xEDTA to the wells followed by 15 min incubation on ice, shaking. The scaffolds from the 3D
cultures were placed in 15 ml tubes (the 3D PS scaffolds were placed in a pipette tip in a 15 ml tube),
1 ml ice-cold PBS/5xEDTA was added and tubes were centrifuged (5 min, 5°C, 500 x g). The cell
solution was pooled with the supernatant, centrifuged (5 min, 5°C, 500 x g) and resuspended in RLT
buffer (Qiagen) and stored at -80°C for later gene expression analysis or resuspended in FACS buffer
(see below) for characterization using flow cytometry. For visualization of cell morphology, moDCs
and monocytes (cultured in media with or without differentiating cytokines, respectively) cultured on
2D PS surfaces were inspected using an inverted Leica DMIL contrasting microscope equipped with a
Leica DFC290 camera (Leica Microsystems) at day 1, 4, and 5.
2.5. Flow cytometry
For characterization of surface marker expression, cells were stained and analyzed by flow cytometry.
Cells were distributed in 96-well plates and washed once in FACS buffer (PBS, 0.1% sodium azide, 1%
FCS) and incubated 20 min in the dark with 20µl primary antibodies or isotype controls in four
antibody cocktails, see table 2. Following three washes, cells were incubated 20 min in the dark with
20µl secondary antibodies, as listed in table 2. For compensation adjustments and viability check,
pooled cells were stained with either mouse anti-porcine CD172a IgG1 in combination with PE-, APC-
or FITC-conjugated anti-mouse IgG1 antibodies, biotin-conjugated CD152 (CTLA-4)-muIg in
combination with V450-conjugated streptavidin or the dead cell marker 7-aminoactinomycin D (7-
AAD) (Sigma-Aldrich). Cells were washed three times and resuspended in FACS sheath fluid containing
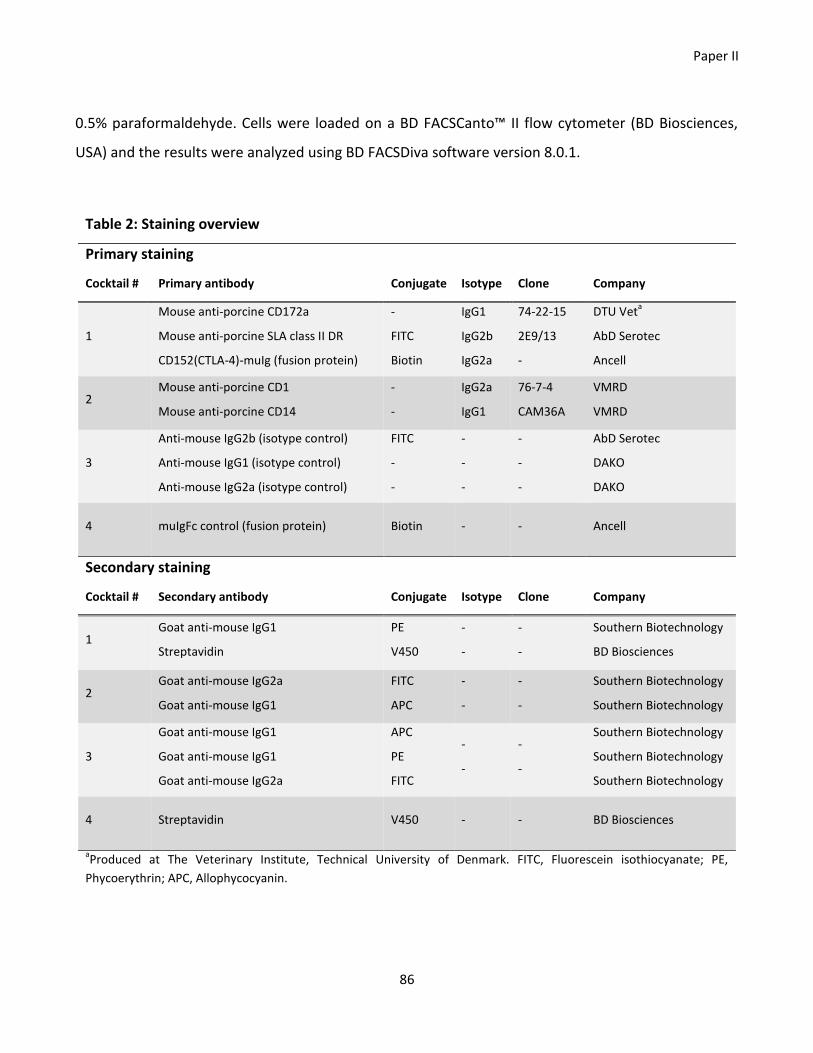
Paper II
86
0.5% paraformaldehyde. Cells were loaded on a BD FACSCanto™ II flow cytometer (BD Biosciences,
USA) and the results were analyzed using BD FACSDiva software version 8.0.1.
Table 2: Staining overview
Primary staining
Cocktail # Primary antibody Conjugate Isotype Clone Company
1
Mouse anti-porcine CD172a
Mouse anti-porcine SLA class II DR
CD152(CTLA-4)-muIg (fusion protein)
-
FITC
Biotin
IgG1
IgG2b
IgG2a
74-22-15
2E9/13
-
DTU Veta
AbD Serotec
Ancell
2 Mouse anti-porcine CD1
Mouse anti-porcine CD14
-
-
IgG2a
IgG1
76-7-4
CAM36A
VMRD
VMRD
3
Anti-mouse IgG2b (isotype control)
Anti-mouse IgG1 (isotype control)
Anti-mouse IgG2a (isotype control)
FITC
-
-
-
-
-
-
-
-
AbD Serotec
DAKO
DAKO
4 muIgFc control (fusion protein) Biotin - - Ancell
Secondary staining
Cocktail # Secondary antibody Conjugate Isotype Clone Company
1 Goat anti-mouse IgG1
Streptavidin
PE
V450
-
-
-
-
Southern Biotechnology
BD Biosciences
2 Goat anti-mouse IgG2a
Goat anti-mouse IgG1
FITC
APC
-
-
-
-
Southern Biotechnology
Southern Biotechnology
3
Goat anti-mouse IgG1
Goat anti-mouse IgG1
Goat anti-mouse IgG2a
APC
PE
FITC
-
-
-
-
Southern Biotechnology
Southern Biotechnology
Southern Biotechnology
4 Streptavidin V450 - - BD Biosciences
aProduced at The Veterinary Institute, Technical University of Denmark. FITC, Fluorescein isothiocyanate; PE,
Phycoerythrin; APC, Allophycocyanin.
Paper II
87
2.6. RNA extraction
Total RNA was purified from RLT-buffered cell lysates using the RNeasy Mini kit (Qiagen) including an
on-column DNase treatment (Qiagen) according to the manufacturer’s instructions. The RNA quantity
and quality was measured using a NanoDrop ND-1000 spectrophotometer (Saveen Biotech) and the
Agilent 2100 Bioanalyzer (Agilent Technologies), respectively. The average yield of total RNA was (in
nanogram ± SD): 2D PS (3698 ± 734); 2D PDMS (5724 ± 785); 3D PS (275 ± 273); 3D PDMS (1340 ± 238)
and pyrolysed 3D PDMS (1096 ± 381). The RNA integrity number (RIN) was determined using the
Agilent RNA 6000 Nano Kit (Agilent Technologies) according to the manufacturer’s instructions. All
RIN numbers were between 8.1 and 10.
2.7. cDNA synthesis and pre-amplification
QuantiTect® reverse Transcription Kit (Qiagen) was used to reverse transcribe 180ng total RNA in
duplicate according to the manufacturer’s instructions. For the pre-amplification, cDNA was diluted
1:5 in low EDTA Tris-EDTA (TE)-buffer (VWR-Bie & Berntsen). TagMan PreAmp Master mix (1µl)
(Applied Biosystems) was mixed with 2.5µl of a 200nM primer mix (containing all primer pairs used in
this study) and 2.5µl diluted cDNA. Using a Thermocycler (Biometra), samples were incubated at 95°C
for 10 min followed by 18 cycles of 95°C for 15 sec and 60°C for 4 min. For removal of excess primers,
exonuclease I (New England Biolabs) (4U/µl) was added to the pre-amplified cDNA and samples were
incubated at 37°C for 30 min and 80°C for 15 min. Pre-amplified, exonuclease-treated cDNA was
diluted 1:5 in low EDTA TE-buffer and stored at -20°C until quantitative real time PCR (RT-qPCR)
analysis.
2.8. Primer design and validation
Primers targeting genes involved in differentiation and activation were designed using the free
software Primer3 (http://bioinfo.ut.ee/primer3-0.4.0/primer3/) as described previously (24) and
synthesized at TAG Copenhagen (Copenhagen, Denmark) or Sigma-Aldrich (Denmark). All primers,
primer sequences and amplicon length are listed in suppl. table S1. If possible, primers were designed
to span introns to prevent amplification of genomic DNA, and BLAST searches were performed to
Paper II
88
ensure primer specificity and absence of intraspecies polymorphisms at the primer site. For several
genes, two primer pairs, annealing at different sites at the mRNA transcript, were designed. Primer
amplification efficiencies and correlation coefficients were obtained by standard curves constructed
from four separate dilution series of pooled pre-amplified, exonucleated cDNA. To ensure primer
specificity, melting curves were visually inspected for all primer assays.
2.9 Quantitative real-time PCR
qRT-PCR was performed in 96.96 Dynamic Array Integrated Fluidic Circuits (IFC) (Fluidigm), combining
54 samples, 38 dilution curve samples, three minus reverse transcriptase controls and one non-
template control, all pre-amplified (96 samples in total) with 96 primer sets for 9216 individual and
simultaneous qPCR reactions. Reaction mix was prepared using the following reagents for each of the
96 reactions: 3µl TaqMan Gene Expression Master Mix (Applied Biosystems), 0.3µl 20XDNA Binding
Dye Sample Loading Reagent (Fluidigm), 0.3µl 20X EvaGreen (Biotium, VWR-Bie & Berntsen) and 0.9µl
low EDTA TE buffer. Reaction mix (4.5µl) was mixed with 1.5µl pre-amplified, diluted cDNA. Primer
mix was prepared for each of the 96 primer sets using 3µl of 20µM primer (forward and reverse) and
3µl of 2X Assay loading Reagent (Fluidigm). The 96.96 Dynamic Array was primed in the IFC Controller
(Fluidigm), and reaction mix including cDNA (5µl) and primer mix (5µl) was loaded into appropriate
inlets on the chip, and again placed in the IFC controller to ensure equal distribution of cDNA and
primer in the 9216 reaction chambers. The chip was then placed in the BioMark real time PCR
instrument (Fluidigm), and the following cycle conditions were used: a thermal mix consisting of 2 min
at 50°C, 30 min at 70°C and 10 min at 25°C, then an uracil-N-glycosylase (UNG) phase with 2 min at 50
and a hot start phase with 10 min at 95°, followed by 35 cycles with denaturation for 15 sec at 95° and
annealing/elongation for 1 min at 60°C. Melting curves were generated after each run to confirm a
single PCR product (from 60°C to 95°C, increasing 1°C/3 sec). Reactions were performed in duplicate
(cDNA replicates). Minus RT controls (samples generated without reverse transcriptase enzyme) and
non-template controls (NTC) were included to check for genomic DNA contamination and non-specific
amplification, respectively. Expression data (Cq values) was acquired using the Fluidigm Real Time PCR
Analysis software 3.0.2 (Fluidigm).
Paper II
89
2.10. Data pre-processing and analysis
Data pre-processing, normalization and relative quantification was done using GenEx5 (MultiD). Data
were corrected for primer efficiency for each individual assay. If primer efficiency was below 0.85 or
above 1.15, a default efficiency of 0.90 was assigned and differential expression was later validated
using the Rotor-Gene Q (Qiagen) qPCR platform. Normalization was done using the geometric mean
of four reference genes: hypoxanthine phosphoribosyl-transferase 1 (HPRT1), tyrosine 3-
monooxygenase/tryptophan 5-monooxygenase (YWHAE), β-actin (ACTB) and β-2-microglobulin (B2M),
found to be the most stably expressed ones out of eight reference genes tested using both GeNorm
(25) and NormFinder (26). Data from the two technical cDNA replicates were averaged, and for each
specific primer set and sample, a maximum of 10% samples/primer sets with a ∆Cq above ±1.5 for the
two cDNA replicates was accepted. To visualize differential gene expression, expression was
calculated relative to the sample with the lowest expression (highest Cq) within each primer assay.
Finally the data was log2 transformed and autoscaled before principal component analysis (PCA). No
statistical analyses were attempted since only three pigs were analysed in the present study. For
comparison of the effect of the different culture surfaces the expression was set relative to the
control surface (2D PS) and a fold change of ±2 was arbitrarily defined as the cut-off for biologically
significant changes.
3. Results
3.1. Monocytes cultured conventionally with differentiating cytokines have moDC morphology and
surface marker expression
In the present study, the effect of culture surface architecture and material on the in vitro
differentiation of porcine moDC was investigated. For this purpose three pigs were used as donors.
Purified CD172a positive monocytes were cultured with medium containing GM-CSF and IL-4 on
surfaces that differed in material; PS, PDMS or carbonized (pyrolysed) PDMS, and dimension; 2D or
3D. After four days of culture on 2D PS in the presence of differentiating cytokines, monocytes
differentiated into elongated cells with dendrites – a morphology characteristic of moDC (Fig. 2). This
Paper II
90
was even more profound after 24 hours of activation with LPS. To confirm the differentiation into
moDCs the expression of surface markers was analysed by flow cytometry. Prior to culture,
monocytes were CD1 negative, CD80/86negative/low and MHCIIlow (Fig. 3). After conventional (2D PS)
culture with differentiating cytokines, cells were CD1pos, CD80/86high (especially after activation by
LPS) and MHCIIhigh which further confirmed their differentiation into moDCs (9,11,12). When cultured
on 3D surfaces of both materials however, cells were CD1neg, CD80/86low and MHCIIlow, a phenotype
resembling monocytes more than moDCs. Cells cultured on 2D PDMS had an intermediate phenotype;
CD1low, CD80/86high and MHCIIhigh. CD14 was equally expressed by cells cultured on all five surfaces.
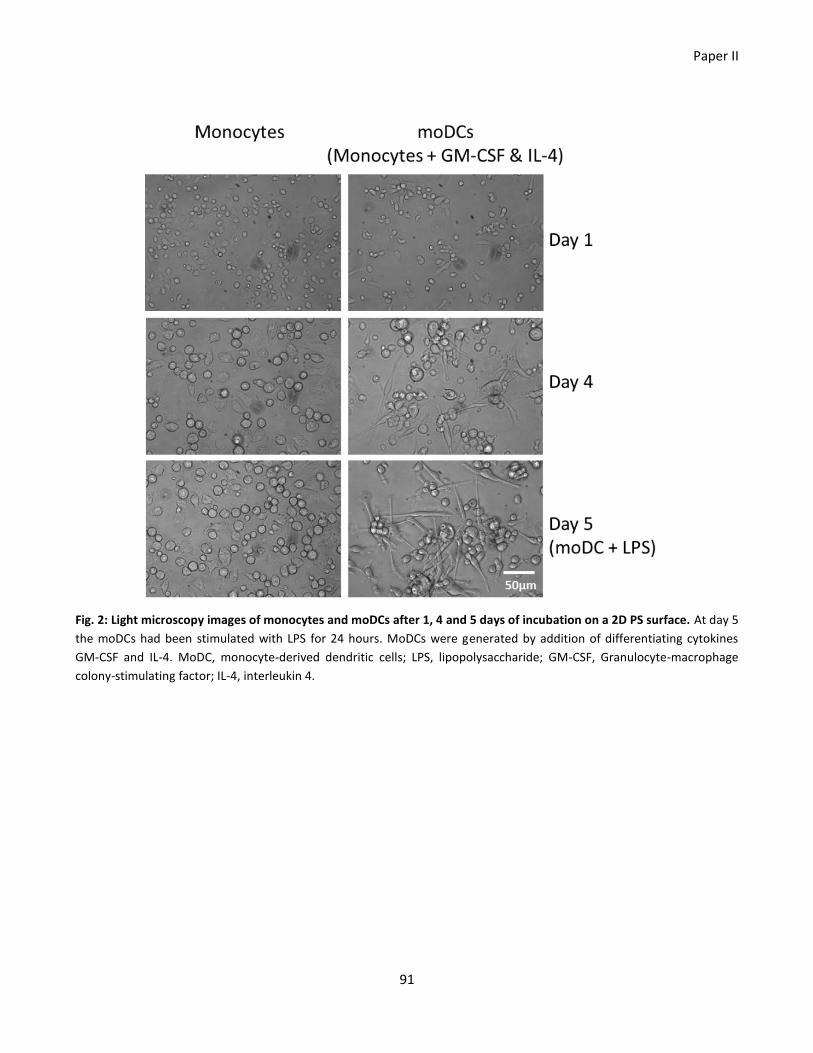
Paper II
91
Fig. 2: Light microscopy images of monocytes and moDCs after 1, 4 and 5 days of incubation on a 2D PS surface. At day 5
the moDCs had been stimulated with LPS for 24 hours. MoDCs were generated by addition of differentiating cytokines
GM-CSF and IL-4. MoDC, monocyte-derived dendritic cells; LPS, lipopolysaccharide; GM-CSF, Granulocyte-macrophage
colony-stimulating factor; IL-4, interleukin 4.
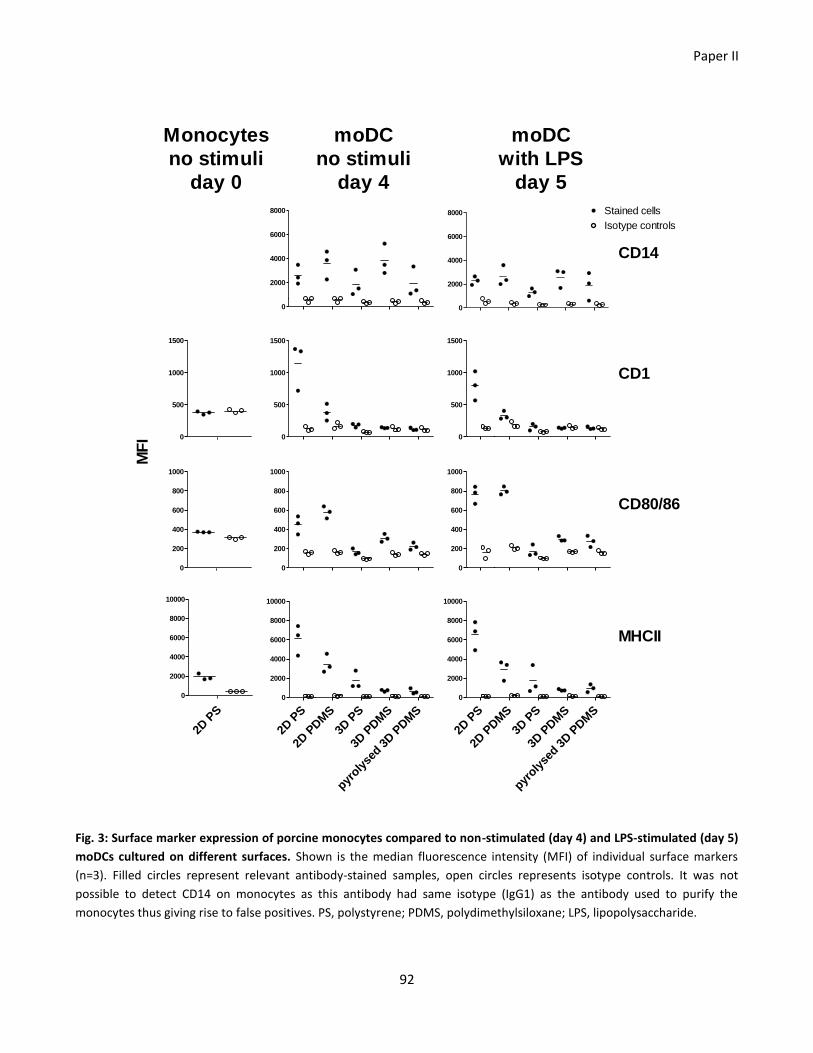
Paper II
92
0
500
1000
1500
0
500
1000
1500
0
2000
4000
6000
8000
0
2000
4000
6000
8000 Stained cells
Isotype controls
0
200
400
600
800
1000
0
200
400
600
800
1000
2D P
S
2D P
DM
S
3D P
S
3D P
DM
S
pyroly
sed 3
D P
DM
S
0
2000
4000
6000
8000
10000
2D P
S
2D P
DM
S
3D P
S
3D P
DM
S
pyroly
sed 3
D P
DM
S
0
2000
4000
6000
8000
10000
CD1
CD14
CD80/86
MHCII
Monocytes
no stimuli
day 0
MF
I 0
500
1000
1500
0
200
400
600
800
1000
0
2000
4000
6000
8000
10000
2D P
S
moDC
no stimuli
day 4
moDC
with LPS
day 5
Fig. 3: Surface marker expression of porcine monocytes compared to non-stimulated (day 4) and LPS-stimulated (day 5)
moDCs cultured on different surfaces. Shown is the median fluorescence intensity (MFI) of individual surface markers
(n=3). Filled circles represent relevant antibody-stained samples, open circles represents isotype controls. It was not
possible to detect CD14 on monocytes as this antibody had same isotype (IgG1) as the antibody used to purify the
monocytes thus giving rise to false positives. PS, polystyrene; PDMS, polydimethylsiloxane; LPS, lipopolysaccharide.
Paper II
93
3.2. Gene expression
The expression of 96 genes - 88 genes of interest and 8 reference genes was examined. Genes were
selected to cover transcription factors, cytokines, maturation markers and phenotypic markers. The
following genes were excluded due to expression levels below limits of detections or variable cDNA
replicates: IL12(p35), IL12(p40), IFN-β, IFN-γ, ITGAM(a), ITGAM(b), CXCL10, IL1B, TNF, CLEC4A(b),
SIGLEC5(a), CCL2, ITGA4(b), CLEC1A(b), CLEC12A(a), CLEC12A(b) and CD101(b). Validation of
differential expression was performed on 11 primers assigned with default efficiency. Expression
levels from primers specific for TLR3 could not be validated on the Rotor-Gene Q qPCR platform and
was thus excluded from the analysis. For genes analyzed using two primer pairs, only one assay was
analyzed further after checking the correlation coefficients between the two pairs. Thus, the following
genes were excluded due to double primer assay (correlation coefficient between the two primer sets
are shown in parentheses): TLR4(a) (0.81), SLA-DRB1(b) (0.95), CD86(b) (0.94), CCR7(b) (0.98),
TRAF6(a) (0.97), CCR5(b) (0.97), CXCR4(b) (0.83), IRF8(b) (0.92), FLT3(a) (0.99), CCR1(a) (0.88), IRF5(a)
(0.65), BATF3(a) (0.65), ID2(a) (0.97), BCL11A(a) (0.77), BCL6(a) (0.97), TCF4(b) (0.86), CLEC2D(b)
(0.88), CD163(b) (0.99), FCGR1A(a) (0.82), FCGR2B(a) (0.96), FCGR3B(a) (0.83), CD1a(b) (0.99),
LAMP3(b) (0.91) and XCR1(a) (0.91). Thus, a total of 46 genes were evaluated for differential gene
expression, many of those with two highly correlated primer pairs targeting the same mRNA
transcript, as a result of surface architecture (2D vs. 3D) and materials used for culturing. (see suppl.
table S1 for complete list of primers).
3.3. The monocyte-derived cells show distinct gene expression when cultured on surfaces of
alternative materials and dimension.
Principal component analysis (PCA) was performed on relative expression data of all 46 genes, to
reveal patterns or clusters among samples based on co-expression patterns. Distinct clustering of cells
isolated from 2D PS, 2D PDMS, 3D PS and 3D PDMS/pyrolysed 3D PDMS can be seen in Fig. 4. Most
variation was explained by PC1 (eigenvalue = 30.4%) separating the cells grown on 2D compared to
3D. No separation, based on gene expression patterns, was seen between cells grown on the
carbonized form of 3D PDMS and 3D PDMS. To see how the gene expression changed when cells were
Paper II
94
cultured on alternative surfaces, the expression was compared relative to the expression on the
conventional control surface (2D PS), set to 1. Both the gene expression from non-stimulated- and
LPS-stimulated cells is shown in table 3. Out of the 46 genes analyzed, 29 genes had a fold change
expression of ± 2 when cultured alternatively compared to control, and for the LPS-stimulated cells
this number was 34. In agreement with results from the PCA, the two most variable groups of clusters
(2D PS and 3D PDMS) also showed the highest number of differentially genes both in samples of no
stimuli and LPS treatment. Fig. 5 summarizes the differently expressed genes across the alternative
surfaces, with or without LPS.
In the non-stimulated cells, a common effect of changing the material from PS to PDMS (both
2D-, 3D- and pyrolysed 3D PDMS) was increased expression of CD163 and decreased expression of
LAMP3 (CD208) and ITGA4 (CD49d). The same applied for the LPS-stimulated cells, except here also
the expression of BATF3 was decreased in cells from the PDMS surfaces and the expression of LAMP3
was, in addition to PDMS surfaces, also decreased in cells cultured on 3D PS. A common effect of
changing the dimension from 2D to 3D in resting cells (both PS, PDMS and pyrolysed PDMS) was
increased expression of IL6, IL10, CCR5 and decreased expression of BCL6, CD1a, CD209 (DC-SIGN) and
FCGR2B (CD32). In the LPS-stimulated cells this was also the case only expression of BCL6 was
unchanged compared to control, and in addition the expression of ID2 and TCF4 was increased and
decreased, respectively. The expression of SLA-DRB1 (MHCII) was approximately the same in cells
from 2D PDMS and 3D PS, but was decreased 2.3 fold (0.43) in cells from 3D PDMS and pyrolysed 3D
PDMS. The same trend applied for cells stimulated with LPS. The expression of CD86 was unchanged
across the various surfaces, except for a 2 fold (0.46) downregulation in LPS-stimulated 3D PS cells.
Common for all the four alternative surfaces tested was an increased expression of IL23A and a
decreased expression of TLR8 and CD40 when compared to the conventional 2D PS culture surface.
For the LPS-stimulated cells a decrease in the expression of TLR8 and LAMP3 was observed for all four
alternative surfaces. The most important findings regarding the gene expression results for all tested
surfaces are summarized in table 4.
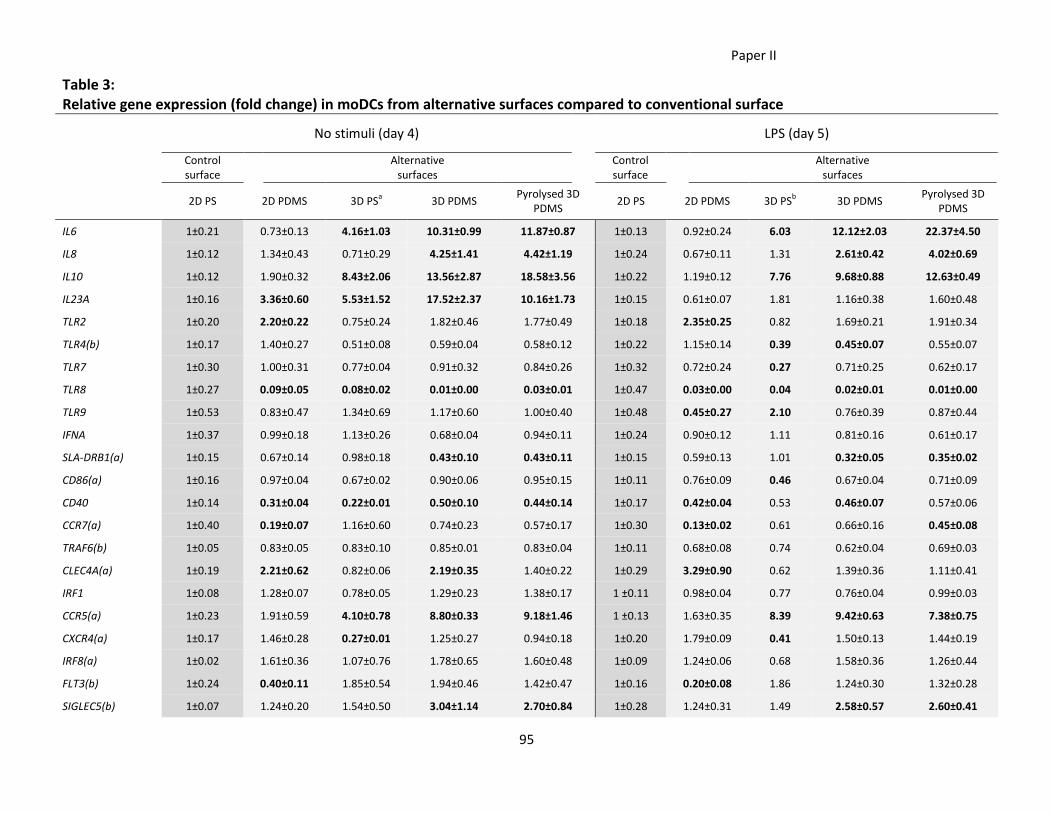
Paper II
95
Table 3: Relative gene expression (fold change) in moDCs from alternative surfaces compared to conventional surface
No stimuli (day 4) LPS (day 5)
Control surface
Alternative
surfaces
Control surface
Alternative
surfaces
2D PS 2D PDMS 3D PSa
3D PDMS Pyrolysed 3D
PDMS 2D PS 2D PDMS 3D PS
b 3D PDMS
Pyrolysed 3D PDMS
IL6 1±0.21 0.73±0.13 4.16±1.03 10.31±0.99 11.87±0.87 1±0.13 0.92±0.24 6.03 12.12±2.03 22.37±4.50
IL8 1±0.12 1.34±0.43 0.71±0.29 4.25±1.41 4.42±1.19 1±0.24 0.67±0.11 1.31 2.61±0.42 4.02±0.69
IL10 1±0.12 1.90±0.32 8.43±2.06 13.56±2.87 18.58±3.56 1±0.22 1.19±0.12 7.76 9.68±0.88 12.63±0.49
IL23A 1±0.16 3.36±0.60 5.53±1.52 17.52±2.37 10.16±1.73 1±0.15 0.61±0.07 1.81 1.16±0.38 1.60±0.48
TLR2 1±0.20 2.20±0.22 0.75±0.24 1.82±0.46 1.77±0.49 1±0.18 2.35±0.25 0.82 1.69±0.21 1.91±0.34
TLR4(b) 1±0.17 1.40±0.27 0.51±0.08 0.59±0.04 0.58±0.12 1±0.22 1.15±0.14 0.39 0.45±0.07 0.55±0.07
TLR7 1±0.30 1.00±0.31 0.77±0.04 0.91±0.32 0.84±0.26 1±0.32 0.72±0.24 0.27 0.71±0.25 0.62±0.17
TLR8 1±0.27 0.09±0.05 0.08±0.02 0.01±0.00 0.03±0.01 1±0.47 0.03±0.00 0.04 0.02±0.01 0.01±0.00
TLR9 1±0.53 0.83±0.47 1.34±0.69 1.17±0.60 1.00±0.40 1±0.48 0.45±0.27 2.10 0.76±0.39 0.87±0.44
IFNA 1±0.37 0.99±0.18 1.13±0.26 0.68±0.04 0.94±0.11 1±0.24 0.90±0.12 1.11 0.81±0.16 0.61±0.17
SLA-DRB1(a) 1±0.15 0.67±0.14 0.98±0.18 0.43±0.10 0.43±0.11 1±0.15 0.59±0.13 1.01 0.32±0.05 0.35±0.02
CD86(a) 1±0.16 0.97±0.04 0.67±0.02 0.90±0.06 0.95±0.15 1±0.11 0.76±0.09 0.46 0.67±0.04 0.71±0.09
CD40 1±0.14 0.31±0.04 0.22±0.01 0.50±0.10 0.44±0.14 1±0.17 0.42±0.04 0.53 0.46±0.07 0.57±0.06
CCR7(a) 1±0.40 0.19±0.07 1.16±0.60 0.74±0.23 0.57±0.17 1±0.30 0.13±0.02 0.61 0.66±0.16 0.45±0.08
TRAF6(b) 1±0.05 0.83±0.05 0.83±0.10 0.85±0.01 0.83±0.04 1±0.11 0.68±0.08 0.74 0.62±0.04 0.69±0.03
CLEC4A(a) 1±0.19 2.21±0.62 0.82±0.06 2.19±0.35 1.40±0.22 1±0.29 3.29±0.90 0.62 1.39±0.36 1.11±0.41
IRF1 1±0.08 1.28±0.07 0.78±0.05 1.29±0.23 1.38±0.17 1 ±0.11 0.98±0.04 0.77 0.76±0.04 0.99±0.03
CCR5(a) 1±0.23 1.91±0.59 4.10±0.78 8.80±0.33 9.18±1.46 1 ±0.13 1.63±0.35 8.39 9.42±0.63 7.38±0.75
CXCR4(a) 1±0.17 1.46±0.28 0.27±0.01 1.25±0.27 0.94±0.18 1±0.20 1.79±0.09 0.41 1.50±0.13 1.44±0.19
IRF8(a) 1±0.02 1.61±0.36 1.07±0.76 1.78±0.65 1.60±0.48 1±0.09 1.24±0.06 0.68 1.58±0.36 1.26±0.44
FLT3(b) 1±0.24 0.40±0.11 1.85±0.54 1.94±0.46 1.42±0.47 1±0.16 0.20±0.08 1.86 1.24±0.30 1.32±0.28
SIGLEC5(b) 1±0.07 1.24±0.20 1.54±0.50 3.04±1.14 2.70±0.84 1±0.28 1.24±0.31 1.49 2.58±0.57 2.60±0.41
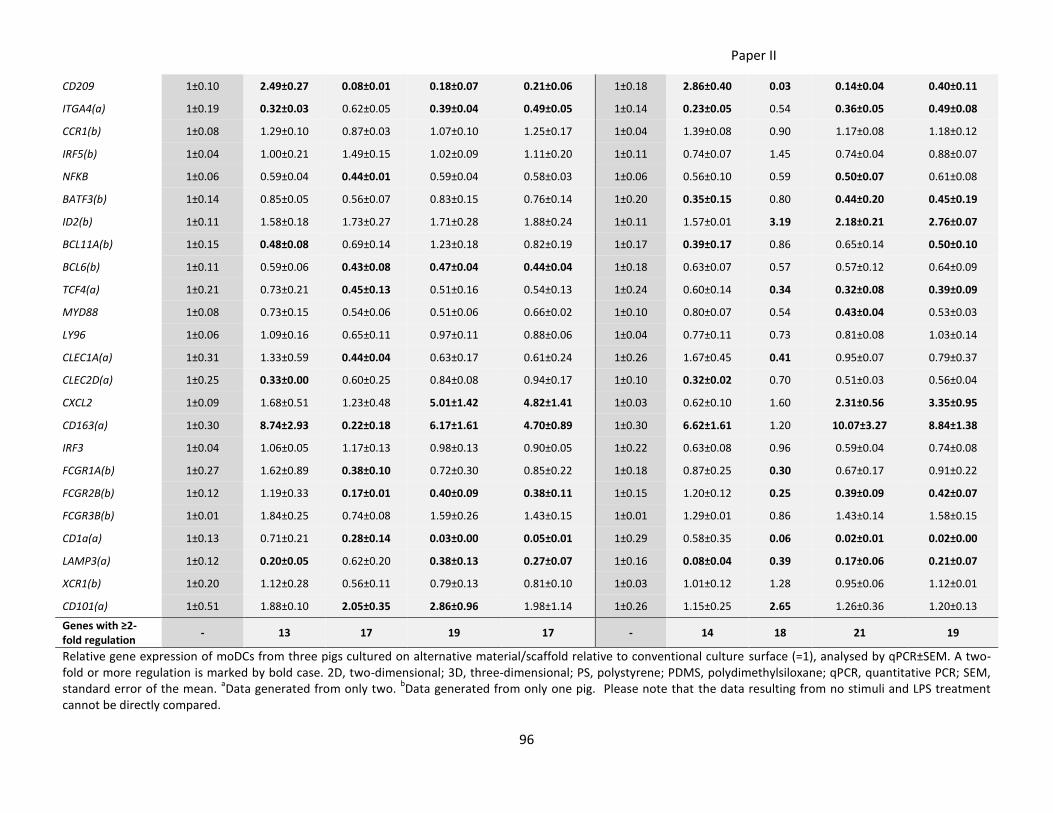
Paper II
96
CD209 1±0.10 2.49±0.27 0.08±0.01 0.18±0.07 0.21±0.06 1±0.18 2.86±0.40 0.03 0.14±0.04 0.40±0.11
ITGA4(a) 1±0.19 0.32±0.03 0.62±0.05 0.39±0.04 0.49±0.05 1±0.14 0.23±0.05 0.54 0.36±0.05 0.49±0.08
CCR1(b) 1±0.08 1.29±0.10 0.87±0.03 1.07±0.10 1.25±0.17 1±0.04 1.39±0.08 0.90 1.17±0.08 1.18±0.12
IRF5(b) 1±0.04 1.00±0.21 1.49±0.15 1.02±0.09 1.11±0.20 1±0.11 0.74±0.07 1.45 0.74±0.04 0.88±0.07
NFKB 1±0.06 0.59±0.04 0.44±0.01 0.59±0.04 0.58±0.03 1±0.06 0.56±0.10 0.59 0.50±0.07 0.61±0.08
BATF3(b) 1±0.14 0.85±0.05 0.56±0.07 0.83±0.15 0.76±0.14 1±0.20 0.35±0.15 0.80 0.44±0.20 0.45±0.19
ID2(b) 1±0.11 1.58±0.18 1.73±0.27 1.71±0.28 1.88±0.24 1±0.11 1.57±0.01 3.19 2.18±0.21 2.76±0.07
BCL11A(b) 1±0.15 0.48±0.08 0.69±0.14 1.23±0.18 0.82±0.19 1±0.17 0.39±0.17 0.86 0.65±0.14 0.50±0.10
BCL6(b) 1±0.11 0.59±0.06 0.43±0.08 0.47±0.04 0.44±0.04 1±0.18 0.63±0.07 0.57 0.57±0.12 0.64±0.09
TCF4(a) 1±0.21 0.73±0.21 0.45±0.13 0.51±0.16 0.54±0.13 1±0.24 0.60±0.14 0.34 0.32±0.08 0.39±0.09
MYD88 1±0.08 0.73±0.15 0.54±0.06 0.51±0.06 0.66±0.02 1±0.10 0.80±0.07 0.54 0.43±0.04 0.53±0.03
LY96 1±0.06 1.09±0.16 0.65±0.11 0.97±0.11 0.88±0.06 1±0.04 0.77±0.11 0.73 0.81±0.08 1.03±0.14
CLEC1A(a) 1±0.31 1.33±0.59 0.44±0.04 0.63±0.17 0.61±0.24 1±0.26 1.67±0.45 0.41 0.95±0.07 0.79±0.37
CLEC2D(a) 1±0.25 0.33±0.00 0.60±0.25 0.84±0.08 0.94±0.17 1±0.10 0.32±0.02 0.70 0.51±0.03 0.56±0.04
CXCL2 1±0.09 1.68±0.51 1.23±0.48 5.01±1.42 4.82±1.41 1±0.03 0.62±0.10 1.60 2.31±0.56 3.35±0.95
CD163(a) 1±0.30 8.74±2.93 0.22±0.18 6.17±1.61 4.70±0.89 1±0.30 6.62±1.61 1.20 10.07±3.27 8.84±1.38
IRF3 1±0.04 1.06±0.05 1.17±0.13 0.98±0.13 0.90±0.05 1±0.22 0.63±0.08 0.96 0.59±0.04 0.74±0.08
FCGR1A(b) 1±0.27 1.62±0.89 0.38±0.10 0.72±0.30 0.85±0.22 1±0.18 0.87±0.25 0.30 0.67±0.17 0.91±0.22
FCGR2B(b) 1±0.12 1.19±0.33 0.17±0.01 0.40±0.09 0.38±0.11 1±0.15 1.20±0.12 0.25 0.39±0.09 0.42±0.07
FCGR3B(b) 1±0.01 1.84±0.25 0.74±0.08 1.59±0.26 1.43±0.15 1±0.01 1.29±0.01 0.86 1.43±0.14 1.58±0.15
CD1a(a) 1±0.13 0.71±0.21 0.28±0.14 0.03±0.00 0.05±0.01 1±0.29 0.58±0.35 0.06 0.02±0.01 0.02±0.00
LAMP3(a) 1±0.12 0.20±0.05 0.62±0.20 0.38±0.13 0.27±0.07 1±0.16 0.08±0.04 0.39 0.17±0.06 0.21±0.07
XCR1(b) 1±0.20 1.12±0.28 0.56±0.11 0.79±0.13 0.81±0.10 1±0.03 1.01±0.12 1.28 0.95±0.06 1.12±0.01
CD101(a) 1±0.51 1.88±0.10 2.05±0.35 2.86±0.96 1.98±1.14 1±0.26 1.15±0.25 2.65 1.26±0.36 1.20±0.13
Genes with ≥2-fold regulation
- 13 17 19 17 - 14 18 21 19
Relative gene expression of moDCs from three pigs cultured on alternative material/scaffold relative to conventional culture surface (=1), analysed by qPCR±SEM. A two-fold or more regulation is marked by bold case. 2D, two-dimensional; 3D, three-dimensional; PS, polystyrene; PDMS, polydimethylsiloxane; qPCR, quantitative PCR; SEM, standard error of the mean.
aData generated from only two.
bData generated from only one pig. Please note that the data resulting from no stimuli and LPS treatment
cannot be directly compared.
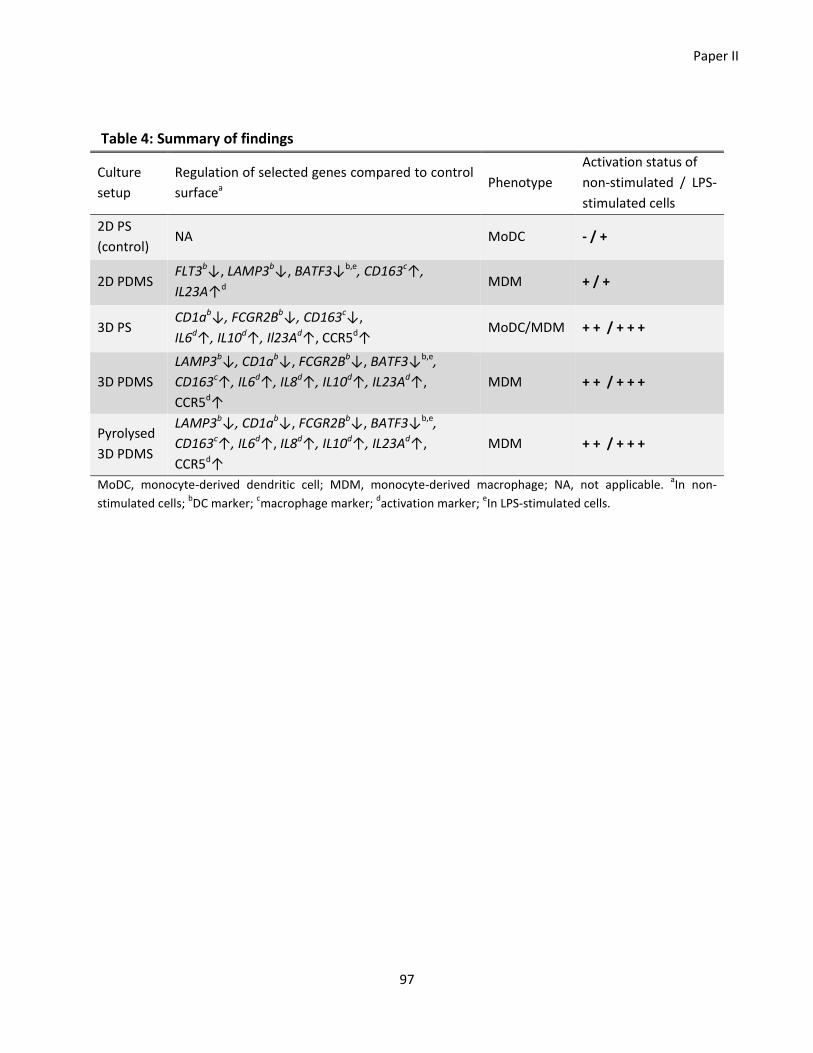
Paper II
97
Table 4: Summary of findings
Culture
setup
Regulation of selected genes compared to control
surfacea Phenotype
Activation status of
non-stimulated / LPS-
stimulated cells
2D PS
(control) NA MoDC - / +
2D PDMS FLT3b↓, LAMP3b↓, BATF3↓b,e, CD163c↑,
IL23A↑d MDM + / +
3D PS CD1ab↓, FCGR2Bb↓, CD163c↓,
IL6d↑, IL10d↑, Il23Ad↑, CCR5d↑ MoDC/MDM + + / + + +
3D PDMS
LAMP3b↓, CD1ab↓, FCGR2Bb↓, BATF3↓b,e,
CD163c↑, IL6d↑, IL8d↑, IL10d↑, IL23Ad↑,
CCR5d↑
MDM + + / + + +
Pyrolysed
3D PDMS
LAMP3b↓, CD1ab↓, FCGR2Bb↓, BATF3↓b,e,
CD163c↑, IL6d↑, IL8d↑, IL10d↑, IL23Ad↑,
CCR5d↑
MDM + + / + + +
MoDC, monocyte-derived dendritic cell; MDM, monocyte-derived macrophage; NA, not applicable. aIn non-
stimulated cells; bDC marker;
cmacrophage marker;
dactivation marker;
eIn LPS-stimulated cells.
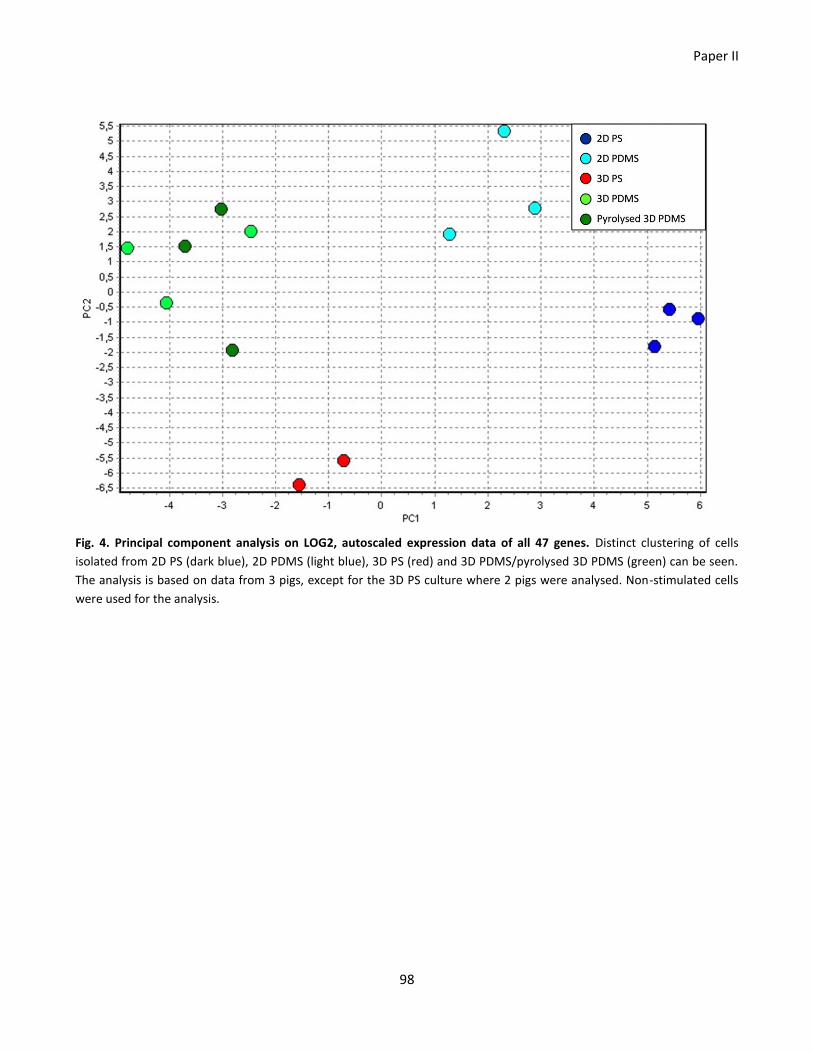
Paper II
98
Fig. 4. Principal component analysis on LOG2, autoscaled expression data of all 47 genes. Distinct clustering of cells
isolated from 2D PS (dark blue), 2D PDMS (light blue), 3D PS (red) and 3D PDMS/pyrolysed 3D PDMS (green) can be seen.
The analysis is based on data from 3 pigs, except for the 3D PS culture where 2 pigs were analysed. Non-stimulated cells
were used for the analysis.
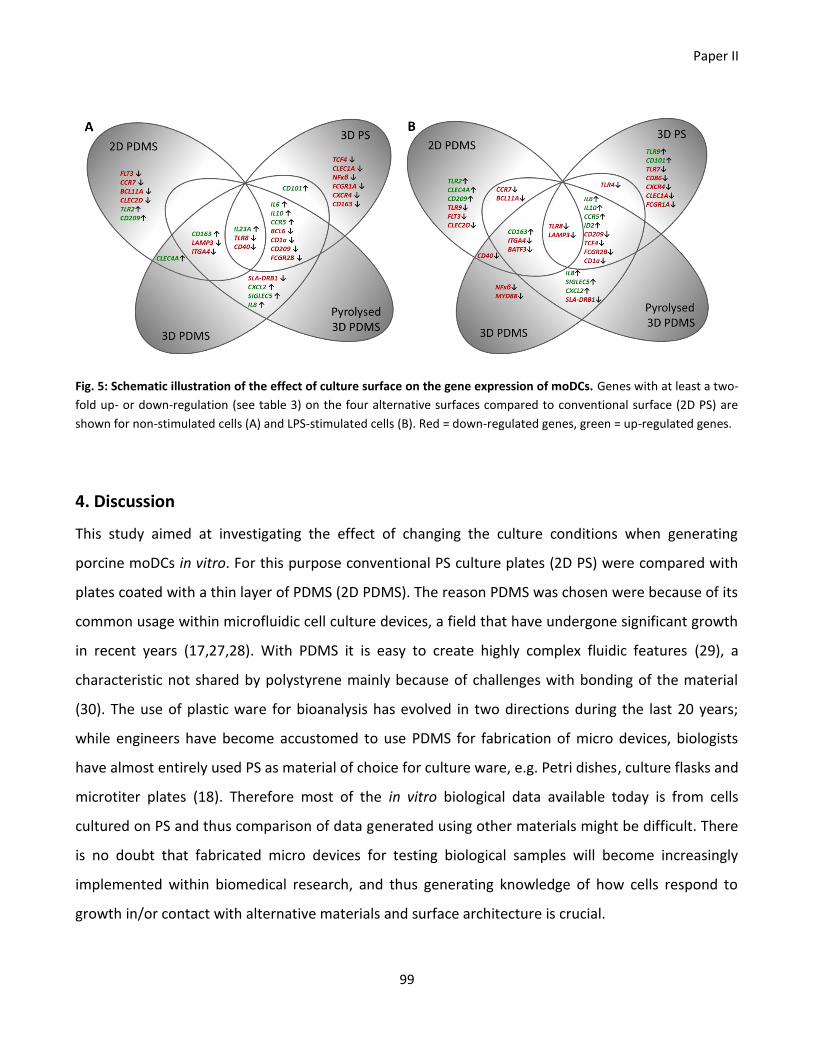
Paper II
99
Fig. 5: Schematic illustration of the effect of culture surface on the gene expression of moDCs. Genes with at least a two-
fold up- or down-regulation (see table 3) on the four alternative surfaces compared to conventional surface (2D PS) are
shown for non-stimulated cells (A) and LPS-stimulated cells (B). Red = down-regulated genes, green = up-regulated genes.
4. Discussion
This study aimed at investigating the effect of changing the culture conditions when generating
porcine moDCs in vitro. For this purpose conventional PS culture plates (2D PS) were compared with
plates coated with a thin layer of PDMS (2D PDMS). The reason PDMS was chosen were because of its
common usage within microfluidic cell culture devices, a field that have undergone significant growth
in recent years (17,27,28). With PDMS it is easy to create highly complex fluidic features (29), a
characteristic not shared by polystyrene mainly because of challenges with bonding of the material
(30). The use of plastic ware for bioanalysis has evolved in two directions during the last 20 years;
while engineers have become accustomed to use PDMS for fabrication of micro devices, biologists
have almost entirely used PS as material of choice for culture ware, e.g. Petri dishes, culture flasks and
microtiter plates (18). Therefore most of the in vitro biological data available today is from cells
cultured on PS and thus comparison of data generated using other materials might be difficult. There
is no doubt that fabricated micro devices for testing biological samples will become increasingly
implemented within biomedical research, and thus generating knowledge of how cells respond to
growth in/or contact with alternative materials and surface architecture is crucial.
Paper II
100
The porcine monocytes-derived cells generated with a cocktail of GM-CSF and IL-4 had a
surface phenotype typically for moDC when cultured on 2D PS (9,11,12). The phenotype when
cultured on 2D PDMS was similar to 2D PS-cultured cells except for decreased expression of CD1 and
MHCII. All the 3D-cultured cells had no or low expression of CD1, CD80/86 and MHCII. This was
consistent with the gene expression analysis; when compared to control, the expression of CD1a was
slightly decreased in 2D PDMS cells (a fold change of 1.4 (a relative-to-control expression of 0.71)
which was, however, not categorized as being biologically significant; see material and methods), and
decreased 3.5-33 fold (0.28-0.03) in cells from all three types of 3D surfaces, Table 1.
Equal weight of all 46 genes in the PCA analysis revealed a clear separation (and most
variation) between cells grown at different surface architecture compared to material. Thirteen genes
were expressed differently in cells from 2D PS and 2D PDMS surfaces. The most interesting
observation was an increase in CD163 and IL23A, and a decrease in FLT3 and LAMP3 expression in 2D
PDMS cells compared to 2D PS. As CD163 have been described as a monocyte/macrophage marker
(6,31) and FLT3 and LAMP3 as markers expressed by DCs (32,33), it seems as if the cells cultured on
PDMS in contrast to PS developed into macrophage-like cells with an increased activation state in the
form of inflammatory cytokine expression even without the addition of LPS. Additionally, LPS-
stimulated cells cultured on all three types of PDMS surfaces, had a decreased expression of BATF3
compared to the control surface. BATF3 is typically expressed by bona fide DC at higher levels (Gael
Aurey and Artur Summerfield, unpublished data) and the downregulation on PDMS surfaces is in
accordance with the cells having macrophage-like phenotypes. It was surprising to find expression of
FLT3 in the monocyte-derived cells as a previous study found this gene to be primarily expressed by
bona fide DCs originating from bone marrow DC-precursors (32). An explanation could be that
conventional DCs (cDCs) were present in our monocyte population to begin with as these cells also
express CD172a (which was used to purify the monocytes), although at a much lower level than
monocytes (34). Changing the surface to PDMS had a negative effect on the FLT3 expression.
Adding a third dimension to the culture, i.e. 3D PDMS generated cells that in addition to the
above mentioned differences in gene expression, also differed from cells on 2D PS by increased
Paper II
101
expression of IL6, IL8, IL10 and CCR5, inflammatory and regulatory cytokines and a chemokine
receptor reflecting cells with higher activation status. In addition to LAMP3, also CD1a and FCGR2b
which is usually expressed by DCs were downregulated. As shown in the PCA plot 3D PDMS and
pyrolysed 3D PDMS surfaces constituted one cluster. In fact there was not much difference in their
gene expression profile; only 2 genes were differently expressed compared to control on 3D PDMS
but not on the pyrolysed version of the surface for non-stimulated cells. Also the level of expression
was similar on the two surfaces. So the carbonization of PDMS had only minor effect on the gene
expression.
Finally the effect of changing only the culture dimension was tested on the 3D PS surface. This
surface clustered differently from the other surfaces and resulted primarily in downregulation of
genes compared to control (12 genes were downregulated, 5 were upregulated). Cells from this
surface were in an activated state based on upregulation of inflammatory and regulatory
cytokines/chemokines as was the case for all 3D surfaces. Apart from the downregulation of the two
DC markers, CD1a and FCGR2b, cells on this surface also downregulated the expression of the
macrophage marker CD163 which were upregulated on all the other alternative surfaces. This
emphasizes that the skewing of cells toward a macrophage phenotype is dependent on surface
material (PDMS) more than dimension (3D).
A concern when working with cells cultured on 3D scaffolds, is the harvesting process. It is
obviously more complicated collecting cells cultured in a 3D setup compared to 2D. There is a risk of
losing cells that are stuck in the scaffold and thus basing the further analysis on a fraction of the
original cell pool. In this study, an equal number of cells were originally pipetted in each culture well.
The cells were not counted after harvesting, but the quantity of total RNA after purification was
measured, and this yield can be used as an indirect measure of initial cell quantity. All culture surfaces
resulted in a relatively high total RNA yield, except for the 3D PS surface. This scaffold is a commercial
available 200 µm thick porous PS membrane made using emulsion templating (35) and designed for
3D culture (36). The scaffold has a porosity of 90% and the pore size is approximately 40µm. This
surface is more compact than the 3D PDMS and pyrolysed 3D PDMS scaffolds which have pore sizes of
Paper II
102
300-600µm. We may only speculate if cells were left trapped within the pores of the 3D PS scaffold
due to their relative compact architecture compared to 3D PDMS and pyrolysed 3D PDMS. The low
RNA yield from 3D PS could also have to do with the material as a higher RNA yield from cells cultured
on 2D PDMS compared to 2D PS was obtained. In a study on human breast cancer cells Zhang and
colleagues reports a poor cell attachment on plasma oxygen-treated 2D PDMS compared to 2D PS
surfaces (37). Thus the decreased RNA yield after retrieval of cells from 3D PS is probably due to a
combination of cells sticking better to the polystyrene and being “trapped” in the relatively small
pores of the scaffold. In any case, it seems as if the 3D PS scaffold is preferable for assays that do not
require retrieval of cells after culture.
In conclusion, the effect of changing the culture setup when generating porcine moDC was
tested and it was found that both material (PDMS) and architecture (3D) changed the gene expression
of the cells. Even though one could wish for more biological replicates, multivariate analysis (PCA)
suggest that architecture (2D vs. 3D) rather than material (PS vs. PDMS) results in differentially
expression of genes involved in pattern recognition and inflammation. In contrast, genes involved in
macrophage phenotype were dependent on surface material (PDMS) more than dimension (3D).
These findings provide evidence of the necessity of detailed reporting of the culture conditions used
when presenting gene expression results as it was found to influence the expression, which make
comparisons difficult. The findings also highlight the challenges for future studies combining the
analysis or generation of cells having specific phenotypes with for example microfluidic cell culture-
devices fabricated using other materials than PS.
Funding information
This research received no specific grant from any funding agency in the public, commercial, or not-for-
profit sectors.
Paper II
103
Acknowledgement
We thank Ulla Riber for assistance with the flow cytometry, Karin Tarp and Panchale Olsen for
assistance with the qRT-PCR, Sylvie Python for help with the cell culture protocol and William Winston
Agace for discussions regarding gene selection.
References
1. Inaba K, Steinman RM, Pack MW, Aya H, Inaba M, Sudo T, et al. Identification of proliferating
dendritic cell precursors in mouse blood. J Exp Med. 1992 May;175(5):1157–67.
2. Castiello L, Sabatino M, Jin P, Clayberger C, Marincola FM, Krensky AM, et al. Monocyte-derived
DC maturation strategies and related pathways: a transcriptional view. Cancer Immunol
Immunother. 2011 Apr;60(4):457–66.
3. Yang L, Carbone DP. Tumor-host immune interactions and dendritic cell dysfunction. Adv
Cancer Res. 2004 Jan;92:13–27.
4. Kusmartsev S, Gabrilovich DI. Role of immature myeloid cells in mechanisms of immune
evasion in cancer. Cancer Immunol Immunother. 2006 Mar;55(3):237–45.
5. Buonerba C, Ferro M, Di Lorenzo G. Sipuleucel-T for prostate cancer: the immunotherapy era
has commenced. Expert Rev Anticancer Ther. 2011 Jan;11(1):25–8.
6. Fairbairn L, Kapetanovic R, Sester DP, Hume DA. The mononuclear phagocyte system of the pig
as a model for understanding human innate immunity and disease. J Leukoc Biol. 2011
Jun;89(6):855–71.
7. Meurens F, Summerfield A, Nauwynck H, Saif L, Gerdts V. The pig: a model for human infectious
diseases. Trends Microbiol. 2012 Jan;20(1):50–7.
8. Kyrova K, Stepanova H, Rychlik I, Polansky O, Leva L, Sekelova Z, et al. The response of porcine
monocyte derived macrophages and dendritic cells to Salmonella Typhimurium and
lipopolysaccharide. BMC Vet Res. 2014 Jan;10(1):244.
9. Johansson E, Domeika K, Berg M, Alm G., Fossum C. Characterisation of porcine monocyte-
derived dendritic cells according to their cytokine profile. Vet Immunol Immunopathol. 2003
Feb;91(3-4):183–97.
10. Facci MR, Auray G, Buchanan R, van Kessel J, Thompson DR, Mackenzie-Dyck S, et al. A
comparison between isolated blood dendritic cells and monocyte-derived dendritic cells in pigs.
Immunology. 2010 Mar;129(3):396–405.
Paper II
104
11. Carrasco CP, Rigden RC, Schaffner R, Gerber H, Neuhaus V, Inumaru S, et al. Porcine dendritic
cells generated in vitro: morphological, phenotypic and functional properties. Immunology.
2001 Oct;104(2):175–84.
12. Chamorro S, Revilla C, Gómez N, Alvarez B, Alonso F, Ezquerra A, et al. In vitro differentiation of
porcine blood CD163- and CD163+ monocytes into functional dendritic cells. Immunobiology.
2004 Jan;209(1-2):57–65.
13. Summerfield A, Auray G, Ricklin M. Comparative dendritic cell biology of veterinary mammals.
Annu Rev Anim Biosci. 2015 Jan;3:533–57.
14. Summerfield A, McCullough KC. The porcine dendritic cell family. Dev Comp Immunol. 2009
Mar;33(3):299–309.
15. Pampaloni F, Reynaud EG, Stelzer EHK. The third dimension bridges the gap between cell
culture and live tissue. Nat Rev Mol Cell Biol. Nature Publishing Group; 2007 Oct;8(10):839–45.
16. Ravi M, Paramesh V, Kaviya SR, Anuradha E, Solomon FDP. 3D cell culture systems: advantages
and applications. J Cell Physiol. 2015 Jan;230(1):16–26.
17. El-Ali J, Sorger PK, Jensen KF. Cells on chips. Nature. 2006 Jul;442(7101):403–11.
18. Berthier E, Young EWK, Beebe D. Engineers are from PDMS-land, Biologists are from
Polystyrenia. Lab Chip. The Royal Society of Chemistry; 2012 Mar;12(7):1224.
19. McDonald JC, Duffy DC, Anderson JR, Chiu DT, Wu H, Schueller OJ, et al. Fabrication of
microfluidic systems in poly(dimethylsiloxane). Electrophoresis. 2000 Jan;21(1):27–40.
20. Łopacińska JM, Emnéus J, Dufva M. Poly(dimethylsiloxane) (PDMS) affects gene expression in
PC12 cells differentiating into neuronal-like cells. PLoS One. 2013 Jan;8(1):e53107.
21. Mohanty S, Amato L, Heiskanen A, Keller SS, Boisen A, Wolff A, et al. Conducting pyrolysed
carbon scaffold for tissue engineering. Proc 39th Int Conf Micro Nano Eng. 2012;
22. Cha KJ, Kim DS. A portable pressure pump for microfluidic lab-on-a-chip systems using a porous
polydimethylsiloxane (PDMS) sponge. Biomed Microdevices. 2011 Oct;13(5):877–83.
23. Mohanty S, Sanger K, Heiskanen A, Trifol J, Szabo P, Dufva M, et al. Fabrication of scalable
tissue engineering scaffolds with dual-pore microarchitecture by combining 3D printing and
particle leaching. Mater Sci Eng C. 2016 Apr;61:180–9.
24. Skovgaard K, Mortensen S, Boye M, Poulsen KT, Campbell FM, Eckersall PD, et al. Rapid and
widely disseminated acute phase protein response after experimental bacterial infection of
pigs. Vet Res. Jan;40(3):23.
25. Vandesompele J, De Preter K, Pattyn F, Poppe B, Van Roy N, De Paepe A, et al. Accurate
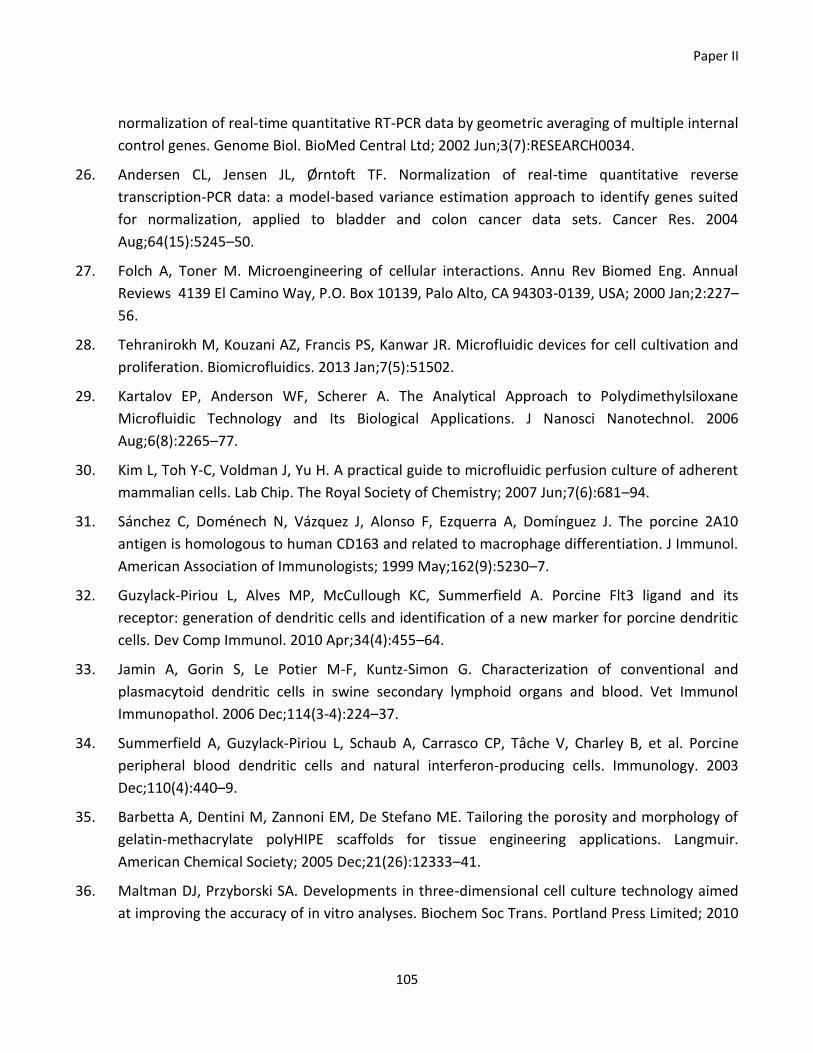
Paper II
105
normalization of real-time quantitative RT-PCR data by geometric averaging of multiple internal
control genes. Genome Biol. BioMed Central Ltd; 2002 Jun;3(7):RESEARCH0034.
26. Andersen CL, Jensen JL, Ørntoft TF. Normalization of real-time quantitative reverse
transcription-PCR data: a model-based variance estimation approach to identify genes suited
for normalization, applied to bladder and colon cancer data sets. Cancer Res. 2004
Aug;64(15):5245–50.
27. Folch A, Toner M. Microengineering of cellular interactions. Annu Rev Biomed Eng. Annual
Reviews 4139 El Camino Way, P.O. Box 10139, Palo Alto, CA 94303-0139, USA; 2000 Jan;2:227–
56.
28. Tehranirokh M, Kouzani AZ, Francis PS, Kanwar JR. Microfluidic devices for cell cultivation and
proliferation. Biomicrofluidics. 2013 Jan;7(5):51502.
29. Kartalov EP, Anderson WF, Scherer A. The Analytical Approach to Polydimethylsiloxane
Microfluidic Technology and Its Biological Applications. J Nanosci Nanotechnol. 2006
Aug;6(8):2265–77.
30. Kim L, Toh Y-C, Voldman J, Yu H. A practical guide to microfluidic perfusion culture of adherent
mammalian cells. Lab Chip. The Royal Society of Chemistry; 2007 Jun;7(6):681–94.
31. Sánchez C, Doménech N, Vázquez J, Alonso F, Ezquerra A, Domínguez J. The porcine 2A10
antigen is homologous to human CD163 and related to macrophage differentiation. J Immunol.
American Association of Immunologists; 1999 May;162(9):5230–7.
32. Guzylack-Piriou L, Alves MP, McCullough KC, Summerfield A. Porcine Flt3 ligand and its
receptor: generation of dendritic cells and identification of a new marker for porcine dendritic
cells. Dev Comp Immunol. 2010 Apr;34(4):455–64.
33. Jamin A, Gorin S, Le Potier M-F, Kuntz-Simon G. Characterization of conventional and
plasmacytoid dendritic cells in swine secondary lymphoid organs and blood. Vet Immunol
Immunopathol. 2006 Dec;114(3-4):224–37.
34. Summerfield A, Guzylack-Piriou L, Schaub A, Carrasco CP, Tâche V, Charley B, et al. Porcine
peripheral blood dendritic cells and natural interferon-producing cells. Immunology. 2003
Dec;110(4):440–9.
35. Barbetta A, Dentini M, Zannoni EM, De Stefano ME. Tailoring the porosity and morphology of
gelatin-methacrylate polyHIPE scaffolds for tissue engineering applications. Langmuir.
American Chemical Society; 2005 Dec;21(26):12333–41.
36. Maltman DJ, Przyborski SA. Developments in three-dimensional cell culture technology aimed
at improving the accuracy of in vitro analyses. Biochem Soc Trans. Portland Press Limited; 2010
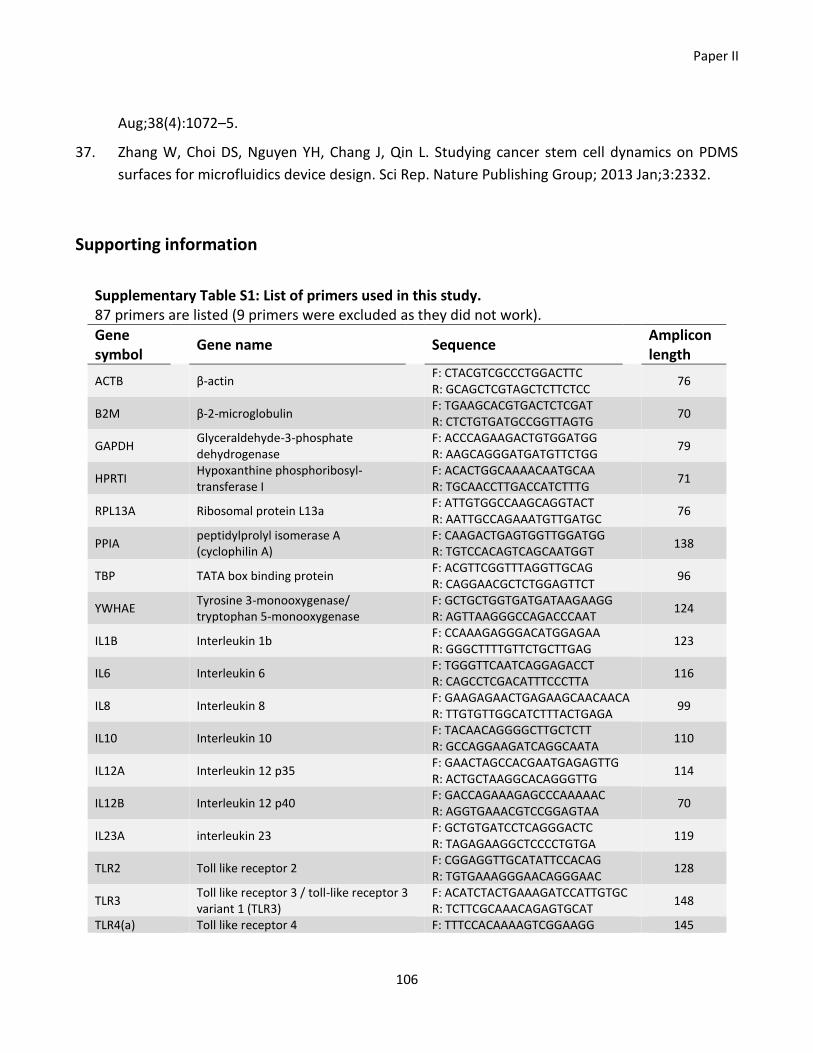
Paper II
106
Aug;38(4):1072–5.
37. Zhang W, Choi DS, Nguyen YH, Chang J, Qin L. Studying cancer stem cell dynamics on PDMS
surfaces for microfluidics device design. Sci Rep. Nature Publishing Group; 2013 Jan;3:2332.
Supporting information
Supplementary Table S1: List of primers used in this study. 87 primers are listed (9 primers were excluded as they did not work).
Gene symbol
Gene name Sequence Amplicon length
ACTB β-actin F: CTACGTCGCCCTGGACTTC R: GCAGCTCGTAGCTCTTCTCC
76
B2M β-2-microglobulin F: TGAAGCACGTGACTCTCGAT R: CTCTGTGATGCCGGTTAGTG
70
GAPDH Glyceraldehyde-3-phosphate dehydrogenase
F: ACCCAGAAGACTGTGGATGG R: AAGCAGGGATGATGTTCTGG
79
HPRTI Hypoxanthine phosphoribosyl-transferase I
F: ACACTGGCAAAACAATGCAA R: TGCAACCTTGACCATCTTTG
71
RPL13A Ribosomal protein L13a F: ATTGTGGCCAAGCAGGTACT R: AATTGCCAGAAATGTTGATGC
76
PPIA peptidylprolyl isomerase A (cyclophilin A)
F: CAAGACTGAGTGGTTGGATGG R: TGTCCACAGTCAGCAATGGT
138
TBP TATA box binding protein F: ACGTTCGGTTTAGGTTGCAG R: CAGGAACGCTCTGGAGTTCT
96
YWHAE Tyrosine 3-monooxygenase/ tryptophan 5-monooxygenase
F: GCTGCTGGTGATGATAAGAAGG R: AGTTAAGGGCCAGACCCAAT
124
IL1B Interleukin 1b F: CCAAAGAGGGACATGGAGAA R: GGGCTTTTGTTCTGCTTGAG
123
IL6 Interleukin 6 F: TGGGTTCAATCAGGAGACCT R: CAGCCTCGACATTTCCCTTA
116
IL8 Interleukin 8 F: GAAGAGAACTGAGAAGCAACAACA R: TTGTGTTGGCATCTTTACTGAGA
99
IL10 Interleukin 10 F: TACAACAGGGGCTTGCTCTT R: GCCAGGAAGATCAGGCAATA
110
IL12A Interleukin 12 p35 F: GAACTAGCCACGAATGAGAGTTG R: ACTGCTAAGGCACAGGGTTG
114
IL12B Interleukin 12 p40 F: GACCAGAAAGAGCCCAAAAAC R: AGGTGAAACGTCCGGAGTAA
70
IL23A interleukin 23 F: GCTGTGATCCTCAGGGACTC R: TAGAGAAGGCTCCCCTGTGA
119
TLR2 Toll like receptor 2 F: CGGAGGTTGCATATTCCACAG R: TGTGAAAGGGAACAGGGAAC
128
TLR3 Toll like receptor 3 / toll-like receptor 3 variant 1 (TLR3)
F: ACATCTACTGAAAGATCCATTGTGC R: TCTTCGCAAACAGAGTGCAT
148
TLR4(a) Toll like receptor 4 F: TTTCCACAAAAGTCGGAAGG 145
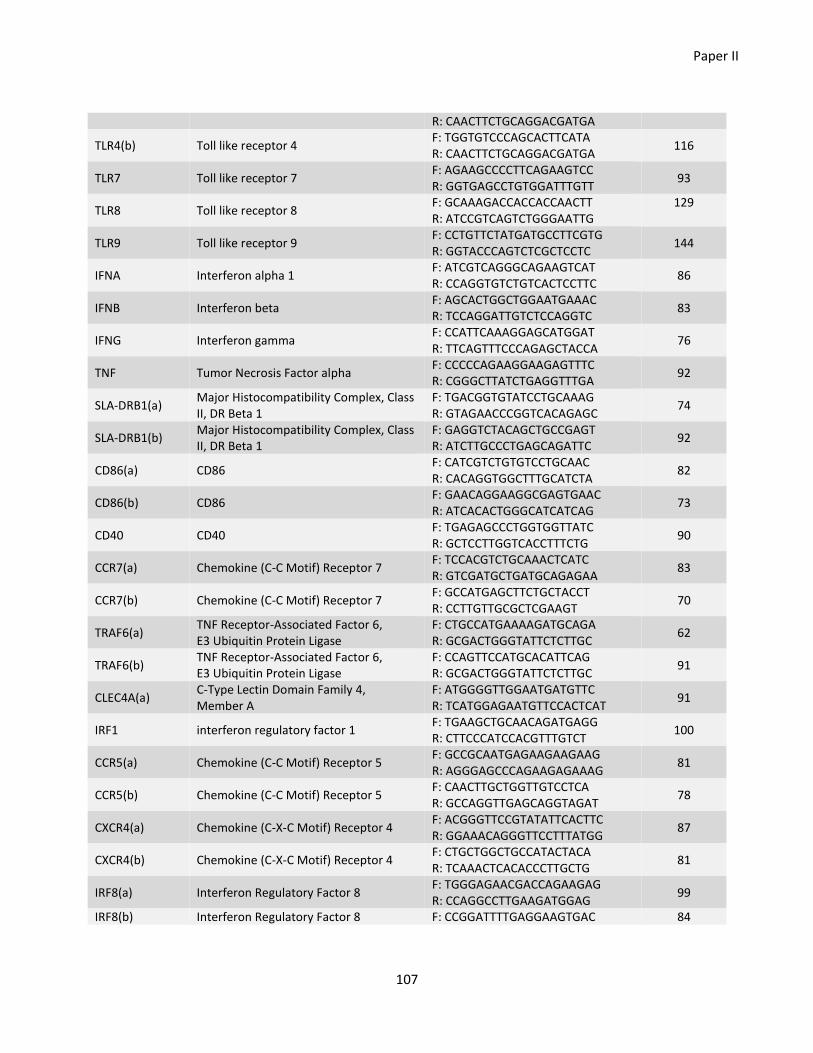
Paper II
107
R: CAACTTCTGCAGGACGATGA
TLR4(b) Toll like receptor 4 F: TGGTGTCCCAGCACTTCATA R: CAACTTCTGCAGGACGATGA
116
TLR7 Toll like receptor 7 F: AGAAGCCCCTTCAGAAGTCC R: GGTGAGCCTGTGGATTTGTT
93
TLR8 Toll like receptor 8 F: GCAAAGACCACCACCAACTT R: ATCCGTCAGTCTGGGAATTG
129
TLR9 Toll like receptor 9 F: CCTGTTCTATGATGCCTTCGTG R: GGTACCCAGTCTCGCTCCTC
144
IFNA Interferon alpha 1 F: ATCGTCAGGGCAGAAGTCAT R: CCAGGTGTCTGTCACTCCTTC
86
IFNB Interferon beta F: AGCACTGGCTGGAATGAAAC R: TCCAGGATTGTCTCCAGGTC
83
IFNG Interferon gamma F: CCATTCAAAGGAGCATGGAT R: TTCAGTTTCCCAGAGCTACCA
76
TNF Tumor Necrosis Factor alpha F: CCCCCAGAAGGAAGAGTTTC R: CGGGCTTATCTGAGGTTTGA
92
SLA-DRB1(a) Major Histocompatibility Complex, Class II, DR Beta 1
F: TGACGGTGTATCCTGCAAAG R: GTAGAACCCGGTCACAGAGC
74
SLA-DRB1(b) Major Histocompatibility Complex, Class II, DR Beta 1
F: GAGGTCTACAGCTGCCGAGT R: ATCTTGCCCTGAGCAGATTC
92
CD86(a) CD86 F: CATCGTCTGTGTCCTGCAAC R: CACAGGTGGCTTTGCATCTA
82
CD86(b) CD86 F: GAACAGGAAGGCGAGTGAAC R: ATCACACTGGGCATCATCAG
73
CD40 CD40 F: TGAGAGCCCTGGTGGTTATC R: GCTCCTTGGTCACCTTTCTG
90
CCR7(a) Chemokine (C-C Motif) Receptor 7 F: TCCACGTCTGCAAACTCATC R: GTCGATGCTGATGCAGAGAA
83
CCR7(b) Chemokine (C-C Motif) Receptor 7 F: GCCATGAGCTTCTGCTACCT R: CCTTGTTGCGCTCGAAGT
70
TRAF6(a) TNF Receptor-Associated Factor 6, E3 Ubiquitin Protein Ligase
F: CTGCCATGAAAAGATGCAGA R: GCGACTGGGTATTCTCTTGC
62
TRAF6(b) TNF Receptor-Associated Factor 6, E3 Ubiquitin Protein Ligase
F: CCAGTTCCATGCACATTCAG R: GCGACTGGGTATTCTCTTGC
91
CLEC4A(a) C-Type Lectin Domain Family 4, Member A
F: ATGGGGTTGGAATGATGTTC R: TCATGGAGAATGTTCCACTCAT
91
IRF1 interferon regulatory factor 1 F: TGAAGCTGCAACAGATGAGG R: CTTCCCATCCACGTTTGTCT
100
CCR5(a) Chemokine (C-C Motif) Receptor 5 F: GCCGCAATGAGAAGAAGAAG R: AGGGAGCCCAGAAGAGAAAG
81
CCR5(b) Chemokine (C-C Motif) Receptor 5 F: CAACTTGCTGGTTGTCCTCA R: GCCAGGTTGAGCAGGTAGAT
78
CXCR4(a) Chemokine (C-X-C Motif) Receptor 4 F: ACGGGTTCCGTATATTCACTTC R: GGAAACAGGGTTCCTTTATGG
87
CXCR4(b) Chemokine (C-X-C Motif) Receptor 4 F: CTGCTGGCTGCCATACTACA R: TCAAACTCACACCCTTGCTG
81
IRF8(a) Interferon Regulatory Factor 8 F: TGGGAGAACGACCAGAAGAG R: CCAGGCCTTGAAGATGGAG
99
IRF8(b) Interferon Regulatory Factor 8 F: CCGGATTTTGAGGAAGTGAC 84
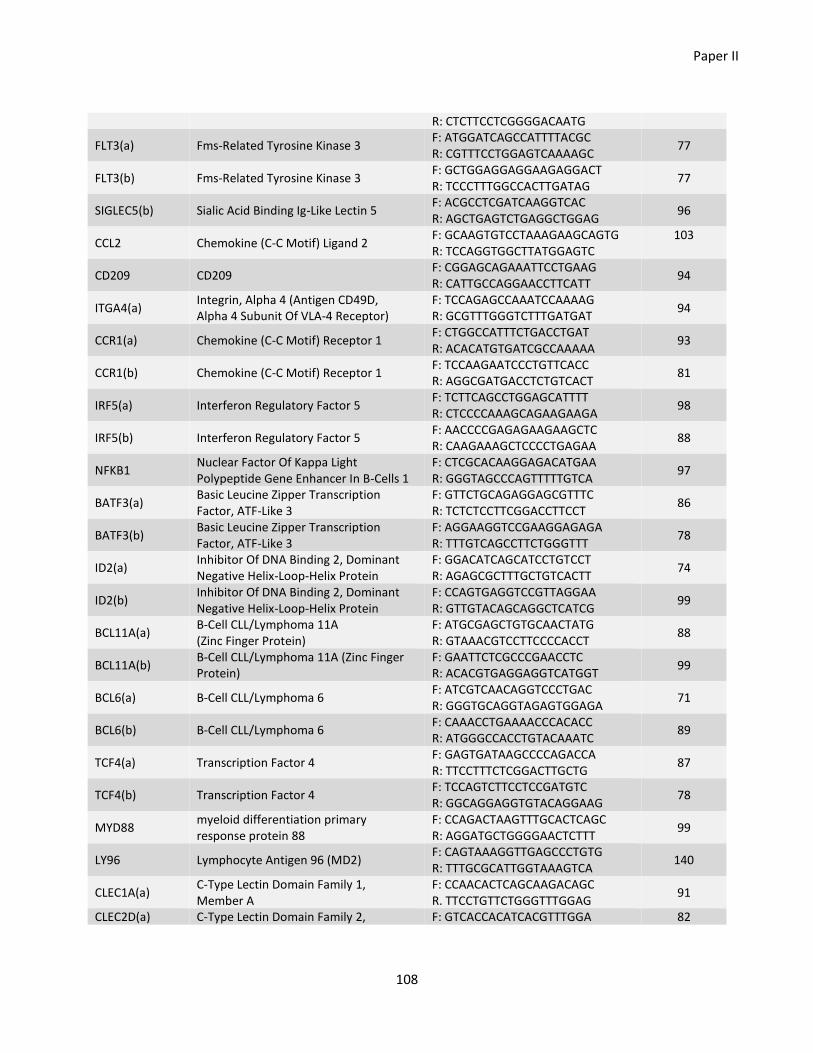
Paper II
108
R: CTCTTCCTCGGGGACAATG
FLT3(a) Fms-Related Tyrosine Kinase 3 F: ATGGATCAGCCATTTTACGC R: CGTTTCCTGGAGTCAAAAGC
77
FLT3(b) Fms-Related Tyrosine Kinase 3 F: GCTGGAGGAGGAAGAGGACT R: TCCCTTTGGCCACTTGATAG
77
SIGLEC5(b) Sialic Acid Binding Ig-Like Lectin 5 F: ACGCCTCGATCAAGGTCAC R: AGCTGAGTCTGAGGCTGGAG
96
CCL2 Chemokine (C-C Motif) Ligand 2 F: GCAAGTGTCCTAAAGAAGCAGTG R: TCCAGGTGGCTTATGGAGTC
103
CD209 CD209 F: CGGAGCAGAAATTCCTGAAG R: CATTGCCAGGAACCTTCATT
94
ITGA4(a) Integrin, Alpha 4 (Antigen CD49D, Alpha 4 Subunit Of VLA-4 Receptor)
F: TCCAGAGCCAAATCCAAAAG R: GCGTTTGGGTCTTTGATGAT
94
CCR1(a) Chemokine (C-C Motif) Receptor 1 F: CTGGCCATTTCTGACCTGAT R: ACACATGTGATCGCCAAAAA
93
CCR1(b) Chemokine (C-C Motif) Receptor 1 F: TCCAAGAATCCCTGTTCACC R: AGGCGATGACCTCTGTCACT
81
IRF5(a) Interferon Regulatory Factor 5 F: TCTTCAGCCTGGAGCATTTT R: CTCCCCAAAGCAGAAGAAGA
98
IRF5(b) Interferon Regulatory Factor 5 F: AACCCCGAGAGAAGAAGCTC R: CAAGAAAGCTCCCCTGAGAA
88
NFKB1 Nuclear Factor Of Kappa Light Polypeptide Gene Enhancer In B-Cells 1
F: CTCGCACAAGGAGACATGAA R: GGGTAGCCCAGTTTTTGTCA
97
BATF3(a) Basic Leucine Zipper Transcription Factor, ATF-Like 3
F: GTTCTGCAGAGGAGCGTTTC R: TCTCTCCTTCGGACCTTCCT
86
BATF3(b) Basic Leucine Zipper Transcription Factor, ATF-Like 3
F: AGGAAGGTCCGAAGGAGAGA R: TTTGTCAGCCTTCTGGGTTT
78
ID2(a) Inhibitor Of DNA Binding 2, Dominant Negative Helix-Loop-Helix Protein
F: GGACATCAGCATCCTGTCCT R: AGAGCGCTTTGCTGTCACTT
74
ID2(b) Inhibitor Of DNA Binding 2, Dominant Negative Helix-Loop-Helix Protein
F: CCAGTGAGGTCCGTTAGGAA R: GTTGTACAGCAGGCTCATCG
99
BCL11A(a) B-Cell CLL/Lymphoma 11A (Zinc Finger Protein)
F: ATGCGAGCTGTGCAACTATG R: GTAAACGTCCTTCCCCACCT
88
BCL11A(b) B-Cell CLL/Lymphoma 11A (Zinc Finger Protein)
F: GAATTCTCGCCCGAACCTC R: ACACGTGAGGAGGTCATGGT
99
BCL6(a) B-Cell CLL/Lymphoma 6 F: ATCGTCAACAGGTCCCTGAC R: GGGTGCAGGTAGAGTGGAGA
71
BCL6(b) B-Cell CLL/Lymphoma 6 F: CAAACCTGAAAACCCACACC R: ATGGGCCACCTGTACAAATC
89
TCF4(a) Transcription Factor 4 F: GAGTGATAAGCCCCAGACCA R: TTCCTTTCTCGGACTTGCTG
87
TCF4(b) Transcription Factor 4 F: TCCAGTCTTCCTCCGATGTC R: GGCAGGAGGTGTACAGGAAG
78
MYD88 myeloid differentiation primary response protein 88
F: CCAGACTAAGTTTGCACTCAGC R: AGGATGCTGGGGAACTCTTT
99
LY96 Lymphocyte Antigen 96 (MD2) F: CAGTAAAGGTTGAGCCCTGTG R: TTTGCGCATTGGTAAAGTCA
140
CLEC1A(a) C-Type Lectin Domain Family 1, Member A
F: CCAACACTCAGCAAGACAGC R. TTCCTGTTCTGGGTTTGGAG
91
CLEC2D(a) C-Type Lectin Domain Family 2, F: GTCACCACATCACGTTTGGA 82
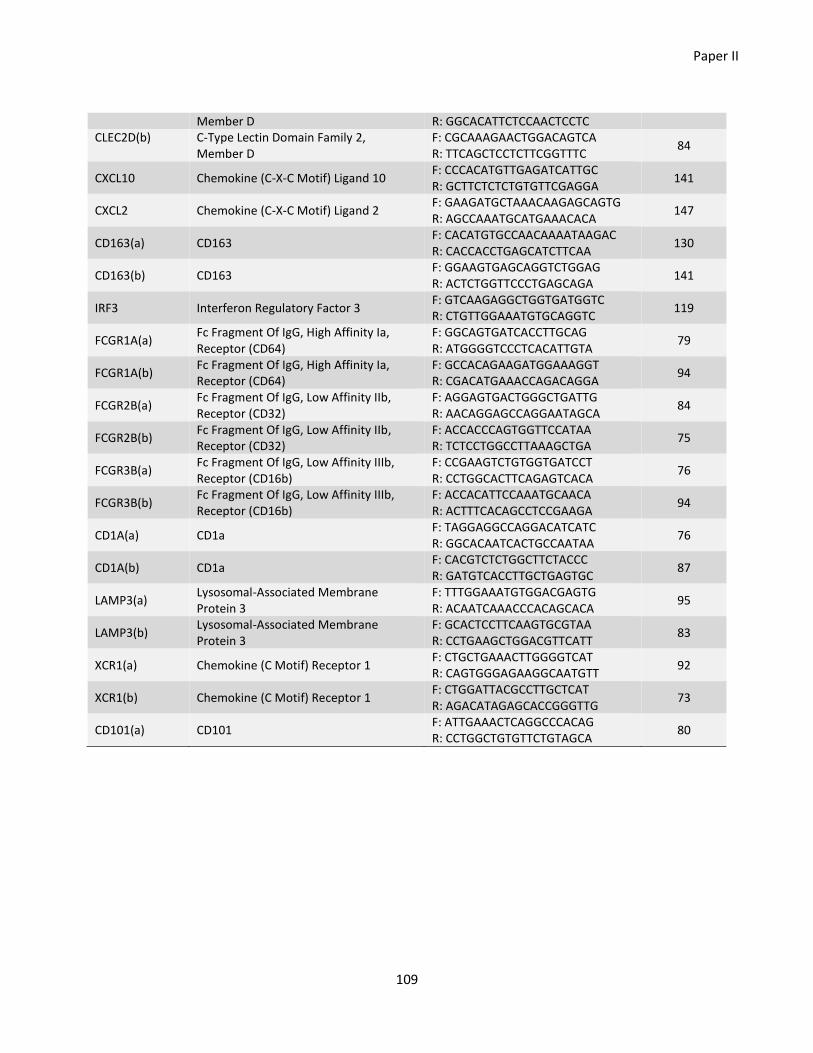
Paper II
109
Member D R: GGCACATTCTCCAACTCCTC CLEC2D(b)
C-Type Lectin Domain Family 2, Member D
F: CGCAAAGAACTGGACAGTCA R: TTCAGCTCCTCTTCGGTTTC
84
CXCL10 Chemokine (C-X-C Motif) Ligand 10 F: CCCACATGTTGAGATCATTGC R: GCTTCTCTCTGTGTTCGAGGA
141
CXCL2 Chemokine (C-X-C Motif) Ligand 2 F: GAAGATGCTAAACAAGAGCAGTG R: AGCCAAATGCATGAAACACA
147
CD163(a) CD163 F: CACATGTGCCAACAAAATAAGAC R: CACCACCTGAGCATCTTCAA
130
CD163(b) CD163 F: GGAAGTGAGCAGGTCTGGAG R: ACTCTGGTTCCCTGAGCAGA
141
IRF3 Interferon Regulatory Factor 3 F: GTCAAGAGGCTGGTGATGGTC R: CTGTTGGAAATGTGCAGGTC
119
FCGR1A(a) Fc Fragment Of IgG, High Affinity Ia, Receptor (CD64)
F: GGCAGTGATCACCTTGCAG R: ATGGGGTCCCTCACATTGTA
79
FCGR1A(b) Fc Fragment Of IgG, High Affinity Ia, Receptor (CD64)
F: GCCACAGAAGATGGAAAGGT R: CGACATGAAACCAGACAGGA
94
FCGR2B(a) Fc Fragment Of IgG, Low Affinity IIb, Receptor (CD32)
F: AGGAGTGACTGGGCTGATTG R: AACAGGAGCCAGGAATAGCA
84
FCGR2B(b) Fc Fragment Of IgG, Low Affinity IIb, Receptor (CD32)
F: ACCACCCAGTGGTTCCATAA R: TCTCCTGGCCTTAAAGCTGA
75
FCGR3B(a) Fc Fragment Of IgG, Low Affinity IIIb, Receptor (CD16b)
F: CCGAAGTCTGTGGTGATCCT R: CCTGGCACTTCAGAGTCACA
76
FCGR3B(b) Fc Fragment Of IgG, Low Affinity IIIb, Receptor (CD16b)
F: ACCACATTCCAAATGCAACA R: ACTTTCACAGCCTCCGAAGA
94
CD1A(a) CD1a F: TAGGAGGCCAGGACATCATC R: GGCACAATCACTGCCAATAA
76
CD1A(b) CD1a F: CACGTCTCTGGCTTCTACCC R: GATGTCACCTTGCTGAGTGC
87
LAMP3(a) Lysosomal-Associated Membrane Protein 3
F: TTTGGAAATGTGGACGAGTG R: ACAATCAAACCCACAGCACA
95
LAMP3(b) Lysosomal-Associated Membrane Protein 3
F: GCACTCCTTCAAGTGCGTAA R: CCTGAAGCTGGACGTTCATT
83
XCR1(a) Chemokine (C Motif) Receptor 1 F: CTGCTGAAACTTGGGGTCAT R: CAGTGGGAGAAGGCAATGTT
92
XCR1(b) Chemokine (C Motif) Receptor 1 F: CTGGATTACGCCTTGCTCAT R: AGACATAGAGCACCGGGTTG
73
CD101(a) CD101 F: ATTGAAACTCAGGCCCACAG R: CCTGGCTGTGTTCTGTAGCA
80
110
Chapter 7 - General discussion
In this chapter, general considerations concerning in vitro culture is presented and discussed. Detailed
discussions on topics related to study I and IIII is presented in paper I and II, respectively.
Conventional in vitro culture
Conventional in vitro culture of cells is usually performed in tissue culture treated 2D culture plates
made in polystyrene, with varying well sizes. IGRA has been used for more than 25 years for
measuring CMI responses within individuals for the purpose of testing vaccine efficacy or as a
diagnostic tool. The test relies on the locomotion of one cell type, namely the T cell and its
engagement with APCs presenting cognate antigen via pMHC complexes. In this sense it can be seen
as a co-culture, where the two cell subtypes need to be in physical contact for the de novo production
of IFN-γ to occur. The culture can be performed using whole blood or PBMCs. By using PBMCs, the
“co-culture” is purest in the sense that only lymphocytes (T-, B- and NK-cells) and monocytes are
present, whereas whole blood cultures also include erythrocytes and granulocytes. In cultures of
PBMCs, cells sediment to the bottom of the well after some time, thus it may be expected that any
migration that takes place is carried out directly on the plastic surface. As whole blood consist of app.
95% erythrocytes, in this type of culture erythrocytes “coat” the bottom well surface thus migration
of T lymphocytes may take place within/on top of the erythrocyte layer. Whether this results in some
migratory advantages/disadvantages needs to be confirmed.
An observation from study I was increased IFN-γ concentrations in polyclonal-activated
cultures of whole blood compared to PBMCs, despite the cell concentration of PBMC cultures
exceeding that of whole blood cultures (7.9 vs. 10x106 cells/ml). This suggests that factors other than
the overall cell concentration may influence the level of IFN-γ detected in the cultures used for IGRA.
An interesting discovery from 2011 reported by Antunes and colleagues, revealed that erythrocytes
are capable of releasing factors into the culture medium, increasing the survival and growth of CD3+ T
lymphocytes (Antunes et al. 2011). Previous studies had shown that the addition of erythrocytes to in
General discussion
111
vitro cultured human T lymphocytes, resulted in increased proliferation regardless of the
erythrocytes being added at the start of culture or 24 hours later, suggesting that the effect exerted
by the erythrocytes were applicable for already activated lymphocytes (Arosa et al. 2004).
Additionally, the mechanisms behind the inhibition of T lymphocyte apoptosis was found to be linked
to upregulation of cytoprotective proteins and downregulation of oxidative stress within the T
lymhocytes (Fonseca 2001; Fonseca et al. 2003).
Antunes and colleagues were able to show that the effect supporting proliferation and survival
of activated T lymphocytes (not B lymphocytes or NK cells) originated from soluble protein/factors
released by intact erythrocytes, which they termed EDGSF (erythrocyte-derived growth and survival
factors). They concluded that erythrocytes are regulatory cells that support growth, proliferation and
survival of dividing T cells by the release of novel factors. This correlates with the finding that addition
of plasma could rescue PBMCs from apoptosis during culture (Hodge et al. 2000), as discussed in
paper I. Thus, testing IFN-γ levels on cells in whole blood format may be desirable for cultures of
intermediate length (overnight cultures) as this seems to protect the T lymphocytes from apoptosis,
yet the nutrient supply should still be adequate within this timeframe.
However, the use of either PBMCs or whole blood cultures for measuring CMI responses is still
under debate. When using IGRA for vaccine efficacy testing, the point is to measure the presence of
antigen-responsive T lymphocytes. Therefore, creating a setting that, despite it being artificial,
resemble the conditions surrounding the cells in vivo, would favor optimal T lymphocyte activation. In
the 2D cultures (whole blood or PBMCs) this is not the case as T lymphocyte migration must be
expected to occur in one plane with no directionality, thus possibly resulting in a sub-optimal setting
for antigen presentation which could lead to decreased sensitivity of the assay. The consequence of
this is rejection of drug/vaccine candidates that might have good in vivo effects, but suffer from poor
in vitro performance due to insufficient antigen-presentation in the 2D culture well.
3D cultures
In the attempt to imitate in vivo conditions during in vitro culture, the obvious next step was to
include a third dimension to the culture. The unnatural 2D environment when culturing cells in vitro
General discussion
112
on glass or plastic surfaces, may provide inaccurate and unreliable data in regards to predictive
outcomes of drug screening tests (Gurski et al. 2010). This “mismatch” between in vitro and in vivo
outcome is causing huge economical losses due to money spent on clinical trials based on pre-studies
using poor correlating in vitro cultures (Hartung 2013). A major limitation of the 2D model is that it
cannot capture the complexity of the in vivo microenvironment, and cell-cell and cell-matrix
interactions important for differentiation, proliferations and cellular functions, are lost (Mazzoleni et
al. 2009). Furthermore studies performed using 2D cultures may also results in misrepresentation of
findings since cells are forced to adapt to an artificial, flat and rigid surface (Mazzoleni et al. 2009).
The development of physiologically relevant 3D in vitro models has mostly focused on long
term culture of cells used for drug screenings etc. In this thesis, focus was on short term culture of
primary immune cells and the hypothesis was, that when culturing cells used for diagnostic
measurements in 2D, as in the case of IGRA, this may not reproduce a CMI response similar to the
response present in vivo, thus decreasing the diagnostic value of the tests. With this in mind, in the
attempt to mimic the in vivo structure of a lymph node in order to increase the changes of T
lymphocyte-APC encounter during in vitro culture, and at the same time keeping the culture format
relatively simple, several 3D incubation setups were tested. The different 3D setups were based on
the addition of 3D scaffolds acting as a network for cell attachment and migration. These were made
from glass wool (with/without extended gravity flow), shavings made in PP, commercial available 3D
scaffolds made in PS or PCL, filter paper disks and a PDMS scaffold. Additionally, coating of some of
these scaffolds with ECM proteins (MaxGel or Matrigel) or CCL21 chemokine to improve cell
attachment and migration, respectively, was also tested.
We did not succeed in developing a 3D platform for IGRA resulting in increased levels of
secreted IFN-γ as compared to the standard assay platform in 2D. This could be due to several causes.
First of all, it would have made sense to look at the kinetics of IFN-γ protein secretion, as was done for
the mRNA expression. Even though the 20-22 hour culture time is a generally accepted and frequently
used time interval when looking at IFN-γ protein, this might not be optimally for 3D cultures. It could
General discussion
113
be speculated if the time interval was simply too short for the 3D architecture to add any advantages
in regards to cell-cell contacts. Secondly, if the cells failed in attaching properly to the tested scaffolds,
but rather “sank” to the bottom of the well, then obviously the scaffolds would lose their effect.
Theoretically this could be the case for a fraction of the cultured cells, but most of the cells would be
expected to reside within or on the scaffolds since caution was made when plating the cells. Also as
some of the scaffolds tested had relatively small pore sizes (20 and 40µm in filter paper and 3D PS
scaffolds, respectively), it would be unlikely if cells sank to the bottom. Also, in the case with ECM-
coated scaffolds, which is believed to increase the surface attachment of the cells (Kleinman et al.
1987; Cooke et al. 2008), this did not seem to improve the assay. Retrospective it would have been
relevant to confirm the inclusion of cells within the different scaffolds for example by scanning
electron microscopy (SEM). Thirdly, 3D culture using artificially scaffolds may simply not be applicable
for this type of short term assay, and it seems as if T lymphocytes are able to migrate (as shown in
Figure 16) and engage with APCs in the 2D plane of a culture well surface even more efficiently than
in an 3D environment, at least the for the type of 3D scaffolds tested in this thesis.
Non-specific activation
A common tendency was elevated background levels of IFN-γ in the 3D cultures compared with 2D
cultures. This suggests that factors other than activation via antigen presentation must have led to the
IFN-γ production in these 3D cultures. It has previously been reported that NK cells are capable of
non-specific IFN-γ secretion in overnight antigen-stimulated cultures from young calves (Olsen et al.
2005). This does not explain the differential finding of non-specific activation in 3D compared to 2D
cultures though. Flow cytometry combining surface labeling with intracellular staining of IFN-γ would
clarify whether this non-specific IFN-γ originated from T lymphocytes or if other cells present in the
cultures such as NK cells or γδ T lymphocytes contributed to the IFN-γ levels. Interestingly, the finding
that 3D culture resulted in increased non-specific activation of cells (at least judged by the level of
IFN-γ) in cultures used for IGRA, correlates with the finding that changing of culture surface
architecture (2D to 3D) resulted in moDCs with increased activation status (paper II). This suggests
that external factors mediated by the shift in culture architecture somehow activate the cells, and this
General discussion
114
applies to both cells of porcine moDC origin and mixed cultures of bovine PBMCs. We only see what
we look for, thus a broader analysis of the nature of activation in the PBMCs, or even in the different
cell subtypes within the PBMC population, would be relevant.
Cells on chip
A lot of research is performed within the development of 3D culture models since they offer a
somewhat complex microenvironment for the cells compared to 2D cultures. Also, the development
of in vivo-correlating in vitro 3D culture models in general would contribute to a reduction in the use
of animal models, which is in accordance to the ethical guidelines concerning the use of animals in
research, defined by the three R´s: Replacement, Reduction and Refinement (Russell & Burch 1959).
In fact, the US National Research Council has recommended that animal models are replaced with in
vitro human cell based assays (Krewski et al. 2010). We aimed at developing a “lymph node-on-a-
chip” system, combining a cell chamber that facilitated lymphocyte migration and activation with
direct detection of IFN-γ using direct one-step qRT-PCR. This combination turned out to be a novel
invention (cf. the novelty search report, appendix 3). It would not only be applicable as a diagnostic
test, it would also be suitable for testing immune-stimulatory/inhibitory agents and thus contribute to
reducing the use of in vivo animal models. Unfortunately we were far from reaching this goal since
neither the 3D “lymph node like” scaffolds seemed to work (off chip), nor did the qRT-PCR reaction. A
prototype chip with different incubation chambers was fabricated. The idea was that by applying a
steady flow through the chamber, relevant cells would attach to the 3D scaffold and liquid be
exchanged without flushing out the cells. The microstructures within the chambers were designed as
a “plan b” if no scaffold-solution was found, and their function was to retain cells while shifting from
blood-flow to qRT-PCR reagent flow. More research was needed for the chip to become a reality and
unfortunately this exceeded the time-frame of the thesis.
Generation of moDCs
Paper II describes the generation of moDC cultured with GM-CSF and IL-4 on various culture surfaces.
It has long been under debate whether in vitro generated moDC could be classified as DC or not (Artur
General discussion
115
Summerfield, personal communication). Classification of DC subsets is complicated and it can be
difficult to differentiate between DCs, macrophages and monocytes since many of the proposed
unique markers and functions have been shown to be shared between cell types (Guilliams et al.
2014). Also the fact that specific markers are not conserved across species as well as the change in
morphology and location of the cells further complicates the nomenclature. However, attempts are
being made to standardize the nomenclature for DC subsets/precursors, and it has been proposed to
simply group these cells under the term “monocyte-derived cells” (Guilliams et al. 2014). The
monocyte-derived cells generated on alternative surfaces in the present study, appeared
macrophage-like in their gene expression profile, whereas monocytes cultured on conventional
surfaces showed “classical” moDC expression and morphology. The fact that external stimuli in the
form of changes in culture surroundings could lead to the differentiation of what appeared to be a
different cell type, argue for the huge plasticity of these cells and that the classification into either DC
or macrophage may be misleading. In fact, this viewpoint is shared by others who suggest a “modular
spectrum model” that argue that monocyte-derived cells being particular plastic are able to express
combinations of multiple transcriptional modules depending on received signals from their
microenvironment (Ginhoux et al. 2015; Xue et al. 2014; Guilliams & van de Laar 2015).
Immunotherapy using moDC generated in vitro have shown varying therapeutic effects and
they often fail in activation of cytotoxic T lymphocytes (Barbuto 2013). In order to induce a strong
response in vivo, the moDC must be able to migrate to the draining lymph node which requires them
to be in an activated state. Lack of activation and migration is usually the reason for the poor
therapeutic effect of these treatments (Wimmers et al. 2014). It would be interesting to investigate if
the different culture methods, apart from changes in gene expression, also gave rise to differential
antigen-presenting abilities and if the migratory capacities of these cells were affected as well. At
least the cells cultured alternatively show an activated phenotype, and it could be speculated that the
flat culture surface generally used for moDC culture is partly the reason for lack of migratory cells and
instead results in “lazy” cells with a gene expression profile adapted to 2D and therefore are not able
to migrate to the draining lymph node when re-introduced to the patient.
116
Chapter 8 - General conclusion
The work presented in this thesis included a revision of procedures commonly used when culturing
cells for immunological studies. We questioned the reliability of IGRAs in terms of its sensitivity
toward changes in culture setup, and challenged the traditional 2D culture by addition of an extra
dimension in the form of 3D scaffolds. Additionally, we examined the effect of external factors on the
differentiation of moDCs by means of changing the material of culture surfaces as well as dimension.
In study I, blood from pre-vaccinated calves with required CMI responses against a MAP
peptide-antigen, was used to investigate factors of influence for the validity of IGRA performed with
cultures of whole blood, diluted whole blood or purified PBMCs in concentrations ranging from 10-
0.625x10⁶ cells/ml. We found large differences in the optimal diagnostic culture conditions with each
individual animal; some calves showed highest specific IFN-γ responses in cultures of whole blood
whereas PBMC cultures of 10x106 or 5x10⁶ cells/ml were found optimal in other calves. Furthermore,
we did the worrying discovery that PBMC cultures were amenable to differences in cellular
composition compared to whole blood; by analyzing the percentages of cellular subsets using flow
cytometry, we found a significantly reduced population of γδ T lymphocytes. Lastly, we were able to
show effect of culture plates from different suppliers, although not significant, and following specific
activation, six out of eight calves tested had optimal response in the same plate from Corning®. These
findings highlights the need for caution when analyzing and comparing IGRA data, as different
conditions infer different results in the same animal.
Culturing cells in 2D is unnatural and cell activation requiring cell-cell contact and thus
migration, is forced down on one plane as opposed to the migration in vivo. In study II, we sought to
alleviate the process of cell activation by facilitating the in vitro migration of cultured cells using 3D
scaffolds and protein coatings. However, these 3D IGRAs did not show superior qualities in terms of
increased cell activation and thus concentrations of IFN-γ compared to 2D IGRAs. A surprising
discovery was that the addition of an extra dimension to the cultures seemed to activate the cells in a
General conclusion
117
non-specific manner. We did not go into detail regarding the circumstances behind this non-specific
activation.
The finding that 3D cultures had an activating effect on cells as well as previous reports
showing a dramatic effect on the gene expression levels of PC12 cells when changing culture material
(Łopacińska et al. 2013), led us to investigate possible effects of changing the culture condition during
the in vitro differentiation of porcine moDC in study IIII. We compared traditional culture surface
material (PS) with an untraditional culture surface made from PDMS, a material frequently used for
lab-on-a-chip device fabrication. The results showed that both the culture surface material (PS vs.
PDMS) as well as the dimension (2D vs. 3D) caused changes in gene expression. PDMS generated cells
with a macrophage-like phenotype and 3D cultures had a positive effect on the activation profile of
the cells. Thus, this study show how sensitive moDCs are to their surrounding environment and it
opens up for the possibility of influencing the expression profile of cultured cells simply by designing
culture setups that favor a desired differentiation path.
Taken together, a microfluidic diagnostic chip for direct detection of CMI responses in a blood
sample was not developed as planned originally. A prototype chip was produced (study III), consisting
of eight chambers having space for a 3D scaffold or with varying microstructures for the capture of
cells. However, neither the detection platform, consisting of direct qRT-PCR nor a 3D scaffold for
increased activation was established. Instead focus within this thesis changed into optimization of in
vitro cell culture conditions. In conclusion, IGRAs, as well as in vitro assays in general, suffer from
severe limitations in terms of imitating in vivo conditions. This might have detrimental consequences
when translating in vitro results into in vivo predictions. Therefore, improved in vivo-like culture
formats applicable for both long and short term routine cultures would be useful and is worth
pursuing.
118
9 References
Antunes, R.F. et al., 2011. Red blood cells release factors with growth and survival bioactivities for normal and leukemic T cells. Immunology and cell biology, 89(1), pp.111–21.
Arosa, F.A., Pereira, C.F. & Fonseca, A.M., 2004. Red blood cells as modulators of T cell growth and survival. Current pharmaceutical design, 10(2), pp.191–201.
Assenmacher, M. et al., 1998. Sequential production of IL-2, IFN-gamma and IL-10 by individual staphylococcal enterotoxin B-activated T helper lymphocytes. European journal of immunology, 28(5), pp.1534–43.
Bajénoff, M. et al., 2007. Highways, byways and breadcrumbs: directing lymphocyte traffic in the lymph node. Trends in immunology, 28(8), pp.346–52.
Barbuto, J.A.M., 2013. Are dysfunctional monocyte-derived dendritic cells in cancer an explanation for cancer vaccine failures? Immunotherapy, 5(2), pp.105–7.
Barker, S.L. & LaRocca, P.J., 1994. Method of production and control of a commercial tissue culture surface. Journal of Tissue Culture Methods, 16(3-4), pp.151–153.
Berthier, E., Young, E.W.K. & Beebe, D., 2012. Engineers are from PDMS-land, Biologists are from Polystyrenia. Lab on a Chip, 12(7), p.1224.
Billman-Jacobe, H. et al., 1992. A comparison of the interferon gamma assay with the absorbed ELISA for the diagnosis of Johne’s disease in cattle. Australian veterinary journal, 69(2), pp.25–8.
Blum, J.S., Wearsch, P.A. & Cresswell, P., 2013. Pathways of antigen processing. Annual review of immunology, 31, pp.443–73.
Boehm, U. et al., 1997. Cellular responses to interferon-gamma. Annual review of immunology, 15, pp.749–95.
Bousso, P. & Robey, E., 2003. Dynamics of CD8+ T cell priming by dendritic cells in intact lymph nodes. Nature immunology, 4(6), pp.579–85.
Chen, J. & Liu, X., 2009. The role of interferon gamma in regulation of CD4+ T-cells and its clinical implications. Cellular immunology, 254(2), pp.85–90.
Choi, Y.W. et al., 1989. Interaction of Staphylococcus aureus toxin “superantigens” with human T cells. Proceedings of the National Academy of Sciences of the United States of America, 86(22), pp.8941–5.
Cooke, M.J. et al., 2008. Enhanced cell attachment using a novel cell culture surface presenting functional domains from extracellular matrix proteins. Cytotechnology, 56(2), pp.71–79.
References
119
Curtis, A.S. et al., 1983. Adhesion of cells to polystyrene surfaces. The Journal of Cell Biology, 97(5), pp.1500–1506.
Danilova, N., 2012. The evolution of adaptive immunity. Advances in experimental medicine and biology, 738, pp.218–35.
Davis, M.M. & Bjorkman, P.J., 1988. T-cell antigen receptor genes and T-cell recognition. Nature, 334(6181), pp.395–402.
Dhillon, N.K. et al., 2007. PDGF Synergistically Enhances IFN- -Induced Expression of CXCL10 in Blood-Derived Macrophages: Implications for HIV Dementia. The Journal of Immunology, 179(5), pp.2722–2730.
Diao, J. et al., 2006. In situ replication of immediate dendritic cell (DC) precursors contributes to conventional DC homeostasis in lymphoid tissue. Journal of immunology (Baltimore, Md. : 1950), 176(12), pp.7196–206.
Eagle, H., 1955. Nutrition needs of mammalian cells in tissue culture. Science (New York, N.Y.), 122(3168), pp.501–14.
Farrar, M.A. & Schreiber, R.D., 1993. The molecular cell biology of interferon-gamma and its receptor. Annual review of immunology, 11, pp.571–611.
Fonseca, A.M., 2001. Red blood cells inhibit activation-induced cell death and oxidative stress in human peripheral blood T lymphocytes. Blood, 97(10), pp.3152–3160.
Fonseca, A.M. et al., 2003. Red blood cells upregulate cytoprotective proteins and the labile iron pool in dividing human T cells despite a reduction in oxidative stress. Free radical biology & medicine, 35(11), pp.1404–16.
Van Furth, R. et al., 1972. [Mononuclear phagocytic system: new classification of macrophages, monocytes and of their cell line]. Bulletin of the World Health Organization, 47(5), pp.651–8.
Van Furth, R., 1980. Identification of Mononuclear Phagocytes: Overview and Definitions. In Methods for Studying Mononuclear Phagocytes. Academid Press, pp. 243–52.
Förster, R., Braun, A. & Worbs, T., 2012. Lymph node homing of T cells and dendritic cells via afferent lymphatics. Trends in immunology, 33(6), pp.271–80.
Gay, D. et al., 1993. Receptor editing: an approach by autoreactive B cells to escape tolerance. The Journal of experimental medicine, 177(4), pp.999–1008.
Ginhoux, F. et al., 2015. New insights into the multidimensional concept of macrophage ontogeny, activation and function. Nature immunology, 17(1), pp.34–40.
References
120
Girard, J.-P., Moussion, C. & Förster, R., 2012. HEVs, lymphatics and homeostatic immune cell trafficking in lymph nodes. Nature reviews. Immunology, 12(11), pp.762–73.
Goldszmid, R.S. & Trinchieri, G., 2012. The price of immunity. Nature immunology, 13(10), pp.932–8.
Gollmer, K. et al., 2009. CCL21 mediates CD4+ T-cell costimulation via a DOCK2/Rac-dependent pathway. Blood, 114(3), pp.580–8.
Gretz, J.E. et al., 1996. Sophisticated strategies for information encounter in the lymph node: the reticular network as a conduit of soluble information and a highway for cell traffic. Journal of immunology (Baltimore, Md. : 1950), 157(2), pp.495–9.
Guilliams, M. et al., 2014. Dendritic cells, monocytes and macrophages: a unified nomenclature based on ontogeny. Nature reviews. Immunology, 14(8), pp.571–8.
Guilliams, M. & van de Laar, L., 2015. A Hitchhiker’s Guide to Myeloid Cell Subsets: Practical Implementation of a Novel Mononuclear Phagocyte Classification System. Frontiers in immunology, 6, p.406.
Gurski, L. et al., 2010. 3D matrices for anti-cancer drug testing and development. Oncology Issues.
Haig, D.M. & Miller, H.R.P., 1990. Differentiationof bone marrow cells into effector cells. In J. M. Behnke, ed. Parasites: Immunity And Pathology: The Consequences Of Parasitic Infections In Mammals. CRC Press, p. 437.
Harrison, R.G., 1911. ON THE STEREOTROPISM OF EMBRYONIC CELLS. Science (New York, N.Y.), 34(870), pp.279–81.
Hartley, S.B. et al., 1993. Elimination of self-reactive B lymphocytes proceeds in two stages: arrested development and cell death. Cell, 72(3), pp.325–35.
Hartung, T., 2013. Look back in anger - what clinical studies tell us about preclinical work. ALTEX, 30(3), pp.275–91.
Hiromatsu, K. et al., 1992. A protective role of gamma/delta T cells in primary infection with Listeria monocytogenes in mice. The Journal of experimental medicine, 175(1), pp.49–56.
Hodge, G., Hodge, S. & Han, P., 2000. Increased levels of apoptosis of leukocyte subsets in cultured PBMCs compared to whole blood as shown by Annexin V binding: relevance to cytokine production. Cytokine, 12(12), pp.1763–8.
Italiani, P. & Boraschi, D., 2014. From Monocytes to M1/M2 Macrophages: Phenotypical vs. Functional Differentiation. Frontiers in Immunology, 5, p.514.
Janikashvili, N., Larmonier, N. & Katsanis, E., 2010. Personalized dendritic cell-based tumor immunotherapy. Immunotherapy, 2(1), pp.57–68.
References
121
Jenkins, M.K. & Moon, J.J., 2012. The role of naive T cell precursor frequency and recruitment in dictating immune response magnitude. Journal of immunology (Baltimore, Md. : 1950), 188(9), pp.4135–40.
Jungersen, G. et al., 2002. Interpretation of the gamma interferon test for diagnosis of subclinical paratuberculosis in cattle. Clinical and diagnostic laboratory immunology, 9(2), pp.453–60.
Jungersen, G., Mikkelsen, H. & Grell, S.N., 2012. Use of the johnin PPD interferon-gamma assay in control of bovine paratuberculosis. Veterinary immunology and immunopathology, 148(1-2), pp.48–54.
Kennedy, H.E., 2002. Modulation of Immune Responses to Mycobacterium bovis in Cattle Depleted of WC1+gammadelta T Cells. Infection and Immunity, 70(3), pp.1488–1500.
King, D.P. et al., 1999. Cutting edge: protective response to pulmonary injury requires gamma delta T lymphocytes. Journal of immunology (Baltimore, Md. : 1950), 162(9), pp.5033–6.
Kleinman, H.K. et al., 1987. Use of extracellular matrix components for cell culture. Analytical biochemistry, 166(1), pp.1–13.
Korohoda, W., 1972. Some aspects of the interrelation among cell locomotion, contact phenomena, and cellular multiplication. Acta Protozoologica, 11.
Krewski, D. et al., 2010. Toxicity testing in the 21st century: a vision and a strategy. Journal of toxicology and environmental health. Part B, Critical reviews, 13(2-4), pp.51–138.
Kwok, W.W. et al., 2012. Frequency of epitope-specific naive CD4(+) T cells correlates with immunodominance in the human memory repertoire. Journal of immunology (Baltimore, Md. : 1950), 188(6), pp.2537–44.
Liu, M. & Schatz, D.G., 2009. Balancing AID and DNA repair during somatic hypermutation. Trends in immunology, 30(4), pp.173–81.
Łopacińska, J.M., Emnéus, J. & Dufva, M., 2013. Poly(dimethylsiloxane) (PDMS) affects gene expression in PC12 cells differentiating into neuronal-like cells. PloS one, 8(1), p.e53107.
Maltman, D.J. & Przyborski, S.A., 2010. Developments in three-dimensional cell culture technology aimed at improving the accuracy of in vitro analyses. Biochemical Society transactions, 38(4), pp.1072–5.
Manz, A., Graber, N. & Widmer, H.M., 1990. Miniaturized total chemical analysis systems: A novel concept for chemical sensing. Sensors and Actuators B: Chemical, 1(1-6), pp.244–248.
Mazurek, G.H. & Villarino, M.E., 2003. Guidelines for using the QuantiFERON-TB test for diagnosing latent Mycobacterium tuberculosis infection. Centers for Disease Control and Prevention. MMWR. Recommendations and reports : Morbidity and mortality weekly report. Recommendations and reports / Centers for Disease Control, 52(RR-2), pp.15–8.
References
122
Mazzoleni, G., Di Lorenzo, D. & Steimberg, N., 2009. Modelling tissues in 3D: the next future of pharmaco-toxicology and food research? Genes & nutrition, 4(1), pp.13–22.
Medzhitov, R., 2008. The Innate Immune System. In W. E. Paul, ed. Fundamental Immunology. Lippincott Williams & Wilkins.
Menegatti, E. et al., 2013. Lab-on-a-chip: emerging analytical platforms for immune-mediated diseases. Autoimmunity reviews, 12(8), pp.814–20.
Mikkelsen, H., Jungersen, G. & Nielsen, S.S., 2009. Association between milk antibody and interferon-gamma responses in cattle from Mycobacterium avium subsp. paratuberculosis infected herds. Veterinary Immunology and Immunopathology, 127(3-4), pp.235–241.
Miller, M.J. et al., 2004. T cell repertoire scanning is promoted by dynamic dendritic cell behavior and random T cell motility in the lymph node. Proceedings of the National Academy of Sciences of the United States of America, 101(4), pp.998–1003.
Moser, B. & Loetscher, P., 2001. Lymphocyte traffic control by chemokines. Nature immunology, 2(2), pp.123–8.
Munoz, M.A., Biro, M. & Weninger, W., 2014. T cell migration in intact lymph nodes in vivo. Current opinion in cell biology, 30, pp.17–24.
Muramatsu, M. et al., 2000. Class switch recombination and hypermutation require activation-induced cytidine deaminase (AID), a potential RNA editing enzyme. Cell, 102(5), pp.553–63.
Murphy, K., 2012. Janeway’s Immunobiology 8th ed., New York, USA & Abingdon, UK: Garland Science.
Naik, S.H. et al., 2007. Development of plasmacytoid and conventional dendritic cell subtypes from single precursor cells derived in vitro and in vivo. Nature immunology, 8(11), pp.1217–26.
Naik, S.H. et al., 2006. Intrasplenic steady-state dendritic cell precursors that are distinct from monocytes. Nature immunology, 7(6), pp.663–71.
Olsen, I. et al., 2005. Bovine NK cells can produce gamma interferon in response to the secreted mycobacterial proteins ESAT-6 and MPP14 but not in response to MPB70. Infection and immunity, 73(9), pp.5628–35.
Palucka, K. & Banchereau, J., 2012. Cancer immunotherapy via dendritic cells. Nature reviews. Cancer, 12(4), pp.265–77.
Pinchuk, I. V, Beswick, E.J. & Reyes, V.E., 2010. Staphylococcal enterotoxins. Toxins, 2(8), pp.2177–97.
Ramos, R.N. et al., 2012. Monocyte-derived dendritic cells from breast cancer patients are biased to induce CD4+CD25+Foxp3+ regulatory T cells. Journal of leukocyte biology, 92(3), pp.673–82.

References
123
Randolph, G.J., Jakubzick, C. & Qu, C., 2008. Antigen presentation by monocytes and monocyte-derived cells. Current opinion in immunology, 20(1), pp.52–60.
Ravi, M. et al., 2015. 3D cell culture systems: advantages and applications. Journal of cellular physiology, 230(1), pp.16–26.
Romagnani, S., 1994. Lymphokine production by human T cells in disease states. Annual review of immunology, 12, pp.227–57.
Romani, N. et al., 1994. Proliferating dendritic cell progenitors in human blood. The Journal of experimental medicine, 180(1), pp.83–93.
Rothel, J.S. et al., 1990. A sandwich enzyme immunoassay for bovine interferon-gamma and its use for the detection of tuberculosis in cattle. Australian veterinary journal, 67(4), pp.134–7.
Rothel, J.S. et al., 1992. The gamma-interferon assay for diagnosis of bovine tuberculosis in cattle: conditions affecting the production of gamma-interferon in whole blood culture. Australian veterinary journal, 69(1), pp.1–4.
Ruhwald, M., Aabye, M.G. & Ravn, P., 2012. IP-10 release assays in the diagnosis of tuberculosis infection: current status and future directions. Expert review of molecular diagnostics, 12(2), pp.175–87.
Russell, W. & Burch, R., 1959. The principles of humane experimental technique.
Sallusto, F. & Lanzavecchia, A., 1994. Efficient presentation of soluble antigen by cultured human dendritic cells is maintained by granulocyte/macrophage colony-stimulating factor plus interleukin 4 and downregulated by tumor necrosis factor alpha. The Journal of experimental medicine, 179(4), pp.1109–18.
Savina, A. & Amigorena, S., 2007. Phagocytosis and antigen presentation in dendritic cells. Immunological reviews, 219, pp.143–56.
Schatz, D.G., 2004. V(D)J recombination. Immunological reviews, 200, pp.5–11.
Schoenborn, J.R. & Wilson, C.B., 2007. Regulation of interferon-gamma during innate and adaptive immune responses. Advances in immunology, 96, pp.41–101.
Schroder, K. et al., 2004. Interferon-gamma: an overview of signals, mechanisms and functions. Journal of leukocyte biology, 75(2), pp.163–89.
Snapka, R.M., 1979. Glass wool as a surface for cell growth in vitro. Tissue Culture Association Manual, 5(3), pp.1117–1120.
Sobocinski, G.P. et al., 2010. Ultrastructural localization of extracellular matrix proteins of the lymph node cortex: evidence supporting the reticular network as a pathway for lymphocyte migration. BMC immunology, 11(1), p.42.
References
124
Tanaka, H. & Taniuchi, I., 2014. The CD4/CD8 lineages: central decisions and peripheral modifications for T lymphocytes. Current topics in microbiology and immunology, 373, pp.113–29.
Teach, W.C. & Kiessling, G.C., 1960. Polystyrene, New York, NY: Reinhold Publishing Corp.
Terry, S., 1975. A gas chromatographic air analyser fabricated on silicon wafer using integrated circuit technology. Ph.D. Thesis, Stanford University.
Thakur, A., Pedersen, L.E. & Jungersen, G., 2012. Immune markers and correlates of protection for vaccine induced immune responses. Vaccine, 30(33), pp.4907–20.
Tonegawa, S., 1983. Somatic generation of antibody diversity. Nature, 302(5909), pp.575–81.
Weninger, W., Biro, M. & Jain, R., 2014. Leukocyte migration in the interstitial space of non-lymphoid organs. Nature reviews. Immunology, 14(4), pp.232–46.
Wilson, R.A. et al., 1996. T-cell subsets in blood and lymphoid tissues obtained from fetal calves, maturing calves, and adult bovine. Veterinary immunology and immunopathology, 53(1-2), pp.49–60.
Wimmers, F. et al., 2014. Paradigm Shift in Dendritic Cell-Based Immunotherapy: From in vitro Generated Monocyte-Derived DCs to Naturally Circulating DC Subsets. Frontiers in immunology, 5, p.165.
Wood, P.R., Corner, L.A. & Plackett, P., 1990. Development of a simple, rapid in vitro cellular assay for bovine tuberculosis based on the production of gamma interferon. Research in veterinary science, 49(1), pp.46–9.
Wood, P.R., Kopsidas, K., Milner, A.R., Hill, J., Gill, I., Webb, R., Mack, W.N., Coates, K., 1989. The development of an in vitro cellular assay for Johne’s disease in cattle. In A. R. Milner & P. R. Wood, eds. Johne’s Disease: Current Trends in Research, Diagnosis and Management. East Melbourne, Australia: CSIRO Publications, pp. 164–167.
Woolf, E. et al., 2007. Lymph node chemokines promote sustained T lymphocyte motility without triggering stable integrin adhesiveness in the absence of shear forces. Nature immunology, 8(10), pp.1076–85.
Worbs, T., Bernhardt, G. & Förster, R., 2008. Factors governing the intranodal migration behavior of T lymphocytes. Immunological reviews, 221, pp.44–63.
Xue, J. et al., 2014. Transcriptome-based network analysis reveals a spectrum model of human macrophage activation. Immunity, 40(2), pp.274–88.
Yamada, K.M. & Cukierman, E., 2007. Modeling tissue morphogenesis and cancer in 3D. Cell, 130(4), pp.601–10.
Yang, H. & Parkhouse, R.M., 2000. Characterization of the porcine gammadelta T-cell receptor structure and cellular distribution by monoclonal antibody PPT27. Immunology, 99(4), pp.504–9.

References
125
Yang, H. & Parkhouse, R.M., 1996. Phenotypic classification of porcine lymphocyte subpopulations in blood and lymphoid tissues. Immunology, 89(1), pp.76–83.
Zhang, C., Zhang, J. & Tian, Z., 2006. The regulatory effect of natural killer cells: do “NK-reg cells” exist? Cellular & molecular immunology, 3(4), pp.241–54.
Aabye, M.G. et al., 2012. A simple method to quantitate IP-10 in dried blood and plasma spots. PloS one, 7(6), p.e39228.
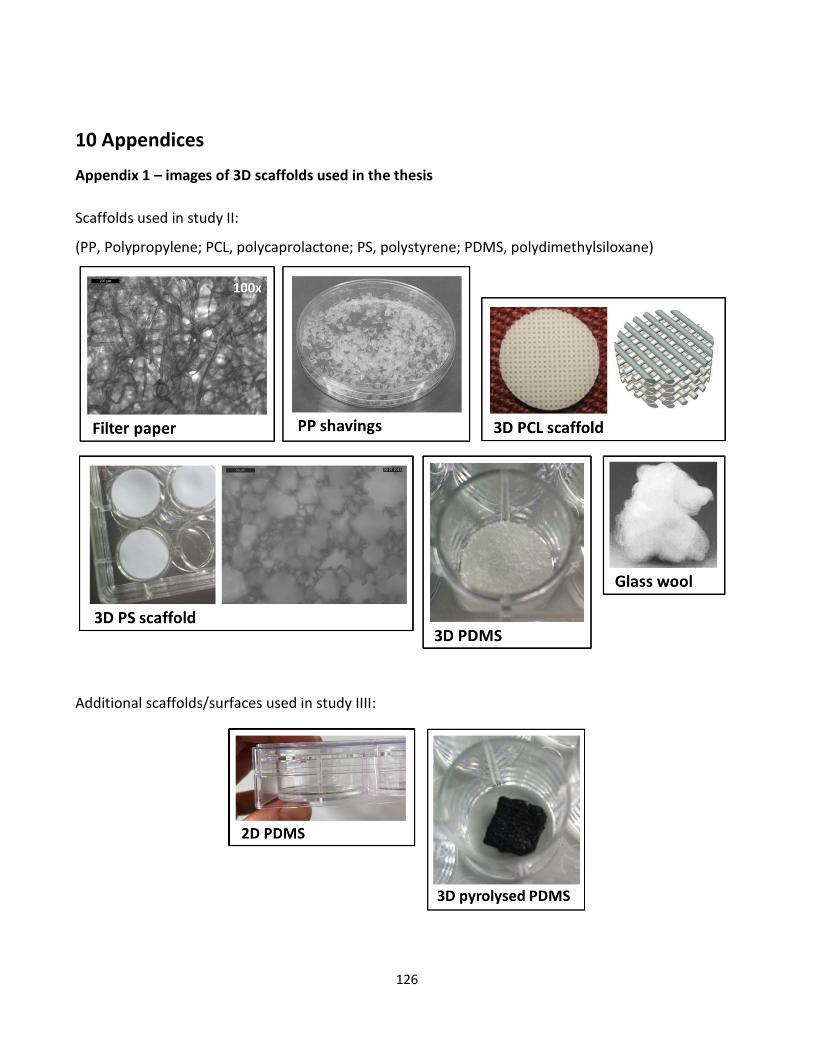
126
10 Appendices
Appendix 1 – images of 3D scaffolds used in the thesis
Scaffolds used in study II:
(PP, Polypropylene; PCL, polycaprolactone; PS, polystyrene; PDMS, polydimethylsiloxane)
Additional scaffolds/surfaces used in study IIII:
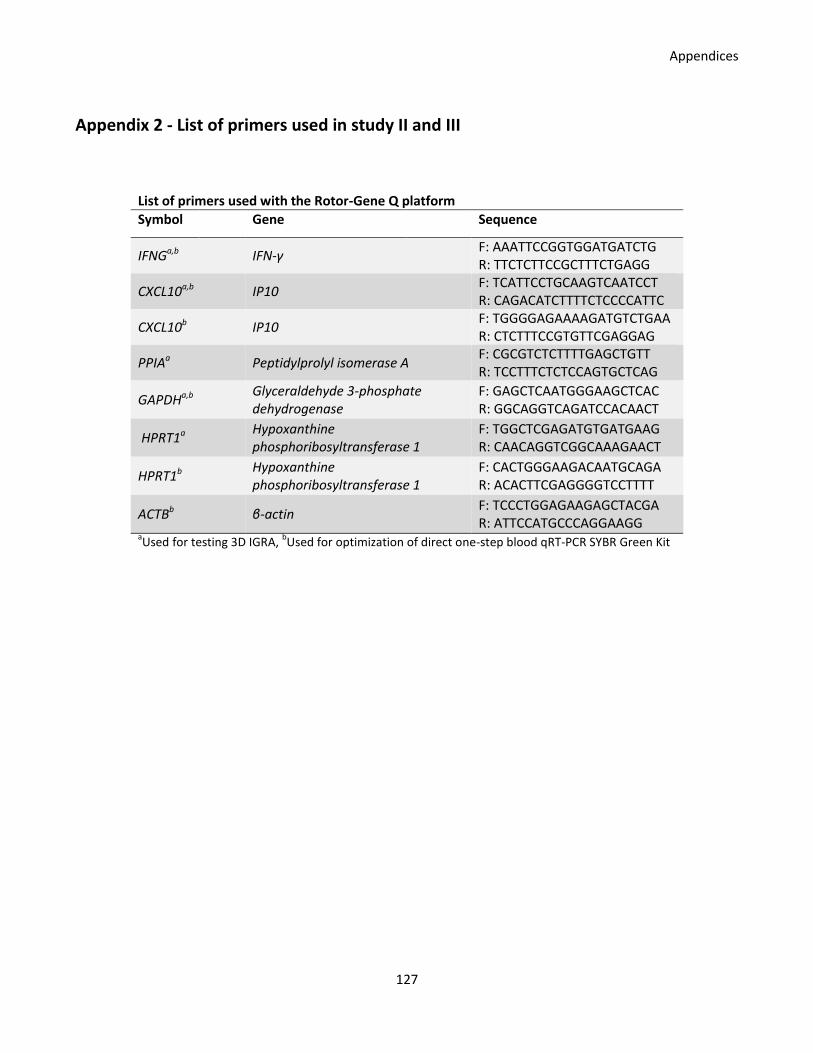
Appendices
127
Appendix 2 - List of primers used in study II and III
List of primers used with the Rotor-Gene Q platform
Symbol Gene Sequence
IFNGa,b IFN-γ F: AAATTCCGGTGGATGATCTG R: TTCTCTTCCGCTTTCTGAGG
CXCL10a,b IP10 F: TCATTCCTGCAAGTCAATCCT R: CAGACATCTTTTCTCCCCATTC
CXCL10b IP10 F: TGGGGAGAAAAGATGTCTGAA R: CTCTTTCCGTGTTCGAGGAG
PPIAa Peptidylprolyl isomerase A F: CGCGTCTCTTTTGAGCTGTT R: TCCTTTCTCTCCAGTGCTCAG
GAPDHa,b Glyceraldehyde 3-phosphate dehydrogenase
F: GAGCTCAATGGGAAGCTCAC R: GGCAGGTCAGATCCACAACT
HPRT1a Hypoxanthine phosphoribosyltransferase 1
F: TGGCTCGAGATGTGATGAAG R: CAACAGGTCGGCAAAGAACT
HPRT1b Hypoxanthine phosphoribosyltransferase 1
F: CACTGGGAAGACAATGCAGA R: ACACTTCGAGGGGTCCTTTT
ACTBb β-actin F: TCCCTGGAGAAGAGCTACGA R: ATTCCATGCCCAGGAAGG
aUsed for testing 3D IGRA,
bUsed for optimization of direct one-step blood qRT-PCR SYBR Green Kit
Appendices
128
Appendix 3 - Novelty Search Report (study II)
Diagnostic reticular chip combining micro fluidics with qRT-PCR for the
detection of antigen-specific cell-mediated immune responses
Aim and background of the invention
The present invention aims at developing a chip that can be used as a simple and quick diagnostic tool
for the indirect detection of an intracellular infection (e.g. tuberculosis) in a blood sample by
detecting the presence of a specific cell-mediated immune response directed against antigens from
the infectious agent.
In the diagnostic methods presently used for testing a cell-mediated immune response against
tuberculosis, blood is incubated together with antigen in a plate or tube for 16-24 hours. The
supernatant is harvested and tested for the presence of cytokines using ELISA (QuantiFERON-TB Gold
or QuantiFERON-TB Gold In-Tube), or the specific cytokine-producing T cells are counted using
ELISPOT (T-SPOT.TB). In the plate or tube, the T cells will have to interact with antigen-presenting
monocytes to become activated and start to produce the cytokines that are used as a measure for the
presence of a specific cell-mediated immune response. The cell-cell contact is a concern, however,
since there is the risk that some specific T cells will not become activated because they do not interact
with the monocytes. This would give rise to false negative results (i.e. where a positive blood sample
does not give a positive read-out because of lack of specific T cell-monocyte interaction in the test
tube/plate).
In vivo, once activated, the antigen-presenting cells (APCs), mainly dendritic cells, will migrate via the
lymphatic system to the draining lymph node. Lymph nodes are specialized structures located in the
interface of the blood and the lymphatic system, and therefore facilitate the interaction between
APCs entering through the lymph and naïve T cells entering via blood vessels. In this way the lymph
Appendices
129
nodes contribute efficiently to the initiation of adaptive immune responses. Lymph nodes are divided
into different areas termed B-cell zones and T-cell zones, according to the primary type of lymphocyte
found in these areas. Naïve T cells, as well as antigen-experienced T cells, constantly circulate the
body via blood and lymph in search for antigen presented to them by APCs. When T cells arrive at a
lymph node they enter the T cell zone. Here, special cells called fibroblastic reticular cells (FRCs)
produce and ensheath a 3 dimensional (3D) reticular network consisting of extracellular matrix
proteins, including collagens, laminin, fibronectin and tenascin1. T cells travel along this network via
chemotaxis toward “trapped”, activated APCs. This extracellular lymph node-architecture is a clever
solution to the challenge of enabling physical contact between specific cells that are only present in
negligible numbers.
Description of the invention
In the context of diagnostics, imitating the extracellular reticular network of a lymph node using a
protein matrix, increases the chance of specific cell-cell contact. In the present invention, a stabilized
blood sample is applied to a chip, together with antigens from the pathogen of interest, and lead
through the extracellular protein matrix. Due to the “stickiness” of the monocytes (APC precursor
cells) present in the blood sample, these cells will stick to the matrix, take up the antigen, process it,
and present it on their cell surface. Additionally, they will start to secrete chemokines as a result of
their activation. T cells, which are less sticky, are able to “travel” along the matrix following the
chemokine gradients created by the stationary, activated APCs. This will increase the chance of
specific T cell-APC encounter and thus increase the reliability of the results, since the risk of false
negatives is decreased. Only if the specific T cells already have been exposed to the antigen prior to
the test (hence in an infected individual), the induced immune-response in the form of cytokine
release, will exceed a threshold and yield a positive readout. The result is read directly on the chip
using a built-in quantitative reverse transcriptase polymerase chain reaction (qRT-PCR). Since the
1 Sobocinski GP, Toy K, Bobrowski WF, Shaw S, Anderson AO, Kaldjian EP (2010): Ultrastructural localization of extracellular matrix
proteins of the lymph node cortex: evidence supporting the reticular network as a pathway for lymphocyte migration. BMC Immunol.
Aug; 11(42).
Appendices
130
readout is based on the presence of mRNA and not proteins the result is expected to be ready after
only a few hours.
The main advantages of this chip compared to presently used in vitro cell culture tests, is that since
the result is expected to be read after only a few hours, the patient tested can get the result within
the same day. This is important when diagnosing for example patients in developing countries that
might have travelled a long way to get to the clinic, and does not have the possibility to wait a few
days for the result. In developed countries the chip will ease the diagnosis of, for example, homeless
people that do not have a contact address. Instead they can get the results directly at the clinic after a
few hours, and a treatment can be initiated. Another advantage is that the blood is directly added to
the chip, and therefore does not need to first be transported to a laboratory, thus it is not a concern
whether the cells are still viable. Since the blood does not need to be incubated and then analyzed by
trained personnel and since the volume of blood, and therefore also reagents, is minimal, this
diagnostic chip will be cheaper than the present solutions. It is, however, a necessity that the clinics
that are performing the tests have a reader that can translate the qRT-PCR results, but this is a one-
time expense.
This invention is generic – the chip is not restricted to one specific disease, but can in principle be
used to diagnose other infections that elicit a cell-mediated immune response in humans as well as
animals, such as HIV, malaria, brucellosis and paratuberculosis. Also it might be useful in the
prognosis of cancer since the activity of the cancer-specific cell-mediated immune response is
important in controlling cancer development.
Appendices
131
Intellectual property right (IPR) landscape - Novelty search
Searched patent/literature databases:
Patents o Derwent Innovations Index
Papers o Web of Science o PubMed – NCBI
Others o Google search
Search profile (words used):
Same words used when searching for patents and papers:
1. Topic=(chip* or micro chip* or microchip* or nano chip* or nanochip* or lab on a chip* or
lab-on-a-chip* or LOC)
2. Topic=(polymerase chain reaction or PCR or qRT PCR or qRT-PCR or quantitative real time
polymerase chain reaction)
3. Topic=(diagnostic* or diagnose*)
4. Topic=(cell-mediated immune respons* or CMI or cell mediated immune respons* or cell
mediated immunerespons*)
5. Topic=(micro fluidic* or microfluidic*)
6. Topic=(detect* or discover* or measure*)
7. Topic=(interferon gamma* or IFN-g or interferon-gamma or interferon-g or interferon* or
IFN)
Derwent
o (Chemical Section, Electrical and Electronic Section, Engineering Section, Timespan = All
Years)
Web of Science
o (Databases = Science Citation Index Expanded, Social Sciences Citation Index, Arts &
Humanities Citation Index, Timespan = All Years)
PubMed –NCBI
o (All Fields)
Appendices
132
o “tuberculosis + low cost + diagnostic + blood”
o “artificial lymph node”
Patents or papers from cooperative scientists:
Patents
Hansen, Mikkel Fougt; Damsgaard, Christian Danvad; Larsen, Niels Bent; Wolff, Anders (2011)
Sample processing device and method. Patent No 20110818
Christer Spegel, Simon Pedersen, Ras K. Vestergaard, Tautgirdas Ruzgas, Rafel, Taboryski,
Anders Wolff (2007). Determining and monitoring system for properties in single particle e.g.
biological cell, has one interface used for interfacing the substrate with an analyzing system.
WO2007104565
Papers
Gregers Jungersen
References related to diagnosis of cell-mediated immunity
o Cordes H., Riber, U., Jensen, T.K., and Jungersen, G. Cell-mediated and humoral immune
responses in pigs following primary and challenge-exposure to Lawsonia intracellularis.
Veterinary Research In press
o Thomsen, V.T., Nielsen, S.S., Thakur, A., Jungersen, G. Characterization of the long-term
immune response to vaccination against Mycobacterium avium subsp. paratuberculosis in
Danish dairy cows. Veterinary Immunology and Immunopathology In press
o Jungersen G., Mikkelsen, H. and Grell, S.N. Use of the johnin PPD interferon-gamma assay
in control of bovine paratuberculosis. 2011. Veterinary Immunology and Immunopathology
In press
o Mikkelsen H, Aagaard C, Nielsen SS, Jungersen G. 2011. Novel antigens for detection of cell
mediated immune responses to Mycobacterium avium subsp. paratuberculosis infection in
cattle. Veterinary Immunology and Immunopathology 143: 46-54.
Appendices
133
o H Mikkelsen, C Aagaard, S S Nielsen, and G Jungersen. 2011. Review of Mycobacterium
avium subsp. paratuberculosis antigen candidates with diagnostic potential. Veterinary
Microbiology 152: 1-20.
o Riber, U., Boesen, H.T., Jakobsen, J.T., Nguyen, L.T.M. and Jungersen, G. 2011. Co-
incubation with IL-18 potentiates antigen-specific IFN-γ response in a whole-blood
stimulation assay for measurement of cell-mediated immune responses in pigs
experimentally infected with Lawsonia intracellularis. Veterinary Immunology and
Immunopathology 139: 257-263.
o D J Begg, K de Silva, K Bosward, L Di Fiore, D L Taylor, G Jungersen and R J Whittington.
2009. Enzyme Linked Immuno Spot: An alternative method for the detection of Interferon
gamma in Johne’s disease. Journal of Veterinary Diagnostic Investigation 21: 187-196.
o H Mikkelsen, G Jungersen and S S Nielsen. 2009. Association between milk antibody and
interferon-gamma responses in cattle from Mycobacterium avium subsp. paratuberculosis
infected herds. Veterinary Immunology and Immunopathology 127: 235-241.
o Riber, U. and Jungersen, G. 2007. Cell-mediated immune responses differentiate infections
with Brucella suis from Yersinia enterocolitica serotype O:9 in pigs. Veterinary Immunology
and Immunopathology 116: 13-25.
o Olsen, I., Boysen, P., Kulberg, S., Hope, J.C., Jungersen, G. and Storset, A. 2005. Bovine NK
cells can produce gamma interferon in response to the secreted mycobacterial proteins
ESAT-6 and MPP14, but not in response to MPB70. Infection and Immunity 73: 5628-5635.
o Huda, A., Jungersen, G. and Lind, P. 2004. Longitudinal study of interferon-gamma, serum
antibody and milk antibody responses in cattle infected with Mycobacterium avium subsp.
paratuberculosis. Veterinary Microbiology 104: 43-53.
o Huda, A., Lind, P., Christoffersen, A.B. and Jungersen, G. 2003. Analysis of repeated tests
for interferon-gamma (IFN-γ) response and faecal excretion for diagnosis of subclinical
paratuberculosis in Danish cattle. Veterinary Immunology and Immunopathology 94: 95-
103.
Appendices
134
o Jungersen, G., Huda, A., Hansen, J.J. and Lind, P. 2002. Interpretation of gamma-interferon
test for diagnosis of subclinical paratuberculosis in cattle. Clinical and Diagnostic
Laboratory Immunology 9, 453-460.
Papers submitted to peer-reviewed journals:
o Mikkelsen H, Aagaard C, Nielsen SS, Jungersen G. Correlation of antigen-specific IFN-γ
responses of fresh blood samples from Mycobacterium avium subsp. paratuberculosis
infected cattle with responses of day-old samples co-cultured with IL-12 or anti-IL-10
antibodies. Veterinary Immunology and Immunopathology.
Anders Wolff
References related to lab-on-a-chip and PCR
o Bui, Thanh Xuan; Wolff, Anders; Madsen, Mogens; Bang, Dang Duong (2011) Reverse
transcriptase real-time PCR for detection and quantification of viable Campylobacter jejuni
directly from poultry faecal samples. Research in Microbiology, p. 1-9 (2011)
o Yi Sun, Raghuram Dhumpa, Dang Duong Bang, Jonas Høgberg, Kurt Handberg and Anders
Wolff (2011) A lab-on-a-chip device for rapid identification of avian influenza viral RNA by
solid-phase PCR. Lab Chip, 2011, 11 (8) Pages: 1457-1463 DOI: 10.1039/c0lc00528b
o Yi Sun, Raghuram Dhumpa, Dang Duong Bang, Kurt Handberg, Anders Wolff (2011). DNA
microarray-based solid-phase RT-PCR for rapid detection and identification of influenza
virus type A and subtypes H5 and H7. Diagnostic Microbiology and Infectious Disease 2011,
69(4) 432-439
o Haukur Gudnason, Martin Dufva, D.D. Bang and Anders Wolff, Comparison of multiple DNA
dyes for real-time PCR: effects of dye concentration and sequence composition on DNA
amplification and melting temperature. Nucleic Acids Research, 35, (19) Art No e127 (8
pages) Oct (2007)
o Christensen, T.B., Pedersen, C.M., Gröndahl, K.G., Jensen, T.G., Bang, D.D. & Wolff, A. PCR
biocompatibility of Lab-on-a-chip and MEMS materials. J. Micromech. Microeng. 17, 1527-
1532 (2007).

Appendices
135
o Ahlford, A; Brivio, M; Gudnason, H; Wolff, A; Sylvanen, A. Development of a lab-on-a-chip
for point-of-care genetic diagnostics. European Journal of Clinical Investigation. 37, 82
(2007)
o Zhenyu Wang, Andrea Sekulovic, Jörg P. Kutter, Dang. D. Bang and Anders Wolff. Towards
a portable microchip system with integrated thermal control and polymer waveguides for
real-time PCR. Electrophorecis, 2006, 27, (24), 5051-5058.
Publications in Refereed Proceedings
o Minqiang Bu, Ivan R. Perch-Nielsen, Yi Sun, and Anders Wolff (2011) A Microfluidic Control
System With Re-Usable Micropump/Valve Actuator and Injection Moulded Disposable
Polymer Lab-on-a-Slide. Transducers '11, 16th International Conference on Solid-State
Sensors, Actuators and Microsystems, Beijing, China (2011), pages 1244-1247
o Dang Duong Bang, Dhumpa Raghuram, Cao Cuong, Flora laouenan, Berganzo Javier, Rafal
Walczak, Yuliang Liu, Minqiang Bu, Jan Dziuban, Jesus Miguel Ruano, and Anders Wolff A
Trip from a Tube to a Chip Applied Micro and Nanotechnology in Biotechonology,
Veterinary and Life Sciences. Proceedings of the 3rd International Conference on the
Development of BioMedical Engineeering in Vietnam, 11-14th Jan 2010 Publisher: Springer
(ISSN: 1680-0737) , pages: 290-293, 2010
o Dang Duong Bang, Raghuram Dhumpa, M. Agirregabiria, Rafal Walczak, Yuliang Liu,
Mingiang Bu, Sun Yi, Jan Dzuiban, Jesus Miguel Rruano, and Anders Wolff (2009) From a
Tube to a Chip - Application of Micro and Nanotechnology in Biotechnology, Veterinary
and Life Sciences. Smart Systems Integration Brussels Belgium On line publication March
2009 (Keynote lecture) http://www.mesago.de/en/SSI/Proceedings/index.htm
o Xuan Thanh Bui, Anders Wolff, Dang Duong Bang. Detection and quantification of
Campylobacter jejuni and Campylobacter coli mRNA in poultry fecal samples. Proceedings
of CHRO 2009. pp 68-
o M. Brivio, D. Snakenborg, E. Søgaard, A. Ahlford, A.-C. Syvänen, J.P. Kutter, and A.Wolff On-
Chip Integration of Sample Pretreatment and Multiplex Polymerase Chainreaction (PCR)
for DNA Analysis. Proc. Micro Total Analysis Systems 2008, Kluwer Academic Publisher,
Dordrecht, The Netherlands, pp. 1737-1739, (2008).
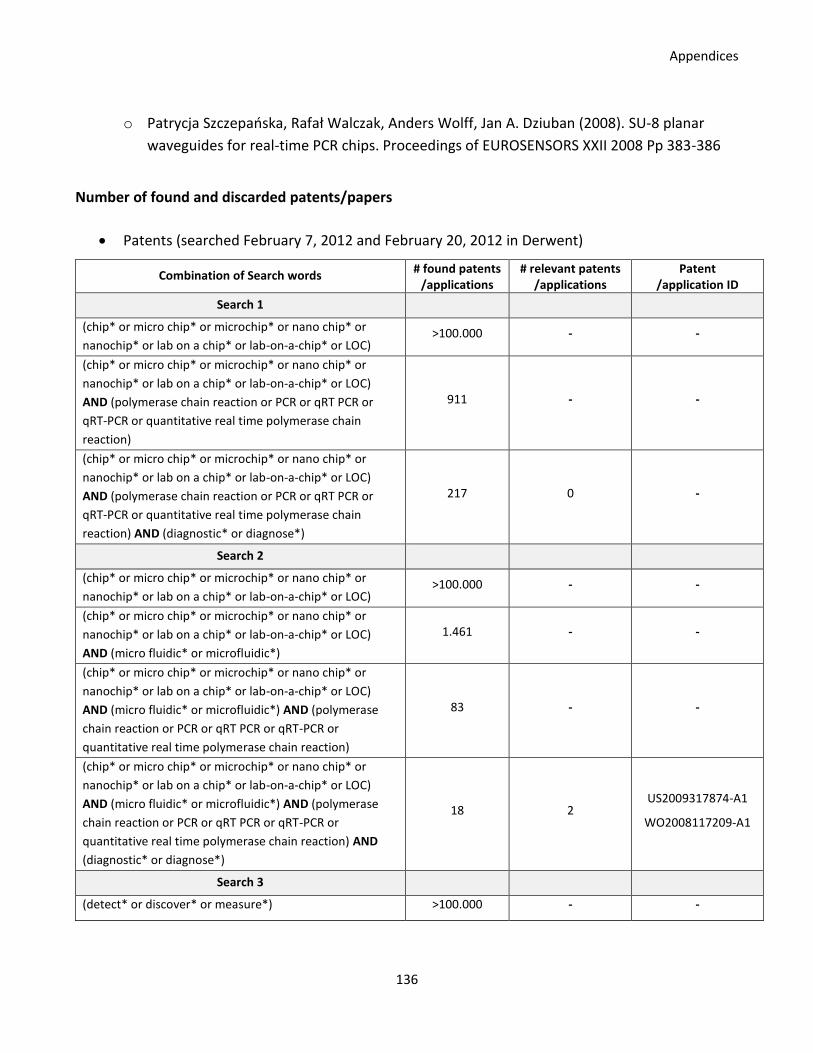
Appendices
136
o Patrycja Szczepańska, Rafał Walczak, Anders Wolff, Jan A. Dziuban (2008). SU-8 planar
waveguides for real-time PCR chips. Proceedings of EUROSENSORS XXII 2008 Pp 383-386
Number of found and discarded patents/papers
Patents (searched February 7, 2012 and February 20, 2012 in Derwent)
Combination of Search words # found patents
/applications # relevant patents
/applications Patent
/application ID
Search 1
(chip* or micro chip* or microchip* or nano chip* or
nanochip* or lab on a chip* or lab-on-a-chip* or LOC) >100.000 - -
(chip* or micro chip* or microchip* or nano chip* or
nanochip* or lab on a chip* or lab-on-a-chip* or LOC)
AND (polymerase chain reaction or PCR or qRT PCR or
qRT-PCR or quantitative real time polymerase chain
reaction)
911 - -
(chip* or micro chip* or microchip* or nano chip* or
nanochip* or lab on a chip* or lab-on-a-chip* or LOC)
AND (polymerase chain reaction or PCR or qRT PCR or
qRT-PCR or quantitative real time polymerase chain
reaction) AND (diagnostic* or diagnose*)
217 0 -
Search 2
(chip* or micro chip* or microchip* or nano chip* or
nanochip* or lab on a chip* or lab-on-a-chip* or LOC) >100.000 - -
(chip* or micro chip* or microchip* or nano chip* or
nanochip* or lab on a chip* or lab-on-a-chip* or LOC)
AND (micro fluidic* or microfluidic*)
1.461 - -
(chip* or micro chip* or microchip* or nano chip* or
nanochip* or lab on a chip* or lab-on-a-chip* or LOC)
AND (micro fluidic* or microfluidic*) AND (polymerase
chain reaction or PCR or qRT PCR or qRT-PCR or
quantitative real time polymerase chain reaction)
83 - -
(chip* or micro chip* or microchip* or nano chip* or
nanochip* or lab on a chip* or lab-on-a-chip* or LOC)
AND (micro fluidic* or microfluidic*) AND (polymerase
chain reaction or PCR or qRT PCR or qRT-PCR or
quantitative real time polymerase chain reaction) AND
(diagnostic* or diagnose*)
18 2 US2009317874-A1
WO2008117209-A1
Search 3
(detect* or discover* or measure*) >100.000 - -
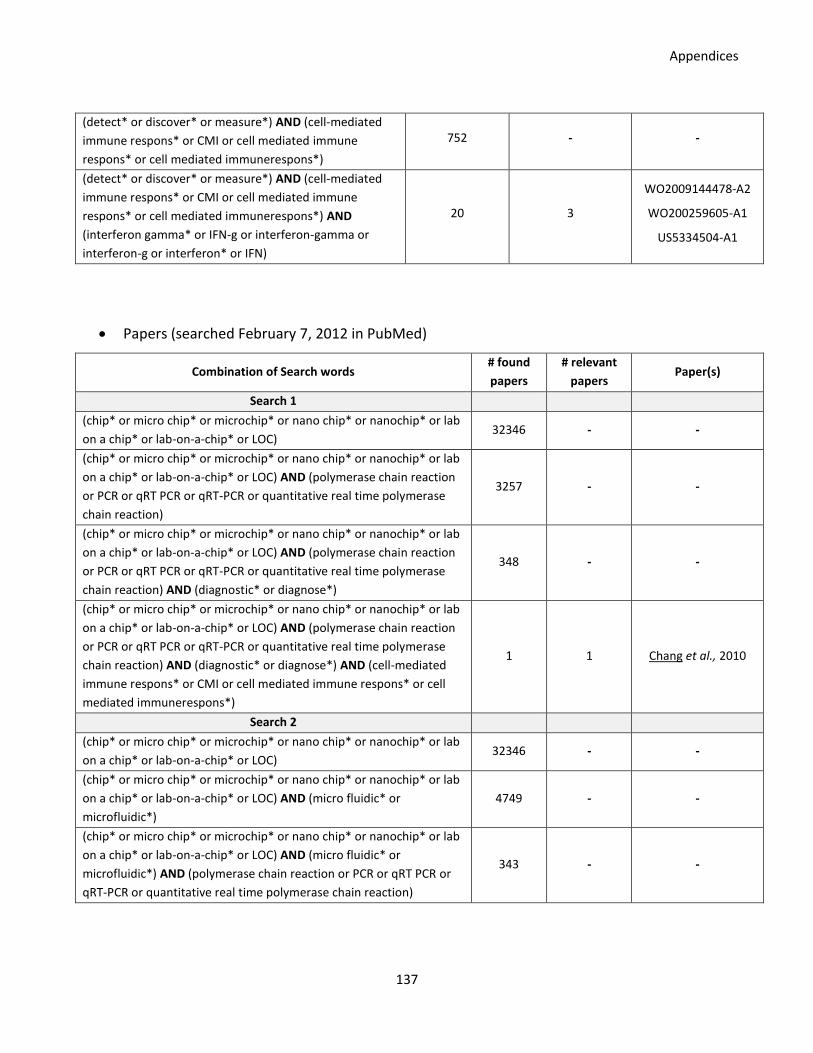
Appendices
137
(detect* or discover* or measure*) AND (cell-mediated
immune respons* or CMI or cell mediated immune
respons* or cell mediated immunerespons*)
752 - -
(detect* or discover* or measure*) AND (cell-mediated
immune respons* or CMI or cell mediated immune
respons* or cell mediated immunerespons*) AND
(interferon gamma* or IFN-g or interferon-gamma or
interferon-g or interferon* or IFN)
20 3
WO2009144478-A2
WO200259605-A1
US5334504-A1
Papers (searched February 7, 2012 in PubMed)
Combination of Search words # found
papers
# relevant
papers Paper(s)
Search 1
(chip* or micro chip* or microchip* or nano chip* or nanochip* or lab
on a chip* or lab-on-a-chip* or LOC) 32346 - -
(chip* or micro chip* or microchip* or nano chip* or nanochip* or lab
on a chip* or lab-on-a-chip* or LOC) AND (polymerase chain reaction
or PCR or qRT PCR or qRT-PCR or quantitative real time polymerase
chain reaction)
3257 - -
(chip* or micro chip* or microchip* or nano chip* or nanochip* or lab
on a chip* or lab-on-a-chip* or LOC) AND (polymerase chain reaction
or PCR or qRT PCR or qRT-PCR or quantitative real time polymerase
chain reaction) AND (diagnostic* or diagnose*)
348 - -
(chip* or micro chip* or microchip* or nano chip* or nanochip* or lab
on a chip* or lab-on-a-chip* or LOC) AND (polymerase chain reaction
or PCR or qRT PCR or qRT-PCR or quantitative real time polymerase
chain reaction) AND (diagnostic* or diagnose*) AND (cell-mediated
immune respons* or CMI or cell mediated immune respons* or cell
mediated immunerespons*)
1 1 Chang et al., 2010
Search 2
(chip* or micro chip* or microchip* or nano chip* or nanochip* or lab
on a chip* or lab-on-a-chip* or LOC) 32346 - -
(chip* or micro chip* or microchip* or nano chip* or nanochip* or lab
on a chip* or lab-on-a-chip* or LOC) AND (micro fluidic* or
microfluidic*)
4749 - -
(chip* or micro chip* or microchip* or nano chip* or nanochip* or lab
on a chip* or lab-on-a-chip* or LOC) AND (micro fluidic* or
microfluidic*) AND (polymerase chain reaction or PCR or qRT PCR or
qRT-PCR or quantitative real time polymerase chain reaction)
343 - -
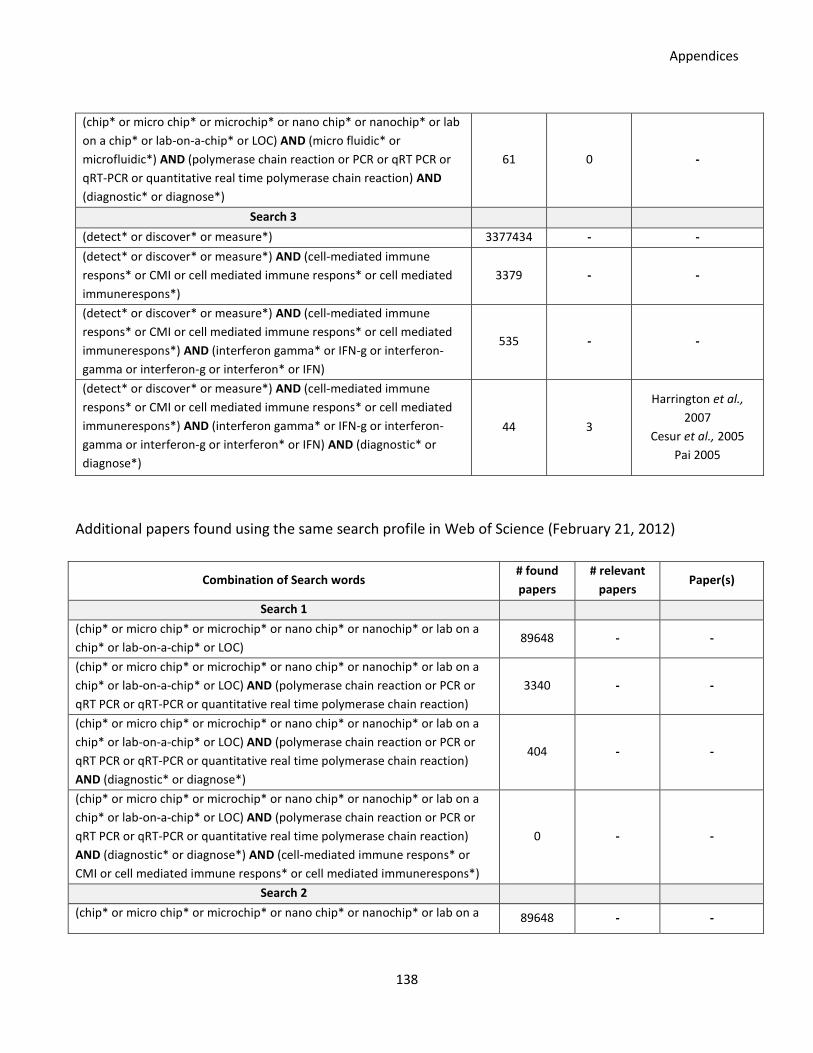
Appendices
138
(chip* or micro chip* or microchip* or nano chip* or nanochip* or lab
on a chip* or lab-on-a-chip* or LOC) AND (micro fluidic* or
microfluidic*) AND (polymerase chain reaction or PCR or qRT PCR or
qRT-PCR or quantitative real time polymerase chain reaction) AND
(diagnostic* or diagnose*)
61 0 -
Search 3
(detect* or discover* or measure*) 3377434 - -
(detect* or discover* or measure*) AND (cell-mediated immune
respons* or CMI or cell mediated immune respons* or cell mediated
immunerespons*)
3379 - -
(detect* or discover* or measure*) AND (cell-mediated immune
respons* or CMI or cell mediated immune respons* or cell mediated
immunerespons*) AND (interferon gamma* or IFN-g or interferon-
gamma or interferon-g or interferon* or IFN)
535 - -
(detect* or discover* or measure*) AND (cell-mediated immune
respons* or CMI or cell mediated immune respons* or cell mediated
immunerespons*) AND (interferon gamma* or IFN-g or interferon-
gamma or interferon-g or interferon* or IFN) AND (diagnostic* or
diagnose*)
44 3
Harrington et al.,
2007
Cesur et al., 2005
Pai 2005
Additional papers found using the same search profile in Web of Science (February 21, 2012)
Combination of Search words # found
papers
# relevant
papers Paper(s)
Search 1
(chip* or micro chip* or microchip* or nano chip* or nanochip* or lab on a
chip* or lab-on-a-chip* or LOC) 89648 - -
(chip* or micro chip* or microchip* or nano chip* or nanochip* or lab on a
chip* or lab-on-a-chip* or LOC) AND (polymerase chain reaction or PCR or
qRT PCR or qRT-PCR or quantitative real time polymerase chain reaction)
3340 - -
(chip* or micro chip* or microchip* or nano chip* or nanochip* or lab on a
chip* or lab-on-a-chip* or LOC) AND (polymerase chain reaction or PCR or
qRT PCR or qRT-PCR or quantitative real time polymerase chain reaction)
AND (diagnostic* or diagnose*)
404 - -
(chip* or micro chip* or microchip* or nano chip* or nanochip* or lab on a
chip* or lab-on-a-chip* or LOC) AND (polymerase chain reaction or PCR or
qRT PCR or qRT-PCR or quantitative real time polymerase chain reaction)
AND (diagnostic* or diagnose*) AND (cell-mediated immune respons* or
CMI or cell mediated immune respons* or cell mediated immunerespons*)
0 - -
Search 2
(chip* or micro chip* or microchip* or nano chip* or nanochip* or lab on a 89648 - -
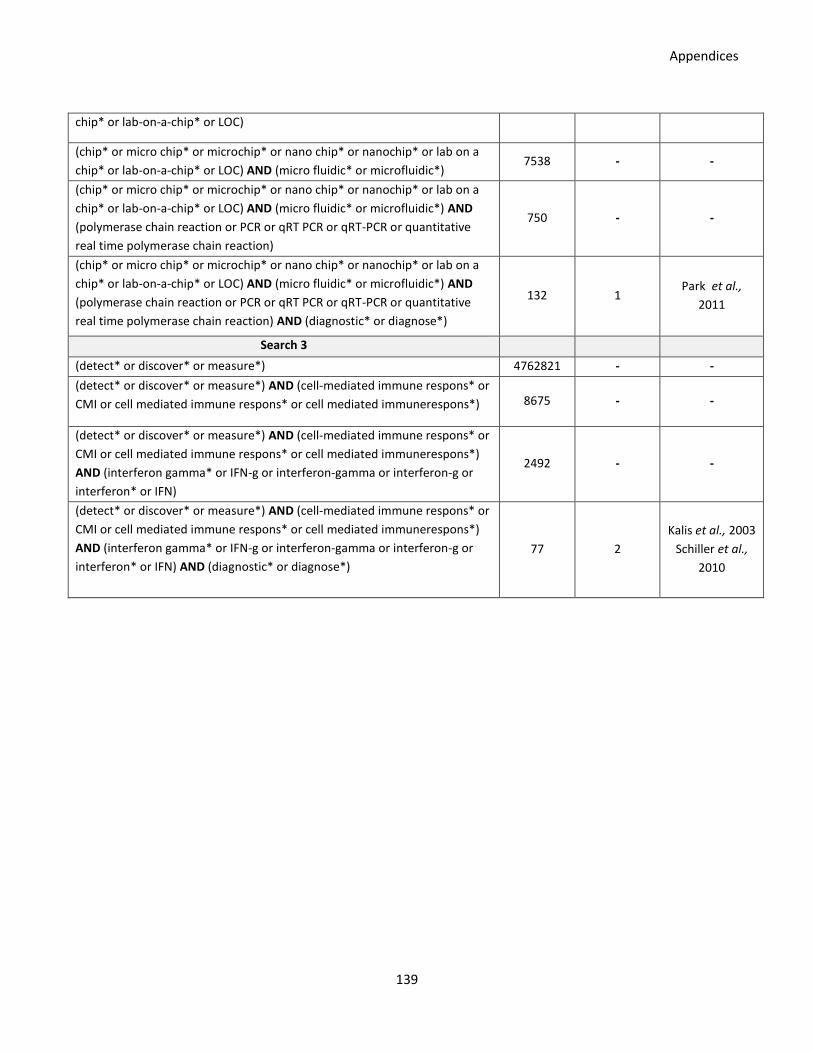
Appendices
139
chip* or lab-on-a-chip* or LOC)
(chip* or micro chip* or microchip* or nano chip* or nanochip* or lab on a
chip* or lab-on-a-chip* or LOC) AND (micro fluidic* or microfluidic*) 7538 - -
(chip* or micro chip* or microchip* or nano chip* or nanochip* or lab on a
chip* or lab-on-a-chip* or LOC) AND (micro fluidic* or microfluidic*) AND
(polymerase chain reaction or PCR or qRT PCR or qRT-PCR or quantitative
real time polymerase chain reaction)
750 - -
(chip* or micro chip* or microchip* or nano chip* or nanochip* or lab on a
chip* or lab-on-a-chip* or LOC) AND (micro fluidic* or microfluidic*) AND
(polymerase chain reaction or PCR or qRT PCR or qRT-PCR or quantitative
real time polymerase chain reaction) AND (diagnostic* or diagnose*)
132 1 Park et al.,
2011
Search 3
(detect* or discover* or measure*) 4762821 - -
(detect* or discover* or measure*) AND (cell-mediated immune respons* or
CMI or cell mediated immune respons* or cell mediated immunerespons*) 8675 - -
(detect* or discover* or measure*) AND (cell-mediated immune respons* or
CMI or cell mediated immune respons* or cell mediated immunerespons*)
AND (interferon gamma* or IFN-g or interferon-gamma or interferon-g or
interferon* or IFN)
2492 - -
(detect* or discover* or measure*) AND (cell-mediated immune respons* or
CMI or cell mediated immune respons* or cell mediated immunerespons*)
AND (interferon gamma* or IFN-g or interferon-gamma or interferon-g or
interferon* or IFN) AND (diagnostic* or diagnose*)
77 2
Kalis et al., 2003
Schiller et al.,
2010
Appendices
140
Summary of relevant patents, papers and others
Patents
Apparatus for performing thermocyclic process such as amplifying DNA comprises
microfluidic chip with fluid channel formed in it, and at least two temperature zones; and
thermal distribution elements disposed over portions of the chip
Patent Number(s): US2009317874-A1
Inventor(s): DALE G A, HASSON K C, STONE M, ZENG S
Patent Assignee Name(s) and Code(s):CANON US LIFE SCI INC(CANO-C)
Derwent Primary Accession Number: 2009-S64755 [02]
Abstract: NOVELTY - Apparatus (100) to perform thermocyclic process comprises microfluidic
chip (200) having fluid channel (202), and is formed with at least two temperature zones; and
thermal distribution element(s) disposed on portions of the chip. Each thermal distribution
element is constructed to distribute thermal energy from external thermal energy source
uniformly over the portion of chip thus defining the portions as one of the temperature zones
within chip. The channel is arranged so that fluid flowing through the channel would enter and
exit several times from each temperature zone.
USE - for performing thermocyclic process such as amplifying DNA (claimed).
ADVANTAGE - The microfluidic chips are prepackaged for optimized assay designs, e.g. specific
diagnostic/analytical tests that optimize the PCR reaction. During chip fabrication, a label is
affixed to the chip so that the instrument readily identifies the chip via an optical detector
reading the label. The microfluidic chips are preferably disposable.
DETAILED DESCRIPTION - An apparatus (100) for performing a thermocyclic process comprises
a microfluidic chip (200) having a fluid channel (202), and is configured with at least two
temperature zones; and at least one thermal distribution element in thermal communication
with an associated portion of the chip. The thermal distribution element is constructed and
arranged to distribute thermal energy from an external thermal energy source uniformly over
the associated portion of the chip thus defining the associated portion as one of the
Appendices
141
temperature zones within the chip. The channel is arranged such that a fluid flowing through
the channel would enter and exit several of times from each temperature zones of the chip.
The thermal distribution element comprises a thermally conductive material adhered to the
associated portion of the microfluidic chip. The thermal distribution element comprises a
metal plate, and a rectangular metal block. The apparatus further comprises a label including
information which is used to identify characteristics of the thermocyclic process that can be
performed with the apparatus based on characteristics of the temperature zones of the chip.
The label comprises a machine-readable label; a bar code; and radiofrequency identification
tag. The apparatus also comprises a thermal energy source associated with each thermal
distribution element and configured to apply thermal energy to the thermal distribution
element; and a detector (115) configured to detect emissions originating from at least one
location within the channel. An INDEPENDENT CLAIM is included for a DNA amplification
method involving providing the apparatus for amplifying DNA; applying thermal energy to the
thermal distribution elements to generate temperatures in the portion of the chip; and
pumping a solution containing a nucleic acid sample through the channel so that the solution
alternately flows through the first, second, and third portions of the chip and is alternately
exposed to the temperatures, while the solution is pumped, detecting emission originating
from solution flowing through a portion of the channel disposed within one of the first,
second, and third portions of the chip.
Integrated micro-fluidic device for molecular diagnostics of fluids e.g. blood, has chamber
circuit integrated on substrate switches signals related to chambers accommodating fluids
and chip has controller coupled to chamber circuit
Patent Number(s): WO2008117209-A1
Inventor(s): FIH D A, HOEVENAARS A A M
Patent Assignee Name(s) and Code(s):KONINK PHILIPS ELECTRONICS NV(PHIG-C)
Derwent Primary Accession Number: 2008-M80548 [59]
Citing Patents: 1
Appendices
142
Abstract: NOVELTY - The integrated micro-fluidic device comprises several polymerase chain
reaction (PCR) chambers (11-MN) provided on a glass substrate for accommodating fluids. A
chamber circuit such as thin film transistor (TFT) is integrated on the substrate for switching
signals related to the chambers. An integrated circuit (IC) chip bonded to the substrate
comprises a controller which is coupled to the chamber circuit. The TFT comprises a
polycrystalline, microcrystalline or amorphous semiconductor material and the IC chip
comprises a monocrystalline semiconductor material.
USE - Integrated micro-fluidic device with local temperature control for molecular diagnostics
of fluidic samples such as blood, urine, saliva, anal and vaginal secretions, agricultural samples,
soil samples, bacteria, viruses, fungi or parasites.
ADVANTAGE - The improved integrated micro-fluidic device enables more uniform heating of
the chamber with local temperature control.
Detecting a cell-mediated immune response to purified antigens of Mycobacterium avium
subsp. paratuberculosis (Map) comprises detection of a cell-mediated immune response by
measuring extent of lymphocyte activation and/or proliferation
Patent Number(s): WO2009144478-A2; WO2009144478-A9; WO2009144478-A3;
AU2009252922-A1; EP2286230-A2; US2011135578-A1; CN102159952-A
Inventor(s): HUGHES V M, STEVENSON K, HUGHES V
Patent Assignee Name(s) and Code(s): MOREDUN RES INST (MORE-Non-standard),
STEVENSON K(STEV-Individual), HUGHES V M(HUGH-Individual)
Derwent Primary Accession Number: 2009-R90374 [60]
Abstract: NOVELTY - Detecting a cell-mediated immune response to purified antigens of
Mycobacterium avium subsp. paratuberculosis (Map) in an animal comprises detection of a
cell-mediated immune response by measuring the extent of lymphocyte activation and/or
proliferation in response to the purified antigens of Map.
USE - The method is useful for detecting a cell-mediated immune response to purified
antigens of Map in an animal; diagnosing Map infection in an animal; and for protecting an

Appendices
143
animal against Map infection or for reducing Map colonization or the severity of a disease
caused or contributed to by Map, where the disease caused or contributed to by Map is
Johne's disease (all claimed).
DETAILED DESCRIPTION - INDEPENDENT CLAIMS are:
(1) a kit for carrying out a method of diagnosing a Map infection comprising purified Map-
specific proteins or immunogenic fragments capable of eliciting a cell-mediated immune
response, further comprising other reagents for use in the method of diagnosis, such as an
anti-interferon gamma (IFN- gamma ) antibody;
(2) proteins, e.g. mitogen activated protein (MAP) 0268c; MAP1297; MAP1365; and
MAP3651c; and fragments, for raising an immune response in an animal;
(3) an immunogenic formulation vaccine comprising proteins, e.g. MAP0268c; MAP1297;
MAP1365; and MAP3651c; and their fragments;
(4) a method of vaccinating or immunizing an animal against a MAP infection comprising
administering MAP antigens, e.g. MAP0268c; MAP1297; MAP1365; and MAP3651c; and their
fragments; and
(5) use of proteins, e.g. MAP0268c; MAP1297; MAP1365; and MAP3651c; and their fragments,
for protecting an animal against Map infection or for reducing Map colonization or the severity
of a disease caused or contributed to by Map.
Technology Focus/Extension Abstract: TECHNOLOGY FOCUS - BIOTECHNOLOGY - Preferred
Method: In detecting a cell-mediated immune response to one or more purified antigens of
Map in an animal, the cell-mediated immune response is measured by detecting a level of
cytokine such as IFN- gamma , tumor necrosis factor alpha (TNF- alpha ), transforming growth
factor beta (TGF- beta ), interleukins (IL-2, IL-6, IL-10, IL-12, IL-17) and granulocyte-
macrophage colony-stimulating factor (GM-CSF) using antibodies or indirectly from mRNA by
reverse transcription (RT)-PCR or microarray. The method is carried out on a blood sample or
fraction, isolated from a subject, or a skin test such as a delayed hypersensitivity skin test. The
sample of blood or fraction is incubated with the one or more purified Map antigens, to allow
any cell-mediated response to develop. The antigens are proteins or fragments that are
Appendices
144
expressed by Map and elicit a detectable immune response in animals infected by Map greater
than that elicited by the antigens of other closely related subspecies of M. avium (M. avium
subsp. avium and M. avium subsp. silvaticum). The antigens are display little or no cross-
reactivity with other related species such as other subspecies of M. avium, M. bovis, and/or
Mycobacterium tuberculosis. The method uses two or more Map-specific antigens, e.g.
MAP0268c; MAP1297; MAP1365 and MAP3651c.
In vitro detection of a human or animal cell-mediated immune response to one or more
specific antigens from the Mycobacterium tuberculosis complex, comprises using
erythrocyte lysing buffer and detecting presence of gamma interferon
Patent Number(s): WO200259605-A; WO200259605-A1; AU2002219017-A1
Inventor(s): MUNK M, ANDERSEN P
Patent Assignee Name(s) and Code(s):STATENS SERUM INST (STAT-Non-standard)
Derwent Primary Accession Number: 2002-608468 [51]
Patents Cited by Examiner: 12, Articles Cited by Examiner: 6
Abstract: NOVELTY - Detecting in vitro a cell-mediated immune response to specific antigens
from the Mycobacterium tuberculosis complex, comprises treating a blood sample containing
lymphocytes within a leukocyte population and erythrocytes to lyse the erythrocytes present,
incubating the lymphocytes with the antigen from the complex, and detecting the cell-
mediated immune response of the lymphocytes to the antigen.
USE - The method above is useful in in vitro detection of a human or animal cell-mediated
immune response within a small fresh whole blood sample to one or more specific antigens
such as those from the Mycobacterium tuberculosis complex (claimed).
ADVANTAGE - The method is capable of decreasing the time and expenses for a cell-mediated
tuberculosis diagnostic test, and it provides a significantly higher IFNgamma release, with less
amount of cells, compared to other method that uses fresh blood samples. Thus, this method
is reliable and suitable for specific T-cell response purposes.
DETAILED DESCRIPTION - Detecting in vitro a cell-mediated immune response to one or more
Appendices
145
specific antigens from the Mycobacterium tuberculosis complex (M. tuberculosis, M.
africanum and M. bovis) in a human or animal, comprises treating a whole blood sample
containing lymphocytes within a leukocyte population and erythrocytes to lyse the
erythrocytes present, incubating the lymphocytes with the antigen from the complex, and
detecting the cell-mediated immune response of the lymphocytes to the antigen.
AN INDEPENDENT CLAIM is also included for a diagnostic kit suitable for use in the above
method, comprising a source of one or more specific antigens, latex beads coated with one or
more specific antigens, and erythrocyte lysing buffer.
Technology Focus/Extension Abstract: TECHNOLOGY FOCUS - BIOTECHNOLOGY - Preferred
Method: The lymphocyte concentration in the above method is concentrated between the
steps of treating the whole blood sample and incubating the lymphocytes. The lymphocytes
are enriched by centrifugation and are resuspended in the cell culture medium to produce a
resuspension volume that is less than the volume of the whole blood sample by a factor of at
least 1.5. The step of detecting the cell-mediated immune response is carried out by detecting
the presence of gamma-interferon (IFNgamma) released by sensitized lymphocytes from the
whole blood sample to indicate a cell-mediated immune response to the antigen. The
IFNgamma released from the sensitized lymphocytes can be detected in an immunoassay,
such as an enzyme-linked immunosorbant assay (ELISA). The lymphocytes cited above are also
contacted with latex beads that are coated with the antigen.
EXAMPLE - Peripheral blood cells from each of several donors (healthy individuals or patients
with tuberculosis) was either left untreated (fresh whole blood) or enriched (improved whole
blood). In this procedure, 200 mul from the enriched leukocyte cell suspension were added
into each well of a 96-well flat-bottom plate in the presence or absence of PHA (1 mug/ml),
PPD (5 mug/ml), ESAT6 (5 mug/ml), or CFP7 (5 mug/ml) and incubated at 37 degreesC in 5%
CO2 air saturation. After 4-6 days in the culture, 100 mul/well of supernatant samples were
removed and added into another 96-well plate for storage or for further use. Quantitative
determination of IFNgamma secreted into the cell-culture supernatants were analyzed by
ELISA technique using monoclonal antibodies specific for human IFNgamma. Briefly, 96-well

Appendices
146
plates were incubated with a catching anti-human IFNgamma monoclonal antibody diluted in
PBS at 4 degreesC for 18 hours. After washing and blocking of the wells, cell culture
supernatants were added and the wells wee incubated for 2 hours. The wells were washed
and biotin-labelled polyclonal goat-anti-human IFNgamma antibodies were added. The
reaction is visualized by adding alkaline phosphatase-conjugated streptavidin followed by p-
nitrophenyl phosphate diluted in the appropriate buffer. Concentrations of IFNgamma in the
samples were calculated using the standard curve generated from the recombinant human
IFNgamma and results were expressed in pg/ml. The minimum assay sensitivity was 10 pg/ml.
The absence of interfering erythrocytes increased cell contact and performance of IFNgamma
production by enriched cells.
In vitro assay for detecting cell-mediated immune responses - by incubating whole blood
with specific antigen and detecting gamma interferon
Patent Number(s): US5334504-A1; US5494799-A1; WO8705400-A1; WO8705400-A;
AU8771659-A ; JP63502695-W; EP296158-A; CA1299099-C ; EP296158-B1; DE3779909-G ;
US5334504-A; EP296158-A4; US5494799-A; JP2642112-B2
Inventor(s): CORNER L A, WOOD P R, WOOD R P, CORNER A L
Patent Assignee Name(s) and Code(s): COMMONWEALTH SCI & IND RES ORG(CSIR-C), WOOD
P R(WOOD-Individual)
Derwent Primary Accession Number: 1987-264177 [74]
Citing Patents: 21, Patents Cited by Examiner: 34, Articles Cited by Inventor: 1, Articles Cited
by Examiner: 56
Abstract: An in vitro method of detecting a cell-mediated immune response to a specific
antigen in a human or animal comprises (a) incubating a whole blood sample from the human
or animal with the specific antigen and (b) detecting the presence of gamma interferon
(gamma IFN) released by sensitised lymphocytes in the whole blood sample to indicate a cell-
mediated immune response to the specific antigen. Pref. the gamma IFN is detected using an
emxyme-linked immunosorbent assay or a radioimmunoassay.
Appendices
147
USE/ADVANTAGE-The assay is far simpler and faster than those previously described. A single
blood sample provides sufficient material for testing a patient's responsiveness to a wide
variety of antigens. The method is used esp. for detecting immune response to the M.bovis
antigen, tuberculin purified protein deriv. (PPD) in whole blood samples from cattle. The assay
does not compromise the immune status of animals as does the current in vivo tuberculin skin
test. The assay can also be used in detecting cellular responses to e.g. M. leprae, M.
tuberculosis, mumps, Candida, Brucella, histoplasmin, trichophyton, coccidioidin and malaria.
Papers
Chang HJ, Huang MY, Yeh CS, Chen CC, Yang MJ, Sun CS, Lee CK, Lin SR (2010): Rapid
diagnosis of tuberculosis directly from clinical specimens using a gene chip. Clin Microbiol
Infect. Aug;16(8):1090-6.
Abstract: The aim of this study was to explore a gene chip capable of detecting the presence
of Mycobacterium tuberculosis isolates directly in clinical sputum specimens and to compare it
with current molecular detection techniques. At first, we selected 13 M. tuberculosis-specific
target genes to construct a gene chip for rapid diagnosis. Using the membrane array method,
we diagnosed M. tuberculosis by gene chip directly from 246 sputum specimens from patients
suspected of having tuberculosis. Among 80 M. tuberculosis complex (MTBC) culture-positive
sputum specimens, the MTBC detection rate was 62.5% (50/80) by PCR-restriction fragment
length polymorphism (RFLP), 70% (56/80) by acid-fast staining, and 85% (68/80) by the
membrane array method. Furthermore, subspecies showed different gene expression patterns
in the membrane array. In conclusion, MTBC could be detected directly in sputum by the
membrane array method. The rapidity of detection and the capability of differentiating
subspecies could make this method useful in the control and prevention of tuberculosis.
Harrington NP, Surujballi OP, Waters WR, Prescott JF (2007): Development and evaluation of
a real-time reverse transcription-PCR assay for quantification of gamma interferon mRNA to
Appendices
148
diagnose tuberculosis in multiple animal species. Clin Vaccine Immunol. Dec;14(12):1563-71.
Abstract: Tuberculosis of free-ranging and captive wildlife, including species implicated in the
maintenance and transmission of Mycobacterium bovis, is a difficult disease to diagnose and
control. Historically, diagnosis of tuberculosis has relied largely upon assays of cell-mediated
immunity (CMI), such as tuberculin skin testing. This approach, however, is problematic or
impractical for use with many wildlife species. Increasingly, in vitro diagnostic tests, including
gamma interferon (IFN-gamma)-based assays, are replacing or complementing skin testing of
cattle and humans. Analogous assays are unavailable for most wildlife because of a lack of
species-specific immunological reagents. This report describes the development and validation
of a whole-blood assay to quantify antigen-specific IFN-gamma mRNA expression by
quantitative real-time reverse transcription-PCR. Oligonucleotide primers and probes were
designed and tested for reactivity towards several susceptible species of interest with respect
to tuberculosis infection. The assay was subsequently optimized to quantify the IFN-gamma
mRNA expression in elk and red deer (Cervus elaphus) and was evaluated for its ability to
detect mycobacterial antigen-specific responses of experimentally tuberculosis-infected
animals. The assay was a simple, rapid, and sensitive measure of antigen-specific CMI. The IFN-
gamma mRNA responses correlated well with IFN-gamma protein production and showed
performance in determining an animal's infection status superior to that of either lymphocyte
proliferation or IFN-gamma protein enzyme-linked immunosorbent assay methods. An
additional advantage is the ease with which the assay can be modified to reliably quantify IFN-
gamma expression by using consensus sequences of closely related species or of other species
for which IFN-gamma sequence information is available.
Cesur S, Saka D, Tarhan G, Ceyhan I, Calişir H, Ogretensoy M (2005): [Evaluation of a
commercial enzyme immunoassay for the detection of interferon gamma levels in active
tuberculosis patients and vaccinated healthy subjects]. Mikrobiyol Bul. Jan;39(1):73-7.
[Article in Turkish].
Appendices
149
Abstract: The detection of plasma interferon gamma (IFN-g) levels has an important value for
the evaluation of cell mediated immune response to Mycobacterium tuberculosis. The aim of
this study was to investigate the plasma IFN-g levels by a commercial enzyme immunoassay
(ELISA) and to compare the levels between recently diagnosed culture positive lung
tuberculosis patients and BCG vaccinated healthy controls. Twenty-three patients with active
lung tuberculosis (13 males, 10 females) and 34 BCG vaccinated healthy adults (16 male, 18
female) have been included in the study. The control subjects were questioned about passed
tuberculosis infection and/or a contact with tuberculosis patients. No risk factors for exposure
to M. tuberculosis were found in the control group. IFN-g levels were measured by
QuantiFERON-TB (Cellestis, Australia) kit, and 22 of patients and 17 of control subjects were
found to be positive. As a result, the sensitivity of QuantiFERON-TB test was high (95.6%),
however its specificity was quite low (50%). In conclusion, QuantiFERON-TB may be used as a
supplementary diagnostic test in patients considered to have active tuberculosis, before
treatment. As BCG is in routine vaccination programme and the number of active tuberculosis
cases is high in our country, this test seems to be invalid for the diagnosis of latent
tuberculosis. Therefore, more specific tests that are not affected by the vaccine response, are
required for the diagnosis of latent tuberculosis.
Pai M (2005): Alternatives to the tuberculin skin test: interferon-gamma assays in the
diagnosis of mycobacterium tuberculosis infection. Indian J Med Microbiol. Jul;23(3):151-8.
Abstract: For nearly a century, there were no alternatives to the tuberculin skin test (TST) for
diagnosing latent tuberculosis infection. Because of advances in immunology and genomics,
for the first time, an alternative has emerged in the form of T cell based interferon-g (IFN-
gamma) assays, a new generation of in vitro tests of cellular immunity. These assays measure
cell mediated immune response by quantifying IFN-gamma released by T cells in response to
stimulation by Mycobacterium tuberculosis antigens. Although early versions of IFN-gamma
assays used purified protein derivative (PPD) as the stimulating antigen, newer versions use
antigens that are significantly more specific to M. tuberculosis. These specific antigens include
Appendices
150
ESAT-6 and CFP-10. These proteins, encoded by genes located within the region of difference 1
(RD1) segment of the M. tuberculosis genome, are more specific to M. tuberculosis than PPD
because they are not shared with any BCG substrains or several nontuberculous mycobacterial
species. A review of current evidence on the performance of IFN-gamma assays and TST
suggests that both the TST and IFN-gamma assays have advantages and limitations, and both
tests appear to be useful at this time. The emergence of IFN-gamma assays is a much
anticipated, welcome development that has, for the first time, increased the choice of tests
available for diagnosing latent tuberculosis infection. Because both tests have their strengths
and limitations, the decision to select one over the other will depend on the population, the
goal of testing, and the resources available. To fully evaluate the utility of IFN-gamma assays in
high burden countries such as India, long-term cohort studies are needed to determine the
association between positive IFN-gamma results and the subsequent risk of active disease.
Kalis CHJ, Collins MT, Hesselink JW, Barkema HW (2003): Specificity of two tests for the
early diagnosis of bovine paratuberculosis based on cell-mediated immunity: the Johnin skin
test and the gamma interferon assay. Veterinary Microbiology. Dec;97(1-2):73-86.
Abstract: Paratuberculosis in cattle is a chronic debilitating infectious disease caused by
Mycobacterium paratuberculosis. Control of paratuberculosis is based on tests that principally
detect advanced stages of infections: faecal culture and serology. Tests measuring cell-
mediated immunity (CMI) could improve control of paratuberculosis if able to diagnose
mycobacterial infections earlier, before animals become infectious. A drawback of CMI tests
for paratuberculosis has been a reported low specificity. This study re-examined CMI
specificity and factors that may affect it. The specificities of the Johnin skin test and its in vitro
equivalent, the gamma interferon (IFNgamma) assay, were estimated in 35 uninfected dairy
herds. In each herd a random sample of 20 young (6-24 months old) and 20 adult (greater than
or equal to24 months old) female dairy cattle were tested by both tests simultaneously. Skin
test specificity was 93.5% using a skin thickness increase of greater than or equal to4 mm as
the cut-off value. IFNgamma assay specificity when interpreted using a newly developed

Appendices
151
algorithm was 93.6%. When interpreted according to two alternative algorithms provided by
the IFNgamma kit suppliers, the assay had specificities of 66.1 and 67.0%. If the skin test and
IFNgamma assay were used in parallel, and only animals positive on both tests were
considered as M. paratuberculosis-infected, the specificity was 97.6%. Agreement between
skin test and IFNgamma assay on 1631 total animals was fair (kappa = 0.41). Antigen batch
influenced the specificity of both the skin test, ranging from 92 to 95%, and the IFNgamma
assay, ranging from 71 to 99% among batches. Test specificity also varied among herds ranging
from 58 to 100% for the skin test and 57 to 100% for the IFNgamma assay. While factors
affecting CMI test specificity and agreement need further evaluation, the high specificity and
general agreement among these CMI tests, coupled with the excellent results obtained in the
control of bovine tuberculosis using CMI tests, support their potential value in the early
diagnosis and control of paratuberculosis.
Schiller I, Oesch B, Vordermeier HM, Palmer MV, Harris BN, Orloski KA, Buddle BM, Thacker
TC, Lyashchenko KP, Waters WR (2010): Bovine Tuberculosis: A Review of Current and
Emerging Diagnostic Techniques in View of their Relevance for Disease Control and
Eradication. Transboundary And Emerging Diseases. Aug; 57(4): 205-220.
Abstract: Existing strategies for long-term bovine tuberculosis (bTB) control/eradication
campaigns are being reconsidered in many countries because of the development of new
testing technologies, increased global trade, continued struggle with wildlife reservoirs of bTB,
redistribution of international trading partners/agreements, and emerging financial and
animal welfare constraints on herd depopulation. Changes under consideration or newly
implemented include additional control measures to limit risks with imported animals,
enhanced programs to mitigate wildlife reservoir risks, re-evaluation of options to manage
bTB-affected herds/regions, modernization of regulatory framework(s) to re-focus control
efforts, and consideration of emerging testing technologies (i.e. improved or new tests) for use
in bTB control/eradication programs. Traditional slaughter surveillance and test/removal
strategies will likely be augmented by incorporation of new technologies and more targeted
control efforts. The present review provides an overview of current and emerging bTB testing
Appendices
152
strategies/tools and a vision for incorporation of emerging technologies into the current
control/eradication programs.
Park S, Zhang Y, Lin S, Wang TH, Yang S (2011): Advances in microfluidic PCR for point-of-
care infectious disease diagnostics. Biotechnology Advances. Nov-Dec; 29(6): 830-839.
Abstract: Global burdens from existing or emerging infectious diseases emphasize the need
for point-of-care (POC) diagnostics to enhance timely recognition and intervention. Molecular
approaches based on PCR methods have made significant inroads by improving detection time
and accuracy but are still largely hampered by resource-intensive processing in centralized
laboratories, thereby precluding their routine bedside- or field-use. Microfluidic technologies
have enabled miniaturization of PCR processes onto a chip device with potential benefits
including speed, cost, portability, throughput, and automation. In this review, we provide an
overview of recent advances in microfluidic PCR technologies and discuss practical issues and
perspectives related to implementing them into infectious disease diagnostics.
Other (found on Google)
Search words: “tuberculosis + low cost + diagnostic + blood”
Pai NP and Pai M (2012): Point-of-Care Diagnostics for HIV and Tuberculosis: Landscape,
Pipeline, and Unmet Needs. Discov Med. Jan;13(68):35-45.
Abstract: Early diagnosis and rapid initiation of treatment remains a key strategy to control
both HIV and tuberculosis (TB). However, HIV and TB control programs have had completely
contrasting successes, especially with the development and deployment of point-of-care (POC)
diagnostics. Clinicians, researchers, and public health staff who work at the frontlines of HIV
care and control have had access to an outstanding array of POC diagnostics at their disposal,
including those used for screening, initial diagnosis, staging, treatment monitoring, and early
infant diagnosis. The field has also advanced to consider over-the-counter, self-testing options
for HIV and the use of multiplexed platforms that allow for simultaneous detection of
Appendices
153
infections associated with HIV. In sharp contrast to HIV, suboptimal and delayed diagnosis of
TB has perpetuated the epidemic in many high-burden countries. Although the TB diagnostics
pipeline is substantially better today than it was even five years ago, absence of a simple POC
test continues to be a gaping hole in the pipeline. In this review, we compare the POC
diagnostics landscape and pipelines for these two important infectious diseases, and highlight
gaps and unmet needs.
(http://www.discoverymedicine.com/Nitika-Pant-Pai/2012/01/18/point-of-care-diagnostics-
for-hiv-and-tuberculosis-landscape-pipeline-and-unmet-needs/)
Post.doc, Ph.D. Thomas Steen Hansen's Project: Low cost polymer device for tuberculosis
diagnostics using electrical readout.
Abstract: Tuberculosis is a serious threat to the people in numerous developing countries. One
of the reasons this dangerous disease is difficult to control is the lack of a cheap and reliable
diagnostic tool. In our project we aim at developing a polymer device that with a high
sensibility can diagnose TB without the use of advanced laboratory equipment. The device is
based on a new type of advanced polymer that can both conduct electricity and bind
molecules with biological relevance. We can e.g. bind antibodies that are distinct in the
manner that they can very specifically recognize a given molecule. Using this setup we can
measure the presence of a TB related molecule in a blood sample from a patient. This is to be
used in association with collaborators from Hvidovre Hospital who have identified a new signal
protein in the blood from TB patients. In this project we will combine the advanced polymer
with antibodies against the new signal protein to produce a simple and cheap polymer device
that can diagnose TB in a health clinic in developing countries. The method is generic and can
be transferred to other areas where antibodies are used for diagnostics, herein HIV.
(http://www.nanotech.dtu.dk/English/Research/Externally_Funded_Projects/Low_Cost_Poly
mer_Device.aspx)
Appendices
154
Search words: “artificial lymph node”
Okamoto N, Chihara R, Shimizu C, Nishimoto S, Watanabe T (2007): Artificial lymph nodes
induce potent secondary immune responses in naive and immunodeficient mice. J Clin
Invest.April;117(4):997–1007.
Abstract: We previously demonstrated that artificial lymph nodes (aLNs) could be generated in
mice by the implantation of stromal cell–embedded biocompatible scaffolds into their renal
subcapsular spaces. T and B cell domains that form in aLNs have immune response functions
similar to those of follicles of normal lymphoid tissue. In the present study, we show that the
aLNs were transplantable to normal as well as SCID mice, where they efficiently induced
secondary immune responses. Antigen-specific secondary responses were strongly induced in
aLNs even 4 weeks after their transplantation. The antigen-specific antibody responses in
lymphocyte-deficient SCID mice receiving transplanted aLNs were substantial. The cells from
the aLNs migrated to the SCID mouse spleen and BM, where they expanded to generate large
numbers of antigen-specific antibody-forming cells. Secondary responses were maintained
over time after immunization (i.e., antigen challenge), indicating that aLNs can support the
development of memory B cells and long-lived plasma cells. Memory CD4+ T cells were
enriched in the aLNs and spleens of aLN-transplanted SCID mice. Our results indicate that aLNs
support strong antigen-specific secondary antibody responses in immunodeficient mice and
suggest the possibility of future clinical applications.
(http://www.jci.org/articles/view/30379)
Patent application title: ARTIFICIAL LYMPH NODE FOR TREATING CANCER
Inventors: Takeshi Watanabe (Yokohama-Shi, JP) Kouji Tanaka (Yokohama-Shi, JP)
Assignees: RIKEN
IPC8 Class: AA61K3900FI
USPC Class: 4242771
Class name: Cancer cell or component thereof
Appendices
155
Publication date: 10/22/2009
Patent application number: 20090263428
Abstract: Provided is an artificial lymph node that is persistently effective in cancer treatment
in vivo. A method of producing an artificial lymph node capable of inducing cancer antigen-
specific immune responses, comprising the following steps: (a) a step for immunizing a non-
human animal using a cancer antigen and an adjuvant capable of inducing cellular immunity;
and (b) a step for transplanting an artificial lymph node material consisting of a polymeric
biomaterial comprising cytokine-producing stromal cells and dendritic cells to the immunized
non-human animal, an artificial lymph node capable of inducing cancer antigen-specific
immune responses obtained by the method of production, a cancer therapeutic agent
comprising the artificial lymph node, and a kit for producing an artificial lymph node for cancer
treatment comprising the following: (a) a cancer antigen; (b) an adjuvant capable of inducing
cellular immunity; (c) a cytokine expression vector and stromal cells, or stromal cells
incorporating a cytokine expression vector; (d) dendritic cells; and (e) a polymeric biomaterial.
(http://www.faqs.org/patents/app/20090263428)
Information about closest relevant techniques
In the “lab-on-a-chip”- field, most devises combining micro fluidics with on-chip PCR are designed to
identify the presence of an infection in a sample by detecting the pathogen and not the immune
response directed against it. One method for on-chip detection of proteins is the use of antibodies
coated on the chip surface. The binding of proteins to these antibodies can either result in a
detectable change in the conductivity of the coated surface or the binding can be visualized via
fluorescence.
Presently used methods of diagnosing tuberculosis consist of either in vitro cell culture test such as
QuantiFERON-TB Gold, QuantiFERON-TB Gold In-Tube, and T-SPOT.TB, or tuberculin skin test such as
the Mantoux test. In the latter test, purified protein derivatives (PPD) tuberculin is intradermally
injected in the skin of a test person and the result is read 48 to 72 hours later. If the person is
infected, this will result in a local swelling due to a rapidly activated immune response.