Embed Size (px)
Citation preview
ww.sciencedirect.com
wat e r r e s e a r c h 5 1 ( 2 0 1 4 ) 2 5 6e2 6 5
Available online at w
ScienceDirect
journal homepage: www.elsevier .com/locate /watres
A three-step test of phosphate sorption efficiencyof potential agricultural drainage filter materials
G. Lyngsie*, O.K. Borggaard, H.C.B. Hansen
University of Copenhagen, Department of Plant and Environmental Sciences, Thorvaldsensvej 40, DK-1871
Frederiksberg C, Denmark
a r t i c l e i n f o
Article history:
Received 17 August 2013
Received in revised form
24 October 2013
Accepted 27 October 2013
Available online 8 November 2013
Keywords:
Water quality
Eutrophication
Iron oxides
Carbonates
Farmland drainage
* Corresponding author.E-mail addresses: [email protected], grylyn
0043-1354/$ e see front matter ª 2013 Elsevhttp://dx.doi.org/10.1016/j.watres.2013.10.061
a b s t r a c t
Phosphorus (P) eutrophication of lakes and streams, coming from drained farmlands, is a
serious problem in areas with intensive agriculture. Installation of P sorbing filters at drain
outlets may be a solution. Efficient sorbents to be used for such filters must possess high P
bonding affinity to retain ortho-phosphate (Pi) at low concentrations. In addition high P
sorption capacity, fast bonding and low desorption is necessary. In this study five potential
filter materials (Filtralite-P�, limestone, calcinated diatomaceous earth, shell-sand and
iron-oxide based CFH) in four particle size intervals were investigated under field relevant P
concentrations (0e161 mM) and retentions times of 0e24 min. Of the five materials exam-
ined, the results from P sorption and desorption studies clearly demonstrate that the iron
based CFH is superior as a filter material compared to calcium based materials when tested
against criteria for sorption affinity, capacity and stability. The finest CFH and Filtralite-P�
fractions (0.05e0.5 mm) were best with P retention of �90% of Pi from an initial concen-
tration of 161 mM corresponding to 14.5 mmol/kg sorbed within 24 min. They were further
capable to retain �90% of Pi from an initially 16 mM solution within 1½ min. However, only
the finest CFH fraction was also able to retain �90% of Pi sorbed from the 16 mM solution
against 4 times desorption sequences with 6 mM KNO3. Among the materials investigated,
the finest CFH fraction is therefore the only suitable filter material, when very fast and
strong bonding of high Pi concentrations is needed, e.g. in drains under P rich soils during
extreme weather conditions.
ª 2013 Elsevier Ltd. All rights reserved.
1. Introduction and ditches collect and direct the diffuse P contribution (loss)
Soils in intensively farmed countries may be sources of
phosphorus (P) due to decades of surplus application of P in
organic and inorganic fertilisers (Heal et al., 2005; Delgado and
Scalenghe, 2008; Buda et al., 2012). However, a P-enriched soil
only becomes an environmental problem when connected to
the aquatic environment by an effective transport pathway
such as artificial drains (Heathwaite et al., 2003). Tile drains
[email protected] (G. Ly
ier Ltd. All rights reserve
from fields to recipient waters and act as highways for both
soluble and particulate P (Ulen et al., 2007). Despite substantial
efforts over many years to reduce this transport, leaching of P
from agricultural land to the aquatic environment is still a
serious and costly problem in many parts of Europe and
elsewhere (Delgado and Scalenghe, 2008; Ballantine and
Tanner, 2010; Buda et al., 2012). Thus, to reach the goal of
good water quality as stated in the EU Water Framework
ngsie).
d.
wat e r r e s e a r c h 5 1 ( 2 0 1 4 ) 2 5 6e2 6 5 257
Directive (WFD) requires a substantial reduction of the diffuse
P loss from farmland in many parts of Europe (Søndergaard
et al., 2005; Kaasik et al., 2008).
While a range of P mitigation options have been tested for
surface transport (Hoffmann et al., 2009), this is not the case
for subsurface transport (Kroger et al., 2008). However, by
installing a filter construction at the end of a drainage pipe,
Penn et al. (2007) demonstrated an immediate reduction of
drainage P leaching. This end-of-pipe approach could be car-
ried out in connection with a small-scale constructed wetland
(Reinhardt et al., 2005) or with flow-through filter structures in
ditches (Penn et al., 2007). A great variety of different types of
filters and filter materials for P retention have been described
for retention of high P concentrations in wastewaters
(Johansson Westholm, 2006; Penn et al., 2007; Cucarella and
Renman, 2009; Vohla et al., 2011). However, it is question-
able to directly transfer the experience obtained from these
high P concentration studies to the low P concentrations in
drainage water as the filter materials may behave differently
at high and low solution concentrations (Agyei et al., 2002;
Adam et al., 2007). Therefore, the filter materials need to be
tested at low P concentrations and short reaction times rele-
vant for cleaning P contaminated drainage water.
P in drainage water may consist of P in dissolved
organic matter, particulate P and dissolved ortho-phosphate
(Pi). The focus in this investigation will be on Pi, which
denotes inorganic phosphate irrespective of the species
ðH2PO�4 ; HPO2�
4 and=or PO3�4 Þ In natural, unpolluted areas in
Denmark, the Pi concentration in base flow drainage water is
typically �1.6 mM but the concentration can be up to 42 mM in
farmland drains (Andersen et al., 2006) and Penn et al. (2007)
found more than four times this concentration in Maryland,
US. The highwater flow during rainstorms and fast frost-thaw
transitions is critical because of high or very high P leaching
during such peak flows (Grant et al., 1996; Johnes, 2007). To
effectively remove the Pi during peak flows with high Pi con-
centrations, the filter material must react fast and possess
high Pi sorption stability and capacity. Even though fast and
substantial Pi sorption is mandatory for the practical use of
the filter materials, it is also important with a stable bonding
of sorbed Pi to ensure that Pi is not desorbed when the sorp-
tion condition changes, e.g. because of decreasing Pi concen-
tration in the drainage water (Grant et al., 1996). This,
however, is often overlooked in studies focussing on sorption
capacity (Klimeski et al., 2012). The Pi removal efficiency of a
filtermaterial is closely related to the content of various Al, Ca,
Fe andMg (hydr)oxides and carbonates (JohanssonWestholm,
2006; Ballantine and Tanner, 2010; Vohla et al., 2011). In
addition to the elemental composition, the specific surface
area (SSA) is important as sorption normally increases at
increasing SSA. Although it is outside the scope of this study,
high hydraulic conductivity of the filter material is also
essential for use in high-flow drainage filters.
As a practical test of high Pi removal efficiency also under
extreme conditions, we suggest the following three sorption/
desorption criteria: (i) A capacity to retain �90% Pi from
161 mM solution within 24 min; (ii) A reactivity resulting in
retention of �90% Pi from 16 mM solution within 1½ min; (iii)
A stability resulting in dissolution of <10% of this retained Pi
after four desorptions with artificial drainage water (6 mM
KNO3). A detailed discussion of these test criteria is given
later in the paper. This concentration range is in line with the
findings in natural drainage water as stated above and the
contact time is based on field findings (Penn et al., 2007; Penn
and McGrath, 2011).
Accordingly, the aim of the present investigation is to
assess the sorption parameters of five manufactured filter
materials (so-called Filtralite-P�, limestone, calcinated diato-
maceous earth CDE, shell-sand and iron oxide based CFH).
The assessment includes a characterization of the materials
and a batch-mode testing of the Pi removal efficiency ac-
cording to above-mentioned criteria of the materials in four
particle sizes at low concentrations of Pi in artificial and nat-
ural drainage waters. To the best of our knowledge, this is the
first studywhere various potential phosphorus filtermaterials
are tested under the same field-relevant conditions, i.e. both
at low to rather low Pi concentrations and very short to semi-
short sorption (reaction) times. The materials chosen for this
study have either been used or tested as wastewater filters or
as an adsorbent/absorbent in other respects.
2. Materials and methods
2.1. Filter materials
Filtralite-P� is a Light Expanded Clay Aggregates (LECA)-
resembling material calcinated at 1200 �C that was provided
by Weber, Norway. The porous material contains granules of
Ca/Mg oxides, which is the active sorbent. Limestone consists
of a mixture of bryozo and coral chalk from the Danian for-
mation at Faxe. The dried product was provided by Faxe Kalk
A/S, Denmark. Calcinated diatomaceous earth (CDE) from the
Fur formation calcinated at 750 �C was provided by Damolin
A/S, Denmark. Shell-sand consisting of crushed sea shells was
provided by DanShells Aps, Denmark. CFH-12 (CFH) consists
of dried iron oxides, which was provided by Kemira Oyj,
Finland.
2.2. Filter material characterization
Bulk samples of the five materials were analysed for pH,
mineral composition, carbonate, oxalate- and citrate-
bicarbonate-dithionite-extractable Al and Fe as well as total
Al, Fe, Ca, Mg and Pi, while the specific surface area (SSA) was
determined on all the particle size fractions. In addition, the
total composition of the CFH and Filtralite-P� fractions was
determined.
All analyses were carried out on ball-milled bulkmaterials.
pH was measured potentiometrically in 0.01 M CaCl2 using a
solid:solution ratio of 1:2.5. The mineralogy of the materials
was assessed by X-ray diffraction analysis on unoriented
samples using a Siemens 5000 instrument equipped with Co-
Ka radiation and a diffracted beam monochromator. Dif-
fractograms were recorded from 10 to 90� 2q using 0.03� 2q
steps and a step speed of 2 s. Diffraction peak positions were
used to calculate d-values for mineral identification. The
carbonate content was determined volumetrically by a
calcimeter (Allison and Moodie, 1965). Oxalate-extractable
aluminium (Alox) and iron (Feox) were determined by
wat e r r e s e a r c h 5 1 ( 2 0 1 4 ) 2 5 6e2 6 5258
extraction with 0.2 M ammonium oxalate for 2 h at pH 3 in the
dark (Schwertmann, 1964). Citrate-bicarbonate-dithionite-
extractable Al and Fe (AlCBD, FeCBD) were determined by
three sequential extractions for 15min at 70 �C as described by
Mehra and Jackson (1960). Total Al, Fe, Ca and Mg (Altotal,
Fetotal, Catotal, Mgtotal) were determined after dissolution of the
materials in a mixture of concentrated nitric acid, hydrogen
peroxide, hydrochloric acid and hydrofluoric acid (EPA 3052).
Al and Fe in oxalate and CBD extracts were determined by
atomic absorption spectroscopy (AAS) using a Perkin Elmer
3300 and the concentrations of total Al, Fe, Ca and Mg were
determined by inductive coupled plasma mass spectroscopy
(ICP-MS) on an Agilent 7500C instrument. Total Pi (Ptotal) was
determined by extracting the material with 6 M H2SO4 for
10 min at 70 �C (Mehta et al., 1954). The concentration of P in
the extract was determined by the molybdenum-blue method
(Murphy and Riley, 1962).
To assess the influence of particle size on Pi sorption, the
filter materials were fractionated into particle size intervals of
2e4mm, 1e2mm, 0.5e1mmand 0.05e0.5mmby sieving. The
(external) SSA of the different fractions was determined by
applying the BET equation (Brunauer et al., 1938) to N2
adsorption data obtained by means of a Micromeritic Gemini
VII 2390a instrument. Total element composition of the CFH
and Filtralite-P� fractions was determined by X-ray fluores-
cence at Actlabs, Canada.
2.3. Phosphate sorption
2.3.1. Influence of Pi concentration and background electrolyteThesorption testswere carriedout as follows:Nine 1 g samples
of each of the different particle sizes of the five filter materials
were shaken (175 rpm) in open beakers for 24minwith 100mL
6 mM KNO3 and 7 initial KH2PO4 concentrations ranging be-
tween 0 and 161 mM adjusted to pH 6 with 0.1 M NaOH. After
shaking, pH was measured and an aliquot of the solution was
withdrawnwith a syringe andfiltered through 0.2 mmMillipore
syringe-filter. The filtrate was added 20 mL 2 M sulphuric acid
per mL for preservation, and stored (<1 week) at 5 �C until P
determination. Before performing Pi sorption, the filter mate-
rials were soaked in the background electrolyte for 24 h.
As background electrolyte so-called artificial drainage
water (ADW), i.e. 6 mM KNO3 was used for all Pi sorptions
instead of natural drainage water (NDW). ADW has the same
electric conductivity (ionic strength) as was found in NDW
(0.6 dS/m) collected from a drainage well at Tastrup, Denmark
under a cultivated soil (Typic Argiudoll) developed on calcar-
eous morainic material from the Weichelian Glaciation. This
NDW had pH 6.9 and contained 2.5 mM Ca2þ, 0.3 mM Mg2þ,0.4 mM Naþ, 1.6 mM Kþ and 1.6 mM Pi; Cl� and NO�
3 were
identified but not quantified. ADW was chosen to avoid
interfering reactions such as formation of Ca-precipitates if
using NDW. Furthermore, use of NDW throughout would be
inconvenient as drainage water composition can exhibit great
temporal variation, which would necessitate collection and
long-time storage of very large volumes of drainage water.
However, sorption by the 1e2 mm fractions of CFH, Fil-
tralite-P� and limestone was tested with the above-
mentioned NDW as background electrolyte using the same
Pi concentrations and procedure as described above.
2.3.2. Pi sorption and desorption kineticsThe importance of contact time was addressed in two turns: (i)
short-time sorption covering the time span of 1½-24minand (ii)
semi long-term sorption running from 0.75 to 48 h. For short-
term Pi sorption 0.7 g samples of the different materials were
shaken end-over-end (175 rpm) with 70 mL 6 mM KNO3 con-
taining 16 mMKH2PO4adjusted to pH 6 for 90 s, 180 s, 360 s, 720 s
and 1440 s (24 min). The kinetics of semi long-term Pi sorption
was determined for the 1e2 mm fractions of CFH, Filtralite-P�
and limestone in the same way as for the short-term sorption
but the sorption times were extended to 45 min, 1.5 h, 3 h, 6 h,
12 h, 24 h and 48 h. After shaking and filtration, the extracts
were treated as described in Section 2.3.1.
Immediately after the 24-min sorption from 16 mM Pi so-
lution, desorption was carried out on all samples by means of
four successive extractions, each by end-over-end shaking of
the sample (175 rpm) for 15 min with 50 mL of 6 mM KNO3,
centrifugation of the suspension and replacement of the
extract with a fresh portion of 6 mM KNO3. After extraction,
the extracts were acidified as described in Section 2.3.1.
The phosphate concentrations in the filtrates and extracts
were determined by themolybdenum blue method using flow
injection analysis on a FIAstar 5000 instrument (Ruzicka and
Hansen, 1988). Sorbed Pi in mmol/kg was calculated from the
difference between the Pi concentrations before and after
shaking with the filter materials. In the desorption investiga-
tion, desorbed Pi in each desorption step was calculated from
the Pi concentration in the extract corrected for left-over from
the previous desorption.
All experiments were carried out in triplicate. The glass-
and plastic wares were acid-washed, the chemicals were pro
analysis or of better quality and triple deionized water was
used throughout.
2.4. Data handling
Sorbed Pi was plotted against the solution concentration
resulting in the isotherms. Sorbed Pi corresponding to initial
concentrations of 16 mM and 161 mM were read on the iso-
therms for the various materials and particle sizes (S16, S161).
The sorption versus time data from the short-term
(90e1440 s) and semi long-term (0.75e48 h) sorption in-
vestigations were fitted to the hyperbola equation:
SK ¼ Smax$tKþ t
(1)
SK is the time-dependent amount of sorbed Pi (mmol/kg) at
time t (min). Smax is the maximum Pi sorption (mmol/kg) and K
(min) is a fitting parameter determined by the shape of the
sorption curve. The curves were fitted with SigmaPlot (v. 12.0,
Systat Software, Inc.).
3. Results and discussion
3.1. Filter material characteristics
The filters comprise three kinds of minerals including car-
bonates (limestone, shell-sand), iron oxides (CFH) and mixed
minerals (CDE, Filtralite-P�) (Table 1). According to XRD, the
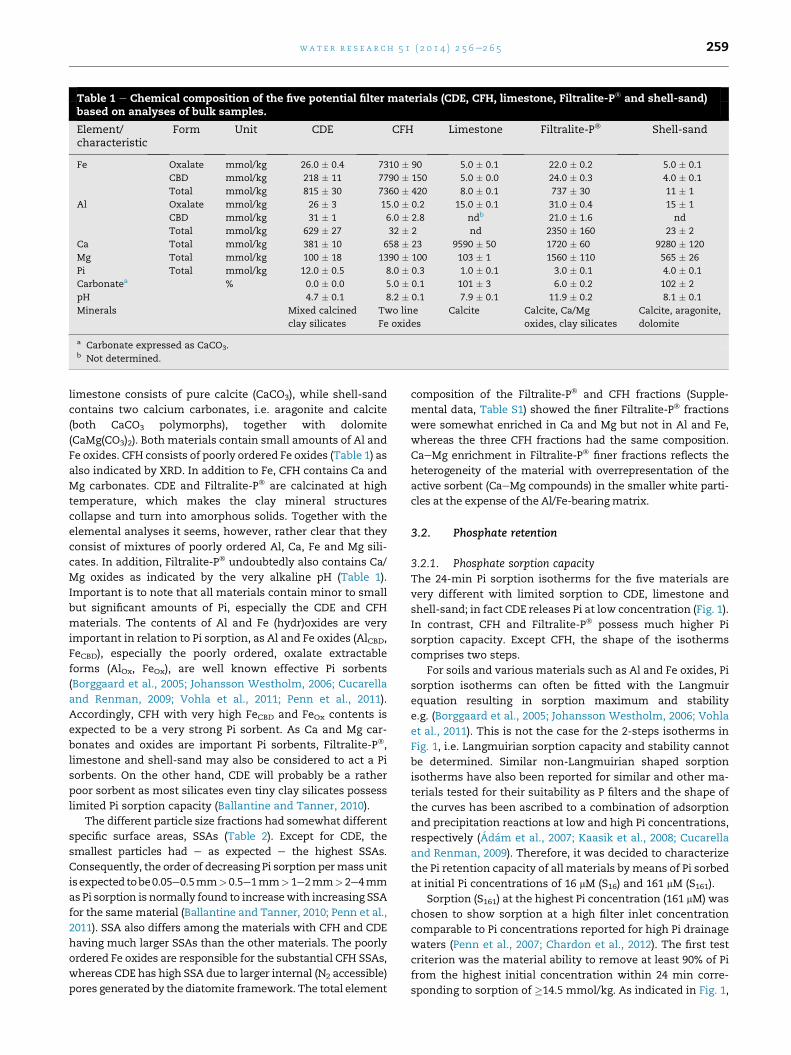
Table 1 e Chemical composition of the five potential filter materials (CDE, CFH, limestone, Filtralite-P� and shell-sand)based on analyses of bulk samples.
Element/characteristic
Form Unit CDE CFH Limestone Filtralite-P� Shell-sand
Fe Oxalate mmol/kg 26.0 � 0.4 7310 � 90 5.0 � 0.1 22.0 � 0.2 5.0 � 0.1
CBD mmol/kg 218 � 11 7790 � 150 5.0 � 0.0 24.0 � 0.3 4.0 � 0.1
Total mmol/kg 815 � 30 7360 � 420 8.0 � 0.1 737 � 30 11 � 1
Al Oxalate mmol/kg 26 � 3 15.0 � 0.2 15.0 � 0.1 31.0 � 0.4 15 � 1
CBD mmol/kg 31 � 1 6.0 � 2.8 ndb 21.0 � 1.6 nd
Total mmol/kg 629 � 27 32 � 2 nd 2350 � 160 23 � 2
Ca Total mmol/kg 381 � 10 658 � 23 9590 � 50 1720 � 60 9280 � 120
Mg Total mmol/kg 100 � 18 1390 � 100 103 � 1 1560 � 110 565 � 26
Pi Total mmol/kg 12.0 � 0.5 8.0 � 0.3 1.0 � 0.1 3.0 � 0.1 4.0 � 0.1
Carbonatea % 0.0 � 0.0 5.0 � 0.1 101 � 3 6.0 � 0.2 102 � 2
pH 4.7 � 0.1 8.2 � 0.1 7.9 � 0.1 11.9 � 0.2 8.1 � 0.1
Minerals Mixed calcined
clay silicates
Two line
Fe oxides
Calcite Calcite, Ca/Mg
oxides, clay silicates
Calcite, aragonite,
dolomite
a Carbonate expressed as CaCO3.b Not determined.
wat e r r e s e a r c h 5 1 ( 2 0 1 4 ) 2 5 6e2 6 5 259
limestone consists of pure calcite (CaCO3), while shell-sand
contains two calcium carbonates, i.e. aragonite and calcite
(both CaCO3 polymorphs), together with dolomite
(CaMg(CO3)2). Both materials contain small amounts of Al and
Fe oxides. CFH consists of poorly ordered Fe oxides (Table 1) as
also indicated by XRD. In addition to Fe, CFH contains Ca and
Mg carbonates. CDE and Filtralite-P� are calcinated at high
temperature, which makes the clay mineral structures
collapse and turn into amorphous solids. Together with the
elemental analyses it seems, however, rather clear that they
consist of mixtures of poorly ordered Al, Ca, Fe and Mg sili-
cates. In addition, Filtralite-P� undoubtedly also contains Ca/
Mg oxides as indicated by the very alkaline pH (Table 1).
Important is to note that all materials contain minor to small
but significant amounts of Pi, especially the CDE and CFH
materials. The contents of Al and Fe (hydr)oxides are very
important in relation to Pi sorption, as Al and Fe oxides (AlCBD,
FeCBD), especially the poorly ordered, oxalate extractable
forms (AlOx, FeOx), are well known effective Pi sorbents
(Borggaard et al., 2005; Johansson Westholm, 2006; Cucarella
and Renman, 2009; Vohla et al., 2011; Penn et al., 2011).
Accordingly, CFH with very high FeCBD and FeOx contents is
expected to be a very strong Pi sorbent. As Ca and Mg car-
bonates and oxides are important Pi sorbents, Filtralite-P�,
limestone and shell-sand may also be considered to act a Pi
sorbents. On the other hand, CDE will probably be a rather
poor sorbent as most silicates even tiny clay silicates possess
limited Pi sorption capacity (Ballantine and Tanner, 2010).
The different particle size fractions had somewhat different
specific surface areas, SSAs (Table 2). Except for CDE, the
smallest particles had e as expected e the highest SSAs.
Consequently, the order of decreasing Pi sorption permass unit
isexpected tobe0.05e0.5mm>0.5e1mm> 1e2mm>2e4mm
as Pi sorption is normally found to increasewith increasing SSA
for the samematerial (Ballantine and Tanner, 2010; Penn et al.,
2011). SSA also differs among the materials with CFH and CDE
having much larger SSAs than the other materials. The poorly
ordered Fe oxides are responsible for the substantial CFH SSAs,
whereas CDE has high SSA due to larger internal (N2 accessible)
pores generated by the diatomite framework. The total element
composition of the Filtralite-P� and CFH fractions (Supple-
mental data, Table S1) showed the finer Filtralite-P� fractions
were somewhat enriched in Ca and Mg but not in Al and Fe,
whereas the three CFH fractions had the same composition.
CaeMg enrichment in Filtralite-P� finer fractions reflects the
heterogeneity of the material with overrepresentation of the
active sorbent (CaeMg compounds) in the smaller white parti-
cles at the expense of the Al/Fe-bearing matrix.
3.2. Phosphate retention
3.2.1. Phosphate sorption capacityThe 24-min Pi sorption isotherms for the five materials are
very different with limited sorption to CDE, limestone and
shell-sand; in fact CDE releases Pi at low concentration (Fig. 1).
In contrast, CFH and Filtralite-P� possess much higher Pi
sorption capacity. Except CFH, the shape of the isotherms
comprises two steps.
For soils and various materials such as Al and Fe oxides, Pi
sorption isotherms can often be fitted with the Langmuir
equation resulting in sorption maximum and stability
e.g. (Borggaard et al., 2005; Johansson Westholm, 2006; Vohla
et al., 2011). This is not the case for the 2-steps isotherms in
Fig. 1, i.e. Langmuirian sorption capacity and stability cannot
be determined. Similar non-Langmuirian shaped sorption
isotherms have also been reported for similar and other ma-
terials tested for their suitability as P filters and the shape of
the curves has been ascribed to a combination of adsorption
and precipitation reactions at low and high Pi concentrations,
respectively (Adam et al., 2007; Kaasik et al., 2008; Cucarella
and Renman, 2009). Therefore, it was decided to characterize
the Pi retention capacity of all materials by means of Pi sorbed
at initial Pi concentrations of 16 mM (S16) and 161 mM (S161).
Sorption (S161) at the highest Pi concentration (161 mM) was
chosen to show sorption at a high filter inlet concentration
comparable to Pi concentrations reported for high Pi drainage
waters (Penn et al., 2007; Chardon et al., 2012). The first test
criterion was the material ability to remove at least 90% of Pi
from the highest initial concentration within 24 min corre-
sponding to sorption of �14.5 mmol/kg. As indicated in Fig. 1,
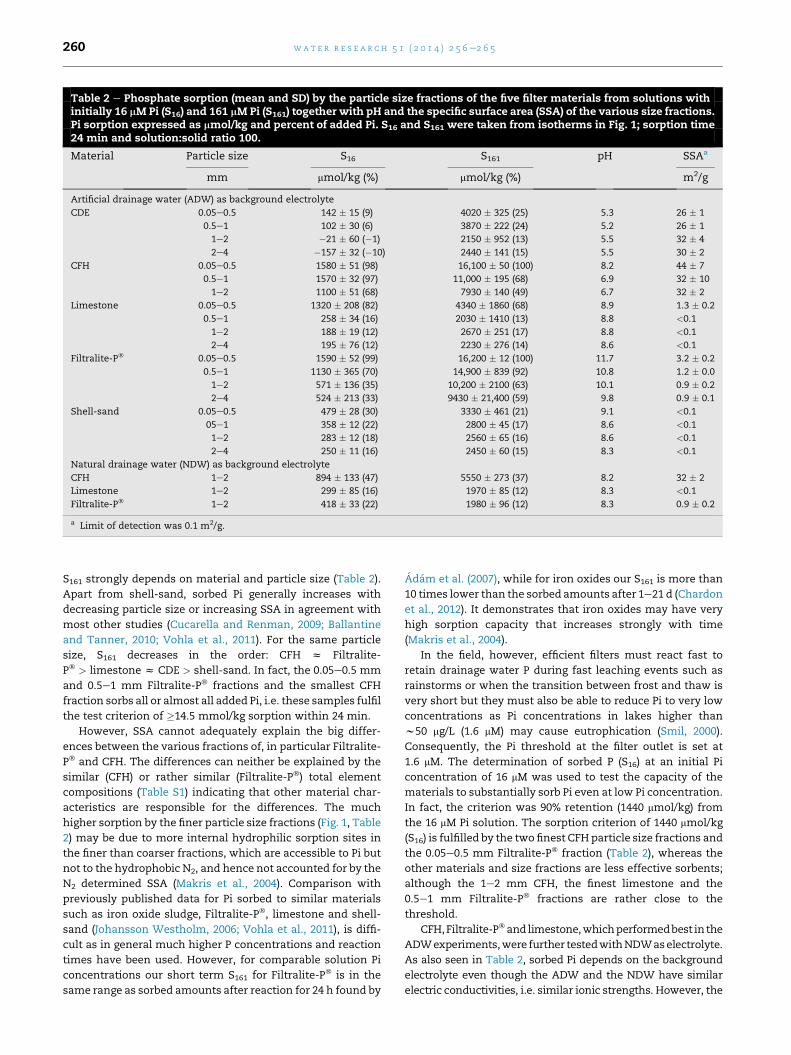
Table 2 e Phosphate sorption (mean and SD) by the particle size fractions of the five filter materials from solutions withinitially 16 mM Pi (S16) and 161 mM Pi (S161) together with pH and the specific surface area (SSA) of the various size fractions.Pi sorption expressed as mmol/kg and percent of added Pi. S16 and S161 were taken from isotherms in Fig. 1; sorption time24 min and solution:solid ratio 100.
Material Particle size S16 S161 pH SSAa
mm mmol/kg (%) mmol/kg (%) m2/g
Artificial drainage water (ADW) as background electrolyte
CDE 0.05e0.5 142 � 15 (9) 4020 � 325 (25) 5.3 26 � 1
0.5e1 102 � 30 (6) 3870 � 222 (24) 5.2 26 � 1
1e2 �21 � 60 (�1) 2150 � 952 (13) 5.5 32 � 4
2e4 �157 � 32 (�10) 2440 � 141 (15) 5.5 30 � 2
CFH 0.05e0.5 1580 � 51 (98) 16,100 � 50 (100) 8.2 44 � 7
0.5e1 1570 � 32 (97) 11,000 � 195 (68) 6.9 32 � 10
1e2 1100 � 51 (68) 7930 � 140 (49) 6.7 32 � 2
Limestone 0.05e0.5 1320 � 208 (82) 4340 � 1860 (68) 8.9 1.3 � 0.2
0.5e1 258 � 34 (16) 2030 � 1410 (13) 8.8 <0.1
1e2 188 � 19 (12) 2670 � 251 (17) 8.8 <0.1
2e4 195 � 76 (12) 2230 � 276 (14) 8.6 <0.1
Filtralite-P� 0.05e0.5 1590 � 52 (99) 16,200 � 12 (100) 11.7 3.2 � 0.2
0.5e1 1130 � 365 (70) 14,900 � 839 (92) 10.8 1.2 � 0.0
1e2 571 � 136 (35) 10,200 � 2100 (63) 10.1 0.9 � 0.2
2e4 524 � 213 (33) 9430 � 21,400 (59) 9.8 0.9 � 0.1
Shell-sand 0.05e0.5 479 � 28 (30) 3330 � 461 (21) 9.1 <0.1
05e1 358 � 12 (22) 2800 � 45 (17) 8.6 <0.1
1e2 283 � 12 (18) 2560 � 65 (16) 8.6 <0.1
2e4 250 � 11 (16) 2450 � 60 (15) 8.3 <0.1
Natural drainage water (NDW) as background electrolyte
CFH 1e2 894 � 133 (47) 5550 � 273 (37) 8.2 32 � 2
Limestone 1e2 299 � 85 (16) 1970 � 85 (12) 8.3 <0.1
Filtralite-P� 1e2 418 � 33 (22) 1980 � 96 (12) 8.3 0.9 � 0.2
a Limit of detection was 0.1 m2/g.
wat e r r e s e a r c h 5 1 ( 2 0 1 4 ) 2 5 6e2 6 5260
S161 strongly depends on material and particle size (Table 2).
Apart from shell-sand, sorbed Pi generally increases with
decreasing particle size or increasing SSA in agreement with
most other studies (Cucarella and Renman, 2009; Ballantine
and Tanner, 2010; Vohla et al., 2011). For the same particle
size, S161 decreases in the order: CFH z Filtralite-
P� > limestone z CDE > shell-sand. In fact, the 0.05e0.5 mm
and 0.5e1 mm Filtralite-P� fractions and the smallest CFH
fraction sorbs all or almost all added Pi, i.e. these samples fulfil
the test criterion of �14.5 mmol/kg sorption within 24 min.
However, SSA cannot adequately explain the big differ-
ences between the various fractions of, in particular Filtralite-
P� and CFH. The differences can neither be explained by the
similar (CFH) or rather similar (Filtralite-P�) total element
compositions (Table S1) indicating that other material char-
acteristics are responsible for the differences. The much
higher sorption by the finer particle size fractions (Fig. 1, Table
2) may be due to more internal hydrophilic sorption sites in
the finer than coarser fractions, which are accessible to Pi but
not to the hydrophobic N2, and hence not accounted for by the
N2 determined SSA (Makris et al., 2004). Comparison with
previously published data for Pi sorbed to similar materials
such as iron oxide sludge, Filtralite-P�, limestone and shell-
sand (Johansson Westholm, 2006; Vohla et al., 2011), is diffi-
cult as in general much higher P concentrations and reaction
times have been used. However, for comparable solution Pi
concentrations our short term S161 for Filtralite-P� is in the
same range as sorbed amounts after reaction for 24 h found by
Adam et al. (2007), while for iron oxides our S161 is more than
10 times lower than the sorbed amounts after 1e21 d (Chardon
et al., 2012). It demonstrates that iron oxides may have very
high sorption capacity that increases strongly with time
(Makris et al., 2004).
In the field, however, efficient filters must react fast to
retain drainage water P during fast leaching events such as
rainstorms or when the transition between frost and thaw is
very short but they must also be able to reduce Pi to very low
concentrations as Pi concentrations in lakes higher than
w50 mg/L (1.6 mM) may cause eutrophication (Smil, 2000).
Consequently, the Pi threshold at the filter outlet is set at
1.6 mM. The determination of sorbed P (S16) at an initial Pi
concentration of 16 mM was used to test the capacity of the
materials to substantially sorb Pi even at low Pi concentration.
In fact, the criterion was 90% retention (1440 mmol/kg) from
the 16 mM Pi solution. The sorption criterion of 1440 mmol/kg
(S16) is fulfilled by the two finest CFH particle size fractions and
the 0.05e0.5 mm Filtralite-P� fraction (Table 2), whereas the
other materials and size fractions are less effective sorbents;
although the 1e2 mm CFH, the finest limestone and the
0.5e1 mm Filtralite-P� fractions are rather close to the
threshold.
CFH,Filtralite-P�and limestone,whichperformedbest in the
ADWexperiments,were further testedwithNDWaselectrolyte.
As also seen in Table 2, sorbed Pi depends on the background
electrolyte even though the ADW and the NDW have similar
electric conductivities, i.e. similar ionic strengths. However, the
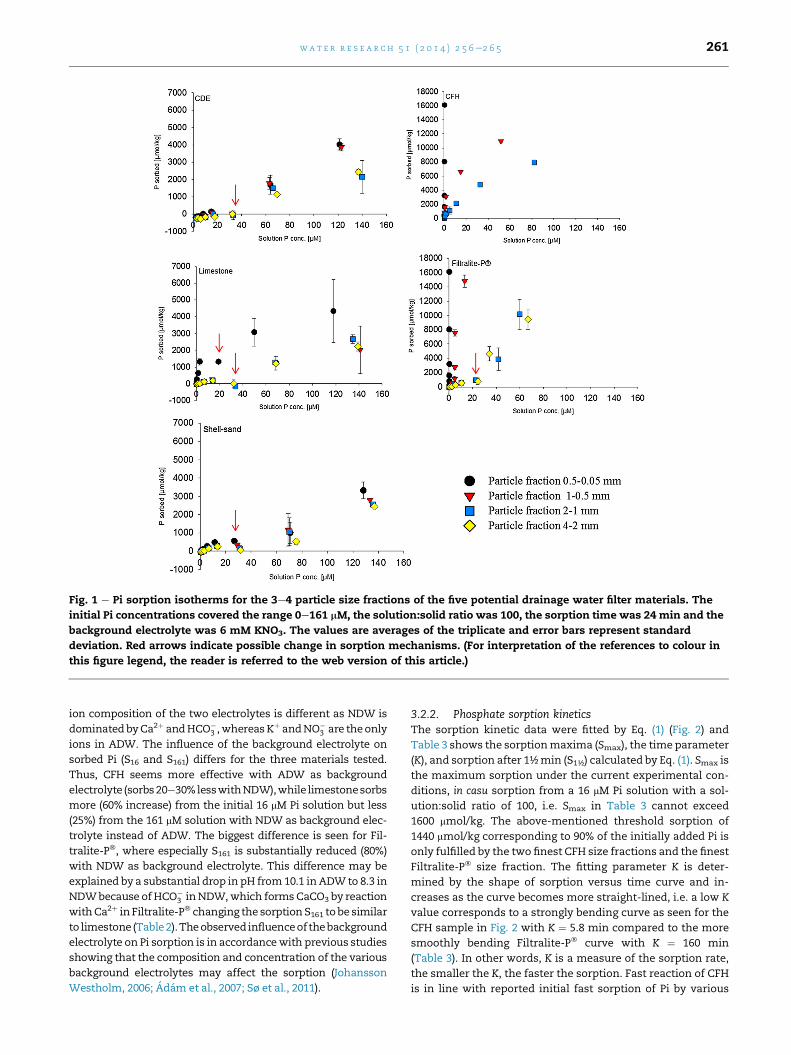
Fig. 1 e Pi sorption isotherms for the 3e4 particle size fractions of the five potential drainage water filter materials. The
initial Pi concentrations covered the range 0e161 mM, the solution:solid ratio was 100, the sorption time was 24 min and the
background electrolyte was 6 mM KNO3. The values are averages of the triplicate and error bars represent standard
deviation. Red arrows indicate possible change in sorption mechanisms. (For interpretation of the references to colour in
this figure legend, the reader is referred to the web version of this article.)
wat e r r e s e a r c h 5 1 ( 2 0 1 4 ) 2 5 6e2 6 5 261
ion composition of the two electrolytes is different as NDW is
dominated byCa2þ andHCO�3 ,whereasKþ andNO�
3 are theonly
ions in ADW. The influence of the background electrolyte on
sorbed Pi (S16 and S161) differs for the three materials tested.
Thus, CFH seems more effective with ADW as background
electrolyte (sorbs20e30%lesswithNDW),while limestonesorbs
more (60% increase) from the initial 16 mM Pi solution but less
(25%) from the 161 mM solution with NDW as background elec-
trolyte instead of ADW. The biggest difference is seen for Fil-
tralite-P�, where especially S161 is substantially reduced (80%)
with NDW as background electrolyte. This difference may be
explained by a substantial drop in pH from10.1 inADW to 8.3 in
NDWbecause ofHCO�3 inNDW,which forms CaCO3 by reaction
withCa2þ in Filtralite-P� changing the sorptionS161 to be similar
to limestone (Table2).Theobserved influenceof thebackground
electrolyte on Pi sorption is in accordancewith previous studies
showing that the composition and concentration of the various
background electrolytes may affect the sorption (Johansson
Westholm, 2006; Adam et al., 2007; Sø et al., 2011).
3.2.2. Phosphate sorption kineticsThe sorption kinetic data were fitted by Eq. (1) (Fig. 2) and
Table 3 shows the sorptionmaxima (Smax), the time parameter
(K), and sorption after 1½min (S1½) calculated by Eq. (1). Smax is
the maximum sorption under the current experimental con-
ditions, in casu sorption from a 16 mM Pi solution with a sol-
ution:solid ratio of 100, i.e. Smax in Table 3 cannot exceed
1600 mmol/kg. The above-mentioned threshold sorption of
1440 mmol/kg corresponding to 90% of the initially added Pi is
only fulfilled by the two finest CFH size fractions and the finest
Filtralite-P� size fraction. The fitting parameter K is deter-
mined by the shape of sorption versus time curve and in-
creases as the curve becomes more straight-lined, i.e. a low K
value corresponds to a strongly bending curve as seen for the
CFH sample in Fig. 2 with K ¼ 5.8 min compared to the more
smoothly bending Filtralite-P� curve with K ¼ 160 min
(Table 3). In other words, K is a measure of the sorption rate,
the smaller the K, the faster the sorption. Fast reaction of CFH
is in line with reported initial fast sorption of Pi by various
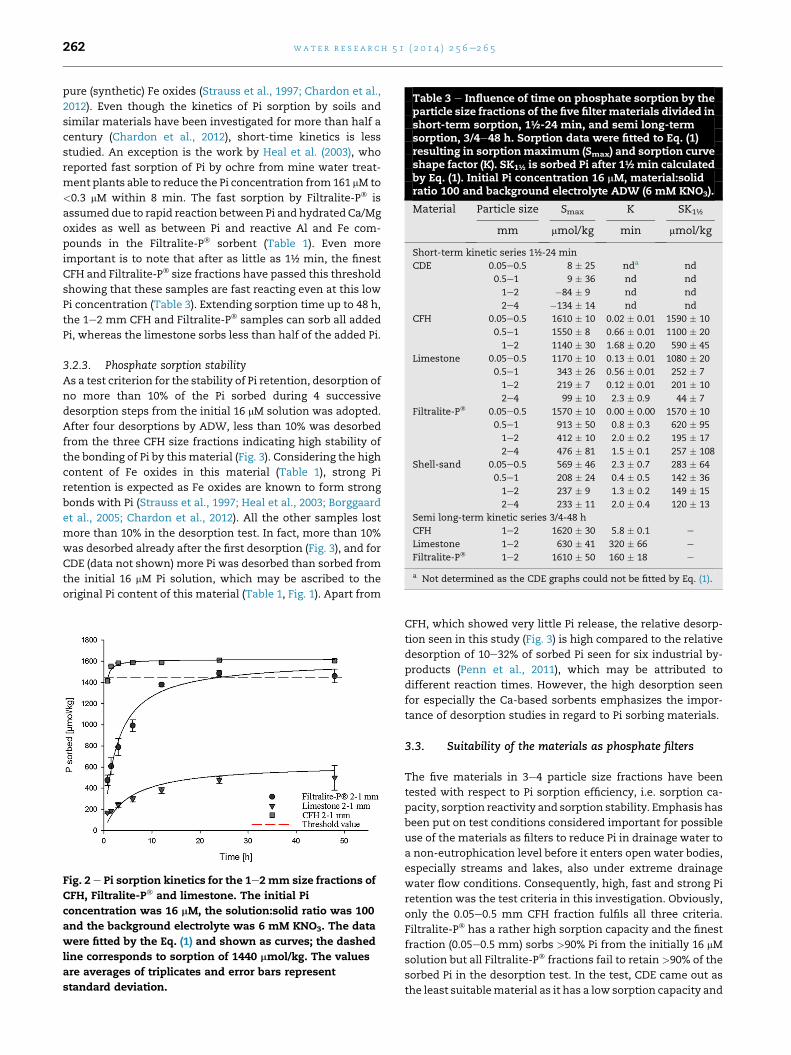
Table 3 e Influence of time on phosphate sorption by theparticle size fractions of the five filter materials divided inshort-term sorption, 1½-24 min, and semi long-termsorption, 3/4e48 h. Sorption data were fitted to Eq. (1)resulting in sorptionmaximum (Smax) and sorption curveshape factor (K). SK1½ is sorbed Pi after 1½min calculatedby Eq. (1). Initial Pi concentration 16 mM, material:solidratio 100 and background electrolyte ADW (6 mM KNO3).
Material Particle size Smax K SK1½
mm mmol/kg min mmol/kg
Short-term kinetic series 1½-24 min
CDE 0.05e0.5 8 � 25 nda nd
0.5e1 9 � 36 nd nd
1e2 �84 � 9 nd nd
2e4 �134 � 14 nd nd
CFH 0.05e0.5 1610 � 10 0.02 � 0.01 1590 � 10
0.5e1 1550 � 8 0.66 � 0.01 1100 � 20
1e2 1140 � 30 1.68 � 0.20 590 � 45
Limestone 0.05e0.5 1170 � 10 0.13 � 0.01 1080 � 20
0.5e1 343 � 26 0.56 � 0.01 252 � 7
1e2 219 � 7 0.12 � 0.01 201 � 10
2e4 99 � 10 2.3 � 0.9 44 � 7
Filtralite-P� 0.05e0.5 1570 � 10 0.00 � 0.00 1570 � 10
0.5e1 913 � 50 0.8 � 0.3 620 � 95
1e2 412 � 10 2.0 � 0.2 195 � 17
2e4 476 � 81 1.5 � 0.1 257 � 108
Shell-sand 0.05e0.5 569 � 46 2.3 � 0.7 283 � 64
0.5e1 208 � 24 0.4 � 0.5 142 � 36
1e2 237 � 9 1.3 � 0.2 149 � 15
2e4 233 � 11 2.0 � 0.4 120 � 13
Semi long-term kinetic series 3/4-48 h
CFH 1e2 1620 � 30 5.8 � 0.1 e
Limestone 1e2 630 � 41 320 � 66 e
Filtralite-P� 1e2 1610 � 50 160 � 18 e
a Not determined as the CDE graphs could not be fitted by Eq. (1).
wat e r r e s e a r c h 5 1 ( 2 0 1 4 ) 2 5 6e2 6 5262
pure (synthetic) Fe oxides (Strauss et al., 1997; Chardon et al.,
2012). Even though the kinetics of Pi sorption by soils and
similar materials have been investigated for more than half a
century (Chardon et al., 2012), short-time kinetics is less
studied. An exception is the work by Heal et al. (2003), who
reported fast sorption of Pi by ochre from mine water treat-
ment plants able to reduce the Pi concentration from161 mM to
<0.3 mM within 8 min. The fast sorption by Filtralite-P� is
assumed due to rapid reaction between Pi and hydrated Ca/Mg
oxides as well as between Pi and reactive Al and Fe com-
pounds in the Filtralite-P� sorbent (Table 1). Even more
important is to note that after as little as 1½ min, the finest
CFH and Filtralite-P� size fractions have passed this threshold
showing that these samples are fast reacting even at this low
Pi concentration (Table 3). Extending sorption time up to 48 h,
the 1e2 mm CFH and Filtralite-P� samples can sorb all added
Pi, whereas the limestone sorbs less than half of the added Pi.
3.2.3. Phosphate sorption stabilityAs a test criterion for the stability of Pi retention, desorption of
no more than 10% of the Pi sorbed during 4 successive
desorption steps from the initial 16 mM solution was adopted.
After four desorptions by ADW, less than 10% was desorbed
from the three CFH size fractions indicating high stability of
the bonding of Pi by this material (Fig. 3). Considering the high
content of Fe oxides in this material (Table 1), strong Pi
retention is expected as Fe oxides are known to form strong
bonds with Pi (Strauss et al., 1997; Heal et al., 2003; Borggaard
et al., 2005; Chardon et al., 2012). All the other samples lost
more than 10% in the desorption test. In fact, more than 10%
was desorbed already after the first desorption (Fig. 3), and for
CDE (data not shown) more Pi was desorbed than sorbed from
the initial 16 mM Pi solution, which may be ascribed to the
original Pi content of this material (Table 1, Fig. 1). Apart from
Fig. 2 e Pi sorption kinetics for the 1e2mm size fractions of
CFH, Filtralite-P� and limestone. The initial Pi
concentration was 16 mM, the solution:solid ratio was 100
and the background electrolyte was 6 mM KNO3. The data
were fitted by the Eq. (1) and shown as curves; the dashed
line corresponds to sorption of 1440 mmol/kg. The values
are averages of triplicates and error bars represent
standard deviation.
CFH, which showed very little Pi release, the relative desorp-
tion seen in this study (Fig. 3) is high compared to the relative
desorption of 10e32% of sorbed Pi seen for six industrial by-
products (Penn et al., 2011), which may be attributed to
different reaction times. However, the high desorption seen
for especially the Ca-based sorbents emphasizes the impor-
tance of desorption studies in regard to Pi sorbing materials.
3.3. Suitability of the materials as phosphate filters
The five materials in 3e4 particle size fractions have been
tested with respect to Pi sorption efficiency, i.e. sorption ca-
pacity, sorption reactivity and sorption stability. Emphasis has
been put on test conditions considered important for possible
use of the materials as filters to reduce Pi in drainage water to
a non-eutrophication level before it enters open water bodies,
especially streams and lakes, also under extreme drainage
water flow conditions. Consequently, high, fast and strong Pi
retention was the test criteria in this investigation. Obviously,
only the 0.05e0.5 mm CFH fraction fulfils all three criteria.
Filtralite-P� has a rather high sorption capacity and the finest
fraction (0.05e0.5 mm) sorbs >90% Pi from the initially 16 mM
solution but all Filtralite-P� fractions fail to retain >90% of the
sorbed Pi in the desorption test. In the test, CDE came out as
the least suitablematerial as it has a low sorption capacity and
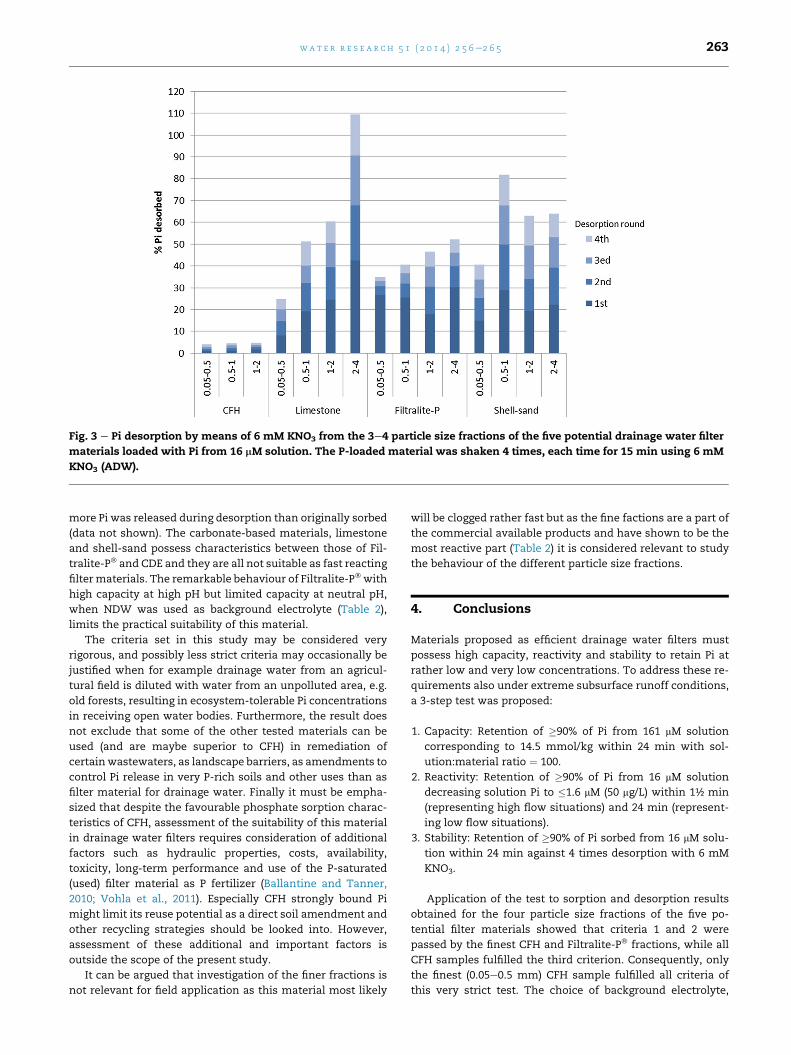
Fig. 3 e Pi desorption by means of 6 mM KNO3 from the 3e4 particle size fractions of the five potential drainage water filter
materials loaded with Pi from 16 mM solution. The P-loaded material was shaken 4 times, each time for 15 min using 6 mM
KNO3 (ADW).
wat e r r e s e a r c h 5 1 ( 2 0 1 4 ) 2 5 6e2 6 5 263
more Pi was released during desorption than originally sorbed
(data not shown). The carbonate-based materials, limestone
and shell-sand possess characteristics between those of Fil-
tralite-P� and CDE and they are all not suitable as fast reacting
filtermaterials. The remarkable behaviour of Filtralite-P�with
high capacity at high pH but limited capacity at neutral pH,
when NDW was used as background electrolyte (Table 2),
limits the practical suitability of this material.
The criteria set in this study may be considered very
rigorous, and possibly less strict criteria may occasionally be
justified when for example drainage water from an agricul-
tural field is diluted with water from an unpolluted area, e.g.
old forests, resulting in ecosystem-tolerable Pi concentrations
in receiving open water bodies. Furthermore, the result does
not exclude that some of the other tested materials can be
used (and are maybe superior to CFH) in remediation of
certainwastewaters, as landscape barriers, as amendments to
control Pi release in very P-rich soils and other uses than as
filter material for drainage water. Finally it must be empha-
sized that despite the favourable phosphate sorption charac-
teristics of CFH, assessment of the suitability of this material
in drainage water filters requires consideration of additional
factors such as hydraulic properties, costs, availability,
toxicity, long-term performance and use of the P-saturated
(used) filter material as P fertilizer (Ballantine and Tanner,
2010; Vohla et al., 2011). Especially CFH strongly bound Pi
might limit its reuse potential as a direct soil amendment and
other recycling strategies should be looked into. However,
assessment of these additional and important factors is
outside the scope of the present study.
It can be argued that investigation of the finer fractions is
not relevant for field application as this material most likely
will be clogged rather fast but as the fine factions are a part of
the commercial available products and have shown to be the
most reactive part (Table 2) it is considered relevant to study
the behaviour of the different particle size fractions.
4. Conclusions
Materials proposed as efficient drainage water filters must
possess high capacity, reactivity and stability to retain Pi at
rather low and very low concentrations. To address these re-
quirements also under extreme subsurface runoff conditions,
a 3-step test was proposed:
1. Capacity: Retention of �90% of Pi from 161 mM solution
corresponding to 14.5 mmol/kg within 24 min with sol-
ution:material ratio ¼ 100.
2. Reactivity: Retention of �90% of Pi from 16 mM solution
decreasing solution Pi to �1.6 mM (50 mg/L) within 1½ min
(representing high flow situations) and 24 min (represent-
ing low flow situations).
3. Stability: Retention of �90% of Pi sorbed from 16 mM solu-
tion within 24 min against 4 times desorption with 6 mM
KNO3.
Application of the test to sorption and desorption results
obtained for the four particle size fractions of the five po-
tential filter materials showed that criteria 1 and 2 were
passed by the finest CFH and Filtralite-P� fractions, while all
CFH samples fulfilled the third criterion. Consequently, only
the finest (0.05e0.5 mm) CFH sample fulfilled all criteria of
this very strict test. The choice of background electrolyte,
wat e r r e s e a r c h 5 1 ( 2 0 1 4 ) 2 5 6e2 6 5264
whether ADW or NDW, affected the sorption, in particular for
Filtralite-P�.
Acknowledgement
The project was carried out in the frames of SupremeTech
project funded by The Danish Council for Strategic Research
(grant no. 09-067280). Special thanks to Bente Postvang for
laboratory assistance.
Appendix A. Supplementary data
Supplementary data related to this article can be found at
http://dx.doi.org/10.1016/j.watres.2013.10.061.
r e f e r e n c e s
Adam, K., Krogstad, T., Vrale, L., Søvik, A.K., Jenssen, P.D., 2007.Phosphorus retention in the filter materials shellsand andfiltralite P�dbatch and column experiment with synthetic Psolution and secondary wastewater. Ecol. Eng. 29 (2),200e208.
Agyei, N.M., Strydom, C.A., Potgieter, J.H., 2002. The removal ofphosphate ions from aqueous solution by fly ash, slag,ordinary Portland cement and related blends. CementConcrete Res. 32 (12), 1889e1897.
Allison, L.E., Moodie, C.D., 1965. Carbonate. In: Black, C.A.,Evans, D.D., White, J.L., Ensminger, L.E., Clark, F.E. (Eds.),Methods of Soil Analysis: Part 2. Chemical and MicrobiologicalProperties. Soil Science Society of America, Madison,Wisconsin, pp. 1392e1395.
Andersen, H.E., Larsen, S.E., Kronvang, B., Hansen, K.M.,Laubel, A., Windolf, J., Muus, K., 2006. Fosfat i drænvand. Vandog Jord 13 (4), 152e156 (in Danish).
Ballantine, D.J., Tanner, C.C., 2010. Substrate and filter materialsto enhance phosphorus removal in constructed wetlandstreating diffuse farm runoff: a review. N.Z. J. Agric. Res. 53 (1),71e95.
Borggaard, O.K., Raben-Lange, B., Gimsing, A.L., Strobel, B.W.,2005. Influence of humic substances on phosphateadsorption by aluminium and iron oxides. Geoderma 127(3e4), 270e279.
Brunauer, S., Emmett, P.H., Teller, E., 1938. Adsorption of gases inmultimolecular layers. J. Am. Chem. Soc. 60 (2), 309e319.
Buda, A.R., Koopmans, G.F., Bryant, R.B., Chardon, W.J., 2012.Emerging technologies for removing nonpoint phosphorusfrom surface water and groundwater: introduction. J. Environ.Qual. 41 (3), 621e627.
Chardon, W.J., Groenenberg, J.E., Temminghoff, E.J.M.,Koopmans, G.F., 2012. Use of reactive materials to bindphosphorus. J. Environ. Qual. 41 (3), 636e646.
Cucarella, V., Renman, G., 2009. Phosphorus sorption capacity offilter materials used for on-site wastewater treatmentdetermined in batch experiments e a comparative study. J.Environ. Qual. 38 (2), 381e392.
Delgado, A., Scalenghe, R., 2008. Aspects of phosphorustransfer from soils in Europe. J. Plant Nutr. Soil Sci. 171 (4),552e575.
Grant, R., Laubel, A., Kronvang, B., Andersen, H.E., Svendsen, L.M.,Fuglsang, A., 1996. Loss of dissolved and particulate
phosphorus from arable catchments by subsurface drainage.Water Res. 30 (11), 2633e2642.
Heal, K., Younger, P.L., Smith, K., Glendinning, S., Quinn, P.,Dobbie, K., 2003. Novel use of ochre from mine watertreatment plants to reduce point and diffuse phosphoruspollution. Land Contam. Reclam. 11 (2), 145e152.
Heal, K., Dobbie, K., Bozika, E., McHaffie, H., Simpson, A.,Smith, K., 2005. Enhancing phosphorus removal inconstructed wetlands with ochre from mine drainagetreatment. Water Sci. Technol. 51 (9), 275e282.
Heathwaite, L., Sharpley, A., Bechmann, M., 2003. The conceptualbasis for a decision support framework to assess the risk ofphosphorus loss at the field scale across Europe. J. Plant Nutr.Soil Sci. 166 (4), 447e458.
Hoffmann, C.C., Kjaergaard, C., Uusi-Kamppa, J., Hansen, H.C.B.,Kronvang, B., 2009. Phosphorus retention in Riparian buffers:review of their efficiency. J. Environ. Qual. 38 (5), 1942e1955.
Johansson Westholm, L., 2006. Substrates for phosphorusremovaldpotential benefits for on-site wastewatertreatment? Water Res. 40 (1), 23e36.
Johnes, P.J., 2007. Uncertainties in annual riverine phosphorusload estimation: impact of load estimation methodology,sampling frequency, baseflow index and catchmentpopulation density. J. Hydrol. 332 (1e2), 241e258.
Kaasik, A., Vohla, C., Motlep, R., Mander, U., Kirsimae, K., 2008.Hydrated calcareous oil-shale ash as potential filter media forphosphorus removal in constructed wetlands. Water Res. 42(4e5), 1315e1323.
Klimeski, A., Chardon, W.J., Turtola, E., Uusitalo, R., 2012.Potential and limitations of phosphate retention media inwater protection: a process-based review of laboratory andfield-scale tests. Agric. Food Sci. 21, 206e223.
Kroger, R., Holland, M.M., Moore, M.T., Cooper, C.M., 2008.Agricultural drainage ditches mitigate phosphorus loads as afunction of hydrological variability. J. Environ. Qual. 37,107e113.
Makris, K.C., Harris, W.G., O’Connor, G.A., Obreza, T.A., 2004.Phosphorus immobilization in micropores of drinking-watertreatment residuals: implications for long-term stability.Environ. Sci. Technol. 38 (24), 6590e6596.
Mehra, O.P., Jackson, M.L., 1960. Iron oxide removal from soilsand clays by dithionite-citrate system buffered withsodium bicarbonate. In: Proceedings of 7th NationalConference of Clay and Clay Minerals. Washington, 1958,pp. 317e327.
Mehta, N., Legg, J., Goring, C., Black, C., 1954. Determination oforganic phosphorus in soils: I. Extraction method. Soil Sci. Soc.Am. J. 18 (4), 443e449.
Murphy, J., Riley, J.P., 1962. A modified single solution method forthe determination of phosphate in natural waters. Anal. Chim.Acta 27 (0), 31e36.
Penn, C.J., Bryant, R.B., Kleinman, P.J.A., Allen, A.L., 2007.Removing dissolved phosphorus from drainage ditch waterwith phosphorus sorbing materials. J. Soil Water Conserv. 62(4), 269e276.
Penn, C.J., Bryant, R.B., Callahan, M.P., McGrath, J.M., 2011. Use ofindustrial by-products to sorb and retain phosphorus.Commun. Soil Sci. Plant Anal. 42 (6), 633e644.
Penn, C.J., McGrath, J.M., 2011. Predicting phosphorus sorptiononto steel slag using a flow-through approach withapplication to a pilot scale system. J. Water Res. Prot. 3,235e244.
Reinhardt, M., Gachter, R., Wehrli, B., Muler, B., 2005. Phosphorusretention in small constructed wetlands treating agriculturaldrainage water. J. Environ. Qual. 34 (4), 1251e1259.
Ruzicka, J., Hansen, E.H., 1988. Homogeneous and heterogeneoussystems: flow injection analysis today and tomorrow. Anal.Chim. Acta 214 (0), 1e27.

wat e r r e s e a r c h 5 1 ( 2 0 1 4 ) 2 5 6e2 6 5 265
Schwertmann,U., 1964.Differenzierungder EisenoxidedesBodensdurch Extraction mit Ammoniumoxalat-Losung. Zietschr.Pflanzenernahr. Dung. Bodenkun. 105, 194e202 (in German).
Smil, V., 2000. Phosphorus in the environment: natural flows andhuman interferences. Annu. Rev. Energy Environ. 25 (1), 53e88.
Sø, H.U., Postma, D., Jakobsen, R., Larsen, F., 2011. Sorption ofphosphate onto calcite; results from batch experiments andsurface complexation modeling. Geochim. Cosmochim. Acta75 (10), 2911e2923.
Søndergaard, M., Jeppesen, E., Jensen, J.P., Amsinck, S.L., 2005.Water framework directive: ecological classification of Danishlakes. J. Appl. Ecol. 42 (4), 616e629.
Strauss, R., Brummer, G.W., Barrow, N.J., 1997. Effects ofcrystallinity of goethite: II. Rates of sorption and desorption ofphosphate. Eur. J. Soil Sci. 48 (1), 101e114.
Ulen, B., Bechmann, M., Folster, J., Jarvie, H.P., Tunney, H.,2007. Agriculture as a phosphorus source foreutrophication in the north-west European countries,Norway, Sweden, United Kingdom and Ireland: a review.Soil Use Manag. 23, 5e15.
Vohla, C., Koiv, M., Bavor, H.J., Chazarenc, F., Mander, U.,2011. Filter materials for phosphorus removal fromwastewater in treatment wetlandsda review. Ecol. Eng. 37(1), 70e89.