Embed Size (px)
Citation preview
A Three-Year Perspective from the Poverty Tracker
FALL 2016 POVERTYTRACKER.ROBINHOOD.ORG
THE PERSISTENCE OF DISADVANTAGE IN NEW YORK CITY
M O N I T O R I N G P O V E R T Y A N D W E L L - B E I N G I N N Y C
FALL 2016 | POVERTY TRACKER 2
Christopher Wimer
Sophie Collyer
Irwin Garfinkel
Matthew Maury
Kathryn Neckerman
Julien Teitler
Jane Waldfogel
Fall 2016
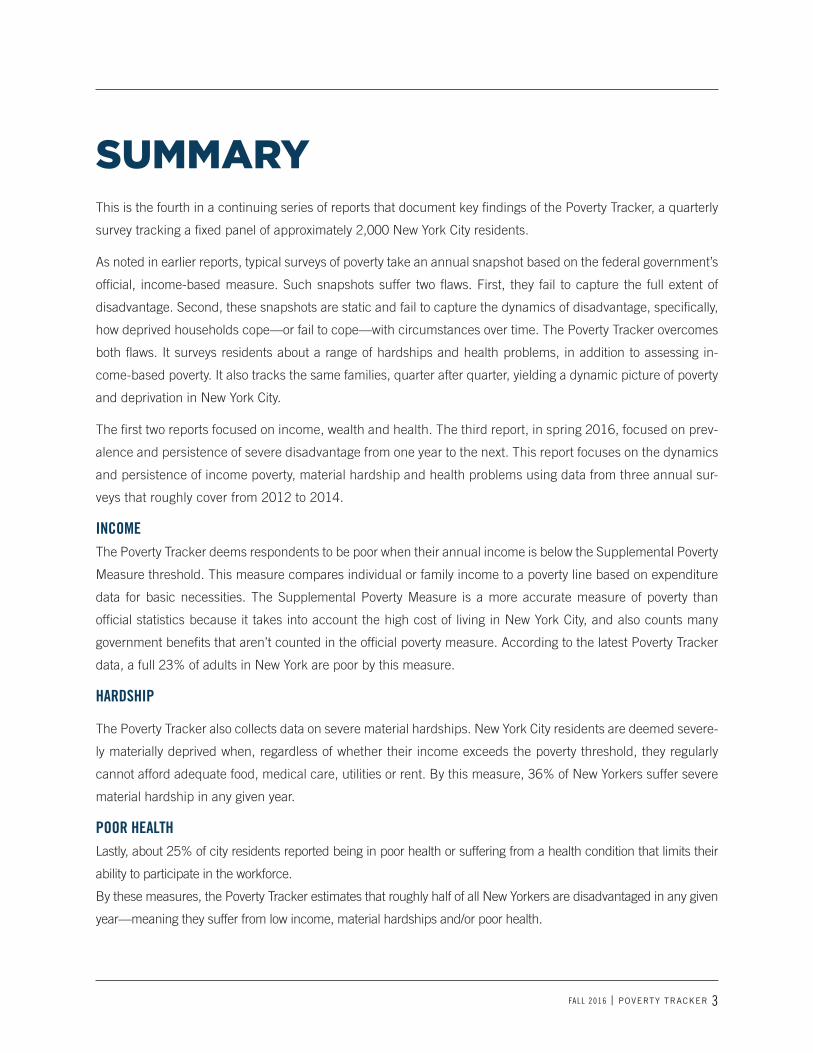
This is the fourth in a continuing series of reports that document key findings of the Poverty Tracker, a quarterly
survey tracking a fixed panel of approximately 2,000 New York City residents.
As noted in earlier reports, typical surveys of poverty take an annual snapshot based on the federal government’s
official, income-based measure. Such snapshots suffer two flaws. First, they fail to capture the full extent of
disadvantage. Second, these snapshots are static and fail to capture the dynamics of disadvantage, specifically,
how deprived households cope—or fail to cope—with circumstances over time. The Poverty Tracker overcomes
both flaws. It surveys residents about a range of hardships and health problems, in addition to assessing in-
come-based poverty. It also tracks the same families, quarter after quarter, yielding a dynamic picture of poverty
and deprivation in New York City.
The first two reports focused on income, wealth and health. The third report, in spring 2016, focused on prev-
alence and persistence of severe disadvantage from one year to the next. This report focuses on the dynamics
and persistence of income poverty, material hardship and health problems using data from three annual sur-
veys that roughly cover from 2012 to 2014.
INCOMEThe Poverty Tracker deems respondents to be poor when their annual income is below the Supplemental Poverty
Measure threshold. This measure compares individual or family income to a poverty line based on expenditure
data for basic necessities. The Supplemental Poverty Measure is a more accurate measure of poverty than
official statistics because it takes into account the high cost of living in New York City, and also counts many
government benefits that aren’t counted in the official poverty measure. According to the latest Poverty Tracker
data, a full 23% of adults in New York are poor by this measure.
HARDSHIP
The Poverty Tracker also collects data on severe material hardships. New York City residents are deemed severe-
ly materially deprived when, regardless of whether their income exceeds the poverty threshold, they regularly
cannot afford adequate food, medical care, utilities or rent. By this measure, 36% of New Yorkers suffer severe
material hardship in any given year.
POOR HEALTH
Lastly, about 25% of city residents reported being in poor health or suffering from a health condition that limits their
ability to participate in the workforce.
By these measures, the Poverty Tracker estimates that roughly half of all New Yorkers are disadvantaged in any given
year—meaning they suffer from low income, material hardships and/or poor health.
FALL 2016 | POVERTY TRACKER 3
SUMMARY
FALL 2016 | POVERTY TRACKER 4
PERSISTENCE
The Poverty Tracker also examines the persistence of disadvantage
across years. At any moment, the survey estimates that nearly a
quarter of New Yorkers live in poverty. Although households flow in
and out of poverty, about 10% of New Yorkers remain poor from one
year to the next. In contrast, approximately 36% suffer one or more
material hardships in any one year, while more than 20% continue
to suffer hardships from one year to another. Hardship appears to
be a far more persistent disadvantage than poverty—a finding that
has substantial implications for determining the best choice of in-
terventions.
This report revisits earlier conclusions about the persistence of dis-
advantage to determine whether they hold up, in view of analysis of
the third year of survey results. Indeed, they do. For example, the
most recent survey confirmed that 73% of New Yorkers suffered
from at least one disadvantage at some point during the three-year
survey period. A sobering 37% reported at least one disadvan-
tage—income poverty, severe material hardship or poor health—in
all three years of data collection. Below, the data is analyzed by sex,
race, immigration status, education and location (borough).
SHOCKSThis report also takes up a new investigation: shocks to family well-
being. Specifically, the Poverty Tracker collects data on five types
of shocks: financial, relationship dissolution, crime victimization
or loss of property, medical events, or encounters with law en-
forcement (police stops or arrests). There appears to be a strong
correlation between frequency of shocks and persistence of hard-
ships. For example, 86% of those suffering from persistent hard-
ship (hardship throughout the three years of the survey period) also
suffered multiple financial shocks. In contrast, only 39% of those
reporting no hardship over the three years suffered multiple finan-
cial shocks. This high correlation raises two important questions
about causation: Do shocks cause hardships? Do hardships cause
shocks? This report concludes with some preliminary observations
about cause and effect as a prelude to further investigation in the
coming years.
HIGHLIGHTS
Nearly half (47%) of New Yorkers experi-
enced at least one spell of poverty during
the three-year study period. About one in
20 (5%) experienced persistent poverty
during the entire three-year period.
More than seven in 10 (73%) New York-
ers suffered from at least one disadvan-
tage—income poverty, severe material
hardship or poor health—at some point
during the three-year period of the study.
Nearly four in 10 (37%) reported at
least one disadvantage throughout the
entire period.
Nearly half of all New Yorkers are severely
disadvantaged, which is defined as having
income lower than what is needed for basic
necessities and/or having poor health that
limits participation in the workforce.
More than half (54%) experienced a hard-
ship during at least one year of the study
and nearly one in five (18%) reported a
hardship during all three years.
The study found strong correlation be-
tween shocks—financial, relationship,
crime, accident/illness and arrest—and
persistence of hardships.
More than eight in 10 (86%) New York-
ers suffering from persistent hardship
throughout the three-year period suffered
multiple financial shocks. By contrast,
about four in ten (39%) of those report-
ing no hardship also suffered multiple
financial shocks.
FALL 2016 | POVERTY TRACKER 5
The Poverty Tracker captures a multi-faceted and dynamic picture of disadvantage by consider-
ing three distinct—and at times interrelated—types of disadvantage and then tracking how they
change over time.
INCOME POVERTY: Annual resources (post-tax cash income plus in-kind benefits minus necessary
expenditures for medical care and work expenses) that fall below a poverty line specific to New York
City. Based on the Supplemental Poverty Measure, this benchmark is a better measure of poverty
than official statistics, which rely only on measures of pre-tax cash income alone, because it takes
into account the high cost of living in New York City as well as the full range of government benefits.
MATERIAL HARDSHIP: Chronic or acute inability to make ends meet; for example, running out of food
or having utilities shut off for failure to pay bills.
POOR HEALTH: Self-reported poor health or a condition that limits the kind or amount of work one
can do.
The previous report documented the prevalence and persistence of income poverty, material hard-
ship and poor health based on two annual surveys. This report focuses on the dynamics and per-
sistence of income poverty, material hardship and poor health using data from three annual surveys
that roughly cover from 2012 to 2014.
PERSISTENCE OF POVERTY, HARDSHIP AND POOR HEALTH IN NEW YORK CITYAlthough annual snapshots suggest that a minority of New Yorkers experience individual disad-
vantages at a single point in time, the Poverty Tracker reveals that a surprisingly high number
of New Yorkers experienced poverty or other disadvantages during the three-year survey period.
Poverty Tracker data identified New Yorkers who experienced none of these disadvantages, ex-
perienced one or more intermittent disadvantages during one or two years and those who were
persistently disadvantaged during all three years.
In our last report, which analyzed two years of survey data, we defined persistent disadvantage as
a disadvantage that was experienced throughout the full two-year study period. Because this report
presents an analysis of three years of survey data, it refers to the group experiencing one or two
years of disadvantage as having experienced intermittent disadvantage and to those experiencing
three years of disadvantage as having experienced persistent disadvantage.
Figure 1 shows the persistence and experience of income poverty, material hardship and poor
health over time. In total, nearly half (47%) of New Yorkers experienced at least one spell of pov-
INTRODUCTION
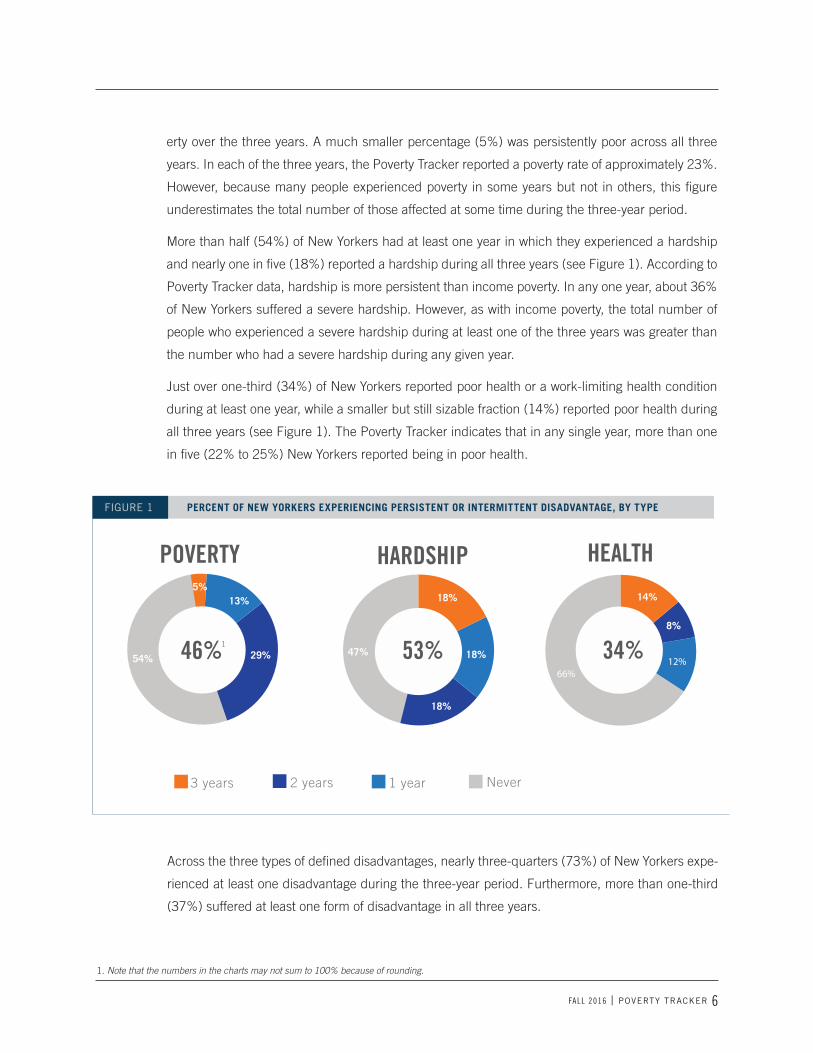
erty over the three years. A much smaller percentage (5%) was persistently poor across all three
years. In each of the three years, the Poverty Tracker reported a poverty rate of approximately 23%.
However, because many people experienced poverty in some years but not in others, this figure
underestimates the total number of those affected at some time during the three-year period.
More than half (54%) of New Yorkers had at least one year in which they experienced a hardship
and nearly one in five (18%) reported a hardship during all three years (see Figure 1). According to
Poverty Tracker data, hardship is more persistent than income poverty. In any one year, about 36%
of New Yorkers suffered a severe hardship. However, as with income poverty, the total number of
people who experienced a severe hardship during at least one of the three years was greater than
the number who had a severe hardship during any given year.
Just over one-third (34%) of New Yorkers reported poor health or a work-limiting health condition
during at least one year, while a smaller but still sizable fraction (14%) reported poor health during
all three years (see Figure 1). The Poverty Tracker indicates that in any single year, more than one
in five (22% to 25%) New Yorkers reported being in poor health.
Across the three types of defined disadvantages, nearly three-quarters (73%) of New Yorkers expe-
rienced at least one disadvantage during the three-year period. Furthermore, more than one-third
(37%) suffered at least one form of disadvantage in all three years.
POVERTY
29%54%47%
5%13%
53%46%
HARDSHIP HEALTH
18%
18%
18% 34%
14%
66%
8%
12%
1
PERCENT OF NEW YORKERS EXPERIENCING PERSISTENT OR INTERMITTENT DISADVANTAGE, BY TYPEFIGURE 1
3 years 2 years 1 year Never
1. Note that the numbers in the charts may not sum to 100% because of rounding.
FALL 2016 | POVERTY TRACKER 6
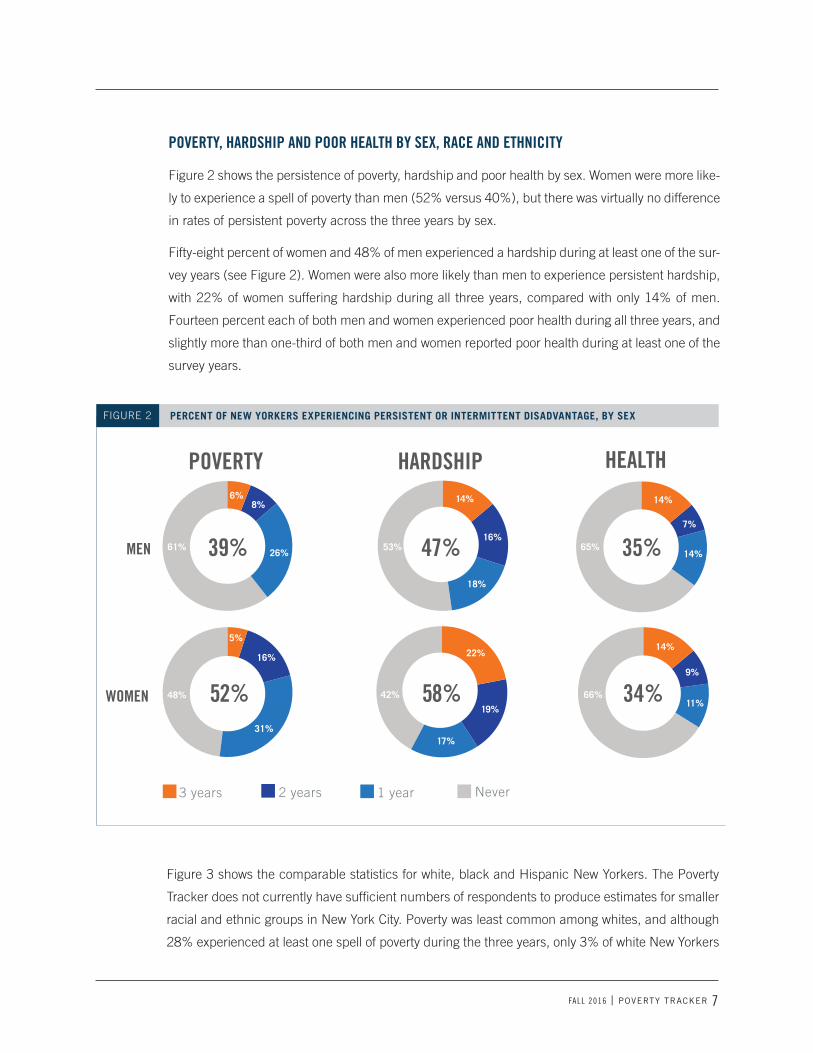
POVERTY, HARDSHIP AND POOR HEALTH BY SEX, RACE AND ETHNICITY
Figure 2 shows the persistence of poverty, hardship and poor health by sex. Women were more like-
ly to experience a spell of poverty than men (52% versus 40%), but there was virtually no difference
in rates of persistent poverty across the three years by sex.
Fifty-eight percent of women and 48% of men experienced a hardship during at least one of the sur-
vey years (see Figure 2). Women were also more likely than men to experience persistent hardship,
with 22% of women suffering hardship during all three years, compared with only 14% of men.
Fourteen percent each of both men and women experienced poor health during all three years, and
slightly more than one-third of both men and women reported poor health during at least one of the
survey years.
Figure 3 shows the comparable statistics for white, black and Hispanic New Yorkers. The Poverty
Tracker does not currently have sufficient numbers of respondents to produce estimates for smaller
racial and ethnic groups in New York City. Poverty was least common among whites, and although
28% experienced at least one spell of poverty during the three years, only 3% of white New Yorkers
POVERTY HARDSHIP HEALTH
26%61% 53%
48%
6%
5%
16%
31%
8%14%
19%
17%
22%
16%
18%
14%
14%
7%
9%
14%
11%42% 66%WOMEN
MEN 65%39%
52% 58%
47% 35%
34%
PERCENT OF NEW YORKERS EXPERIENCING PERSISTENT OR INTERMITTENT DISADVANTAGE, BY SEXFIGURE 2
3 years 2 years 1 year Never
FALL 2016 | POVERTY TRACKER 7
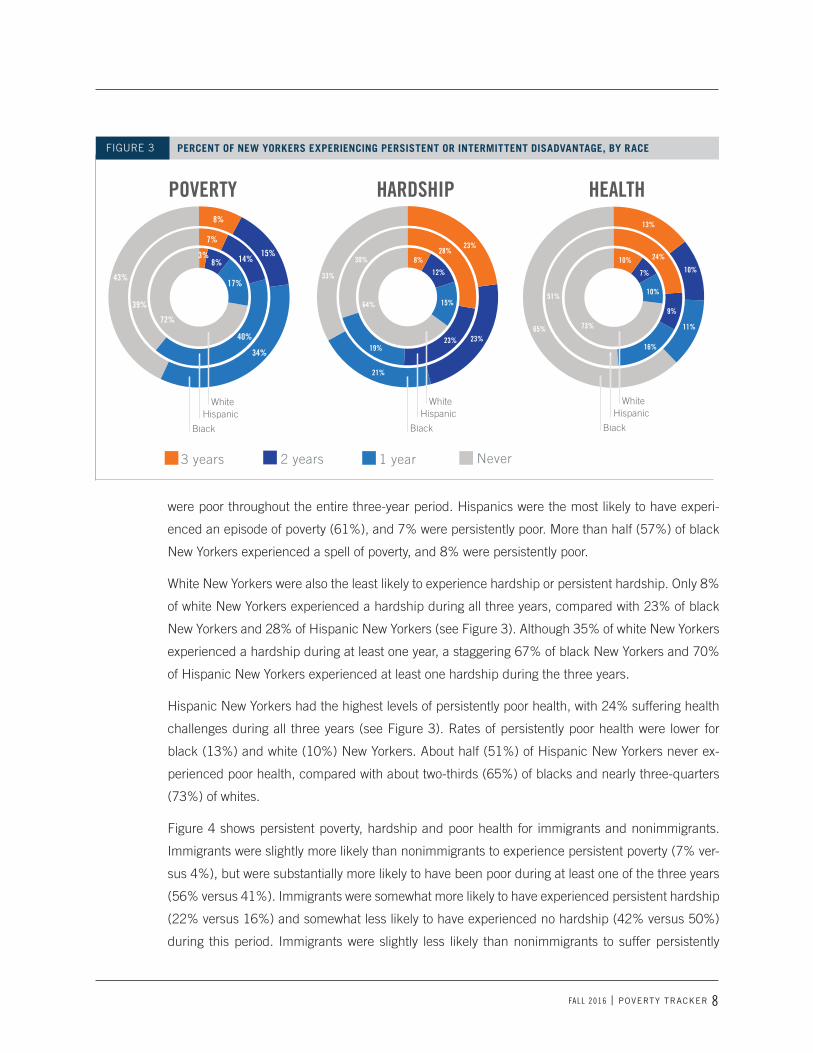
were poor throughout the entire three-year period. Hispanics were the most likely to have experi-
enced an episode of poverty (61%), and 7% were persistently poor. More than half (57%) of black
New Yorkers experienced a spell of poverty, and 8% were persistently poor.
White New Yorkers were also the least likely to experience hardship or persistent hardship. Only 8%
of white New Yorkers experienced a hardship during all three years, compared with 23% of black
New Yorkers and 28% of Hispanic New Yorkers (see Figure 3). Although 35% of white New Yorkers
experienced a hardship during at least one year, a staggering 67% of black New Yorkers and 70%
of Hispanic New Yorkers experienced at least one hardship during the three years.
Hispanic New Yorkers had the highest levels of persistently poor health, with 24% suffering health
challenges during all three years (see Figure 3). Rates of persistently poor health were lower for
black (13%) and white (10%) New Yorkers. About half (51%) of Hispanic New Yorkers never ex-
perienced poor health, compared with about two-thirds (65%) of blacks and nearly three-quarters
(73%) of whites.
Figure 4 shows persistent poverty, hardship and poor health for immigrants and nonimmigrants.
Immigrants were slightly more likely than nonimmigrants to experience persistent poverty (7% ver-
sus 4%), but were substantially more likely to have been poor during at least one of the three years
(56% versus 41%). Immigrants were somewhat more likely to have experienced persistent hardship
(22% versus 16%) and somewhat less likely to have experienced no hardship (42% versus 50%)
during this period. Immigrants were slightly less likely than nonimmigrants to suffer persistently
FALL 2016 | POVERTY TRACKER 8
POVERTY HARDSHIP HEALTH
34%
8%
Black
White
3%
8%
7%
34%
43%
15%14%
40%
8%
17%
72%
39% 34%
8%8%28%
8%
23%
33%
30%
21%
23%
15%
23%19%
64% 15%
12%
34%
8%7%
10%
73%
10%
24%
11%
13%
15%
9%
16%
10%
51%
65%
Hispanic
Black
WhiteHispanic
Black
WhiteHispanic
PERCENT OF NEW YORKERS EXPERIENCING PERSISTENT OR INTERMITTENT DISADVANTAGE, BY RACE
3 years 2 years 1 year Never
FIGURE 3
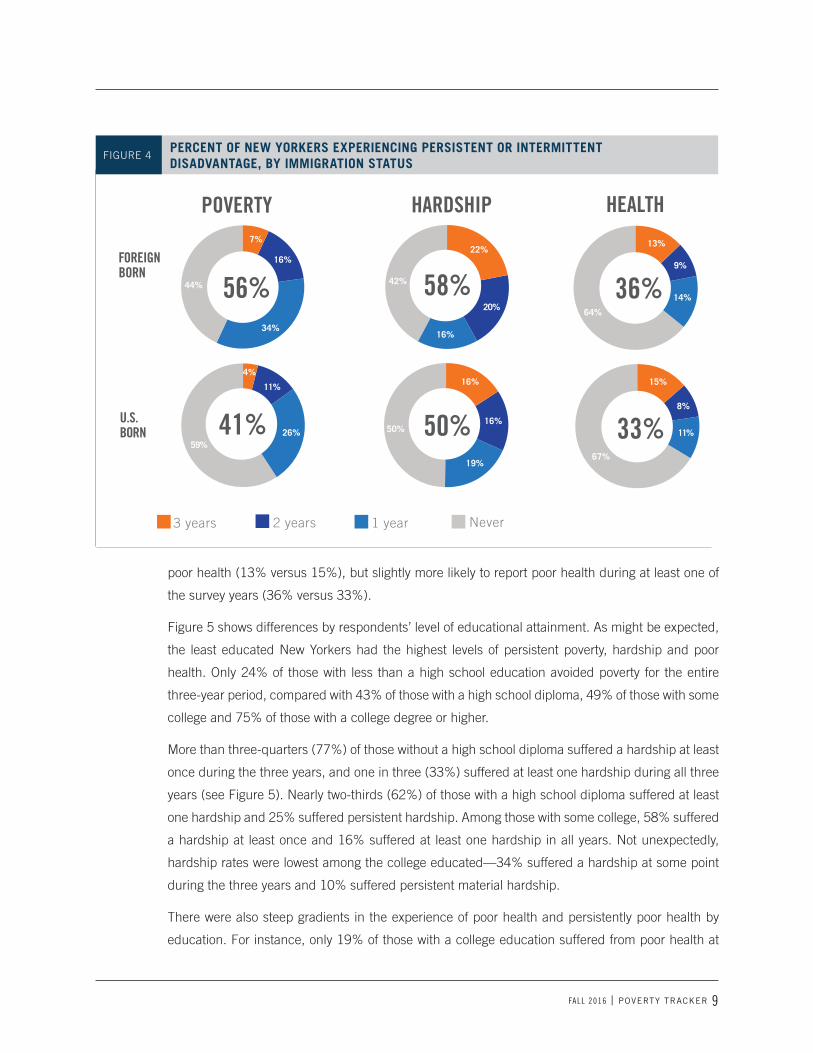
poor health (13% versus 15%), but slightly more likely to report poor health during at least one of
the survey years (36% versus 33%).
Figure 5 shows differences by respondents’ level of educational attainment. As might be expected,
the least educated New Yorkers had the highest levels of persistent poverty, hardship and poor
health. Only 24% of those with less than a high school education avoided poverty for the entire
three-year period, compared with 43% of those with a high school diploma, 49% of those with some
college and 75% of those with a college degree or higher.
More than three-quarters (77%) of those without a high school diploma suffered a hardship at least
once during the three years, and one in three (33%) suffered at least one hardship during all three
years (see Figure 5). Nearly two-thirds (62%) of those with a high school diploma suffered at least
one hardship and 25% suffered persistent hardship. Among those with some college, 58% suffered
a hardship at least once and 16% suffered at least one hardship in all years. Not unexpectedly,
hardship rates were lowest among the college educated—34% suffered a hardship at some point
during the three years and 10% suffered persistent material hardship.
There were also steep gradients in the experience of poor health and persistently poor health by
education. For instance, only 19% of those with a college education suffered from poor health at
FIGURE 4PERCENT OF NEW YORKERS EXPERIENCING PERSISTENT OR INTERMITTENT DISADVANTAGE, BY IMMIGRATION STATUS
3 years 2 years 1 year Never
FOREIGNBORN
U.S.BORN
0.0
0.2
0.4
0.6
0.8
1.0
56% 58%34%
44%
16%22%
42%
16%
50%16%
19%
20%
16%
41%
4%
11%
59%26%
13%
64%
15%
67%
9%
8%
14%
11%50%
36%
33%
POVERTY HARDSHIP HEALTH7%
FALL 2016 | POVERTY TRACKER 9
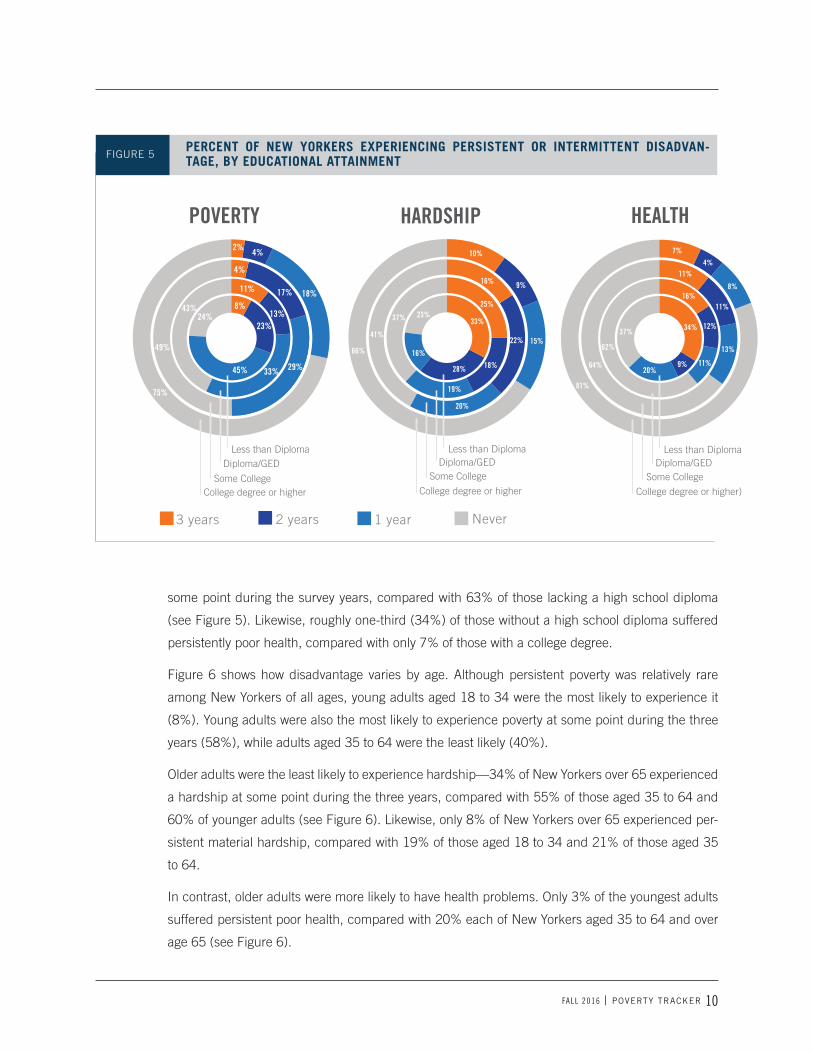
some point during the survey years, compared with 63% of those lacking a high school diploma
(see Figure 5). Likewise, roughly one-third (34%) of those without a high school diploma suffered
persistently poor health, compared with only 7% of those with a college degree.
Figure 6 shows how disadvantage varies by age. Although persistent poverty was relatively rare
among New Yorkers of all ages, young adults aged 18 to 34 were the most likely to experience it
(8%). Young adults were also the most likely to experience poverty at some point during the three
years (58%), while adults aged 35 to 64 were the least likely (40%).
Older adults were the least likely to experience hardship—34% of New Yorkers over 65 experienced
a hardship at some point during the three years, compared with 55% of those aged 35 to 64 and
60% of younger adults (see Figure 6). Likewise, only 8% of New Yorkers over 65 experienced per-
sistent material hardship, compared with 19% of those aged 18 to 34 and 21% of those aged 35
to 64.
In contrast, older adults were more likely to have health problems. Only 3% of the youngest adults
suffered persistent poor health, compared with 20% each of New Yorkers aged 35 to 64 and over
age 65 (see Figure 6).
FIGURE 5
PERCENT OF NEW YORKERS EXPERIENCING PERSISTENT OR INTERMITTENT DISADVAN-TAGE, BY EDUCATIONAL ATTAINMENT
3 years 2 years 1 year Never
POVERTY HARDSHIP HEALTH
34%
8%
Less than DiplomaDiploma/GED
Some CollegeCollege degree or higher
8%
11%
43%
49%
75%
4%
2% 4%
18%17%
29%
13%
33%
23%
45%
24%
34%
8%
Less than DiplomaDiploma/GED
Some College
College degree or higher
33%
25%
16%
10%
9%
15%22%
20%
18%
19%
28%
16%
23%37%
41%
66%34%
8%
Less than Diploma
Some College
College degree or higher)
34%
16%
11%
7%
4%
8%
11%
13%
12%
11%9%20%
37%
62%
64%
81%
Diploma/GED
FALL 2016 | POVERTY TRACKER 10
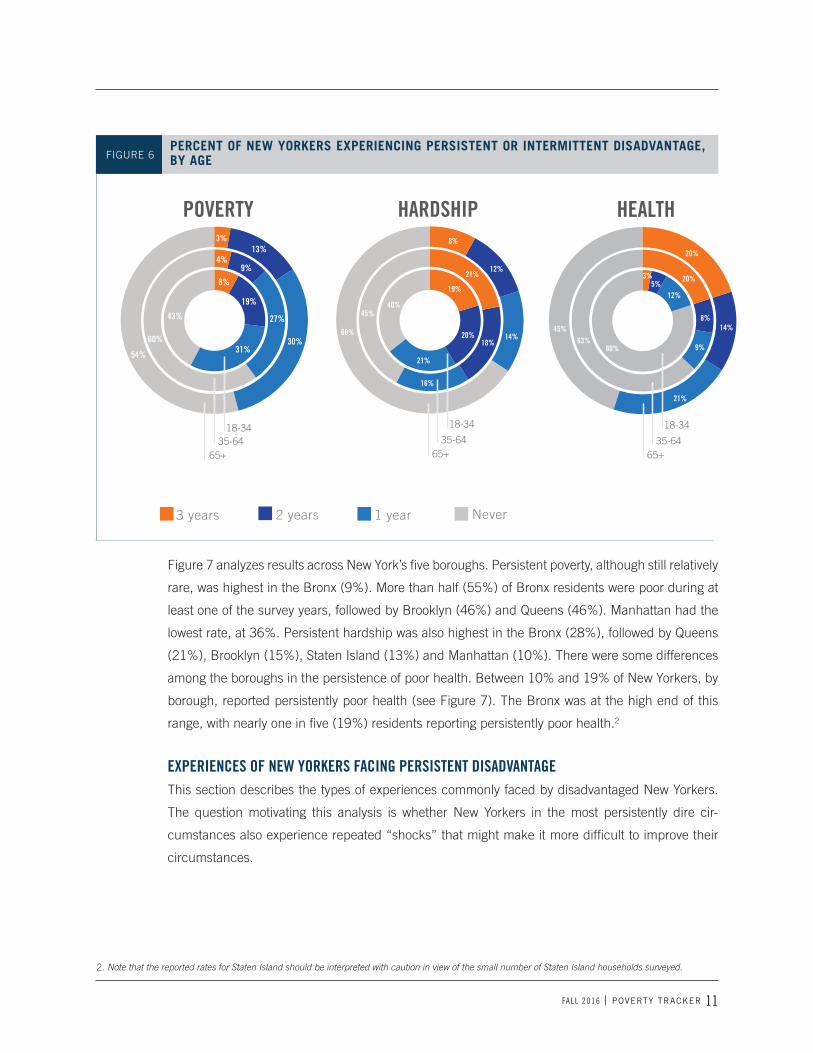
Figure 7 analyzes results across New York’s five boroughs. Persistent poverty, although still relatively
rare, was highest in the Bronx (9%). More than half (55%) of Bronx residents were poor during at
least one of the survey years, followed by Brooklyn (46%) and Queens (46%). Manhattan had the
lowest rate, at 36%. Persistent hardship was also highest in the Bronx (28%), followed by Queens
(21%), Brooklyn (15%), Staten Island (13%) and Manhattan (10%). There were some differences
among the boroughs in the persistence of poor health. Between 10% and 19% of New Yorkers, by
borough, reported persistently poor health (see Figure 7). The Bronx was at the high end of this
range, with nearly one in five (19%) residents reporting persistently poor health.2
EXPERIENCES OF NEW YORKERS FACING PERSISTENT DISADVANTAGEThis section describes the types of experiences commonly faced by disadvantaged New Yorkers.
The question motivating this analysis is whether New Yorkers in the most persistently dire cir-
cumstances also experience repeated “shocks” that might make it more difficult to improve their
circumstances.
PERCENT OF NEW YORKERS EXPERIENCING PERSISTENT OR INTERMITTENT DISADVANTAGE, BY AGEFIGURE 6
2. Note that the reported rates for Staten Island should be interpreted with caution in view of the small number of Staten Island households surveyed.
3 years 2 years 1 year Never
POVERTY HARDSHIP HEALTH
34%
8%
18-34
65+
8%
3%
54%
60%
43%
4%
30%
13%
9%
27%
19%
31%
34%
8%19%
21%
8%
12%
14%
8%15%
18%
16%
40%45%
66%
21%
20%34%
8%5%12%
14%
20%
21%
20%
15%
8%
9%
3%
80%63%
45%
35-64
18-34
65+35-64
18-34
65+35-64
FALL 2016 | POVERTY TRACKER 11
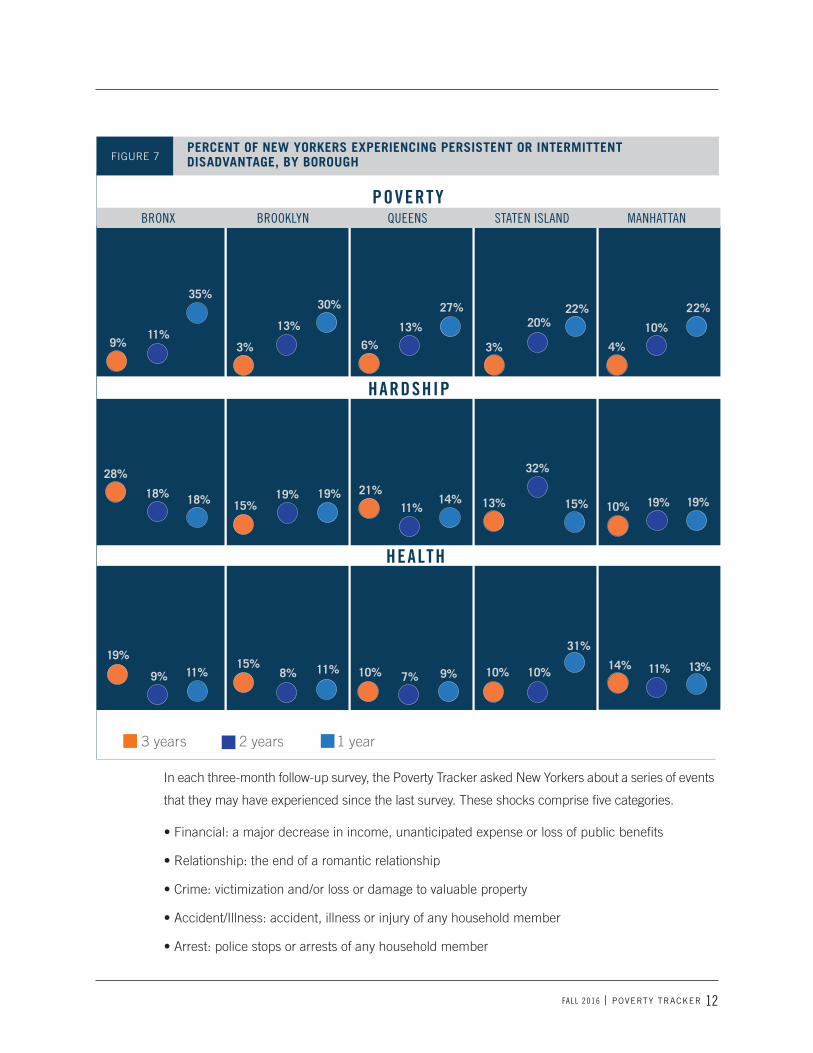
PERCENT OF NEW YORKERS EXPERIENCING PERSISTENT OR INTERMITTENT DISADVANTAGE, BY BOROUGHFIGURE 7
POVERTY
HARDSHIP
HEALTH
9%
28%
19%
3% 3%6% 4%11%
18%
9%
13% 20%13% 10%
35%
18% 15%21%
11% 13%
32%
15% 10% 19% 19%14%19%19%
11% 8% 7%11% 9%
15%10%
30% 22% 22%27%
BRONX BROOKLYN QUEENS STATEN ISLAND MANHATTAN
3 year 2 years 1 years
In each three-month follow-up survey, the Poverty Tracker asked New Yorkers about a series of events
that they may have experienced since the last survey. These shocks comprise five categories.
• Financial: a major decrease in income, unanticipated expense or loss of public benefits
• Relationship: the end of a romantic relationship
• Crime: victimization and/or loss or damage to valuable property
• Accident/Illness: accident, illness or injury of any household member
• Arrest: police stops or arrests of any household member
10% 14% 11% 13%10%
31%
FALL 2016 | POVERTY TRACKER 12
8%
25%
16%
13%
23%
15%8%
62%
19%
15%
9%
8%
RELATIONSHIP
34%
8%
62%
18%
68%23% 62%
51%45%
FINANCIAL 18% 62%CRIME
8% 9%
12%
18%
14%
ARREST
8%20%
16%
30%23%
ACCIDENT/ILLNESS
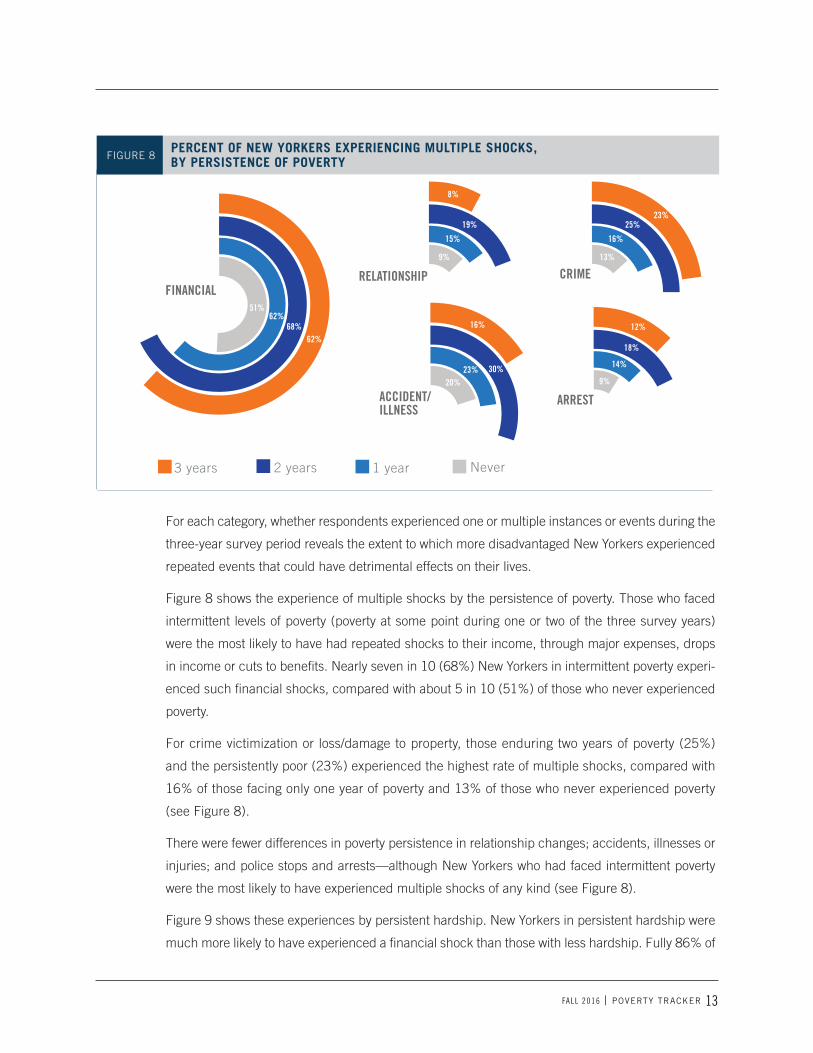
PERCENT OF NEW YORKERS EXPERIENCING MULTIPLE SHOCKS, BY PERSISTENCE OF POVERTYFIGURE 8
For each category, whether respondents experienced one or multiple instances or events during the
three-year survey period reveals the extent to which more disadvantaged New Yorkers experienced
repeated events that could have detrimental effects on their lives.
Figure 8 shows the experience of multiple shocks by the persistence of poverty. Those who faced
intermittent levels of poverty (poverty at some point during one or two of the three survey years)
were the most likely to have had repeated shocks to their income, through major expenses, drops
in income or cuts to benefits. Nearly seven in 10 (68%) New Yorkers in intermittent poverty experi-
enced such financial shocks, compared with about 5 in 10 (51%) of those who never experienced
poverty.
For crime victimization or loss/damage to property, those enduring two years of poverty (25%)
and the persistently poor (23%) experienced the highest rate of multiple shocks, compared with
16% of those facing only one year of poverty and 13% of those who never experienced poverty
(see Figure 8).
There were fewer differences in poverty persistence in relationship changes; accidents, illnesses or
injuries; and police stops and arrests—although New Yorkers who had faced intermittent poverty
were the most likely to have experienced multiple shocks of any kind (see Figure 8).
Figure 9 shows these experiences by persistent hardship. New Yorkers in persistent hardship were
much more likely to have experienced a financial shock than those with less hardship. Fully 86% of
3 years 2 years 1 year Never
FALL 2016 | POVERTY TRACKER 13
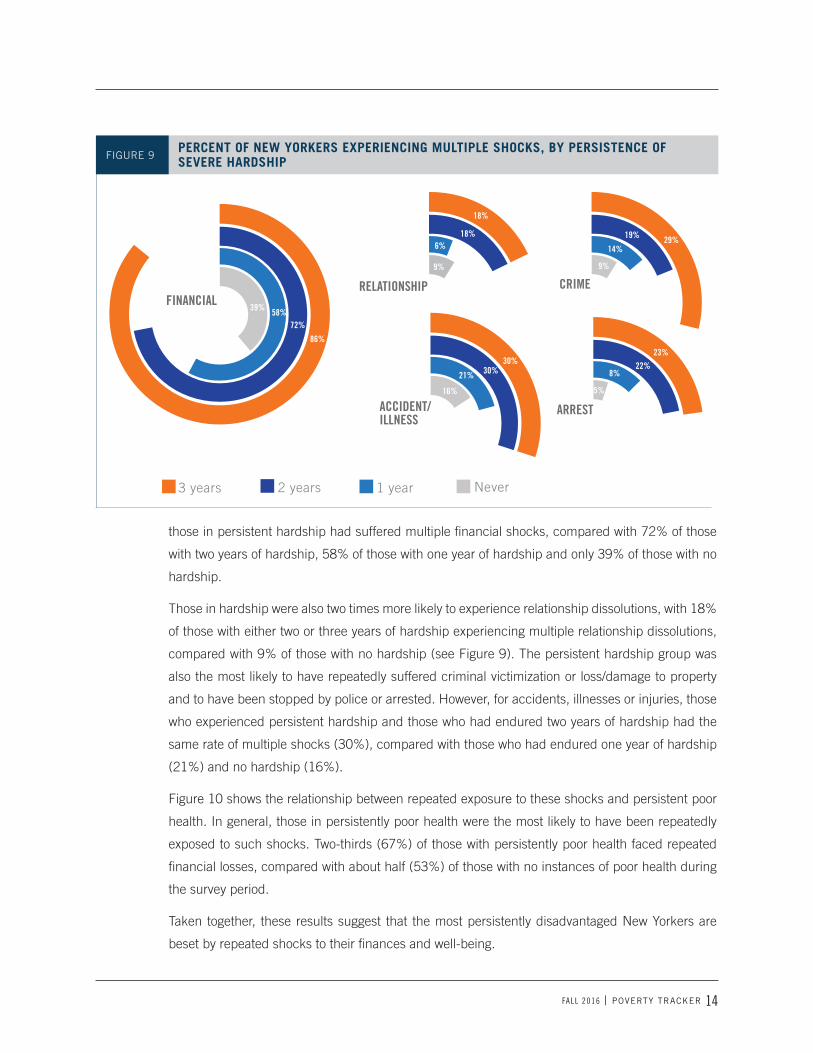
those in persistent hardship had suffered multiple financial shocks, compared with 72% of those
with two years of hardship, 58% of those with one year of hardship and only 39% of those with no
hardship.
Those in hardship were also two times more likely to experience relationship dissolutions, with 18%
of those with either two or three years of hardship experiencing multiple relationship dissolutions,
compared with 9% of those with no hardship (see Figure 9). The persistent hardship group was
also the most likely to have repeatedly suffered criminal victimization or loss/damage to property
and to have been stopped by police or arrested. However, for accidents, illnesses or injuries, those
who experienced persistent hardship and those who had endured two years of hardship had the
same rate of multiple shocks (30%), compared with those who had endured one year of hardship
(21%) and no hardship (16%).
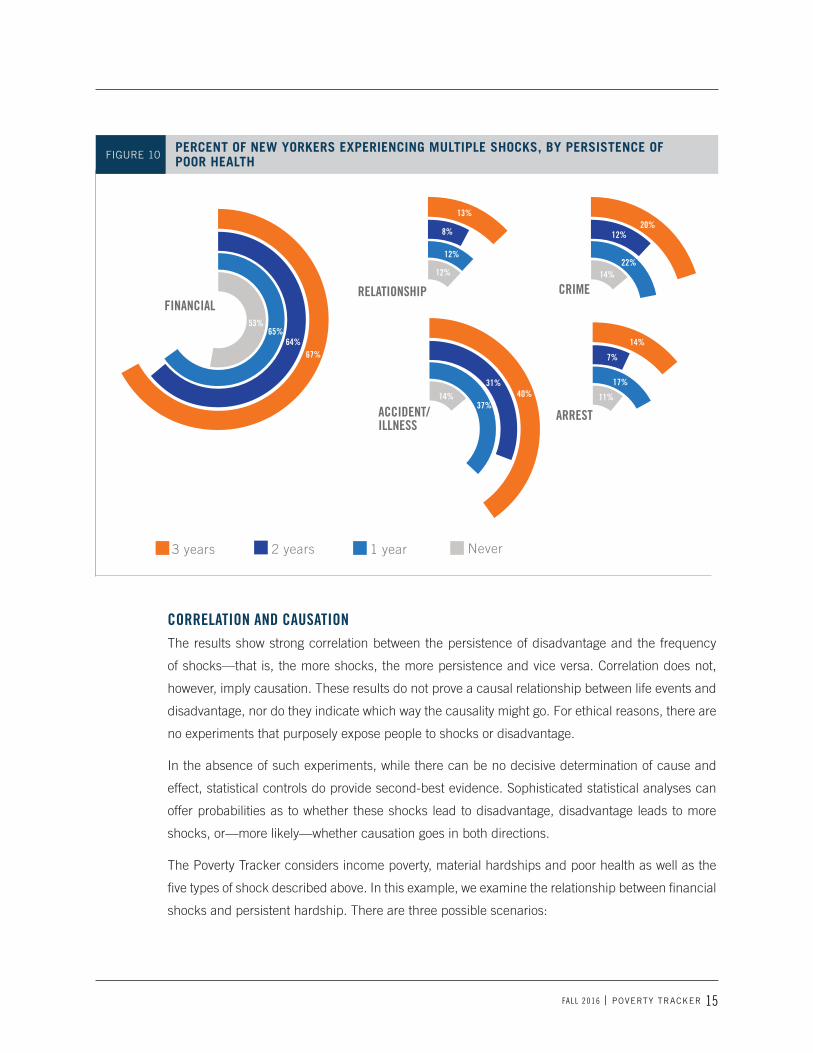
Figure 10 shows the relationship between repeated exposure to these shocks and persistent poor
health. In general, those in persistently poor health were the most likely to have been repeatedly
exposed to such shocks. Two-thirds (67%) of those with persistently poor health faced repeated
financial losses, compared with about half (53%) of those with no instances of poor health during
the survey period.
Taken together, these results suggest that the most persistently disadvantaged New Yorkers are
beset by repeated shocks to their finances and well-being.
8%
19%
14%
9%
29%
8%
62%
18%6%
9%
18%
RELATIONSHIP
34%
8%
86%
72%58%39%
45%
FINANCIAL 18% 62%CRIME
8% 5%
23%22%
8%
ARREST
8%16%
30%30%21%
ACCIDENT/ILLNESS
PERCENT OF NEW YORKERS EXPERIENCING MULTIPLE SHOCKS, BY PERSISTENCE OF SEVERE HARDSHIPFIGURE 9
3 years 2 years 1 year Never
FALL 2016 | POVERTY TRACKER 14
CORRELATION AND CAUSATION The results show strong correlation between the persistence of disadvantage and the frequency
of shocks—that is, the more shocks, the more persistence and vice versa. Correlation does not,
however, imply causation. These results do not prove a causal relationship between life events and
disadvantage, nor do they indicate which way the causality might go. For ethical reasons, there are
no experiments that purposely expose people to shocks or disadvantage.
In the absence of such experiments, while there can be no decisive determination of cause and
effect, statistical controls do provide second-best evidence. Sophisticated statistical analyses can
offer probabilities as to whether these shocks lead to disadvantage, disadvantage leads to more
shocks, or—more likely—whether causation goes in both directions.
The Poverty Tracker considers income poverty, material hardships and poor health as well as the
five types of shock described above. In this example, we examine the relationship between financial
shocks and persistent hardship. There are three possible scenarios:
8%
12%
22%14%
20%
15%8%
62%
8%
12%
12%
13%
RELATIONSHIP
34%
8%
67%64%
65%53%
FINANCIALCRIME
8% 11%
14%
7%
17%
ARREST
8%14% 40%
31%
37%ACCIDENT/ILLNESS
PERCENT OF NEW YORKERS EXPERIENCING MULTIPLE SHOCKS, BY PERSISTENCE OF POOR HEALTHFIGURE 10
3 years 2 years 1 year Never
FALL 2016 | POVERTY TRACKER 15
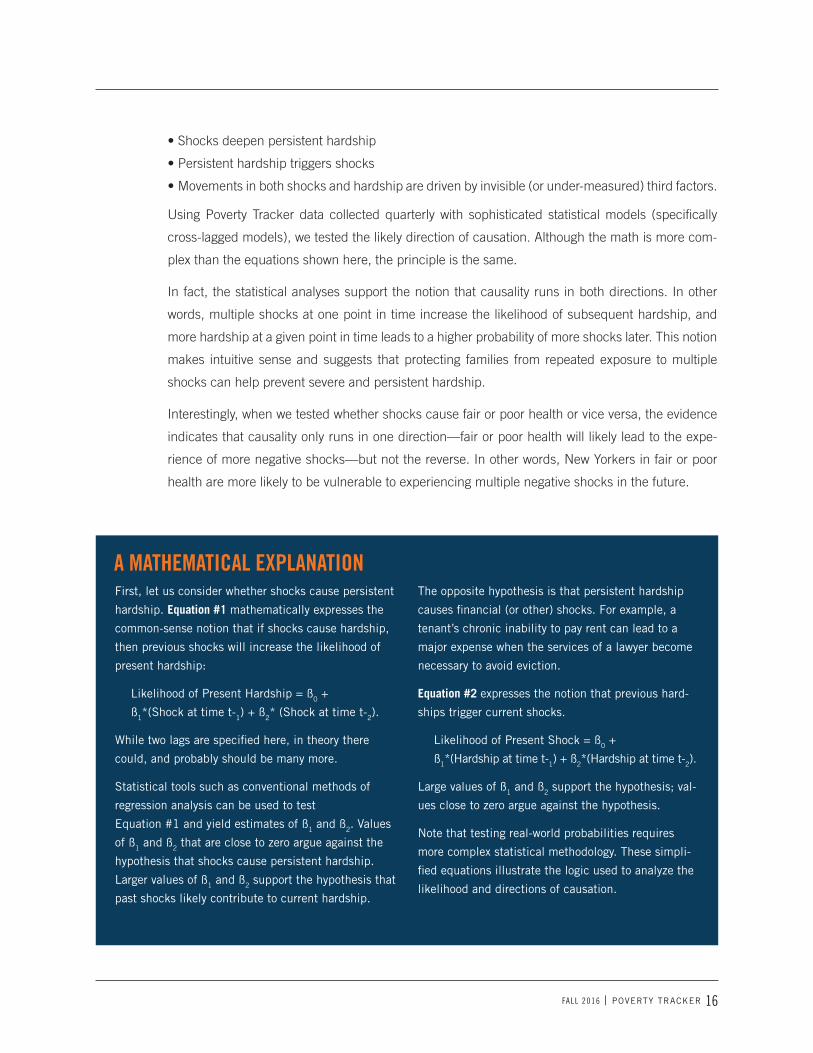
• Shocks deepen persistent hardship
• Persistent hardship triggers shocks
• Movements in both shocks and hardship are driven by invisible (or under-measured) third factors.
Using Poverty Tracker data collected quarterly with sophisticated statistical models (specifically
cross-lagged models), we tested the likely direction of causation. Although the math is more com-
plex than the equations shown here, the principle is the same.
In fact, the statistical analyses support the notion that causality runs in both directions. In other
words, multiple shocks at one point in time increase the likelihood of subsequent hardship, and
more hardship at a given point in time leads to a higher probability of more shocks later. This notion
makes intuitive sense and suggests that protecting families from repeated exposure to multiple
shocks can help prevent severe and persistent hardship.
Interestingly, when we tested whether shocks cause fair or poor health or vice versa, the evidence
indicates that causality only runs in one direction—fair or poor health will likely lead to the expe-
rience of more negative shocks—but not the reverse. In other words, New Yorkers in fair or poor
health are more likely to be vulnerable to experiencing multiple negative shocks in the future.
First, let us consider whether shocks cause persistent
hardship. Equation #1 mathematically expresses the
common-sense notion that if shocks cause hardship,
then previous shocks will increase the likelihood of
present hardship:
Likelihood of Present Hardship = ß0 +
ß1*(Shock at time t-1) + ß2* (Shock at time t-2).
While two lags are specified here, in theory there
could, and probably should be many more.
Statistical tools such as conventional methods of
regression analysis can be used to test
Equation #1 and yield estimates of ß1 and ß2. Values
of ß1 and ß2 that are close to zero argue against the
hypothesis that shocks cause persistent hardship.
Larger values of ß1 and ß2 support the hypothesis that
past shocks likely contribute to current hardship.
The opposite hypothesis is that persistent hardship
causes financial (or other) shocks. For example, a
tenant’s chronic inability to pay rent can lead to a
major expense when the services of a lawyer become
necessary to avoid eviction.
Equation #2 expresses the notion that previous hard-
ships trigger current shocks.
Likelihood of Present Shock = ß0 +
ß1*(Hardship at time t-1) + ß2*(Hardship at time t-2).
Large values of ß1 and ß2 support the hypothesis; val-
ues close to zero argue against the hypothesis.
Note that testing real-world probabilities requires
more complex statistical methodology. These simpli-
fied equations illustrate the logic used to analyze the
likelihood and directions of causation.
A MATHEMATICAL EXPLANATION
FALL 2016 | POVERTY TRACKER 16
This fourth report, summarizing the results of Poverty Tracker data analysis from three years of the
study, shows that poverty and disadvantage are highly dynamic. Although annual snapshots show
that slightly more than one in five New Yorkers lives in poverty, the Poverty Tracker reveals that only
about one in 20 faced persistent poverty during the three-year survey period. The flip side of this,
of course, is that a much larger fraction of New Yorkers experienced poverty, hardship and/or poor
health at some point during the survey.
When we look across these three dimensions—income poverty, material or financial hardship and
poor health—the likelihood that someone will experience some form of disadvantage is higher still.
The analysis also reveals that large fractions of New Yorkers experienced repeated shocks during
the three-year study period, which may help explain why some people remain locked in persistent
poverty, hardship or poor health over time.
CONCLUSION
FALL 2016 | POVERTY TRACKER 17
In each quarterly follow-up survey, the Poverty Tracker asked New Yorkers about a series of events
that may have experienced since the last survey. The events, or “shocks” comprised five catego-
ries, each supported by data items gathered in the survey.
Financial (three items assessed). Whether someone in the household experienced
• a major decrease in income
• a major unanticipated expense
• loss of public benefits
Relationship (one item assessed). Whether the respondent
• ended a romantic relationship
Crime (two items assessed). Victimization or loss/damage to valuable property; whether someone
in the household
• was the victim of a crime
• experienced loss or damage to valuable property
Accident/Illness (one item assessed). Whether someone in the household
• experienced an accident, illness or injury
Arrest (two items assessed). Police stops and arrests: whether someone in the household
• was stopped by police
• was arrested
APPENDIX
FALL 2016 | POVERTY TRACKER 18