Embed Size (px)
Citation preview
792 VOLUME 30 NUMBER 8 AUGUST 2012 nature biotechnology
l e t t e r s
Reverse engineering of biological form and function requires hierarchical design over several orders of space and time. Recent advances in the mechanistic understanding of biosynthetic compound materials1–3, computer-aided design approaches in molecular synthetic biology4,5 and traditional soft robotics6,7, and increasing aptitude in generating structural and chemical microenvironments that promote cellular self-organization8–10 have enhanced the ability to recapitulate such hierarchical architecture in engineered biological systems. Here we combined these capabilities in a systematic design strategy to reverse engineer a muscular pump. We report the construction of a freely swimming jellyfish from chemically dissociated rat tissue and silicone polymer as a proof of concept. The constructs, termed ‘medusoids’, were designed with computer simulations and experiments to match key determinants of jellyfish propulsion and feeding performance by quantitatively mimicking structural design, stroke kinematics and animal-fluid interactions. The combination of the engineering design algorithm with quantitative benchmarks of physiological performance suggests that our strategy is broadly applicable to reverse engineering of muscular organs or simple life forms that pump to survive.
Jellyfish represent a unique test case for design-based tissue engineer-ing of a functional device (Supplementary Fig. 1) as their repetitive behavior and simple bauplan facilitate probing, and potentially emulat-ing, structure-function relationships. Jellyfish medusae feature a radi-ally symmetric, transparent body powered by a few, readily identifiable cell types, such as motor neurons and striated muscle11,12, and they generate quantifiable output functions, for example, well-defined feed-ing and swimming currents13,14, based on straightforward body-fluid interactions15,16. We started by identifying the key factors contribut-ing to the jellyfish stroke cycle and its functions, that is, feeding and propulsion (Fig. 1a and Supplementary Movie 1), with the goal of determining potential functional substitutes from tissue-engineering materials. First, previous studies and observations17,18 have highlighted the importance of symmetric and complete bell contraction, which the jellyfish achieves by synchronously activating its axisymmetric musculature through a system of distributed pacemakers, result-ing in controlled folding of the lobed or otherwise compressible bell (Fig. 1b, top)19–21. We reasoned that a sheet of cultured muscle tissue
synchronized by an electrical field would be functionally equivalent (Fig. 1b, bottom). Second, jellyfish stroke kinematics derive from the alternating action of fast muscle contraction and slow elastic recoil of the bell’s compliant gelatinous matrix (mesoglea), corresponding to the power and recovery strokes (Fig. 1c, top)19. For the engineered con-struct, we envisioned that a bilayer of muscle and synthetic elastomer would be suitable to mimic this interaction, that is, the muscle would provide the force to contract the bell, and the elastomer would act to restore the original shape (Fig. 1c, bottom). Third, previous research has highlighted the contribution of viscous, fluid boundary layers to efficient solid-fluid interactions in juvenile medusae and other aquatic organisms (Fig. 1d, top)15,16,22,23. We concluded that the geometry of our construct should be chosen based on ambient fluid conditions so as to facilitate the formation of boundary layers that fill the gaps between neighboring lobes (Fig. 1d, bottom).
We then investigated in detail how the tissue components of juvenile specimens, so-called ephyrae, of the scyphozoan jellyfish Aurelia aurita generate these three key properties, and in parallel attempted to select and assemble functionally equivalent substitutes from synthetic and tissue-engineered materials. In Aurelia aurita, bell contraction relies on a monolayer of striated muscle lining the subumbrella12,24. Using chemical staining, we mapped the cel-lular architecture of the swimming muscle in Aurelia sp. ephyrae, which consists of a central ring merging into eight radial branches (Supplementary Fig. 2a). Jellyfish myofibrils displayed a high degree of alignment, and longitudinal continuity suggested mechanical end-to-end coupling of muscle cells25. Optical mapping of membrane voltage potential revealed that, at least locally, action potentials propa-gate continuously within jellyfish muscle (Supplementary Fig. 3), whereas global coordination of muscle activation is thought to be accomplished by a networked ensemble of pacemaker cells 21,26. Together, these findings suggested that highly ordered myofibril organization paired with spatiotemporal coordination of contrac-tion would be critical to emulating jellyfish muscle function. As it turns out, these properties are intrinsic to engineered monolayers of anisotropic rat cardiac tissue designed to mimic the laminar structure of the heart ventricles27. Given a suitable micro-pattern of extracel-lular matrix cues, neonatal rat cardiomyocytes self-assemble into a functional syncytium with well-defined axes of force generation28,29. Cell-to-cell electromechanical coupling promotes tissue-wide propa-gation of electrical impulses and spatiotemporal synchronization of
A tissue-engineered jellyfish with biomimetic propulsionJanna C Nawroth1, Hyungsuk Lee2, Adam W Feinberg2, Crystal M Ripplinger2, Megan L McCain2, Anna Grosberg2, John O Dabiri3 & Kevin Kit Parker2
1Division of Biology, California Institute of Technology, Pasadena, California, USA. 2Disease Biophysics Group, Wyss Institute for Biologically Inspired Engineering and School of Engineering and Applied Sciences, Harvard University, Cambridge, Massachusetts, USA. 3Graduate Aeronautical Laboratories and Bioengineering, California Institute of Technology, Pasadena, California, USA. Correspondence should be addressed to K.K.P. ([email protected]) or J.O.D. ([email protected]).
Received 7 December 2011; accepted 14 May 2012; published online 22 July 2012; doi:10.1038/nbt.2269
npg
© 2
012
Nat
ure
Am
eric
a, In
c. A
ll rig
hts
rese
rved
.

nature biotechnology VOLUME 30 NUMBER 8 AUGUST 2012 793
l e t t e r s
contraction, which differentiates cardiomyocytes from most other contractile cell types, such as skeletal myocytes. In particular, engi-neered cardiac tissue constructs contract synchronously when electric field stimulation is applied30, eliminating the need for internal inner-vation by means of neuronal cells or embedded electrodes. We mod-eled medusoid body design after that of early-stage ephyrae, which do not possess a closed bell but an array of eight lobes arranged radially to a central disc (Fig. 1e). We emulated jellyfish myofibril organi-zation in a monolayer of patterned neonatal rat cardiomyocytes, as evidenced by morphology at different scales as well as quantifica-tion of actin-fiber alignment (Fig. 1f,g and Supplementary Fig. 4). Further, optical mapping of membrane voltage potential confirmed
the continuous spread of electrical activity through the nerve-free cardiac tissue (Supplementary Fig. 3).
Next, we identified suitable substrates to substitute for mesoglea in stroke kinematics. Jellyfish stroke kinetics result from the coopera-tive effects of muscle and mesoglea mechanics, the former constrict-ing the bell during the power stroke, the latter restoring the original shape through elastic recoil during the recovery stroke. In the medu-soid, we attempted to create a similar interaction by coupling a layer of anisotropic cardiomyocytes with an elastic silicone substrate of adjustable stiffness5,30. Millimeter-scale medusoid constructs were fabricated by seeding neonatal rat cardiomyocytes onto micro- patterned, jellyfish-shaped, polydimethylsiloxane (PDMS) thin
f
c
0.010.020.030.040.050.06
Nor
mal
ized
occ
uren
ce
–50 0 50
0.010.020.030.040.050.06
OOP = 0.93 ± 0.2n = 7
OOP = 0.94 ± 0.2n =10
Actin orientation angle(degrees)
10 µm
5 µm
1 mm
Jelly�sh muscle
Medusoid muscle
eJelly�sh
Medusoid
1 mm
Efficient Inefficient
Fluid dynamicsStroke kinematics
UFluid
Ubell
Ubell
Ubell
UFree stream
Bell
Boundary layer
Oncoming �ow
Boundary layer
Lobed bell
b d
g
Jelly�sh
Medusoid
Muscledesign
Body design
Con�gurational change
Mesoglea
Swimming muscle
Feeding current
Contract
Recoil
Thrust
Pow
erst
roke
Rec
over
yst
roke
Jelly�shstroke cycleand functions
Elastomer
Engineered muscle
Fastcontraction
Slowrecoil
L[r] D
R
r Fluid transport efficiency= f (boundary layer)= f (R, D, L[r])
Med
usoi
d
V
+–
Jelly
�sh
Fluid transport efficiency= f (boundary layer)
Fieldstimulation
Anisotropic muscle& functional syncytium
Pacemakersystem
aKey factors
Lobedbell
Figure 1 Key concepts of fluid transport in jellyfish and in vitro implementation. (a) Schematics of jellyfish stroke cycle generating thrust during the power stroke, and feeding currents during the recovery stroke. (b) Controlled configurational change. Symmetric, complete bell contraction is mediated by anisotropic striated muscle tissue, a functional syncytium synchronized by a system of distributed neuronal pacemaker centers (jellyfish, top). This mechanism can be approximated by electrical field stimulation of electromechanically coupled, anisotropic cardiac muscle (medusoid, bottom). In either case, lobed geometry facilitates circumferential constriction of the bell. (c) Stroke kinematics. In the bilayered design of jellyfish (top) and medusoid (bottom), a flexible elastomer opposes an actuator, which promotes asymmetric stroke patterns: active, fast contraction and passive, slow recoil. (d) Fluid dynamics. Fluid velocity gradients, so-called boundary layers, extend effective reach of lobes (top). Overlapping boundary layers close interlobate gaps to oncoming flow. This prevents leakage and inefficient fluid transport despite the presence of gaps (center). Optimized medusoid body geometry favors the formation of boundary layer overlap and thus efficient fluid transport (bottom). (e) Body design of jellyfish (top) and free-swimming medusoid construct (bottom). Comparison demonstrates similar geometry and dimensions but also illustrates that the medusoid constitutes a simplified version of a jellyfish, reduced to elements necessary for propulsive function. (f) Jellyfish 2D muscle architecture (top) was reverse-engineered in medusoids (bottom). Left: Composite brightfield image overlaid with F-actin stain (green) of muscle cell monolayer. Square inset: Close-up on muscle organization at lobe-body junction; F-actin stain (green). Note that jellyfish muscle tissue consists of a single layer of myofibrils, here in focus, whereas engineered medusoid muscle tissue contains a stack of myofibrils, most of them being out of focus and blurring the image at this resolution. Circular inset: microstructure of single myofibril layer; F-actin stain (green), sarcomeric α-actinin (gray). (g) Distribution of actin fiber orientation angles within single myofibril layer (centered on zero). Quantitative analysis of multiple fields of view revealed no significant difference in the orientation organization parameter (OOP) (P = 0.61, n = 10; two-sample t-test).
npg
© 2
012
Nat
ure
Am
eric
a, In
c. A
ll rig
hts
rese
rved
.
794 VOLUME 30 NUMBER 8 AUGUST 2012 nature biotechnology
l e t t e r s
films (Supplementary Fig. 5). Thus, PDMS surface modifications controlled two-dimensional tissue architecture, whereas the overall medusoid shape was equal to PDMS film dimensions. Jellyfish meso-glea, however, is a heterogeneous substrate with soft folds allowing for compression and with stiffened ribs serving as springs and piv-ots around which the substrate can bend into a bell17. A homogene-ous disc of PDMS, on the other hand, is incompressible and cannot be turned into a bell without wrinkling, buckling or cracking, all of which require considerably higher stresses than bending31. As a result, a naive biomimetic approach of precisely copying the muscle architec-ture and circular body shape of late-stage ephyrae (Supplementary Fig. 2b) led to minimal film deformation and no propulsion at all (Supplementary Movie 2). Successful medusoid designs must there-fore match muscle stress generation with substrate compliance. In the lobed design, each arm freely bends around its base such that circum-ferential compression is avoided and a quasi-closed bell is formed at maximal contraction. The lobe bending angle was maximized by aligning the muscle fibers to the main axis of deformation and using minimal film thickness (~20 µm) without compromising stability, exploiting the known relation between myocyte tissue architecture, PDMS film thickness and resulting curvature of contraction. In par-ticular, anisotropic engineered cardiac tissue generates peak stresses of 10 mN/mm2, which is similar to native cardiac muscle and suf-ficient to bend PDMS membranes of 20-µm thickness at a curvature of 1/mm, meaning that a 2-mm long lobe will be arched by more than 90 degrees9,30. Conversely, in the bell’s center, where little deformation was required, a circumferential muscle layout was implemented to facilitate electrical conduction between neighboring lobes, as action potential propagation velocity is fastest along the longitudinal axis of an anisotropic syncytium27 (Supplementary Fig. 3).
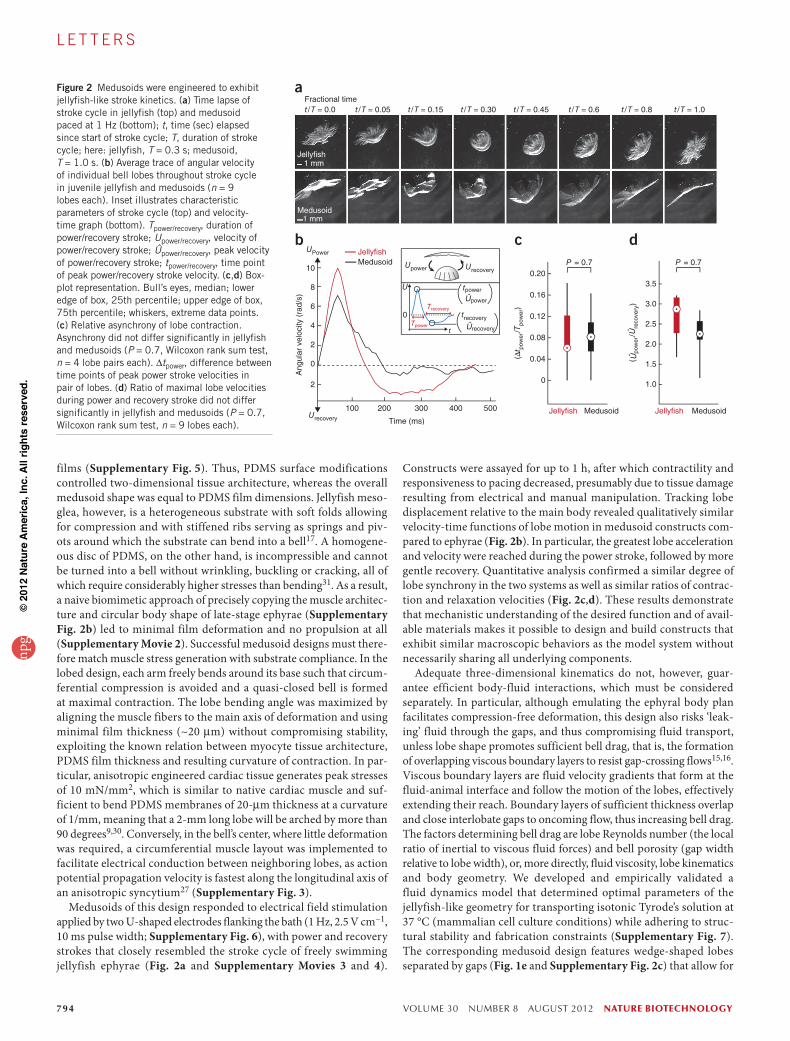
Medusoids of this design responded to electrical field stimulation applied by two U-shaped electrodes flanking the bath (1 Hz, 2.5 V cm−1, 10 ms pulse width; Supplementary Fig. 6), with power and recovery strokes that closely resembled the stroke cycle of freely swimming jellyfish ephyrae (Fig. 2a and Supplementary Movies 3 and 4).
Constructs were assayed for up to 1 h, after which contractility and responsiveness to pacing decreased, presumably due to tissue damage resulting from electrical and manual manipulation. Tracking lobe displacement relative to the main body revealed qualitatively similar velocity-time functions of lobe motion in medusoid constructs com-pared to ephyrae (Fig. 2b). In particular, the greatest lobe acceleration and velocity were reached during the power stroke, followed by more gentle recovery. Quantitative analysis confirmed a similar degree of lobe synchrony in the two systems as well as similar ratios of contrac-tion and relaxation velocities (Fig. 2c,d). These results demonstrate that mechanistic understanding of the desired function and of avail-able materials makes it possible to design and build constructs that exhibit similar macroscopic behaviors as the model system without necessarily sharing all underlying components.
Adequate three-dimensional kinematics do not, however, guar-antee efficient body-fluid interactions, which must be considered separately. In particular, although emulating the ephyral body plan facilitates compression-free deformation, this design also risks ‘leak-ing’ fluid through the gaps, and thus compromising fluid transport, unless lobe shape promotes sufficient bell drag, that is, the formation of overlapping viscous boundary layers to resist gap-crossing flows15,16. Viscous boundary layers are fluid velocity gradients that form at the fluid-animal interface and follow the motion of the lobes, effectively extending their reach. Boundary layers of sufficient thickness overlap and close interlobate gaps to oncoming flow, thus increasing bell drag. The factors determining bell drag are lobe Reynolds number (the local ratio of inertial to viscous fluid forces) and bell porosity (gap width relative to lobe width), or, more directly, fluid viscosity, lobe kinematics and body geometry. We developed and empirically validated a fluid dynamics model that determined optimal parameters of the jellyfish-like geometry for transporting isotonic Tyrode’s solution at 37 °C (mammalian cell culture conditions) while adhering to struc-tural stability and fabrication constraints (Supplementary Fig. 7). The corresponding medusoid design features wedge-shaped lobes separated by gaps (Fig. 1e and Supplementary Fig. 2c) that allow for
Figure 2 Medusoids were engineered to exhibit jellyfish-like stroke kinetics. (a) Time lapse of stroke cycle in jellyfish (top) and medusoid paced at 1 Hz (bottom); t, time (sec) elapsed since start of stroke cycle; T, duration of stroke cycle; here: jellyfish, T = 0.3 s; medusoid, T = 1.0 s. (b) Average trace of angular velocity of individual bell lobes throughout stroke cycle in juvenile jellyfish and medusoids (n = 9 lobes each). Inset illustrates characteristic parameters of stroke cycle (top) and velocity-time graph (bottom). Tpower/recovery, duration of power/recovery stroke; Upower/recovery, velocity of power/recovery stroke; Ûpower/recovery, peak velocity of power/recovery stroke; tpower/recovery, time point of peak power/recovery stroke velocity. (c,d) Box-plot representation. Bull’s eyes, median; lower edge of box, 25th percentile; upper edge of box, 75th percentile; whiskers, extreme data points. (c) Relative asynchrony of lobe contraction. Asynchrony did not differ significantly in jellyfish and medusoids (P = 0.7, Wilcoxon rank sum test, n = 4 lobe pairs each). ∆tpower, difference between time points of peak power stroke velocities in pair of lobes. (d) Ratio of maximal lobe velocities during power and recovery stroke did not differ significantly in jellyfish and medusoids (P = 0.7, Wilcoxon rank sum test, n = 9 lobes each).
npg
© 2
012
Nat
ure
Am
eric
a, In
c. A
ll rig
hts
rese
rved
.

nature biotechnology VOLUME 30 NUMBER 8 AUGUST 2012 795
l e t t e r s
compression-free, collision-free deformation, whereas fluid leakage is resisted through formation of viscous boundary layers.
Medusoids with optimized muscle and PDMS geometry succeeded in replicating jellyfish swimming behavior (Supplementary Movies 3 and 4) and achieved similar propulsion and feeding performances. In particular, digital particle image velocimetry (DPIV) (Supplementary Fig. 8 and Supplementary Movie 5) revealed qualitatively and quanti-tatively similar flow fields generated during bell contraction. Both medusoid and jellyfish power strokes generated fluid velocities between 6 and 10 mm s−1, indicating similar momentum transfer (Fig. 3a,b
and Supplementary Movies 6 and 7). DPIV also revealed the wake structures formed due to bell acceleration and motion reversal. The presence of a so-called stopping vortex, a ring of circulating fluid shed during the recovery stroke, suggested that jellyfish-like feeding cur-rents, which draw fluid inside the bell, were produced by the medusoid construct (Fig. 3d,e and Supplementary Movies 6 and 7). Changes to medusoid geometry resulted in altered fluid interactions (Fig. 3c,f), which will be discussed in detail later. Medusoid and jellyfish propul-sion performances were expressed in units of body lengths traveled per swimming stroke (BL/S), a common metric for biological locomotion
1 3 5 7
1
3
5
7
mm
mm
0
1
2
3
4
5
6
7
8
9
2 4 6 8
2
4
6
mm
0
1
0
2
3
4
5
6
7
1
2
4
6
3
5
7
Velocity mm • s–1 Velocity mm • s–1a
2 3 4 5 6 7 8 91
Jelly�sh b Medusoid
mm2 4 63 51
0
1
2
3
4
5
6
7
mm
1
2
4
6
3
5
7
c Velocity mm • s–1Sieve medusoid
mm
d
2 4 6 8
2
4
6
–35–30–25–20–15–10–505101520253035
mm
3 5 71
1
3
5
Vorticity s–1
Fluid velocity6 mm • s–1
7
Jelly�sh
mm
Fluid velocity3 mm • s–1
2 3 4 5 6 7 8 9
1
2
3
4
5
6
7
mm
mm
–10–8–6–4–202
4
6810
Vorticity s–1
1 2 3 4 5 6
1
2
3
4
5
6
7
mm
mm
1
–10–8–6–4–202
6810
Vorticity s–1
4 4
Fluid velocity3 mm • s–1
e Medusoid f Sieve medusoid
Figure 3 Medusoids generated jellyfish-like flow fields. (a–c) Velocity field at end of power stroke reveals similar thrust generation in a, jellyfish and b, medusoids, and reduced thrust in c, sieve-designed medusoids. White arrows, lobe motion. (d–f) Vorticity field during recovery stroke reveals similar formation of stopping vortices in jellyfish (d), medusoids (e) and sieve-designed medusoid (f). Blue and red contours, counter-rotating cross-sections of stopping vortex ring; gray arrows, lobe motion.
–0.8 –0.6 –0.4 –0.2 0
[UTR–1]
Radial position (r/R)
Fra
ctio
nal t
ime
(t/T
reco
very
)
0.2 0.80.60.4
0.20.4
0
0.20.4
0
0.20.4
0
0.20.4
0
0.20.4
0
0.20.4
0
0.20.4
0
–R R0
Referencesection
Stoppingvortex
(i) (ii)
0.00
0.17
0.33
0.50
0.67
0.83
1.00 21
18
22
14
8
15
13
8
0
–7
587
–568
436
6
10
Vel
ocity
(B
L/s
trok
e)
BLa b
*P = 0.02 *P = 0.00015
0.1
0.2
0.3
0.4
0.5
0.6
0.7
0.8
0.9
1.0
P = 0.06
P = 0.8
Jellyfish Jellyfish,sieve mode
Medusoid,sieve design
Medusoid
Jellyfish Medusoid[QTR–3] × 10–2
Jellyfish Medusoid,sieve design
Medusoid
BellMedusoid, sieve design
Figure 4 Medusoids achieved functional performance of jellyfish. (a) Box-plot representation of relative propulsion performances in BL/S. Performance in jellyfish (n = 7, red) and optimally designed medusoids (n = 11, black) spans similar range. Compared to optimal conditions, jellyfish in sieve conditions (n = 7, blue) and sieve-designed medusoids (n = 6, gray) performed significantly worse (P = 0.02 and P = 0.00015, respectively; Wilcoxon rank sum test). Bull’s eyes, median; lower edge of box, 25th percentile; upper edge of box, 75th percentile; whiskers, extreme data points not considered outliers; circle, outlier. Asterisks denote statistically significant difference, P < 0.05. (b) For each stage of the recovery stroke, flow profile (i) and volume flow rate (ii) across subumbrellar reference section reveal similar fluid transport, that is, ‘feeding current’ in jellyfish and medusoids, and reduced performance—including flow reversal—in sieve-designed medusoids. Data shown for one representative sample each. Left: reference section at each stage of recovery stroke. Measured quantities are nondimensionalized to facilitate comparison. R, bell radius (mm); jellyfish: R = 9 mm; medusoid: R = 9 mm; sieve-designed medusoid: R = 9 mm; r, radial distance (mm) from center. Trecovery, duration (s) of recovery stroke; jellyfish: T = 0.2 s, medusoid, T = 0.48 s; sieve-designed medusoid, T = 0.55 s; t, time (s) elapsed since start of recovery stroke. U, flow velocity [mm/s] normal to reference section; jellyfish: Umax = 9 mm/s; medusoid: Umax = 2.4 mm/s; sieve-designed medusoid: Umax = 1.6 mm/s. Q, volume flow rate (mm3/s) passing across reference area (circle with diameter reference section); jellyfish: Qmax = 100 mm3/s; medusoid: Qmax = 40 mm3/s; sieve-designed medusoid: Qmax = 15 mm3/s.
npg
© 2
012
Nat
ure
Am
eric
a, In
c. A
ll rig
hts
rese
rved
.
796 VOLUME 30 NUMBER 8 AUGUST 2012 nature biotechnology
l e t t e r s
efficiency that normalizes for size differences between the specimens that are being compared32. Here, body length was defined as bell height at maximal contraction (Fig. 4a, inset). Medusoid performance mostly ranged between 0.4 and 0.7 and occasionally reached values close to 1 BL/S. Upper medusoid performance thus covered the span of regular ephyral swimming efficiency, which varied between 0.6 and 0.8 BL/S (Fig. 4a). Relative feeding performance was given by nondimensionalized velocity profile and volumetric flux across the underside of the bell during the recovery stroke (Fig. 4b). These metrics were drawn from DPIV data and quantify the rate of fluid turnover at the solid-liquid interface. In ephyrae, this rate determines the efficiency of transporting prey items to the subumbrellar feed-ing structures, hence the term ‘feeding performance’. Comparison of volumetric flux across the entire bell revealed that medusoids and ephyrae processed fluid at similar rates during each stage of the recov-ery stroke (Fig. 4b, ii). Total volumetric flux in the medusoid equaled 75% of ephyral flux. The corresponding velocity profile of medusoid and jellyfish confirmed positive flux, that is, flow toward the bell, of similar magnitude throughout the stroke cycle (Fig. 4b, i). Note that the pronounced ‘M’-shaped velocity profile observed in the ephyrae derives from the fact that the central oral arms (not present in medu-soids) are diverting the flow.
For comparison, we also tested a suboptimal layout featuring slim, straight lobes (Supplementary Fig. 2d). This body plan is adopted by ephyrae exposed to relatively low water temperatures where increased kinematic viscosity and thicker boundary layers allow for greater gaps between lobes without compromising fluid transport as boundary layer overlap is maintained. Exposed to the lower viscosity conditions at warmer temperatures, this same body plan provides little resistance to the flow and effectively sieves through the fluid instead of trans-porting it (Supplementary Fig. 7h–j)16. Similarly, sieve-designed medusoids accelerated the fluid to no more than 50% of the velocities reached by the original design, which was optimized for 37 °C (Fig. 3b,c and Supplementary Movie 8), resulting in a 60% reduc-tion of median propulsion performance (Fig. 4a and Supplementary Movie 4). Further, although sieve-designed medusoids generated a stopping vortex ring during the recovery stroke (Fig. 3e,f and Supplementary Movie 8), they nonetheless exhibited an 80% reduc-tion in total volumetric flux toward the bell compared to optimal medusoids. As the velocity profile reveals, the reduced feeding per-formance was due to lower flow rates as well as reversal of flow, which corresponds to expelling potential prey from the bell (Fig. 4b).
This study extends the process of designing novel biological or bio-inspired systems to the realm of pseudo-organisms. We have employed traditional quantitative engineering approaches to build a millimeter-scale construct from living and synthetic materials that emulates typical jellyfish behaviors. Our current work builds on our previous work in biohybrid actuators30, where the objective was to build a biologically powered mechanical device. We have demonstrated here how such devices can be designed and incorporated into synthetic organisms that mimic the biological function of an organism. As shown here for muscle-powered fluid transport, the main challenge for macroscale synthetic biology is to dissect complex behaviors into mechanistic components that have functionally equivalent, tissue-engineered solutions. Our results illustrate that a biomimetic design does not always reproduce the intended function (Supplementary Fig. 2b and Supplementary Movie 2), and that complex behaviors can be generated from relatively few materials by establishing key interactions with cells that exploit their powers of self-organization.
In conclusion, we have succeeded in recreating jellyfish swim-ming, a well-defined animal behavior, in an artificial tissue construct.
At this stage, swimming behavior is limited to exactly one stereotypic mode of execution because we have no means of fine-controlling local muscle contraction to achieve, for example, turning and maneu-vering. However, the future integration of multiple cell types and compound materials will allow for constructs of greater autonomy that are capable of sensing the environment and employing internal decision-making circuits to choose a suitable response from a variety of behaviors.
Our design algorithm is applicable to the assembly of any synthetic muscular pump. With respect to the engineering of tissues or organs intended for therapeutic use in patients, our results highlight the impor-tance of developing and applying quantitative performance specifica-tions. With simple model systems, the design of these specification standards can be accomplished in carefully controlled conditions.
MeTHodsMethods and any associated references are available in the online version of the paper.
Note: Supplementary information is available in the online version of the paper.
ACKNOWLeDGMeNtsWe acknowledge financial support from the Wyss Institute for Biologically Inspired Engineering at Harvard, the Harvard Materials Research Science and Engineering Center under National Science Foundation award number DMR-0213805, US National Institutes of Health grant 1 R01 HL079126 (K.K.P.), and from the office of Naval Research and National Science Foundation Program in Fluid Dynamics (J.O.D.). We acknowledge the Harvard Center for Nanoscale Science for use of facilities and the New England Aquarium for supplying jellyfish. We thank J. Goss, P.W. Alford, K.R. Sutherland, K. Balachandran, C. Regan, P. Campbell, S. Spina and A. Agarwal for comments and technical support.
AutHOR CONtRibutiONsK.K.P., J.O.D. and J.C.N. conceived the project, designed the experiments and prepared the manuscript. J.O.D. and J.C.N. developed the fluid model. J.C.N. did the experiments and analyzed the data. H.L., A.W.F., C.M.R., M.L.M. and A.G. supervised experiments, analyzed data and gave conceptual advice. M.L.M. isolated rat cardiomyocytes for experiments.
COMPetiNG FiNANCiAL iNteRestsThe authors declare no competing financial interests.
Published online at http://www.nature.com/doifinder/10.1038/nbt.2269. reprints and permissions information is available online at http://www.nature.com/reprints/index.html.
1. Mitragotri, S. & Lahann, J. Physical approaches to biomaterial design. Nat. Mater. 8, 15–23 (2009).
2. Place, E.S., Evans, N.D. & Stevens, M.M. Complexity in biomaterials for tissue engineering. Nat. Mater. 8, 457–470 (2009).
3. von der Mark, K., Park, J., Bauer, S. & Schmuki, P. Nanoscale engineering of biomimetic surfaces: cues from the extracellular matrix. Cell Tissue Res. 339, 131–153 (2010).
4. Kaznessis, Y.N. Models for synthetic biology. BMC Syst. Biol. 1, 47 (2007).5. Fu, P. A perspective of synthetic biology: assembling building blocks for novel
functions. Biotechnol. J. 1, 690–699 (2006).6. Bar-Cohen, Y. EAP as artificial muscles: progress and challenges. Proc. SPIE 5385,
10–16 (2004).7. Bar-Cohen, Y. Biomimetics–using nature to inspire human innovation. Bioinspir.
Biomim. 1, P1–P12 (2006).8. Grosberg, A. et al. Self-organization of muscle cell structure and function.
PLOS Comput. Biol. 7, e1001088 (2011).9. Alford, P.W., Feinberg, A.W., Sheehy, S.P. & Parker, K.K. Biohybrid thin films for
measuring contractility in engineered cardiovascular muscle. Biomaterials 31, 3613–3621 (2010).
10. Huang, A.H., Farrell, M.J. & Mauck, R.L. Mechanics and mechanobiology of mesenchymal stem cell-based engineered cartilage. J. Biomech. 43, 128–136 (2010).
11. Arai, M.N. A Functional Biology of Scyphozoa (Springer; 1997).12. Anderson, P.A.V. & Schwab, W.E. The organization and structure of nerve and muscle
in the jellyfish Cyanea capillata (coelenterata; scyphozoa). J. Morphol. 170, 383–399 (1981).
npg
© 2
012
Nat
ure
Am
eric
a, In
c. A
ll rig
hts
rese
rved
.

nature biotechnology VOLUME 30 NUMBER 8 AUGUST 2012 797
l e t t e r s
13. Dabiri, J.O., Colin, S.P., Costello, J.H. & Gharib, M. Flow patterns generated by oblate medusan jellyfish: field measurements and laboratory analyses. J. Exp. Biol. 208, 1257–1265 (2005).
14. Costello, J.H. & Colin, S.P. Flow and feeding by swimming scyphomedusae. Marine. Biol. 124, 399–406 (1995).
15. Feitl, K.E., Millett, A.F., Colin, S.P., Dabiri, J.O. & Costello, J.H. Functional morphology and fluid interactions during early development of the scyphomedusa Aurelia aurita. Biol. Bull. 217, 283–291 (2009).
16. Nawroth, J.C., Feitl, K.E., Colin, S.P., Costello, J.H. & Dabiri, J.O. Phenotypic plasticity in juvenile jellyfish medusae facilitates effective animal-fluid interaction. Biol. Lett. 6, 389–393 (2010).
17. Gladfelter, W.G. A comparative analysis of the locomotory systems of medusoid Cnidaria. Helgol. Wiss. Meeresunters. 25, 228–272 (1973).
18. Widmer, C.L. How to Keep Jellyfish in Aquariums: An Introductory Guide for Maintaining Healthy Jellies (Wheatmark; 2008).
19. Gladfelter, W.B. Structure and function of the locomotory system of the Scyphomedusa Cyanea capillata. Marine Biol. 14, 150–160 (1972).
20. Passano, L.M. Pacemakers and activity patterns the medusae: homage to Romanes. Am. Zool. 5, 465–481 (1965).
21. Satterlie, R.A. Neuronal control of swimming in jellyfish: a comparative story. Can. J. Zool. 80, 1654–1669 (2002).
22. Koehl, M.A. et al. Lobster sniffing: antennule design and hydrodynamic filtering of information in an odor plume. Science 294, 1948–1951 (2001).
23. Koehl, M.A.R. Biomechanics of microscopic appendages: functional shifts caused by changes in speed. J. Biomech. 37, 789–795 (2004).
24. Chapman, D.M. Microanatomy of the bell rim of Aurelia aurita (Cnidaria: Scyphozoa). Can. J. Zool. 77, 34–46 (1999).
25. Blanquet, R.S. & Riordan, G.P. An ultrastructural study of the subumbrellar musculature and desmosomal complexes of cassiopea xamachana (Cnidaria: Scyphozoa). Trans. Am. Microsc. Soc. 100, 109–119 (1981).
26. Hayward, R.T. Modeling Experiments on Pacemaker Interactions in Scyphomedusae. PhD thesis, UNCW ⟨http://libres.uncg.edu/ir/uncw/listing.aspx?id=1787⟩ (2007).
27. Grosberg, A., Alford, P.W., McCain, M.L. & Parker, K.K. Ensembles of engineered cardiac tissues for physiological and pharmacological study: heart on a chip. Lab Chip 11, 4165–4173 (2011).
28. Böl, M., Reese, S., Parker, K.K. & Kuhl, E. Computational modeling of muscular thin films for cardiac repair. Comput. Mech. 43, 535–544 (2008).
29. Shim, J., Grosberg, A., Nawroth, J.C., Parker, K.K. & Bertoldi, K. Modeling of cardiac muscular thin films: pre-stretch, passive and active behavior. J. Biomech. 45, 832–841 (2012).
30. Feinberg, A.W. et al. Muscular thin films for building actuators and powering devices. Science 317, 1366–1370 (2007).
31. Marder, M., Deegan, R. & Sharon, E. Crumpling, buckling, and cracking: elasticity of thin sheets. Phys. Today 60, 33–38 (2007).
32. Vogel, S. Life in Moving Fluids: the Physical Biology of Flow (Princeton University Press, 1996).
npg
© 2
012
Nat
ure
Am
eric
a, In
c. A
ll rig
hts
rese
rved
.
nature biotechnology doi:10.1038/nbt.2269
oNLINe MeTHodsDesign of medusoid muscle architecture. Initial medusoid muscle architec-ture mimicked the comparatively sparse muscle layout of jellyfish ephyrae (Supplementary Fig. 2a,b) but was found to generate insufficient stresses for robust bell contraction. We therefore implemented a medusoid muscle layout featuring extensive radial components designed for maximal lobe bending whereas the central ring muscle facilitated lobe synchronization by providing a rapid pathway for circumferential action potential propagation (Supplementary Fig. 2c,d). This design exploited the fact that both maximal force generation and maximal conduction velocity occurs along the longitu-dinal axis of anisotropic myocardium27,30.
Optical mapping of muscle action potential propagation in jellyfish and medusoid. Medusoids. PMDS-coated glass cover slips with cardiomyocyte monolayers of medusoid muscle architecture were assayed in a custom-made optical mapping system (Supplementary Fig. 3i–o) by adapting previ-ously described protocols27. Briefly, the cultures were incubated for 5 min in 8 µM RH-237 voltage-sensitive dye (Iex\Iem in DMSO = ~550/~800 nm; Molecular Probes) in Tyrode’s solution, then washed with Tyrode’s solution. During recording, the tissue was placed in Tyrode’s solution containing 10 µM excitation-contraction uncoupler blebbistatin, thereby minimizing motion artifacts33. All solutions were maintained at 35–37 °C. A platinum point electrode connected to a Grass S48 stimulator (Grass technologies, West Warwick, RI 02893, USA) was placed ~1 mm above the culture surface (Supplementary Fig. 3i) and used to apply point stimuli (2 Hz, 5–8 V, 10-ms duration). Imaging was performed using an inverted microscope (Zeiss Axiovert 200; Carl Zeiss MicroImaging, LLC Thornwood, NY 10594, USA) equipped with a 40× Plan-Neofluar (1.3 NA) oil-immersion objective, a fluo-rescence light source (Hamamatsu L2422 100 Watt Mercury-Xenon lamp) and a filter cube appropriate for RH237 imaging (Zeiss EX BP530-585, DC FT600, EM LP615). Fluorescence shutter opening and closing was synchronized with the pacing stimulus. Membrane voltage signals were optically recorded at 5 Hz using a honeycomb of 124 independent optical fibers, each monitoring an approximately circular field of view of 25 µm in diameter (Supplementary Fig. 2j,k) and each connected to a discrete photodiode transimpedance ampli-fier. The outputs of the photodiode amplifiers were digitized by a bank of differential amplifiers and DAQ cards (National Instruments Corporation, Austin, TX 78759, USA). Digitized signals were processed using custom-made software implemented in MATLAB (MathWorks, Natick, MA 01760, USA) (Supplementary Fig. 3l). Activation times, defined as the time point of maxi-mum positive slope of the action potential, served to calculate isochronal maps of activation and velocity vector fields across the field of view monitored by the LED array34 (Supplementary Fig. 3m–o).
Jellyfish. Optical mapping in jellyfish (Supplementary Fig. 3a–h) was per-formed as in medusoid coverslips except for the following differences. All pro-cedures were carried out in artificial seawater at room temperature (KENT Marine Sea Salt, KENT Marine Sea, 5401 West Oakwood Park Drive, Franklin, WI 53132). Jellyfish swimming muscle proved to be insensitive to all available excitation-contraction uncoupling agents including blebbistatin, cytochalasin D, 2,3-butanedione monoxime (BDM) and dantrolene sodium. Thus, to constrain movement, an additional cover slip was placed on top of the jellyfish using vacuum grease as a spacer. The anode and cathode pole of a platinum pacing electrode were placed into excess seawater protruding from either side of the coverslips to apply electric field stimulation (5–8 V, 10 ms duration) at a rate of 1 Hz (Supplementary Fig. 3a). This stimulus reliably led to muscle contraction starting near the pacemaker centers within the lobes (Supplementary Fig. 3b). The optical signals contained motion artifacts due to muscle contractions; how-ever, the difference in relative timing allowed isolation of true voltage signals (Supplementary Fig. 3c,d). Subsequently, activation times, isochronal maps and velocity vector fields were calculated as above (Supplementary Fig. 3e–h).
Histochemical staining and structural analysis. Muscle microstructure in jellyfish and medusoids was visualized by fluorescent staining of actin and sarcomeres. Medusoid-patterned myocardial tissues were cultured on PDMS-coated glass cover slips and stained for F-actin fibers and sarcomeric α-actinin as previously described30. Briefly, washed samples were fixed for 15 min in 4%
paraformaldehyde and 2.5% Triton X-100 in PBS at 37 °C, followed by 1-h incubation with 1:200 dilutions of mouse anti-sarcomeric α-actinin mono-clonal primary antibody (Sigma-Aldrich). Samples were then washed and con-currently incubated with 1:200 dilutions of DAPI (Sigma-Aldrich), phalloidin conjugated to Alexa-Fluor 488 (Invitrogen, Carlsbad, CA 92008, USA) and goat anti-mouse secondary antibody conjugated to tetramethylrhodamine for 1 h at room temperature. Juvenile jellyfish were anesthetized in 7.5% MgCl2 solution in artificial seawater (1:1) and fixed overnight in 4% paraformaldehyde and 2.5% Triton X-100 in PBS at 4 °C. Following fixation the animals were stained overnight at 4 °C with 1:250 dilutions of phalloidin conjugated to Alexa-Fluor 488 (Invitrogen) and DAPI (Sigma-Aldrich). Following staining, jellyfish and medusoid samples were mounted to glass slides and imaged on an inverted light microscope (Model DMI 6000B, Leica Microsystems, International Headquarters, Wetzlar, Germany) in epifluorescence using a Coolsnap HQ digital camera (Roper Scientific Inc, Trenton, NJ 08619, USA).
Custom-made image processing software was used to quantify actin fiber alignments35. The code was adapted from biometric fingerprint algorithms (Peter Kovesi, School of Computer Science & Software Engineering, University of Western Australia) and implemented in MATLAB. Briefly, intensity images of actin fiber stains (Supplementary Fig. 4a) were normalized and thresholded to create a binary mask blocking actin-free areas (Supplementary Fig. 4b). From the masked image intensities, we calculated a field of orientation vectors that “flow” tangential to the edges (like velocity vectors along streamlines) and thus correspond to fiber orientation (Supplementary Fig. 4c). Dominant orientation angles were visualized through the histogram of orientation vector angles (Fig. 2b and Supplementary Fig. 4d). In order to quantify the degree of fiber alignment we employed a derivation of the orientational order parameter (OOP), which is commonly used to determine the degree of order in anisotropic media such as liquid crystals and polymeric solutions36 and has also been used to quantify cell alignment37. Briefly, for each nonempty pixel i, we constructed an orientation unit vector ri = [rix, riy] that was used to form the pixel orientational tensor
Tr r r rr r r riix ix ix iy
iy ix iy iy=
, ,, ,
Image orientational tensor T is found by averaging over all pixels, i = 1…n, followed by normalization. The largest eigenvalue of T corresponds to the orientational order parameter (OOP) and ranges—as T is normalized—from 0 to 1, the former indicating completely random orientation, the latter report-ing perfect alignment of all vectors. OOPs calculated from fields of view of different samples can be assumed to be independent of each other and nor-mally distributed, such that a paired t-test could be used to compare jellyfish and medusoids.
Medusoid fabrication. The fabrication of free-swimming medusoid con-structs (Supplementary Fig. 5) closely followed the process described for building muscular thin films30. First, titanium or acrylic casting molds were created by milling a 100-µm high plateau with medusoid body geometry from a circular base. The casting molds were cleaned by sonicating for 20 min in 95% ethanol and air dried. Next, the molds were spin-coated for 1 min at 6,000 RPM with poly(N-isopropylacrylamide) (PIPAAm, Polysciences, Inc., Warrington, PA 18976, USA) at 10% in 1-butanol (w/v). Sylgard 184 (Dow Corning Corporation, Midland, MI 48686, USA) polydimethylsiloxane (PDMS) elastomer was mixed at a 10:1 base to curing agent ratio and allowed to cure for 3.5 h at room temperature, then spin-coated on top of the PIPAAm coated molds for 1 min at 4,500 RPM. The resulting medusoid-shaped PDMS films were ~22 µm thick. The films were cured for a minimum of 4 h at 65 °C, followed by surface functionalization. First, the PDMS film surface was oxi-dized using UV ozone (Model No. 342, Jelight Company Inc., Irvine, CA 92618, USA) in order to increase hydrophilicity and facilitate protein transfer during microcontact printing. Medusoid-muscle patterned PDMS stamps cast from negatively patterned photoresist silicon wafers were inked for 2 h with human fibronectin (50 µg/mL in deionized water; Sigma-Aldrich Co. LLC Natick, MA 0176, USA). Freshly oxidized medusoid substrates were placed under a dissection scope for microcontact printing. The air-dried stamps were lowered onto the medusoid substrates and gently pushed down to achieve
npg
© 2
012
Nat
ure
Am
eric
a, In
c. A
ll rig
hts
rese
rved
.

nature biotechnologydoi:10.1038/nbt.2269
efficient fibronectin transfer. The micropatterned medusoid substrates were then placed into 6-well culture dishes equipped with custom-made height adaptor that leveled the surface to promote homogeneous cell seeding. Prior to cell seeding the samples were sterilized by 15 min exposure to the UV light of the culturing hood.
Neonatal rat ventricular cardiomyocytes were isolated from 2-day old neona-tal Sprague-Dawley using published methods5,30. All procedures were approved by the Harvard Animal Care and Use Committee. Cells were seeded at a den-sity of 1 million cells per well of a 6-well dish. Standard culture media were used (M199 culture medium supplemented with 0.1 mM MEM nonessential amino acids, 10% heat-inactivated FBS,10mM HEPES, 3.5 g/L glucose, 2 mM L-glutamine, 2 mg/L vitamin B-12, and 50 U/ml penicillin). Samples were incu-bated under standard conditions at 37 °C and 5% CO2. At 6 h post seeding 50 nM epinephrine (Sigma-Aldrich) was added to the media. At 24 h post seeding the medium was replaced to remove epinephrine and cellular debris. At 48 h post seeding the media was exchanged with maintenance media (M199 media supplemented as above but with 2% FBS). At 72 h post seeding the media was exchanged with maintenance media once again until use at 4 d post seeding.
Medusoids were released from their titanium or acrylic molds after 4 d of culture when the cardiomyocytes had formed a confluent 2D tissue. The samples were removed from the incubator and placed into a Petri dish filled with 37 °C normal Tyrode’s solution, an extracellular mammalian electrolyte at pH 7.4 suitable for in vitro contractility assay. Tyrode’s solution was prepared from powdered formulation (Sigma-Aldrich, SKU T2145). The solution was allowed to cool below 35 °C so that the temperature-sensitive, sacrificial layer of PIPAAm began to dissolve, allowing for the medusoids to be peeled off from the casing molds aided by fine forceps.
Electric field stimulation of muscle contraction in medusoids. Medusoid contraction was initiated and controlled via electric field stimulation. For this, the medusoid tank was equipped with two U-shaped platinum electrodes installed at opposite walls of the tank and connected to a voltage pulse generator (MyoPacer Cell Stimulator, IonOptix, Milton, MA 02186, USA) for electric field stimulation of the tissue constructs (Supplementary Fig. 6). Monophasic square pulses at 1 Hz, 2.5 V/cm and 10-ms duration resulted in reliable capture.
Design of medusoid geometry and modeling of fluid-solid interactions. Medusoid body shape was modeled after the lobed geometry of juvenile jel-lyfish as this design enables compression-free bell contraction. Outer body diameter and number of lobes were kept constant across all medusoid designs while varying relative lobe length and distal lobe divergence (Supplementary Fig. 6a). Parameter space was further constrained by two functional objec-tives. First, lobe geometry was chosen to promote the formation of overlapping boundary layers along the lobe surface (Supplementary Fig. 7b), effectively converting the interlobal gaps into additional paddle surface and increasing bell drag. Without boundary layer overlap, propulsion becomes inefficient as fluid leaks through the gaps (Supplementary Fig. 7c)15,16. Second, lobe dimensions were constrained by considerations of mechanical stability, fea-sibility of fabrication and freedom of motion (Supplementary Fig. 7d). In particular, lobe divergence and relative length were bounded to prevent lobes from twisting and interfering with each other during contraction.
The relation between bell geometry and drag was studied through a simple fluid-solid interaction model. Lobes were represented as n continuous arrays of elliptical cylinders perpendicular to the flow (Supplementary Fig. 7e). Each array corresponded to a radial lobe position ri, with i = 1…n, and was characterized by parameters, bi, lobe width; Li, width of lobe plus adjacent gap; N, number of lobes; v, kinematic fluid viscosity; and Ui, fluid velocity which is the product of ri and angular velocity ω. These parameters in turn determined local array properties Pi, porosity; Rei, Reynolds number; and Ai, reference area (Supplementary Fig. 7f):
P L b Li i i i= − −( ) 1
Re bU vi i i= −1
A r r b Ni i i i= −+( )1
(1)(1)
(2)(2)
(3)(3)
The drag factors of circular and elliptical cylinders at Reynolds numbers relevant for medusoid lobe contraction (Re = 0.1–20) have been characterized empirically as a function of Re and P38,39. Interpolation of the published data across our parameter space of interest allowed us to estimate local drag factor Cdi for each radial lobe position (Supplementary Fig. 7g). Total bell drag was calculated by summing local drag over all radial positions
Drag Cd AUp i i ii
n=
=∑ 1
22
1ρ
where n was chosen high enough to approximate integration, subscript “p” stands for prediction, and ρ is fluid density. We validated the model by empirically determining the relative magnitude of drag factors of two sets of medusoid-shaped and medusoid-sized acrylic discs (“medusoid dummies”), varying systematically in lobe divergence within each set, and varying in rela-tive lobe length across sets. The empirical order of drag factors within each set was compared to the order predicted by the model. Empirical drag data were obtained by measuring terminal sinking velocities of medusoid dummies in a cylindrical column containing glycerol-water solutions. Viscosity was adjusted for each run to achieve similar lobe Reynolds numbers for all tested shapes. The column was 20 cm in width and 50 cm in height, minimizing edge effects and allowing the shapes to travel at least 30 cm at terminal velocity before reaching the bottom. The dummies were released electromagnetically to ensure zero starting velocity and avoid tilting. A metal weight attached to the center of the acrylic disc served the dual purpose of responding to the electromagnetic field and lowering the center of mass to stabilize the falling trajectory. Terminal sinking velocities were determined from video recordings of the fall. We then applied equation
Cd WU AeT
= ×22d
to calculate empirical drag factors Cde with UT, terminal velocity, A, refer-ence area and W, weight of the medusoid dummy (Supplementary Fig. 6h)40. Predicted drag factors were derived by computing total drag from equation (4) with Ui = UT for all radial positions, and applying
CdDrag
AUpp
T=
×22d
For both sets of medusoid dummies it was found that empirical and predicted orders of normalized drag factors were consistent. Importantly, this order was independent of the order of average lobe Reynolds numbers (Supplementary Fig. 7i). These results, although based on rigid medusoid dummies, suggested that the model was suitable for predicting the relative performance of actual medusoid tissue constructs with different geometries. We subsequently com-puted total bell drag of medusoid tissue constructs as a function of relative lobe length and divergence (Supplementary Fig. 7j). Flow parameters were adjusted to live tissue conditions, with cell media viscosity v = 0.8 × 10⁻⁶m2s−1 and average muscle construct velocity ω = 2.5 rad s−1. In general, higher lobe divergence resulted in higher maximal drag; however, lobe divergence was limited to 1.8 due to stability and fabrication constraints. The optimal design chosen for medusoid fabrication corresponded to the geometry achieving peak drag at lobe divergence of 1.8. For performance comparisons, we also chose to fabricate a suboptimal design with much lower predicted drag at the same relative lappet length. Final optimal and suboptimal body designs promoted propulsion and sieving, respectively (Supplementary Fig. 7j, left, and Supplementary Fig. 2c,d).
Digital particle image velocimetry (DPIV). Fluid dynamics in free-swimming jellyfish and medusoids were assessed through DPIV that allows for quanti-tative analysis of flow created by swimming animals in a two-dimensional plane41. In DPIV, fluid motion is determined by quantifying the displacement vectors of small seeding particles between successive video frames. The same basic DPIV set-up was used for jellyfish and medusoids (Supplementary Fig. 8a). The specimens were imaged in custom-built acrylic containers filled with either artificial seawater at room temperature (for jellyfish), or
(4)(4)
(5)(5)
(6)(6)
npg
© 2
012
Nat
ure
Am
eric
a, In
c. A
ll rig
hts
rese
rved
.

nature biotechnology doi:10.1038/nbt.2269
with Tyrode’s solution maintained at 35 °C using a custom-made heated stage (for medusoids). Additionally, the medusoid tank was equipped with two U-shaped platinum electrodes to allow for electric field stimulation. The bath was seeded with neutrally buoyant, silver-coated, hollow glass spheres with a nominal diameter of 13 µm (Potters Industries Inc., Brownwood, TX 76801, USA). Particle illumination in the medusoid bath and the larger jel-lyfish tank was achieved using a green (532 nm) 5 mW laser pointer or a 300 mW hand-held laser (Laserglow Technologies, Ontario, Canada), respectively. The laser beam was diverged into a 1 mm-thick planar sheet by a plano-con-cave cylindrical lens with a focal length of −4 mm (Thorlabs, Newton, NJ 07860, USA) to illuminate a horizontal plane dissecting the vertically swim-ming specimens along their bell diameter (Supplementary Fig. 8a). A camera was installed perpendicular to the laser sheet. In the case of the jellyfish, the motions of the particles were recorded with a Sony HDR-SR12 camcorder (1,440 × 1,080 pixels, 30 frames per second; Sony Electronics, San Diego, CA 92127, USA; example recording: Supplementary Movie 5). In case of the medusoids, an A602f/fc Basler camera was used (656 × 491 pixels, 100 frames per second; Basler Vision Technologies Exton, PA 19341, USA; exam-ple recording: Supplementary Movie 5). The videos were processed with an in-house DPIV algorithm42. The DPIV interrogation window size was 32 × 32 pixels with 50–70% overlap (16 to 10 pixels step size). Velocity vectors were yielded from average particle displacement within each interrogation window (Supplementary Fig. 8b,c). Resultant velocity and vorticity fields (Supplementary Fig. 8d) were used to compare fluid transfer and vortex for-mation in medusoids and jellyfish (Fig. 4 and Supplementary Movies 6–8).
Propulsion/feeding performance analysis. Feeding performance was defined as the relative amount of fluid drawn toward the subumbrellar bell aperture (site of feeding) per recovery stroke. Briefly, in each DPIV image frame a refer-ence line was drawn to span the stopping vortex formed during the recovery stroke (Supplementary Fig. 8d), which approximates the diameter of subum-brellar bell aperture (site of feeding). The normal components of the velocity vectors across this reference line correspond to the velocity profile across the bell aperture at a given instant of time (Supplementary Fig. 8e). Flow toward the bell was defined to be positive. Flow velocities were nondimensionalized by multiplying with the total duration of the recovery stroke and dividing by bell diameter. Volumetric flux across the area of the subumbrellar bell aperture was estimated by assuming that the specimens were axisymmetric and integrating the velocity profile over a circular area.
Propulsion performance was defined as relative swimming speed expressed in units of body length per stroke. Here, body length denoted the bell height at maximal contraction. Propulsion performance was calculated from brightfield video recordings of free-swimming medusoids and jellyfish.
Kinematic analysis. Analysis of medusoid and jellyfish lobe kinematics was performed by tracking frame-to-frame displacement of lobe tips relative to the bell using ImageJ (US National Institutes of Health)43 and an in-house
MATLAB algorithm. Angular lobe velocity was expressed as function of time (Fig. 2a). For each lobe, relative stroke asymmetry was defined as the maximal lobe contraction velocity divided by maximal lobe relaxation velocity. Relative contraction asymmetry within each set of labeled lobes was expressed as the temporal variance in reaching maximal contraction velocity.
Statistical methods. Lobe kinematics and propulsion performance data did not follow a normal (or otherwise obvious) statistical distribution, and sample sizes were relatively small (in most cases n < 10). Therefore, nonparametrical methods were chosen for both data analysis and data representation (Figs. 2c,d and 4a). Briefly, the data sets are presented in a so-called box-plot diagram, which gives a graphical summary of the data distribution in a nonparametric form, that is, without making assumptions about an underlying statistical distribution. The box-plot summarizes each data set in five numbers: median (bull’s eye), 25th and 75th percentile (upper and lower edge of rectangle, respectively), and the smallest and the greatest observation (upper and lower end of whiskers, respectively). The Wilcoxon rank-sum test, synonymously called Mann–Whitney U test or Mann–Whitney–Wilcoxon (MWW) test, was employed for examining the sample sets pairwise for statistically significant differences in performance/kinematics. The P values are noted in the plots (Figs. 2c,d and 4a). Here, the P values denote the probability of obtaining two data distributions that are at least as different as the ones that were actually observed if the two sample sets were equal in their performances/kinematics (null hypothesis). Asterisks denote a statistically significant difference, that is, P < α = 0.05, where α is the significance level.
33. Fedorov, V.V. et al. Application of blebbistatin as an excitation-contraction uncoupler for electrophysiologic study of rat and rabbit hearts. Heart Rhythm 4, 619–626 (2007).
34. Bayly, P.V. et al. Estimation of conduction velocity vector fields from epicardial mapping data. IEEE Trans. Biomed. Eng. 45, 563–571 (1998).
35. Bray, M.-A., Sheehy, S.P. & Parker, K.K. Sarcomere alignment is regulated by myocyte shape. Cell Motil. Cytoskeleton 65, 641–651 (2008).
36. Hamley, I.W. Liquid crystals. in Introduction to Soft Matter: Synthetic and Biological Self-Assembling Materials, pp. 221–273 (John Wiley & Sons, 2007) ⟨http://onlinelibrary.wiley.com/doi/10.1002/9780470517338.ch5/summary⟩.
37. Umeno, A. & Ueno, S. Quantitative analysis of adherent cell orientation influenced by strong magnetic fields. IEEE Trans. Nanobioscience 2, 26–28 (2003).
38. Satheesh, V.K., Chhabra, R.P. & Eswaran, V. Steady incompressible fluid flow over a bundle of cylinders at moderate Reynolds numbers. Can. J. Chem. Eng. 77, 978–987 (1999).
39. Masliyah, J.H. & Epstein, N. Steady symmetric flow past elliptical cylinders. Ind. Eng. Chem. Fundam. 10, 293–299 (1971).
40. Halliday, D., Resnick, R. & Walker, J. Fundamentals of Physics (John Wiley and Sons, 2010).
41. Adrian, R.J. Particle-imaging techniques for experimental fluid mechanics. Annu. Rev. Fluid Mech. 23, 261–304 (1991).
42. Willert, C.E. & Gharib, M. Digital particle image velocimetry. Exp. Fluids 10, 181–193 (1991).
43. Abramoff, M., Magelhaes, P. & Ram, S. Image processing with ImageJ. Biophotonics Int. 11, 36–42 (2004).
npg
© 2
012
Nat
ure
Am
eric
a, In
c. A
ll rig
hts
rese
rved
.