Embed Size (px)
Citation preview
A TOOL FOR DETERMINATION FINITE SEISMIC SOURCE PARAMETERS VIA STOPPING PHASES METHOD
P. Kolář
Institute of Geophysics, Czech Acad. of Sci. of Czech Rep.
Abstract
We present a special (interactive) tool for particular processing of seismograms from West Bohemia region. The purpose of the data investigation is to determine the parameter of (simplified) seismic source. There are given basic information about the seismic region, its activity, about the used method and about its particular realization. The developed tool is described including screen shots of the graphical interfaces.
1 Background and motivation
West Bohemia region is definitely the most seismo-active region on the territory of Czech Republic. This fact has been recently confirmed by a seismic swarm which lasted from August 23th till the end of September 2011 year – see Fig. 1a,b. The seismic activity is one of the features of geodynamics processes which performed in this region. The West Bohemia seismic activity is not manifested by occurrence of singe events, but the individual events are clustered in so named seismic swarms. Such type of seismic activity is known also in other regions (e.g. Iceland, Sultz in France, north Italy), but it has been firstly investigated just in West Bohemia region in 19th century.
The swarm activity can be traces back to middle ages, however instrumental observation can be dated to beginning of 20th century. Local network of (analogues) seismic station was build up on Germany part of the region in 1962. The modern, i.e. digital, observations were started during pronounced seismic swarm which occurred in 1985/86. At that time it was established WEBNET (Horálek et al., 2000) - a network of digital seismic stations. The WEBNET network continuously operates; of course during the time it was enlarged (up to contemporary number of about 20 stations), the equipment is permanently modernized, the network shape was tuned to optimum. Data transfer from selected stations is now continuous and on-line.
At the beginning of digital seismic observations, the main effort was concentrated on basic data processing, e.g. routine pre-processing, event identification, location, magnitude determination. Lately, the investigated tasks were enlarged to time-spatial distribution study, seismic source mechanism determination of larger events (at the beginning only double couple model was considered, lately full 6 component seismic moment tensor were determined). Together with these tasks there were performed also some structural studies. During approximately last decade, such studies become a little bit routine (even if still they are of significant importance and by far not all the problems has been solved yet) and it has arisen a highly specialized studies, as e.g. determination parameters of a finite source mode. This is also the case of our study.
The observed data are permanently subject of various studies – see e.g. Stud. Geophys. et Geod., (2000, 2008 and 2009). Actual information about the West Bohemia activity can be found on wwwWEBNET (2011a,b).
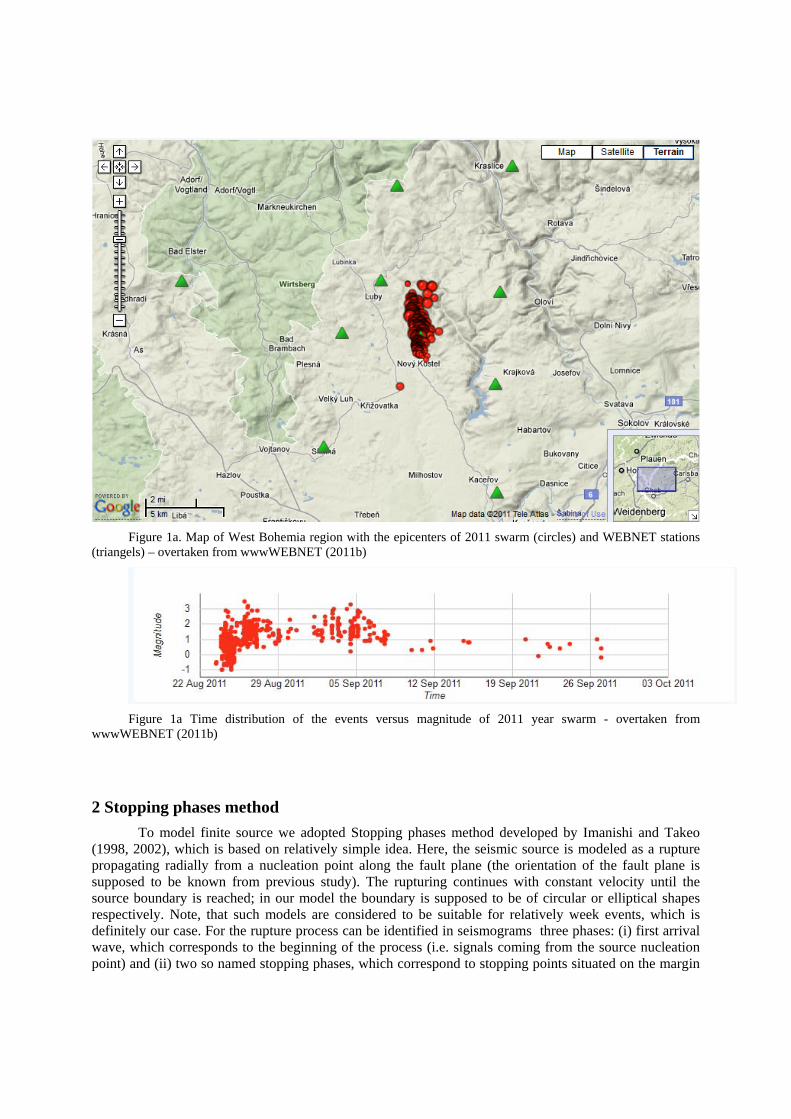
Figure 1a. Map of West Bohemia region with the epicenters of 2011 swarm (circles) and WEBNET stations
(triangels) – overtaken from wwwWEBNET (2011b)
Figure 1a Time distribution of the events versus magnitude of 2011 year swarm - overtaken from
wwwWEBNET (2011b)
2 Stopping phases method
To model finite source we adopted Stopping phases method developed by Imanishi and Takeo (1998, 2002), which is based on relatively simple idea. Here, the seismic source is modeled as a rupture propagating radially from a nucleation point along the fault plane (the orientation of the fault plane is supposed to be known from previous study). The rupturing continues with constant velocity until the source boundary is reached; in our model the boundary is supposed to be of circular or elliptical shapes respectively. Note, that such models are considered to be suitable for relatively week events, which is definitely our case. For the rupture process can be identified in seismograms three phases: (i) first arrival wave, which corresponds to the beginning of the process (i.e. signals coming from the source nucleation point) and (ii) two so named stopping phases, which correspond to stopping points situated on the margin
of ruptured area. In a figurative way, the stopping phases can be understand as a changes in the course of observed displacement produced by finite source. When the rupture process reach the source boundary and fade in a particular direction, such a change results in a change of slope of displacement pulse, which can be (in twice differentiate displacement signal, i.e. in accelerogram) interpreted as a stopping phase. Or in another words (figurative way proposed Imanishi and Takeo) the source radiation can be reduced into three points, while the signals from all other point are mutually destroyed by deconstructive interference. Imanishi and Takeo (1998, 2002), derived stopping phases theory and methodology for their identification – see also Appendix.
The two stopping phases are in mutual relation as a pulse and its Hilbert transform, which is also the criterion for their identification. The time lags between these phases depend on source size, geometrical orientation of the finite source and also on the source-to-station path. Therefore first we have to search for the stopping phases in seismograms. The time delays between onset and these two stopping phases represent the input data, which are subject of inversion. .
3 Data processing
While the above mentioned inversion is contemporary more or less routine process, the stopping phases identification it has appeared to be crucial. As soon as we started process real data it has appeared same features. We try to determine finite seismic source for selected events from West Bohemia seismic area from 2000 year and lately also from 2008 year (such a detail study as it is in our case, it is necessary delay for same time, as it is necessary to wait for results from others previous data processing). The processed data are partly low indexed and the signals suffer from partial disturbances (which origin is known only partly), that the stopping phases positions definitely cannot be determined automatically. Soon after the starting the study, it has appeared that all the picked stopping phases positions have to be checked and in necessary corrected interactively. To be able to do such interpretation effectively we have developed an interactive tool (created on MATLAB platform) which is briefly described in the next section.
4 Interactive tool realization
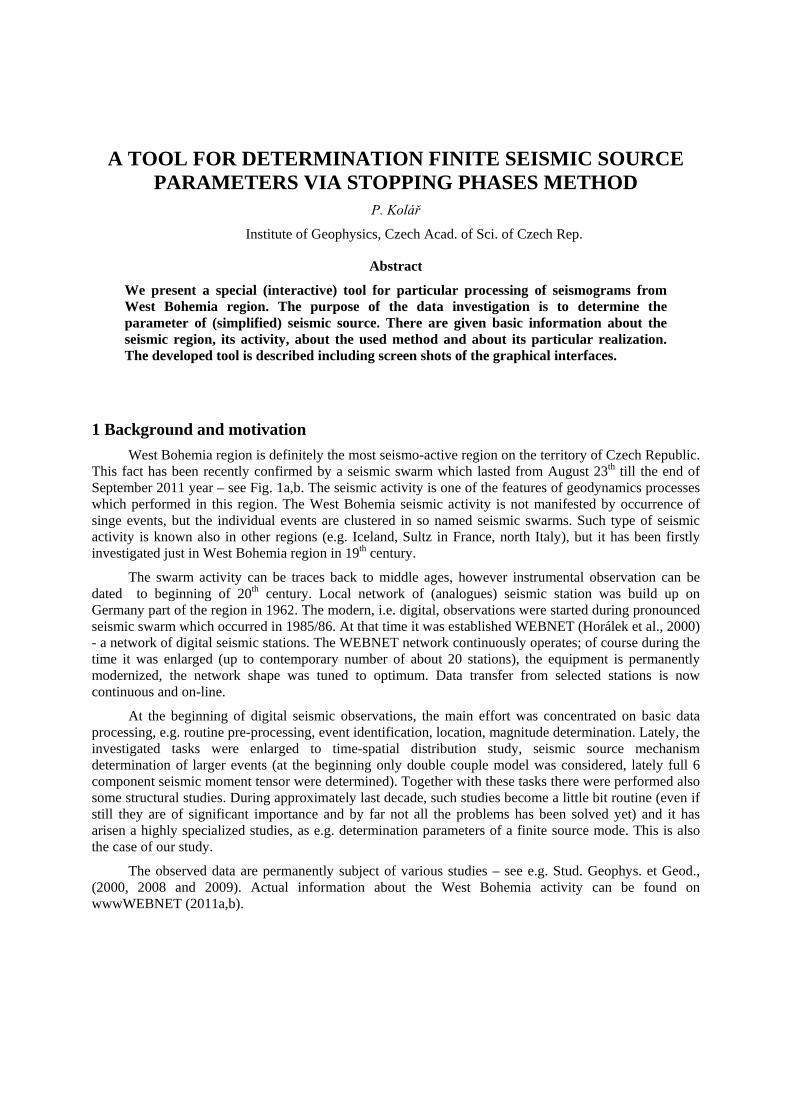
To handle the exploited data in an effective way we have developed unique Tool for determination finite seismic source parameters via Stopping phase method. The code was written on MATLAB platform. In the Fig. 2 there is a screen shot of the tool main window, its basic features are given below:
Main control window - header
In the upper part there is a header, which displays principal information about the processed event, namely event identification, location, magnitude, source mechanism (all this data are taken form prearranged tables). Further there are displayed results of the two last inversion attempts (to be able to compare their results) and some control buttons are present.
Main control window - display area
Below, there are displayed individual records of processed event. There are 3 vertical columns:
o Left column - seismograms
On the left there are plotted seismograms (transversal component of acceleration, its Hilbert transform and Hilbert transform multiplied by -1; all these signal are used to calculate mutual correlation
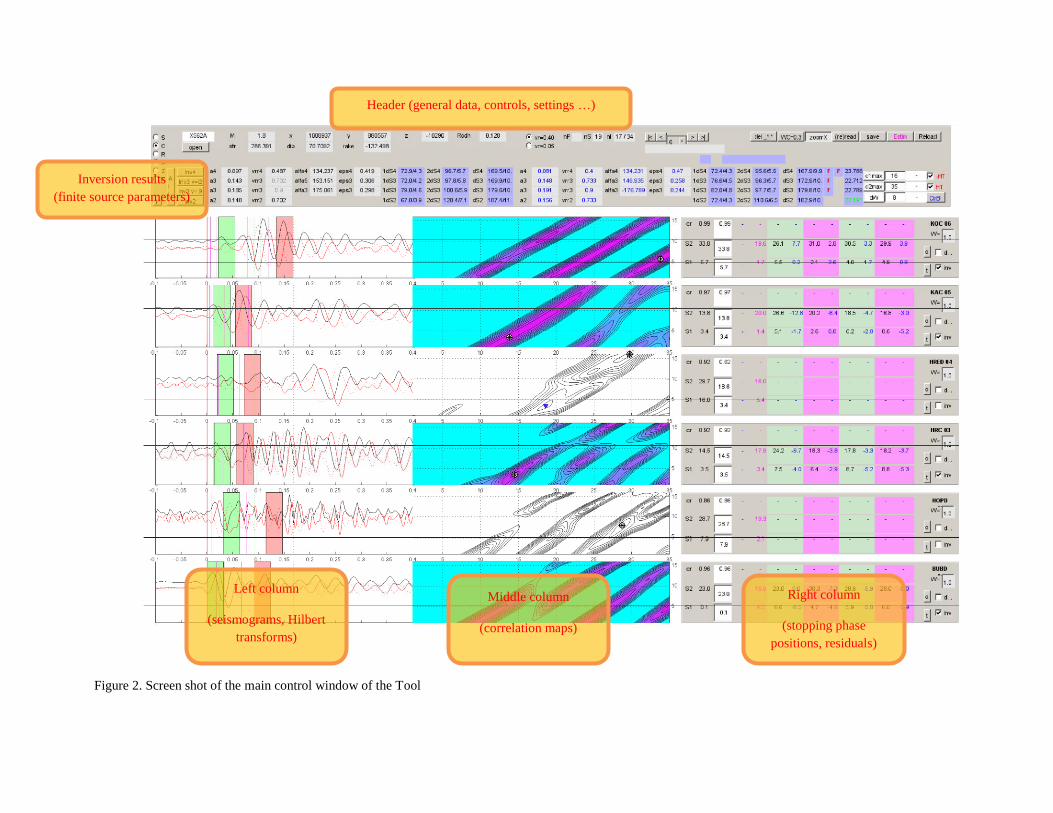
Figure 2. Screen shot of the main control window of the Tool
Header (general data, controls, settings …)
Left column
(seismograms, Hilbert
transforms)
Middle column
(correlation maps)
Right column
(stopping phase
positions, residuals)
Inversion results
(finite source parameters)
to determine stopping phases), the positions of interpreted stopping phases as well as seismic wave onset are marked.
o Middle column: correlation maps
In the middle column there are correlation maps. These maps are main mean for stopping phases identification: the stopping phases are defined as a point with highest mutual correlation. Unfortunately, the processed signal waveform are not simple enough and the point with maximal correlation does not necessary corresponds to the stopping phases. Therefore we check every automatic interpretation and if the stopping phase position appeared to be unrealistic and simultaneously there is a pronounced local maximum close to the expected stopping phases position, we prefer this interpretation as the more probable. Note, that such approach is also mention by the stopping phases method – see Imanishi and Takeo (1998, 2002). Note also that the origin of false correlation is not exactly known – probably it is some reflection of the signal on the subtle medium structure (which is not yet known in details).
o Right column: numbers
In the right column there are displayed values of stopping phases interpretation, inversions result, inversion residua and some control buttons. There are displayed the values of original (automatic) interpretation, their corrections if available and the various inversion result and their residua – see below.
In addition the tool enables to set length of interval of correlation, weight individual records and switched on/off particular record from the calculation. The number of records displayed can be changed to enable clear visibility of the investigated event; in the case of extend number of seismogram the plots are swapped.
-905 -900 -895 -890 -885 -880 -875 -870 -865-1030
-1025
-1020
-1015
-1010
-1005
-1000
-995
-990
-985
BUBD
HOPD
HRC
HRED
KAC
KOC
KOPD
KRC
LBC LOUD
NKCPLED
POC
POLD SKC
SNED
TRC
VAC
ZHC
LAC
STC
OLV
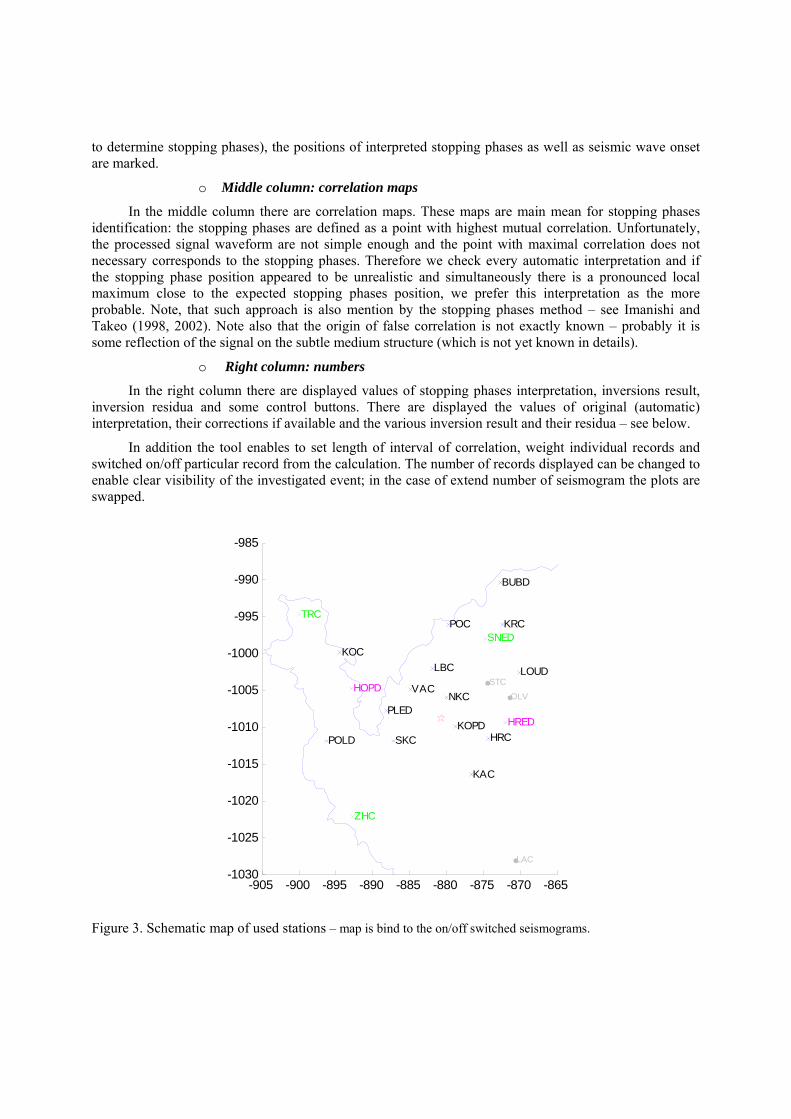
Figure 3. Schematic map of used stations – map is bind to the on/off switched seismograms.
Secondary window - map
At the separate window (see fig. 3), there is a separate map of the region with marked event epicenter, considered stations; the stations included/not included into inversion process are marked by different colors
5 Performed inversion(s)
Stopping phases position interpreted (either automatically or interactively) are input data to the inversion. The data are piped into independent inversion code and the inversion is run. Then the inversion results are read and displayed in form of particular values as well as in a graphical form. We use BRST inversion designed by Boender et al., (1982) and Czendes, (1988), wwwBRST (2011). The inversion evaluation is relatively fast, so it appears to the user as semi-interactive.
During the inversion we are seeking for values of two, three and four parameters. The considered circular seismic source is described by two parameters (namely source radius and rupture velocity). The elliptical source by four parameters (namely by principal axes, eccentricity, rupture velocity and ellipse orientation on the fault plane). As the rupture velocity and the source size showed sometimes coupling, we perform also inversion with fix value of rupture velocity. We display simultaneously results of the inversion and of the previous one. This enables effective comparison of different combination of input data sets.
Note that results of inversion confirm theoretical relation
r=30*10(0.35 Ml) (1)
which bound even magnitude and its radius derived (Fischer and Horálek, 2005).
6 Conclusions
The developed code appears to be an effective tool for (sometime low indexed) data processing. The code is subject of continuous development and improvements. The exploited method is rather particular in its orientation, nevertheless observation indicates that the correlation can be useful for identification of other phases in seismograms which potentially open a way for detailed interpretation of subtle medium structure.
Acknowledgement
Presentation of this work is supported by grant: P210/10/1728 of the Grant Agency of the Czech Republic (Z. Jechumtálová).
References
Boender, C.G.E., Rinnooy Kan, A.H.G. and Timmer, G.T.: 1982, A Stochastic method for global optimalisation, Mathematical programming, 22, 125 – 140.
Csendes, T.: 1988, Nonlinear parameter estimation by global optimization – Efficiency and reliability, Acta Cybernetica, VIII/4, 361 – 370.
Horálek, J., Fischer, T., Boušková, A., and Jedlička, P.: 2000, The Western Bohemia/Vogtland Region in the Light of the Webnet Network, Studia Geophys. et Geodet., 44, 2, 107 – 125.
Imanishi, K. and Takeo, M.: 1998, Estimates of fault dimensions for small earthquakes using stopping phases, Geophys. J. Let., 25, 15, pp. 287-2900.
Imanishi, K. and Takeo, M.: 2002, An inversion method to analyze rupture process of small earthquakes using stopping phases, J. Geophys. Res., 107, B3.
Studia Geohpysica et Geodetica: 2000, (special issue devotes to West Bohemia topics): 44, 2 – 3.
Studia Geohpysica et Geodetica: 2008, (special issue devotes to West Bohemia topics – Part 1): 52, 4.
Studia Geohpysica et Geodetica: 2009, (special issue devotes to West Bohemia topics – Part 2): 53, 3.
wwwBRST: 2011, http://en.wikipedia.org/wiki/BRST_algorithm access: 12 Jan 2011.
wwwWEBNET: 2011a, http://www.ig.cas.cz/en/structure/observatories/west-bohemia-seismic-network-webnet/ access: 15 Oct 2011.
wwwWEBNET: 2011b, http://www.ig.cas.cz/en/structure/observatories/webnet/map-of-epicenters/ access: 15 Oct 2011.
Appendix: HOW and WHERE are Stopping phases generated
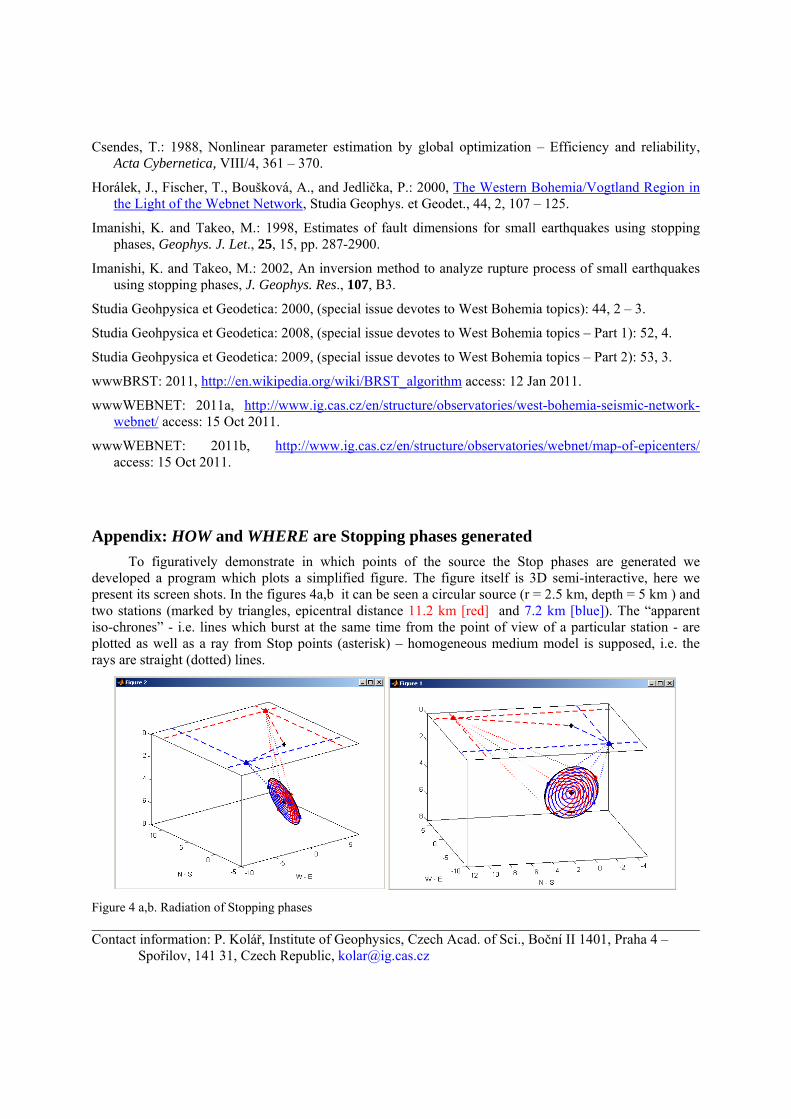
To figuratively demonstrate in which points of the source the Stop phases are generated we developed a program which plots a simplified figure. The figure itself is 3D semi-interactive, here we present its screen shots. In the figures 4a,b it can be seen a circular source (r = 2.5 km, depth = 5 km ) and two stations (marked by triangles, epicentral distance 11.2 km [red] and 7.2 km [blue]). The “apparent iso-chrones” - i.e. lines which burst at the same time from the point of view of a particular station - are plotted as well as a ray from Stop points (asterisk) – homogeneous medium model is supposed, i.e. the rays are straight (dotted) lines.
Figure 4 a,b. Radiation of Stopping phases
Contact information: P. Kolář, Institute of Geophysics, Czech Acad. of Sci., Boční II 1401, Praha 4 –
Spořilov, 141 31, Czech Republic, [email protected]