Embed Size (px)
Citation preview
1
A Tour of the World Economy:
Global, Regional and Local Risks and
Opportunities
Dr Florian Kohlbacher
Director, North Asia
Economist Corporate Network
7 September 2016

2
Agenda
1) Global Context
2) Regional Context
3) Local Context

3
Global Context

4
Global economy – key points for 2016
• The new normal
Lower for longer: oil and commodity prices
Lower for longer: interest rates
Lower for longer: economic growth
• Tour of the world
US: Trump presidency? US consumers powering the global economy
Europe: Brexit and immigration policy; European project in reverse?
China: smooth landing not possible; choice is bumpy or hard landing
• Bright spots
India: fastest growing large economy
Iran: rejoins global economy

5
Global context
2.1% 2.4%
Brexit Vote
Slowdown in the US

6
Global context
2016 will be the fifth
consecutive year in
which global growth is
below its long-term
average of 3.7%

7
Emerging Asia the growth hotspot – again – in 2016
-0.52.3
2.0
1.6
5.8
2.5
2.0
7.14.4
-1.3
0.5
Real GDP growth, %
Policymaking once again key(-) BR, ZA, NG, RU (+) IN, VN, IR, AR
Global growth

8
Global growth

9
Asia outperforms RoW

10
Poll of Forecasters

11
Risks to the global economy

12
Stagnant living
standards?
Political risk: on the rise
Is there a pattern to the latest surge?
Anti-establishment Long running
disputes

13
0
10
20
30
40
50
60
70
80
0 10 20 30 40 50 60 70 80 90 100
Cu
mu
lati
ve
gro
wth
ra
te (
%)
of
rea
l P
PP
in
co
me
Percentile of global income distribution
Winners and losers of globalisation
Global growth incidence curve (1988 – 2008)
Source: Branko Milanovic
Very poorest
locked out of
growth
Fast income
growth in EMs
(mainly China)
Global elite: rich
get richer!
Stagnating incomes
for middle class in
rich countries

14
Trans Pacific Partnership: mission impossible?
Chance of US ratifying the key policy of Obama’s Asia pivot has fallen to 30%
“The Trans-Pacific Partnership, which has some serious flaws, will not be acted
upon this year.” – Mitch McConnell, US Senate majority leader
Source: Peterson Institute for International Economics

15
Monetary policy in a new normal
Central banks are unprepared for the next recession
Policy options
Quantitative easing ✓Forward guidance ✓
Negative interest rates ?
Higher inflation target ?
Target nominal GDP ?
Helicopter money ?
0
2
4
6
8
10
12
14
1983 1988 1993 1998 2003 2008 2013
US federal funds rate (%) “ I know you think
you understand
what you thought
I said but I'm not
sure you realise
that what you
heard is not what
I meant”
Source: The Economist Intelligence Unit

16
The oil price will rise, but not by much
High stocks and higher OPEC production will prevent a surge in oil price
Source: The Economist Intelligence Unit
-0.5%
0.0%
0.5%
1.0%
1.5%
2.0%
2.5%
3.0%
3.5%
2013 2014 2015 2016 2017 2018 2019 2020
Production growth Consumption growth

17
Since the financial crisis,
shipping has suffered from the
global trade slowdown, plus too
much shipbuilding and not
enough scrapping.
The Baltic Dry index, a measure
of freight rates, has plummeted
by more than 90% since 2008.
Container lines might lose $10
billion this year (according to
consultancy Drewry)
Maersk, the world’s largest
shipping firm, may break itself
up to stay sea-worthy
That sinking feeling: shipping in crisis

18
Trade, a secular decline
Global trade having its worst year since 2009, but will improve modestly in 2017
-20
-15
-10
-5
0
5
10
15
20
2009m01 2010m01 2011m01 2012m01 2013m01 2014m01 2015m01 2016m01
Global merchandise trade (% change yoy)
Volume terms Value terms
0
4
8
12
16
1991 1996 2001 2006 2011 2016
Share of global trade (%)
China Germany Japan US

19
Where is the growth?
Higher commodity prices will support Emerging Markets in 2017
-4
-2
0
2
4
6
8
10
Ind
ia
Chin
a
AS
EA
N
Sou
th K
ore
a
Mid
dle
Ea
st
Latin
Am
eri
ca
Russia
US
Euro
zo
ne
Ja
pa
n
Glo
ba
l
2015 2016 2017
Source: The Economist Intelligence Unit
Real GDP growth; % change, year on year

20
A four decade slump in productivity
Are our best inventions behind us?

21
Long term forecast to 2050
The rise of Asia
Regional share of the global economy
Real GDP growth; % change, year on year

2222
China was going to overtake the US in 2026: now 2033
Green = Lower rank since Nov 2015, Red = Higher rank, Grey = same rank
Nominal GDP, US$ trn.
0
5
10
15
20
25
30
35
TH, MY, PO
drop out
Source: The Economist Intelligence Unit.
World’s largest economies in 2030

23
Regional outlooks: US, Europe, Asia

24
US election: the unpopularity contest
Two of the most disliked presidential candidates in history

25
We forecast Clinton presidency, Democratic Senate, Republican House
US election: the unpopularity contest

26
US economy
1.6%

27
US: a two-speed economy
Consumers are driving the economy, as firms fail to invest
-4.0
-3.0
-2.0
-1.0
0.0
1.0
2.0
3.0
4.0
5.0
2015 Q1 2015 Q2 2015 Q3 2015 Q4 2016 Q1 2016 Q2
(%)
Consumer spending Business investment Real GDP
Source: Bureau of Labor Statistics

28
US: a turning point
Workers are gaining power, at the expense of corporations

29
European Union

30
EU: growth and the ECB
The EU should grow by 1.6% in
2016
ECB pushing hard on stimulus
・Aim to encourage banks to lend to
companies
・Deposit rate cut from -0.3% to -0.4%;
policy rate cut to zero
・Investment grade non-bank corporate
debt added to QE programme
・Impact limited by demand side
constraints and strong euro
・Political climate means ECB getting
little assistance from governments or
investment
-0.2 0.8 1.8
2015
2016
2017
Contribution to GDP growth (%)
Cons Govt Inv External

31
Brexit: profound consequences for UK and Europe
Brexit will have damaging political
and economic consequences
UK recession in 2017
Euro zone annual real GDP growth
forecast for 2016-20 trimmed by 0.2
percentage points
Contagion: boost for anti-establishment
and anti-EU parties across Europe
EU referendums in other countries—
Netherlands and France–could trigger
euro zone crisis
Scotland independence, united Ireland?

32
Europe: on the brink?
Italy is the next pressure point

33
China: another two-speed economy

34
China: slowing industries
Source: The Economist

35
China: difficulties ahead
36
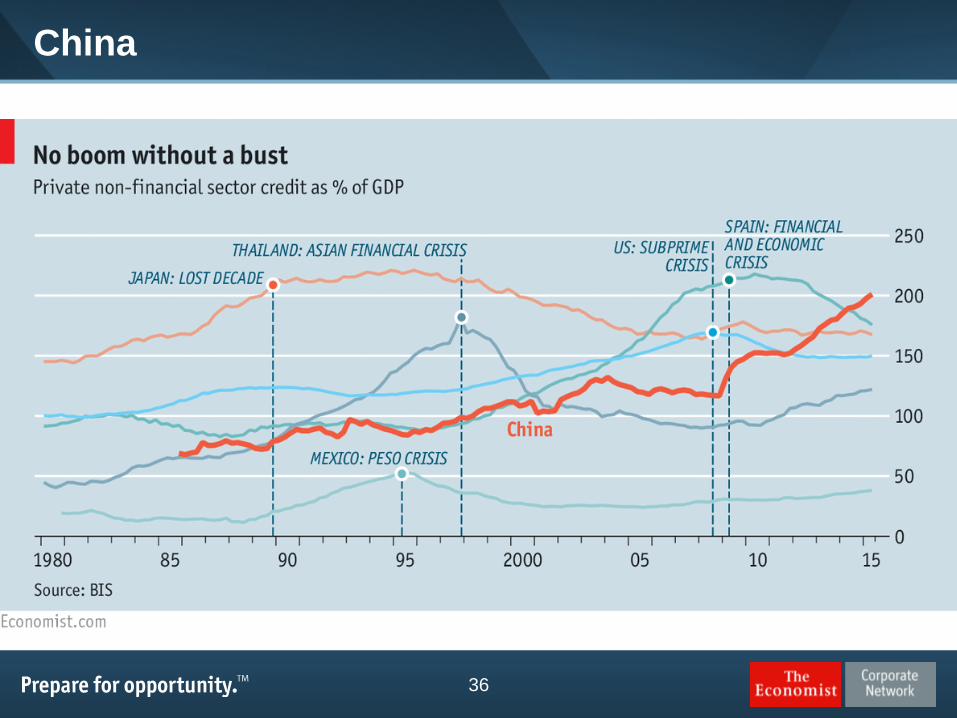
China
37
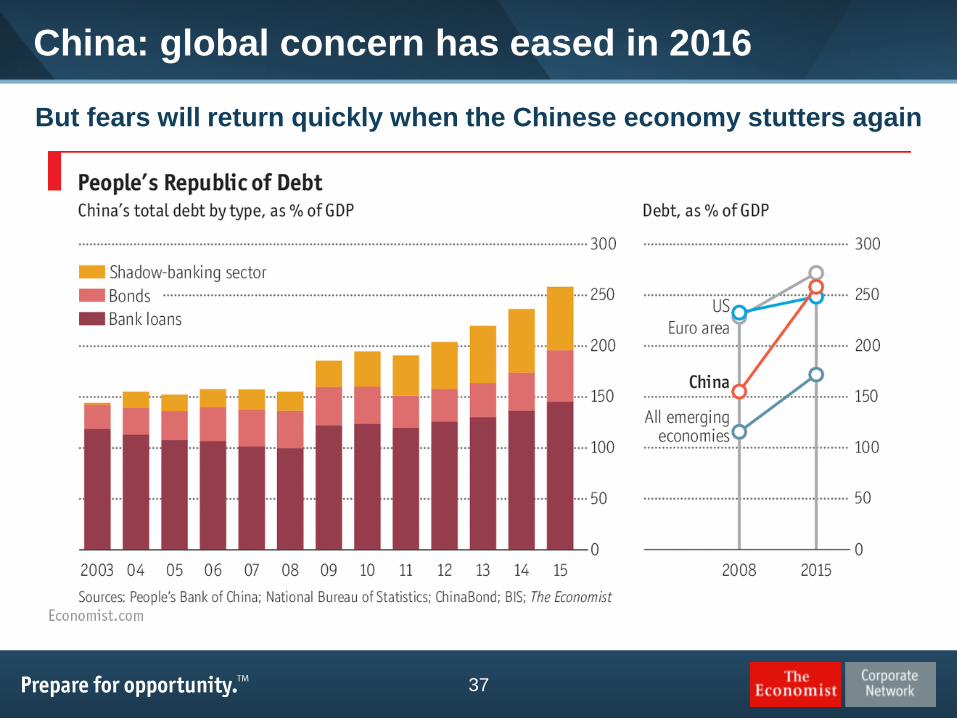
China: global concern has eased in 2016
But fears will return quickly when the Chinese economy stutters again

38
Hard landing in China is major global risk
• We think there is a 40% risk of a China
hard landing (defined as 2ppt
deceleration in real GDP growth)
• Triggers? Banking crisis, housing crash
or slump in private investment
• Housing bubble? Property sales value
up by 40% in January-Jul over the
year-earlier period
• Debt now at dizzying levels; domestic
credit growing 3.2 x faster than nominal
GDP
We forecast real GDP growth of 6.6% in 2016, slowing to 4.2% in 2020

39
India: catching up?
0
2
4
6
8
10
12
14
16
1990 1995 2000 2005 2010 2015 2020
Economic growth (%)
China India
Forecast

4040
• India has overtaken China as the fastest growing large emerging market
• Source: The Economist Intelligence Unit.
0
2
4
6
8
10
12
14
16
1990 1995 2000 2005 2010 2015 2020
Economic growth (%)
China India
Forecast
India: catching up?

41
India – macroeconomic trends
Real GDP growth will average 7.3% a year in
2016/17 – 2020/21, well below its potential・Constrained by overcapacity in some industrial
sectors, infrastructure bottlenecks, shortages of labor
in key sectors and the difficulties in shifting resources
to higher-productivity manufacturing. Bankruptcy
reform legislation (expected to be passed this year)
will free up distressed assets and improve capital
allocation. Services sector will still lead output basis.
Nationwide GST unifies India’s 29 states into
a single market・Expect huge efficiency savings for business,
greater competitiveness for local firms, a wider tax
base, and less administrative burden.
.

42
Japan: Abenomics

43
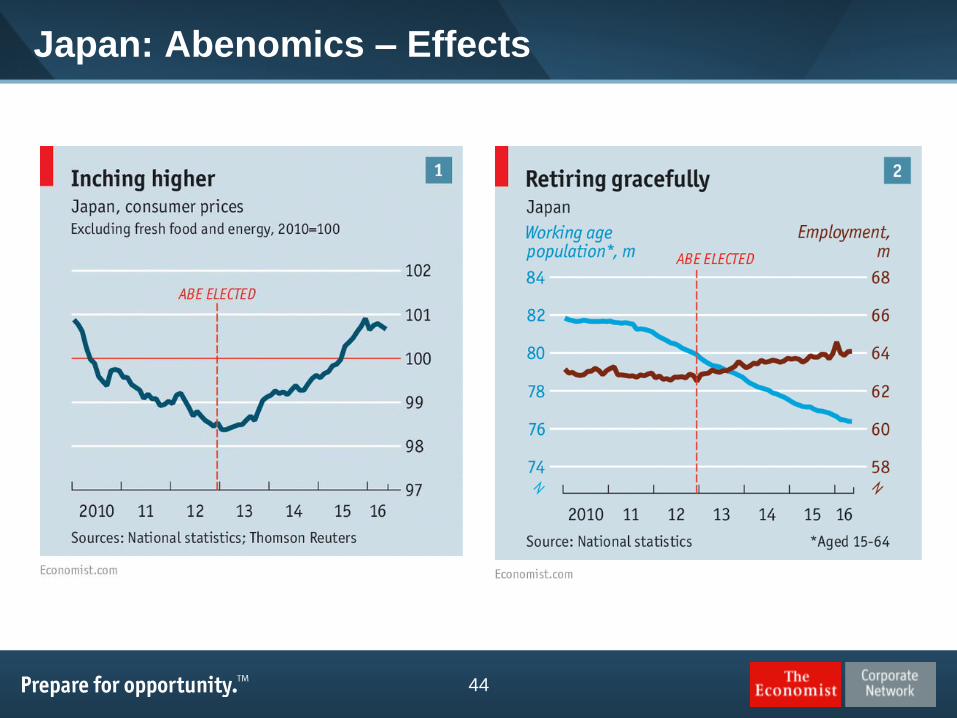
Japan: running to a stand still
• Growth in nominal yen terms has been stronger
• Falling population means falling real GDP may become the norm
Per capita growth looks better
• Abenomics not a long-term solution
Monetary and fiscal √
Structural reform X
44
Japan: Abenomics – Effects

45
-0.5
0.0
0.5
1.0
1.5
2.0
2.5
20
11
20
12
20
13
20
14
20
15
20
16
20
17
20
18
20
19
20
20
Real GDP (% change)
-0.5
0.0
0.5
1.0
1.5
2.0
2.5
3.0
20
11
20
12
20
13
20
14
20
15
20
16
20
17
20
18
20
19
20
20
BOJ’s inflation
target
Govt’s target
growth rateAbe in office
Consumption
tax rate hike
2nd consumption
tax hike (Oct ‘19);
Tokyo Olympics
Consumer prices (% change)
We forecast GDP growth of 0.4% in 2016, and avg of 0.3% in 2017-20
Japan: Abenomics is not succeeding

46
Japan: macroeconomic trends
Expected growth of economy is 0.4% this year, compared with
previous forecast of 0.8%.
・Economy predicted to fail in picking up significant momentum in 2017-2020, but
Olympic Games in 2020 will help boost consumer and business confidence.
Demographic factors will be main constraint on potential GDP
growth in the forecast period.
・Population and workforce to contract steadily, acting to crimp consumption and
investment. Promised structural reforms will proceed haltingly, and TPP benefits
for Japan’s external sector will show only after 2020.
Fiscal stimulus not as powerful as it looks
・Only around a quarter of the headline figure of \28tn constitutes new spending,
and that will be spread over two years.

47
ASEAN: growth led by CLMV
• CLMV countries to grow rapidly – but
from a low base
• Philippines will remain the fastest
growing ASEAN-6 economy, although
we lowered our forecast because of
the election result
• Indonesia’s growth will pick up
because of improvements to
business environment and
government infrastructure investment
• Thailand still struggling and growth
will be below potential
• Region set to benefit as China, Japan
& India seek to gain influence
0
2
4
6
8
10
Myanm
ar
Laos
Cam
bodia
Vie
tnam
Phili
ppin
es
Indonesia
Mala
ysia
Thaila
nd
Sin
gapore
Bru
nei
Economic growth in ASEAN, 2016-20
(% real change pa; avg)
Source: The Economist Intelligence Unit.

48
ASEAN: China’s slowdown

49
ASEAN: rising incomes and consumption
0
2,000
4,000
6,000
8,000
10,000
12,000
14,000
16,000
2016
2020
GDP per head (US$)
52,150
66,280
0
1,000
2,000
3,000
4,000
5,000
6,000
7,000
8,000
9,000
10,000 2016
2020
Private consumption per head (US$)
19,910
25,590
Source: Economist Intelligence Unit

50
ASEAN: expanding middle and upper classes
Source: Economist Intelligence Unit

51
ASEAN: Political challenges
For how long can the
army hold the peace?
Jokowi struggles to
remain popular
Conflicts with China
Najib clings on but
investors are spooked
Much-needed reforms,
fragile institutions
Rodrigo Duterte’s war
on drugs

52
Regional outlook:
Economic integration in Asia

53
The innovation imperative

54
The innovation imperative

55
Asia’s infrastructure imperative
56
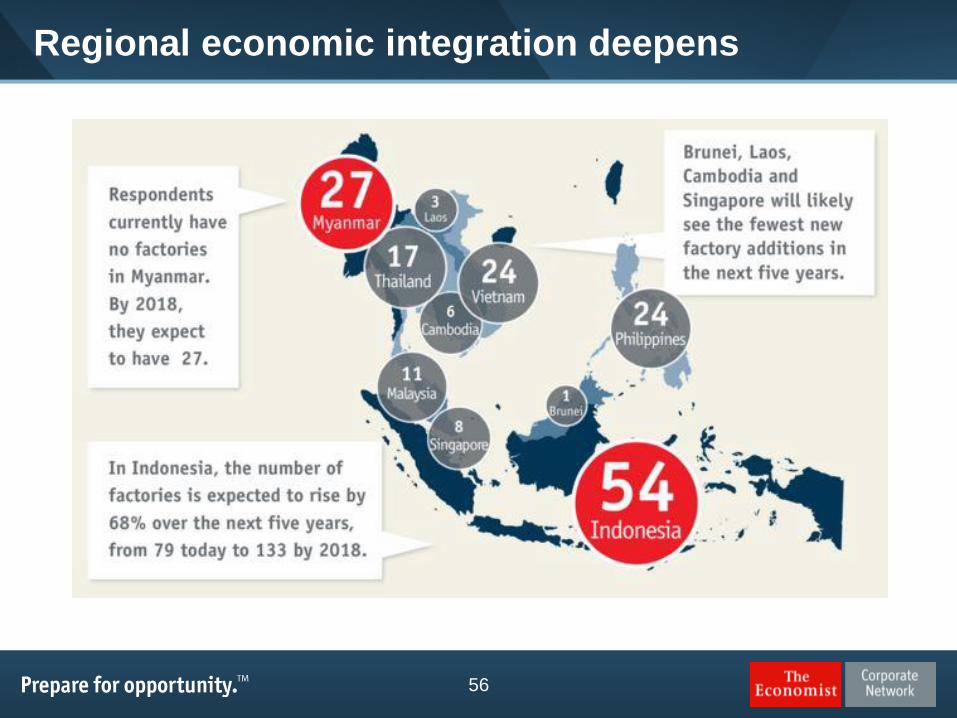
Regional economic integration deepens
57
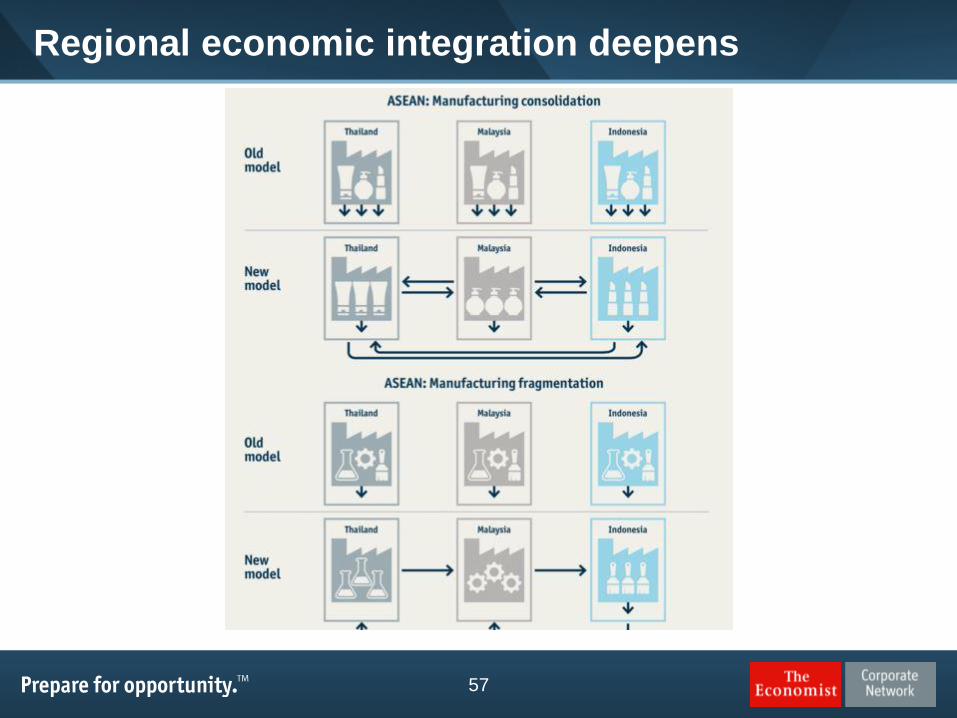
Regional economic integration deepens

58
Regional economic integration deepens

59
• Annual survey of business
expectations in Asia for
the year ahead
What are you expecting for
your company’s Asia sales
performance in 2016 relative
to 2015?
• South-east Asia ranks 2nd
(after India) in terms of
sales growth expectations
Source: The Economist Intelligence Unit
Asia Business Outlook Survey 2016: sales expectations

60
• Most positive factors: economic growth (2nd in survey), technology (3rd)
• Most negative factors: currency, competition Source: The Economist Intelligence Unit
Asia Business Outlook Survey 2016: Profitability factors in SEA

61
Asia Business Outlook Survey 2016: Profitability factors in Japan
• Most positive factor: technology
• Most negative factors: currency, competition Source: The Economist Intelligence Unit

62
Longer term positives: Major trade deals ahead
• RCEP: Links ASEAN economies with major Asian economies
Pop. of 3.5 billion; 32% of world exports, 4.58% avg. GDP growth (2016-2020)
Championed by China
• TPP: Links Asian economies to Americas
32% of world GDP
Championed by the US

63
Longer term positives: Major trade deals ahead

64
Longer term positives: Major trade deals ahead

65
Longer term positives: “one belt, one road”

66
Longer term positives: “one belt, one road”

67
Longer term positives: “one belt, one road”

68
Regional economic integration deepens

69
Local outlook: Korea

70
Korea: Political risk

71
South Korea: GDP
• Sluggish GDP growth
• Conforming to the New Normal?
• EIU forecast: GDP to grow by an
average of 2.5% a year in 2016-
20

72
South Korea: GDP growth

73
South Korea: GDP per capita
• GDP per Capita is at 84%
of Japan and the gap is
closing
• Will exceed US$ 30,000 by
2022

74
South Korea: consumer prices
• Slowly rising consumer
prices
• “Inflation Report” by BoK
• Inflation target 2016: 1.4%
• Inflation target 2017: 2%
• EIU: Inflation to average
0.8% in 2016 but will
accelerate to an average
annual rate of 1.8% in
2017-18

75
South Korea: household debt
• Household debt is increasing at an
alarming rate
Total debt: KRW 1,200 trillion.
• Low interest rate leads to
excessive loan of household

76
South Korea: Foreign Direct Investment
• FDI has decreased in recent
years so the government is
implementing new set of policies
Reduced corporate taxes
New system to better protect
intellectual property rights
Shorter process of establishing
an industrial complex
Maximum amount of foreign
capital that can be lent or
borrowed without the need to
report the transaction has been
increased
International financial reporting
standards have been adopted

77
South Korea: the Won
• Bank of Korea tries to keep the
Won low for price
competitiveness over other
export-oriented economies
• EIU: won to weaken from an
estimated average value of
W1,168:US$1 in 2016 to
W1,238:US$1 in 2020

78
South Korea: Women in the economy

79
South Korea: Aging population & low birthrate
• Birth rate in 2014: 1.25 (Unit: Number of births per woman)
Failure in policy to support working women

80
Finally

81
Five big questions for 2016
1. Will the oil price reach a bottom?
Yes, but price rises will be gradual
2. Will the US elect Donald Trump as president?
Probably not, but risk rises if there is a recession or terrorist attack
3. Can the EU survive the migration crisis and Brexit vote?
Yes, but “ever closer union” is over for now
4. Can China meet its ambitious growth targets?
No, but slower growth reduces risk of hard landing
5. Will weak currencies and low commodity prices crush EMs?
No, but most will struggle. Gradual improvement from 2017 onwards

82
Q&A
Anti-establishment Long running
disputes
Stagnant living
standards?
The return of political risk