Embed Size (px)
Citation preview
A TRANSFORMING DEAL: A TRANSFORMING DEAL: THE ACQUISITION OF AALBORG PORTLAND & UNICONTHE ACQUISITION OF AALBORG PORTLAND & UNICON
ROADSHOW NOVROADSHOW NOV--DEC 2004DEC 2004

2
TRANSACTION OVERVIEWTRANSACTION OVERVIEW
3
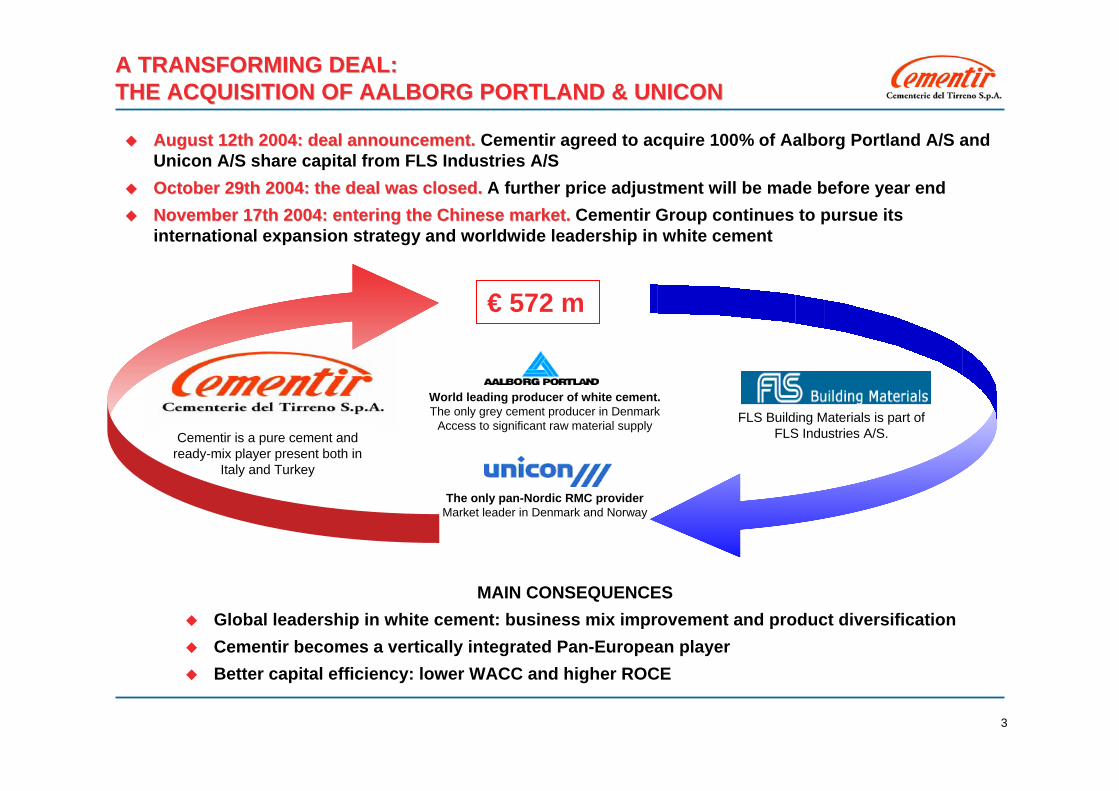
A TRANSFORMING DEAL: A TRANSFORMING DEAL: THE ACQUISITION OF AALBORG PORTLAND & UNICONTHE ACQUISITION OF AALBORG PORTLAND & UNICON
World leading producer of white cement.The only grey cement producer in Denmark
Access to significant raw material supply
The only pan-Nordic RMC providerMarket leader in Denmark and Norway
FLS Building Materials is part of FLS Industries A/S. Cementir is a pure cement and
ready-mix player present both in Italy and Turkey
€ 572 m
August 12th 2004: deal announcement.August 12th 2004: deal announcement. Cementir agreed to acquire 100% of Aalborg Portland A/S and Unicon A/S share capital from FLS Industries A/SOctober 29th 2004: the deal was closed.October 29th 2004: the deal was closed. A further price adjustment will be made before year endNovember 17th 2004: entering the Chinese market.November 17th 2004: entering the Chinese market. Cementir Group continues to pursue its international expansion strategy and worldwide leadership in white cement
MAIN CONSEQUENCESGlobal leadership in white cement: business mix improvement and product diversificationCementir becomes a vertically integrated Pan-European player Better capital efficiency: lower WACC and higher ROCE
4
ACQUISITION RATIONALEACQUISITION RATIONALE
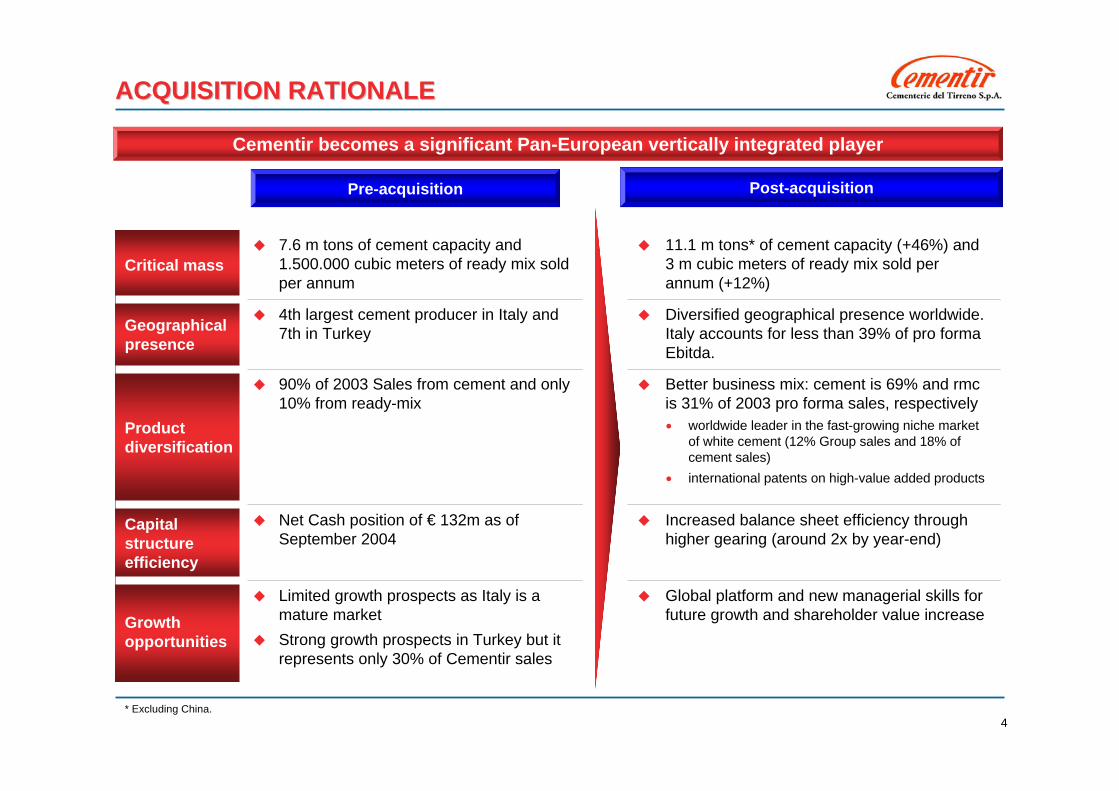
Cementir becomes a significant Pan-European vertically integrated player
Pre-acquisition Post-acquisition
Global platform and new managerial skills for future growth and shareholder value increase
Limited growth prospects as Italy is a mature marketStrong growth prospects in Turkey but it represents only 30% of Cementir sales
Growth opportunities
Increased balance sheet efficiency through higher gearing (around 2x by year-end)
Net Cash position of € 132m as of September 2004
Capital structure efficiency
Better business mix: cement is 69% and rmcis 31% of 2003 pro forma sales, respectively• worldwide leader in the fast-growing niche market
of white cement (12% Group sales and 18% of cement sales)
• international patents on high-value added products
90% of 2003 Sales from cement and only 10% from ready-mix
Product diversification
Diversified geographical presence worldwide. Italy accounts for less than 39% of pro forma Ebitda.
4th largest cement producer in Italy and 7th in Turkey Geographical
presence
7.6 m tons of cement capacity and 1.500.000 cubic meters of ready mix sold per annum
11.1 m tons* of cement capacity (+46%) and 3 m cubic meters of ready mix sold per annum (+12%)
Critical mass
* Excluding China.

5
FINANCING DETAILSFINANCING DETAILS
€€ 190 m190 m
€€ 382 m382 m
€€ 169 m169 m
€€ 213 m213 m€€ 572 m572 m
Aalborg Portand and Unicon existing debt. Debt has already been renegotiated (maturity extension and lower average cost)
€ 169 m of new debt raised for the acquisition
Cementir invested all of its cash resources
CASHCASH
EVEVTOTAL DEBTTOTAL DEBT
EXISTING DEBTEXISTING DEBT
NEW DEBTNEW DEBT
Acquisition multiples (LTM): EV/Ebitda 6x, EV/Sales 1.3x, P/Book 1.4x, EV/Ton ~ € 118Being the deal debt-financed, Cementir improved its capital structure and lowered its WACC
Financing structure

6
FINANCING DETAILS
* € 44 m from Treasury shares and Caltagirone Editore stake; € 20 m from real estate; € 14 m from other financial stakes** This is an estimate of the price adjustment to be paid before year end, reflecting the net equity increase at target companies between Jan-04 and closing date
DEAL DEAL ANNOUNCEMENTANNOUNCEMENT
20042004YEAR ENDYEAR END
De-leverage is a priority: Net Debt / Ebitda ~ 2x by end of 2004 and to zero by end of 2009
AALBORG AALBORG UNICONUNICON
€ 213 m€ 213 m
CEMENTIRCEMENTIR€ 69 m€ 69 m
EEXXIISSTTIINNGG
DDEEBBTT
NEW DEBTNEW DEBT€ 169 m€ 169 m
NET DEBT € 451mNET DEBT € 451m
NONNON--CORE CORE ASSET ASSET
DISPOSALS*DISPOSALS*
€€ 78m78m€€ 30 m30 m
PRICE PRICE ADJUSTMENT**ADJUSTMENT**
(est)(est)
CASH FLOWCASH FLOWGENERATIONGENERATION
fromfrom H1H1--0404(est)(est)
€€ 30 m30 m
NET DEBT € 373 m NET DEBT € 373 m ((expexp))
NEW DEBTNEW DEBT€ 91 m€ 91 m
AALBORG AALBORG UNICONUNICON
€ 213 m€ 213 m
CEMENTIRCEMENTIR€ 69 m€ 69 m
EEXXIISSTTIINNGG
DDEEBBTT
20092009YEAR ENDYEAR END
NET DEBTNET DEBT€ 0 m€ 0 m
Net Net DebtDebt //EbitdaEbitda = 2.5x= 2.5x
Net Net DebtDebt //EbitdaEbitda ~~ 2x2x
7
THE ACQUIRED COMPANIESTHE ACQUIRED COMPANIES

8
Malaysia(White)
2%
Egypt (White)
2%
Grey Denmark 62%
White Denmark34%
AALBORG PORTLAND A/S OVERVIEWAALBORG PORTLAND A/S OVERVIEW
0 500 1.000 1.500 2.000 2.500 3.000 3.500 4.000 4.500 5.000
Others
Chinese pro ducers
Tuleda Veguin
Federal
SaudiWhite Cement Co mpany
B irla, India
Ho lcim
Ras A l Khaimah
Italcementi/Cimentas Francais
Heidelberg/CB R
Lafarge/B C
Cimsa
Cemex
A albo rg P o rtland
Sinai8%
Malaysia4%
Denmark88%Grey
62%
White38%
Worldwide leadership in white cement
Korea, Thailand, Indonesia, Australia200,000Malaysia
EXPORT COUNTRIESTONSCOUNTRY
1,660,000TOTAL
-200,000China
Algeria, Syria, Morocco410,000Sinai
USA, Germany, France, UK850,000Denmark
AALBORG WHITE CEMENT CAPACITY**
GREY CEMENT CAPACITY
EXPORT COUNTRIESTONSCOUNTRY
UK, Northern Ireland, Puerto Rico 2,100,000Denmark
* Production capacity after capacity expansion.** Not including joint venture in Leigh White USA (24.5% owned).
‘03 Aalborg Ebitda Breakdown by country 03 White Cement Sales Breakdown by origin
**
GLOBAL CEMENT CAPACITY (000 Tons)
*
9
WHITE CEMENT MARKET OVERVIEWWHITE CEMENT MARKET OVERVIEW
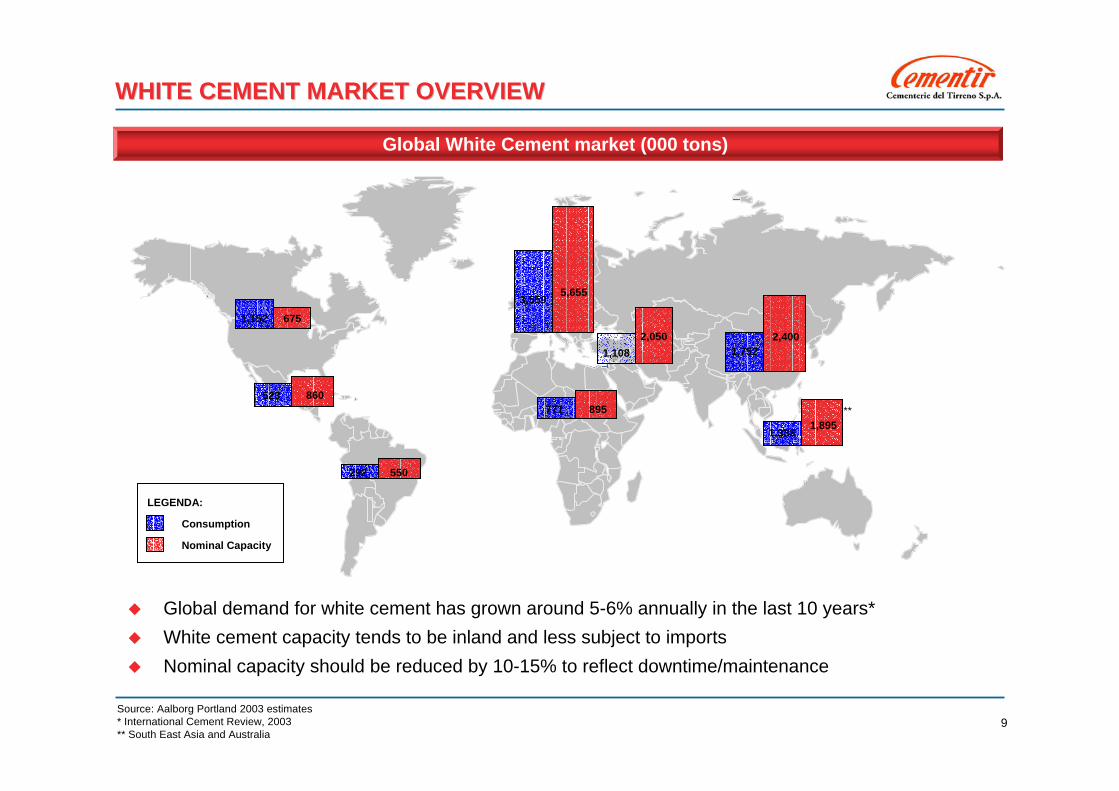
Global White Cement market (000 tons)
Global demand for white cement has grown around 5-6% annually in the last 10 years*White cement capacity tends to be inland and less subject to importsNominal capacity should be reduced by 10-15% to reflect downtime/maintenance
Source: Aalborg Portland 2003 estimates* International Cement Review, 2003** South East Asia and Australia
3,559 5,655
6751,152
523 860
292 550
771 895
1,108
1,3331,895
Consumption
Nominal Capacity
LEGENDA:
1,7522,4002,050
**
10
RECENT INVESTMENT IN CHINA
SHANGHAISHANGHAI
Plant Highlights
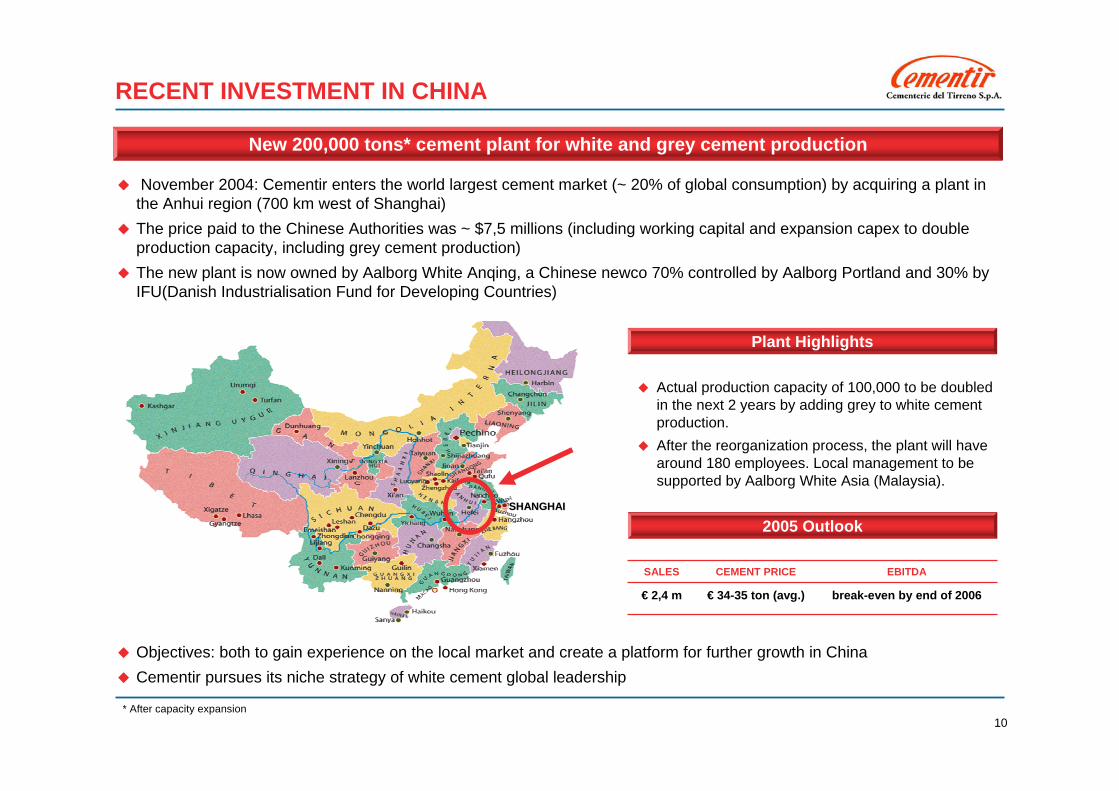
New 200,000 tons* cement plant for white and grey cement production
November 2004: Cementir enters the world largest cement market (~ 20% of global consumption) by acquiring a plant in the Anhui region (700 km west of Shanghai)The price paid to the Chinese Authorities was ~ $7,5 millions (including working capital and expansion capex to doubleproduction capacity, including grey cement production)The new plant is now owned by Aalborg White Anqing, a Chinese newco 70% controlled by Aalborg Portland and 30% byIFU(Danish Industrialisation Fund for Developing Countries)
Actual production capacity of 100,000 to be doubledin the next 2 years by adding grey to white cementproduction.After the reorganization process, the plant will havearound 180 employees. Local management to besupported by Aalborg White Asia (Malaysia).
Objectives: both to gain experience on the local market and create a platform for further growth in ChinaCementir pursues its niche strategy of white cement global leadership
* After capacity expansion
break-even by end of 2006€ 34-35 ton (avg.)€ 2,4 m
EBITDACEMENT PRICESALES
2005 Outlook

11
UNICON A/S OVERVIEWUNICON A/S OVERVIEW
Ready-mix Production CapacityN.1 Pan-Scandinavian RMC player
2003 Sales breakdown by country 2003 EBITDA breakdown by country
1,901,000 m375TOTAL
366,000 m.310Poland
132,000 m.38Sweden**
578,000 m.329Norway
825,000 m 328Denmark
Volumes sold / yearPLANTSCOUNTRY*
Poland9%
Norway35%
Sweden16% Denmark
40%
Poland4%
Norway33%
Sweden21%
Denmark42%
* In addition Unicon has a 50% stake in a Portuguese subsidiary which produces concrete elements** 50:50 share capital split between Unicon and Skanska.
12
GEOGRAPHICAL FIT OF THE ENLARGED GROUPGEOGRAPHICAL FIT OF THE ENLARGED GROUP
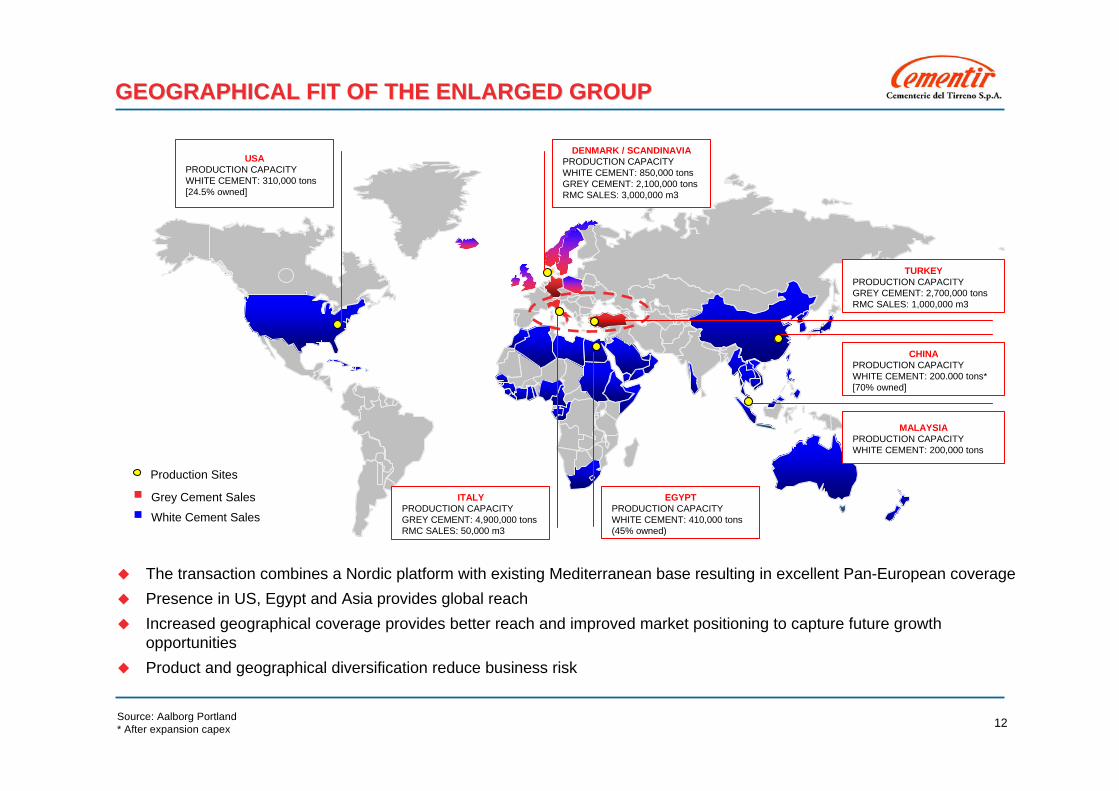
The transaction combines a Nordic platform with existing Mediterranean base resulting in excellent Pan-European coveragePresence in US, Egypt and Asia provides global reachIncreased geographical coverage provides better reach and improved market positioning to capture future growth opportunitiesProduct and geographical diversification reduce business risk
Production Sites
Grey Cement Sales
White Cement Sales
DENMARK / SCANDINAVIAPRODUCTION CAPACITYWHITE CEMENT: 850,000 tonsGREY CEMENT: 2,100,000 tonsRMC SALES: 3,000,000 m3
EGYPT PRODUCTION CAPACITYWHITE CEMENT: 410,000 tons(45% owned)
MALAYSIA PRODUCTION CAPACITYWHITE CEMENT: 200,000 tons
ITALY PRODUCTION CAPACITYGREY CEMENT: 4,900,000 tonsRMC SALES: 50,000 m3
TURKEYPRODUCTION CAPACITYGREY CEMENT: 2,700,000 tonsRMC SALES: 1,000,000 m3
USA PRODUCTION CAPACITYWHITE CEMENT: 310,000 tons[24.5% owned]
CHINAPRODUCTION CAPACITYWHITE CEMENT: 200.000 tons*[70% owned]
Source: Aalborg Portland* After expansion capex
13
CEMENTIR SALES BREAKDOWNCEMENTIR SALES BREAKDOWN
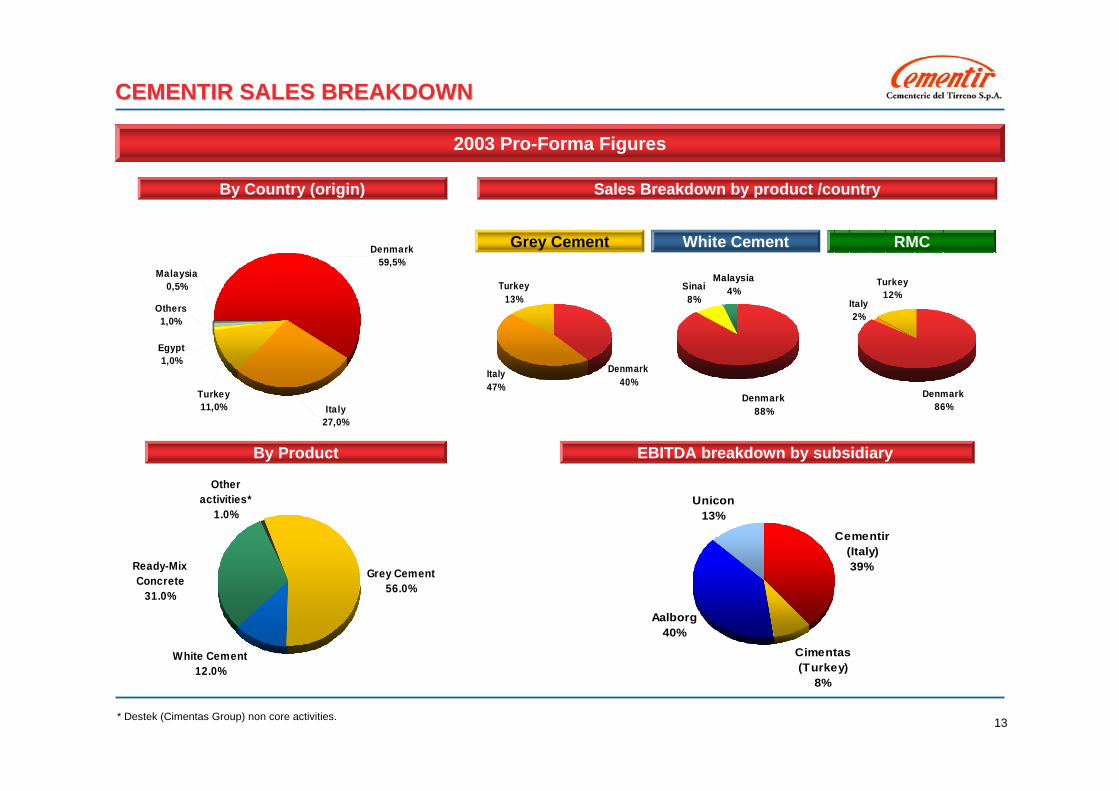
Malaysia0,5%
Others1,0%
Egypt1,0%
Denmark 59,5%
Italy27,0%
Turkey11,0%
2003 Pro-Forma Figures
Grey Cement White Cement RMC
Italy47%
Turkey13%
Denmark40%
Sinai8%
Malaysia4%
Denmark88%
Italy2%
Turkey12%
Denmark86%
* Destek (Cimentas Group) non core activities.
Other activities*
1.0%
White Cement12.0%
Ready-Mix Concrete
31.0%
Grey Cement56.0%
*
By Product
By Country (origin) Sales Breakdown by product /country
INSERIRE FLASH SU EBITDA PER PRODOTTO/PER PAESE…??
EBITDA breakdown by subsidiary
Cementir (Italy)39%
Cimentas (Turkey)
8%
Aalborg40%
Unicon13%

14
FINANCIALSFINANCIALS
15
PRO FORMA FINANCIALSPRO FORMA FINANCIALS
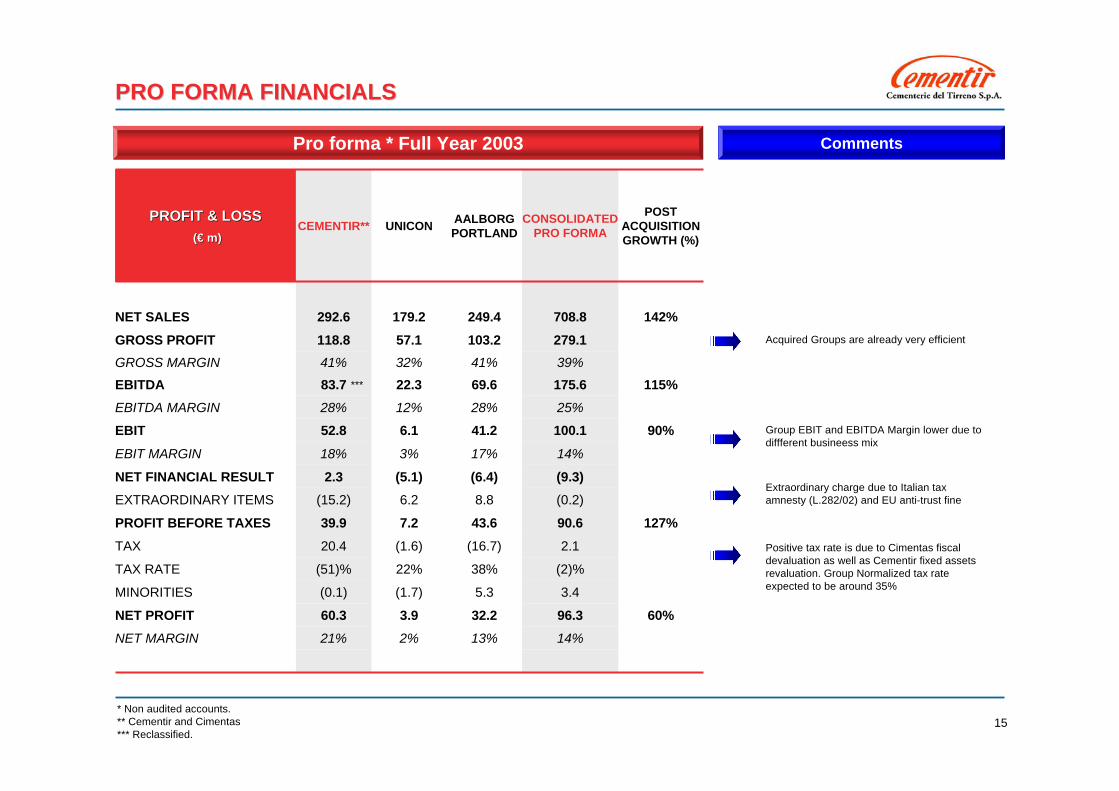
(2)%38%22%(51)%TAX RATE
(0.2)8.86.2(15.2)EXTRAORDINARY ITEMS
14%13%2%21%NET MARGIN
3.45.3(1.7)(0.1)MINORITIES
2.1(16.7)(1.6)20.4TAX
(9.3)(6.4)(5.1)2.3NET FINANCIAL RESULT
14%17%3%18%EBIT MARGIN
96.3
90.6
100.125%
175.639%
279.1
708.8
CONSOLIDATED PRO FORMA
POST ACQUISITION GROWTH (%)
AALBORG PORTLANDUNICONCEMENTIR**
PROFIT & LOSS PROFIT & LOSS (€ m)(€ m)
60%32.23.960.3NET PROFIT
127%43.67.239.9PROFIT BEFORE TAXES
90%41.26.152.8EBIT28%12%28%EBITDA MARGIN
115%69.622.383.7EBITDA41%32%41%GROSS MARGIN
103.257.1118.8GROSS PROFIT
142%249.4179.2292.6NET SALES
Pro forma * Full Year 2003 Comments
* Non audited accounts.** Cementir and Cimentas*** Reclassified.
Positive tax rate is due to Cimentas fiscal devaluation as well as Cementir fixed assetsrevaluation. Group Normalized tax rate expected to be around 35%
Extraordinary charge due to Italian taxamnesty (L.282/02) and EU anti-trust fine
Group EBIT and EBITDA Margin lower due todiffferent busineess mix
Acquired Groups are already very efficient
***
16
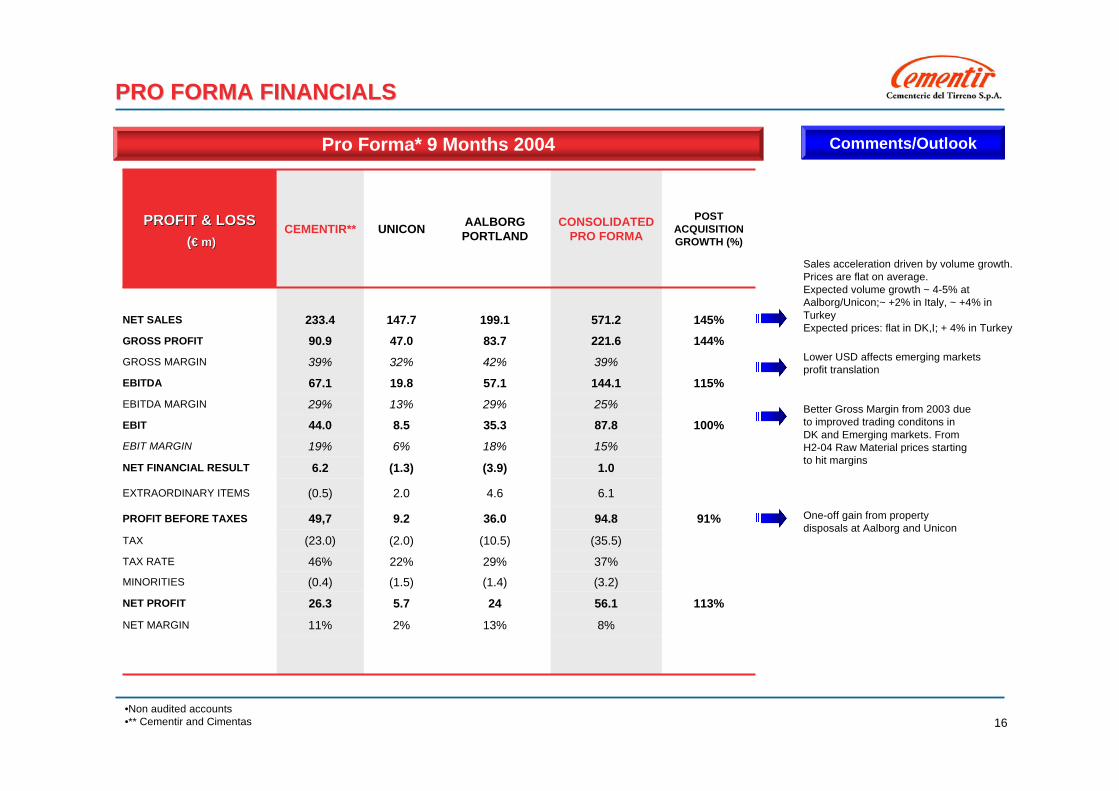
PRO FORMA FINANCIALSPRO FORMA FINANCIALS
8%13%2%11%NET MARGIN
(3.2)(1.4)(1.5)(0.4)MINORITIES
37%29%22%46%TAX RATE
(35.5)(10.5)(2.0)(23.0)TAX
6.14.62.0(0.5)EXTRAORDINARY ITEMS
1.0(3.9)(1.3)6.2NET FINANCIAL RESULT
113%56.1245.726.3NET PROFIT
15%18%6%19%EBIT MARGIN
94.8
87.8
25%
144.1
39%
221.6
571.2
CONSOLIDATED PRO FORMA
POST ACQUISITION GROWTH (%)
AALBORG PORTLANDUNICONCEMENTIR**PROFIT & LOSS PROFIT & LOSS
((€ m)€ m)
91%36.09.249,7PROFIT BEFORE TAXES
100%35.38.544.0EBIT
29%13%29%EBITDA MARGIN
115%57.119.867.1EBITDA
42%32%39%GROSS MARGIN
144%83.747.090.9GROSS PROFIT
145%199.1147.7233.4NET SALES
Pro Forma* 9 Months 2004
•Non audited accounts•** Cementir and Cimentas
Better Gross Margin from 2003 due to improved trading conditons in DK and Emerging markets. FromH2-04 Raw Material prices startingto hit margins
Comments/Outlook
One-off gain from propertydisposals at Aalborg and Unicon
Sales acceleration driven by volume growth. Prices are flat on average. Expected volume growth ~ 4-5% at Aalborg/Unicon;~ +2% in Italy, ~ +4% in Turkey Expected prices: flat in DK,I; + 4% in Turkey
Lower USD affects emerging marketsprofit translation
17
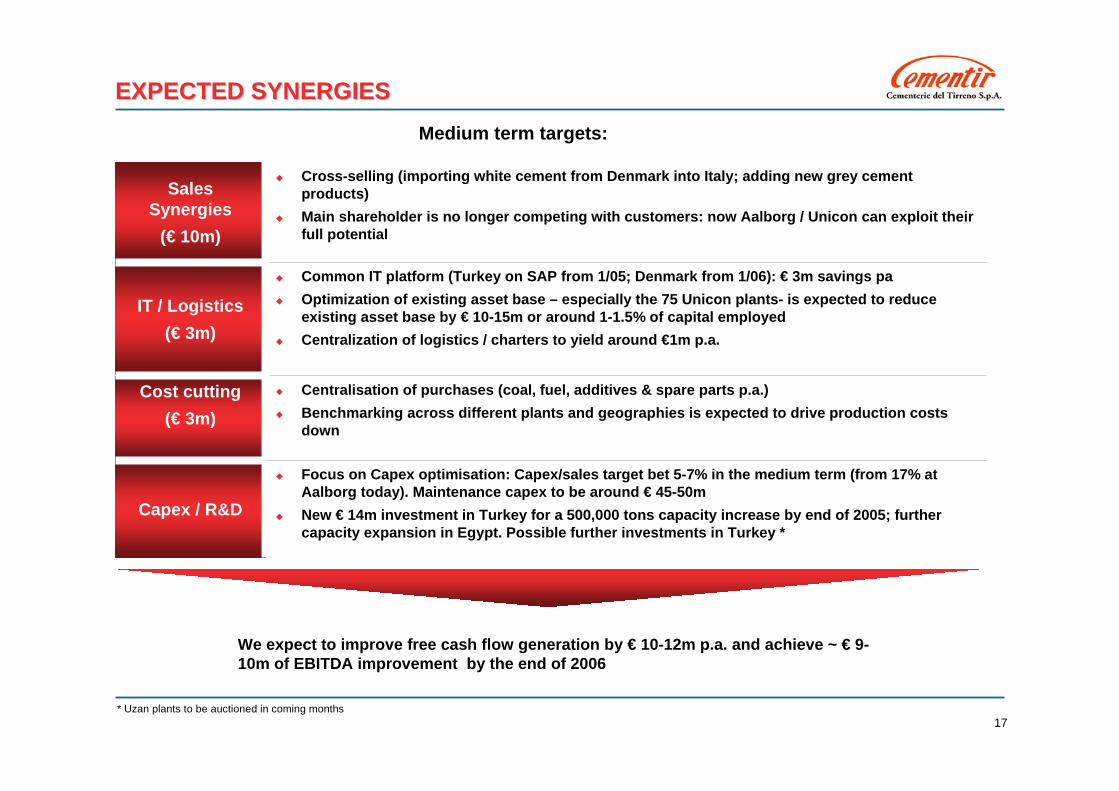
Centralisation of purchases (coal, fuel, additives & spare parts p.a.)Benchmarking across different plants and geographies is expected to drive production costs down
Cost cutting(€ 3m)
Focus on Capex optimisation: Capex/sales target bet 5-7% in the medium term (from 17% at Aalborg today). Maintenance capex to be around € 45-50mNew € 14m investment in Turkey for a 500,000 tons capacity increase by end of 2005; further capacity expansion in Egypt. Possible further investments in Turkey *
Capex / R&D
Common IT platform (Turkey on SAP from 1/05; Denmark from 1/06): € 3m savings paOptimization of existing asset base – especially the 75 Unicon plants- is expected to reduce existing asset base by € 10-15m or around 1-1.5% of capital employed Centralization of logistics / charters to yield around €1m p.a.
IT / Logistics(€ 3m)
Cross-selling (importing white cement from Denmark into Italy; adding new grey cement products)Main shareholder is no longer competing with customers: now Aalborg / Unicon can exploit their full potential
Sales Synergies
(€ 10m)
EXPECTED SYNERGIESEXPECTED SYNERGIES
* Uzan plants to be auctioned in coming months
Medium term targets:
We expect to improve free cash flow generation by € 10-12m p.a. and achieve ~ € 9-10m of EBITDA improvement by the end of 2006
18
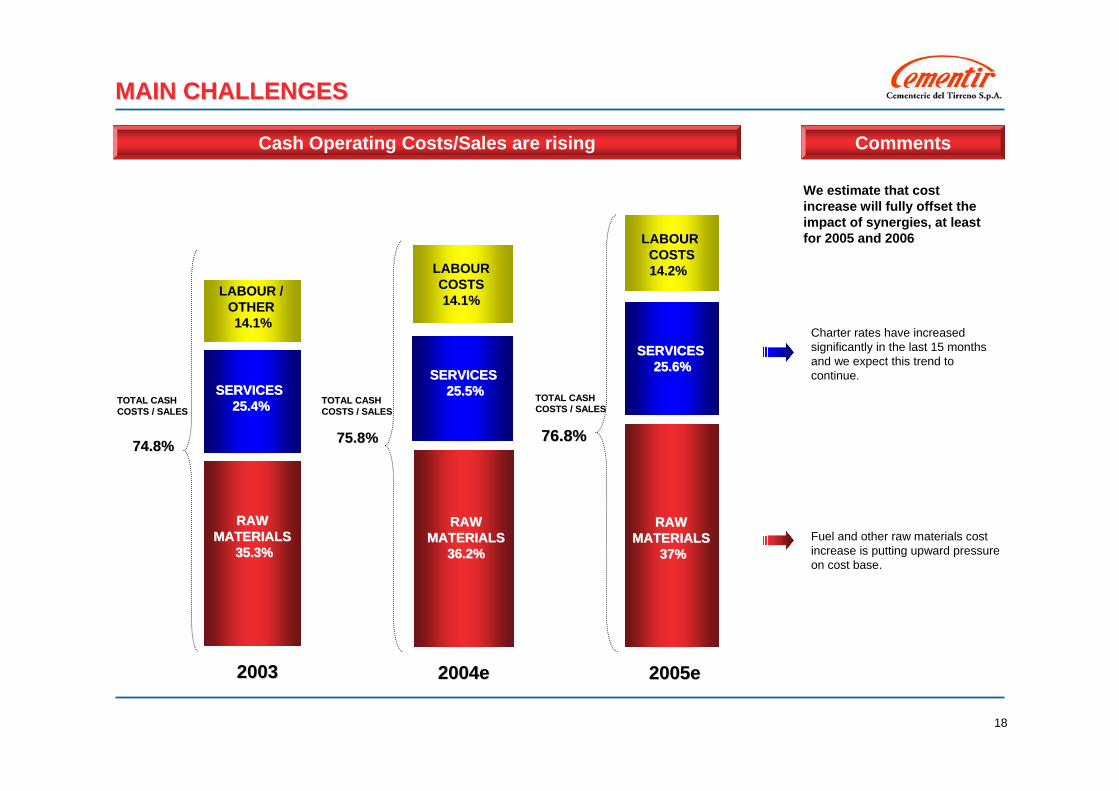
MAIN CHALLENGESMAIN CHALLENGES
Cash Operating Costs/Sales are rising Comments
Charter rates have increasedsignificantly in the last 15 monthsand we expect this trend tocontinue.
Fuel and other raw materials costincrease is putting upward pressureon cost base.
We estimate that costincrease will fully offset the impact of synergies, at leastfor 2005 and 2006
LABOUR / LABOUR / OTHEROTHER14.1%14.1%
SERVICES SERVICES 25.4%25.4%
20032003 2004e2004e 2005e2005e
RAW RAW MATERIALS MATERIALS
35.3%35.3%
LABOUR LABOUR COSTSCOSTS14.1%14.1%
SERVICES SERVICES 25.5%25.5%
RAW RAW MATERIALS MATERIALS
36.2%36.2%
LABOURLABOURCOSTSCOSTS14.2% 14.2%
SERVICES SERVICES 25.6%25.6%
RAW RAW MATERIALS MATERIALS
37%37%
TOTAL CASH TOTAL CASH COSTS / SALESCOSTS / SALES
74.8%74.8% 75.8%75.8% 76.8% 76.8%
TOTAL CASH TOTAL CASH COSTS / SALESCOSTS / SALES
TOTAL CASH TOTAL CASH COSTS / SALESCOSTS / SALES
19
PURSUING GROWTH IN A MATURE INDUSTRYPURSUING GROWTH IN A MATURE INDUSTRY
20
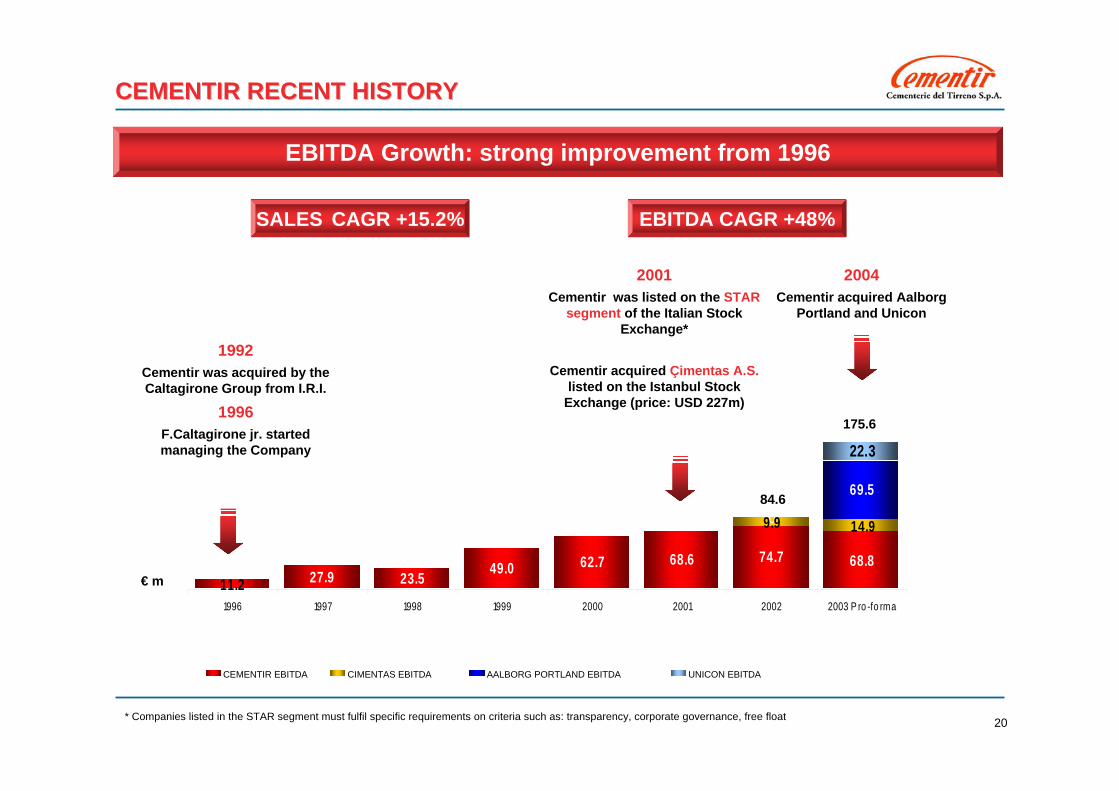
27.9 23.5 49.0 62.7 68.6 74.7
0
11.268.8
14.99.9
69.5
22.3
1996 1997 1998 1999 2000 2001 2002 2003 P ro -fo rma
CEMENTIR EBITDA CIMENTAS EBITDA AALBORG PORTLAND EBITDA UNICON EBITDA
€ m
CEMENTIR RECENT HISTORYCEMENTIR RECENT HISTORY
2001Cementir was listed on the STAR
segment of the Italian Stock Exchange*
Cementir acquired Çimentas A.S.listed on the Istanbul Stock
Exchange (price: USD 227m)
2004Cementir acquired Aalborg
Portland and Unicon
EBITDA Growth: strong improvement from 1996
* Companies listed in the STAR segment must fulfil specific requirements on criteria such as: transparency, corporate governance, free float
1992Cementir was acquired by the Caltagirone Group from I.R.I.
1996F.Caltagirone jr. started managing the Company
SALES CAGR +15.2% EBITDA CAGR +48%
175.6
84.6
21
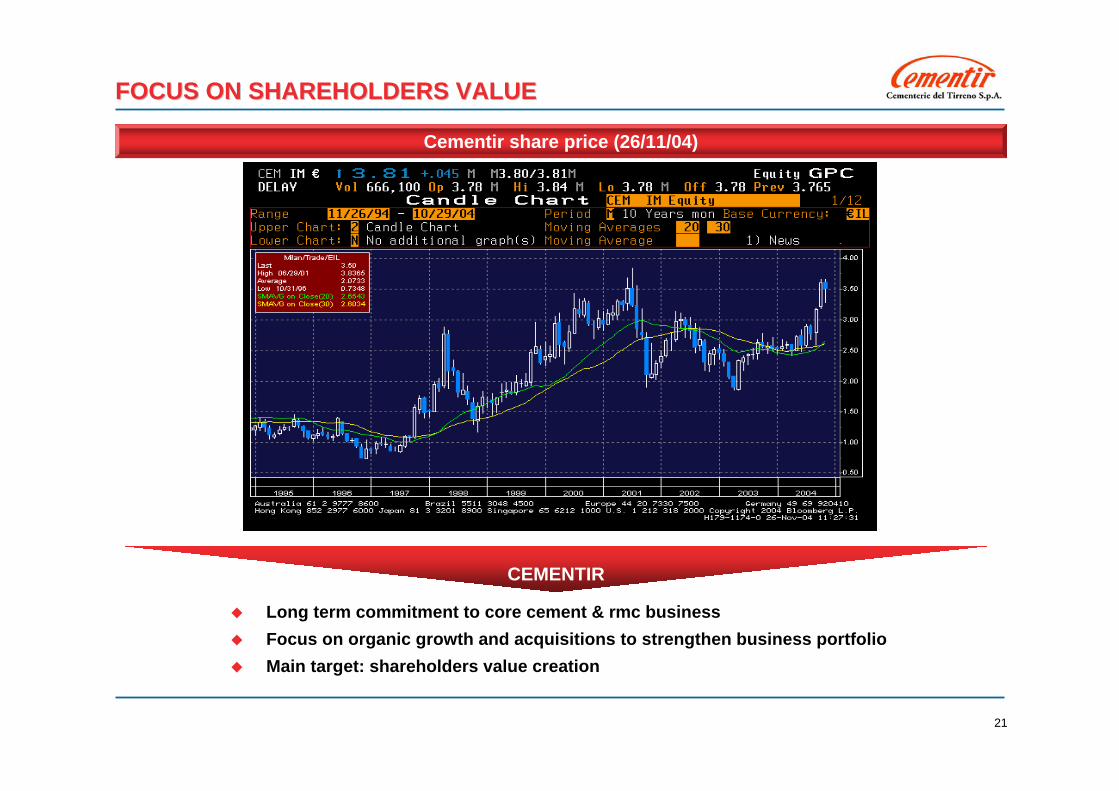
FOCUS ON SHAREHOLDERS VALUEFOCUS ON SHAREHOLDERS VALUE
Cementir share price (26/11/04)
CEMENTIR
Long term commitment to core cement & rmc businessFocus on organic growth and acquisitions to strengthen business portfolioMain target: shareholders value creation
22
FOR FURTHER INFORMATION
INVESTOR RELATIONS
Tel. +39 06 45412213Fax. +39 06 45412288
APPENDIX

24
CEMENTIR OVERVIEWCEMENTIR OVERVIEW
Company Structure
CEMENT RMC OTHER ACTIVITIESFINANCING SUBSIDIARIESLEGENDA:
INTERCEM SA
CALCESTRUZZI PICCIOLINI S.p.A.
COMPACT PUGLIA S.R.L.
SPEEDY BETON S.p.A.
CEMENTIR DELTA S.p.A.
ALFACEM S.R.L.
99.8%
AALBORG PORTLAND
ISLANDI hf.
CEMMILJØ A/S
AALBORG WHITE
SINAI WHITE PORTLAND
CEMENT COMPANY
AALBORG WHITEASIA
AALBORG PORTLAND
POLSKA SP
LEIGH WHITECEMENT
COMPANY
100%
45%
70%
24.5%
POL. GRAVEL Ind.Sp.
POLAND
UNICON AS
NORWAY
EKOL UNICON Sp
POLAND
UNICON BETON Sp
POLAND
STORSAND ANDTAKAS
NORWAY
AB SYDSTEN
SWEDEN
SKÄNE GRUS
AB
SWEDEN
50%49%
50%
60%
CIMBETON
KARS CIMENTO
BAKIRCAY
YAPITEC
DESTEK
100%
84.7%97.8%
78.1%
100%
100%
100%
100%
100% 100%
95%
30%
99.9%
99.9%
99.9%
19% 100% 100%
100%
99.9%
99.9%
AALBORG PORTLAND
US INC.
AALBORG WHITE ANQUING
70%
MarketMarket36%36%
Caltagirone Caltagirone GroupGroup64%64%
25
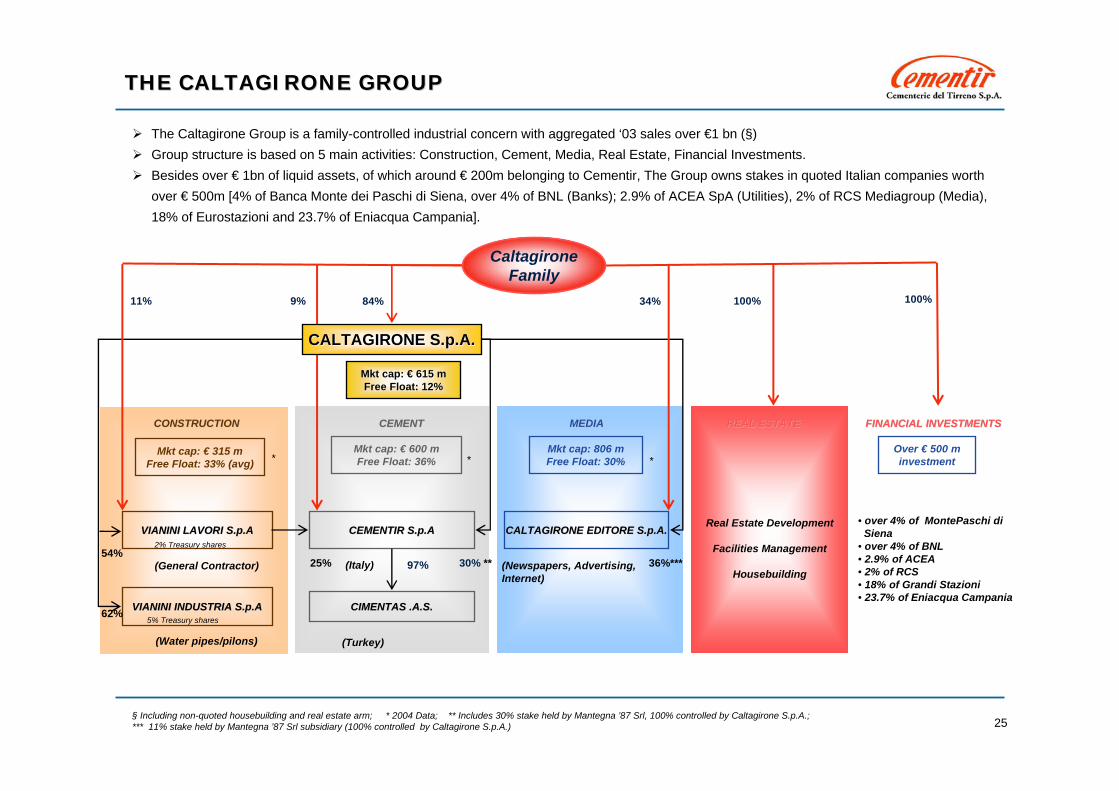
The Caltagirone Group is a family-controlled industrial concern with aggregated ‘03 sales over €1 bn (§)Group structure is based on 5 main activities: Construction, Cement, Media, Real Estate, Financial Investments.Besides over € 1bn of liquid assets, of which around € 200m belonging to Cementir, The Group owns stakes in quoted Italian companies worth over € 500m [4% of Banca Monte dei Paschi di Siena, over 4% of BNL (Banks); 2.9% of ACEA SpA (Utilities), 2% of RCS Mediagroup (Media), 18% of Eurostazioni and 23.7% of Eniacqua Campania].
THE CALTAGIRONE GROUPTHE CALTAGIRONE GROUP
§ Including non-quoted housebuilding and real estate arm; * 2004 Data; ** Includes 30% stake held by Mantegna ’87 Srl, 100% controlled by Caltagirone S.p.A.; *** 11% stake held by Mantegna ’87 Srl subsidiary (100% controlled by Caltagirone S.p.A.)
Mkt cap: 806 mFree Float: 30%
Mkt cap: € 315 mFree Float: 33% (avg)
VIANINI INDUSTRIA S.p.AVIANINI INDUSTRIA S.p.A
CONSTRUCTIONCONSTRUCTION
***
CEMENTCEMENT
CEMENTIR S.p.ACEMENTIR S.p.A CALTAGIRONE EDITORE S.p.A.CALTAGIRONE EDITORE S.p.A.
36%***
VIANINI LAVORI S.p.AVIANINI LAVORI S.p.A
11%
MEDIAMEDIA
(General Contractor)
(Water pipes/pilons) (Turkey)
CIMENTAS CIMENTAS .A.S..A.S.
(Newspapers, Advertising, Internet)
84% 34%
(Italy) 97%
Mkt cap: € 600 mFree Float: 36%
MktMkt capcap: : €€ 615 m615 mFreeFree FloatFloat: 12%: 12%
30% **25%
CALTAGIRONE S.p.A.CALTAGIRONE S.p.A.
9%
2% Treasury shares
5% Treasury shares
REAL ESTATEREAL ESTATE
Real Estate Development
Facilities Management
Housebuilding
100%
FINANCIAL INVESTMENTSFINANCIAL INVESTMENTS
• over 4% of MontePaschi di Siena
• over 4% of BNL• 2.9% of ACEA• 2% of RCS• 18% of Grandi Stazioni• 23.7% of Eniacqua Campania
Over € 500 minvestment
Caltagirone Family
54%
62%
100%