Embed Size (px)
Citation preview
Connecting People to Parks in King CountyA Transit-to-Parks GIS Analysis
June 2019
1
Table of Contents
Acknowledgements 2
Executive Summary 3
Introduction 6
Background Research 9
Methodology 17
Major Findings 21
Discussion and Recommendations 36
Next Steps 42
Study Limitations 43
Appendices 45
Appendix A: Glossary 45
Appendix B: Details on Methodology 46
Appendix C: List of Premier Parks 47
Appendix D: Supplemental Maps 49
References 56
The Wilderness Society
Founded in 1935, The Wilderness Society is the leading organization protecting our nation’s shared public lands. Our mission is simple, yet powerful and far-reaching: to protect wilderness and inspire Americans to care for our wild places. We are committed to the ideal that wilderness and all public lands can bring people and communities together and that everyone should share equitably in the benefits these places provide. For more than three decades, The Wilderness Society has worked to protect the last great wild places of the Pacific Northwest, from our ancient forests to rugged wilderness. Today, we are working with communities from the crest of the Cascade Mountains to the heart of Seattle to break down barriers to accessing nearby public lands. Rooted in a belief that public lands should be enjoyed by and available to all, The Wilderness Society’s newest initiative, Urban to Wild, works directly with communities in the greater Seattle area to identify challenges and advance smart solutions that increase access to the outdoors. We are committed to working with partners to close gaps and address inequities in the region’s parks and open spaces and facilitate connections to nature through creative transit and policy solutions and partnerships. We advocate for programs, policies and investments that improve the health and well-being of local communities to ensure everyone can enjoy local parks, public lands and the wilderness beyond.
2
Acknowledgements
The Wilderness Society would like to thank several organizations and individuals for the contribution of their expertise for the development of the study, including Matt Stevenson from CORE GIS as the primary GIS analyst and cartographer, and Lauren Grabowski from Los Angeles Metro who is the primary project manager for a similar transit-to-parks study in Los Angeles, which was a catalyst for this study. Thanks also to Transportation Choices Coalition, Puget Sound Regional Council, Seattle Department of Transportation, and the Office of Planning and Community Development for their input and expertise in the beginning stages of conceptualizing the study. Finally, The Wilderness Society would like to acknowledge the Bullitt Foundation, which is a key supporter of the Urban to Wild initiative in Seattle. Research and Writing: Elena Arakaki, lead study analyst and primary author, The Wilderness Society Project Team: Elena Arakaki, Kitty Craig, Yvette Lopez-Ledesma, Michael
Carroll, The Wilderness Society; Matt Stevenson, CORE GIS GIS Analysis: Matt Stevenson, CORE GIS Contact Information Elena Arakaki Urban to Wild Coordinator The Wilderness Society [email protected] 206-294-7665 Kitty Craig Washington State Deputy Director The Wilderness Society [email protected] 206-624-0605 Matt Stevenson CORE GIS [email protected] 206-782-1734
3
Executive Summary
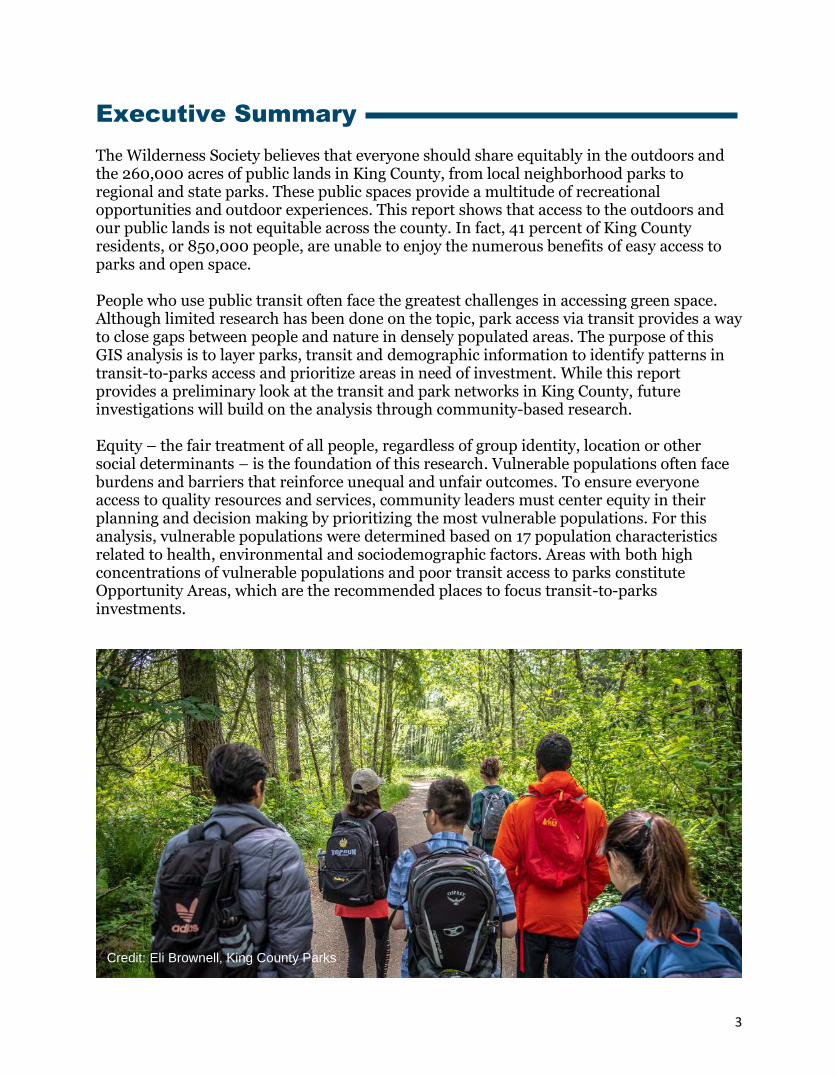
The Wilderness Society believes that everyone should share equitably in the outdoors and the 260,000 acres of public lands in King County, from local neighborhood parks to regional and state parks. These public spaces provide a multitude of recreational opportunities and outdoor experiences. This report shows that access to the outdoors and our public lands is not equitable across the county. In fact, 41 percent of King County residents, or 850,000 people, are unable to enjoy the numerous benefits of easy access to parks and open space. People who use public transit often face the greatest challenges in accessing green space. Although limited research has been done on the topic, park access via transit provides a way to close gaps between people and nature in densely populated areas. The purpose of this GIS analysis is to layer parks, transit and demographic information to identify patterns in transit-to-parks access and prioritize areas in need of investment. While this report provides a preliminary look at the transit and park networks in King County, future investigations will build on the analysis through community-based research. Equity – the fair treatment of all people, regardless of group identity, location or other social determinants – is the foundation of this research. Vulnerable populations often face burdens and barriers that reinforce unequal and unfair outcomes. To ensure everyone access to quality resources and services, community leaders must center equity in their planning and decision making by prioritizing the most vulnerable populations. For this analysis, vulnerable populations were determined based on 17 population characteristics related to health, environmental and sociodemographic factors. Areas with both high concentrations of vulnerable populations and poor transit access to parks constitute Opportunity Areas, which are the recommended places to focus transit-to-parks investments.
Credit: Eli Brownell, King County Parks
4
The findings show that Seattle residents have very good access to parks, with 87 percent able to walk to a park. However, nearby park access throughout the rest of the county falls to 46 percent, well below the national average. People of color and non-Seattle residents are least likely to have nearby access to parks, particularly in south King County. In Tukwila and Renton, less than half of the residents who live in majority-people of color neighborhoods live within a half mile of a park. There is great potential to connect vulnerable communities to parks via transit when they have little walking access. Vulnerable populations tend to have better access to frequent transit than the rest of King County, creating opportunities for quick connections. While only 61 percent of King County’s most vulnerable populations live within a half mile of a park, 92 percent live within two miles of a Community or Regional park. Transit adjustments can close the gap between people and quality parks that are otherwise too far or too difficult to reach. In this analysis, Highly Vulnerable populations reflect at least 8 of the 17 vulnerable characteristics and are predominantly located in central and south Seattle, Burien, Renton, Kent, Federal Way and Tukwila. Much of south King County lacks good transit access to parks, which we define as the ability to reach at least two Community and Regional parks, including one high-quality park (called a Premier park), within 45 minutes from doorstep to park. Areas with Highly Vulnerable populations that also lack good transit access to parks arise along Highway 167 from Renton to Algona. These Opportunity Areas present the greatest opportunity for investment since transit-to-parks improvements would impact these communities more than anywhere else in King County. Based on the research and analysis, we present several recommendations in this report.
1. This study should inform transit-to-parks investments, with a focus on Opportunity Areas. These areas currently do not have good park access via transit, and they are home to concentrations of Highly Vulnerable populations.
2. King County should conduct a comprehensive parks needs assessment to consistently inventory the condition of all parks and their amenities and identify areas of high park need. This inventory would also highlight desirable park destinations for potential transit connections.
3. King County should undertake a more robust transit-to-parks study with more
extensive parks and transit data than were available for this analysis. Data must also be paired with inclusive community engagement to understand the needs of the populations aimed to be served. King County has great potential to create a successful transit-to-parks network due to its strong parks and transit systems, but those connections must be explored and backed up by community input.
4. Existing transit routes to parks should be advertised to the public along transit lines,
on maps and at parks. There are currently many routes that serve high-quality parks, but they will be underutilized if people do not know they exist.
5
5. Public health benefits of parks should be leveraged to promote park equity. Communities experiencing negative health effects can benefit greatly from access to green space. Culturally relevant park programming and information can encourage park visitation and physical activity.
6. Current planning and program efforts should use this analysis to further inform
resource prioritization (e.g., funding and workforce planning) and opportunities for supplemental investigation. Current efforts include, but are not limited to, the City of Seattle’s Transit Equity and Outside Citywide efforts, King County Parks Levy renewal, King County Land Conservation Initiative, King County’s Trailhead Direct program and Puget Sound Regional Council’s VISION 2050 planning.
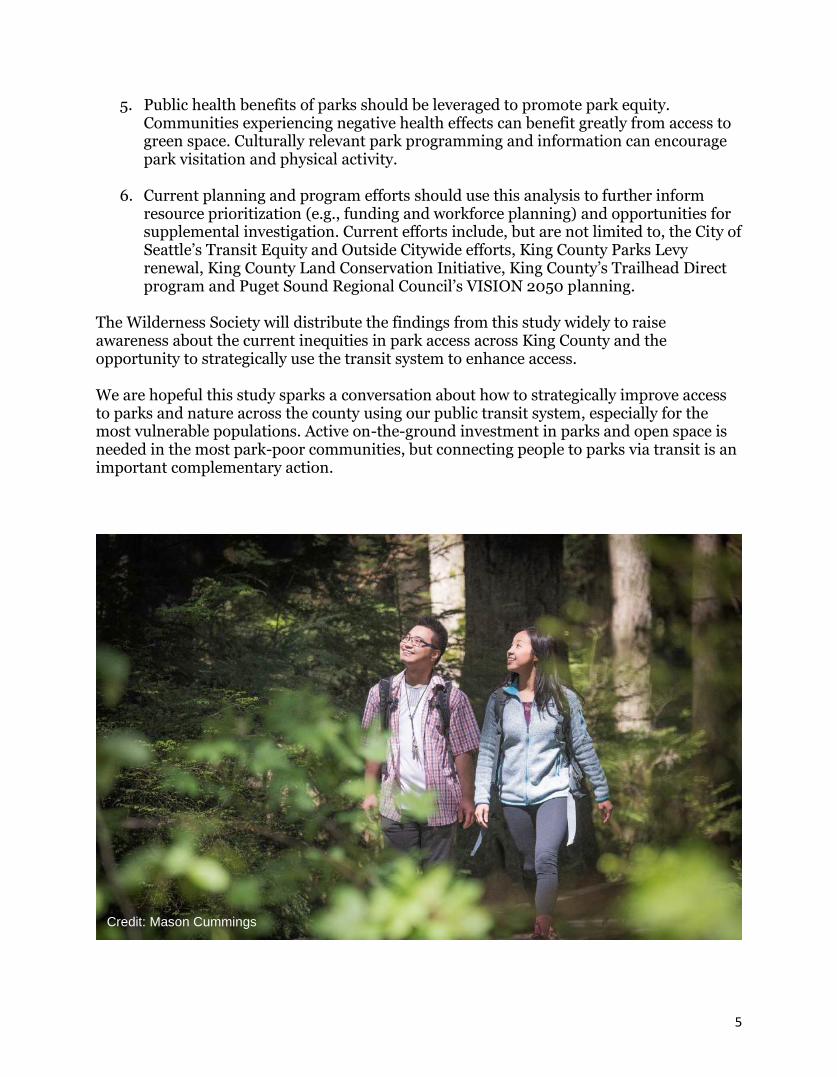
The Wilderness Society will distribute the findings from this study widely to raise awareness about the current inequities in park access across King County and the opportunity to strategically use the transit system to enhance access. We are hopeful this study sparks a conversation about how to strategically improve access to parks and nature across the county using our public transit system, especially for the most vulnerable populations. Active on-the-ground investment in parks and open space is needed in the most park-poor communities, but connecting people to parks via transit is an important complementary action.
Credit: Mason Cummings
6
Introduction
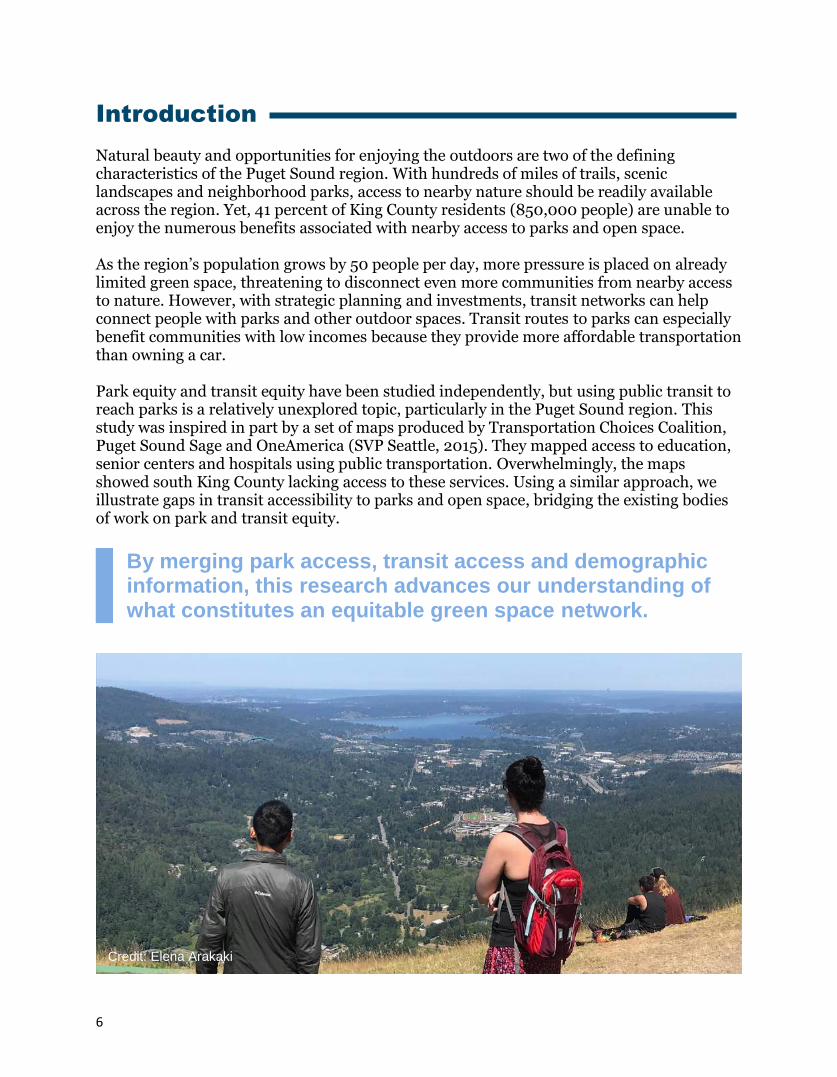
Natural beauty and opportunities for enjoying the outdoors are two of the defining characteristics of the Puget Sound region. With hundreds of miles of trails, scenic landscapes and neighborhood parks, access to nearby nature should be readily available across the region. Yet, 41 percent of King County residents (850,000 people) are unable to enjoy the numerous benefits associated with nearby access to parks and open space. As the region’s population grows by 50 people per day, more pressure is placed on already limited green space, threatening to disconnect even more communities from nearby access to nature. However, with strategic planning and investments, transit networks can help connect people with parks and other outdoor spaces. Transit routes to parks can especially benefit communities with low incomes because they provide more affordable transportation than owning a car. Park equity and transit equity have been studied independently, but using public transit to reach parks is a relatively unexplored topic, particularly in the Puget Sound region. This study was inspired in part by a set of maps produced by Transportation Choices Coalition, Puget Sound Sage and OneAmerica (SVP Seattle, 2015). They mapped access to education, senior centers and hospitals using public transportation. Overwhelmingly, the maps showed south King County lacking access to these services. Using a similar approach, we illustrate gaps in transit accessibility to parks and open space, bridging the existing bodies of work on park and transit equity.
By merging park access, transit access and demographic information, this research advances our understanding of what constitutes an equitable green space network.
Credit: Elena Arakaki
7
Study Purpose
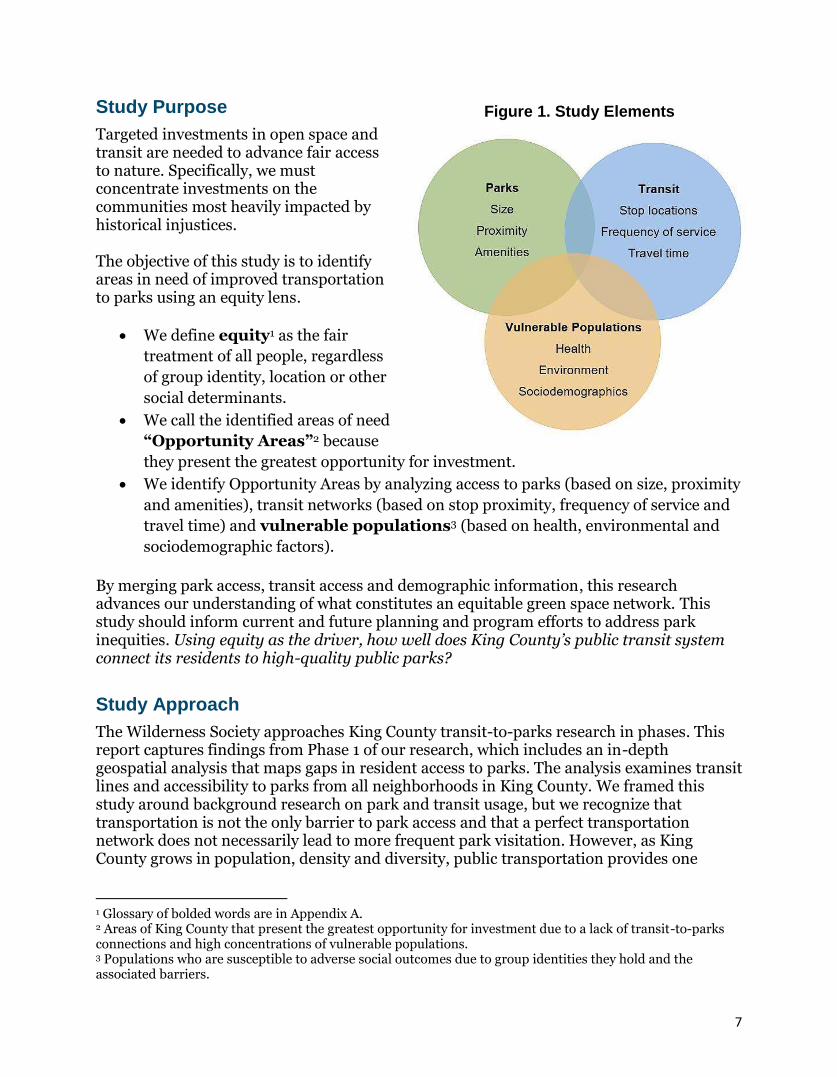
Targeted investments in open space and transit are needed to advance fair access to nature. Specifically, we must concentrate investments on the communities most heavily impacted by historical injustices. The objective of this study is to identify areas in need of improved transportation to parks using an equity lens.
• We define equity1 as the fair
treatment of all people, regardless
of group identity, location or other
social determinants.
• We call the identified areas of need
“Opportunity Areas”2 because
they present the greatest opportunity for investment.
• We identify Opportunity Areas by analyzing access to parks (based on size, proximity
and amenities), transit networks (based on stop proximity, frequency of service and
travel time) and vulnerable populations3 (based on health, environmental and
sociodemographic factors).
By merging park access, transit access and demographic information, this research advances our understanding of what constitutes an equitable green space network. This study should inform current and future planning and program efforts to address park inequities. Using equity as the driver, how well does King County’s public transit system connect its residents to high-quality public parks?
Study Approach
The Wilderness Society approaches King County transit-to-parks research in phases. This report captures findings from Phase 1 of our research, which includes an in-depth geospatial analysis that maps gaps in resident access to parks. The analysis examines transit lines and accessibility to parks from all neighborhoods in King County. We framed this study around background research on park and transit usage, but we recognize that transportation is not the only barrier to park access and that a perfect transportation network does not necessarily lead to more frequent park visitation. However, as King County grows in population, density and diversity, public transportation provides one
1 Glossary of bolded words are in Appendix A. 2 Areas of King County that present the greatest opportunity for investment due to a lack of transit-to-parks connections and high concentrations of vulnerable populations. 3 Populations who are susceptible to adverse social outcomes due to group identities they hold and the associated barriers.
Figure 1. Study Elements
8
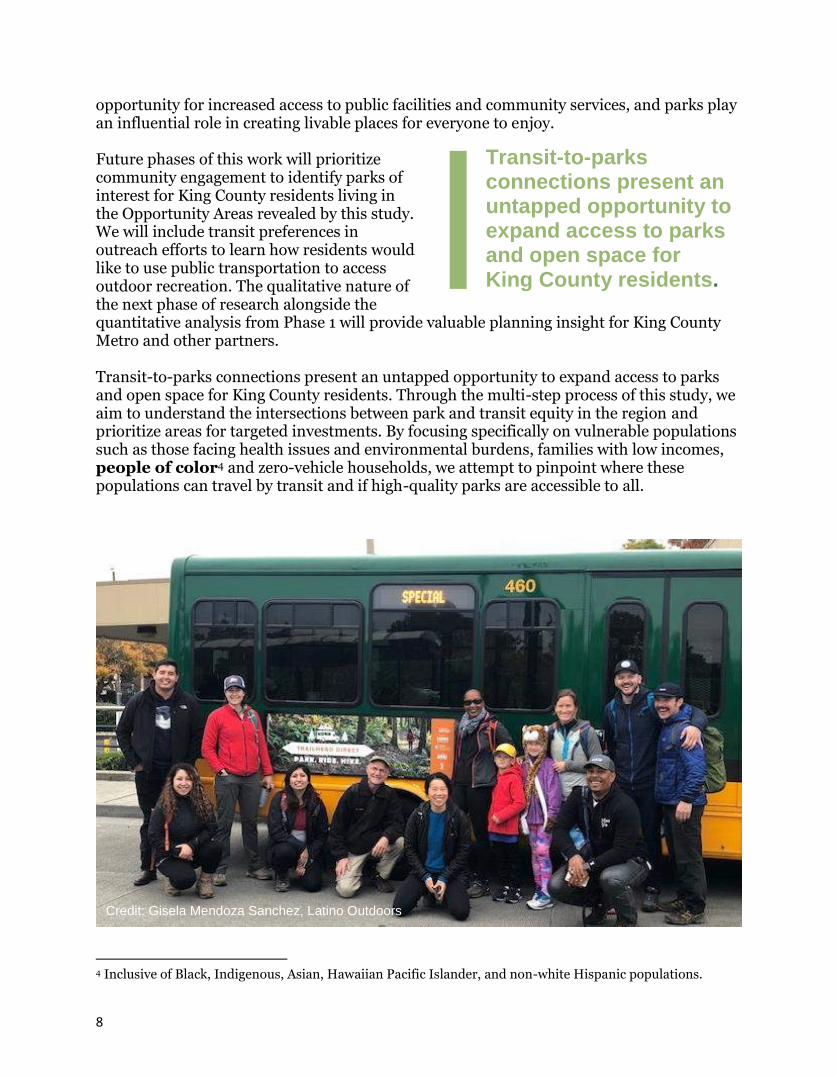
opportunity for increased access to public facilities and community services, and parks play an influential role in creating livable places for everyone to enjoy. Future phases of this work will prioritize community engagement to identify parks of interest for King County residents living in the Opportunity Areas revealed by this study. We will include transit preferences in outreach efforts to learn how residents would like to use public transportation to access outdoor recreation. The qualitative nature of the next phase of research alongside the quantitative analysis from Phase 1 will provide valuable planning insight for King County Metro and other partners. Transit-to-parks connections present an untapped opportunity to expand access to parks and open space for King County residents. Through the multi-step process of this study, we aim to understand the intersections between park and transit equity in the region and prioritize areas for targeted investments. By focusing specifically on vulnerable populations such as those facing health issues and environmental burdens, families with low incomes, people of color4 and zero-vehicle households, we attempt to pinpoint where these populations can travel by transit and if high-quality parks are accessible to all.
4 Inclusive of Black, Indigenous, Asian, Hawaiian Pacific Islander, and non-white Hispanic populations.
Transit-to-parks connections present an untapped opportunity to expand access to parks and open space for King County residents.
Credit: Gisela Mendoza Sanchez, Latino Outdoors
9
Background Research
The following section situates our study in the context of existing research on transit and park equity. We outline the significance of focusing on local parks and transportation and explore how the two areas of study have the potential to improve access to quality parks. We then bring the research closer to home and describe the relevance to King County.
Public Parks Provide Countless Benefits
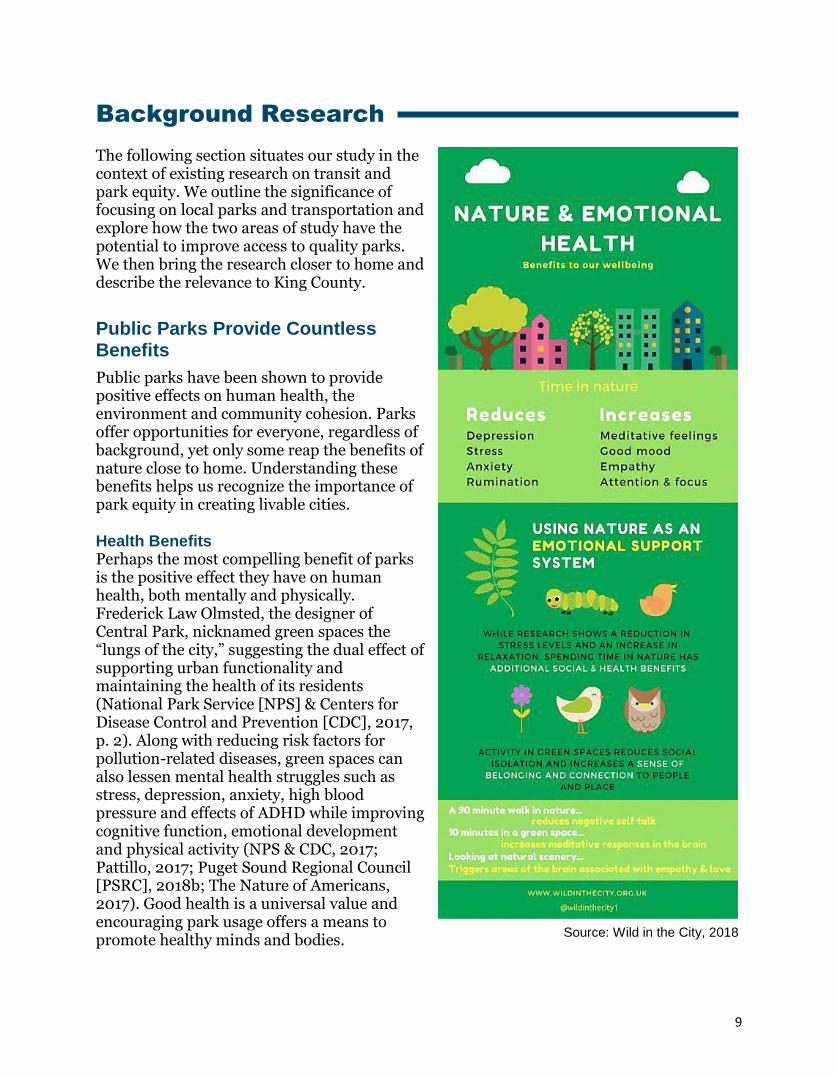
Public parks have been shown to provide positive effects on human health, the environment and community cohesion. Parks offer opportunities for everyone, regardless of background, yet only some reap the benefits of nature close to home. Understanding these benefits helps us recognize the importance of park equity in creating livable cities. Health Benefits Perhaps the most compelling benefit of parks is the positive effect they have on human health, both mentally and physically. Frederick Law Olmsted, the designer of Central Park, nicknamed green spaces the “lungs of the city,” suggesting the dual effect of supporting urban functionality and maintaining the health of its residents (National Park Service [NPS] & Centers for Disease Control and Prevention [CDC], 2017, p. 2). Along with reducing risk factors for pollution-related diseases, green spaces can also lessen mental health struggles such as stress, depression, anxiety, high blood pressure and effects of ADHD while improving cognitive function, emotional development and physical activity (NPS & CDC, 2017; Pattillo, 2017; Puget Sound Regional Council [PSRC], 2018b; The Nature of Americans, 2017). Good health is a universal value and encouraging park usage offers a means to promote healthy minds and bodies.
Source: Wild in the City, 2018
10
Environmental Benefits Due to a relative lack of nature in cities, urban areas often suffer from environmental burdens such as polluted air and water, lack of biodiversity and rising temperatures (PSRC, 2018b). One of the most well-known consequences of urban development is the urban heat island effect, which is caused by heating rates exceeding cooling rates, usually driven by an abundance of impervious surfaces (e.g., pavement, buildings) in urban areas. Plants act as natural cooling agents and can moderate temperatures, thereby reducing negative health burdens of climate change (NPS & CDC, 2017). The well-being of the surrounding natural environment heavily influences human health, so cultivating a thriving environment can lead to better health outcomes. Social Benefits As technology roots itself firmly in our society, humans have become increasingly isolated from each other. According to The Nature of Americans (2017), people in the United States now spend 90 percent of their time indoors and an average of 40 to 50 hours on leisure electronic media per week. Our technology fixation not only contributes to detrimental health effects, but also to a decrease in external social stimulation. Public spaces have the potential to initiate neighborly interactions and strengthen a sense of community (Patillo, 2017; PSRC, 2018b). Particularly in cities, where residents may feel anonymous amidst the hustle and bustle, community spaces such as parks provide refuges to gather with neighbors and form social ties.
Disparities Exist in Park Access and Usage, Often by Race and Income
Nationwide, people of color are underrepresented in outdoor recreation (Floyd et al., 2016; Outdoor Foundation, 2018; Patillo, 2017). The Outdoor Foundation’s 2018 survey on outdoor recreation revealed that 74 percent of participants who reported recreating outdoors identified as non-Hispanic white, despite only 61 percent of the U.S. population identifying as such.5 This disparity shows up closer to home as well, with only 11 percent of visitors to the Mt. Baker-Snoqualmie National Forest in 2015 identifying as people of color
despite 35 percent of the region being non-white at the time (PSRC, 2018b). These disparities coupled with population trends have serious implications for future park equity in the Puget Sound region. People of color have accounted for 76 percent of the region’s growth over the past two decades, far surpassing the nation’s people of color growth rate (PSRC, 2018a).
5 Survey included over 31,000 participants.
People in the United States now spend 90 percent of their time indoors.
Only 11 percent of visitors to the Mt. Baker-Snoqualmie National Forest in 2015 identified as people of color despite 35 percent of the region being non-white.
11
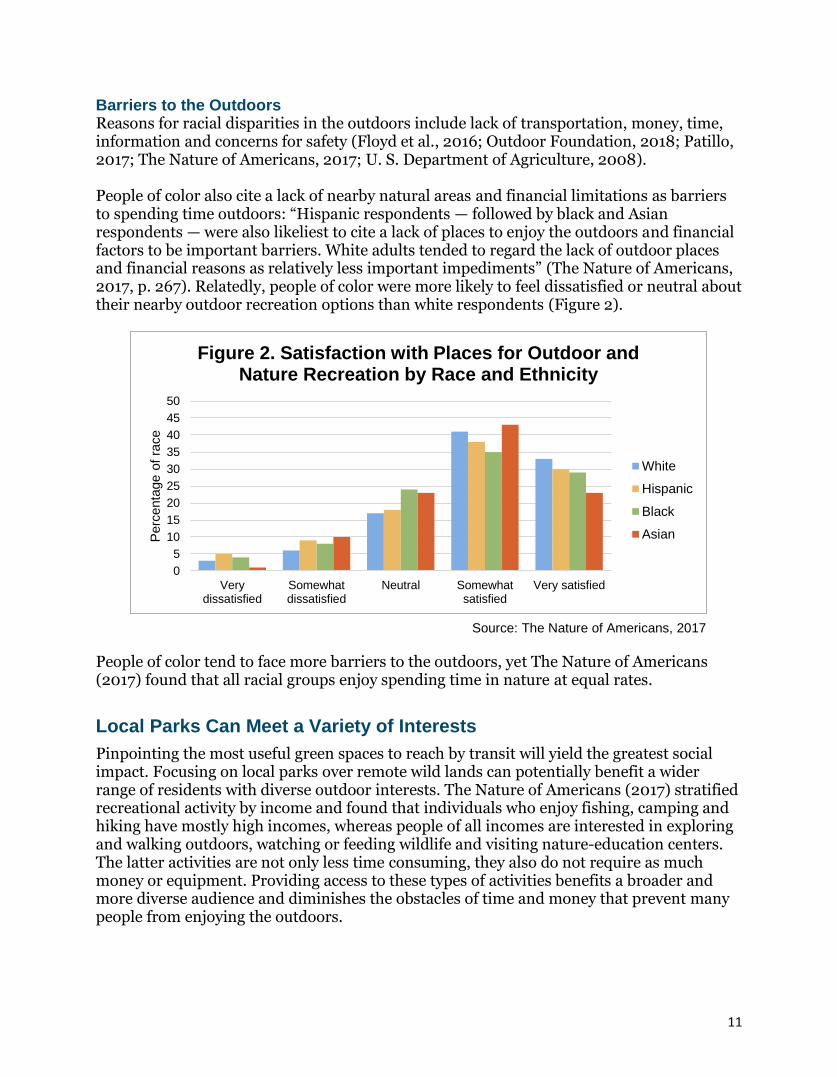
Barriers to the Outdoors Reasons for racial disparities in the outdoors include lack of transportation, money, time, information and concerns for safety (Floyd et al., 2016; Outdoor Foundation, 2018; Patillo, 2017; The Nature of Americans, 2017; U. S. Department of Agriculture, 2008). People of color also cite a lack of nearby natural areas and financial limitations as barriers to spending time outdoors: “Hispanic respondents — followed by black and Asian respondents — were also likeliest to cite a lack of places to enjoy the outdoors and financial factors to be important barriers. White adults tended to regard the lack of outdoor places and financial reasons as relatively less important impediments” (The Nature of Americans, 2017, p. 267). Relatedly, people of color were more likely to feel dissatisfied or neutral about their nearby outdoor recreation options than white respondents (Figure 2).
People of color tend to face more barriers to the outdoors, yet The Nature of Americans (2017) found that all racial groups enjoy spending time in nature at equal rates.
Local Parks Can Meet a Variety of Interests
Pinpointing the most useful green spaces to reach by transit will yield the greatest social impact. Focusing on local parks over remote wild lands can potentially benefit a wider range of residents with diverse outdoor interests. The Nature of Americans (2017) stratified recreational activity by income and found that individuals who enjoy fishing, camping and hiking have mostly high incomes, whereas people of all incomes are interested in exploring and walking outdoors, watching or feeding wildlife and visiting nature-education centers. The latter activities are not only less time consuming, they also do not require as much money or equipment. Providing access to these types of activities benefits a broader and more diverse audience and diminishes the obstacles of time and money that prevent many people from enjoying the outdoors.
0
5
10
15
20
25
30
35
40
45
50
Verydissatisfied
Somewhatdissatisfied
Neutral Somewhatsatisfied
Very satisfied
Perc
enta
ge o
f ra
ce
Figure 2. Satisfaction with Places for Outdoor and Nature Recreation by Race and Ethnicity
White
Hispanic
Black
Asian
Source: The Nature of Americans, 2017
12
Additionally, people are more likely to visit local parks on a regular basis compared to nature located farther away (Sister, Wolch, & Wilson, 2010). For the average Washingtonian, visits to local parks account for half of outdoor recreation visits per year (PSRC, 2018b). Local parks are well-aligned to accommodate varied interests of park visitors and are located at reasonable distances for recreating, making them a recommended starting point for increasing access to nature. One step toward increasing equitable access to parks and open space in the city is to provide more methods of transportation. The following sections outline the benefits of public transportation in an urban setting and frame the topic in terms of equitable mobility.
Public Transportation Plays a Critical Role in the Livability of Urban Communities
Robust public transportation networks shape a city’s layout and affordability, which in turn affects livability. Public transportation connects people to resources and especially benefits carless populations, which often comprise people of color, people with low incomes, elderly populations and those with disabilities (PSRC, 2018d). However, transit-oriented development frequently focuses on creating new, attractive communities rather than maintaining the livability for current residents, resulting in gentrification near transit centers (Puget Sound Sage, 2012). This raises the question: are vulnerable populations able to access necessary resources, including green space, using public transportation? Because of urban density and rising costs, quality transit networks are of utmost importance when considering livability for vulnerable populations. Urban density Over 80 percent of the U.S. population now lives in urban areas, creating dense centers where thousands of people share the same resources, including land. King County’s population is growing at an unprecedented rate: over 48,000 people moved to the county in 2017 and 1.8 million more people are predicted to move to the four-county region by 2050 (King County DNRP, 2018; PSRC, 2018c). To minimize commute times and traffic-related pollution as the population grows, alternative transportation solutions must be implemented. In 2017, King County Metro (2016a) adopted a long-range plan to increase service by 70 percent within 25 years. This bold vision demonstrates Metro’s commitment to adapting to population growth and urban density.
For the average Washingtonian, visits to local parks account for half of outdoor recreation visits per year.
13
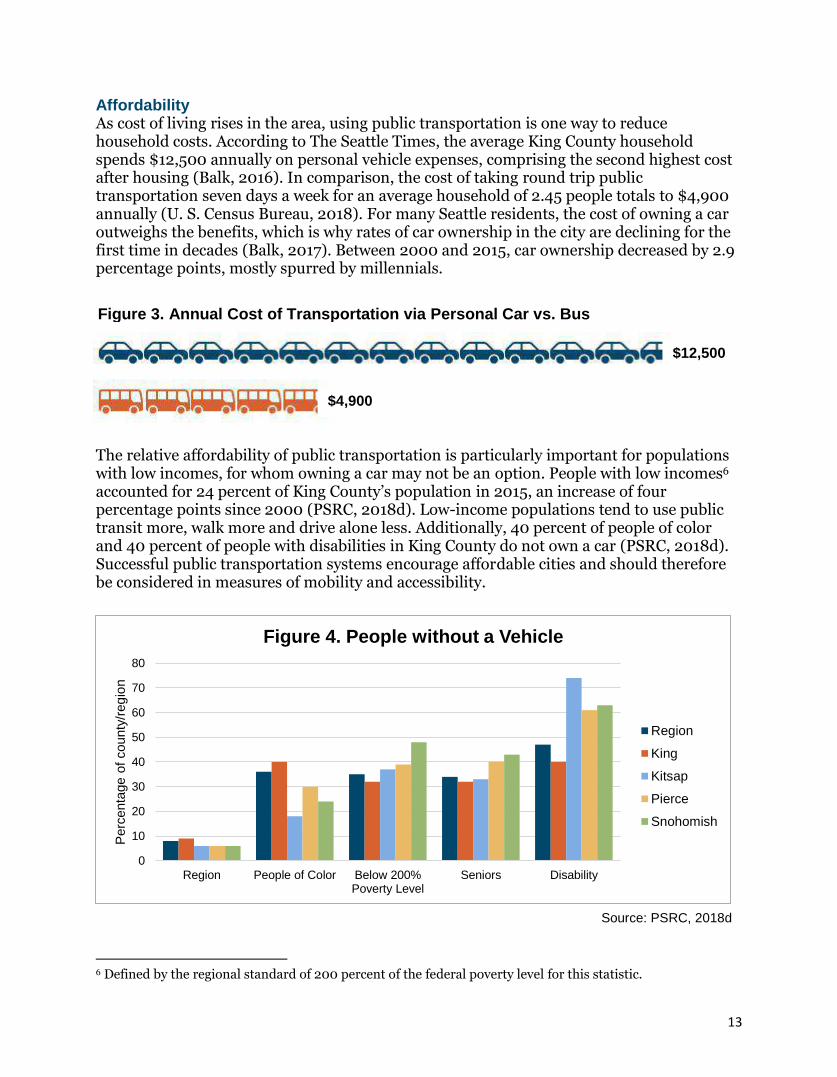
Affordability As cost of living rises in the area, using public transportation is one way to reduce household costs. According to The Seattle Times, the average King County household spends $12,500 annually on personal vehicle expenses, comprising the second highest cost after housing (Balk, 2016). In comparison, the cost of taking round trip public transportation seven days a week for an average household of 2.45 people totals to $4,900 annually (U. S. Census Bureau, 2018). For many Seattle residents, the cost of owning a car outweighs the benefits, which is why rates of car ownership in the city are declining for the first time in decades (Balk, 2017). Between 2000 and 2015, car ownership decreased by 2.9 percentage points, mostly spurred by millennials.
The relative affordability of public transportation is particularly important for populations with low incomes, for whom owning a car may not be an option. People with low incomes6 accounted for 24 percent of King County’s population in 2015, an increase of four percentage points since 2000 (PSRC, 2018d). Low-income populations tend to use public transit more, walk more and drive alone less. Additionally, 40 percent of people of color and 40 percent of people with disabilities in King County do not own a car (PSRC, 2018d). Successful public transportation systems encourage affordable cities and should therefore be considered in measures of mobility and accessibility.
6 Defined by the regional standard of 200 percent of the federal poverty level for this statistic.
Figure 3. Annual Cost of Transportation via Personal Car vs. Bus
$4,900
$12,500
Source: PSRC, 2018d
0
10
20
30
40
50
60
70
80
Region People of Color Below 200%Poverty Level
Seniors Disability
Perc
enta
ge o
f county
/reg
ion
Figure 4. People without a Vehicle
Region
King
Kitsap
Pierce
Snohomish
14
Transit-to-parks Connections are Understudied, but Have Promising Potential
As described above, vulnerable groups tend to face more barriers to park access, ranging from financial limitations to the absence of a car to racial discrimination. People of color, populations with low incomes, elderly people and populations with disabilities are also most likely to use public transportation regularly (PSRC, 2018d). Therefore, a logical way to increase equitable access to green spaces is to incorporate desirable park destinations into transit networks. Increasing the quantity of nearby parks would provide the strongest benefits due to ease of access, but in dense areas such as city centers, improving transportation routes may be more feasible than creating new parks (Dony, Delmelle, & Delmelle, 2015). Los Angeles County is already deep in the process of creating connections to parks using public transportation (Los Angeles Metro, 2019). After conducting a Comprehensive Parks and Recreation Needs Assessment (Los Angeles County Department of Parks & Recreation, 2016), the county faced a striking reality check that over 50 percent of the population has “high” or “very high” park need (Lewis, 2016). Consequently, LA Metro has committed to expanding its purview and will “detail opportunities for future transit access, identify funding sources, and provide recommendations for new transit service connecting to parks, such as active transportation bike lanes, greenways, and public transit shuttles” (Lewis, 2016). LA County is paving the way for the rest of the country in creating large-scale changes to transportation networks to support park access.
Transit Routes to Parks Present Opportunities to Connect King County Residents to Nearby Nature
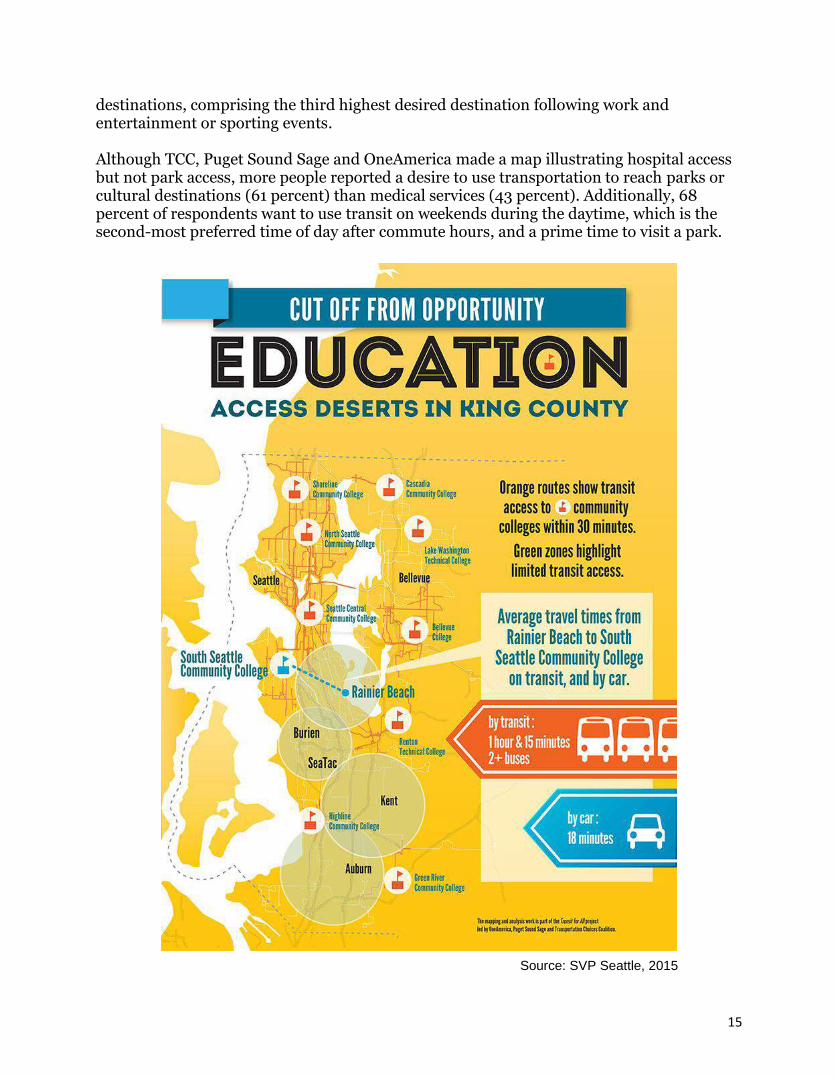
King County is home to a multitude of beautiful green spaces from pocket parks to expansive state parks, yet the Land Conservation Initiative (King County DNRP, 2018) acknowledges that many residents still do not have easy access to nature. Using public transportation to reach parks has not been studied in the region, although there has been some research done on transit to other resources. Transportation Choices Coalition (TCC), Puget Sound Sage and OneAmerica mapped access to education, senior centers and hospitals using public transportation. Overwhelmingly, south King County appeared on the maps as lacking access to services, such as community colleges, shown in the map on page 15 (SVP Seattle, 2015).
While these maps did not include a transit-to-parks analysis, feedback from community members revealed a desire to access green space using transit. According to the Public Engagement Report from King County Metro’s long-range plan (2016b), 61 percent of online survey respondents would like to use public transportation to visit parks or cultural
King County is home to 260,000 acres of green spaces from pocket parks to state parks, yet 41 percent of its residents do not have easy access to nature.
15
destinations, comprising the third highest desired destination following work and entertainment or sporting events. Although TCC, Puget Sound Sage and OneAmerica made a map illustrating hospital access but not park access, more people reported a desire to use transportation to reach parks or cultural destinations (61 percent) than medical services (43 percent). Additionally, 68 percent of respondents want to use transit on weekends during the daytime, which is the second-most preferred time of day after commute hours, and a prime time to visit a park.
Source: SVP Seattle, 2015
16
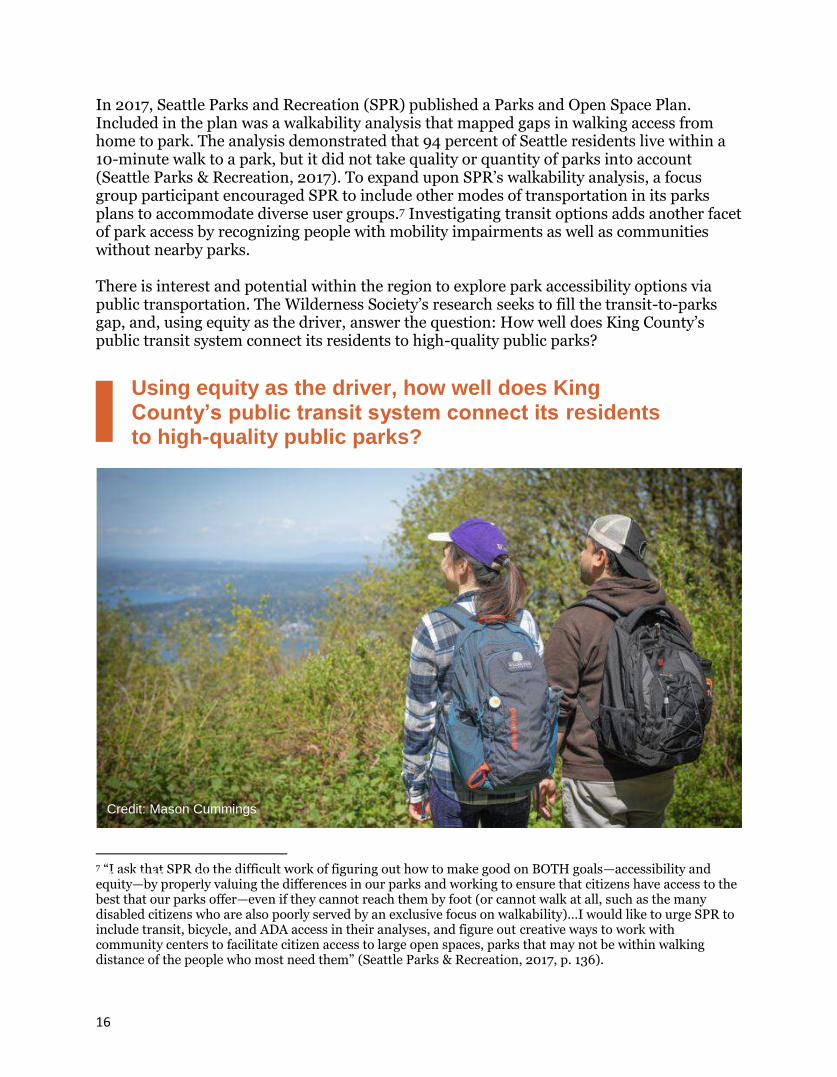
In 2017, Seattle Parks and Recreation (SPR) published a Parks and Open Space Plan. Included in the plan was a walkability analysis that mapped gaps in walking access from home to park. The analysis demonstrated that 94 percent of Seattle residents live within a 10-minute walk to a park, but it did not take quality or quantity of parks into account (Seattle Parks & Recreation, 2017). To expand upon SPR’s walkability analysis, a focus group participant encouraged SPR to include other modes of transportation in its parks plans to accommodate diverse user groups.7 Investigating transit options adds another facet of park access by recognizing people with mobility impairments as well as communities without nearby parks. There is interest and potential within the region to explore park accessibility options via public transportation. The Wilderness Society’s research seeks to fill the transit-to-parks gap, and, using equity as the driver, answer the question: How well does King County’s public transit system connect its residents to high-quality public parks?
7 “I ask that SPR do the difficult work of figuring out how to make good on BOTH goals—accessibility and equity—by properly valuing the differences in our parks and working to ensure that citizens have access to the best that our parks offer—even if they cannot reach them by foot (or cannot walk at all, such as the many disabled citizens who are also poorly served by an exclusive focus on walkability)…I would like to urge SPR to include transit, bicycle, and ADA access in their analyses, and figure out creative ways to work with community centers to facilitate citizen access to large open spaces, parks that may not be within walking distance of the people who most need them” (Seattle Parks & Recreation, 2017, p. 136).
Using equity as the driver, how well does King County’s public transit system connect its residents to high-quality public parks?
Credit: Mason Cummings
Credit: Mason Cummings
17
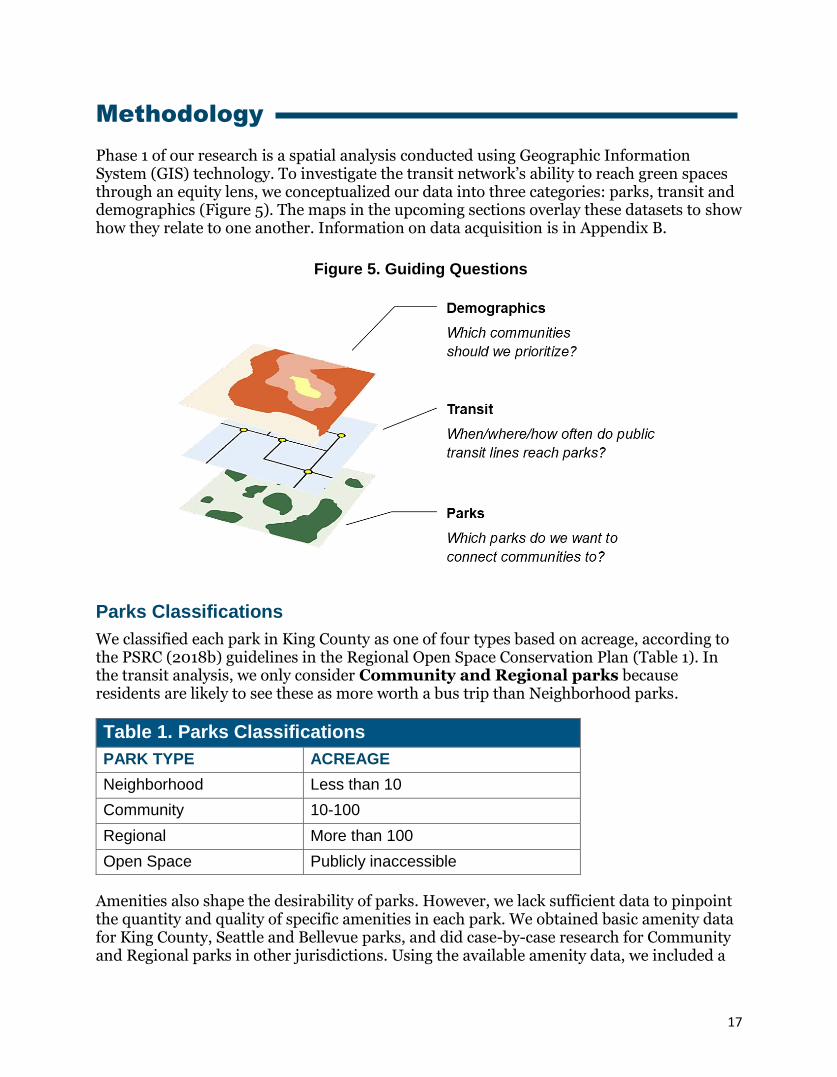
Methodology
Phase 1 of our research is a spatial analysis conducted using Geographic Information System (GIS) technology. To investigate the transit network’s ability to reach green spaces through an equity lens, we conceptualized our data into three categories: parks, transit and demographics (Figure 5). The maps in the upcoming sections overlay these datasets to show how they relate to one another. Information on data acquisition is in Appendix B.
Parks Classifications
We classified each park in King County as one of four types based on acreage, according to the PSRC (2018b) guidelines in the Regional Open Space Conservation Plan (Table 1). In the transit analysis, we only consider Community and Regional parks because residents are likely to see these as more worth a bus trip than Neighborhood parks.
Amenities also shape the desirability of parks. However, we lack sufficient data to pinpoint the quantity and quality of specific amenities in each park. We obtained basic amenity data for King County, Seattle and Bellevue parks, and did case-by-case research for Community and Regional parks in other jurisdictions. Using the available amenity data, we included a
Table 1. Parks Classifications
PARK TYPE ACREAGE
Neighborhood Less than 10
Community 10-100
Regional More than 100
Open Space Publicly inaccessible
Figure 5. Guiding Questions
18
fifth classification called “Premier parks” as a subset of Community and Regional parks. Premier parks contain at least one of each of the following: passive amenity (open space, forest, view), active amenity (opportunity for spontaneous and/or organized physical exertion such as playgrounds and sports courts/fields), trail, picnic table and restroom. Due to the range of amenity options, an individual is likely to find an activity of interest at any Premier park. Amenity diversity also affects the cultural relevance of a park. For example, some groups value public parks for their social opportunities, so amenities such as picnic areas, barbeque grills and sports facilities provide higher use value to them than trails or undisturbed forests (Gobster, 2002; Loukaitou-Sideris, 1995). Having amenities of interest encourages park visitation and Premier parks best encompass the presence of diversified amenities given our available datasets.
Transit Classifications
Using General Transit Feed Specification data8 on frequency of transit service, we classified all service areas in King County on a scale of “None” to “Frequent” (Table 2). We use PSRC’s (2018d) measure to define transit service areas as within a quarter-mile walk of a bus stop. For example, all areas that are located within a quarter mile of a bus stop with service every 20 minutes are classified as having “Fair” service.
Given that over two-thirds (68 percent) of King County Metro riders like to use transit on weekends during the day, we mapped Saturday AM and Saturday PM transit access (King County Metro, 2016b). We also mapped Wednesday PM to accommodate those who may have non-traditional work schedules or might like to visit a park during the week. The maps are modeled using transit data from October 13, 2018 and October 17, 2018.
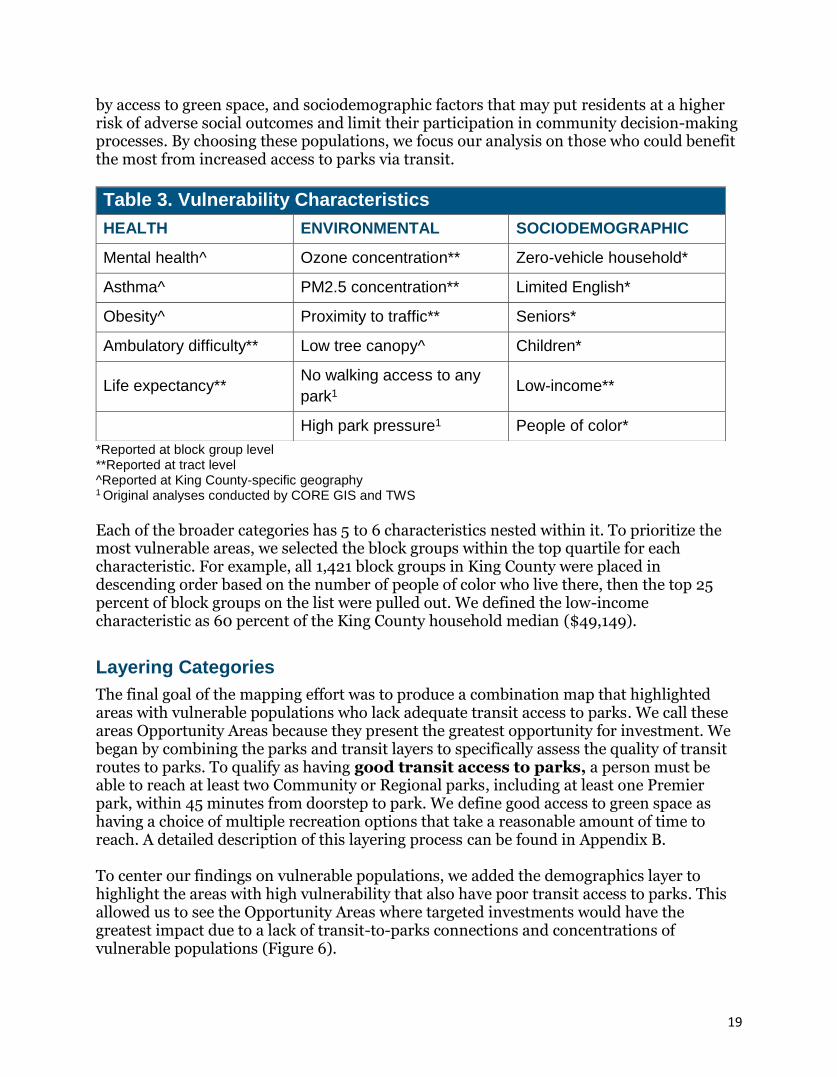
Defining Vulnerable Populations
Whereas parks and transit are relatively uncomplicated variables to understand, we needed to define the populations that deserve prioritization based on historic and present social vulnerabilities. We recognize that societal factors give some populations advantages over others, so we selected 17 group characteristics to constitute “vulnerable populations” based on relevant literature and similar studies9 (Table 3). The 17 characteristics fall into 3 broader categories: health, environmental and sociodemographic factors. These characteristics represent potential health and environmental burdens that may be mitigated
8 This dataset includes all King County Metro bus, Seattle Streetcar and King County Water Taxi service, as well as Sound Transit Link light rail service and some, but not all, Sound Transit Regional Express bus service. 9 Particularly the environmental justice mapping tool from Front and Centered (2018) and the EPA’s EJSCREEN (2018).
Table 2. Transit Classifications
CLASSIFICATION WAIT TIME
None No buses within 4-hour window
Poor 31+ minutes
Fair 16-30 minutes
Frequent 15 minutes or less
19
by access to green space, and sociodemographic factors that may put residents at a higher risk of adverse social outcomes and limit their participation in community decision-making processes. By choosing these populations, we focus our analysis on those who could benefit the most from increased access to parks via transit.
*Reported at block group level **Reported at tract level ^Reported at King County-specific geography 1 Original analyses conducted by CORE GIS and TWS
Each of the broader categories has 5 to 6 characteristics nested within it. To prioritize the most vulnerable areas, we selected the block groups within the top quartile for each characteristic. For example, all 1,421 block groups in King County were placed in descending order based on the number of people of color who live there, then the top 25 percent of block groups on the list were pulled out. We defined the low-income characteristic as 60 percent of the King County household median ($49,149).
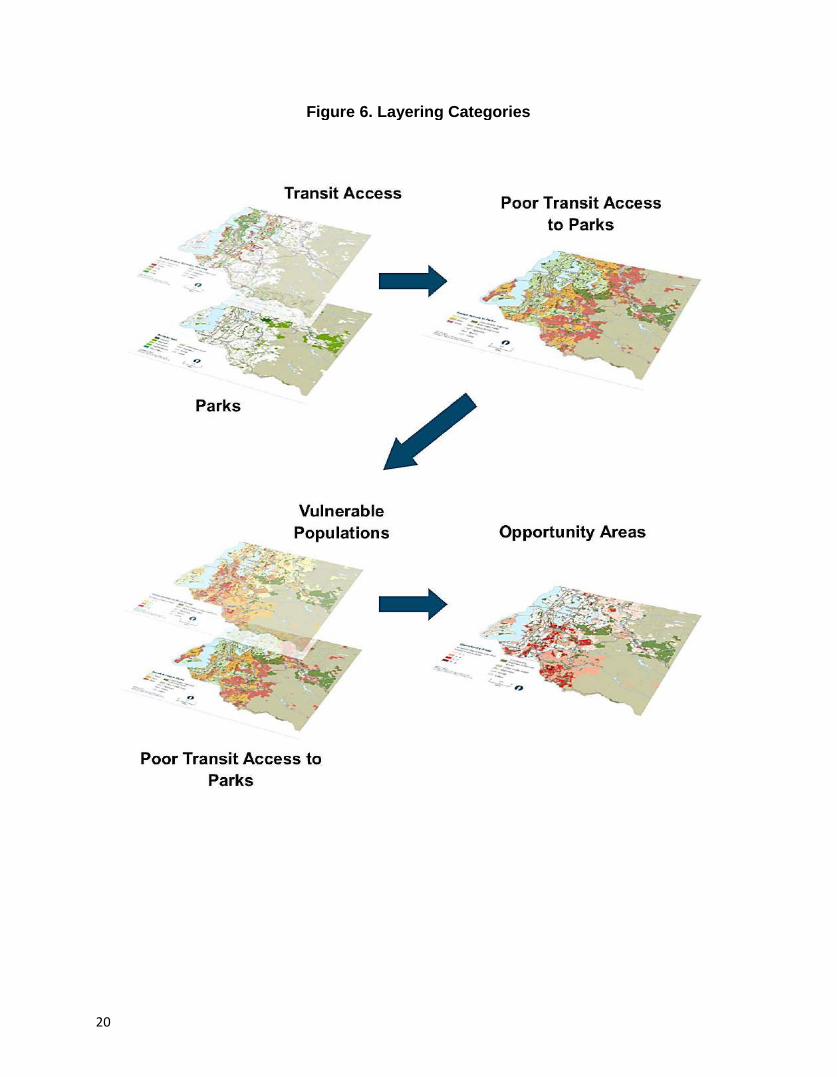
Layering Categories
The final goal of the mapping effort was to produce a combination map that highlighted areas with vulnerable populations who lack adequate transit access to parks. We call these areas Opportunity Areas because they present the greatest opportunity for investment. We began by combining the parks and transit layers to specifically assess the quality of transit routes to parks. To qualify as having good transit access to parks, a person must be able to reach at least two Community or Regional parks, including at least one Premier park, within 45 minutes from doorstep to park. We define good access to green space as having a choice of multiple recreation options that take a reasonable amount of time to reach. A detailed description of this layering process can be found in Appendix B. To center our findings on vulnerable populations, we added the demographics layer to highlight the areas with high vulnerability that also have poor transit access to parks. This allowed us to see the Opportunity Areas where targeted investments would have the greatest impact due to a lack of transit-to-parks connections and concentrations of vulnerable populations (Figure 6).
Table 3. Vulnerability Characteristics
HEALTH ENVIRONMENTAL SOCIODEMOGRAPHIC
Mental health^ Ozone concentration** Zero-vehicle household*
Asthma^ PM2.5 concentration** Limited English*
Obesity^ Proximity to traffic** Seniors*
Ambulatory difficulty** Low tree canopy^ Children*
Life expectancy** No walking access to any
park1 Low-income**
High park pressure1 People of color*
20
Figure 6. Layering Categories
21
Major Findings
The following section details the major findings from our GIS analysis.
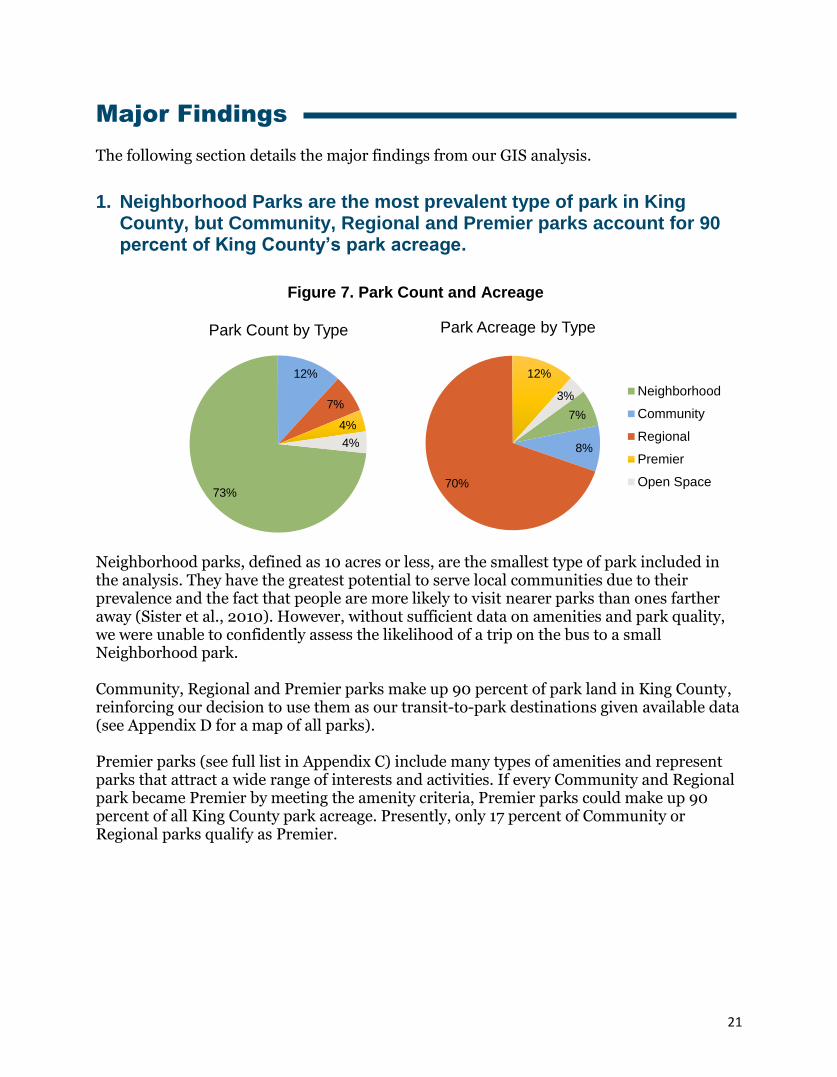
1. Neighborhood Parks are the most prevalent type of park in King County, but Community, Regional and Premier parks account for 90 percent of King County’s park acreage.
Neighborhood parks, defined as 10 acres or less, are the smallest type of park included in the analysis. They have the greatest potential to serve local communities due to their prevalence and the fact that people are more likely to visit nearer parks than ones farther away (Sister et al., 2010). However, without sufficient data on amenities and park quality, we were unable to confidently assess the likelihood of a trip on the bus to a small Neighborhood park. Community, Regional and Premier parks make up 90 percent of park land in King County, reinforcing our decision to use them as our transit-to-park destinations given available data (see Appendix D for a map of all parks). Premier parks (see full list in Appendix C) include many types of amenities and represent parks that attract a wide range of interests and activities. If every Community and Regional park became Premier by meeting the amenity criteria, Premier parks could make up 90 percent of all King County park acreage. Presently, only 17 percent of Community or Regional parks qualify as Premier.
7%
8%
70%
12%
3%
Park Acreage by Type
Neighborhood
Community
Regional
Premier
Open Space73%
12%
7%
4%
4%
Park Count by Type
Figure 7. Park Count and Acreage
22
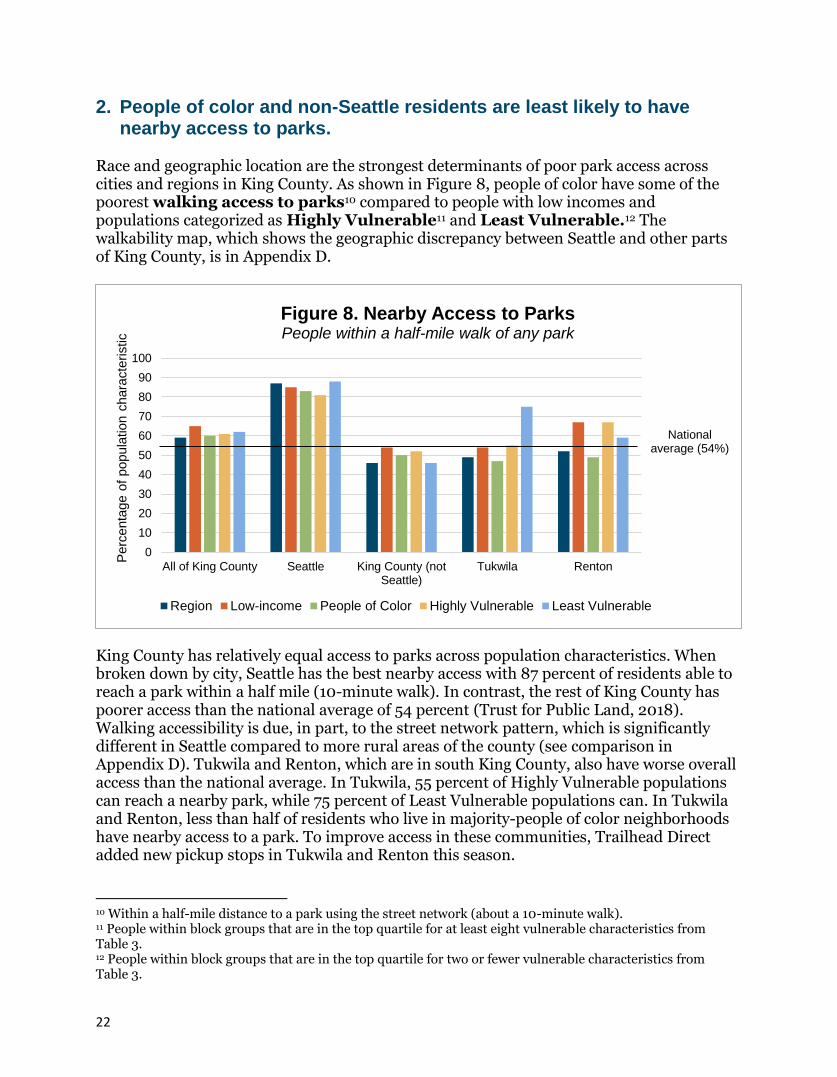
2. People of color and non-Seattle residents are least likely to have nearby access to parks.
Race and geographic location are the strongest determinants of poor park access across cities and regions in King County. As shown in Figure 8, people of color have some of the poorest walking access to parks10 compared to people with low incomes and populations categorized as Highly Vulnerable11 and Least Vulnerable.12 The walkability map, which shows the geographic discrepancy between Seattle and other parts of King County, is in Appendix D. King County has relatively equal access to parks across population characteristics. When broken down by city, Seattle has the best nearby access with 87 percent of residents able to reach a park within a half mile (10-minute walk). In contrast, the rest of King County has poorer access than the national average of 54 percent (Trust for Public Land, 2018). Walking accessibility is due, in part, to the street network pattern, which is significantly different in Seattle compared to more rural areas of the county (see comparison in Appendix D). Tukwila and Renton, which are in south King County, also have worse overall access than the national average. In Tukwila, 55 percent of Highly Vulnerable populations can reach a nearby park, while 75 percent of Least Vulnerable populations can. In Tukwila and Renton, less than half of residents who live in majority-people of color neighborhoods have nearby access to a park. To improve access in these communities, Trailhead Direct added new pickup stops in Tukwila and Renton this season.
10 Within a half-mile distance to a park using the street network (about a 10-minute walk). 11 People within block groups that are in the top quartile for at least eight vulnerable characteristics from Table 3. 12 People within block groups that are in the top quartile for two or fewer vulnerable characteristics from Table 3.
0
10
20
30
40
50
60
70
80
90
100
All of King County Seattle King County (notSeattle)
Tukwila Renton
Perc
enta
ge o
f popula
tion c
hara
cte
ristic
Figure 8. Nearby Access to ParksPeople within a half-mile walk of any park
Region Low-income People of Color Highly Vulnerable Least Vulnerable
National average (54%)
23
With the right infrastructure, we can connect people to quality parks even if they currently do not live within walking distance. For example, while 61 percent of Highly Vulnerable populations live within a half mile of a park, 92 percent live within two miles of a Community or Regional park. These parks are well-placed to serve the surrounding neighborhoods via a short transit ride, providing quick connections for residents who live slightly too far to walk to a park.
3. Park pressure is inversely related to income. Park pressure measures the amount of congestion a park has if everyone visits the park nearest to their home. Park pressure is generally measured in acres/1,000 people, and a park with lower pressure, and thus less crowding, is considered more appealing to its residents. Each distinct colored area in the park pressure map in Appendix D represents a “park service area,” or the area for which the specified park is the nearest park. According to Sister et al. (2010), the National Recreation and Park Association (NRPA) standard is 6 to 10 acres/1,000 residents. Following this standard, 53 percent of King County park service areas meet or surpass the range of adequate park pressure. Sister et al. (2010) also found correlations between park pressure and different demographic groups. For example, African American and Latinx populations in Los Angeles were more likely to live in areas with high park pressure compared to their white counterparts. Income was also correlated with park pressure, with lower-income residents more likely to live with high park pressure.
Credit: Mason Cummings
24
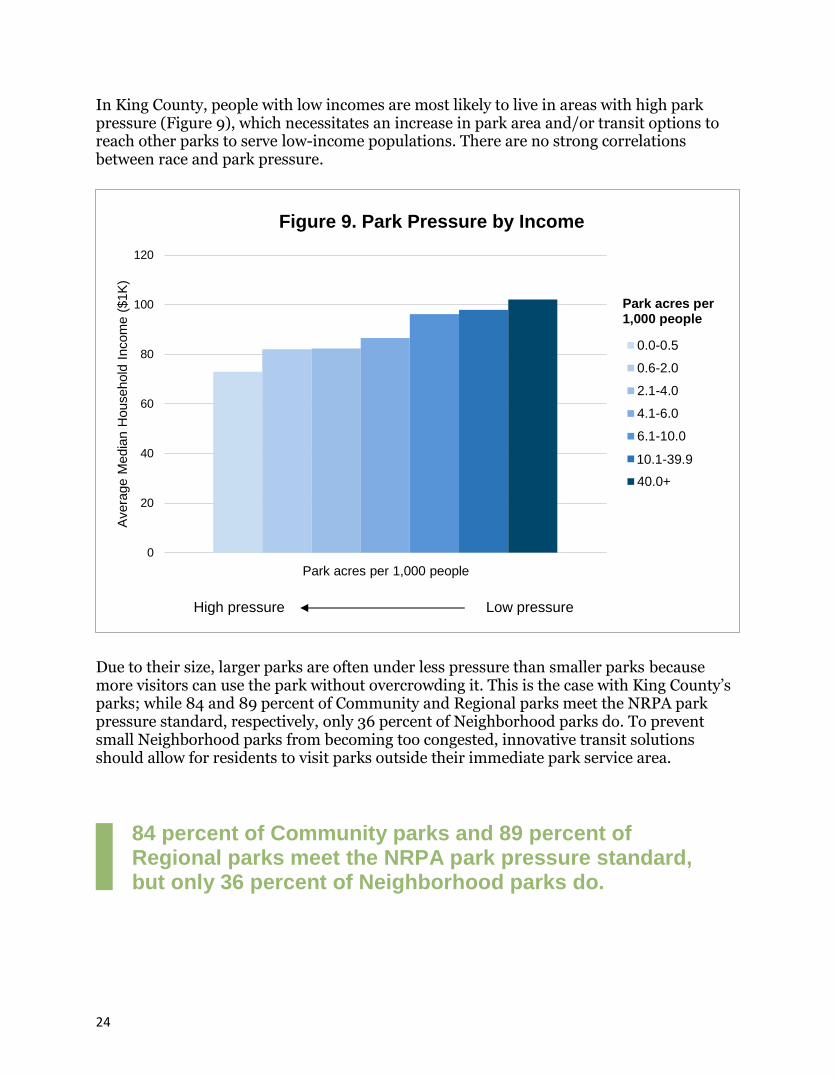
In King County, people with low incomes are most likely to live in areas with high park pressure (Figure 9), which necessitates an increase in park area and/or transit options to reach other parks to serve low-income populations. There are no strong correlations between race and park pressure.
Due to their size, larger parks are often under less pressure than smaller parks because more visitors can use the park without overcrowding it. This is the case with King County’s parks; while 84 and 89 percent of Community and Regional parks meet the NRPA park pressure standard, respectively, only 36 percent of Neighborhood parks do. To prevent small Neighborhood parks from becoming too congested, innovative transit solutions should allow for residents to visit parks outside their immediate park service area.
High pressure Low pressure
0
20
40
60
80
100
120
Avera
ge M
edia
n H
ousehold
Incom
e (
$1K
)
Park acres per 1,000 people
Figure 9. Park Pressure by Income
0.0-0.5
0.6-2.0
2.1-4.0
4.1-6.0
6.1-10.0
10.0-39.9
40.0+
Park acres per 1,000 people
10.1-39.9
84 percent of Community parks and 89 percent of Regional parks meet the NRPA park pressure standard, but only 36 percent of Neighborhood parks do.
25
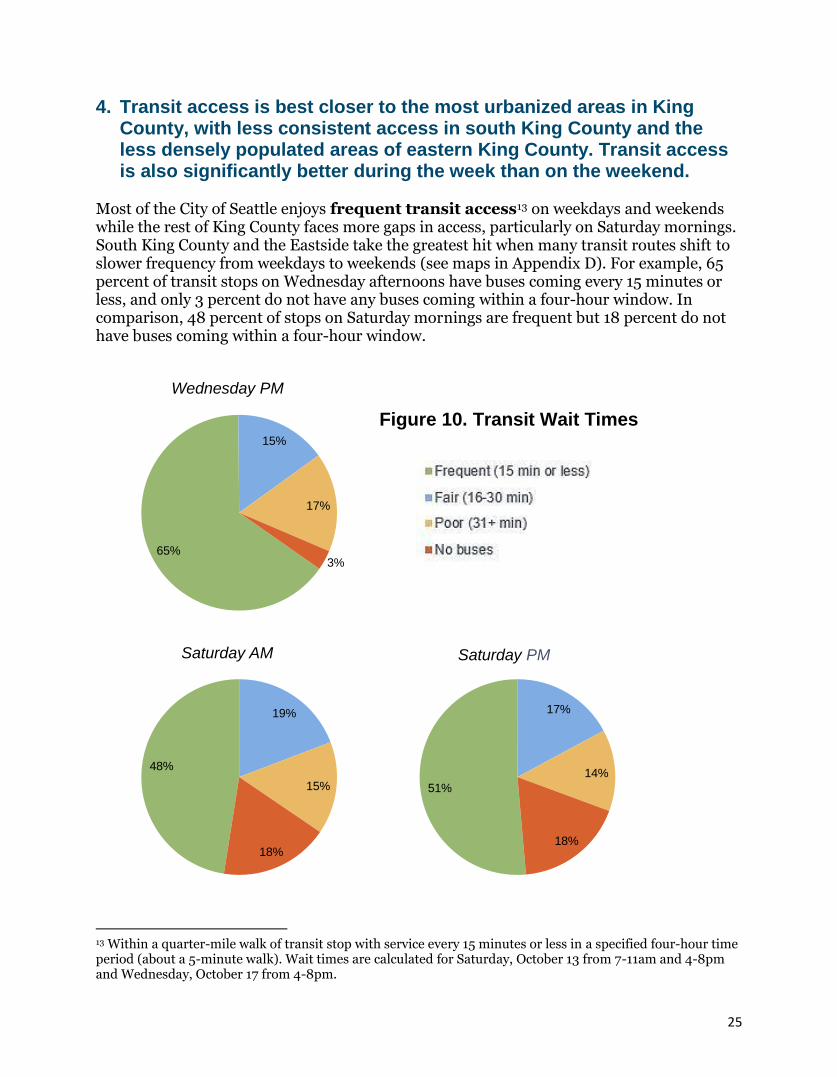
4. Transit access is best closer to the most urbanized areas in King County, with less consistent access in south King County and the less densely populated areas of eastern King County. Transit access is also significantly better during the week than on the weekend.
Most of the City of Seattle enjoys frequent transit access13 on weekdays and weekends while the rest of King County faces more gaps in access, particularly on Saturday mornings. South King County and the Eastside take the greatest hit when many transit routes shift to slower frequency from weekdays to weekends (see maps in Appendix D). For example, 65 percent of transit stops on Wednesday afternoons have buses coming every 15 minutes or less, and only 3 percent do not have any buses coming within a four-hour window. In comparison, 48 percent of stops on Saturday mornings are frequent but 18 percent do not have buses coming within a four-hour window.
13 Within a quarter-mile walk of transit stop with service every 15 minutes or less in a specified four-hour time period (about a 5-minute walk). Wait times are calculated for Saturday, October 13 from 7-11am and 4-8pm and Wednesday, October 17 from 4-8pm.
48%
19%
15%
18%
Saturday AM
65%
15%
17%
3%
Wednesday PM
51%
17%
14%
18%
Saturday PM
Figure 10. Transit Wait Times
26
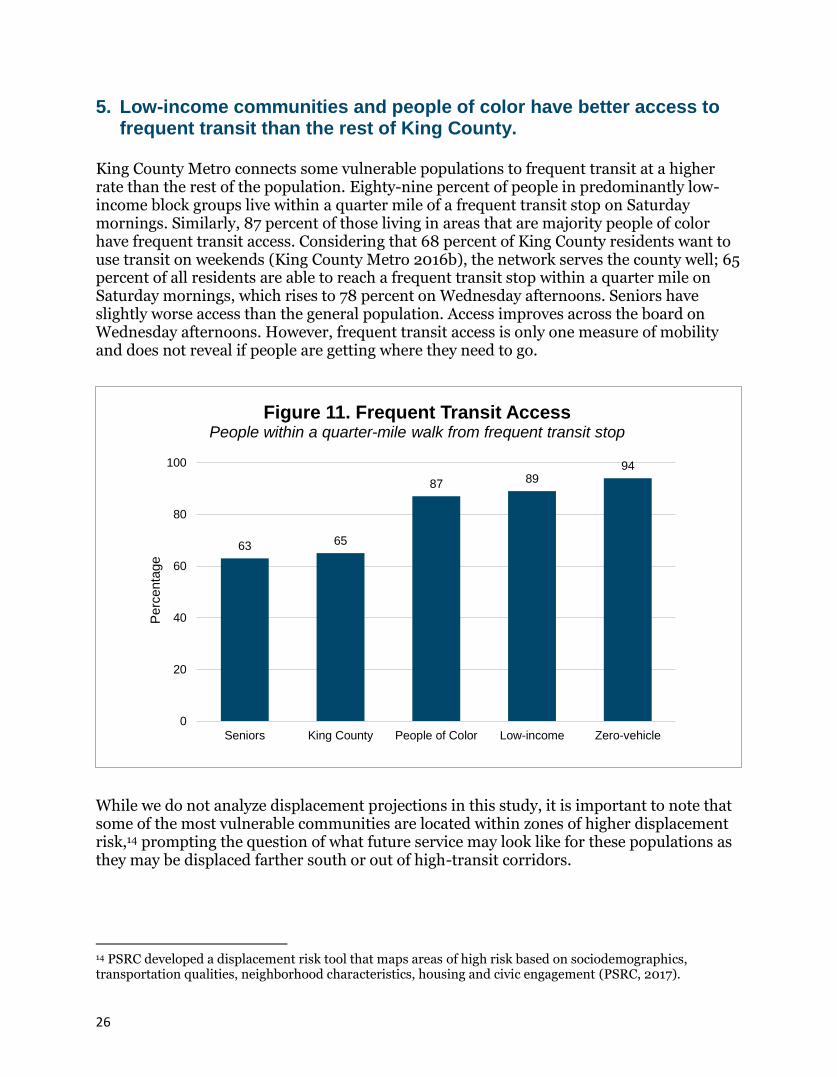
5. Low-income communities and people of color have better access to frequent transit than the rest of King County.
King County Metro connects some vulnerable populations to frequent transit at a higher rate than the rest of the population. Eighty-nine percent of people in predominantly low-income block groups live within a quarter mile of a frequent transit stop on Saturday mornings. Similarly, 87 percent of those living in areas that are majority people of color have frequent transit access. Considering that 68 percent of King County residents want to use transit on weekends (King County Metro 2016b), the network serves the county well; 65 percent of all residents are able to reach a frequent transit stop within a quarter mile on Saturday mornings, which rises to 78 percent on Wednesday afternoons. Seniors have slightly worse access than the general population. Access improves across the board on Wednesday afternoons. However, frequent transit access is only one measure of mobility and does not reveal if people are getting where they need to go.
While we do not analyze displacement projections in this study, it is important to note that some of the most vulnerable communities are located within zones of higher displacement risk,14 prompting the question of what future service may look like for these populations as they may be displaced farther south or out of high-transit corridors.
14 PSRC developed a displacement risk tool that maps areas of high risk based on sociodemographics, transportation qualities, neighborhood characteristics, housing and civic engagement (PSRC, 2017).
63 65
87 8994
0
20
40
60
80
100
Seniors King County People of Color Low-income Zero-vehicle
Perc
enta
ge
Figure 11. Frequent Transit AccessPeople within a quarter-mile walk from frequent transit stop
27
6. The populations most vulnerable to health factors are predominately located from south Seattle to south King County with concentrations in Burien, Federal Way and Algona.
The health map on page 28 shows the layering of five characteristics: mental health, asthma, obesity, ambulatory difficulty and life expectancy (Figure 12). The most vulnerable populations live in south Seattle and south King County. In contrast, there are very few vulnerabilities present in north Seattle and the Eastside.
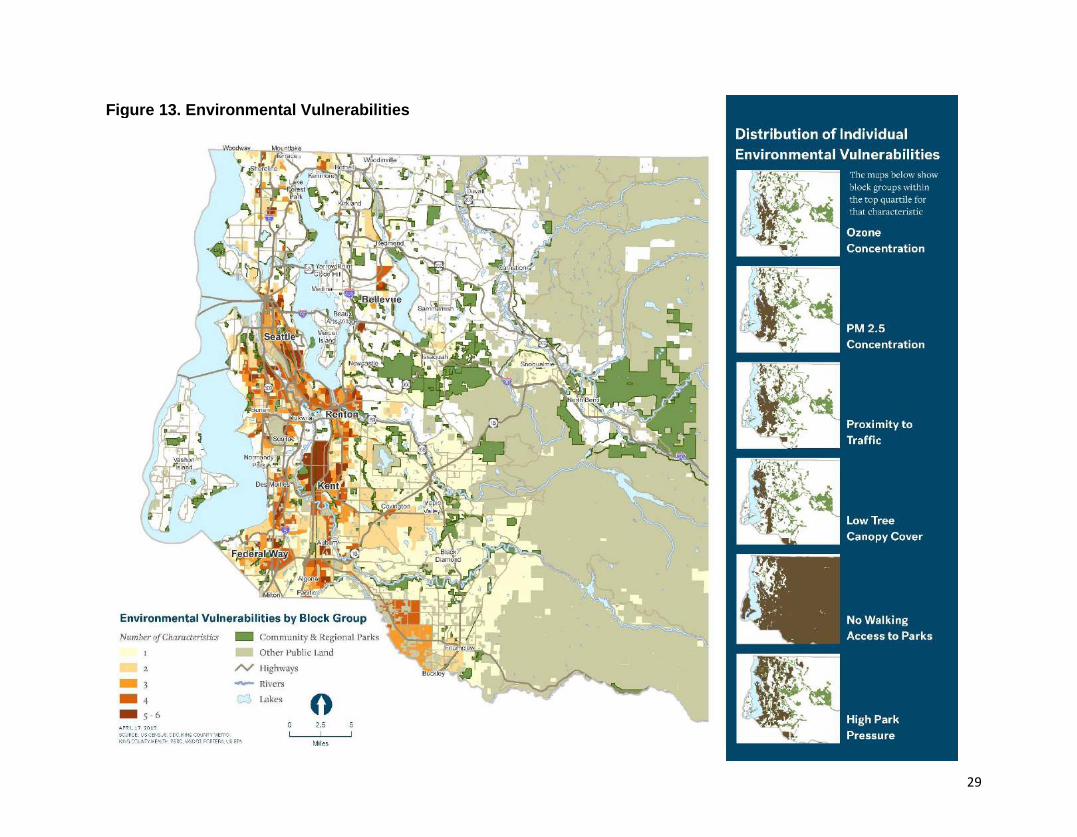
7. The populations most vulnerable to environmental factors are predominantly located in the urban and industrial areas of central and south Seattle, extending into the more populated regions of south King County.
The map on page 29 combines six environmental characteristics: ozone concentration, PM2.5 concentration, proximity to traffic, low tree canopy cover, no walking access to any park and high park pressure (Figure 13). All these characteristics are highly associated with urban areas, so it is not surprising that most of the vulnerable neighborhoods are in urban and industrial parts of the county. Larger highly vulnerable areas emerge in downtown Seattle, South Park, Georgetown, Beacon Hill, Rainier Valley and Kent.
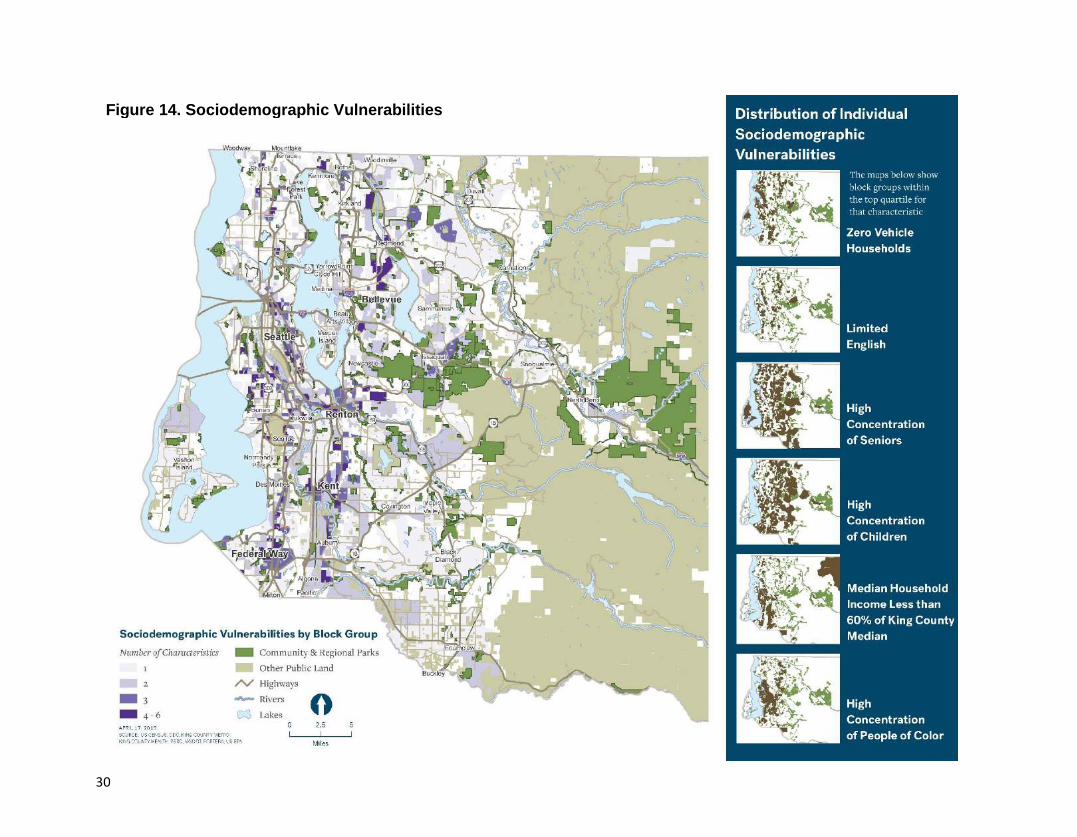
8. The populations most vulnerable to sociodemographic factors are scattered around south Seattle, south King County and the Eastside.
Six characteristics make up the sociodemographic map on page 30: zero-vehicle households, limited English, seniors, children, low-income and people of color (Figure 14). Unlike the other two maps, the areas with high vulnerability are spread out over most of the county. The most significant pockets are around south Seattle, Renton, Kent, Federal Way and Bellevue, but the patterns are less defined than in the health and environmental maps.
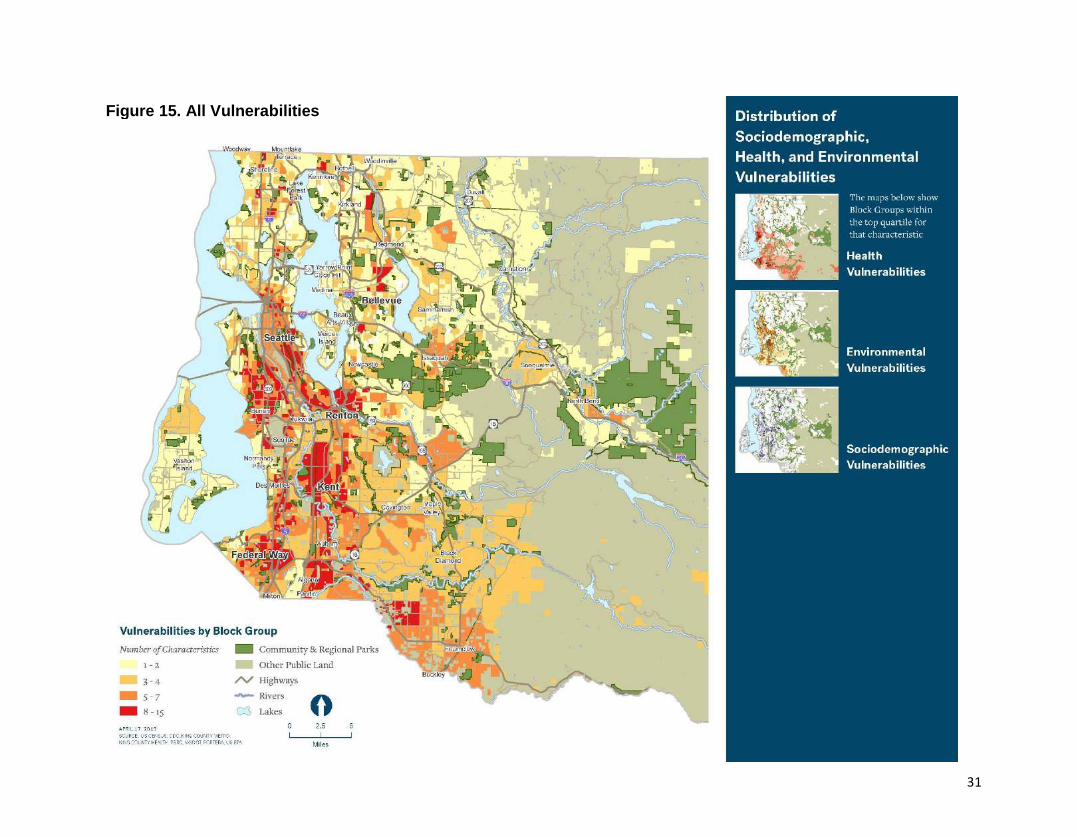
9. South Seattle and south King County face disproportionate health, environmental and sociodemographic vulnerabilities.
The overall vulnerability map on page 31 combines all three categories, layering the top quartiles of all 17 potential characteristics (Figure 15). The most any block group has is 15 characteristics and the least is zero. This map highlights the areas that experience numerous vulnerabilities and deserve priority attention in equity planning. These Highly Vulnerable areas (in the top quartile for at least eight characteristics) include central and south Seattle, Burien, Renton, Kent, Federal Way, Tukwila and around Enumclaw.
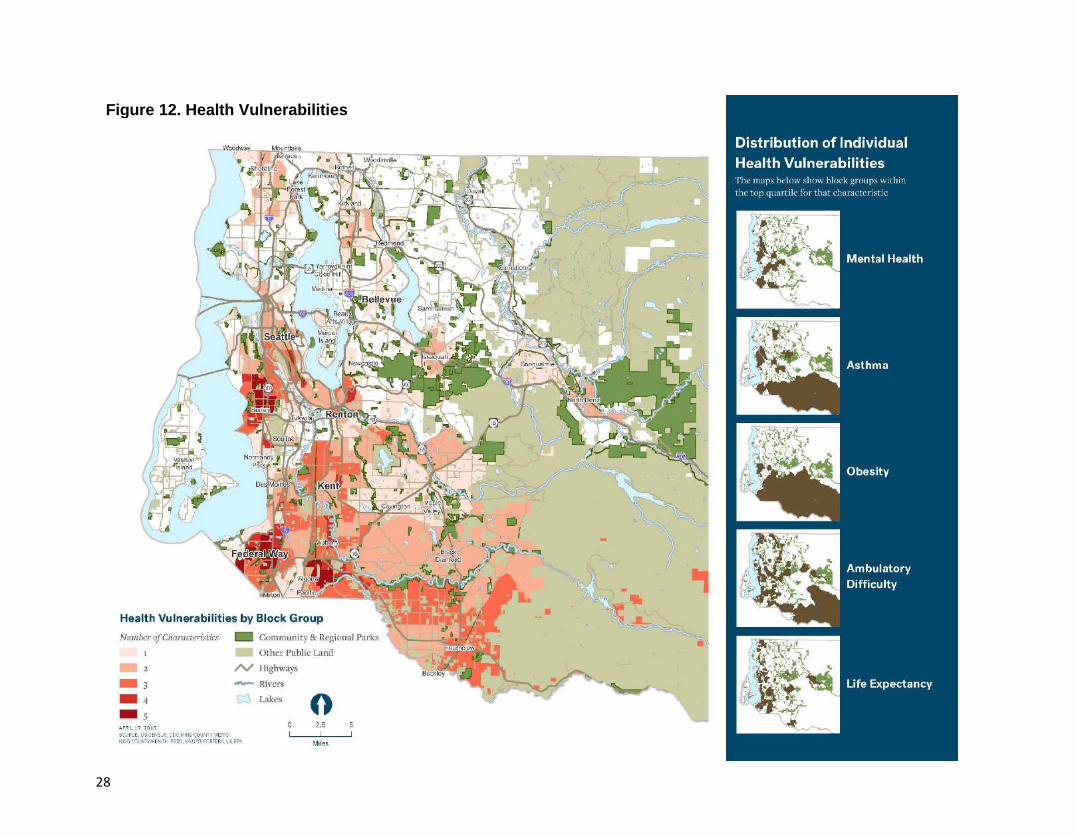
28
Figure 12. Health Vulnerabilities
29
Figure 13. Environmental Vulnerabilities
30
Figure 14. Sociodemographic Vulnerabilities
31
Figure 15. All Vulnerabilities
32
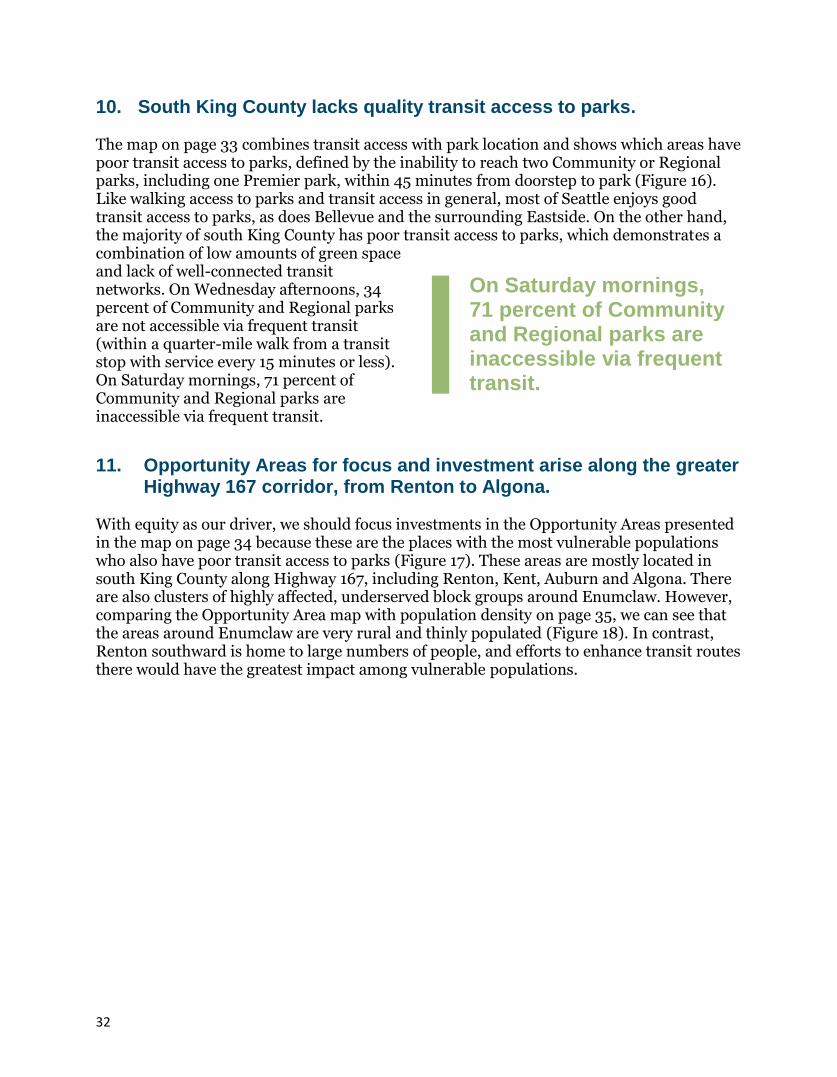
10. South King County lacks quality transit access to parks. The map on page 33 combines transit access with park location and shows which areas have poor transit access to parks, defined by the inability to reach two Community or Regional parks, including one Premier park, within 45 minutes from doorstep to park (Figure 16). Like walking access to parks and transit access in general, most of Seattle enjoys good transit access to parks, as does Bellevue and the surrounding Eastside. On the other hand, the majority of south King County has poor transit access to parks, which demonstrates a combination of low amounts of green space and lack of well-connected transit networks. On Wednesday afternoons, 34 percent of Community and Regional parks are not accessible via frequent transit (within a quarter-mile walk from a transit stop with service every 15 minutes or less). On Saturday mornings, 71 percent of Community and Regional parks are inaccessible via frequent transit.
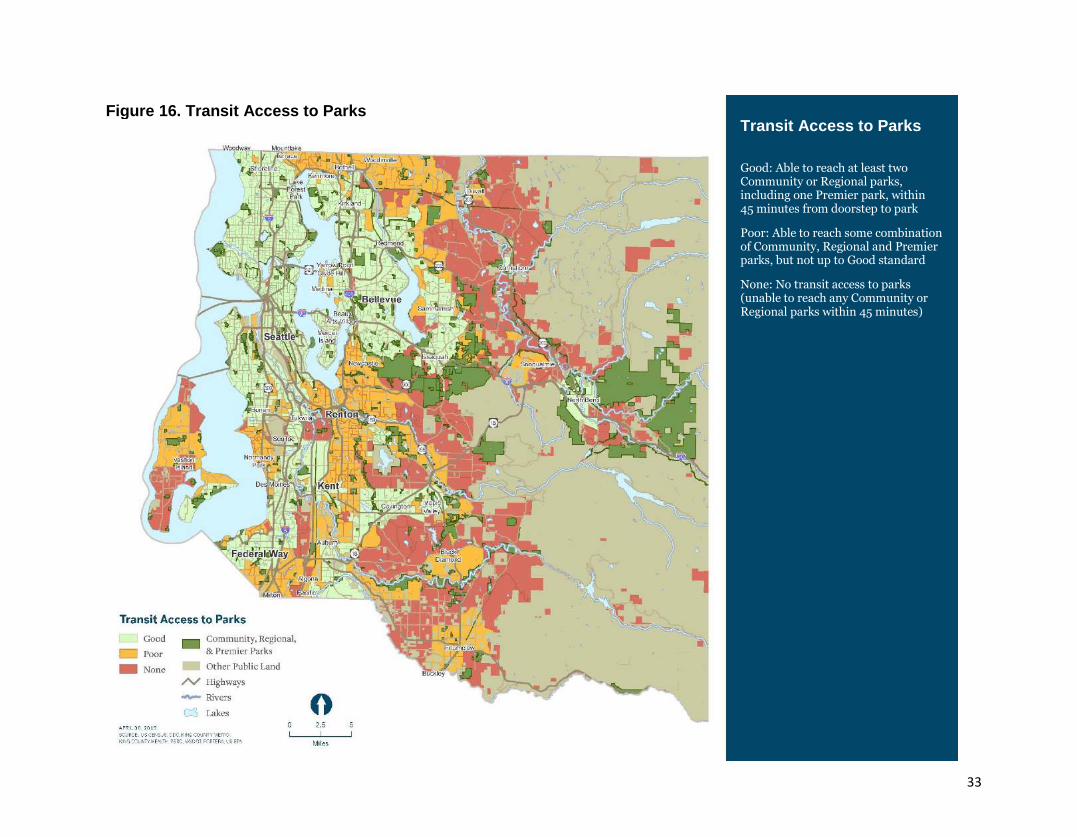
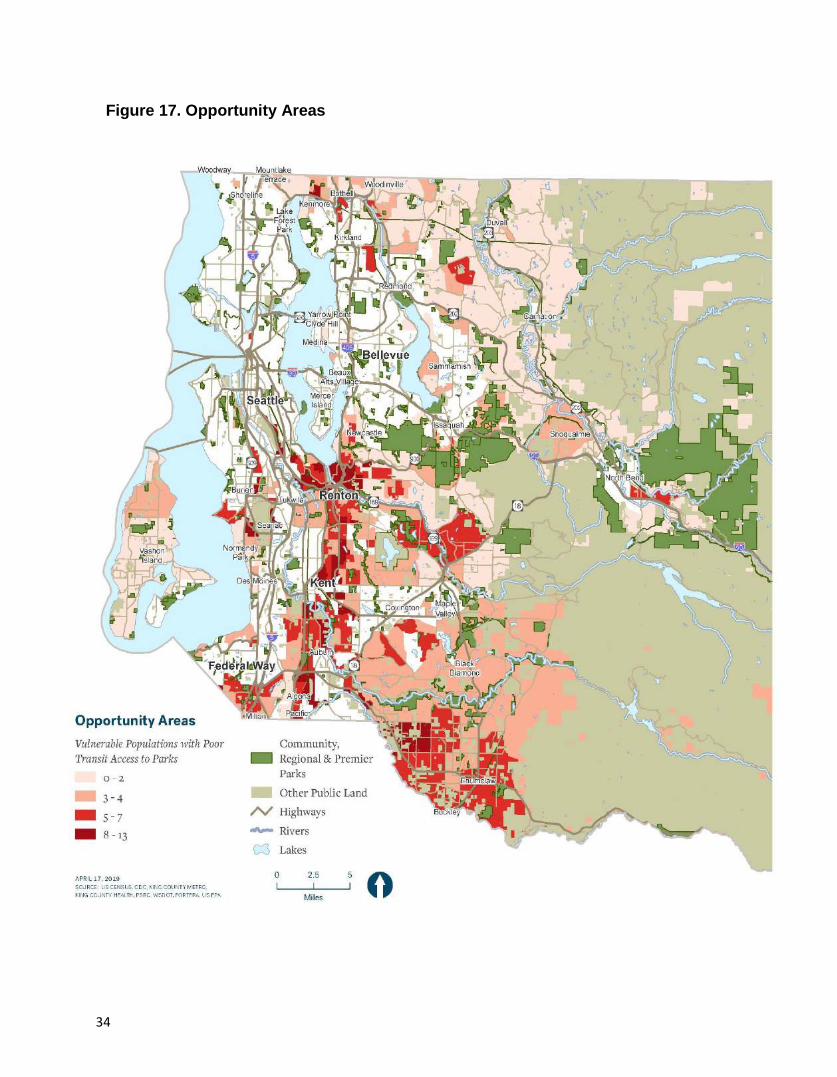
11. Opportunity Areas for focus and investment arise along the greater Highway 167 corridor, from Renton to Algona.
With equity as our driver, we should focus investments in the Opportunity Areas presented in the map on page 34 because these are the places with the most vulnerable populations who also have poor transit access to parks (Figure 17). These areas are mostly located in south King County along Highway 167, including Renton, Kent, Auburn and Algona. There are also clusters of highly affected, underserved block groups around Enumclaw. However, comparing the Opportunity Area map with population density on page 35, we can see that the areas around Enumclaw are very rural and thinly populated (Figure 18). In contrast, Renton southward is home to large numbers of people, and efforts to enhance transit routes there would have the greatest impact among vulnerable populations.
On Saturday mornings, 71 percent of Community and Regional parks are inaccessible via frequent transit.
33
Transit Access to Parks
Good: Able to reach at least two Community or Regional parks, including one Premier park, within 45 minutes from doorstep to park
Poor: Able to reach some combination of Community, Regional and Premier parks, but not up to Good standard
None: No transit access to parks (unable to reach any Community or Regional parks within 45 minutes)
Figure 16. Transit Access to Parks
34
Figure 17. Opportunity Areas
35
Figure 18. Opportunity Areas and Population Density
36
Discussion and Recommendations
The following section summarizes our findings into main takeaways and provides preliminary recommendations to improve King County’s transit-to-parks network. We hope to collaborate with King County and other partners to explore and achieve the recommended actions.
1. Opportunity Areas exhibit the highest need for transit-to-parks investments.
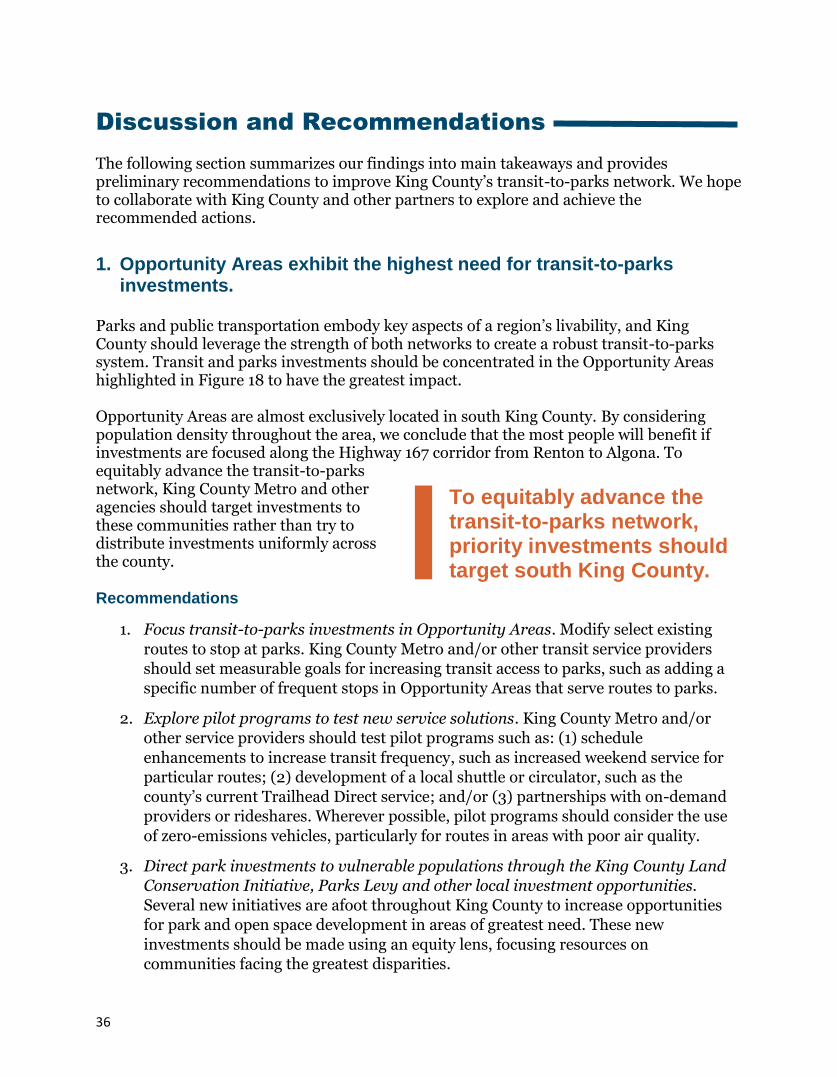
Parks and public transportation embody key aspects of a region’s livability, and King County should leverage the strength of both networks to create a robust transit-to-parks system. Transit and parks investments should be concentrated in the Opportunity Areas highlighted in Figure 18 to have the greatest impact. Opportunity Areas are almost exclusively located in south King County. By considering population density throughout the area, we conclude that the most people will benefit if investments are focused along the Highway 167 corridor from Renton to Algona. To equitably advance the transit-to-parks network, King County Metro and other agencies should target investments to these communities rather than try to distribute investments uniformly across the county. Recommendations
1. Focus transit-to-parks investments in Opportunity Areas. Modify select existing
routes to stop at parks. King County Metro and/or other transit service providers
should set measurable goals for increasing transit access to parks, such as adding a
specific number of frequent stops in Opportunity Areas that serve routes to parks.
2. Explore pilot programs to test new service solutions. King County Metro and/or
other service providers should test pilot programs such as: (1) schedule
enhancements to increase transit frequency, such as increased weekend service for
particular routes; (2) development of a local shuttle or circulator, such as the
county’s current Trailhead Direct service; and/or (3) partnerships with on-demand
providers or rideshares. Wherever possible, pilot programs should consider the use
of zero-emissions vehicles, particularly for routes in areas with poor air quality.
3. Direct park investments to vulnerable populations through the King County Land
Conservation Initiative, Parks Levy and other local investment opportunities.
Several new initiatives are afoot throughout King County to increase opportunities
for park and open space development in areas of greatest need. These new
investments should be made using an equity lens, focusing resources on
communities facing the greatest disparities.
To equitably advance the transit-to-parks network, priority investments should target south King County.
37
2. More data will help identify and increase the number of high-quality parks.
To fully inventory parks of interest, we need more information about park quality. A comprehensive parks needs assessment in King County would fill critical data gaps about park quality including amenity presence, prevalence and condition. Specifically, data on Neighborhood parks, which were not included in our analysis, could identify which ones are of high quality and expand the list of parks of interest. Our analysis was limited to larger Community and Regional parks, plus Premier parks, because consistent data was not available to ascertain the quality of Neighborhood parks across the county. However, Neighborhood parks have great potential to serve local populations because they (1) are located nearby; (2) make up 74 percent of the county’s parks; and (3) can establish the strongest platform for close community connections.
We know that improving park quality can be as effective at increasing park equity as improving transit connections, if not more effective. Raising more parks into the Premier category will also increase park access. This would include adding more park amenities such as restrooms or play equipment to accommodate a greater range of needs. Currently, only 29 percent of Highly
Vulnerable populations live within two miles of a Premier park. However, because 92 percent live near a Community or Regional park, improving the quality of all Community and Regional parks could increase the percentage of Highly Vulnerable groups that live close to a Premier park to 92 percent as well. Access is about quality as well as quantity and high-quality parks contribute the most to thriving communities. Recommendations
1. Conduct a comprehensive parks needs assessment in King County to measure
overall park quality including data on amenity presence, prevalence and condition.
Consistent and updated data on park amenities and conditions is critical to
identifying highest-need areas and driving strategic park investments and more
equitable allocation of resources. This detailed information would provide a
foundation for county- and city-level park planning. A needs assessment should
engage local community groups to identify what is needed to make parks safer,
culturally relevant and overall assets to the community. King County Parks should
plan for and conduct an assessment following the passage of the King County Parks
Levy in August 2019.
2. Solicit community engagement to identify community needs and prioritize projects.
As discussed above, any parks assessment or planning effort should be informed by
community input and engagement. King County and other agencies should work
with community groups to identify community needs and prioritize projects through
thoughtful and culturally appropriate community engagement strategies.
Improving park quality can be as effective at increasing park equity as improving transit connections.
38
3. Based on community feedback, add culturally relevant amenities to parks serving
Highly Vulnerable populations to increase park value to the local community.
Too often, parks are not utilized because they do not meet a local community’s needs
for amenities, such as high-quality, reservation-free soccer fields, large picnic
shelters and community gathering spaces. King County Parks and partner
organizations should determine amenities investments based on local input and
expertise.
4. Maintain high park quality (amenity condition, cleanliness, attractiveness).
Creating and acquiring new parks and open spaces are only effective investments if
those spaces can be adequately maintained over time. Without attention to
maintenance, these areas can fall into disrepair and become places that harbor
unwanted activities in the neighborhood or are simply unsafe to use. King County
agencies should make park maintenance part of every park planning project, which
may mean setting aside more funding for park operations and maintenance or
developing community-based partnerships with local stewardship groups.
5. Create more park programming and partnerships to encourage community use.
Park programming can make going to a park more fun and appealing to surrounding
communities, and it can also draw in new park users who may not otherwise use the
space. King County agencies should reach out to community organizations based in
Opportunity Areas to explore the types of programming they can provide.
Credit: Mason Cummings
39
3. King County’s transit network does not fulfill its potential to connect Highly Vulnerable communities to parks.
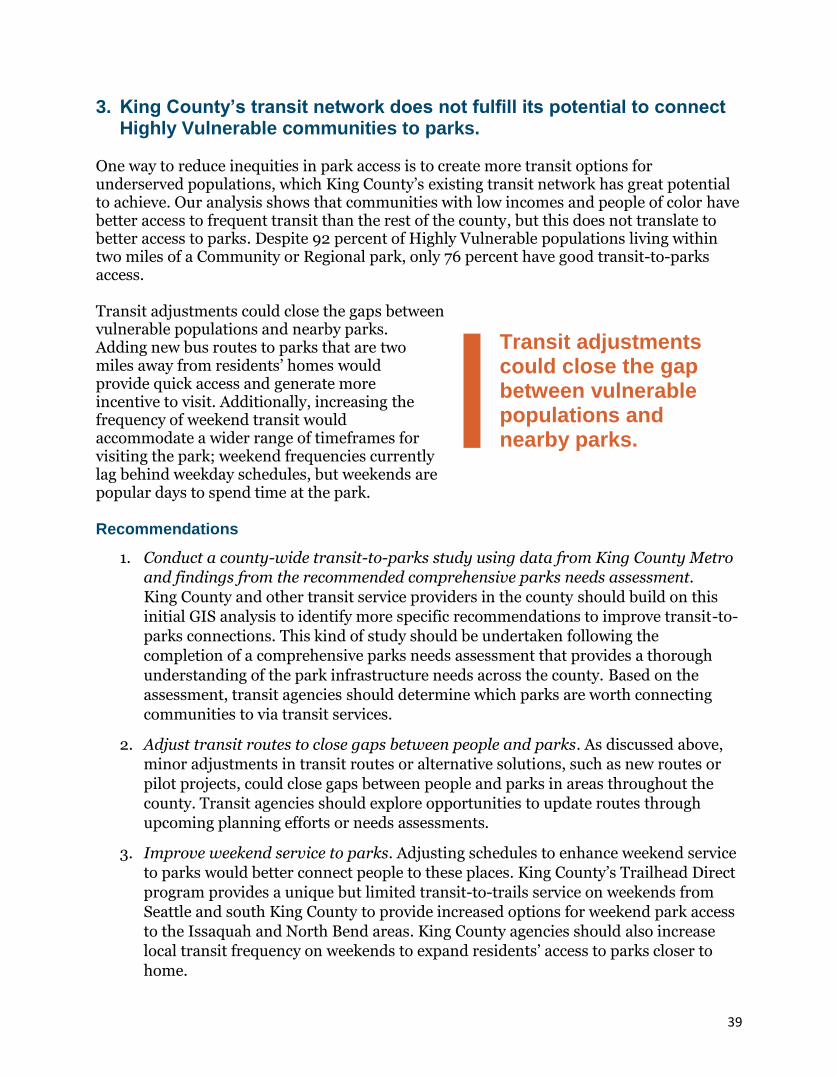
One way to reduce inequities in park access is to create more transit options for underserved populations, which King County’s existing transit network has great potential to achieve. Our analysis shows that communities with low incomes and people of color have better access to frequent transit than the rest of the county, but this does not translate to better access to parks. Despite 92 percent of Highly Vulnerable populations living within two miles of a Community or Regional park, only 76 percent have good transit-to-parks access. Transit adjustments could close the gaps between vulnerable populations and nearby parks. Adding new bus routes to parks that are two miles away from residents’ homes would provide quick access and generate more incentive to visit. Additionally, increasing the frequency of weekend transit would accommodate a wider range of timeframes for visiting the park; weekend frequencies currently lag behind weekday schedules, but weekends are popular days to spend time at the park. Recommendations
1. Conduct a county-wide transit-to-parks study using data from King County Metro
and findings from the recommended comprehensive parks needs assessment.
King County and other transit service providers in the county should build on this
initial GIS analysis to identify more specific recommendations to improve transit-to-
parks connections. This kind of study should be undertaken following the
completion of a comprehensive parks needs assessment that provides a thorough
understanding of the park infrastructure needs across the county. Based on the
assessment, transit agencies should determine which parks are worth connecting
communities to via transit services.
2. Adjust transit routes to close gaps between people and parks. As discussed above,
minor adjustments in transit routes or alternative solutions, such as new routes or
pilot projects, could close gaps between people and parks in areas throughout the
county. Transit agencies should explore opportunities to update routes through
upcoming planning efforts or needs assessments.
3. Improve weekend service to parks. Adjusting schedules to enhance weekend service
to parks would better connect people to these places. King County’s Trailhead Direct
program provides a unique but limited transit-to-trails service on weekends from
Seattle and south King County to provide increased options for weekend park access
to the Issaquah and North Bend areas. King County agencies should also increase
local transit frequency on weekends to expand residents’ access to parks closer to
home.
Transit adjustments could close the gap between vulnerable populations and nearby parks.
40
4. Current quality transit-to-parks routes need strategic and increased advertisement and investments.
There are many quality transit-to-parks routes currently operating. For example, King County’s Trailhead Direct program provides access from downtown Seattle, Tukwila, Renton, Bellevue and Issaquah to some of the most popular parks and trails in the county. Currently, between 71 and 73 percent of King County residents can reach two Regional or Community parks, including one Premier park, within 45 minutes. However, just because the routes exist does not mean that they are utilized as well as they could be. To fully utilize the quality transit-to-parks routes King County already has, the public must be aware of and encouraged to take the bus to a park. Recommendations
1. Permanently authorize King County’s Trailhead Direct transit service and continue
to evaluate and refine service delivery to better meet community needs. In 2017,
King County made a bold investment in the pilot transit-to-trails service, Trailhead
Direct. Since its inception, Trailhead Direct has grown steadily in ridership and
provided much-needed access to some of the region’s most popular trails and parks.
This year, King County should permanently authorize this service and continue to
evaluate and refine it to meet community needs, particularly in south King County.
King County has established a successful model that other Puget Sound counties
should consider implementing.
2. Educate the public about existing transit routes to parks. Through a variety of
partnerships, King County Metro should identify and promote specific transit routes
that provide access to parks of interest in the region (for example, the Premier parks
listed in Appendix C). King County Metro should partner with local cities on
education campaigns to show how the transit system can serve communities beyond
home-to-work commuting needs. King County Metro should also work with
community partners to raise awareness through methods including, but not limited
to, signage in bus shelters, inside buses and on Metro maps. Transit information at
parks should also provide park visitors with the information necessary to take the
bus the next time they visit.
3. Forge strategic partnerships with community-based organizations to promote
transit-to-parks routes and develop complementary programming. Transit-to-
parks routes need active and ongoing investment to ensure communities know about
and utilize them. Such promotion could be facilitated through strategic partnerships
with community-based organizations that could use the service to support unique
organizational goals. King County has a multitude of programs that could support
such partnership ventures.
Between 71 and 73 percent of King County residents can reach two Regional or Community parks within 45 minutes from doorstep to park.
41
5. Public health benefits of parks are compelling and should be leveraged to encourage visitation.
Health improvements are often the most compelling benefits of green spaces. Building strategies around the parks-health connection should be part of the push for equitable park access. As highlighted by our study and the King County Comprehensive Health Needs Assessment (Public Health, 2018-19), south King County already faces the greatest health burdens such as mental health, obesity and early mortality. Communities experiencing these adverse health effects can significantly benefit from exposure to green space and, as described above, programming and partnerships can help get people to the park. For example, organized activities could introduce non-park users to the benefits associated with going to the park and encourage them to continue going on their own. Additionally, partnerships between health providers and park agencies could incorporate nature into structured health plans for patients as part of a park or trail prescription program, which has recently found success in Whatcom County (Recreation Northwest, 2019) and across the country. According to a recent survey in July 2018, the U.S. now has 71 provider-based nature-prescription programs in 32 states, aiming to connect hundreds of thousands of patients with the health benefits of nature (Reuben, 2019). Recommendations
1. Forge new partnerships across the public health and parks communities to
promote the health benefits of parks through innovative programs such as Park
Prescriptions (Rx). Reference the growing body of research around the health
benefits of parks to build new partnerships and programming that connect
communities to this low-cost, publicly accessible resource for healthy living. King
County Parks, King County Public Health and other health agencies should
partner to explore the viability of a Park Prescription program for the region.
2. Support active programming to encourage park users to exercise. As discussed
above, park programming is important to support community utilization of these
public assets. King County agencies should create active programming that
specifically encourages park users to exercise and provides them with critical
health benefits.
Credit: Eli Brownell, King County Parks
42
Next Steps
King County’s extensive parks and transit systems provide the structure for a strong transit-to-parks network. King County Metro has prioritized transit access for people of color and communities with low incomes, and has successfully connected nearly 90 percent of those populations to frequent transit stops. However, King County still has significant disparities in park access; people of color are least likely to have nearby access to a park, especially in south King County, and populations with low incomes are more likely to live in areas with high park pressure. Innovative transit solutions should focus on the Opportunity Areas identified in this study so that those without access to parks have the same opportunities that other parts of the county enjoy. This is a pivotal time for King County’s parks and transit networks. Related legislation such as the Land Conservation Initiative, Parks Levy and Trailhead Direct are quickly progressing and goals are taking shape. We hope that the results of this GIS analysis will inform the prioritization of funds for green space protection and maintenance and identify expansion opportunities for Trailhead Direct and future transit-to-parks efforts. This GIS analysis is a first step in identifying areas of need in the larger effort to establish access to high-quality parks for all county residents. Future research must include qualitative investigation and more park-specific data. A comprehensive parks needs assessment would reveal areas of high park need while considering park quality, which could change the geography of good park access. Most importantly, community engagement brings the analysis to a local level and helps us understand community-specific needs as they relate to parks and transit. The Los Angeles County Parks Needs Assessment is an exceptional model for collecting community feedback and inventorying parks, which King County should adapt to this region. Once priority parks of interest are identified, transit routes should be adjusted to ensure access to them. In addition to creating new connections, transit routes that reach high-quality parks should be advertised to the public around transit stops and in parks. King County agencies should pursue culturally competent programming and amenities as well as programming that involves physical activities to incentivize park visitation and introduce new users to the benefits of parks. Given the right programming and maintenance, open parks can be transformed into neighborhood gathering places and social hubs. We hope to continue this work with King County and other partners and utilize our combined resources to increase access to parks for all residents. Nature should be available to everyone, regardless of background, and transit solutions can help make this a reality.
43
Study Limitations
Data-based
Lack of consistent data on park amenities, quality and entrances Los Angeles County completed a Comprehensive Parks Needs Assessment that inventoried all park amenities and their condition, allowing the county to identify “parks of interest” that community members might like to visit via public transit. King County lacks comprehensive data on amenity presence, quantity and quality, so we analyzed all Community and Regional parks for our study. However, this approach leaves out high-quality smaller parks that could be greatly utilized by local neighborhoods and may over-count Community and Regional parks that are not attractive destinations. We also lack data on park entrance points for mapping the distance between the destination bus stop and park entrance, so we came up with an alternative solution described in Appendix B. Transportation data does not include Accessible Services King County Metro supports several programs that provide on-demand transportation for people with disabilities, seniors and low-income residents (e.g., Access shuttle service). As these services are operated on demand, they are not included in the General Transit Feed Specification data. Therefore, our results may underestimate the level of service for these populations by not counting Accessible Services as transportation options. Variation in geographic levels of demographic data The datasets we used were reported at varying geographic levels; some were by block group, some by tract and some at a King County-specific geography, which was generally larger than the block or tract level. This created inconsistencies when layering demographic categories, so some characteristics may not be accurate for specific areas. For example, much of the health data was reported at a King County-specific geography. We projected the health data of the reporting area to all block groups within, which may have created inaccuracies for some of the block groups if their health did not match the larger area’s characteristic. We faced the same issue when assigning all individuals within a reporting area a characteristic even though not every individual fit that characteristic, and left out individuals living elsewhere.
Approach-based
Findings and recommendations are data-driven and not informed by community input This first phase of research relies almost solely on data and maps. We have not conducted any community outreach to ground truth the assumptions made in this study, such as the 45-minute threshold for a trip to the park or the likelihood of visiting the parks we have identified as destinations. In future research, community participation will be essential to inform solutions that will work for individual neighborhoods with varying needs.
New methodologies always have room for improvement Because this study is one of few transit-to-parks analyses, many of our methods are untested. We used the Los Angeles County study as a guide but developed many of our own
44
approaches. As this type of study becomes more widespread, methodologies, knowledge and data will improve and become verified.
Cross-sectional approach is unable to consider population changes and displacement Most of our data was taken from the 2012-2016 5-Year American Community Survey (ACS) and does not account for past trends or future conditions. This type of static analysis is useful for understanding the present state, but will need to be updated as parks, transit and demographics change in the area. Currently, data on displacement trends is just beginning to emerge and equity priorities will likely shift as populations are displaced and others move in.
Funding-based
Limited funding defined our capacity for in-depth research The Wilderness Society had limited funding for this project, so we were confined in the depth and iterative approach that we could take. We are hopeful that future phases will be supported by additional funding and community partnerships.
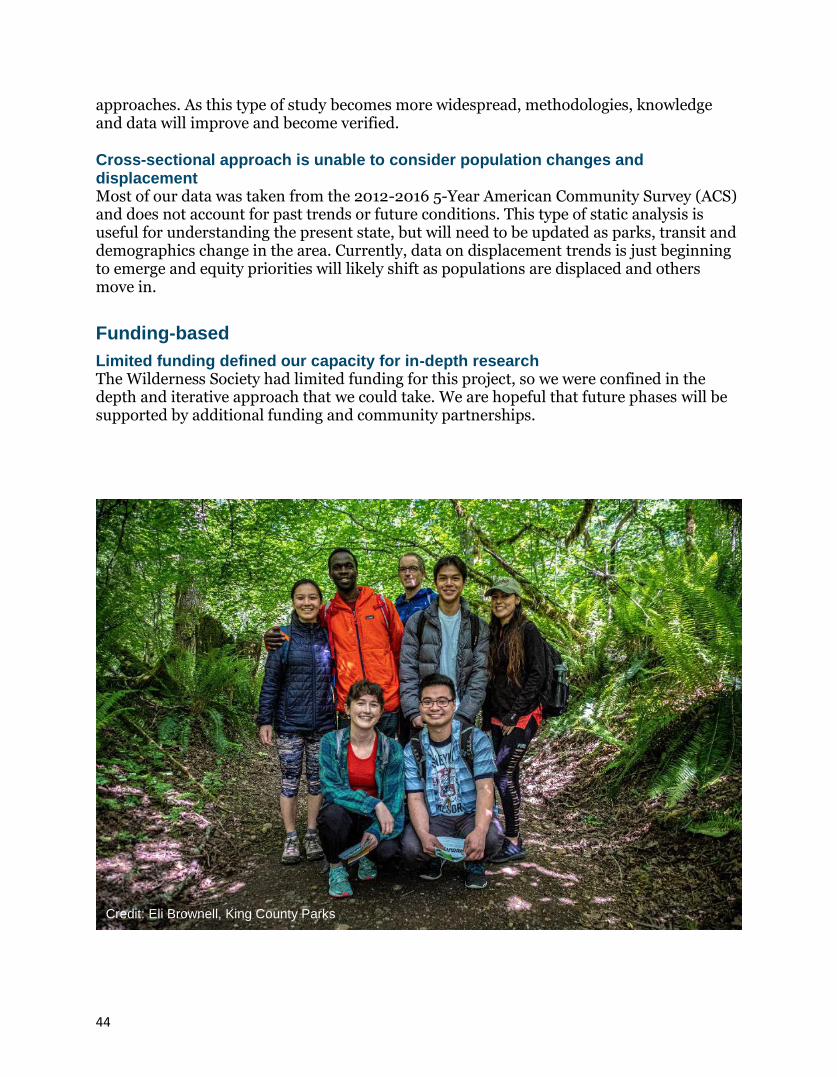
Credit: Eli Brownell, King County Parks
45
Appendices
Appendix A. Glossary
Community and Regional parks (p. 17): Larger parks that comprise the destination
parks in the GIS analysis.
Equity (p. 7): The fair treatment of all people, regardless of group identity, location or
other social determinants.
Frequent transit access (p. 25): Within a quarter-mile walk of transit stop with service
every 15 minutes or less in a specified four-hour time period (about a 5-minute walk). Wait
times are calculated for Saturday, October 13 from 7-11am and 4-8pm and Wednesday,
October 17 from 4-8pm.
Good transit access to parks (p. 19): Able to reach at least two Community or Regional
parks, including at least one Premier park, within 45 minutes from doorstep to park.
Highly Vulnerable populations (p. 22): People within block groups that are in the top
quartile for at least eight vulnerable characteristics from Table 3.
Least Vulnerable populations (p. 22): People within block groups that are in the top
quartile for two or fewer characteristics from Table 3.
Opportunity Areas (p. 7): Areas of King County that present the greatest opportunity for
investment due to a lack of transit-to-parks connections and high concentrations of
vulnerable populations.
Park pressure (p. 23): The number of park acres per 1,000 residents if everyone were to
visit the park nearest to their home.
People of color (p. 8): Inclusive of Black, Indigenous, Asian, Hawaiian Pacific Islander
and non-white Hispanic populations.
Premier parks (p. 18): Community or Regional parks that contain at least one of each of
the following: passive amenity (open space, forest, view), active amenity (opportunity for
spontaneous and/or organized physical exertion such as playgrounds and sports
courts/fields), trail, picnic table and restroom.
Vulnerable populations (p. 7): Populations who are susceptible to adverse social
outcomes due to group identities they hold and the associated barriers.
Walking access to a park (p. 22): Within a half-mile distance to a park using the street
network (about a 10-minute walk).
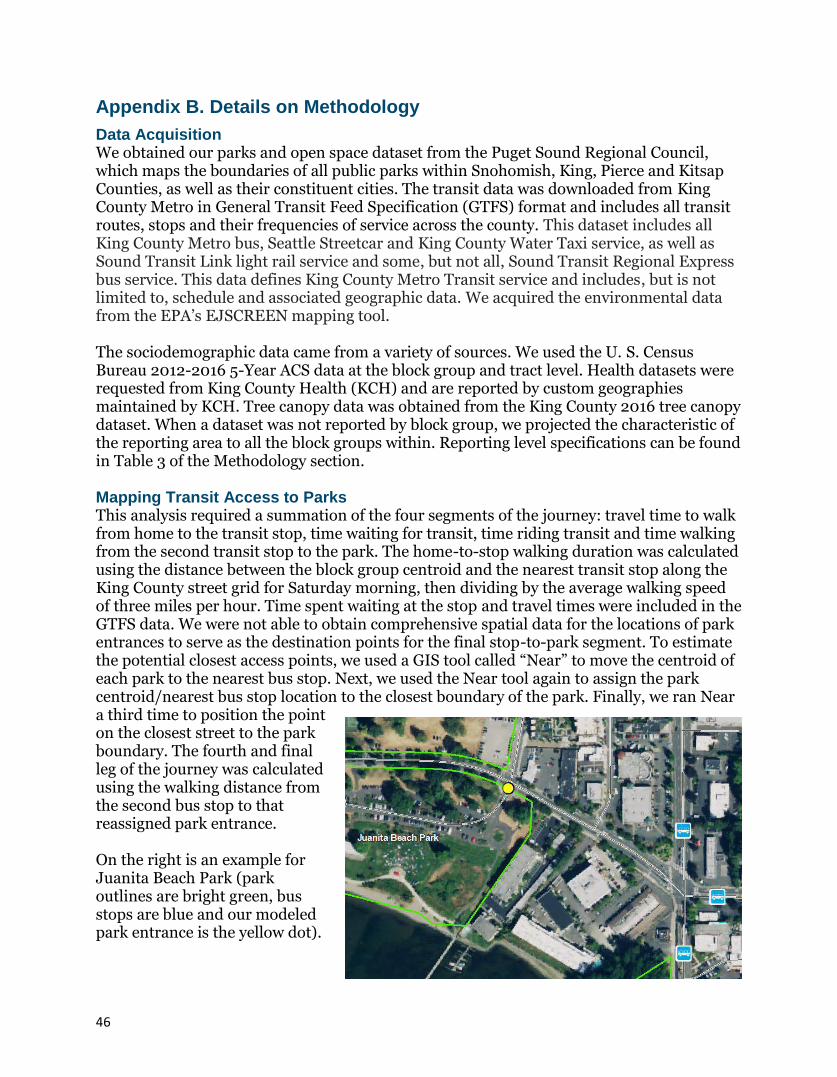
46
Appendix B. Details on Methodology
Data Acquisition We obtained our parks and open space dataset from the Puget Sound Regional Council, which maps the boundaries of all public parks within Snohomish, King, Pierce and Kitsap Counties, as well as their constituent cities. The transit data was downloaded from King County Metro in General Transit Feed Specification (GTFS) format and includes all transit routes, stops and their frequencies of service across the county. This dataset includes all King County Metro bus, Seattle Streetcar and King County Water Taxi service, as well as Sound Transit Link light rail service and some, but not all, Sound Transit Regional Express bus service. This data defines King County Metro Transit service and includes, but is not limited to, schedule and associated geographic data. We acquired the environmental data from the EPA’s EJSCREEN mapping tool. The sociodemographic data came from a variety of sources. We used the U. S. Census Bureau 2012-2016 5-Year ACS data at the block group and tract level. Health datasets were requested from King County Health (KCH) and are reported by custom geographies maintained by KCH. Tree canopy data was obtained from the King County 2016 tree canopy dataset. When a dataset was not reported by block group, we projected the characteristic of the reporting area to all the block groups within. Reporting level specifications can be found in Table 3 of the Methodology section.
Mapping Transit Access to Parks This analysis required a summation of the four segments of the journey: travel time to walk from home to the transit stop, time waiting for transit, time riding transit and time walking from the second transit stop to the park. The home-to-stop walking duration was calculated using the distance between the block group centroid and the nearest transit stop along the King County street grid for Saturday morning, then dividing by the average walking speed of three miles per hour. Time spent waiting at the stop and travel times were included in the GTFS data. We were not able to obtain comprehensive spatial data for the locations of park entrances to serve as the destination points for the final stop-to-park segment. To estimate the potential closest access points, we used a GIS tool called “Near” to move the centroid of each park to the nearest bus stop. Next, we used the Near tool again to assign the park centroid/nearest bus stop location to the closest boundary of the park. Finally, we ran Near a third time to position the point on the closest street to the park boundary. The fourth and final leg of the journey was calculated using the walking distance from the second bus stop to that reassigned park entrance. On the right is an example for Juanita Beach Park (park outlines are bright green, bus stops are blue and our modeled park entrance is the yellow dot).
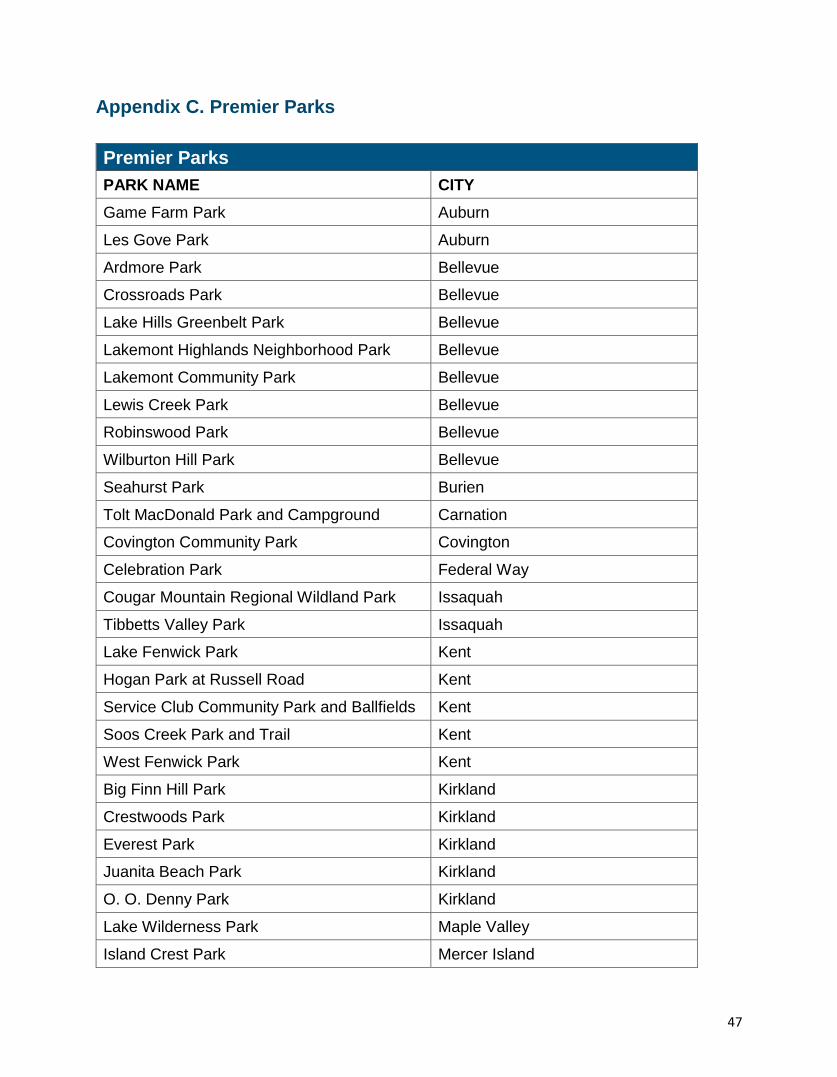
47
Appendix C. Premier Parks
Premier Parks
PARK NAME CITY
Game Farm Park Auburn
Les Gove Park Auburn
Ardmore Park Bellevue
Crossroads Park Bellevue
Lake Hills Greenbelt Park Bellevue
Lakemont Highlands Neighborhood Park Bellevue
Lakemont Community Park Bellevue
Lewis Creek Park Bellevue
Robinswood Park Bellevue
Wilburton Hill Park Bellevue
Seahurst Park Burien
Tolt MacDonald Park and Campground Carnation
Covington Community Park Covington
Celebration Park Federal Way
Cougar Mountain Regional Wildland Park Issaquah
Tibbetts Valley Park Issaquah
Lake Fenwick Park Kent
Hogan Park at Russell Road Kent
Service Club Community Park and Ballfields Kent
Soos Creek Park and Trail Kent
West Fenwick Park Kent
Big Finn Hill Park Kirkland
Crestwoods Park Kirkland
Everest Park Kirkland
Juanita Beach Park Kirkland
O. O. Denny Park Kirkland
Lake Wilderness Park Maple Valley
Island Crest Park Mercer Island
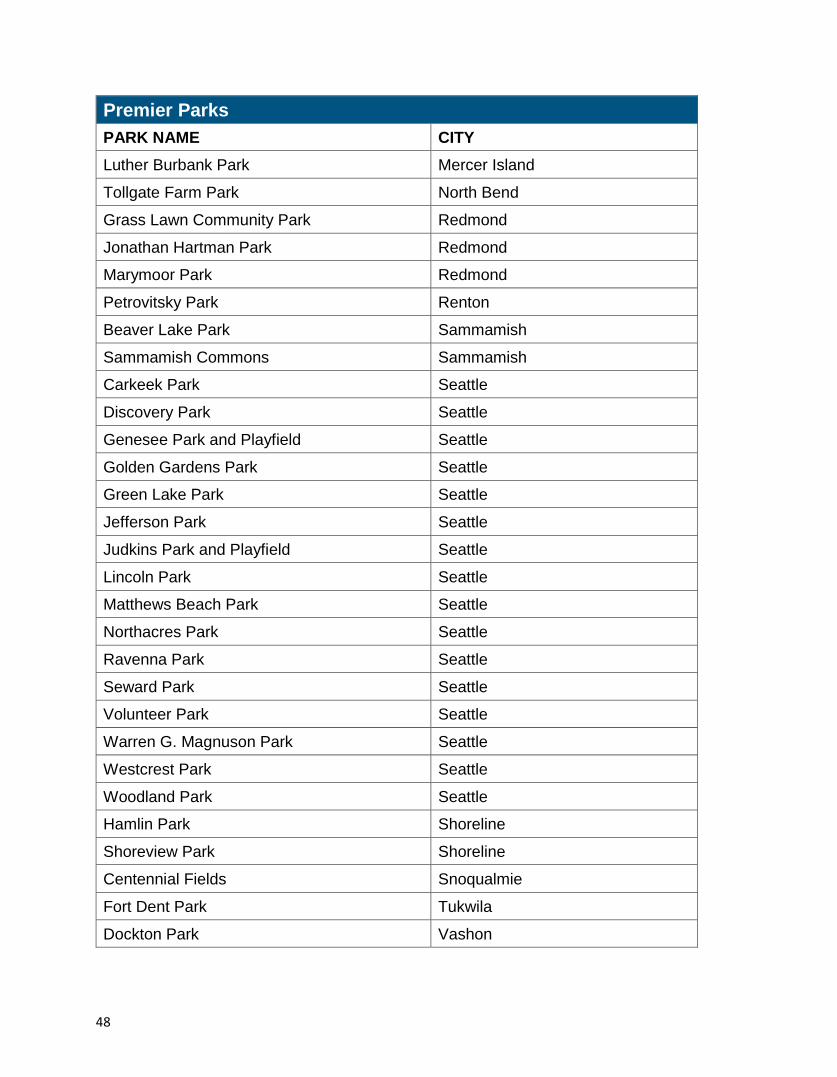
48
Premier Parks
PARK NAME CITY
Luther Burbank Park Mercer Island
Tollgate Farm Park North Bend
Grass Lawn Community Park Redmond
Jonathan Hartman Park Redmond
Marymoor Park Redmond
Petrovitsky Park Renton
Beaver Lake Park Sammamish
Sammamish Commons Sammamish
Carkeek Park Seattle
Discovery Park Seattle
Genesee Park and Playfield Seattle
Golden Gardens Park Seattle
Green Lake Park Seattle
Jefferson Park Seattle
Judkins Park and Playfield Seattle
Lincoln Park Seattle
Matthews Beach Park Seattle
Northacres Park Seattle
Ravenna Park Seattle
Seward Park Seattle
Volunteer Park Seattle
Warren G. Magnuson Park Seattle
Westcrest Park Seattle
Woodland Park Seattle
Hamlin Park Shoreline
Shoreview Park Shoreline
Centennial Fields Snoqualmie
Fort Dent Park Tukwila
Dockton Park Vashon
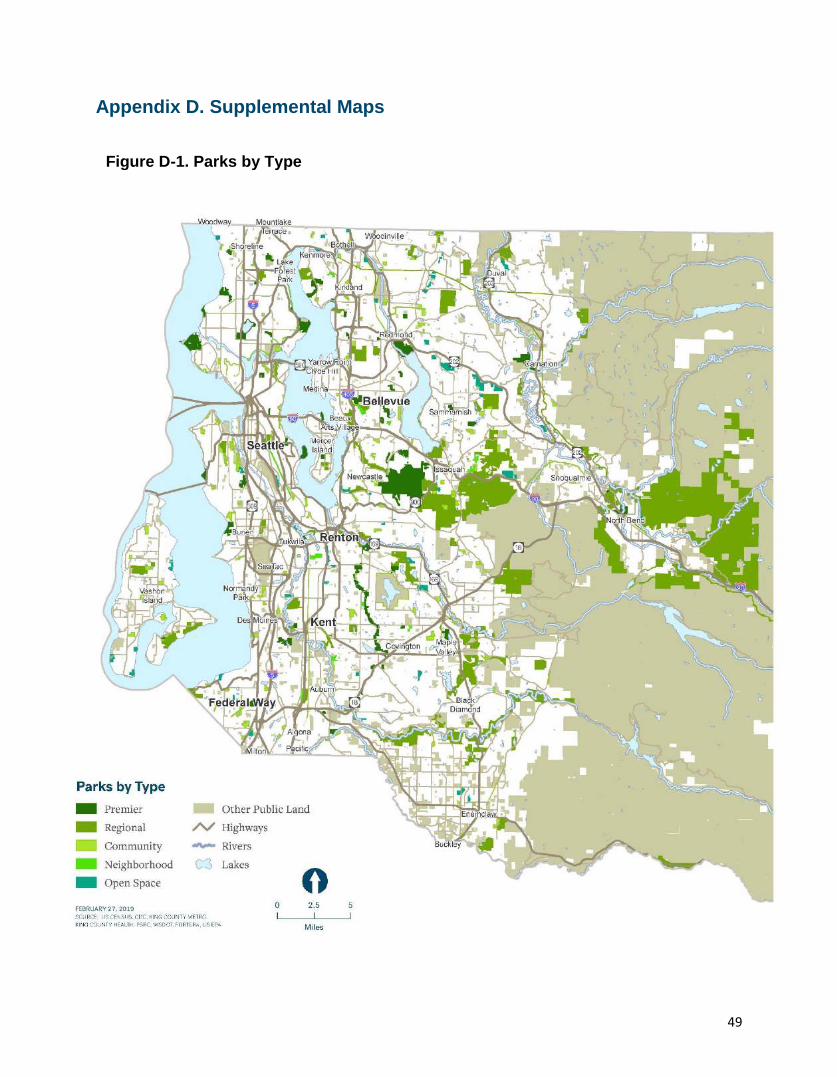
49
Appendix D. Supplemental Maps
Figure D-1. Parks by Type
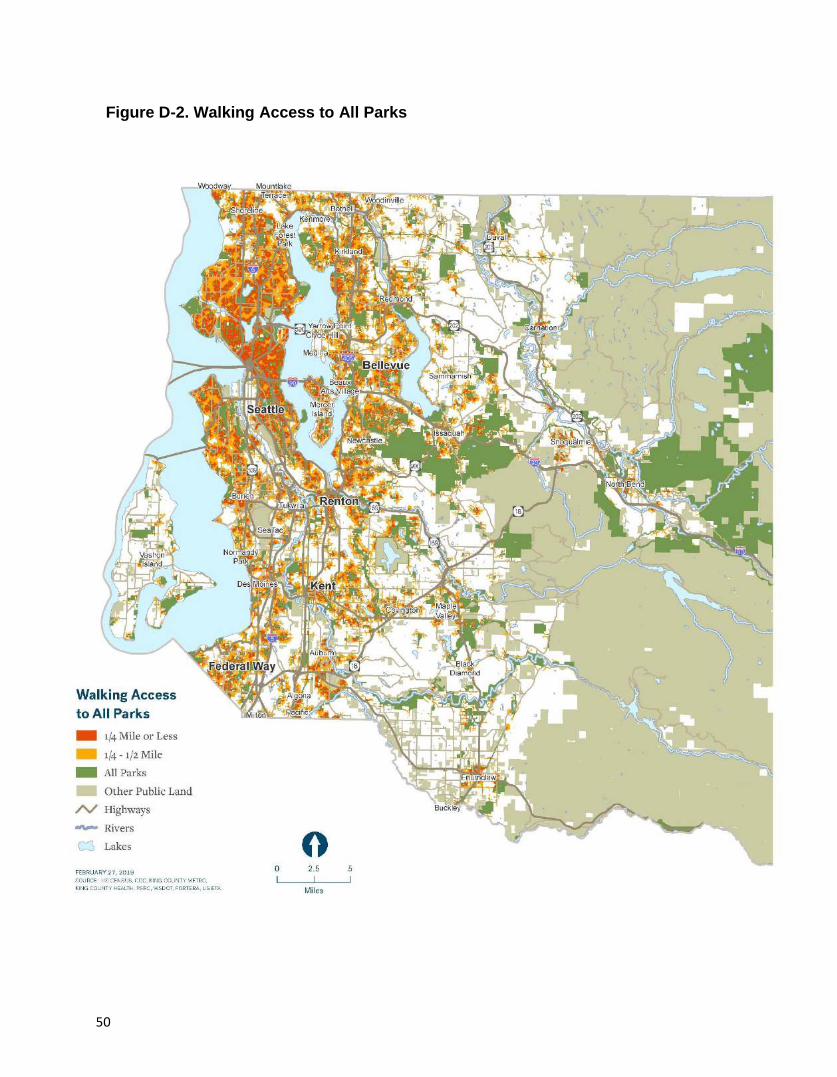
50
Figure D-2. Walking Access to All Parks
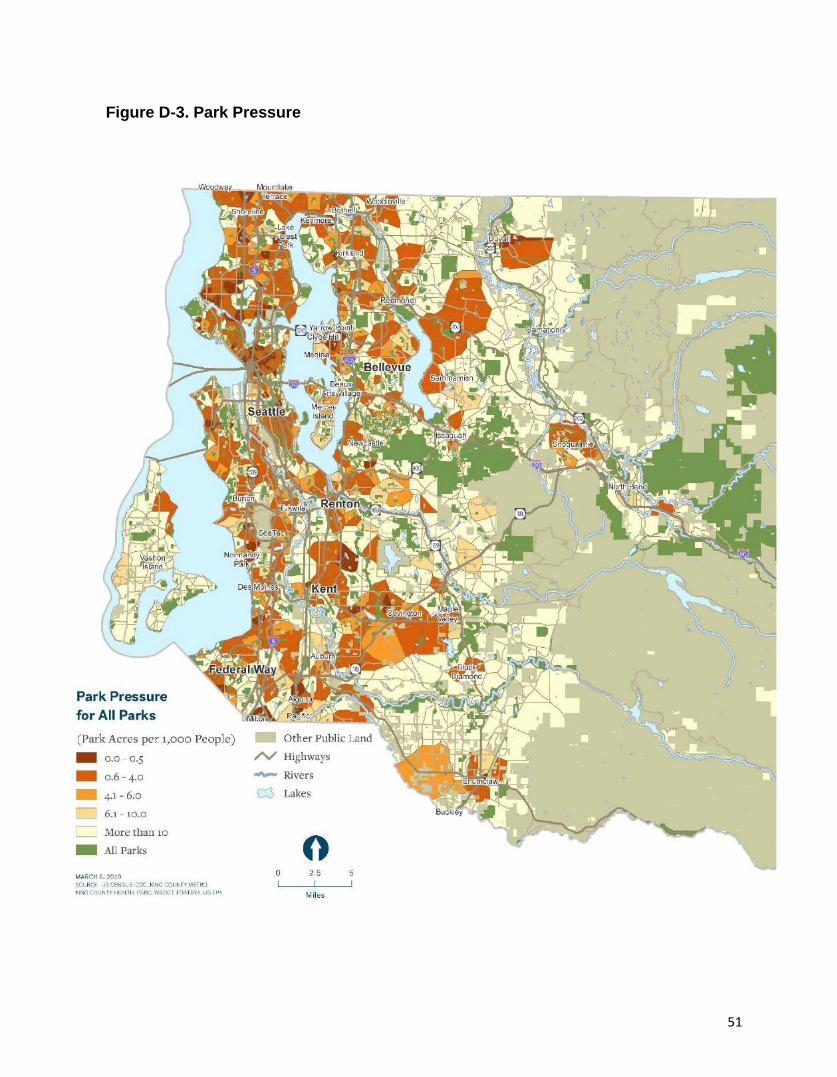
51
Figure D-3. Park Pressure
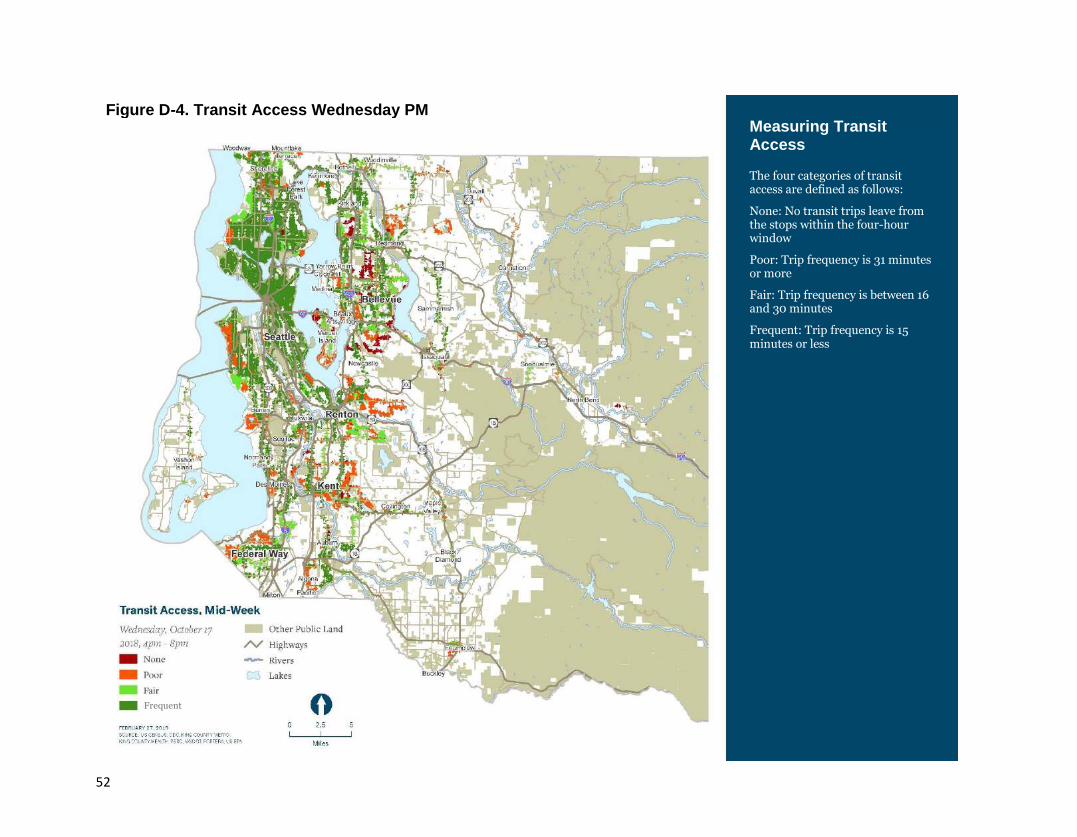
52
Figure D-4. Transit Access Wednesday PM Measuring Transit Access The four categories of transit access are defined as follows:
None: No transit trips leave from the stops within the four-hour window
Poor: Trip frequency is 31 minutes or more
Fair: Trip frequency is between 16 and 30 minutes
Frequent: Trip frequency is 15 minutes or less
Frequent
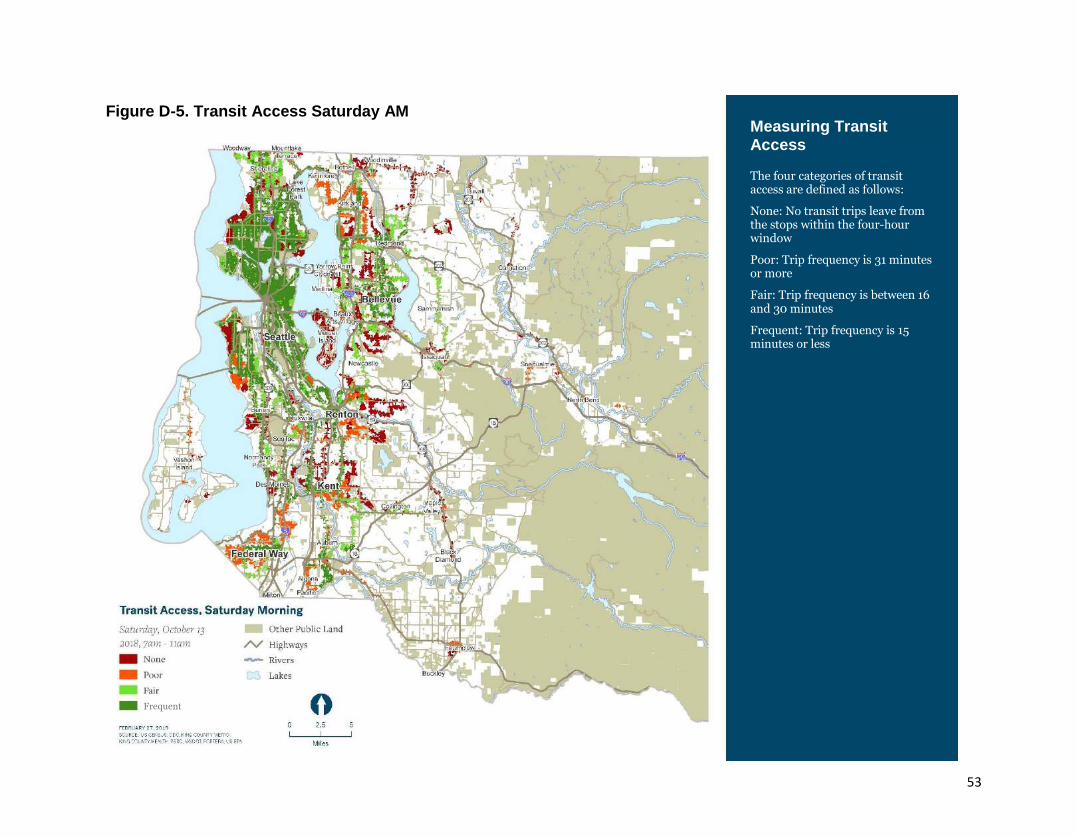
53
Figure D-5. Transit Access Saturday AM
Frequent
Measuring Transit Access The four categories of transit access are defined as follows:
None: No transit trips leave from the stops within the four-hour window
Poor: Trip frequency is 31 minutes or more
Fair: Trip frequency is between 16 and 30 minutes
Frequent: Trip frequency is 15 minutes or less
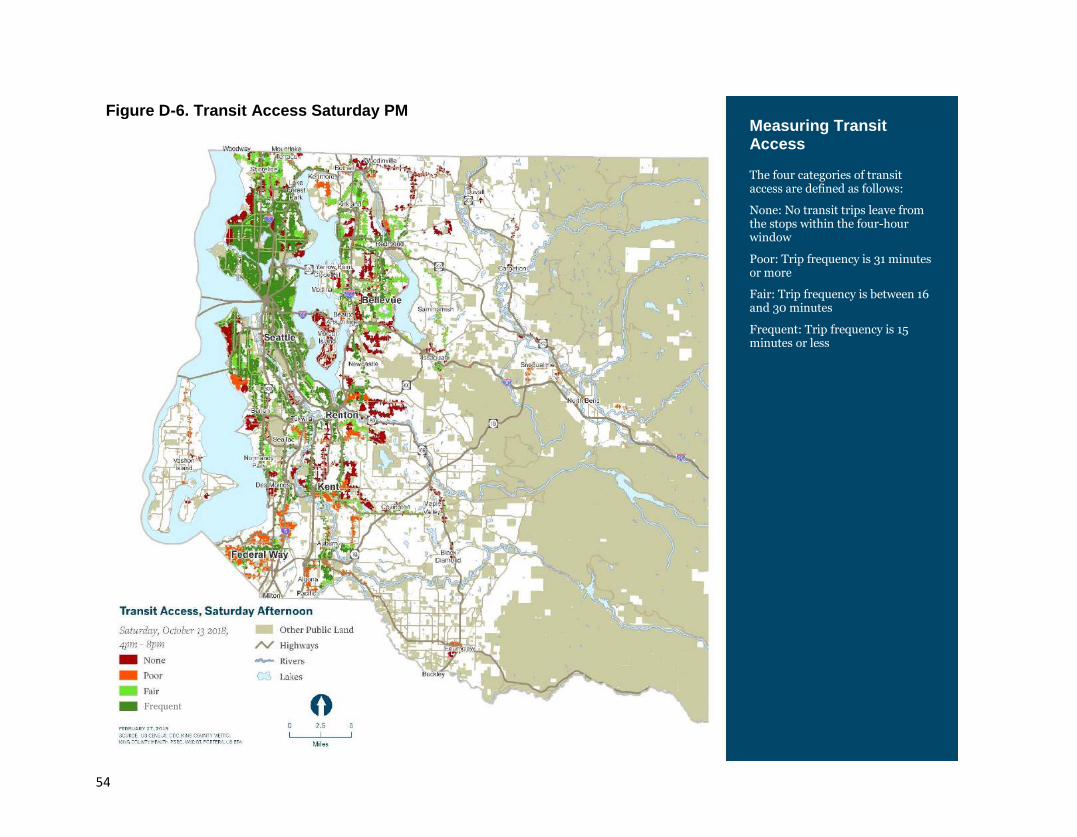
54
Figure D-6. Transit Access Saturday PM
Frequent
Measuring Transit Access The four categories of transit access are defined as follows:
None: No transit trips leave from the stops within the four-hour window
Poor: Trip frequency is 31 minutes or more
Fair: Trip frequency is between 16 and 30 minutes
Frequent: Trip frequency is 15 minutes or less
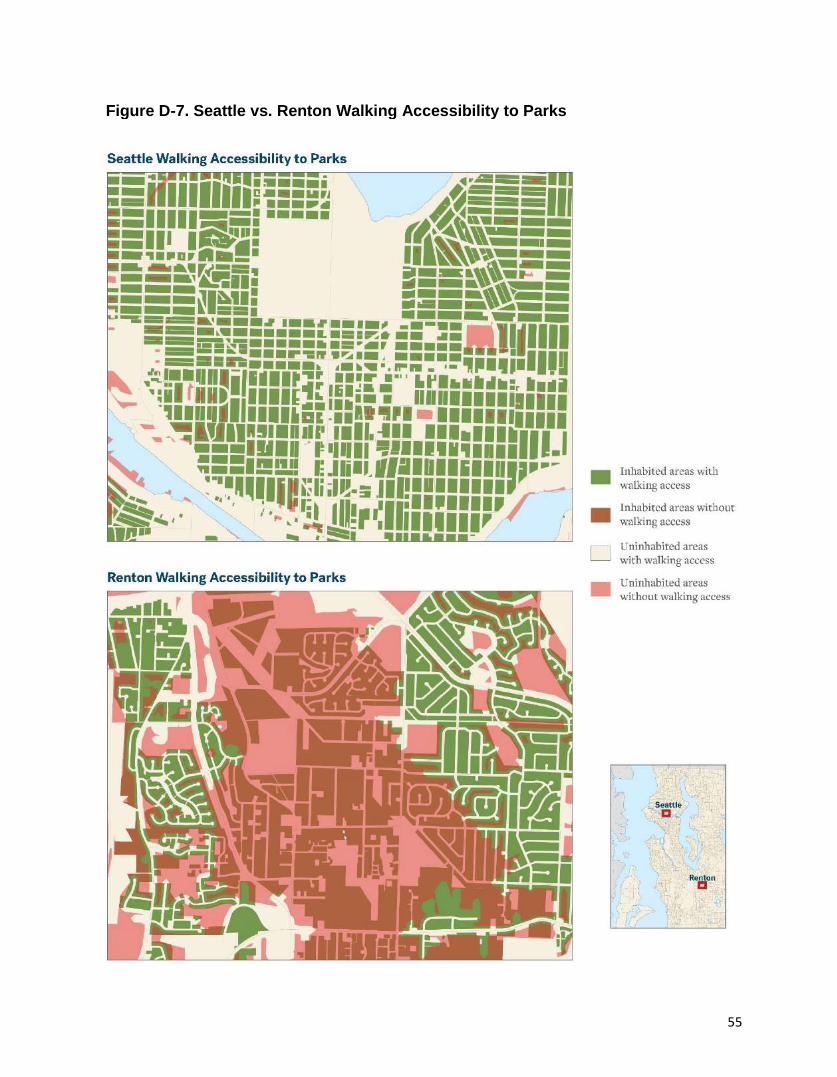
55
Figure D-7. Seattle vs. Renton Walking Accessibility to Parks
56
References
Balk, G. (2016). Second-biggest expense likely out in your driveway. The Seattle Times. Retrieved from https://www.seattletimes.com/seattle-news/second-biggest-expense-likely-out-in-your-driveway/. Accessed May 20, 2019.
Balk, G. (2017). Seattle has reversed a decades-long trend of rising car ownership — and
millennials are the reason. The Seattle Times. Retrieved from https://www.seattletimes.com/seattle-news/data/seattle-has-reversed-a-decades-long-trend-of-car-ownership-and-millennials-are-the-reason/. Accessed May 20, 2019.
Dony, C. C., Delmelle, E. M., & Delmelle, E. C. (2015). Re-conceptualizing accessibility to
parks in multi-modal cities: A variable-width floating catchment area (VFCA) method. Landscape and Urban Planning 143, 90-99. Accessed May 20, 2019.
EPA. (2018). EJSCREEN: EPA's environmental justice screening and mapping tool.
Retrieved from https://ejscreen.epa.gov/mapper/. Accessed May 20, 2019. Floyd, M., Ross-Winslow, D., Thompson, E., Sexton, N., Dietsch, A., & Conlon, K. (2016).
Barriers and strategies to connecting urban audiences to wildlife and nature: Results from a multi-method research project. North Carolina State University: Accessed May 20, 2019.
Front and Centered, & Washington State Department of Health. (2018). Information by
location. Retrieved from https://fortress.wa.gov/doh/wtn/WTNIBL. Accessed May 20, 2019.
Gobster, P. H. (2002). Managing urban parks for a racially and ethnically diverse clientele.
Leisure Sciences 24, 143-159. Accessed May 20, 2019. King County Department of Natural Resources & Parks. (2018). King County land
conservation initiative. King County, WA. Retrieved from https://kingcounty.gov/services/environment/water-and-land/land-conservation.aspx. Accessed May 20, 2019.
King County Metro. (2016a). Metro connects: Long-range plan. King County, WA.
Retrieved from http://www.kcmetrovision.org/view-plan/. Accessed May 20, 2019. King County Metro. (2016b). Metro connects: Public engagement report. King County, WA.
Retrieved from http://www.kcmetrovision.org/view-plan/. Accessed May 20, 2019. Lewis, D. (2016). Metro making plans to use transit to connect communities with parks.
Streetsblog LA. Retrieved from https://la.streetsblog.org/2016/07/21/metro-making-plans-use-transit-to-connect-communities-with-parks/. Accessed May 20, 2019.
57
Los Angeles County Department of Parks & Recreation. (2016). Los Angeles countywide comprehensive parks & recreation needs assessment. Los Angeles, CA. Retrieved from https://lacountyparkneeds.org/. Accessed May 20, 2019.
Los Angeles Metro. (2019). Transit to parks strategic plan. Los Angeles, CA. Retrieved
from https://www.metro.net/projects/transit-parks/. Accessed May 20, 2019. Loukaitou-Sideris, A. (1995). Urban form and social context: Cultural differentiation in the
uses of urban parks. Journal of Planning and Education and Research 14, 89-102. Accessed May 20, 2019.
National Park Service, & Centers for Disease Control and Prevention. (2017). Improving
public health through public parks and trails: Eight common measures. Washington, DC: Merriam, D., Bality, A., Stein, J., & Boehmer, T. Accessed May 20, 2019.
Outdoor Foundation. (2018). 2018 Outdoor participation report. Boulder, CO. Retrieved
from https://outdoorindustry.org/resource/2018-outdoor-participation-report/. Accessed May 20, 2019.
Patillo, A. (2017). Nature’s calling -- for more human diversity. CNN. Retrieved from
https://www.cnn.com/2017/09/12/health/nature-wilderness-minorities/index.html. Accessed May 20, 2019.
PSRC. (2017). Displacement risk analysis. Retrieved from
https://www.psrc.org/displacement-risk-analysis. Accessed May 20, 2019.
PSRC. (2018a). Region becoming more diverse: Seven cities have majority-minority
population. Retrieved from https://www.psrc.org/whats-happening/blog/region-becoming-more-diverse. Accessed May 20, 2019.
PSRC. (2018b). Regional open space conservation plan. Retrieved from
https://www.psrc.org/open-space. Accessed May 20, 2019. PSRC. (2018c). Region planning for 1.8 more people by 2050: Strong regional economy
fuels expected growth. Retrieved from https://www.psrc.org/whats-happening/blog/region-planning-18-million-more-people-2050. Accessed May 20, 2019.
PSRC. (2018d). Regional transportation plan (Appendix B: Equity analysis report).
Retrieved from https://www.psrc.org/our-work/rtp. Accessed May 20, 2019. Public Health - Seattle & King County. (2018-19). King County community health needs
assessment. King County, WA. Retrieved from https://www.kingcounty.gov/depts/health/data/community-health-indicators/king-county-hospitals-healthier-community.aspx. Accessed May 20, 2019.
58
Puget Sound Sage. (2012). Transit oriented development that’s healthy, green & just:
Ensuring transit investment in Seattle’s Rainier Valley builds community where all families thrive. Seattle, WA: Greenwich, H., & Wykowski, M. Accessed May 20, 2019.
Recreation Northwest. (2019). Parkscriptions. Retrieved from
https://www.recreationnorthwest.org/parkscriptions/. Accessed May 20, 2019. Reuben, Aaron. (2019). Science’s Newest Mircale Drug is Free. Outside. Retrieved from
https://www.outsideonline.com/2393660/science-newest-miracle-drug-free. Accessed May 20, 2019.
Seattle Parks & Recreation. (2017). 2017 Parks and Open Space Plan. Seattle, WA.
Retrieved from https://www.seattle.gov/parks/about-us/policies-and-plans/2017-parks-and-open-space-plan. Accessed May 20, 2019.
Sister, C., Wolch, J., & Wilson, J. (2010). Got green? Addressing environmental justice in
park provision. GeoJournal, 55, 229-248. Accessed May 20, 2019. SVP Seattle. (2015). Navigating the transit rollercoaster. Social Venture Partners. Retrieved
from http://www.socialventurepartners.org/seattle/2015/02/04/mapping-transit/. Accessed May 20, 2019.
The Nature of Americans. (2017). National Report. Retrieved from
https://natureofamericans.org/research. Accessed May 20, 2019. Trust for Public Land. (2018). ParkServe. Retrieved from https://parkserve.tpl.org/.
Accessed May 20, 2019. U. S. Census Bureau. (2018). QuickFacts: King County, WA. Retrieved from
https://www.census.gov/quickfacts/kingcountywashington. Accessed May 20, 2019. U. S. Department of Agriculture. (2008). Recreation visitor research: Studies of diversity.
Albany, CA: Chavez, D. J., Winter, P. L., & Absher, J. D. Accessed May 20, 2019. Wild in the City. (2018). Nature and Health. Retrieved from
https://wildinthecity.org.uk/?page_id=2627. Accessed May 20, 2019.

wilderness.org