Embed Size (px)
Citation preview

A trophic model for Gulf St Vincent:
Balancing exploitation of three fisheries in an EBFM framework
Simon D Goldsworthy, Maylene Loo, Anthony Fowler, Michael Steer and Craig Noell
April 2017
FRDC Project No. 2013/031

A trophic model for Gulf St Vincent: balancing exploitation of three fisheries ii
© 2017 Fisheries Research and Development Corporation and South Australian Research and Development Institute. All rights reserved. ISBN: 978-1-921563-93-5
A trophic model for Gulf St Vincent: Balancing exploitation of three fisheries in an EBFM framework. 2013/031
2017
Ownership of Intellectual property rights Unless otherwise noted, copyright (and any other intellectual property rights, if any) in this publication is owned by the Fisheries Research and Development Corporation and the South Australian Research and Development Institute. This work is copyright. Apart from any use as permitted under the Copyright Act 1968 (Cth), no part may be reproduced by any process, electronic or otherwise, without the specific written permission of the copyright owner. Neither may information be stored electronically in any form whatsoever without such permission.
This publication (and any information sourced from it) should be attributed to Goldsworthy, S.D., Loo, M., Fowler, A., Steer, M. and Noell, C. South Australian Research and Development Institute (Aquatic Sciences) 2017, A trophic model for Gulf St Vincent: Balancing exploitation of three fisheries in an EBFM framework. Adelaide, April.
Creative Commons licence All material in this publication is licensed under a Creative Commons Attribution 3.0 Australia Licence, save for content supplied by third parties, logos and the Commonwealth Coat of Arms.
Creative Commons Attribution 3.0 Australia Licence is a standard form licence agreement that allows you to copy, distribute, transmit and adapt this publication provided you attribute the work. A summary of the licence terms is available from creativecommons.org/licenses/by/3.0/au/deed.en. The full licence terms are available from creativecommons.org/licenses/by/3.0/au/legalcode.
Inquiries regarding the licence and any use of this document should be sent to: [email protected]
Disclaimer The authors warrant that they have taken all reasonable care in producing this report. The report has been through the SARDI internal review process, and has been formally approved for release by the Research Chief, Aquatic Sciences. Although all reasonable efforts have been made to ensure quality, SARDI does not warrant that the information in this report is free from errors or omissions. SARDI does not accept any liability for the contents of this report or for any consequences arising from its use or any reliance placed upon it. Material presented in these Administrative Reports may later be published in formal peer-reviewed scientific literature.
The information, opinions and advice contained in this document may not relate, or be relevant, to a readers particular circumstances. Opinions expressed by the authors are the individual opinions expressed by those persons and are not necessarily those of the publisher, research provider or the FRDC.
The Fisheries Research and Development Corporation plans, invests in and manages fisheries research and development throughout Australia. It is a statutory authority within the portfolio of the federal Minister for Agriculture, Fisheries and Forestry, jointly funded by the Australian Government and the fishing industry.
Researcher Contact Details FRDC Contact Details
Name:
Address:
Phone:
Fax:
Email:
Simon D. Goldsworthy
SARD Aquatic Sciences
2 Hamra Avenue
West Beach SA 5024
08 8207 5325
Address:
Phone:
Fax:
Email: Web:
25 Geils Court
Deakin ACT 2600
02 6285 0400
02 6285 0499
www.frdc.com.au
In submitting this report, the researcher has agreed to FRDC publishing this material in its edited form.

A trophic model for Gulf St Vincent: balancing exploitation of three fisheries iii
Contents
Contents ................................................................................................................................................. iii
Tables ...................................................................................................................................................... v
Figures ................................................................................................................................................... vi
Acknowledgments ................................................................................................................................ vii
Abbreviations ....................................................................................................................................... vii
Executive Summary .............................................................................................................................. 1
1 Introduction ......................................................................................................................................... 4
1.1 Background ..................................................................................................................................4
1.2 Need .............................................................................................................................................5
1.3 Objectives ....................................................................................................................................5
2 Methodology ........................................................................................................................................ 6
2.1 Ecopath and mass balance approach ............................................................................................6
2.2 Model area and structure ..............................................................................................................6
2.3 Model fitting ................................................................................................................................7
2.4 Ecosystem indicators ...................................................................................................................8
2.5 Scenario testing ............................................................................................................................8
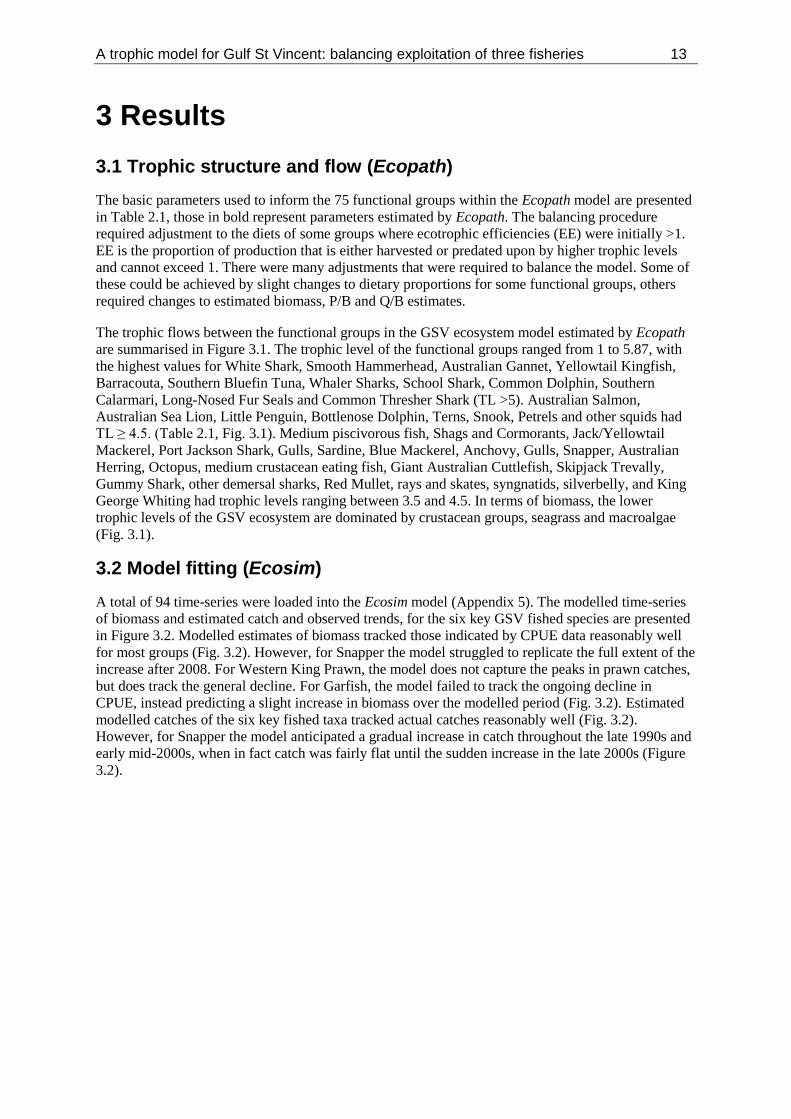
3 Results................................................................................................................................................ 13
3.1 Trophic structure and flow (Ecopath) ........................................................................................13
3.2 Model fitting (Ecosim) ...............................................................................................................13
3.3 Temporal changes in GSV ecosystem .......................................................................................16
Trends in catch ..........................................................................................................................16 Group biomasses .......................................................................................................................16 Effects of fishing .......................................................................................................................17
3.2 Trophic role of three key species and impact of Snapper ..........................................................25
Diet of three key species ...........................................................................................................25 Predation on three key species ..................................................................................................25 Sensitivity analysis ....................................................................................................................26 Impact of increasing biomass of Snapper on GSV ecosystem ..................................................26
3.3 Optimisation of future ecological and economic performance ..................................................32
Impact of reducing Snapper biomass on high value commercial fisheries and on the GSV
ecosystem ..................................................................................................................................32
4 Discussion .......................................................................................................................................... 37
Dynamic management arrangements in the GSV ecosystem ..........................................................37
Trophodynamic indicators of fisheries status and impact ................................................................41
Trophic relationships – role of Snapper in GSV ecosystem ............................................................43
Could a directed fishery for Snapper be used to optimise ecological and economic
performance of Blue Crab and prawn fisheries? ..............................................................................45
5 Conclusion ......................................................................................................................................... 46
6 Implications ....................................................................................................................................... 47
7 Recommendations ............................................................................................................................ 48
8 Further development ........................................................................................................................ 49

A trophic model for Gulf St Vincent: balancing exploitation of three fisheries iv
9 Extension and Adoption ................................................................................................................... 49
10 Appendices ...................................................................................................................................... 50
Appendix 1. Research staff and intellectual property ......................................................................50
Appendix 2. Description of functional groups, data sources, methods and assumptions in
estimating parameters used in the Gulf St Vincent Ecosystem model .............................................51
Pinnipeds ...................................................................................................................................51 Cetaceans ...................................................................................................................................53 Seabirds .....................................................................................................................................54 Pelagic sharks ............................................................................................................................58 Demersal sharks ........................................................................................................................61 Teleosts ......................................................................................................................................63 Small pelagic fish ......................................................................................................................70 Crustaceans ................................................................................................................................73 Primary Producers .....................................................................................................................77 Detritus ......................................................................................................................................78
Appendix 3. Diet matrix Gulf St Vincent Ecosystem model ...........................................................79
Appendix 4. Biomass estimates for bycatch species from the GSV Prawn fishery .........................87
Appendix 5. Time series ..................................................................................................................92
11 References ....................................................................................................................................... 94
A trophic model for Gulf St Vincent: balancing exploitation of three fisheries v
Tables
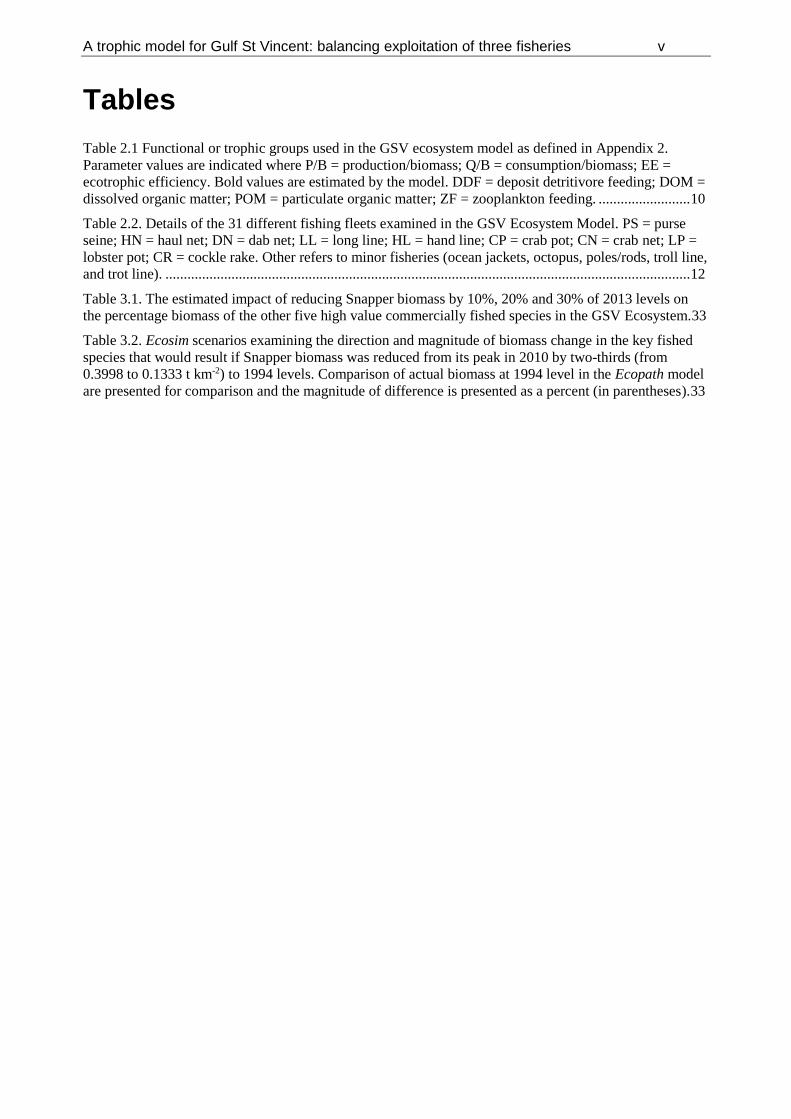
Table 2.1 Functional or trophic groups used in the GSV ecosystem model as defined in Appendix 2.
Parameter values are indicated where P/B = production/biomass; Q/B = consumption/biomass; EE =
ecotrophic efficiency. Bold values are estimated by the model. DDF = deposit detritivore feeding; DOM =
dissolved organic matter; POM = particulate organic matter; ZF = zooplankton feeding. ......................... 10
Table 2.2. Details of the 31 different fishing fleets examined in the GSV Ecosystem Model. PS = purse
seine; HN = haul net; DN = dab net; LL = long line; HL = hand line; CP = crab pot; CN = crab net; LP =
lobster pot; CR = cockle rake. Other refers to minor fisheries (ocean jackets, octopus, poles/rods, troll line,
and trot line). ............................................................................................................................................... 12
Table 3.1. The estimated impact of reducing Snapper biomass by 10%, 20% and 30% of 2013 levels on
the percentage biomass of the other five high value commercially fished species in the GSV Ecosystem.33
Table 3.2. Ecosim scenarios examining the direction and magnitude of biomass change in the key fished
species that would result if Snapper biomass was reduced from its peak in 2010 by two-thirds (from
0.3998 to 0.1333 t km-2) to 1994 levels. Comparison of actual biomass at 1994 level in the Ecopath model
are presented for comparison and the magnitude of difference is presented as a percent (in parentheses). 33

A trophic model for Gulf St Vincent: balancing exploitation of three fisheries vi
Figures
Figure 2.1 Area of Gulf St. Vincent (GSV) (shaded blue) used to define the model domain in the GSV
Ecosystem Model. The region of the Spencer Gulf Ecosystem Model (FRDC 2011/205) is also indicated,
bounded by the black line. ............................................................................................................................. 9
Figure 3.1 Flow diagram expression of trophic flows and trophic levels in the GSV ecosystem. Functional
groups are represented by a circle; the size of the circle is proportional to its biomass (colour of circles is
unrelated to any parameter). ........................................................................................................................ 14
Figure 3.2 Example of time series fits of the Gulf St Vincent ecosystem model (thin line) to observed
biomass (CPUE) and catch (dots and dashed trend line) data for six key commercial groups between 1994
and 2013. ..................................................................................................................................................... 15
Figure 3.3 Trends in the total catch (t y-1) (observed landings plus estimated discards) of groups in the
GSV ecosystem between 1994 and 2013. ................................................................................................... 18
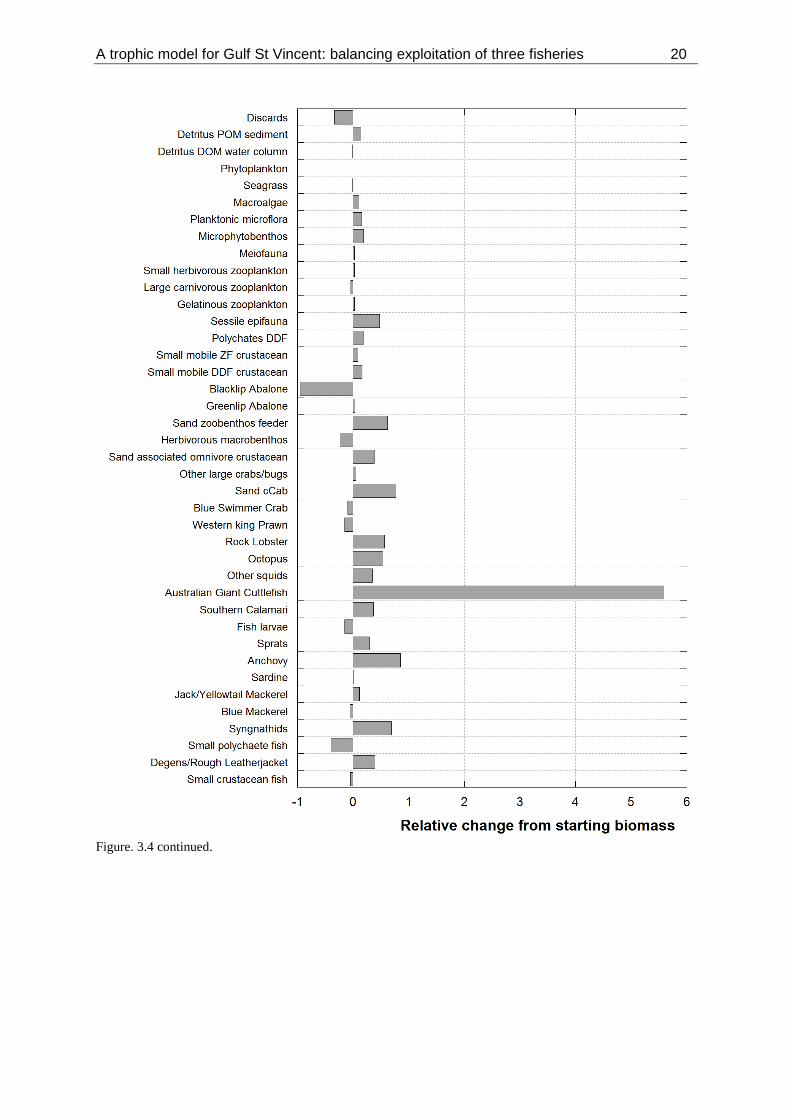
Figure 3.4. Estimated relative change in the biomass of functional groups in the GSV ecosystem model
from 1994 to 2013. A value of 1 indicates a doubling of biomass, -1 a loss of that group. ........................ 19
Figure 3.5 Estimated changes in the biomass of major taxonomic groups in the GSV ecosystem groups by
year between 1994 and 2013. ...................................................................................................................... 21
Figure 3.6 Ecosystem indicators calculated from the GSV ecosystem (Ecopath with Ecosim) model for the
period 1994 to 2013; a) mean trophic level of the catch (line indicating mean for time-series), and b)
Fishing in Balance (FIB) index. .................................................................................................................. 22
Figure 3.7 Estimated relative change in the biomass of functional groups following introduction of
BRD/T90 net in the GSV prawn fishery in the GSV Ecosystem. Biomass change with BRD/T90 (reduced
discards) is plotted relative to base model scenario (pre-BRD/T90 net) output run over a 50-year period.23
Figure 3.8 Trophic flows in the GSV ecosystem relating to Snapper (a), Blue Crabs (b) and Western King
Prawns (c). Green and red lines connect prey and predator groups, respectively. ...................................... 27
Figure 3.9 Estimated breakdown of relative consumption (key predators) of Snapper (A), Blue Crabs (B)
and Western King Prawns (C) in the GSV ecosystem. ............................................................................... 28
Figure 3.10 Leontif sensitivity matrix showing impacts of increasing abundance of groups on the y-axis on
groups on the x-axis. Impacts are expressed as relative % changes, not all impacts are discernible on this
figure. .......................................................................................................................................................... 29
Figure 3.11 Estimated relative change in the biomass of functional groups following scenarios that
examined the potential impacts of increasing Snapper biomass by 10%, 20% and 30% of 2013 levels.
Biomass change under each scenario is plotted relative to base model (2013) output run over a 50-year
period. .......................................................................................................................................................... 30
Figure 3.12 Estimated relative change in the biomass of functional groups following scenarios that
examined the potential impacts of decreasing Snapper biomass by 10%, 20% and 30% of 2013 levels.
Biomass change under each scenario is plotted relative to base model (2013) output run over a 50-year
period. .......................................................................................................................................................... 34
Figure 3.13 Estimated relative change in the biomass of high value commercially fished groups under
different scenarios of Snapper biomass (while maintaining all fleet fishing efforts at 2013 levels). .......... 36
A trophic model for Gulf St Vincent: balancing exploitation of three fisheries vii
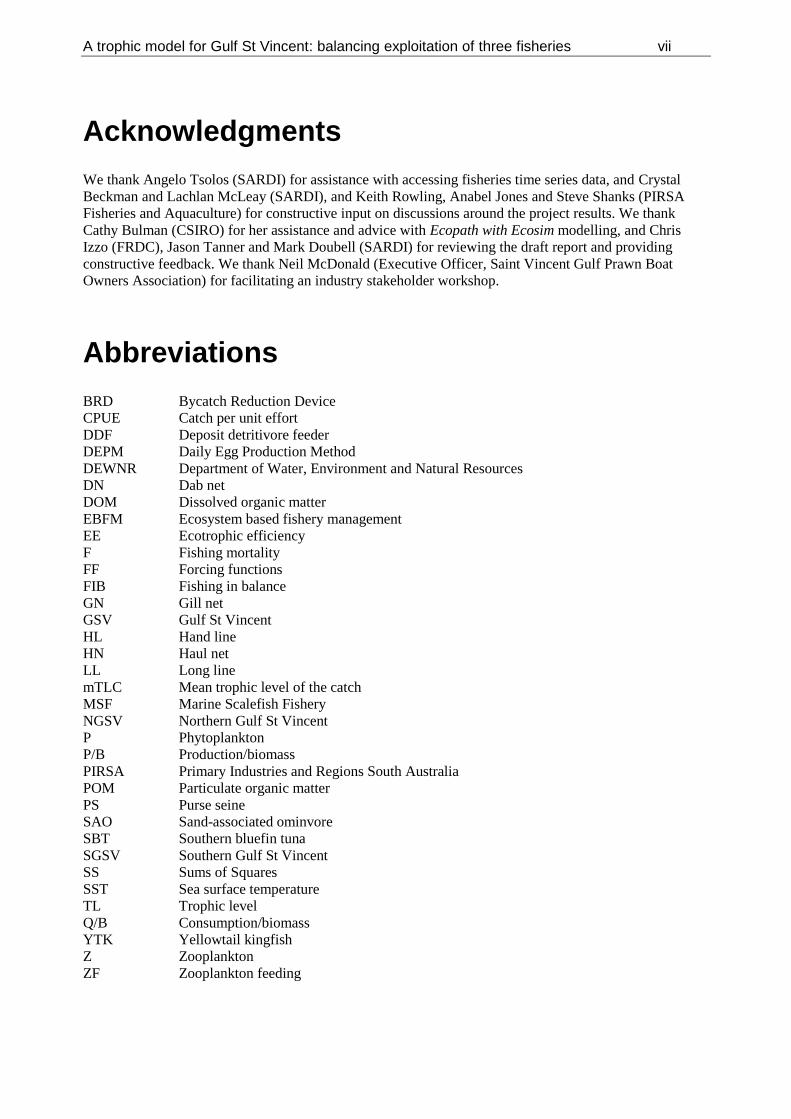
Acknowledgments
We thank Angelo Tsolos (SARDI) for assistance with accessing fisheries time series data, and Crystal
Beckman and Lachlan McLeay (SARDI), and Keith Rowling, Anabel Jones and Steve Shanks (PIRSA
Fisheries and Aquaculture) for constructive input on discussions around the project results. We thank
Cathy Bulman (CSIRO) for her assistance and advice with Ecopath with Ecosim modelling, and Chris
Izzo (FRDC), Jason Tanner and Mark Doubell (SARDI) for reviewing the draft report and providing
constructive feedback. We thank Neil McDonald (Executive Officer, Saint Vincent Gulf Prawn Boat
Owners Association) for facilitating an industry stakeholder workshop.
Abbreviations
BRD Bycatch Reduction Device
CPUE Catch per unit effort
DDF Deposit detritivore feeder
DEPM Daily Egg Production Method
DEWNR Department of Water, Environment and Natural Resources
DN Dab net
DOM Dissolved organic matter
EBFM Ecosystem based fishery management
EE Ecotrophic efficiency
F Fishing mortality
FF Forcing functions
FIB Fishing in balance
GN Gill net
GSV Gulf St Vincent
HL Hand line
HN Haul net
LL Long line
mTLC Mean trophic level of the catch
MSF Marine Scalefish Fishery
NGSV Northern Gulf St Vincent
P Phytoplankton
P/B Production/biomass
PIRSA Primary Industries and Regions South Australia
POM Particulate organic matter
PS Purse seine
SAO Sand-associated ominvore
SBT Southern bluefin tuna
SGSV Southern Gulf St Vincent
SS Sums of Squares
SST Sea surface temperature
TL Trophic level
Q/B Consumption/biomass
YTK Yellowtail kingfish
Z Zooplankton
ZF Zooplankton feeding

A trophic model for Gulf St Vincent: balancing exploitation of three fisheries 1
Executive Summary
What the report is about This project has developed the first whole of ecosystem model for Gulf St Vincent (GSV), South
Australia. It describes the key components of the ecosystem, and provides the first integrated assessment
of the stock status, performance and impact of its key fisheries over a 20-year period (1994 to 2014). The
model was principally developed to assess if increases in Snapper abundance in the late 2000s could have
contributed to reduced production in crustacean fisheries (Blue Crab and Prawn) in GSV, and if so,
whether a directed Snapper fishery could provide ecological and economic benefits. It also examined the
ecological and production implications of greater selectivity of fishing methods in the GSV Prawn fishery.
The GSV ecosystem model provides a basis for an ecosystem based management decision support tool for
fisheries and other key activities in GSV.
Background A dramatic switch was observed in the spatial structure of South Australia’s Snapper fishery between
2008 to 2013, leading to a marked increase in Snapper biomass in GSV that coincided with a considerable
downturn in the commercial harvests in the GSV Blue Crab and Prawn fisheries. As Snapper are known to
predate upon Blue Crabs and Prawns, there was concern and uncertainty among fishers and managers that
the downturn in these crustacean fisheries had occurred in part, due to increases in the biomass and
predation pressure of Snapper. The potential interactions between these three high-value fisheries and their
respective management has consequently generated a need to: a) better understand the trophic interactions
that underpin their production; b) assess the potential impacts of increased Snapper biomass on Blue
Crabs, Prawns and other key species, and c) assess if such impacts could be ameliorated by directed
fishing of Snapper to a level that optimised production across the three fisheries while minimising
ecosystem impacts.
An additional change in the GSV ecosystem, which has uncertain ecosystem implications, is the
introduction of more selective fishing methods in the GSV Prawn fishery. Rigid-grid bycatch reduction
devices (BRDs) and T90-mesh cod-ends were introduced in the GSV Prawn fishery in 2012. Use of BRDs
has substantially reduced sponge, elasmobranch and fish bycatch, not only improving fishing efficiency,
but enhancing the ability of the T90 net to exclude juvenile prawns, small fish and crustaceans from the
catch. The expectation among fishers and managers has been that reduced bycatch will bring positive
ecological benefits, but the potential ecosystem and fishery production consequences of greater gear
selectivity are uncertain.
Aims/objectives The objectives of the project were to develop a GSV ecosystem model to: 1) understand the impact of
changes in the abundance of Snapper on the GSV ecosystem, with particular emphasis on other high value
commercial fisheries, i.e. Prawns and Blue Crabs; 2) assess temporal change, the effects of fishing and
improved fishing selectivity on the GSV ecosystem over the last 20 years; and 3) assess and optimise
future ecological and economic performance of multi-species fisheries in an ecosystem based fishery
management (EBFM) framework.
Methodology A GSV ecosystem, trophic mass-balance model was developed using the Ecopath with Ecosim software.
The Ecopath model was constructed for 1994 and the Ecosim model developed for a 20-year time period
(1994-2013). The model area, which included all of GSV and part of the Investigator Strait, was
calculated to be 10,500 km2. The model incorporated 75 functional or trophic groups based on similarities
in diet, habitat, foraging behaviour, size, consumption and rates of production, as well as 31 fishing fleets
for which landings and effort data were available for the 20-year period. Key changes in the marine
ecosystem assessed were total catch; the mean trophic level of the catch (mTLC); and the Fishing in
Balance Index (FIB index). Two broad scenarios were examined using the model. The first examined the
potential ecosystem implications of greater gear selectivity in the GSV Prawn fishery brought about by the
introduction of BRDs and T90 nets in 2012; the second examined the potential impacts on the ecosystem
and high value fisheries from different Snapper biomass scenarios.

A trophic model for Gulf St Vincent: balancing exploitation of three fisheries 2
Results/key findings This project developed the first whole of ecosystem model for GSV that describes key components of the
ecosystem, and an integrated assessment of the stock status, performance and impact of its key fisheries
between 1994 and 2013. In terms of fisheries impacts, model results suggest there has been a general
increase in the biomass of most trophic groups as a consequence of marked declines in fisheries catch and
effort, over the 20-year period.
Analyses of key ecosystem indicators identified a relatively stable mean trophic level of the catch and FIB
index, against a backdrop of declining catches of most key fisheries by the end of the 20-year period.
Results suggest there may have been a net loss in production or productivity to the GSV ecosystem over
this period that could be attributed to underestimated catch in the model (e.g. from commercial discards
and/or recreational landings and discards), and/or a real loss of productivity as a consequence of
environmental change and/or environmental degradation (e.g. pollution, habitat loss).
Scenarios comparing the ecosystem response to greater gear selectively in the GSV prawn fishery,
supported the expectation that the introduction of BRDs/T90 cod-end mesh has resulted in positive
ecological benefits (an increase in the biomass of demersal sharks and rays). Importantly, no negative
impacts on other commercially targeted species were identified.
The ecological role of Snapper and its impact on crustacean and other fisheries was assessed. Snapper
were found to be important predators in the GSV ecosystem, consuming a diverse range of prey across
four trophic levels, with much of their predation directed to crustaceans and molluscs. Blue Crab was
important in the diet of Snapper (~24%), especially in northern GSV, but other commercially targeted
species were consumed at relatively lower levels (King George Whiting 2.9%, Western King Prawns
1.1%, Calarmari 0.4%, Garfish 0.04%). Results from the GSV ecosystem model estimated that Snapper
accounted for ~11% of the total consumption of Blue Crabs, and ~1% of Western King Prawns, with most
of the consumption of Blue Crabs and Prawns being accounted for by omnivorous crustaceans and a range
of crustacean and piscivorous feeding fish, respectively. Sensitivity and scenario analysis of ecosystem
responses to changes in Snapper biomass, suggests that most taxa groups are relatively insensitive to
changes in Snapper biomass. Increasing Snapper biomass had a negative effect on Blue Crab biomass
(<2% decline for each 10% increase in Snapper biomass), and a slight positive effect on Western King
Prawn biomass (~1% increase for each 10% increase in Snapper biomass). Snapper may form an
important mesopredator in the GSV ecosystem, providing a positive benefit to Prawns and Garfish
through predation and competitive interactions with their key predators (Australian Salmon, Calarmari and
Cuttlefish). Results from the ecosystem model suggest that the increase in Snapper biomass in GSV was
unlikely to have contributed significantly to the observed reduction in biomass of Blue Crab and Prawn.
Scenarios examining the potential ecological and economic benefits (increased biomasses of commercially
targeted taxa) that may result from a reduction in Snapper biomass achieved through a directed Snapper
fishery, identified that such an approach was unlikely to deliver significant benefits across fisheries. In
particular, the benefits to Blue Crab (slight positive effect) and Prawns (slight negative effect) was
unlikely to deliver cost-effective benefits to their respective fisheries.
Implications for relevant stakeholders The key implication of the development of the GSV ecosystem model, is that it provides a preliminary
tool to optimise future economic and ecological performance in seafood production within an EBFM
framework. This has not been possible until now. The GSV ecosystem model provides a framework for
managers, industry and other stakeholders to investigate the potential ecological and economic
implications of a range of fishery management scenarios. In particular, it provides a means to examine the
potential impacts of management measures directed at one fishery on other fisheries and on the broader
GSV ecosystem. The current model was developed explicitly to address the aims of the study, but with
further development could be used to investigate a range of different scenarios.
Importantly, the model results were able to determine that the marked increase in Snapper biomass in the
late 2000s in GSV was unlikely to have contributed significantly to the observed biomass reductions in
Blue Crab and Western King Prawn.

A trophic model for Gulf St Vincent: balancing exploitation of three fisheries 3
An important outcome of the study was an ecosystem based assessment of the performance of the key
GSV fisheries over a 20-year period. Results suggest that the declining performance of many of the key
fisheries in GSV in recent decades, could be due in part to a decline and/or loss of production to the
ecosystem over time. The important implications of this finding are the additional questions it raises about
the source(s) and cause(s) for declining productivity, and further model developments could explicitly
examine these questions.
Recommendations To improve application, utility and confidence in the GSV ecosystem model as a decision support tool for
ecosystem management, we recommend: a) further research to improve the provenance and quality of core
data for key species and trophic interactions (diet and biomass); b) the development of a spatially explicit
trophodynamic model (Ecospace) incorporating habitat data, the spatial distribution of fishing catch and
effort, and spatial layers that capture the full range of activities in GSV; and c) inclusion of environmental
time series to assess the potential impacts of environmental change (including climate change) on the GSV
ecosystem, and the industries and activities it supports.
Keywords
Gulf St Vincent (GSV), Snapper, Western King Prawn, Blue Crab, trophic interactions, Ecopath with
Ecosim.

A trophic model for Gulf St Vincent: balancing exploitation of three fisheries 4
1 Introduction
1.1 Background
A dramatic switch in the spatial structure of South Australia’s Snapper fishery was observed between
2008 and 2013. Spencer Gulf (SG) has traditionally yielded the State’s highest Snapper catches,
however, in recent years it has been superseded by Gulf St. Vincent (GSV) and the South East (SE),
two regions that had previously attracted little attention from fishers (Fowler et al. 2013). This shift
has been a consequence of a downturn in the commercial harvest in northern SG coupled with
increases in catches and catch rates in northern GSV. The perceived increase in Snapper biomass
concerned commercial Blue Crab and GSV Prawn fishers as their catches had concurrently declined.
As Snapper are known to heavily predate upon Blue Crabs and to a lesser extent prawns (Lloyd
2010), the apparent inverse trend in catches with the crustacean fisheries has generated suggestions
that there may be predatory ‘top-down’ regulation operating within GSV on Blue Crabs and Prawns.
The potential interaction between these three high-value fisheries and their respective management
concerns has consequently generated two broad questions: 1) what are the flow-on ecosystem effects
of changes in Snapper biomass on Western King Prawns, Blue Crabs and other species; and 2) what
balanced exploitation scenarios would optimise production and value of Snapper, Western King
Prawns and Blue Crabs and minimise ecosystem impacts?
Ecosystem based fishery management (EBFM) seeks to sustain healthy marine ecosystems and the
fisheries they support, by reversing the order of management priorities from the target species to the
ecosystem. The overall objective of EBFM is to sustain healthy marine ecosystems and the fisheries
or ecosystem services they support. Specifically, it seeks to address some of the unintended
consequences of fishing, including habitat destruction, incidental mortality of non-target species and
changes in the structure and function of ecosystems. Such considerations underpin more precautionary
fishery management measures that favour the ecosystem where knowledge to aid management is
insufficient (Pikitch et al. 2004), and more selective fishing practices in one or more of the ‘6-S’
selection strategies, namely: species, stock, size, sex, season and space (Zhou et al. 2010). EBFM has
been suggested to provide a more effective and holistic approach to managing fisheries than
traditional approaches (Gislason et al. 2000, Pikitch et al. 2004). Despite the global recognition of the
need to adopt the EBFM approach, there are very few examples where it has been utilised effectively
to complement the existing single species/stock management paradigm. It has been suggested this is
largely due to the science of its implementation often being considered overly complex and difficult
because ecosystem approaches are so broadly inclusive (Cowan Jr et al. 2012).
In GSV, the Western King Prawn fishery has made major advances in increasing the selectivity of
their fishing methods, with the introduction of rigid-grid bycatch reduction devices (BRDs) and T90-
mesh cod-ends in 2012. Use of BRDs has substantially reduced sponge, elasmobranch and fish
bycatch, not only improving fishing efficiency, but enhancing the ability of the T90 net to exclude
juvenile prawns, small fish and crustaceans from the catch (Dixon et al. 2013a). The outcomes for
industry are improved catch quality (fewer damaged prawns) and trawling efficiency due to longer
trawl shot duration and increased fuel efficiency (total fuel consumption per hour of trawling). The
expectation is that reduced bycatch will also lead to good environmental outcomes; however, the
ecological changes to GSV and the flow-on effects of reduced bycatch and discards to benthic
communities and to Snapper, Prawn and Blue Crab production are uncertain. Recently, the concept of
‘balanced exploitation’ for EBFM is gaining acceptance (Zhou et al. 2010). Where multiple fisheries
operate in the same ecosystems, this approach favours exploitation balance among species, stocks,
sexes and sizes, as a means to enhance maintenance of sustainable ecosystems and biodiversity (Zhou
et al. 2010). A key concept to balanced exploitation is maintenance of the abundance of species,
stocks, sexes and sizes above certain thresholds, in conjunction with productivity dependent
exploitation, and minimising ecological impacts.

A trophic model for Gulf St Vincent: balancing exploitation of three fisheries 5
This project aims to develop a GSV ecosystem model to assess the flow-on ecosystem effects of
increased Snapper abundance on other commercial fisheries within the gulf. Exploring shifts in
biomass between key, high value species across a range of trophic levels, while assessing the
ecological and stock production implications of greater selectivity in fishing methods is the principle
focus of this model. It will also provide a potential decision support tool for multi-species fisheries
management in GSV, as a step toward fully integrated (EBFM) whole-of-system management.
1.2 Need
The apparent biomass of Snapper in northern GSV increased considerably above historic levels,
between 2008 and 2013. This observation coincided with a marked decline in catches by GSV Prawn
and Blue Crab fisheries to the extent that it required a considerable reduction in fishing effort to
promote stock recovery. As Snapper are known to predate upon Blue Crabs and Prawns, there has
been concern and uncertainty among fishers and managers that the downturn in these crustacean
fisheries has occurred in part, due to predatory ‘top-down’ regulation by Snapper within GSV. The
potential interaction between these three high value fisheries and their respective management has
consequently generated a need to better understand the trophic interactions that underpin production
of these fisheries in GSV, how exploitation rates within each fishery may impact on production in the
others, and what balanced exploitation scenarios would optimise production and value across
fisheries, while minimising ecosystem impacts.
A GSV ecosystem model is needed to assess the linkages between increased Snapper abundance and
reduced production in crustacean fisheries. Sensitivity analyses and scenario testing will identify the
ecological factors important to production across the three fisheries, assessing the ecological and
production implications of greater selectivity of fishing methods in the GSV Prawn fishery and multi-
species optimisation scenarios. It will provide the basis for a potential decision support tool for multi-
species fisheries management in GSV.
1.3 Objectives
The objectives of the project were to develop a GSV ecosystem model to:
(1) Assess temporal change, the effects of fishing and improved fishing selectivity on the GSV
ecosystem over the last 20 years,
(2) Understand the impact of changes in the abundance of Snapper on the GSV ecosystem, with
particular emphasis on other high value commercial fisheries, i.e. Prawns and Blue Crabs, and
(3) Assess and optimise future ecological and economic performance of multi-species fisheries in
an EBFM framework.

A trophic model for Gulf St Vincent: balancing exploitation of three fisheries 6
2 Methodology
2.1 Ecopath and mass balance approach
The Ecopath with Ecosim (EwE) software (www.Ecopath.org, Version 6.5) was used to develop a
trophic mass-balance model of the Gulf St Vincent (GSV) ecosystem. Ecopath was developed by
Polovina (1984), based on a simple steady-state trophic box model, and further developed by
Christensen and Pauly (1992a) and Walters et al. (1997). Ecopath enables description of the static
state energy flow of an ecosystem at a particular point in time, whereas Ecosim enables dynamic
simulations based on Ecopath parameters that allow the forecasting of ecosystem response to
environmental perturbations. The EwE software has now been used to describe a diverse range of
aquatic ecosystems world-wide, and details of the ecological theory and mathematical equations that
underpin its key functions have been extensively detailed elsewhere (e.g. Christensen and Walters
2004, Griffiths et al. 2010, Piroddi et al. 2010, Shannon et al. 2008). For the GSV ecosystem, an
Ecopath model was constructed for 1994. Time series data over a 20-year period (1994-2013) were
used to develop the Ecosim model. A 20-year time period was chosen as it provided a suitable period
to tune the model to fisheries time-series data (see Section 2.3 below) and assess ecosystem change.
2.2 Model area and structure
The model domain extended from Cape Davenport (lower Yorke Peninsula) to Cape Cassini (north-
coast of Kangaroo Island) across Investigator Strait, to a line between the southernmost point of the
Fleurieu Peninsula and Cape St Albans on Kangaroo Island (Figure 2.1). The model area was
calculated to be 10,500 km2.
A number of functional or trophic groups were used in the GSV ecosystem model, based on species
similarity in terms of diet, habitat, foraging behaviour, size, consumption and rates of production
(Table 2.1). Many commercial species were modelled as separate groups to aid scenario
testing/modelling, and facilitate the assessment of impacts and drivers. The GSV ecosystem model
structure is built around 75 functional groups including: mammals (4), birds (6), chondrichthyans (9),
teleosts (26), cephalopods (4), other invertebrates (18), microbes (2), autotrophs (3), detritus (2) and
discards (1) (Table 2.1, Appendix 2). A large dietary matrix was developed that included 328 prey
taxa categories. Dietary information was based largely on those data utilised in the construction of the
Spencer Gulf Ecosystem (SGE) Model (FRDC Project No. 2011/205; Gillanders et al. 2015), but
where regional data with provenance to GSV were available, they were used in preference. Key
sources of dietary data were Page et al. (2011) and Currie and Sorokin (2010). For Snapper, diet data
were sourced from a large dataset of stomach contents analysis obtained across multiple seasons
within GSV (Lloyd 2010, and SARDI unpublished data). Guild structure analyses in Currie and
Sorokin (2010) also provided a basis for structuring of functional/trophic groups within the model,
particularly for fish species. Intrinsic to Ecopath model development, each trophic group operates as
a single biomass, despite groups often being composed of multiple species. The aggregation of
species into trophic groups will therefore effect model dynamics in some instances; however, by
matching species for diet, consumption, and production rates we attempted to constrain the errors and
uncertainty of aggregating (see Appendix 3).
In addition to diet information, there are four key parameters that are required by Ecopath for each
group to balance a model. These include biomass (B), production per unit of biomass (P/B, equivalent
to the instantaneous rate of total mortality (Z) used by fisheries biologists, under the steady-state
assumption of the model), consumption per unit of biomass (Q/B) and ecotrophic efficiency (EE, the
fraction of the production that is used in the system, i.e. either passed up the food web, used for
biomass accumulation, migration or export, and varies between 0 and 1 and can be expected to
approach 1 for groups with considerable predation pressure). Values for three of these four parameters

A trophic model for Gulf St Vincent: balancing exploitation of three fisheries 7
need to be estimated, with the final parameter value estimated by the model. Where possible, the
biomasses (t km-2) of functional groups were estimated either from field surveys or stock assessments.
A detailed description of the functional groups and how estimates of biomass, P/B and Q/B were
derived are provided in Appendix 2.
Fishery data on landings, discards and effort were obtained for the GSV ecosystem region and broken
down into 31 fishing fleets (Table 2.2). With the exception of the Cockle, Charter boat, Recreational
and ‘Other’ fishing fleets, the remaining fisheries all fall within six main fishery management units:
South Australian (SA) Sardine (1 fleet), SA Marine Scalefish (18), GSV Prawn (1), Blue Crab (4),
Abalone (2) and Southern Rock Lobster (1). Annual fishery landings and effort data were obtained for
all fleets between 1994 and 2013 (logbook data obtained from SARDI Aquatic Sciences). Retained
and discarded catch data were typically only available for between 1 and 3 years for each fishery, and
were estimated for 1994 based on their proportion to landed catch or effort (Currie et al. 2009b,
Fowler et al. 2009, Roberts and Steer 2010). All landed and discarded species were assigned their
functional group, and biomasses summed at the functional group level (t km-2).
For the GSV Prawn fishery, the discarded catch data were obtained from a project that trialled T90
cod-end nets and bycatch reduction devices (BRDs) (Dixon et al. 2013a). Although the raw bycatch
data were not published, they were available and analysed as part of this project so they could be
incorporated into the GSV ecosystem model. The standardised surveys of catch and discards in the
GSV Prawn fishery followed the methods described by Dixon et al. (2013a), and biomass estimation
of taxonomic groups followed methods described by Currie et al. (2009a) and Burnell et al. (2015).
The upper standard error estimates were used to provide a starting biomass (prior to model balancing)
for many taxonomic groups in the GSV model, because trawl surveys generally underestimate
biomass, depending the size, mobility and net-avoidance capacity of taxa (Poiner et al. 1998). The
biomass estimates derived for each bycatch species are presented in Appendix 4.
For the GSV Blue Crab fishery, the discarded catch data were obtained from fishery-independent
surveys conducted annually since 2002. Bycatch data from 2002 to 2006 were published in the stock
assessment report (Currie et al. 2007), but for the subsequent years is unpublished. However, the
unpublished data were available and biomass estimates for these were calculated for 2002 to 2014.
Time series of annual catch and catch per unit-effort (CPUE) were calculated for functional groups,
and biomass and fishing mortality (F) estimates were used where available.
2.3 Model fitting
Dynamic simulations were run in Ecosim using 94 time-series (1994-2013) of estimates of fishing
effort, biomass or relative biomass (CPUE) and fishing mortality (F) for functional groups with
available data (for list of time series see Appendix 5). Several Ecosim scenarios were explored
through adjustment of predator vulnerability using the ‘fit to time series’ procedure. Different
numbers of predator interactions within the dietary matrix were selected (10-50) within this procedure
to identify the most sensitive and optimal number of predator interactions, and their vulnerability
values that would minimise the model sum of squares (SS) and Akaike Information Criteria (AIC),
and produce the best fit to the time series data. Some of the default Ecosim parameters were then
adjusted to further decrease the model SS. This included adjusting the maximum relative feeding time
of marine mammals and seabirds from 2.0 (default) to 10.0, and their feeding time adjustment rates to
0.5 (0 for all other groups), to account for modifications to their search feeding times in response to
changes in prey availability (Christensen et al. 2008). Similarly, we adjusted density-dependent
predator-prey switching power of the dolphin and seal groups from 0 to 2.0, to account for their
capacity to opportunistically adjust their diet in response to changes in prey availability (Piroddi et al.
2010). We also explored improvements to model fits by adjusting values of density-dependent
A trophic model for Gulf St Vincent: balancing exploitation of three fisheries 8
changes in catchability for pelagic schooling fish such as sardines (Christensen et al. 2008, Piroddi et
al. 2010), but these did not produce improvements to the model fits.
2.4 Ecosystem indicators
After the model fitting procedure in Ecosim, we examined three variables to evaluate changes in the
marine ecosystem: 1) total catch; 2) the mean trophic level of the catch (mTLC) which is calculated as
the weighted average of the trophic level (TL) of fishery targeted species (Pauly et al. 1998); and 3)
the Fishing in Balance Index (FIB index), which assesses whether catch rates are in balance with
ecosystem trophic production due to catch at a given TL being related to the assimilation efficiency of
the ecosystem (Coll et al. 2009). The FIB index will remain constant if a decline in mean trophic level
of the catch is matched by an ecologically appropriate increase in catch, and conversely for increasing
trophic level (Pauly and Palomares 2005). In general, the index increases if the underlying fishery
expands beyond its traditional fishing area or ecosystem, and decreases if the geographic area
contracts, or if the underlying food web is collapsing (Pauly and Palomares 2005).
2.5 Scenario testing
Scenario testing was undertaken to explore different ‘what-if’ questions that can be informed by
trophodynamic modelling of the GSV ecosystem. Two key scenarios were examined: the first to
assess the potential ecosystem implications of greater gear selectivity in the GSV Prawn fishery
brought about by the introduction of BRDs and T90 nets in 2012; the second to assess the potential
impacts on the ecosystem and high value fisheries from different Snapper biomass scenarios.
For the fishing gear selectivity scenario, results from the study by Dixon et al. (2013a) were used as
the basis to estimate the reduced extent of bycatch and discards associated with the introduction of
BRDs and T90 nets into the fishery. There was no significant difference in mean catch rate between
the T90 cod-end net with or without the BRD, therefore the data for landings remained unchanged.
However, there were reductions in the bycatch when the T90 cod-end nets with BRDs was used
(relative to no-BRD/T90). The bycatch was broadly separated into three groups: sponges,
elasmobranchs (sharks and rays) and fish/crabs. The reduction in bycatch rate indicated in Figure 12
of Dixon et al. (2013a) was used to estimate the proportional decrease in biomass, i.e. 0.125 for
sponges, 0.0227 for elasmobranchs and 0.8182 for fish/crabs. These proportions were then used to
adjust the values across taxa groups in the pre-BRD/T90 discard catch data. A new ‘GSV Prawn
BRD/T90’ fleet was added with these modified (reduced) discards. In the base (pre-BRD/T90) model
scenario, fishing only occurred in the regular GSV Prawn fleet, effort in the new (BRD/T90) fleet was
set to zero, and a constant level of fishing effort was maintained over a 50-year period (2014 to 2063),
based on the average 2002 to 2012 effort levels (0.85 of 1994 levels). In the post-BRD/T90 scenario,
fishing effort was increased in the new fleet to match that used for the old (pre-BRD/T90) fleet in the
base model and run for a 50-year period (2014 to 2063) with the old fleet effort set to zero. In both
scenarios, fishing effort in all other fleets was held constant at 2013 levels. The relative change in
estimated biomass of groups in the post-BRD/T90 scenarios was then compared to that of the base
model.
For scenarios assessing the potential impacts of increased Snapper biomass, Snapper biomass was
increased by 10%, 20% and 30% of 2013 levels of the base GSV ecosystem model and then held
constant for a 50-year period (2014 to 2063), while maintaining all fishing fleet efforts constant at
2013 levels (except for the GSV Prawn fleet, which was maintained at 0.85 of 1994 levels, as there
was zero effort in 2013). The relative change in estimated biomass of groups under the different
Snapper biomass scenarios was then compared to that of the base model. Additional scenarios were
run where Snapper biomass was fixed at varying levels ranging from 0.1 and 0.7 t km-2, and held
constant for a 50-year period to examine the potential impacts of a range of difference Snapper
biomasses on the GSV ecosystem from a base level of 1994 to an equivalent of a 7-fold increase in
biomass. The group biomasses under different Snapper biomass scenarios were then compared.

A trophic model for Gulf St Vincent: balancing exploitation of three fisheries 9
Figure 2.1 Area of Gulf St. Vincent (GSV) (shaded blue) used to define the model domain in the GSV
Ecosystem Model. The region of the Spencer Gulf Ecosystem Model (FRDC 2011/205) is also indicated,
bounded by the black line.

A trophic model for Gulf St Vincent: balancing exploitation of three fisheries 10
Table 2.1 Functional or trophic groups used in the GSV ecosystem model as defined in Appendix 2. Parameter
values are indicated where P/B = production/biomass; Q/B = consumption/biomass; EE = ecotrophic efficiency.
Bold values are estimated by the model. DDF = deposit detritivore feeding; DOM = dissolved organic matter;
POM = particulate organic matter; ZF = zooplankton feeding.
Group name
Trophic level
Habitat area
(fraction)
Biomass (t/km²)
P/B (/year)
Q/B (/year)
EE
1 Australian Sea Lion 4.93 1 0.00627 0.79200 29.44000 0.00006
2 Long Nosed Fur Seal 5.00 1 0.00213 1.18400 49.86000 0.04310
3 Bottlenose Dolphin 4.85 1 0.00354 0.08000 18.99000 0.04543
4 Common Dolphin 5.09 1 0.02210 0.09000 20.58000 0.00525
5 Petrel 4.62 1 0.00514 1.00000 191.18000 0.57278
6 Australian Gannet 5.40 1 0.00003 1.00000 125.33000 0.00000
7 Little Penguin 4.87 1 0.00148 1.29000 85.64000 0.47190
8 Shags & Cormorants 4.46 1 0.00051 1.00000 77.41000 0.00000
9 Terns 4.84 1 0.00003 1.00000 90.23000 0.87527
10 Gulls 3.96 1 0.00203 1.00000 129.35000 0.00000
11 White Shark 5.87 1 0.00001 0.10000 1.73000 0.00000
12 Whaler Shark 5.15 1 0.03000 0.09500 2.61000 0.95000
13 Smooth Hammerhead 5.63 1 0.00003 0.10000 3.15000 0.95000
14 Common Thresher Shark 5.00 1 0.00001 0.15000 2.78000 0.95000
15 Gummy shark 3.69 1 0.07472 0.55000 2.60000 0.28899
16 School shark 5.15 1 0.00205 0.88000 2.50000 0.90000
17 Port Jackson shark 4.22 1 0.02529 0.25000 1.52000 0.71081
18 Other demersal shark 3.66 1 0.03622 0.35100 2.60000 0.53671
19 Rays & skates 3.65 1 0.16777 0.41800 1.76000 0.32163
20 Southern Bluefin Tuna 5.16 1 0.00258 0.20000 1.60000 0.90000
21 Yellowtail Kingfish 5.22 1 0.00287 0.20000 2.50000 0.90000
22 Snapper 3.85 1 0.13065 0.49300 3.80000 0.90000
23 Snook 4.80 1 0.04247 0.41100 3.51000 0.90000
24 Barracouta 5.22 1 0.22935 0.41100 3.64000 0.90000
25 Skipjack Trevally 3.70 1 0.21971 0.48000 4.17000 0.79584
26 Medium piscivore fish 4.48 1 0.37753 0.63600 1.58000 0.90000
27 Medium echinoderm fish 3.33 1 0.01362 0.62500 2.34000 0.90000
28 Australian Salmon 4.95 1 0.59737 0.45000 4.70000 0.90000
29 Australian Herring 3.83 1 1.04027 0.45000 4.70000 0.90000
30 King George Whiting 3.58 1 0.07879 0.54800 2.29000 0.90000
31 Garfish 2.94 1 0.14984 0.32900 4.73000 0.90000
32 Red Mullet 3.66 1 0.07984 0.79000 2.36000 0.90000
33 Silverbelly 3.62 1 0.22685 1.10000 4.40000 0.90000
34 Medium crustacean fish 3.72 1 0.09585 0.54600 2.97000 0.90000
35 Medium molluscan fish 3.38 1 0.35628 0.86900 2.26000 0.90000
36 Small crustacean fish 3.46 1 0.48935 1.31500 3.32000 0.90000
37 Degens/Rough Leatherjacket 3.10 1 0.85509 0.90000 2.26000 0.90000
38 Small polychaete fish 3.22 1 0.32935 0.99200 2.82000 0.90000
39 Syngnathids 3.63 1 0.00393 1.00000 4.70000 0.90000

A trophic model for Gulf St Vincent: balancing exploitation of three fisheries 11
40 Blue Mackerel 4.14 1 1.23074 0.49000 6.40000 0.90000
41 Jack/Yellowtail Mackerel 4.24 1 3.30417 0.52000 5.37000 0.90000
42 Sardine 4.18 1 1.79589 1.00000 5.04000 0.45379
43 Anchovy 3.97 1 2.19924 0.98000 5.76000 0.90000
44 Sprats 3.30 1 0.58648 1.00000 5.76000 0.90000
45 Fish larvae 2.82 1 1.77291 4.00000 20.00000 0.99000
46 Southern Calarmari 5.05 1 0.08870 1.83000 18.25000 0.90000
47 Giant Australian cuttlefish 3.72 1 0.06592 2.37000 5.80000 0.90000
48 Other squids 4.51 1 0.17060 1.80000 17.50000 0.90000
49 Octopus 3.74 1 0.07866 2.37000 7.90000 0.90000
50 Rock Lobster 2.87 0.5 0.02941 0.73000 12.41000 0.47857
51 Western King Prawn 2.38 1 0.08225 7.57000 37.90000 0.61467
52 Blue Swimmer Crab 2.99 1 0.43756 2.80000 8.50000 0.90000
53 Sand Crab 3.06 1 1.01104 2.80000 8.50000 0.90000
54 Other large crabs/bugs 2.01 1 23.99724 2.80000 8.50000 0.90000
55 Sand associated omnivore crustacean 2.50 1 28.98130 0.79000 11.30000 0.90000
56 Herbivorous macrobenthos 2.32 1 35.80787 2.80000 14.00000 0.90000
57 Sand zoobenthos feeder 2.27 1 118.67940 0.65000 7.50000 0.90000
58 Greenlip Abalone 2.00 0.2 0.12000 1.50000 15.00000 0.00152
59 Blacklip Abalone 2.00 0.2 0.00339 1.50000 15.00000 0.90000
60 Small mobile DDF crustacean 2.51 1 1.15765 7.01000 27.14000 0.90000
61 Small mobile ZF crustacean 3.48 1 39.18450 1.12000 9.50000 0.90000
62 Polychaetes DDF 2.62 1 6.56530 1.60000 6.00000 0.90000
63 Sessile epifauna 2.47 1 0.95748 2.80000 11.80000 0.28940
64 Gelatinous zooplankton 3.38 1 0.20000 16.50000 80.00000 0.16542
65 Large carnivorous zooplankton 2.95 1 45.87358 5.00000 32.00000 0.99000
66 Small herbivorous zooplankton 2.03 1 42.59775 29.50000 55.00000 0.99000
67 Meiofauna 2.56 1 0.88714 35.00000 125.00000 0.99000
68 Microphytobenthos 1.65 1 0.50000 9500.0000 12000.000 0.26935
69 Planktonic microflora 1.62 1 2.20880 571.00000 1028.0000 0.99000
70 Macroalgae 1.00 0.012 46.80000 10.00000 0.00000 0.82785
71 Seagrass 1.00 0.202 667.87260 0.93800 0.00000 0.04255
72 Phytoplankton 1.00 1 22.00000 190.00000 0.00000 0.50691
73 Detritus DOM water column 1.00 1 20.40000 0.95179
74 Detritus POM sediment 1.00 1 18.50000 0.76073
75 Discards 1.00 1 0.10490

A trophic model for Gulf St Vincent: balancing exploitation of three fisheries 12
Table 2.2. Details of the 31 different fishing fleets examined in the GSV Ecosystem Model. PS = purse seine;
HN = haul net; DN = dab net; LL = long line; HL = hand line; CP = crab pot; CN = crab net; LP = lobster pot;
CR = cockle rake. Other refers to minor fisheries (ocean jackets, octopus, poles/rods, troll line, and trot line).
No. Fleet name Fishery Management Unit
1 Snapper-HL Marine Scalefish Fishery
2 Snapper-LL Marine Scalefish Fishery
3 King George Whiting-HN Marine Scalefish Fishery
4 King George Whiting-HL Marine Scalefish Fishery
5 Australian herring-HN Marine Scalefish Fishery
6 Australian salmon-HN Marine Scalefish Fishery
7 Australian salmon-PS Marine Scalefish Fishery
8 Garfish-HN Marine Scalefish Fishery
9 Garfish-DN Marine Scalefish Fishery
10 Sardine-PS SA Sardine Fishery
11 Shark-HL Marine Scalefish Fishery
12 Small mesh net Marine Scalefish Fishery
13 Large mesh set net Marine Scalefish Fishery
14 Troll line Marine Scalefish Fishery
15 Drop line Marine Scalefish Fishery
16 Fish trap Marine Scalefish Fishery
17 Other-HN Marine Scalefish Fishery
18 Other-HL Marine Scalefish Fishery
19 Squid jig Marine Scalefish Fishery
20 GSV Prawn GSV Prawn Fishery
21 Blue crab-CP Blue Crab Fishery
22 Blue crab-HN Blue Crab Fishery
23 Blue crab-CN Blue Crab Fishery
24 Sand crab-CN Blue Crab Fishery
25 Rock lobster-LP Southern Rock Lobster Fishery
26 Blacklip abalone Abalone Fishery
27 Greenlip abalone Abalone Fishery
28 Cockle-CR
29 Charter Boat
30 Recreational Fishing
31 Other
A trophic model for Gulf St Vincent: balancing exploitation of three fisheries 13
3 Results
3.1 Trophic structure and flow (Ecopath)
The basic parameters used to inform the 75 functional groups within the Ecopath model are presented
in Table 2.1, those in bold represent parameters estimated by Ecopath. The balancing procedure
required adjustment to the diets of some groups where ecotrophic efficiencies (EE) were initially >1.
EE is the proportion of production that is either harvested or predated upon by higher trophic levels
and cannot exceed 1. There were many adjustments that were required to balance the model. Some of
these could be achieved by slight changes to dietary proportions for some functional groups, others
required changes to estimated biomass, P/B and Q/B estimates.
The trophic flows between the functional groups in the GSV ecosystem model estimated by Ecopath
are summarised in Figure 3.1. The trophic level of the functional groups ranged from 1 to 5.87, with
the highest values for White Shark, Smooth Hammerhead, Australian Gannet, Yellowtail Kingfish,
Barracouta, Southern Bluefin Tuna, Whaler Sharks, School Shark, Common Dolphin, Southern
Calarmari, Long-Nosed Fur Seals and Common Thresher Shark (TL >5). Australian Salmon,
Australian Sea Lion, Little Penguin, Bottlenose Dolphin, Terns, Snook, Petrels and other squids had
TL ≥ 4.5. (Table 2.1, Fig. 3.1). Medium piscivorous fish, Shags and Cormorants, Jack/Yellowtail
Mackerel, Port Jackson Shark, Gulls, Sardine, Blue Mackerel, Anchovy, Gulls, Snapper, Australian
Herring, Octopus, medium crustacean eating fish, Giant Australian Cuttlefish, Skipjack Trevally,
Gummy Shark, other demersal sharks, Red Mullet, rays and skates, syngnatids, silverbelly, and King
George Whiting had trophic levels ranging between 3.5 and 4.5. In terms of biomass, the lower
trophic levels of the GSV ecosystem are dominated by crustacean groups, seagrass and macroalgae
(Fig. 3.1).
3.2 Model fitting (Ecosim)
A total of 94 time-series were loaded into the Ecosim model (Appendix 5). The modelled time-series
of biomass and estimated catch and observed trends, for the six key GSV fished species are presented
in Figure 3.2. Modelled estimates of biomass tracked those indicated by CPUE data reasonably well
for most groups (Fig. 3.2). However, for Snapper the model struggled to replicate the full extent of the
increase after 2008. For Western King Prawn, the model does not capture the peaks in prawn catches,
but does track the general decline. For Garfish, the model failed to track the ongoing decline in
CPUE, instead predicting a slight increase in biomass over the modelled period (Fig. 3.2). Estimated
modelled catches of the six key fished taxa tracked actual catches reasonably well (Fig. 3.2).
However, for Snapper the model anticipated a gradual increase in catch throughout the late 1990s and
early mid-2000s, when in fact catch was fairly flat until the sudden increase in the late 2000s (Figure
3.2).

A trophic model for Gulf St Vincent: balancing exploitation of three fisheries 14
Figure 3.1 Flow diagram expression of trophic flows and trophic levels in the GSV ecosystem. Functional groups are represented by a circle; the size of the circle is
proportional to its biomass (colour of circles is unrelated to any parameter).
5
4
3
2
1
Australian sea lion
LN fur seal
Bottlenose dolphin
Common dolphin
Petrel
Australian gannet
Little penguin
Shags & commorants
Terns
Gulls
White shark
Whaler shark
Smooth hammerhead
Common thresher shark
Gummy shark
School shark
Port Jackson shark
Other demersal shark
Ray & skate
Southern bluefin tunaYellowtail kingfish
Snapper
Snook
Barracouta
Skipjack trevally
Medium piscivore fish
Medium echinoderm fish
Australian salmon
Australian herring
King George whiting
Garfish
Red mulletSilverbelly Medium crustacean fish
Medium molluscan fish Small crustacean fish
Degens/Rough leatherjacket Small polychaete fish
Syngnathids
Blue mackerel
Jack/yellowtail mackerel
Sardine
Anchovy
Sprats
Fish larvae
Southern calamary
Giant cuttlefish
Other squids
Octopus
Rock lobster
Western king prawn
Blue swimmer crabSand crab
Other large crabs/bugs
Sand associated omnivore crustacean
Herbivorous macrobenthos Sand zoobenthos feeder
Greenlip abalone Blacklip abalone
Small mobile DDF crustacean
Small mobile ZF crustacean
Polychates DDF Sessile epifauna
Gelatinous zooplankton
Large carnivorous zooplankton
Small herbivorous zooplankton
Meiofauna
MicrophytobenthosPlanktonic microflora
Macroalgae Seagrass
PhytoplanktonDetritus DOM water columnDetritus POM sediment
Discards

A trophic model for Gulf St Vincent: balancing exploitation of three fisheries 15
Bio
ma
ss
(t
km
-2)
Figure 3.2 Example of time series fits of the Gulf St Vincent ecosystem model (thin line) to observed biomass
(CPUE) and catch (dots and dashed trend line) data for six key commercial groups between 1994 and 2013.

A trophic model for Gulf St Vincent: balancing exploitation of three fisheries 16
3.3 Temporal changes in GSV ecosystem
Trends in catch
Trends in total catches (landings and discards), catches of the six high value commercial fisheries
(prawn, Blue Crab, Snapper, Garfish, King George Whiting and Calamari), and of other groups in the
GSV ecosystem between 1994 and 2013 are presented in Figure 3.3. Trends in total catch show
marked peaks as a consequence of sardine catch in GSV. The sardine fishery developed in southern
Spencer Gulf, and there was significant growth in the fishery between 1991 and 2010, with the major
growth period occurring since 2000. Although most of the catch occurs in southern Spencer Gulf,
occasionally catch is taken in the GSV region (mainly in Investigator Strait and lower GSV) (Ward et
al. 2015). When sardine catches are excluded, the remaining aggregated GSV catch has declined
steadily over the 20-year period by about one-third (Figure 3.3a), with mean catch over the last five
years (2,057 t; 2009-2013) being about 68% of that caught in the first five years of the study period
(3,016 t; 1994-1998). Also, the total catch in the final year (1,389 t, 2013) was less than half that in
the first year of the study (3,026 t; 1994).
A major component in the decline in catch is attributable to a major reduction in effort in the Australia
salmon purse seine fishery, which resulted in a substantial (~90%) reduction in the catch of this
species over the study period (Figure 3.3 c). There was also a major reduction in large mesh net set
(demersal gillnet) effort targeting gummy and school shark (Figure 3.3 c-d), which followed transfer
of management of the fishery from the State to the Commonwealth in 2000, resulting in major
closures in State waters including GSV. This resulted in a significant (~60%) decline in the combined
catch of gummy, school and other demersal sharks over the 20-year period (Figures 3.3 c-d).
There were significant changes in the catches of the six main high-value commercially targeted
groups between 1994 and 2013 (Figure 3.3 b). Prawn and Blue Crab catches declined by ~37% (~21%
if 2013 is excluded when the fishery was closed) and ~25% between the first and last five years of the
study, respectively. Significant declines in King George Whiting (~54%) and Garfish (~43%) also
occurred (Figure 3.3 b). In contrast, catches of Calamari were relatively stable. Snapper catches
remained relatively stable between 1994 and 2004, before increasing sharply between 2005 and 2010
(Figure 3.3b). There was a 5.75-fold increase in Snapper catch between the first five and last five
years of the study period.
Group biomasses
The relative change in group biomasses between 1994 and 2013, estimated by the GSV ecosystem
Ecosim model, are presented in Figure 3.4. Across the array of different trophic groups, most showed
an increase in relative biomass over the study period (Figure 3.4). A major part of this is directly
related to the marked reduction in catch (~46%) of both landed (-54%) and discarded (-33%) groups
and the flow-on effects through trophic cascades to higher trophic levels (Figure 3.4). This is apparent
with yearly changes in biomass over the study period for teleost fish, sharks and rays, and
cephalopods (Figure 3.5). Teleost groups estimated to increase significantly over the study period
included Snapper, Snook, Australian Salmon and Herring, medium molluscan feeding fish,
syngnathids and anchovy (Figure 3.4). For chondrichthyans, notable recoveries included School
Shark, Common Thresher, Smooth Hammerhead, and Whaler Sharks (Figure 3.4). The estimated
increase in the cephalopod groups was largely driven by a notable recovery in Giant Australian
Cuttlefish (Figure 3.4). For most commercially-targeted groups, the model estimated an increase in
biomass over the study period, although as noted above, the projected increase in Garfish is at odds
with declines in CPUE, harvest fraction and fishable biomass since 2010 (Figure 3.2, 3.3) (Steer et al.
2016). Declines in biomass were estimated to have occurred for Blacklip Abalone, Western King
Prawn and Blue Swimmer Crab (Figure 3.4). The model estimated increases in the biomass of marine
mammal and seabird groups throughout the study period (Figure 3.4, 3.5). Although the model
includes fishing mortality for many of the targeted (landed) and discarded groups, it does not include
any non-fishery related anthropogenic mortality. This may be significant for some of the higher

A trophic model for Gulf St Vincent: balancing exploitation of three fisheries 17
trophic level groups. For example, the model projected an increase in the biomass of Australian sea
lion over the 20 year study period, whereas recent surveys for the species indicate that the population
has declined significantly over that time (Goldsworthy et al. 2015).
Effects of fishing
Ecosystem indicators
In addition to trends in catches and changes to group biomasses, two additional ecosystem indicators
(the mean trophic level of the catch and FIB index, were used to evaluate ecosystem change and the
effects of fishing. The mean trophic level of the catch remained relatively stable throughout the study
period and ranged from 3.3 to 3.8 (Figure 3.6a). The lowest point of 3.3 occurred in 2007, and then
increased steadily to 2013 to 3.8 (Figure 3.6a). Declines in the catch of Australian Salmon (TL=4.95)
contributed to the slight decline in mean trophic level of the catch to 2007, whereas increases in the
catch of Snapper (TL=3.85) and declines in catches of Blue Crab (TL=2.99), Prawn (TL=2.38),
Garfish (TL=2.94) and steady catches of southern Calarmari (TL=5.05) contributed to the increase in
mean trophic level of the catch between 2007 and 2013 (Figure 3.5a).
The FIB index was stable across the 20 years in absolute terms (Figure 3.6b). In general, the FIB
index increases if the underlying fishery expands beyond its traditional fishing area or ecosystem, or if
bottom-up effects result in more catch than expected; and decreases if the geographic area contracts,
or if the underlying food web is collapsing (Coll et al. 2009, Pauly and Palomares 2005). The
magnitude of change in FIB index typically reported for fisheries-impacted ecosystems are generally
in the order of 0.1 to 1.0 or more over time (Large Marine Ecosystems of the world at
www.seaaroundus.org, Kleisner and Pauly 2011, Tsikliras et al. 2015). In contrast, the magnitude of
the range of FIB index values for the 20-year study period in GSV was two to three orders of
magnitude lower (i.e. stable).
Improved gear selectivity in GSV prawn fishery
The ecosystem impacts of improved gear selectivity following the introduction of devices BRD and
T90 nets in the GSV Prawn fishery were examined by comparing the estimated biomasses of groups
following pre- and post-BRD/T90 fishing scenarios, run over a 50-year period (2014 to 2063) (Figure
3.7). The most notable impact following post-BRD/T90 fishing scenarios was the marked reduction in
discards (~43%) relative to pre- BRD/T90 fishing scenarios (Figure 3.7). There was also a marked
increase in biomass of demersal chondrichthyans, particularly Port Jackson sharks (~22%), rays and
skates (~10%) and other demersal sharks (~6%) following post-BRD/T90 fishing scenarios, relative
to pre-BRD/T90 fishing scenarios (Figure 3.7). For all other groups, biomass changes estimated under
a post-BRD/T90 fishing scenario were relatively minor (<1%), and there were no projected negative
impacts on commercially-targeted species (Figure 3.7).

A trophic model for Gulf St Vincent: balancing exploitation of three fisheries 18
a
b
c
d
e
f
Figure 3.3 Trends in the total catch (t y-1) (observed landings plus estimated discards) of groups in the
GSV ecosystem between 1994 and 2013.

A trophic model for Gulf St Vincent: balancing exploitation of three fisheries 19
Figure 3.4. Estimated relative change in the biomass of functional groups in the GSV ecosystem model from
1994 to 2013. A value of 1 indicates a doubling of biomass, -1 a loss of that group.
A trophic model for Gulf St Vincent: balancing exploitation of three fisheries 20
Figure. 3.4 continued.

A trophic model for Gulf St Vincent: balancing exploitation of three fisheries 21
Figure 3.5 Estimated changes in the biomass of major taxonomic groups in the GSV ecosystem groups by year
between 1994 and 2013.

A trophic model for Gulf St Vincent: balancing exploitation of three fisheries 22
a.
b.
Figure 3.6 Ecosystem indicators calculated from the GSV ecosystem (Ecopath with Ecosim) model for the
period 1994 to 2013; a) mean trophic level of the catch (line indicating mean for time-series), and b) Fishing in
Balance (FIB) index.

A trophic model for Gulf St Vincent: balancing exploitation of three fisheries 23
Figure 3.7 Estimated relative change in the biomass of functional groups following introduction of BRD/T90 net
in the GSV prawn fishery in the GSV Ecosystem. Biomass change with BRD/T90 (reduced discards) is plotted
relative to base model scenario (pre-BRD/T90 net) output run over a 50-year period.

A trophic model for Gulf St Vincent: balancing exploitation of three fisheries 24
Figure 3.7 continued.

A trophic model for Gulf St Vincent: balancing exploitation of three fisheries 25
3.2 Trophic role of three key species and impact of Snapper
Diet of three key species The estimated trophic relationships of the three key species within the GSV ecosystem are presented
in Figure 3.8. These demonstrate a complex suite of trophic interactions that connect the species to all
trophic levels within the GSV ecosystem. These relationships are dependent on the dietary
information available for the key taxa and other groups. The quality of these data and their
provenance to GSV also vary markedly among trophic groups.
For Snapper, information on diet was obtained from 735 stomachs sampled across multiple seasons
within the GSV region (Lloyd 2010) (see Appendix 2 and 3). Snapper diet included 33 taxonomic
groups, but only five of these accounted for >5% of the diet by mass: Blue Crab (23.5%), other large
crabs/bugs (18.3%), Australian Herring (10.6%), sessile epifauna (9.6%) and herbivorous
macrobenthos (6.8%) (Appendix 2). Figure 3.8a depicts the trophic position of Snapper prey taxa
throughout the GSV food web. Snapper predate on a number of other commercially targeted taxa in
GSV. With the exception of Blue Crab, all other commercially targeted taxa are consumed at
relatively low levels: King George Whiting (2.9%), Australian Salmon (1.2%), Western King Prawns
(1.1%), Sardine (0.8%), Southern Calarmari (0.4%), Garfish (0.04%), Southern Rock Lobster
(0.03%), and Snapper (<0.01%) (Appendix 3).
The diet of the Blue Crab has not been studied in GSV or other parts of South Australia. The limited
information on the diet of the species comes from SW Western Australia where they are reported to
have a predatory/scavenging lifestyle, predating mainly on molluscs, crustaceans and polychaetes
(Edgar 1990). In Spencer Gulf, Blue Crabs have been reported as being one of the main scavengers on
discarded bycatch from prawn trawling (Svane 2003). Given the paucity of information, the diet of the
Blue Crab used in the GSV ecosystem model was based on the study by Edgar (1990), descriptions in
Bryars and Svane (2008) and that used in the Spencer Gulf ecosystem model (Gillanders et al. 2015).
Diet was estimated as follows: sand associated omnivorous crustaceans (10%), herbivorous
macrobenthos (5%), sand zoobenthos feeders (17%), small mobile deposit-detritovore feeding (DDF)
crustaceans (10%), DDF polychaetes (25%), macroalgae (8%), detritus (POM) (10%) and discards
(15%) (Appendix 3). However, during the Ecopath model balancing procedures, ecotrophic
efficiencies (EE) for discards were excessive in early model runs (EE=48.6). To balance the model,
all of the detritus fates (100%) for discards were returned to detritus (POM) and the 15% discard diet
was added to detritus (POM, total 25%) (see Appendix 3). The predicted trophic position of Blue
Crabs and their prey taxa throughout the GSV food web is presented in Figure 3.8b.
As with Blue Crabs, there is little known about the diet of Western King Prawns in GSV. King (1977)
considered them to be opportunistic scavengers and observed them feeding on algae and possibly
bacterial films on the surfaces of seagrass and shells. They are thought to also scavenge on small dead
animals, and take live annelids (Appendix 2). Diet was estimated as follows: DDF polychaetes (10%),
meiofauna (10%), benthic microflora (10%), macroalgae (50%), detritus (POM) (20%) (Appendix 2).
The predicted trophic position of Western King Prawns and their prey taxa throughout the GSV food
web is presented in Figure 3.8c.
Predation on three key species Ecopath outputs for the GSV Ecosystem model estimated the consumers of Snapper to be ‘other
squids’ (87%), Whaler Sharks (11%) and Common Dolphins (2%) (Figure 3.9a). Predation by White
and Smooth Hammerhead Shark, and from cannibalism, accounted for <1% of Snapper consumed
(Figure 3.9a). The major consumers of Blue Crabs were sand associated omnivore crustaceans (76%)
(presumably of juveniles), followed by Snapper (11%), Giant Australian Cuttlefish (5%) and Gummy
Shark (5%) (Figure 3.9b). Medium crustacean feeding fish (3%) and gulls (<1%) were relatively
minor consumers of Blue Crab (Figure 3.9b). For Western King Prawns, the principal consumers were
medium (31%) and small (16%) crustacean feeding fish taxa, medium piscivorous fish taxa (14%),
Gummy Shark (13%), Giant Australian Cuttlefish (11%), and other squids (8%) (Figure 3.9c). Other
demersal sharks (3%), Snapper (1%) and Port Jackson shark (1%) consumed a relative small

A trophic model for Gulf St Vincent: balancing exploitation of three fisheries 26
proportion of the total biomass consumed (Figure 3.9c). King George Whiting, Australian sea lion,
Little Penguin, Whaler Shark, Terns and Smooth Hammerhead all accounted for <1% of the estimated
total consumption of Western King Prawns in GSV (Figure 3.9c).
Sensitivity analysis The mixed trophic impacts routine in the network analysis tools within Ecopath was used to identify
important interactions that influence the available biomass of the six high value commercial taxa in
the GSV ecosystem (Figure 3.10). The Leontif matrix produced through this routine visually
represents the effects of increasing biomass of one functional group or fishing fleet on other groups or
fisheries, and provides a form of sensitivity analysis (Figure 3.10). The biomass of the six commercial
taxa examined influenced their respective fishing fleets positively, and most fishing fleets impacted
their fleets and target species negatively (Figure 3.10). In general, groups containing commercially
targeted species influenced their respective fishing fleets positively, and most groups affected
themselves negatively (Figure 3.10). Snapper negatively impacted King George Whiting and its main
fisheries (e.g. hand-line and haul-net) and to a lesser extent Blue Crab and its main fisheries (Figure
3.10). Blue Crab positively impacted Snapper biomass and its main fisheries and negatively impacted
King George Whiting and its main fisheries, and to a lesser extent Western King Prawn and the GSV
Prawn fishery (Figure 3.10). Western King Prawn had a positive impact on hand-line, long-line and
large-mesh fisheries, and a negative impact on Blue Crab and its fisheries (Figure 3.10). King George
Whiting had a minor positive impact on Snapper biomass and its fisheries, as well as other hand-line,
and small-mesh net fisheries (Figure 3.10). Garfish had a minor negative impact on King George
Whiting, its hand-line fishery and the Snapper long-line fishery, but positive impacts on whiting and
‘other’ haul-net fisheries (Figure 3.10). Southern Calarmari had a positive impact on Western King
Prawns and its fishery, the Australian herring, King George Whiting and ‘other’ haul-net fisheries for
which it also forms part of the landed catch (Figure 3.10). It had a negative impact on King George
Whiting and Garfish, on Australian salmon fisheries and handline fisheries for King George Whiting
and Snapper, long-line fisheries for Snapper and the Garfish dab-net fishery (Figure 3.10). All these
sensitivity analyses assume a steady-state system, and do not take into account the changing
abundances or diets of groups.
Impact of increasing biomass of Snapper on GSV ecosystem A better understanding of the sensitivity of taxonomic groups in the GSV ecosystem to increasing
Snapper biomass, can be gained from Ecosim scenarios that take into account changing time series
and group abundances. Results from scenarios that examined the potential impacts of increasing
Snapper biomass by 10%, 20% and 30% of 2013 levels (base model) are presented in Figure 3.11.
The majority of groups were relatively insensitive to changes in Snapper biomass. For example, under
a scenario with a 10% increase in Snapper biomass, the greatest decrease in biomass was -4.8% (King
George Whiting), and increase in biomass was +1.4% (small polychaete feeding fish). With a 10%
increase in Snapper biomass, the mean and median biomass declines were just -0.6% and -0.3%,
respectively for negatively impacted groups, and just +0.3% and +0.1% respectively, for positively
impacted groups (Figure 3.11). Under a scenario with a 30% increase in Snapper biomass, the greatest
decrease in biomass was -12.9% (King George Whiting), and increase in biomass was +3.9% (small
polychaete feeding fish) and the mean and median biomass declines were just -1.6% and -0.8%,
respectively for negatively impacted groups, and just +0.8% and +0.4% respectively, for positively
impacted groups (Figure 3.11). Other than King George Whiting, the main groups negatively
impacted by increasing Snapper biomass were giant cuttlefish, Australian herring, shags and
cormorants, bottlenose dolphin, Australian Sea Lions, Blue Swimmer Crab, Smooth Hammerhead,
octopus, and Rock Lobster, but all by <2% under a 10% increase in Snapper biomass scenario (Figure
3.12). Other than small polychaete feeding fish, groups that responded positively to increases in
Snapper biomass included medium crustacean eating fish, Sand Crabs, Sprats, Terns, Western King
Prawns and Little Penguins, but all by <1% under a 10% increase in Snapper biomass scenario
(Figure 3.11).
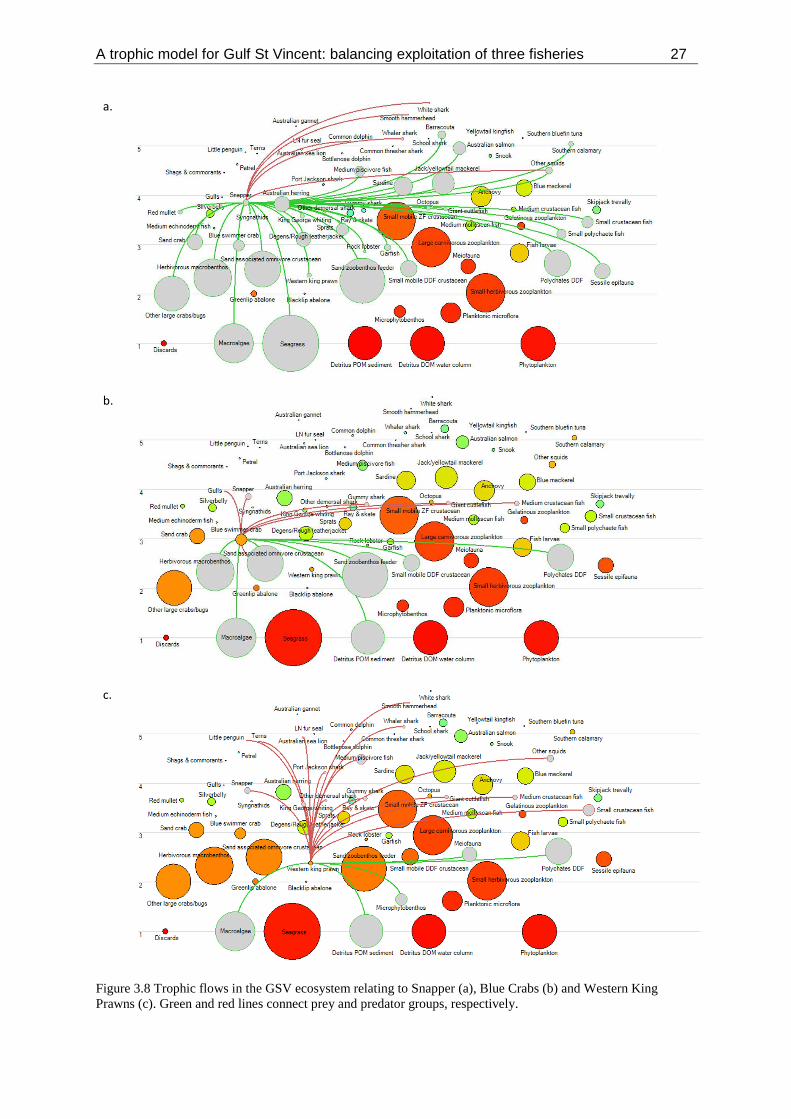
A trophic model for Gulf St Vincent: balancing exploitation of three fisheries 27
a.
b.
c.
Figure 3.8 Trophic flows in the GSV ecosystem relating to Snapper (a), Blue Crabs (b) and Western King
Prawns (c). Green and red lines connect prey and predator groups, respectively.

A trophic model for Gulf St Vincent: balancing exploitation of three fisheries 28
a.
b.
c.
Figure 3.9 Estimated breakdown of relative consumption (key predators) of Snapper (A), Blue Crabs (B) and
Western King Prawns (C) in the GSV ecosystem.

A trophic model for Gulf St Vincent: balancing exploitation of three fisheries 29
Figure 3.10 Leontif sensitivity matrix showing impacts of increasing abundance of groups on the y-axis on groups on the x-axis. Impacts are expressed as relative % changes,
not all impacts are discernible on this figure.

A trophic model for Gulf St Vincent: balancing exploitation of three fisheries 30
Figure 3.11 Estimated relative change in the biomass of functional groups following scenarios that examined the
potential impacts of increasing Snapper biomass by 10%, 20% and 30% of 2013 levels. Biomass change under
each scenario is plotted relative to base model (2013) output run over a 50-year period.

A trophic model for Gulf St Vincent: balancing exploitation of three fisheries 31
Figure 3.11 continued.

A trophic model for Gulf St Vincent: balancing exploitation of three fisheries 32
3.3 Optimisation of future ecological and economic performance
In this study, the specific context for optimisation of ecological and economic performance in the GSV
ecosystem is centred on the potential that increased Snapper biomass has directly impacted the
available biomass of prawns and Blue Crabs, and resulted in reduced catches in recent years in these
fisheries. A key aim of the study was to examine the flow-on ecosystem effects of changes in Snapper
biomass on Western King Prawns, Blue Crabs and other species; and if these interactions were
significant, what balanced exploitation scenarios would optimise production (and value) of Snapper,
prawns and Blue Crabs and minimise ecosystem impacts? The previous section identified the impacts
of increased biomass of Snapper on key fisheries and the ecosystem, here we examine the impacts of
reducing Snapper biomass on Blue Crab and prawn fisheries and other high value commercially fished
groups and the broader ecosystem, and the potential benefits from balanced exploitation of Snapper in
the GSV ecosystem.
Impact of reducing Snapper biomass on high value commercial fisheries and on the GSV ecosystem
Results from Ecosim scenarios that examined potential changes to the GSV ecosystem resulting from
reductions in Snapper biomass by 10%, 20% and 30% of 2013 levels (base model) are presented in
Figure 3.12. The majority of groups were relatively insensitive to changes in Snapper biomass. For
example, under a scenario with a 10% decrease in Snapper biomass, the greatest increase in biomass
was 5.4% (King George Whiting), and decrease in biomass was -1.4% (small polychaete feeding fish).
With a 10% decrease in Snapper biomass, the mean and median biomass changes were 0.6% and
0.3%, respectively for positively impacted groups, and -0.3% and -0.1%, respectively, for negatively
impacted groups (Figure 3.12). Under a scenario with a 30% decrease in Snapper biomass, the greatest
increase in biomass was 18.8% (King George Whiting), and decrease in biomass was -4.5% (small
polychaete feeding fish) and the mean and median biomass changes were just 2.0% and 1.0%,
respectively for positively impacted groups, and -0.9% and -0.4%, respectively, for negatively
impacted groups (Figure 3.12). Other than King George Whiting, the main groups that responded
positively to reduced Snapper biomass were Giant Australian Cuttlefish, Australian Herring, Shags
and Cormorants, Bottlenose Dolphin, Australian Sea Lions, Smooth Hammerhead, Blue Swimmer
Crab, Octopus, and Rock Lobster, but all by ≤2% under a 10% decrease in Snapper biomass scenario
(Figure 3.12). Other than small polychaete feeding fish, groups that responded negatively to decreases
in Snapper biomass included medium-sized crustacean eating fish, sand crabs, sprats, terns, Western
King Prawns and Little Penguins, but all by ≤1% under a 10% decrease in Snapper biomass scenario
(Figure 3.12).
The estimated impact of reducing Snapper biomass by 10%, 20% and 30% of 2013 levels on the
biomass of the other five high-value commercially fished groups in the GSV ecosystem is summarised
in Table 3.1. Although not strictly linear, these results indicate that for every 10% reduction in Snapper
biomass, there is about a 0.6% decline in prawn biomass, and 0.04% decline in Garfish biomass, a
0.3% increase in Calarmari biomass, a 1.2% increase in Blue Crab biomass and a 5.4% increase in
King George Whiting biomass (Table 3.1). These estimates assume no change in fleet fishing effort or
other environmental factors throughout the scenario period.

A trophic model for Gulf St Vincent: balancing exploitation of three fisheries 33
Table 3.1. The estimated impact of reducing Snapper biomass by 10%, 20% and 30% of 2013 levels on the
percentage biomass of the other five high value commercially fished species in the GSV Ecosystem.
Snapper -10% -20% -30%
Western King Prawn -0.6% -1.2% -1.8%
Garfish -0.04% -0.1% -0.2%
Calarmari 0.3% 0.5% 0.8%
Blue Swimmer Crab 1.2% 2.4% 3.7%
King George Whiting 5.4% 11.7% 18.8%
The potential impact of Snapper on other high-value, commercially-fished groups was also explored
by running the GSV ecosystem Ecosim model under different scenarios of Snapper biomass (while
maintaining all fleet fishing efforts at 2013 levels). By running scenarios from near zero to high
biomass levels (0.7 t km-2), the potential impact of different possible Snapper biomasses (potentially
brought about by targeted reductions in biomass) on other high-value commercial-fished groups (while
not forcing biomass change in any other group), was examined. Results are presented in Figure 3.13.
As detailed above, the results suggest that as the biomass of Snapper increases, the biomass of Blue
Crabs, King George Whiting, and Southern Calarmari decline, while the biomass of Western King
Prawns and Garfish increase (Figure 3.13). The relationship between Snapper biomass and other group
biomasses is close to linear for Garfish, Southern Calarmari and Western King Prawns, but is more
curvilinear for Blue Crab and King George Whiting.
Between 1994 and 2013, estimates of the fishable biomass of Snapper in GSV almost trebled (Fowler
et al. 2013). Results from Ecosim scenarios examining the direction and magnitude of biomass change
in the key fished species that would result if Snapper biomass was reduced from this peak by two-
thirds (from 0.3998 to 0.1333 t.km-2) to 1994 levels are presented in Table 3.2. The estimated change
in the biomass in groups (while not forcing biomass change in any other group and holding all fleet
fishing efforts constant), when Snapper biomass is reduced by 66.7% was a decline in prawn biomass
of 4.9%, an increase in Blue Crab biomass of 10.9%; a decrease in Garfish biomass of 0.6%; an
increase in King George Whiting biomass of 64.5%; and an increase in Calamari biomass of 2.4%
(Table 3.2). These modelled results are different to the observed and estimated biomasses from
fisheries data and the balanced Ecopath model of the key fished taxa in 1994, especially for King
George Whiting (-41.5% difference), Calarmari (-25.1% difference), prawns (24.1% difference) and
Garfish (-16.6% difference) (Table 3.2).
Table 3.2. Ecosim scenarios examining the direction and magnitude of biomass change in the key fished species
that would result if Snapper biomass was reduced from its peak in 2010 by two-thirds (from 0.3998 to 0.1333 t
km-2) to 1994 levels. Comparison of actual biomass at 1994 level in the Ecopath model are presented for
comparison and the magnitude of difference is presented as a percent (in parentheses).
Estimated biomass of groups at peak
Snapper biomass (~2010)
Modelled change in biomass if Snapper
reduced to 1994 levels
Actual biomass at 1994 levels (% difference
between modelled and actual biomass)
Snapper 0.3998 0.1333 (-66.7%) 0.1333 (0.0%)
Prawns 0.0821 0.0780 (-4.9%) 0.0968 (24.1%)
Blue Crab 0.4625 0.5130 (10.9%) 0.5298 (3.3%)
Garfish 0.1813 0.1802 (-0.6%) 0.1504 (-16.6%)
Kin George Whiting 0.0846 0.1391 (64.5%) 0.0813 (-41.5%)
Calarmari 0.1165 0.1194 (2.4%) 0.0893 (-25.1%)

A trophic model for Gulf St Vincent: balancing exploitation of three fisheries 34
Figure 3.12 Estimated relative change in the biomass of functional groups following scenarios that examined the
potential impacts of decreasing Snapper biomass by 10%, 20% and 30% of 2013 levels. Biomass change under
each scenario is plotted relative to base model (2013) output run over a 50-year period.

A trophic model for Gulf St Vincent: balancing exploitation of three fisheries 35
Figure 3.12 continued.

A trophic model for Gulf St Vincent: balancing exploitation of three fisheries 36
Figure 3.13 Estimated relative change in the biomass of high value commercially fished groups under different
scenarios of Snapper biomass (while maintaining all fleet fishing efforts at 2013 levels).
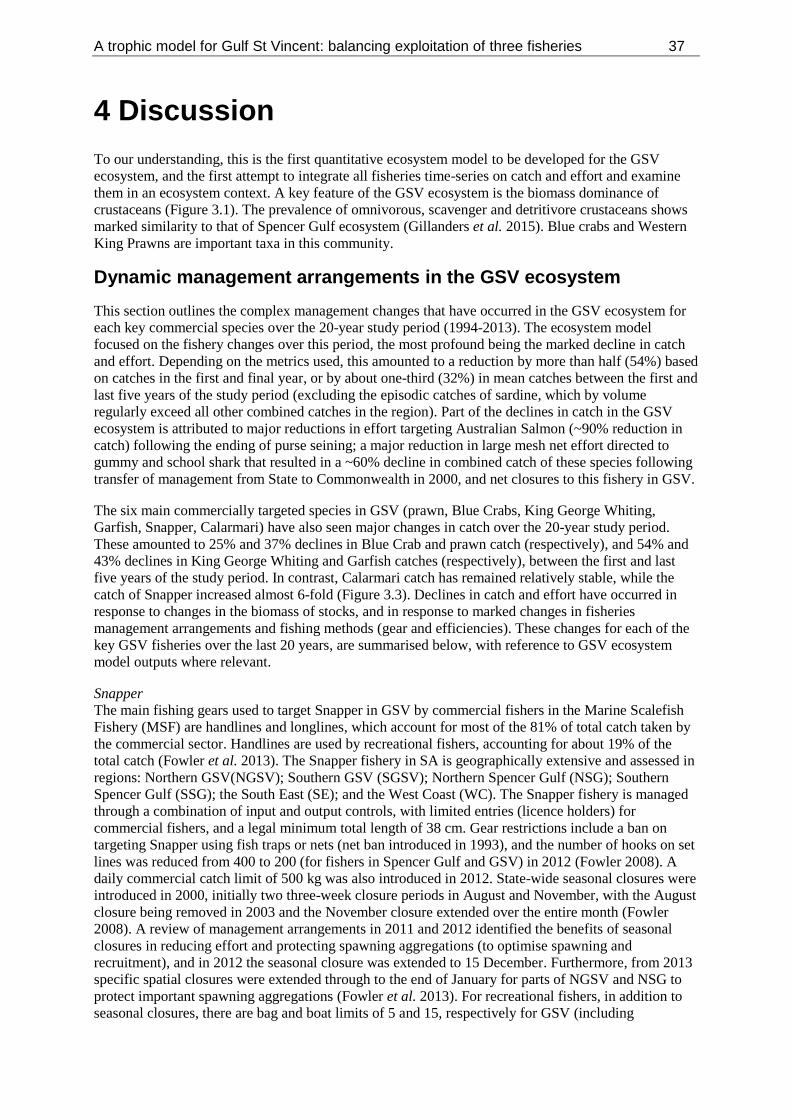
A trophic model for Gulf St Vincent: balancing exploitation of three fisheries 37
4 Discussion
To our understanding, this is the first quantitative ecosystem model to be developed for the GSV
ecosystem, and the first attempt to integrate all fisheries time-series on catch and effort and examine
them in an ecosystem context. A key feature of the GSV ecosystem is the biomass dominance of
crustaceans (Figure 3.1). The prevalence of omnivorous, scavenger and detritivore crustaceans shows
marked similarity to that of Spencer Gulf ecosystem (Gillanders et al. 2015). Blue crabs and Western
King Prawns are important taxa in this community.
Dynamic management arrangements in the GSV ecosystem
This section outlines the complex management changes that have occurred in the GSV ecosystem for
each key commercial species over the 20-year study period (1994-2013). The ecosystem model
focused on the fishery changes over this period, the most profound being the marked decline in catch
and effort. Depending on the metrics used, this amounted to a reduction by more than half (54%) based
on catches in the first and final year, or by about one-third (32%) in mean catches between the first and
last five years of the study period (excluding the episodic catches of sardine, which by volume
regularly exceed all other combined catches in the region). Part of the declines in catch in the GSV
ecosystem is attributed to major reductions in effort targeting Australian Salmon (~90% reduction in
catch) following the ending of purse seining; a major reduction in large mesh net effort directed to
gummy and school shark that resulted in a ~60% decline in combined catch of these species following
transfer of management from State to Commonwealth in 2000, and net closures to this fishery in GSV.
The six main commercially targeted species in GSV (prawn, Blue Crabs, King George Whiting,
Garfish, Snapper, Calarmari) have also seen major changes in catch over the 20-year study period.
These amounted to 25% and 37% declines in Blue Crab and prawn catch (respectively), and 54% and
43% declines in King George Whiting and Garfish catches (respectively), between the first and last
five years of the study period. In contrast, Calarmari catch has remained relatively stable, while the
catch of Snapper increased almost 6-fold (Figure 3.3). Declines in catch and effort have occurred in
response to changes in the biomass of stocks, and in response to marked changes in fisheries
management arrangements and fishing methods (gear and efficiencies). These changes for each of the
key GSV fisheries over the last 20 years, are summarised below, with reference to GSV ecosystem
model outputs where relevant.
Snapper
The main fishing gears used to target Snapper in GSV by commercial fishers in the Marine Scalefish
Fishery (MSF) are handlines and longlines, which account for most of the 81% of total catch taken by
the commercial sector. Handlines are used by recreational fishers, accounting for about 19% of the
total catch (Fowler et al. 2013). The Snapper fishery in SA is geographically extensive and assessed in
regions: Northern GSV(NGSV); Southern GSV (SGSV); Northern Spencer Gulf (NSG); Southern
Spencer Gulf (SSG); the South East (SE); and the West Coast (WC). The Snapper fishery is managed
through a combination of input and output controls, with limited entries (licence holders) for
commercial fishers, and a legal minimum total length of 38 cm. Gear restrictions include a ban on
targeting Snapper using fish traps or nets (net ban introduced in 1993), and the number of hooks on set
lines was reduced from 400 to 200 (for fishers in Spencer Gulf and GSV) in 2012 (Fowler 2008). A
daily commercial catch limit of 500 kg was also introduced in 2012. State-wide seasonal closures were
introduced in 2000, initially two three-week closure periods in August and November, with the August
closure being removed in 2003 and the November closure extended over the entire month (Fowler
2008). A review of management arrangements in 2011 and 2012 identified the benefits of seasonal
closures in reducing effort and protecting spawning aggregations (to optimise spawning and
recruitment), and in 2012 the seasonal closure was extended to 15 December. Furthermore, from 2013
specific spatial closures were extended through to the end of January for parts of NGSV and NSG to
protect important spawning aggregations (Fowler et al. 2013). For recreational fishers, in addition to
seasonal closures, there are bag and boat limits of 5 and 15, respectively for GSV (including
A trophic model for Gulf St Vincent: balancing exploitation of three fisheries 38
Investigator Strait and Backstairs Passage) and a size limit of 38-60 cm total length (Fowler et al.
2013).
Historically, the catch of Snapper from NGSV and SGSV has been low (~8% of South Australian
catch between 2000 to 2004), with most of the catch originating from both regions in Spencer Gulf
(Fowler 2008). Commercial catches of Snapper in GSV were relatively high in the late 1970s and early
1980s, peaking at 117 t in 1984/85, before declining to their lowest minimum of 23 t in 1995/96
(Fowler 2008). However, since 2006 there has been a marked increase in the catch of Snapper,
especially in NGSV, leading to commercial catches peaking in 2009 and 2010 (Fowler et al. 2013).
This increase was associated with a major shift in fishing effort away from the traditional areas of
Spencer Gulf, where catch rates declined significantly, to NGSV. It was also associated with a major
shift from handline to more efficient longline fishing methods, where targeted catches, effort and catch
rates all increased exponentially to record levels, seeing the NGSV contribution to South Australian
Snapper catches increase from 9% in 2007 to 65% in 2012 (Fowler et al. 2013). Assessment of the
Snapper fishery in 2013 identified that all fishery regions (with the exception of NGSV) demonstrated
declines in catch and catch rates consistent with decreases in fishable biomass, resulting in the NSG,
SSG, WC, SE and SGSV Snapper stocks all being assigned a status of ‘transitional depleting’. In
contrast, the NGSV stock was assigned a status of ‘sustainable’ based on it producing record catches
and catch rates that reflected high biomass and strong recruitment throughout the 1990s and 2000s
(Fowler et al. 2013). Assessment in 2016 has demonstrated no recovery for NSG, SSG, WC, SE, while
high catches have persisted in NGSV (Fowler 2016).
There has been uncertainty in whether the regional shift in Snapper catch, and specifically the
simultaneous decline in catches from Spencer Gulf as catch in GSV increased, was coincidental or
related (Fowler et al. 2013). In particular, if the declines in biomass of Snapper in Spencer Gulf were
related to poor recruitment or if there was some large-scale movement of Spencer Gulf fish into GSV.
A recent otolith study that examined age-related increment width and elemental concentrations
identified three primary nursery areas for South Australian Snapper: NSG, NGSV and Port Phillip Bay
in Victoria (Fowler 2016). Each of these populations was found to be self-sustaining but also to
provide the source fish that replenish regional populations. The study showed that recent declines in
Snapper biomass in Spencer Gulf were primarily due to persistent high exploitation rates as well as
poor recruitment throughout the 2000s; while the growth in biomass of the GSV population from the
late 2000s was due to local reproduction and recruitment, and not the movement of fish into the region
from other populations (Fowler 2016). The GSV ecosystem model fit to Snapper time series data
predicted a gradual increase in Snapper biomass in GSV throughout the 2000s and did not match the
low level of catch throughout the 2000s, with the marked increase in catch from 2008, instead
projecting a more gradual increase in catch (Figure 3.2). Part of the marked increase in catch and effort
for Snapper in GSV was related to the switch from handline to longline fishing that increased
efficiency and attracted more fishers to targeting Snapper and increased the targeted fishing effort,
much of which switched from Spencer Gulf (where catch rates had declined) to GSV (Fowler 2016).
GSV Prawn fishery
High exploitation of the spawning biomass of Western King Prawns in GSV in the 1970s and 1980s
resulted in reduced recruitment and stock depletion (Dixon et al. 2012, Kangas and Dixon 2008). A
range of management measures were introduced including major reductions in fishing effort; an
increase in the size of targeted prawns; restricting the area of the fishery to protect the spawning stock;
the introduction of a licence buy-back scheme followed by a total closure of the fishery between June
1991 and March 1994 following a parliamentary review (Kangas and Dixon 2008), and no pre-
Christmas fishing in the 1994/95 season (Dixon et al. 2012). The GSV ecosystem model time-series
commenced in the year the GSV Prawn fishery was reopened in 1994, and from then to 2000, prawn
catch and CPUE increased, suggesting that the closure period over four spawning seasons enabled the
stock biomass to increase (Dixon et al. 2006). However, increased catches and a harvest strategy based
solely on harvest size precipitated further stock declines between 2000 and 2004 (Kangas and Dixon
2008), resulting in a new management strategy being implemented for the fishery that included the
introduction of independent stock assessment and the current harvest strategy. The harvest strategy
A trophic model for Gulf St Vincent: balancing exploitation of three fisheries 39
aimed to control exploitation rates using spatial and temporal closures, restricting the fleet to targeting
limited areas with appropriately sized prawns, with the intent to protect a sufficient portion of the stock
to enable stock recovery (Dixon et al. 2012). These measures appeared to enable both catch and
biomass of prawns to increase until 2008/09, but following declines in the catch rates of adult prawns
and poor economic performance through to the 2011/12 season, the fishery was closed for two
consecutive fishing seasons (2012/13 to 2013/14) (Beckmann et al. 2015). Part of the most recent
declines in biomass and catch has been attributed to a shift in size structure in the population,
particularly an increase in the abundance of smaller prawns that made it difficult for fishers to locate
suitable areas with appropriate size prawns (Dixon et al. 2013a). This led industry to consider
approaches to improve the size selectivity of their trawl gear (Dixon et al. 2013a). As a consequence,
modified T90 cod-end mesh and BRDs were introduced into the GSV prawn fishery in March 2012
(Beckmann et al. 2015). Fishing trials demonstrated that these devices improved gear selectivity,
specifically the escapement of small pawns, enabling increased tow durations and trawl effort
efficiencies (Dixon et al. 2013a). The fishery was reopened in November 2014, and although
subsequent stock assessment surveys have noted an increase in adult biomass following the recent
closures, low catch rates of recruits suggest limited recruitment to the harvestable biomass. As such the
GSV Prawn fishery has recently been classified as ‘transitional-depleting’ (Beckmann et al. 2015).
The GSV ecosystem model provided a reasonable fit to the prawn biomass and catch time-series,
although clearly anticipated a gradual recovery in prawn biomass from the late 1990s through to 2013
(Fig 3.2, 3.3), which is not reflected in the CPUE data for the fishery (Beckmann et al. 2015).
GSV Blue Crab fishery
Historically, Blue Crabs were mainly taken as bycatch in the Marine Scalefish and Prawn fisheries,
although the provision to sell Blue Crabs caught in the Prawn fishery was revoked in 1986. The
modern fishery was established in 1996 comprising two fishing zones (Spencer Gulf and GSV), each
with a separate quota (TACC), and consisting of commercial ‘pot fisheries’ and MSF licence holders,
with most of the quota now allocated to pot fishers (Beckmann and Hooper 2015). Blue Crabs are
widely caught among fishing sectors including the recreational fishery, where recent catches are
estimated to represent about 30% of the total combined commercial and recreational catches
(Beckmann and Hooper 2015). There are some differences in the reported catch data presented in
stock assessment reports, which do not include discards, and those used in the GSV ecosystem model
that includes both landings and discards. Based on the later data, Blue Crab catch was reasonably
stable (~300 t year-1) throughout the late 1990s to the mid-2000s, but then declined from about 2006 to
the end of the time-series in 2013. CPUE of legal size and pre-recruit crabs in the GSV fishery
declined markedly between 2006 and 2012, and the stock was classified then as ‘transitional-
depleting’ (Dixon et al. 2013b). The management initiatives to promote stock recovery then included
50% voluntary reduction in catch in 2012/13 (through effort reduction), a quota reduction of 20% in
2013/14 and 2014/15, a six month voluntary closure in July 2013, and a halving of recreational bag
and boat limits in 2013/14 (Beckmann and Hooper 2016). The low 2012 and 2013 Blue Crab catches
for the GSV ecosystem (Figure 3.3), reflect these management measures. The GSV ecosystem model
provided a reasonable fit to the Blue Crab biomass (generally increasing) and catch (generally
declining) throughout the time-series, but anticipated generally lower catches of Blue Crab than those
observed from the early 2000s to 2013 (Figure 3.2).
Garfish
The commercial fishery for Garfish in GSV has undergone significant changes in operation and
management over the last 40 years that include: restructuring; gear limitations, configurations and
restrictions; licencing; spatial and temporal closures; and size limits. These changes, summarised by
Steer et al. (2016), include netting restrictions introduced in the 1970s (restricting fishers to net in
coastal waters <5 m deep), and netting closures introduced in 1983, 1994, 1995, 1997, 2005 and 2006
that have resulted in a continued contraction of the areas open to haul-netting in northern GSV.
Although occurring just outside the time series of this study, the introduction of marine parks in 2014
further restricted the area available to haul-netting in northern GSV. Other important management
measures include: an increase in the minimum total legal size of Garfish from 210 mm to 230 mm and
reductions in recreational bag limits in 2001; a voluntary net buy-back scheme in 2005 to reduce
A trophic model for Gulf St Vincent: balancing exploitation of three fisheries 40
fishing effort (reduced haul-netting licence holders by 54%); introduction of seasonal closures in 2012,
2013 and 2014 (increased from 20 to 38 to 40 days, respectively); increases to the minimum regulated
mesh size of haul-net pockets (to 32 mm in 2013, and 35 mm in 2015); and further increases to the
minimum legal size of Garfish in 2015 (250 mm) and 2016 (260 mm) (Steer et al. 2016).
Most of the Garfish catch is taken by commercial MSF licence holders (~90% haul-net, ~10% dab
net), with recreational catch increasing from 18% in 2000/01 to 23% in 2013/14 (Steer et al. 2016).
The GSV region contains two Garfish management zones (NGSV and SGSV). The NGSV zone is the
second most productive Garfish region in SA, accounting for about 35% of the State’s annual catch
(Steer et al. 2016). Between 1993 and 2013, catch in the SGSV zone steadily declined from ~70 t to
<10 t per year due to a steady decline in haul and dab net fishing effort (Steer et al. 2016). In the
NGSV zone, annual catches have exceeded 200 t twice in the last 20 years (2000 and 2005). Annual
catch declined to 97 t in 2007 with a concomitant 22% decline in haul-net effort and a 35% reduction
in CPUE. Catch and effort declined further to their lowest values in 2012 (82 t in NGSV), when winter
fishing closures were first implemented. Estimates of fishable biomass and recruitment in NGSV have
both trended downward since 2000, reaching their lowest recorded levels in 30 years in 2014 (Steer et
al. 2016). On this basis, a recent assessment classified the NGSV Garfish stock as ‘overfished’ (Steer
et al. 2016). In contrast, the SGSV Garfish stock, which accounts for a negligible component of the
GSV Garfish fishery, was classed as ‘sustainable’(Steer et al. 2016). The GSV ecosystem model
provided a good fit to Garfish catch throughout the time-series, but contrary to observed declining
trends in biomass, anticipated increasing biomass over the time-series (Figure 3.2). The estimated
fishable biomass of Garfish is based on that available in the areas open to the fishery, which has
contracted over time, and as such may not reflect the biomass of the entire stock.
King George Whiting
Commercial targeting of King George Whiting (KGW) is principally undertaken with three gear types:
handlines, haul nets and gillnets. Recreational fishers principally use hook and line gear from boats.
The principal areas of the fishery are the West Coast bays, Northern Spencer Gulf and GSV. The
KGW fishery in GSV is a ‘gauntlet’ fishery, with juvenile fish (~3 years of age) being targeted when
they move from shallow, protected nursery areas to adjacent deeper waters of GSV (Fowler and Jones
2008). The predominant take in NGSV is therefore of juvenile fish that are close to the minimum legal
size, while fish in the southern spawning grounds tend to be larger and older. Changes in the
management and performance of the fishery have been detailed by Fowler et al. (2014). In 1994,
reductions in daily recreational bag (30 to 20 fish per person) and boat limits (90 to 60 fish per boat)
were introduced, and the minimum legal size of fish was increased from 28 to 30 cm total length in
1995. Concern about the status of the fishery in 2003 resulted in significant management changes
introduced in 2004 that included: an increase in the minimum legal length (30 to 31 cm); a reduction in
the daily recreational bag and boat limit (from 20 to 12 legal-sized fish per person; boat limit reduced
from 60 to 36 fish); enhancement of the existing licence amalgamation scheme; and possession limits
for non-licence holders. The MSF net-buy back scheme in 2005 (as above for Garfish), resulted in
significant (~45%) reduction in haul net and gillnet fishing effort. Commercial catch of KGW in GSV
declined steadily over the study period from ~145 t in 1994 to 45 t in 2013. Handlines and haul nets
account for most of the catch in NGSV, gillnets now account for a small portion of the total catch, and
most of the catch off Kangaroo Island in Investigator Strait is with handlines. As commercial catch has
declined, the relative contribution of the recreational catch has increased and now accounts for more
than 60% of the total catch in GSV (Fowler et al. 2014). Recent assessment of the fishery has noted
persistent declining catch and catch rates over the last 20 years, with the shift in effort away from
KGW suggesting a decline in fishable biomass. Effort creep (vessel speed and navigational equipment)
may mean that declines in fishable biomass over the last decade have been greater than suggested by
reductions in CPUE. Furthermore, recreational catches have only been estimated for three seasons
(2000/01, 2007/08, 2013/14) and if the recreational catches have increased since 2007/08, then the
decline in fishable biomass would be greater than estimated. Based on declining trends in commercial
catch, effort, CPUE and estimated fishable biomass to 2013, the GSV stock was classified as
‘transitional-depleting’ (Fowler et al. 2014). The GSV ecosystem model provided a good fit to the
KGW biomass and marked decline in catch throughout the time-series, (Figure 3.2).

A trophic model for Gulf St Vincent: balancing exploitation of three fisheries 41
Calarmari
In GSV, southern Calarmari are landed by commercial MSF fishers (~62% of catch), by recreational
fishers (~30%) and incidentally in the GSV prawn fishery (~8% of catch) (Steer et al. 2007).
Commercial catches in GSV fluctuate from year to year, from a low in 2001 (133 t) to a high in 2004
(258 t) (Triantafillos 2008). Calarmari are targeted with haul nets and jigs, with hauling net catch
focused in NGSV and jigging in SGSV (Triantafillos 2008). In the early 1990s, catch was evenly
distributed between these two sectors, but with the decrease in haul net effort the jig sector catch has
grown. In 1995, recreational bag and boat limits were introduced (15 per bag and 45 per boat day). The
same spatial and temporal closures detailed above for net fishers in GSV, and gear restrictions (mesh
size) apply, as well as the generic licence amalgamations and voluntary buyback schemes, but are not
specific to Calarmari (Steer et al. 2007). For south and central GSV which accounts for the largest
Calarmari catch in SA (28% in 2006), CPUE for the jig sector has shown a general increase between
1993 to 2006 (Steer et al. 2007). The last assessment of the fishery within GSV was undertaken in
2007 (Steer et al. 2007). The stock status of the GSV fishery has not undergone a formal assessment
since then. The GSV Ecosystem model provided a reasonable fit to the time series data for Calarmari
biomass, with the fit to catch data better since the mid-2000s (Figure 3.2).
Trophodynamic indicators of fisheries status and impact
Trophodynamic indicators are broadly used in marine ecology and can be useful in identifying the
expansion or contraction of fisheries, and quantifying the effects of fishing on the trophic structure and
functioning of marine ecosystems (Tsikliras et al. 2015). Two key indicators used extensively are the
mean trophic level of the catch (or marine trophic index, MTI) and the Fishing In Balance (FIB) index,
which have proven robust in tracking fishing effects (see MTI and FIB trends for all maritime
countries and Large Marine Ecosystems of the world at www.seaaroundus.org), and in assessing
ecosystem changes (Kleisner and Pauly 2011, Tsikliras et al. 2015). Typically the two measures are
assessed together, with the interpretation of one facilitating the other (Kleisner and Pauly 2011).
In the 20-year study of the GSV ecosystem, the mean trophic level of the catch averaged ~3.6 and
remained relatively stable, but could be broadly divided into three periods: 1994 to 2001 (increasing
slightly to ~3.8); 2003 to 2007 (decreasing slightly to ~3.4) and 2007 to 2013 (increasing to 3.8). The
increase in mean trophic level of the catch between 2007 and 2013 occurred as a consequence of the
marked increase in catches of Snapper and concomitant declines in the catches at lower trophic levels
(Blue Crab, Prawns and Garfish), and steady catches of Calamari (TL>5).
As a consequence of the marked reduction in fishing effort and landed and discarded catches between
1993 and 2014, the biomass of most trophic groups in the model was estimated to have increased over
the study period. However, this does not imply that over the study period, these groups were not
subject to the effects of fishing, or other ecosystem changes, and the FIB index can provide some
insight into potential ecological change and impacts of fishing on the GSV ecosystem. In absolute
terms, the FIB index for the 20-year study period in GSV has remained stable, noting that the scale of
change in FIB index reported for other fisheries-impacted ecosystems globally are generally in the
order of 0.1 to 1.0 or more over time (Large Marine Ecosystems of the world at www.seaaroundus.org,
Kleisner and Pauly 2011, Tsikliras et al. 2015). In contrast, the range of FIB index values for the 20-
year study period in GSV was two to three orders of magnitude lower. The FIB index is set to 0 for the
first year of the time-series and will remain stable when the trophic level of the catch and catches
change in opposite directions (i.e. where trophic level changes are matched by ‘ecologically
equivalent’ changes in catch, Kleisner and Pauly 2011, Tsikliras et al. 2015). For example, with
transfer efficiencies of ~10% between trophic levels there should be a ten-fold increase in catches
when fishing shifts one trophic level down (Christensen 2000). If this occurs, then the FIB index
should remain constant, and fishing is assessed to be ‘in balance’ (Christensen 2000). The FIB index
will increase when catches increase more than expected when fisheries move to a lower trophic level,
and when the geographic area expands beyond its traditional fishing area or ecosystem (Coll et al.

A trophic model for Gulf St Vincent: balancing exploitation of three fisheries 42
2009, Pauly and Palomares 2005). In contrast, the FIB index will decline when catches fail to increase
as much as anticipated when a fishery moves to a lower trophic level, if the geographic area of the
fishery contracts, or if the underlying food web is collapsing through the excessive removal of biomass
(Kleisner and Pauly 2011, Pauly et al. 2000).
The relative stability of the ecosystem indictors (FIB index and mean trophic level of catch) for GSV
is challenging to reconcile against the marked changes in fisheries catch and effort and management
dynamics over the last two decades. The GSV Prawn, Blue Crab and KGW fisheries were all classified
as transitionally depleting between 2012 and 2014, with the main GSV Garfish stock classified as
overfished, indicating the deteriorating performance of the main fisheries in GSV towards the latter
stage of the study period. The considerable management adjustments in these fisheries over the last
decade, which have resulted in a contraction in their spatial extent and reductions in fishing effort and
catch, could be expected to have resulted in a marked decline in the FIB index. In contrast, an increase
in the FIB index may have been expected following the marked increase in Snapper catches between
2007 and 2013, a concomitant increase in mean trophic level of the catch, and with the periodic
marked increases in overall catches in GSV due to sardine in the second decade of the time-series.
Despite these marked changes the FIB index and mean trophic level of the catch have remained
relatively stable. How do we reconcile these observations?
As indicated above, the FIB index will remain stable when the trophic level of the catch and catches
change in opposite directions, or are stable. For fishing to have remained in balance with stable trophic
level of the catch while catches have declined, suggests that the productive capacity of the GSV
ecosystem and/or its resilience to fisheries exploitation has diminished over the 20-year study period.
Loss of productivity could have occurred as a consequence of environmental or ecological change (e.g.
reduced primary productivity, seagrass loss) or other factors that may have impacted production of the
ecosystem (e.g. pollution). Loss of production may also reflect additional loss of biomass (catch) to the
GSV ecosystem that has not been adequately estimated by the model. This could include an under-
estimation of discarding (not reported as catch), or recreational fishing catches. The available data for
discards and recreational catches are both poor for the GSV ecosystem. As no time-series of
recreational fishing catch and effort are available, the model undoubtedly under-estimated the
increasing level of recreational fishing catch in GSV, as indicated by recent recreational fishing
surveys (Giri and Hall 2015). Any loss of production to the ecosystem over time, either through
environmental change, underestimated catches (discards or recreational fishing), or other impacting
factors or processes, will potentially contribute to the situation where catches fail to remain stable
when fishing is in balance and occurring at the same trophic level.
In summary, the broad picture of the GSV ecosystem over the 20-year period of the study is of
persistent declines in total catch (by about one-third), reduced performance (declines in catches and
fishable biomass) in four of the six key fisheries over the last decade and the classification of their
main GSV stocks as either transitional-depleting (Prawn, Blue Crab, KGW) or overfished (Garfish),
and significant fisheries management intervention. The overall performance of the key commercial
fisheries in GSV, despite contractions in effort and catch, is at odds with the key ecosystem indicators
of a general increase in the biomass of most non-targeted trophic groups, and stable FIB index and
mean trophic level of the catch. These inconsistencies in fishery performance and ecosystem indicators
suggest that the ecosystem is not performing as well as expected, and is less resilient to change
because there has been a net loss in production or productivity over time. This net loss of production
may be real (environmental change and/or degradation), an artefact of underestimated catches
(discards/recreational fishing), and/or data limitations and assumptions of the modelling approach.
A trophic model for Gulf St Vincent: balancing exploitation of three fisheries 43
Ecosystem implications of greater gear selectivity in the GSV prawn fishery
A major advance in increasing the selectivity of fishing methods in the GSV Prawn fishery was the
introduction of rigid-grid BRDs and T90-mesh cod-ends in 2012. Experimental trials identified that
the use of BRDs with T90 nets substantially reduced sponge, elasmobranch and fish bycatch,
improving fishing efficiency, and excluded juvenile prawns, small fish and crustaceans from the catch
(Dixon et al. 2013a). Other benefits included improved catch quality (fewer damaged prawns),
trawling efficiency (due to longer trawl shot duration) and fuel efficiency (total fuel consumption per
hour of trawling). The expectation was that the reduced bycatch would also lead to good
environmental outcomes. We used the GSV ecosystem model to examine the likely ecological changes
to the GSV ecosystem from reduced bycatch levels in the prawn fishery.
Using the levels of bycatch reduction reported for sponges, elasmobranchs and fish when using the
BRD/T90 net (Dixon et al. 2013a), we compared the ecosystem response by comparing the estimated
biomasses of groups under pre- and post-BRD/T90 fishing scenarios, run over a 50-year period (2014
to 2063). Results indicated a ~43% reduction in discards under post-BRD/T90 fishing scenarios, as
well as an increase in the biomass of demersal chondrichthyians, particularly Port Jackson sharks
(~22%), rays and skates (~10%) and other demersal sharks (~6%). All other group biomass changes
estimated under a post-BRD/T90 fishing scenario were relatively minor, and there were no projected
negative impacts on any of the key fished species. These results therefore, support the expectation that
the introduction of more selective fishing methods in the GSV Prawn fishery were likely to have
positive ecological benefits, and importantly here we also identify that they were unlikely to have
negative impacts on the biomasses of key commercial taxa. As we did not develop any multi-stanza
models, which incorporate both juvenile and adult age-classes for key species, we were not able to
examine the ecological change and stock biomass implications of greater escapement of undersized
prawns that result from improved gear selectivity, but this could be examined with further
development of the GSV ecosystem model.
Trophic relationships – role of Snapper in GSV ecosystem
The importance of Snapper as a predator in the GSV ecosystem, and its potential impacts on key
crustacean fisheries were the central questions for this study. An understanding of the diet of Snapper
and the importance of its predation and competitive interactions on other taxonomic groups in the
ecosystem were fundamental to addressing these questions, which we examined by developing the
GSV ecosystem model. Underpinning much of this assessment are data from Lloyd (2010), who
undertook a comprehensive analysis of diet by examining the stomach contents of 1,068 Snapper
collected between 2008 and 2010 in Spencer Gulf and GSV. Of these 735 stomach samples were
obtained within the GSV ecosystem domain, across all seasons in both SGSV and NGSV. Data from
these samples were used and integrated into the ecosystem model. Lloyd (2010) found significant
differences in the diet of Snapper by region, season and fish size. He found that Blue Crabs were the
dominant prey in NGSV, followed by mussel Modilus areolatus, and Red Swimmer Crabs
(Nectocarcinus integrifrons). Other important prey included Snapping Prawn (Alpheus villosus),
Mantis Shrimp (Erugosquilla graham), Facetted Crabs (Actea calculosa), Sea Slugs (Philine angasi),
Western King Prawns, Blood Worms (Glycera americana) and Razor Clams (Pinna bicolor). Blue
Swimmer Crabs were absent from the diet of Snapper in SGSV, and crustaceans of much less
importance than in NGSV with the top three species being Doughboy Scallops (Mimachlamys
asperrrima), File Clam (Limatula strangei) and Thorny Sea Urchins (Goniocidaris tubaria). Other
important prey species included Goose Barnacles (Ibla quadrivalvis), Wrinkled Swimcrabs
(Liocarcinus corrugatus), Facetted Crab (Actea calculosa), Spider Crabs (Schizophrys rufescens) and
Common Hermit Crabs (Paguristes frontalis). Seasonal differences were also marked. In NGSV, the
consumption of Blue Crab and Western King Prawn was highly seasonal and largely restricted to the
warmer months of summer and autumn, the mussel Modilus areolatus featured most in spring and
summer, and Red Swimmer Crabs in winter and spring. In SGSV, doughboy scallops peaked in spring

A trophic model for Gulf St Vincent: balancing exploitation of three fisheries 44
and the File Clam peaked in autumn while thorny sea urchins were present in similar amounts
throughout the year. In NGSV, medium and large sized Snapper consumed more Blue Crab and
mussel Modiolus areolatus, and large Snapper consumed more red swimmer crab and mantis shrimp,
while small Snapper consumed more Western King Prawns and Blood Worms. In contrast, no
significant ontogenetic difference in diet was detected for Snapper of different size in SGSV (Lloyd
2010).
Integration of the diet of Snapper from the study of Lloyd (2010), along with dietary information on
Blue Crab, Western King Prawn and other taxonomic groups into a trophic model of the GSV
ecosystem, enabled the impact of predation by Snapper on key fished species to be examined. Within
this context, the diet of Snapper was extremely broad, including taxa across four trophic levels. The
trophic model also enabled the relative importance of Snapper predation on key taxa, relative to other
predators of these groups to be determined. Results from analysis of the GSV ecosystem model
estimates that Snapper accounted for 11% of Blue Crab predation, and about 1% of king prawn
predation. Other crustaceans were the major consumer of Blue Crab (~76% by sand associated
omnivorous crustaceans), while medium (31%) and small (16%) crustacean feeding fish taxa, medium
piscivorous fish taxa (14%), gummy shark (13%), giant cuttlefish (11%), and other squids (8%) were
the major consumer of Western King Prawns.
Across the taxonomic groups in the GSV ecosystem, most were relatively insensitive to changes in
Snapper biomass. A 10% increase or decrease in Snapper biomass resulted in negligible changes
(usually a fraction of 1%) in the biomasses of impacted groups. Ecosim modelling indicated that as
Snapper biomass increased, Blue Crab biomass decreased, but these declines were relatively small (i.e.
<2% decline in Blue Crab biomass for every 10% increase in Snapper biomass). Contrary to
expectation, increases in Snapper biomass resulted in an increase in Prawn biomass, although the gain
was relatively minor (i.e. <1% increase for every 10% increase in Snapper biomass). Although
Snapper predate on Prawns, this predation impact was less than the predation and/or competitive
impacts that Snapper apply to other Prawn consumers, particularly small crustacean feeding fish, Giant
Cuttlefish and other squids that collectively are estimated to consume 35% of King Prawn biomass.
Snapper may therefore play an ecological role in the regulation of mesopredator populations.
Mesopredators are medium-sized, middle-trophic level predators that both predate and are predated
upon. Many of the species that predate on crustacean populations in GSV, including crustacean
feeding fish, cuttlefish and other squids, could be described as mesopredators. Snapper may form part
of the guild of apex predators within the GSV ecosystem that are important in regulating mesopredator
populations. The ‘mesopredator release’ hypothesis is an important ecological theory that describes the
population dynamics that occur as a consequence of the trophic interactions between apex predators
and mesopredators, where major declines in the former may lead to eruptions (‘mesopredator release’)
of the latter (Baum and Worm 2009, Ritchie and Johnson 2009). There are many examples of such
patterns in marine ecosystems where reductions in apex predators such as marine mammals, sharks
and piscivorous fish have led to increases in mesopredator populations (Baum and Worm 2009).
Although Snapper also predate on Garfish, the Ecosim models indicated that Snapper have a minor
positive impact on Garfish biomass, potentially through similar mesopredator control, here through
preferential predation on Australian Salmon, Calarmari and Giant Australian Cuttlefish.
The most notable negative impact of increasing Snapper biomass identified through the Ecosim
models, was the interaction with KGW. Even though KGW formed a relatively small component of
Snapper diet in the GSV ecosystem model (2.9%), the Ecosim analysis identified that for every 10%
increase in Snapper biomass, the biomass of KGW declined by 4.8%.
In summary, ecological modelling has shown that the impact of Snapper on Blue Crab and prawn
biomass in the GSV ecosystem is relatively minor and that increasing biomass of Snapper is unlikely
to have been significant in explaining decreases in the biomass of Blue Crabs and prawns. Although
declines in Blue Crab and prawn catch rates have occurred over the same period as Snapper biomass
has increased, ecological modelling suggest these declines have principally arisen due to other factors.

A trophic model for Gulf St Vincent: balancing exploitation of three fisheries 45
Could a directed fishery for Snapper be used to optimise ecological and economic performance of Blue Crab and prawn fisheries?
Ecosystem based fishery management strives to maintain healthy marine ecosystems and the fisheries
they support by mitigating many of the unintended consequences of fishing, including habitat
destruction, bycatch of non-target species and impacts to ecosystem structure and function (Pikitch et
al. 2004). It has been recognised that to achieve EBFM, there is a need to address both fishing
intensity and selectivity, the latter through one or more of 6-S selection strategies of: species, stock,
size, sex, season and space. It has been argued that the focus on the 6-S selection may lead to
unintended consequences that ultimately increase, and not decrease ecosystem-level effects of fishing,
and reduce the productive capacity of ecosystems to sustain fishery catches (Zhou et al. 2010). Less
selective fishing, where stocks are harvested relative to their productivity while maintaining species,
stocks, sexes and sizes above certain thresholds, has been suggested as a better approach to achieve
EBFM. This concept of ‘balanced exploitation’ encompasses reduced fishing effort with less selective
fishing and better utilisation of catch to maximise sustainable yields and minimise ecological impacts
(Zhou et al. 2010). A key aim of this study was to examine if a balanced exploitation approach in
GSV, productivity dependent exploitation of Snapper biomass through a directed fishery, could deliver
benefits to other fisheries, in particular whether this approach could enhance the sustainable yield of
Blue Crab and prawn fisheries, and what balanced exploitation scenarios would optimise production
and value across fisheries, while minimising ecosystem impacts.
This study has shown that although Snapper predate on Blue Crab and King Pawn, the trophic linkages
between these groups are not particularly strong (e.g. slight negative effect on Blue Crabs, slight
positive effect on King Prawns), and the benefits to Blue Crab and Prawn biomass (and catch rates)
from a directed Snapper fishery to reduce its biomass are unlikely to bring about significant benefits to
fisheries targeting these species. Ecosim scenarios where Snapper biomass was reduced by two-thirds
from its peak biomass in 2010 to 1994 levels (while not forcing biomass change in any other group
and maintaining constant fishing effort across all fleets), resulted in a decline in prawn biomass of
~5%, and an increase in Blue Crab biomass of ~11%. These model results suggest that the declining
catches of prawns and Blue Crabs that occurred concurrent with a marked increase in Snapper
biomass, were likely to have been caused by factors other than changes in the biomass of Snapper.
The study focused on the potential of top-down (predation) control by Snapper on Prawn and Blue
Crab biomass. It was unable to examine the range of other, bottom-up factors that could have
contributed changes in Prawn and Blue Crab biomass in the GSV ecosystem. There is almost no data
on the diet of Prawns and Blue Crabs in SA’s Gulfs, and our understanding of the trophic interactions
between the significant crustacean communities in these ecosystems and the key environmental factors
that drive recruitment and regulate their populations is poor. Addressing such critical gaps in
knowledge should be prioritised in future studies, because such data deficiencies and model
assumptions limit the range of scenarios that can be examined and could impact model results.

A trophic model for Gulf St Vincent: balancing exploitation of three fisheries 46
5 Conclusion
This project has developed the first whole of ecosystem model for GSV that describes the key
components of the ecosystem, providing an integrated assessment of the status, performance and
impact of its key fisheries between 1993 and 2014.
This integrated assessment identified temporal changes in the GSV ecosystem. In terms of fisheries
impacts, major change occurred as a consequence of declines in fisheries catch and effort, which in
general has resulted in an increase in biomass of most trophic groups over the 20-year period.
Analyses of key ecosystem indicators identified a relatively stable mean trophic level of the catch and
a stable Fishing in Balance (FIB) index, against a backdrop of declining fisheries catches. At the end
of the study time-series, four of the five main fisheries that had undergone recent stock assessments in
the region were classified as either transitional-depleting or overfished, with only Snapper classed as
sustainable.
The poor performance of key commercial fisheries, despite marked contractions in effort and catch, is
at odds with the key ecosystem indicators of a general increase in the biomass of most taxonomic
groups, and stable FIB index and mean trophic level of the catch. These inconsistencies suggest that
the ecosystem is not performing as well as expected, and that there may have been a net loss in
production or productivity over time. Some of this could be explained by an underestimation of fishing
catch (commercial discards and/or recreational catch), through natural and/or anthropogenic
environmental change (e.g. climate change, pollution, habitat loss) or model limitations.
Scenarios comparing the ecosystem response pre- and post-introduction of BRD/T90 fishing gear in
the GSV Prawn fishery, supported the expectations that the introduction of more selective fishing
methods would bring about positive ecological benefits, such as increases in the biomass of demersal
sharks and rays, with no negative impacts on other commercially targeted species (namely Western
King Prawns and Blue Crabs).
The ecological role of Snapper and its impact on crustacean and other fisheries was assessed. Snapper
are an important predator in the GSV ecosystem, consuming a diverse range of prey across four
trophic levels, with much of their predation directed to crustaceans and molluscs. Blue Crabs were
important in Snapper diet (~24%), especially in northern GSV, but other commercially targeted
species were consumed at low levels (King George Whiting 2.9%, Western King Prawns 1.1%,
Calarmari 0.4%, Garfish 0.04%). Ecosystem model results estimated that Snapper accounted for ~11%
of the total consumption of Blue Crabs, and ~1% of Western King Prawns, with most of the
consumption of Blue Crabs and prawns being accounted for by omnivorous crustaceans and a range of
crustacean and piscivorous feeding fish, respectively.
Sensitivity and scenario analysis of ecosystem responses to changes in Snapper biomass, suggests that
most taxonomic groups are relatively insensitive to changes in Snapper biomass (<1% change in
biomass for each 10% change in Snapper biomass). Increasing Snapper biomass had a negative effect
on Blue Crab biomass (<2% decline for each 10% increase in Snapper biomass), and a slight positive
effect on Western King Prawn biomass (~1% increase for each 10% increase in Snapper biomass).
Snapper may form an important predator of mesopredators in the GSV ecosystem, providing a positive
benefit to Prawns and Garfish through predation and competitive interactions with their key predators
(Australian salmon, Calarmari and Giant Australian Cuttlefish). Results from the ecosystem model
indicate that the increase in Snapper biomass in GSV is unlikely to have contributed significantly to
the observed reduction in biomass of Blue Crab and Prawn.
Scenarios examining the potential ecological and economic benefits (increased biomasses of
commercially targeted taxa) that may result from a reduction in Snapper biomass achieved through a
directed Snapper fishery, identified that such an approach was unlikely to deliver significant benefits

A trophic model for Gulf St Vincent: balancing exploitation of three fisheries 47
across fisheries. In particular, the benefits to Blue Crabs (slight positive effect) and Prawns (slight
negative effect) were small or non-existent.
6 Implications
The key outputs of the project included:
the development of the first whole of ecosystem model for GSV that describes the key
components of the ecosystem and provides important ecological context for its multi-species
fisheries;
an integrated assessment of the status and impact of the key fisheries in GSV over a 20-year
period, and an ecosystem-based assessment of their performance;
an assessment of the ecological implications of the introduction of more selective fishing gear
in the GSV Prawn fishery;
an assessment of the role of Snapper predation in changing production of Prawn and Blue
Crab fisheries; and
an assessment of the potential ecological and economic benefits that may result from a
reduction in Snapper biomass achieved through a directed Snapper fishery.
The model results were able to determine that the increase in GSV Snapper biomass in the late 2000s
was unlikely to have contributed significantly to the observed biomass reductions in Blue Crab and
Western King Prawn.
An important outcome of the study was an ecosystem based assessment of the performance of the key
GSV fisheries over a 20-year period. In the framework of the existing model, the ecosystem
performance measures were difficult to interpret, but suggested that the declining performance of
many of the key fisheries in GSV in recent decades has been due in part to a decline and/or loss of
production to the ecosystem over time. The important implication of this finding is the need to identify
the source(s) and cause(s) for the potential decline in productivity, and whether or not these could be
managed and mitigated. Potential sources (and causes) include environmental (e.g. temperature,
salinity and nutrients changes) and anthropogenic factors (e.g. pollution, seagrass/habitat loss) that
have resulted in a loss of primary productivity (e.g. reduced phytoplankton, macroalgae and/or
seagrass production). The loss of production to the ecosystem may also be an artefact of model
limitations, including underestimated catches. This possibility cannot be ruled out, as although the
fishery data and time-series for landed catch in commercial fisheries in GSV are relatively good, those
for discarded catch across most fisheries, and for landed and discarded catch in recreational fisheries
are poor, and may well have been underestimated in the model. All of these factors could impact on
the ecological sustainability of the GSV ecosystem and its fisheries, and could be assessed through
additional model development (see Section 8).
This study is a first step towards a tool to assist with ecosystem based management of GSV and its
fisheries. Further development of the model including a spatially explicit ecosystem model and
consideration of other (non-fishery) sectors would be beneficial.

A trophic model for Gulf St Vincent: balancing exploitation of three fisheries 48
7 Recommendations
This project has developed the first whole of ecosystem model for GSV that describes the key
components of the ecosystem, and the first ecosystem based assessment of the status, performance and
impact of its key fisheries over a 20-year period. The Ecopath with Ecosim model developed has
incorporated as much data available on the key taxa and trophic structure of groups within the GSV
ecosystem, or where absent from similar systems (including Spencer Gulf) to inform key parameters
including diet, biomass and production. However, given that much of the data used in the model does
not have high provenance to the GSV ecosystem, and/or there is a general lack of data and knowledge
about some of the key parameters for taxonomic groups in general, there is some level of uncertainty
about whether the model outputs adequately reflect the real processes and trophodynamic relationships
in GSV. For example, in this study we were fortunate to have comprehensive data on the diet of
Snapper in the GSV ecosystem from the study of Lloyd (2010); however, for other key predators of
prawns, Blue Crab and other fished species in GSV, the information is either poor or absent and has
had to be inferred from other studies in other ecosystems. Furthermore, information on the diet of
many of the key fished species, and food webs that underpin their populations in GSV, is extremely
limited. The absence of good quantitative data with high provenance to GSV for key species and
interactions ultimately means that results from the model need to be interpreted with caution and
cognisant of the limitations of some of the data that inform it. It also means that there is a limitation on
the types of questions that the model can adequately investigate, a critical one being (for example) the
extent to which ecological processes may have limited the production of key fished species in GSV.
The GSV ecosystem model developed for this project is a combination of a static, mass-balance model
(Ecopath) combined with temporal (times-series) model (Ecosim). This Ecopath with Ecosim model
does not capture the critical spatial dimension that underpins distribution of species and their habitat,
nor the spatial and temporal variability in fisheries catch and effort, and other human activities. The
spatial dimension is important to improving model utility and confidence, given the marked
environmental gradients in GSV that influence the distribution of taxa and fishing effort. Ecospace
replicates Ecosim dynamics over a spatial grid and can include habitat, habitat preference and habitat
capacity parameters, physical circulation patterns (advection model) that can capture larval transport
and taxa movement dynamics, environmental data (e.g. depth, temperature, salinity), marine protected
areas, and changes in the spatial distribution of fishing effort and catch (Walters et al. 1999). Given the
significant and fine-scales of spatial management of fisheries and other activities including defence
and marine parks that constrain and/or limit the influence of activities in GSV, future development of
ecosystem models should include spatial and temporal dynamics. Their inclusion will improve our
understanding of the GSV ecosystem, and ensure that the models for the ecosystem are relevant and
have improved application.
The GSV ecosystem model developed for this project did not attempt to include environmental time
series data. Improving Ecosim model fits to environmental time series data greatly aids in the
assessment of whether changes in the production of the ecosystem and biomasses of taxonomic groups
can be explained by environmental change. This is clearly relevant to the GSV ecosystem given the
findings of this study infer that recent declines in the performance of some GSV fisheries may be due
to a loss of ecosystem production, which could be due to environmental change. Given the marked
north-south environmental gradients in GSV, including environmental time-series in a spatial context
within Ecospace would be most relevant.
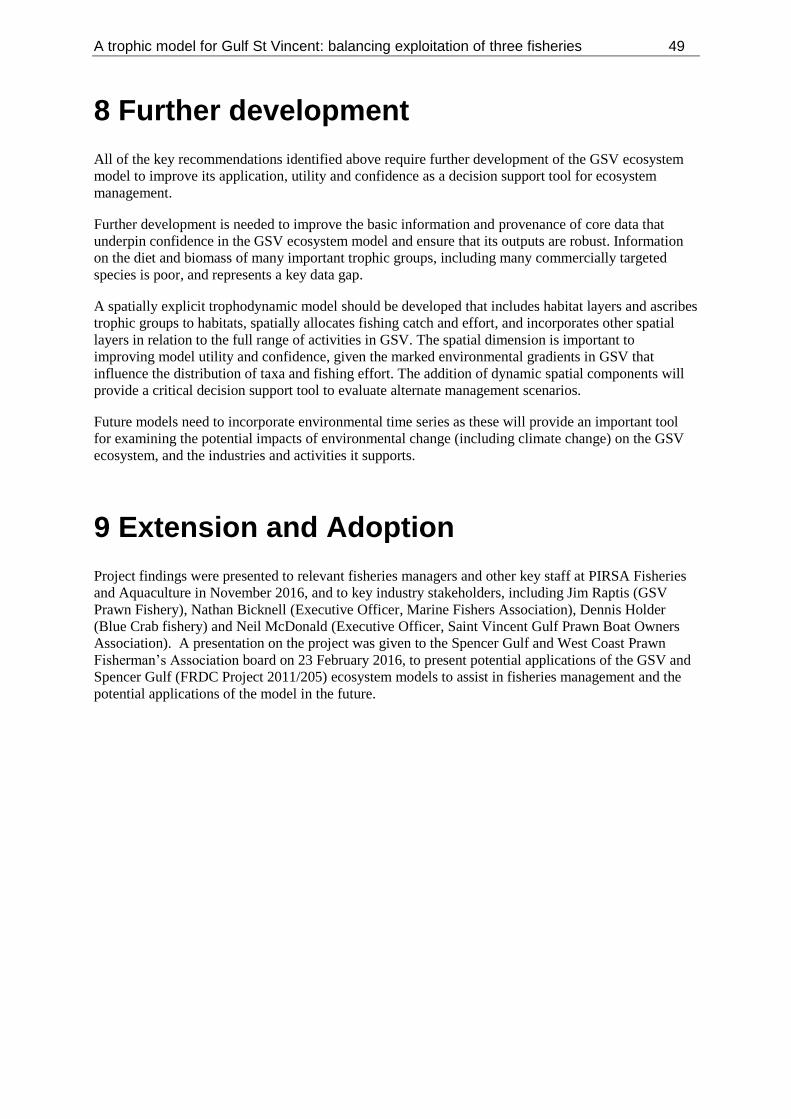
A trophic model for Gulf St Vincent: balancing exploitation of three fisheries 49
8 Further development
All of the key recommendations identified above require further development of the GSV ecosystem
model to improve its application, utility and confidence as a decision support tool for ecosystem
management.
Further development is needed to improve the basic information and provenance of core data that
underpin confidence in the GSV ecosystem model and ensure that its outputs are robust. Information
on the diet and biomass of many important trophic groups, including many commercially targeted
species is poor, and represents a key data gap.
A spatially explicit trophodynamic model should be developed that includes habitat layers and ascribes
trophic groups to habitats, spatially allocates fishing catch and effort, and incorporates other spatial
layers in relation to the full range of activities in GSV. The spatial dimension is important to
improving model utility and confidence, given the marked environmental gradients in GSV that
influence the distribution of taxa and fishing effort. The addition of dynamic spatial components will
provide a critical decision support tool to evaluate alternate management scenarios.
Future models need to incorporate environmental time series as these will provide an important tool
for examining the potential impacts of environmental change (including climate change) on the GSV
ecosystem, and the industries and activities it supports.
9 Extension and Adoption
Project findings were presented to relevant fisheries managers and other key staff at PIRSA Fisheries
and Aquaculture in November 2016, and to key industry stakeholders, including Jim Raptis (GSV
Prawn Fishery), Nathan Bicknell (Executive Officer, Marine Fishers Association), Dennis Holder
(Blue Crab fishery) and Neil McDonald (Executive Officer, Saint Vincent Gulf Prawn Boat Owners
Association). A presentation on the project was given to the Spencer Gulf and West Coast Prawn
Fisherman’s Association board on 23 February 2016, to present potential applications of the GSV and
Spencer Gulf (FRDC Project 2011/205) ecosystem models to assist in fisheries management and the
potential applications of the model in the future.
A trophic model for Gulf St Vincent: balancing exploitation of three fisheries 50
10 Appendices
Appendix 1. Research staff and intellectual property
List of researchers and project staff (boat skippers, technicians, consultants)
Simon Goldsworthy PI, SARDI Aquatic Sciences
Maylene Loo, SARDI Aquatic Sciences
Tony Fowler, CI SARDI Aquatic Sciences
Mike Steer, CI SARDI Aquatic Sciences
Craig Noell, CI SARDI Aquatic Sciences
Sean Sloan, CI PIRSA Fisheries and Aquaculture
Intellectual Property
This report will be made freely available and can be copied and distributed provided attribution of the
work is made. The GSV ecosystem model will also be available for modelling additional scenarios.

A trophic model for Gulf St Vincent: balancing exploitation of three fisheries 51
Appendix 2. Description of functional groups, data sources, methods and assumptions in estimating parameters used in the Gulf St Vincent Ecosystem model
Pinnipeds
Australian Sea Lion
Biomass and consumption: Australian Sea Lions (Neophoca cinerea) are endemic to Australia and
restricted to South and Western Australia, with over 85% of the species breeding in South Australia
(Shaughnessy et al. 2011). The nearest and most significant ASL breeding colony to GSV, is The
Pages Islands, which lie in the Backstairs Passage just east of the GSV ecosystem domain location.
Trend data are available for this population between 1990 and 2009, with pup numbers per breeding
season ranging from 381 to 609 (Shaughnessy et al. 2013). The most recent survey conducted during a
breeding was in 2009 when 478 pups were counted (Goldsworthy et al. 2015, Shaughnessy et al.
2013).
Age-specific survival and pup production data were used to estimate the numbers of animals alive at
each age stage. Life tables were based on those developed by McIntosh (2007) and modified to
achieve stable growth by Goldsworthy et al. (2010). A maximum longevity of 24 and 21.5 years for
females and males was used (McIntosh 2007). As Australian sea lions breed about every 18 months
(Shaughnessy et al. 2006), survival was calculated for every 1.5 years. Age-mass relationships for
females and males followed those developed for the species by McIntosh (2007) and were used to
estimate total biomass in 1993 at 184 tonnes, or a biomass density within the GSV of B = 0.00627 t
km-2.
A mass-based regression equation of field metabolic rate (FMR) based on seven otariid species
developed by Green (presented in Goldsworthy et al. (2003) was used to estimate daily energy
requirement (ER):
𝐸𝑅𝑎𝑡−𝑠𝑒𝑎 = 2.234𝑀0.665,
where ERat-sea is MJd-1 and M is the mean mass of each age-class/sex. The average daily energy
requirement of otariid seals is a function of the proportion of time spent at sea and on-shore (Costa and
Gales 2000, Winship et al. 2002), with daily energy requirements at-sea being about 1.8 times greater
than those on-shore (ERon-shore) (Costa and Gentry 1986). As such the ER of each age-class/sex was
estimated following Mecenero et al. (2006) as:
𝐸𝑅 = (𝐸𝑅𝑎𝑡−𝑠𝑒𝑎𝑝𝑎𝑡−𝑠𝑒𝑎 + 𝐸𝑅𝑜𝑛−𝑠ℎ𝑜𝑟𝑒𝑝𝑜𝑛−𝑠ℎ𝑜𝑟𝑒)/0.93,
Where the proportion of time spent at sea and on-shore is pat-sea, pon-shore, respectively. Estimates of pat-
sea, pon-shore, were based on those in Goldsworthy et al. (2007), Goldsworthy and Page (2007) and
Kirkwood et al. (2006). 0.93 is the estimated mean prey assimilation efficiency (Mecenero et al. 2006,
Winship et al. 2002). An average prey energy density of 4.985 MJ/kg (Goldsworthy et al. 2003) was
then used to estimate the total annual prey consumption (Q t y-1) of age/sex classes as:
𝑄 = [(𝐸𝑅
4.985)365] /1000

A trophic model for Gulf St Vincent: balancing exploitation of three fisheries 52
Using this approach prey consumption for the Australian Sea Lion population in the GSV areas was
estimated (Q = 1,939 t/yr); with Q/B = 29.445 and P/B = 0.792. Production (P) per Biomass estimates
(P/B) were estimated as: ((current biomass live + dead)/(previous year annual biomass alive)).
No definitive diet study of Australian sea lion in the GSV area has been undertaken. Data were pooled
from three main sources; Page et al. (2011) which drew heavily on the study of McIntosh et al. (2006);
and from faecal prey DNA studies (K. Peters, unpublished data).
Long-Nosed Fur Seal
Biomass and consumption: Long-Nosed Fur Seal (Arctocephalus forsteri) are native to southern
Australia and New Zealand. South Australia has most (>80%) of Australia’s population (Goldsworthy
and Page 2007), with the largest colonies occurring along the south coast of Kangaroo Island and south
of Spencer Gulf at North and South Neptune and Liguanea Islands (Shaughnessy et al. 2015).
Estimates for the abundance of long-nosed fur seals in the GSV ecosystem model area were based on
pup production estimates obtained from these locations between the 1993/94 and 2013/14 breeding
seasons (Shaughnessy et al. 2015).
Adult female fur seals were not considered to forage within the GSV model area based on satellite
tracking studies, indicating that almost all foraging is directed towards oceanic areas of the sub-
tropical front between 400 and 1,100 km to the south west (Baylis et al. 2008, Baylis et al. 2012).
Weaned pups and yearlings forage in oceanic waters (B. Page, A. Baylis and S. Goldsworthy
unpublished data, Page et al. 2006) while adult males once reaching reproductive age (first male tenure
average 9 years, McKenzie et al. 2007b) forage in continental slope waters (Page et al. 2006). In
contrast, satellite tracking studies of juvenile and subadult males tracked from southern Spencer Gulf
and off the north coast of Kangaroo Island indicate that most of foraging occurs within the Gulf and
inner shelf regions, although animals tracked ranged extensively westward to the Nuyts Archipelago
and eastward to Gulf St Vincent, south of Tasmania and into Bass Strait (B. Page and S. Goldsworthy
unpublished data). For the purposes of the GSV Ecosystem model, we considered juvenile and sub-
adult males aged between 2 and 8 years and juvenile females between 2 and 4 years (mean age of first
reproduction in females is 5, McKenzie et al. 2007b) foraged within the model area.
Life-tables were based on those developed by Goldsworthy et al. (2003) and Goldsworthy and Page
(2007), utilising data available for closely related species. Age-specific survival relationships were:
females S = 0.627-0.073a + 0.003a2-(5.91 x 10⁻⁵)a3; males S = 0.627-0.097a + 0.006a2-(0.140
x 10-3)a3, where S is survival and a is age in years. Maximum ages were 23.4 and 16.7 for females and
males, respectively (McKenzie 2006, McKenzie et al. 2007a). Age-mass relationships for females and
males followed those developed for the species by McKenzie et al. (2007a), and were used to estimate
the biomass (B) of juveniles and sub-adult males at 252 t (0.00870 t km-2) in 1993/94 and 524 t
(0.01810 t km-2) in 2012/13.
Consumption and production estimates followed the methods described above for Australian sea lions.
Prey consumption by juvenile and sub-adult male Long-Nosed Fur Seals within GSV ecosystem area
was estimated (Q = 1,044 t yr-1); with Q/B = 46.707 and P/B = 1.184. Production per Biomass
estimates (P/B) was estimated for the entire population as: ((current biomass live + dead)/(previous
year annual biomass alive)).
Diet data for the long-nosed fur seal were based on 333 scat samples collected from five sites
containing juveniles and sub-adult males (B. Page, unpublished data) within Spencer Gulf

A trophic model for Gulf St Vincent: balancing exploitation of three fisheries 53
(Donnington Rock, Sibsey, Althorpe, Thistle and Liguanea Islands), assuming these are similar to prey
species targeted in the GSV ecosystem area. Recovered prey hard parts (fish otoliths, cephalopod
beaks, feathers) were identified and biomass reconstructed following the methods of Page et al. (2005).
Given the high mobility of juvenile and sub-adult male long-nosed fur seals, it is unlikely that all of
the foraging undertaken by animals is restricted to the GSV ecosystem model area, and it is also
possible that some animals originating from other key population centres outside GSV ecosystem
model domain also spend part of their time foraging within the region. We have estimated the amount
of dietary input from regions outside of the GSV ecosystem model area as 40%.
Cetaceans
Within GSV, dolphins are the most common toothed cetacean species. The two main groups are the
short-beaked common dolphin (Delphis delphis) and members of the bottlenose dolphin genus
(Tursiops spp.). At least two species have potentially been documented from the region, the coastal
Indo-Pacific bottlenose dolphin (T. aduncus) and common bottlenose dolphins (T. truncatus), the latter
of which are predominantly distributed in shelf and oceanic waters further offshore than former (Gibbs
et al. 2011, Kemper and Ling 1991, Kemper 2004). More recently, a third species (the Southern
Australian bottlenose dolphin) has been described from coastal regions of Victoria, South Australia
and Tasmania (Charlton-Robb et al. 2011, Moller et al. 2008). There may also be hybridisation
between species (Kemper 2004). Marked population structure has been found between coastal
Tursiops spp. in Spencer Gulf and those in the Great Australian Bight that may be associated with the
oceanography of the Gulf region (Bilgmann et al. 2007).
Common Dolphin
Biomass and consumption: A recent aerial survey of Common Dolphin across both Spencer and Gulf
St Vincent and the Investigator Straight in summer and winter 2011 by L. Moller, G. Parra and K.
Bilgmann (Flinders University, unpublished data) formed the basis of estimates for common dolphin
biomass and densities within the GSV ecosystem model area. Using their strata 3 (Upper GSV) and
strata 4 (Lower GSV and Investigator Strait) surveys areas, the mean estimate was 3,462 dolphins
(1,712 – 7,239 ±95% confidence limits, uncorrected for availability bias) giving a mean density of
0.2799 dolphins km-2. The mean mass of Delphinus was estimated to be 79 kg (C. Kemper pers.
comm.) giving overall estimates of biomass of 273 t or B = 0.0221 t km-2.
Prey consumption was estimated using the methods presented by Barlow et al. (2008). They used
models of the average daily ration (R in kg wet weight) and average daily metabolic requirements
(ADMR in kJ d-1) as follows:
𝑅 =𝐴𝐷𝑀𝑅
{0.8[3900𝑍 + 5450(1 − 𝑍)},
where:
𝐴𝐷𝑀𝑅 = 𝛽(293.1𝑀0.75),
and 3900 and 5450 are the energy densities of crustaceans and fish, respectively (kJ kg-1 wet weight),
Z is the fraction of crustaceans in the diet, 0.8 is the assimilation efficiency (Leaper and Lavigne 2007)
and β = 2.5 (Hooker et al. 2002, Kenney et al. 1997, Laidre et al. 2004). These models were based on
the Kleiber (1975) function for basal metabolic rate (BMR) related to the mass (M) of homeotherms:

A trophic model for Gulf St Vincent: balancing exploitation of three fisheries 54
𝐵𝑀𝑅 = 293.1𝑀0.75,
and food consumption models developed by Lavigne (1996) and Leaper and Levigne (2007). Total
annual prey consumption was estimated as the product of the mean yearly ration (365 x R) and
abundance (Barlow et al. 2008). Following this, we estimated the annual prey consumption of
common dolphins to be 5,625 t yr-1. This provides a Q/B estimate of 20.578. P/B was estimated at 0.09
for Common Dolphins based on Barlow and Boveng (1991).
The diets of common dolphins were assessed from stomach contents and stable isotope analyses of
individuals that were found dead in southern Australia (Gibbs et al. 2011) and summaries compiled by
Page et al. (2011). Common dolphins principally forage on pelagic fish such as sardines, anchovy and
jack mackerel. In Spencer Gulf they are known to feed on bycatch and discards from the Prawn fishery
(Svane 2005). We have assumed some feeding also occurs in association with the GSV Prawn fishery,
although given the fishery is much smaller, the contribution to the diet from discards is likely to be
considerably less.
Bottlenose Dolphin
Biomass and consumption: Bottlenose Dolphin abundance was based on the mean density of dolphins
(0.0325 km-2) from aerial surveys conducted by Kemper et al. (2006), assuming that bottlenose
dolphins made up ~40% of those dolphins surveyed (C. Kemper, pers. comm.). The mean mass of
Tursiops was estimated to be 109 kg (Barlow et al. 2008), giving an overall estimate of biomass of 102
t or B = 0.00354 t km-2. Estimates of Q/B followed the same approach for common dolphins, providing
an estimate of Q/B = 18.985. P/B was estimated at 0.08 based on Barlow and Boveng (1991).
The diets of bottlenose dolphins were assessed from stomach contents and stable isotope analyses of
individuals that were found dead in southern Australia (Gibbs et al. 2011, Kemper and Gibbs 2001),
and summaries compiled by Page et al. (2011).
Seabirds
Little penguin
Biomass and consumption: There has not been a systematic survey of Little Penguins (Eudyptula
minor) in South Australia or within the GSV ecosystem model area. Estimates used here were based
on available summaries and estimates (Copley 1996, Wiebkin 2011a). Survival in little penguins is
estimated to be 17%, 71% and 78% in each of the first three years, respectively, and 83% per year
subsequently (P. Dann, pers. comm.). 50% of birds are mature and breed when they are two years of
age, with the remaining birds breeding for the first time at three years (Dann and Cullen 1990). A
simplified life-table based on these parameters and maximum longevity of ~26 years (Dann et al.
2005)) suggests juveniles make up 27% of the population, while breeding pairs (adults) make up 73%.
Using the estimate of 2,348 breeding pairs based on surveys of Troughbridge and Kangaroo Island
(Wiebkin 2011a), the total population of little penguins in the GSV ecosystem model area is estimated

A trophic model for Gulf St Vincent: balancing exploitation of three fisheries 55
to be 6,476. Assuming a mean mass of 1.2 kg per bird, the total biomass in the habitat area of the
population is estimated to be 7.8 t (B = 0.00148 t km-2), assuming 50% of the GSV domain area is
suitable habitat for Little Penguins. Non-breeding (juvenile) little penguins were estimated to consume
73.1 kg per year, based on prey consumption of 167 g kg-1 D-1 (Costa et al. 1986), while breeding
Little Penguins are estimated to consume 114.0 kg of prey each year (including the food requirements
for 0.85 chicks per year, 1.7 per pair) (Bethge et al. 1997). This provides an estimate of total annual
prey consumption (Q) in the GSV model area of 665.5 t and a Q/B of 85.6. A P/B estimate of 1.29 was
derived from an estimate for Antarctic penguins (Cornejo-Donoso and Antezana 2008).
Information on diet was based on that detailed for the Reevesby Island population in the Sir Joseph’s
Banks Group by Weibkin (2011a). These included 156 stomach contents collected over six occasions
in all seasons between 2003 and 2005 (Wiebkin 2011b).
Petrels
Biomass and consumption: The dominant petrel species in the GSV ecosystem region are the abundant
short-tailed shearwater (Puffinus tenuirostris) which breeds across many of the islands in lower
Spencer Gulf and off the southern and western Eyre Peninsula (Copley 1996); the far less abundant
flesh-footed shearwater (Puffinus carneipes) which is only known to breed on two islands (Lewis and
Smith Islands in lower Spencer Gulf) (Copley 1996, Goldsworthy et al. 2013); and the widespread
white-faced storm petrel (Pelagodroma marina) (Copley 1996).
Of these species, data on the breeding ecology, diet and at-sea distributions are only available for the
short-tailed shearwater, but only for areas south of Spencer Gulf outside of the GSV ecosystem. They
undergo major migrations, overwintering in the North Pacific Ocean and Bering Sea, arriving in south-
eastern Australia in September/October and leaving again in March/April (Weimerskirch and Cherel
1998). The return rate of fledged chicks at four years of age is estimated at 0.437 and adult annual
survival at 0.92 (Hunter et al. 2000, Wooller et al. 1990). With the mean age of first breeding at ~7
years (Hunter et al. 2000), a simplified life-table based on these parameters suggests juveniles make up
47% of the population, while breeding pairs (adults) make up 53%. Using an estimate of the number of
breeding pairs in the SGE region for short-tailed (136,318) and flesh-foot (3,300) shearwaters (Copley
1996, Goldsworthy et al. 2013), the total number of shearwater within and adjacent to the GSV
ecosystem was estimated to be 520,872. Assuming a mean mass of 0.7 and 0.6 kg per bird, for short-
tailed and flesh-foot shearwaters, respectively, the total biomass of shearwaters is estimated to be
about 372.2 t.
The active (965.9 kJ d-1) and resting (296.9 kJ d-1) metabolic rates for short-tailed shearwaters were
estimated from regression equations in Warham (1996). Breeding pairs were assumed to spend 206
days in non-breeding foraging grounds, 14 days pre-incubation in waters adjacent to the GSV
ecosystem, 55 days incubating the egg (incubation shared equally between the sexes) and 90 days
rearing chicks (Einoder 2010, Einoder and Goldsworthy 2005, Weimerskirch and Cherel 1998). In
South Australia, short-tailed shearwaters undertake on average 28 short foraging trips over shelf
waters and 12 long trips into the Southern Ocean during the 90 day chick-rearing period (Einoder
2010). Assuming individual birds spend about 5 hours ashore in between foraging trips; birds were
estimated to spend 10.2% of their time ashore and 89.8% at sea. The prey consumption equation of
Daunt et al. (2008) was used, assuming an assimilation efficiency of 0.69, and based on information of
dietary breakdown, prey energy density and 4.5 kg of prey being fed to the chick by each breeding pair
(Einoder 2010). Annual prey consumption (Q) was estimated at 80,679 t, but with 70% of foraging
time during chick rearing spent on long trips into the Southern Ocean, and 206 days spent undertaking

A trophic model for Gulf St Vincent: balancing exploitation of three fisheries 56
the annual migration into the Northern Hemisphere, most (86.9%) prey consumption is estimated to be
imported (derived from outside the GSV ecosystem). Q/B is estimated to be 147.3. P/B was estimated
to be 1.0 and was derived from an estimate for Antarctic seabirds (Cornejo-Donoso and Antezana
2008).
The estimate of breeding pairs of white-faced storm petrels within the region adjacent to the GSV
ecosystem is 218,125 (Copley 1996). Assuming breeding pairs make up 2/3 of the population, the total
estimate of the population is 660,985. White-faced storm petrels are estimated to be present in
southern Australia between October and March which includes a 45 day incubation and 51 day chick
rearing period (Marchant and Higgins 1990). Assuming a mean mass of 55 g (Marchant and Higgins
1990), adults spending 82% of their time at sea, and at-sea and onshore metabolic rates of 223.7 kJ d-1
and 50.3 kJ d-1, respectively (estimated from equations in Warham 1996), an assimilation efficiency of
0.69, a prey energy density of 5 MJ kg-1, and a mean meal mass fed to chicks of 6.4 g (0.5 meals per
night) (Marchant and Higgins 1990); prey consumption per annum is estimated to be 23,628 t (using
equations in Daunt et al. 2008). Parameters for the Ecopath model for the petrel group were combined
to provide an overall estimate of biomass (409 t), biomass in the habitat area (0.00514 t km-2) and
consumption (78,105 t). Based on these values, Q/B was estimated to be 191.2. A P/B estimate of 1.0
was used based on Sakshaug (1997).
Diet data for short-tailed shearwaters was based on extensive studies undertaken in South Australia by
Einoder (2010) and summarised by Page et al. (2011). The diet of white-faced storm petrels was based
on that detailed for the species by Imber (1981). Dietary data for the petrel functional group was
weighted for each species based on their proportion of prey biomass consumed in the habitat area.
Import of prey consumption from outside the GSV ecosystem for all petrels combined was estimated
to be 81.6%.
Australasian gannet
Biomass and consumption: The only breeding colony of Australasian gannets (Morus serrator) in
South Australia is at Margaret Brock Reef off Cape Jaffa where approximately 300 breeding pairs nest
(Lighthouses of Australia Inc 2004). Gannets are common in GSV year-round, where they plunge-dive
on small pelagic fish. They likely originate from the Margaret Brock Reef colony, as well as other
breeding colonies in Victoria and Tasmania, which number approximately 6,660 pairs (Marchant and
Higgins 1990). We estimated that 10% of the Margaret Brock Reef population and about 2% of the
Victoria and Tasmania populations may be foraging within the GSV ecosystem area at any time. With
individual gannets weighing approximately 2.5 kg (Daunt et al. 2008), GSV gannet biomass is
estimated to be 0.9 t (0.00003 t km-2). Estimates of the energy needs of breeding and non-breeding
birds (4,561 KJ d-1), plus the energy costs of egg (201,100 KJ) and chick production (145,000 KJ)
were derived from Bunce (2001). Assuming 0.63 chicks per pair, 0.75 assimilation efficiency and a
mean prey energy density of 6.7 kJ g-1 (Bunce 2001), prey consumption was estimated using the
formula of Daunt et al. (2008) to be 286 t. Based on these estimates, Q/B is 125.3, and a P/B estimate
of 1.0 was used based on Sakshaug (1997). Dietary data were based on (Bunce 2001) and summarised
by Page et al. (2011).
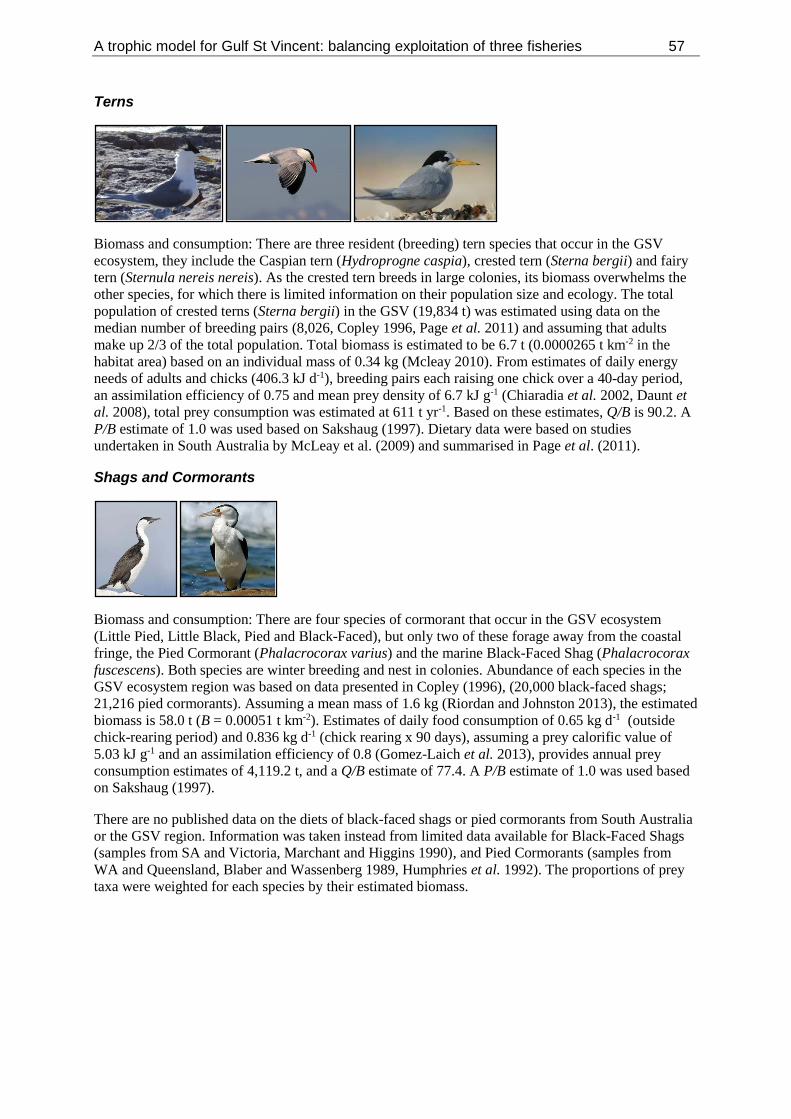
A trophic model for Gulf St Vincent: balancing exploitation of three fisheries 57
Terns
Biomass and consumption: There are three resident (breeding) tern species that occur in the GSV
ecosystem, they include the Caspian tern (Hydroprogne caspia), crested tern (Sterna bergii) and fairy
tern (Sternula nereis nereis). As the crested tern breeds in large colonies, its biomass overwhelms the
other species, for which there is limited information on their population size and ecology. The total
population of crested terns (Sterna bergii) in the GSV (19,834 t) was estimated using data on the
median number of breeding pairs (8,026, Copley 1996, Page et al. 2011) and assuming that adults
make up 2/3 of the total population. Total biomass is estimated to be 6.7 t (0.0000265 t km-2 in the
habitat area) based on an individual mass of 0.34 kg (Mcleay 2010). From estimates of daily energy
needs of adults and chicks (406.3 kJ d-1), breeding pairs each raising one chick over a 40-day period,
an assimilation efficiency of 0.75 and mean prey density of 6.7 kJ g-1 (Chiaradia et al. 2002, Daunt et
al. 2008), total prey consumption was estimated at 611 t yr-1. Based on these estimates, Q/B is 90.2. A
P/B estimate of 1.0 was used based on Sakshaug (1997). Dietary data were based on studies
undertaken in South Australia by McLeay et al. (2009) and summarised in Page et al. (2011).
Shags and Cormorants
Biomass and consumption: There are four species of cormorant that occur in the GSV ecosystem
(Little Pied, Little Black, Pied and Black-Faced), but only two of these forage away from the coastal
fringe, the Pied Cormorant (Phalacrocorax varius) and the marine Black-Faced Shag (Phalacrocorax
fuscescens). Both species are winter breeding and nest in colonies. Abundance of each species in the
GSV ecosystem region was based on data presented in Copley (1996), (20,000 black-faced shags;
21,216 pied cormorants). Assuming a mean mass of 1.6 kg (Riordan and Johnston 2013), the estimated
biomass is 58.0 t (B = 0.00051 t km-2). Estimates of daily food consumption of 0.65 kg d-1 (outside
chick-rearing period) and 0.836 kg d-1 (chick rearing x 90 days), assuming a prey calorific value of
5.03 kJ g-1 and an assimilation efficiency of 0.8 (Gomez-Laich et al. 2013), provides annual prey
consumption estimates of 4,119.2 t, and a Q/B estimate of 77.4. A P/B estimate of 1.0 was used based
on Sakshaug (1997).
There are no published data on the diets of black-faced shags or pied cormorants from South Australia
or the GSV region. Information was taken instead from limited data available for Black-Faced Shags
(samples from SA and Victoria, Marchant and Higgins 1990), and Pied Cormorants (samples from
WA and Queensland, Blaber and Wassenberg 1989, Humphries et al. 1992). The proportions of prey
taxa were weighted for each species by their estimated biomass.

A trophic model for Gulf St Vincent: balancing exploitation of three fisheries 58
Gulls
Biomass and consumption: There are two species of gull that occur in the GSV ecosystem region, the
Silver Gull (Chroicocephalus novaehollandiae) and the Pacific Gull (Larus pacificus). In many parts
of Australia, silver gull numbers have increased substantially with increases in human populations.
Estimates of the size of gull populations were based on estimates provided within Copley (1996).
Earlier estimates were used to derive estimates for 1993 of 35,840 pairs of silver gulls, and 7 pairs of
Pacific gulls in the GSV region. Based on an assumption that adults make up 40% of the population
(Coulson et al. 1982), and with a mean estimated mass of 0.3 kg for silver gulls and 1.04 kg for Pacific
gulls (Lindsay and Meathrel 2008) gives a combined biomass estimate of 21.5 t (or 0.00205 t km-2).
An estimated daily energy requirement of 400 kJ d-1, was used for silver gulls whereas those
summarised by Lindsay and Meathrel (2008) were used for Pacific gulls. Based on these values,
assimilation efficiency of 0.75, a mean prey density of 4.985 kJ g-1 (Goldsworthy et al. 2003), and the
seabird consumptions models of Daunt et al. (2008), total prey consumption was estimated at 2,760 t
yr-1. Based on these estimates, Q/B is 130.1. A P/B estimate of 1.0 was used based on Sakshaug
(1997).
The diet of silver gulls was based on data obtained from 108 samples for southern Spencer Gulf
detailed in Harrison (2009), interpreted by (Page et al. 2011). No dietary information is available for
Pacific gulls in South Australia. Data from Lindsay and Meathrel (2008) were used to infer the diet in
the GSV region. Proportion of prey taxa was weighted for each species by estimated biomass.
Pelagic sharks
The pelagic shark community of the GSV region is made up of five main species, the White Shark
(Carcharodon carcharias), Smooth Hammerhead (Sphyrna zygaena), Common Thresher (Alopias
vulpinus) and Bronze (Carcharhinus brachyurus) and Dusky Whaler (C. obscurus). There is scant
catch data for pelagic sharks in the GSV region, and records were likely to have under-estimated actual
landings. Pelagic shark species included in the model, for which there were some time series catch
data, were whaler sharks and smooth hammerhead, mainly caught in the SA line and net marine
scalefish fishery, and the demersal gillnet shark fishery. There was limited discard information
available. No biomass (B) data were available for any component of this model group and this
parameter was estimated by the model. The methods for estimating P/B, Q/B and EE for pelagic sharks
are detailed below.
Production per biomass (P/B) can be approximated by the instantaneous total mortality rate Z (Allen
1971). The P/B values were therefore set equal to the total mortality rates Z = F + M, where F is the
mean fishing mortality and M is the rate of natural mortality. Non-commercial species were considered
to have an F = 0.
The instantaneous natural mortality rate (M) was preferably taken from direct estimation. However,
only a few direct estimates of instantaneous natural mortality rate have been calculated for
chondrichthyans (e.g. Gruber et al. 2001, Heupel and Simpfendorfer 2002). Instead, indirect estimates
of mortality were obtained through methods based on predictive equations of life history traits. Natural
mortality was derived from the empirical model of Pauly (1980):
𝑀 = 𝐾0.65𝐿∞−0.279𝑇0.463

A trophic model for Gulf St Vincent: balancing exploitation of three fisheries 59
where K and L∞ (cm) refer to the curvature and asymptotic length parameters of the von Bertalanffy
growth function, respectively, and T is the mean annual water temperature in Celsius.
Q/B was calculated according to the empirical regression of Christensen and Pauly (1992):
𝑄 𝐵⁄ = 106.370.0313𝑇𝑘𝑊∞−0.1681.38𝑃𝑓189𝐻𝑑,
where W∞ is the asymptotic body weight in grams, calculated from L∞ using published length-weight
regressions; Tk is the mean annual temperature expressed as 1000/(T˚C + 2.731); Pf equals one for
predators and zooplankton feeders and zero for others; and Hd equals one for herbivores and zero for
carnivores. W∞ was calculated according to the equation W∞ = a x L∞b. Length-weight data were
usually available from the area from which L∞ was estimated.
The von Bertalanffy growth parameters were taken from the most recent studies in Australia or New
Zealand. When no studies from these areas were available, the arithmetic mean of the most recent
studies from other locations was used. When available, growth parameters for combined sexes were
used. Otherwise, the arithmetic mean between male and female growth parameters was used. An
ecotrophic efficiency estimate of 0.95 was used.
White shark
Production per biomass and consumption: The white shark (Carcharodon carcharias) is a wide
ranging but mostly temperate and coastal species; it has a global distribution and at times occurs in
oceanic environments, in the tropics, and down to depths of at least 1280 m. It is most common over
the continental shelf (often close inshore) of southern Australia. Within the broader SA region outside
of the GSV ecosystem, white sharks are often concentrated around seal colonies including Dangerous
Reef and the Neptune Islands, where they can be observed year round (Strong et al. 1996; Bruce et al.
2005). White sharks of all sizes, from less than 2 m to over 5 m total length, occur in areas where
Snapper are abundant. Smaller specimens (< 2 m) are commonly encountered between Streaky Bay
and the Head of the Bight. Fur seal and sea lion colonies are important locations for sub-adult and
adult sharks in South Australia, Victoria and Tasmania.
P/B was assumed equivalent to M and calculated using Pauly’s (1980) empirical equation. The von
Bertalanffy growth parameters for species combined from three studies were used to estimate M
(Cailliet et al. 1985, Wintner and Cliff 1999). A temperature of 17.5˚C was assumed for the mean
annual water temperature as white sharks are most often found in temperatures between 15 and 20˚C
(Carey et al. 1982, Casey and Kohler 1992, Dewar et al. 2004, Klimley et al. 2002, Weng et al. 2005).
Q/B was estimated using Christensen and Pauly’s (1992b) equation with W∞ estimated by the length-
weight regressions for combined sexes from Australia (Malcolm et al. 2001). P/B and Q/B estimates
were then averaged across sexes and studies as 0.10 and 1.73, respectively.
The diet of white shark was based primary on the study from South Africa by Hussey et al. (2012),
using their largest size class (> 2.85 m) as most sharks in SA watres are 3m+ (P. Rogers, pers. comm.),
and adjusting for local equivalent prey species (P. Rogers and C. Huveneers, unpublished data). The
undifferentiated elasmobranch diet component was spread proportionally across other know
elasmobranch taxa.

A trophic model for Gulf St Vincent: balancing exploitation of three fisheries 60
Smooth hammerhead
The smooth hammerhead (Sphyrna zygaena) is a wide-ranging shark with an amphitemperate
distribution in, or close to, the continental shelf waters of all oceans (Compagno 1984). They are
common in the GSV region.
P/B was assumed equivalent to M and calculated using Pauly’s (1980) empirical equation. Von
Bertalanffy growth parameters for each sex were taken from a study in Mexico by Garza (unpublished
data). Q/B was estimated using Christensen and Pauly’s (1992b) equation with W∞ estimated by the
length-weight regression from Western Australia (McAuley and Simpfendorfer 2003). P/B = 0.21 and
Q/B = 3.15 estimates were then averaged across sexes.
Dietary information was taken from the study of Rogers et al. (2012). A total of 39 stomachs (95%
containing prey items) were examined from samples collected from commercial catches in the Great
Australian Bight (GAB) and Spencer Gulf between 2007 and 2010.
Thresher shark
The common thresher shark (Alopias vulpinus) is found both in coastal and oceanic waters. Von
Bertalanffy growth parameters for each sex were taken from the most recent age and growth study of
A. vulpinus (Smith et al. in press). Q/B was estimated using Christensen and Pauly’s (1992b) equation
with W∞ estimated by the length-weight regression from the Northwest Atlantic (Kohler et al. 1996).
P/B = 0.2 and Q/B = 2.78 estimates were averaged between sexes.
Dietary information was taken from the study of Rogers et al. (2012). A total of 27 stomachs (63%
containing prey items) were examined from samples in the GAB between 2007 and 2009.
Whaler sharks
Bronze (Carcharhinus brachyurus) and dusky whaler (C. obscurus) sharks are the most abundant
pelagic sharks in the GSV region. P/B was assumed equivalent to M and calculated using Pauly’s
(1980) empirical equation. Von Bertalanffy growth parameters for combined sexes were taken from a
study in South Africa by Walter and Ebert (1991) and a study in Western Australia by Simpfendorfer
et al. (2002). The mean summer water temperature (19.2°C) was used to account for the higher
summer abundance and temperature-related migrations of C. brachyurus in South Australian waters.
Q/B was estimated using Christensen and Pauly’s (1992b) equation with W∞ estimated by the length-

A trophic model for Gulf St Vincent: balancing exploitation of three fisheries 61
weight regression of Cliff and Dudley (1992) and from Western Australia (J. Chidlow, pers. comm.).
P/B = 0.095 and Q/B = 2.61 estimates were averaged across species and sexes.
Dietary information was taken from the study of Rogers et al. (2012). A total of 250 bronze whaler
stomachs (65% containing prey items) and 49 dusky shark stomachs (65% containing prey items) were
examined from samples collected in the Spencer Gulf, GSV and GAB, between 2007 and 2010.
Demersal sharks
Demersal sharks were represented by three model groups within the GSV model: the Port Jackson
Shark (Heterodontus portusjacksoni); Gummy Shark (Mustelus antarcticus) and School Shark
(Galeorhinus galeus); and a third group composed of other demersal sharks that includes species such
as Wobbegongs or Carpet Sharks (Orecttolobidae), Catsharks (Scyliorhinidae and Parascylliidae),
Angel Sharks (Squatinidae), Spurdogs and Dogfish (Squalidae), Sawsharks (Pristiophoridae) and
Elephant Fish (Callorhinchidae).
Port Jackson shark
Port Jackson sharks (Heterodontus portusjacksoni) are a common bycatch in many commercial and
recreational fisheries in southern Australia. Biomass estimates were based on standardised surveys
undertaken in the GSV Prawn fishery, using the upper standard error estimates (0.02529 t km-2). This
was calculated following the methods of Currie et al. (2009a) and Burnell et al. (2015). Estimates of
P/B = 0.25 were based on estimates of M (Froese and Pauly 2009) and F (0.15), and Q/B = 1.52
(Currie and Sorokin 2010). Dietary data for Port Jackson shark were sourced from C. Beckmann
(n=22, unpublished data) and Currie et al. (2010) (n=14), all samples were from Spencer Gulf.
Gummy and school shark
Gummy (Mustelus antarcticus) and School Shark (Galeorhinus galeus) biomass estimates were based
on mean annual catch of both species in GSV between 1993 and 2013 and an estimated fishing
mortality (F) during this period of 0.3 giving a biomass of 0.07472 t km-2 for gummy shark while F for
school shark was 0.7, giving a biomass of 0.00071 t km-2. Estimates of P/B (0.55) and Q/B (2.6) were
based on estimates of F (0.3) and M (0.25) (Froese and Pauly 2009) for gummy shark while school
shark estimates of P/B is 8855 and Q/B is 2.5 (F = 0.7 and M = 0.25) (Froese and Pauly 2009). There
is limited diet information of these species. Dietary makeup was based on Currie et al. (2010) (n=1)
and P. Rogers (pers. comm.).

A trophic model for Gulf St Vincent: balancing exploitation of three fisheries 62
Other demersal sharks
The ‘Other demersal sharks’ group consisted of several species including the Rusty Catshark
(Parascyllium ferrugineum), Elephant Fish (Callorhinchus milii), Angel Shark (Squatina australis),
Cobbler Carpet Shark (Sutorectus tentaculatus), Piked Dogfish (Squalus megalops), Southern
Sawshark (Pristiophorus nudipinnis) and Common Sawshark (Pristiophorus cirratus).
Biomass estimates were based on standardised surveys undertaken in the GSV Prawn fishery, using
the upper standard error estimates for 3 species, Rusty Catshark, Elephant Fish and Angel Shark
(0.03622 t km-2). This was calculated following the methods of Currie et al. (2009a) and Burnell et al.
(2015). P/B and Q/B estimates of 0.351 and 2.6 were based on Froese and Pauly (2009) and Currie
(2009b) respectively. Diet data were based on the analyses of 17 shark stomachs (Cobbler Carpet
Shark = 1, Rusty Catshark = 3, Angel Shark = 2, Piked Dogfish = 1, Saw Shark = 5, Elephant Fish =
5), collected in Spencer Gulf, weighted for each species in proportion to their estimated biomass.
Skates & Rays
Biomass estimates were based on standardised surveys undertaken in the GSV Prawn fishery, using
the upper standard error estimate for eight species (0.16777 t km-2) and the calculation followed the
methods of Currie et al. (2009a) and Burnell et al. (2015). The species included Melbourne Skate
(Spiniraja whitleyi), Southern Fiddler Ray (Trygonorrhina dumerilii), Southern Shovelnose Ray
(Aptychotrema vincentiana), Smooth Stingray (Dasyatis brevicaudata), Coastal Stingaree (Urolophus
orarius), Sparsely-Spotted Stingaree (Urolophus paucimaculatus), Western Shovelnose stingaree
(Trygonoptera mucosa), White Spotted Skate (Dipturus cerva). P/B and Q/B estimates of 0.234 and
1.757 were based on Froese and Pauly (2009) and Currie (2009b), respectively.
Dietary data were based on the analysis of 19 stomachs (eagle ray = 1, southern fiddler ray = 1, coastal
stingaree = 3, Melbourne skate = 1, sparsely-spotted stingaree = 11, southern shovelnose ray = 1,
Australian numbfish =1) collected in Spencer Gulf, weighted for each species in proportion to their
estimated biomass (Currie and Sorokin 2010).
The State managed (< 3nm from shore) component was mostly taken in the Marine Scalefish Fishery
using long-lines. Most skates and rays tend to be discarded with the exception of the southern eagle
ray (Myliobatis australis), which is occasionally retained. Catch data for this group are patchy and
undoubtedly biased by the fact that most large Dasyatidaes are released. There was limited discard
information available for State fisheries that take this model group as bycatch, with the exception of
2007, when a dedicated bycatch program was implemented in State waters (Fowler et al. 2009).

A trophic model for Gulf St Vincent: balancing exploitation of three fisheries 63
Teleosts
Southern Bluefin Tuna
Southern Bluefin Tuna (SBT; Thunnus maccoyii) is a highly migratory and pelagic species that occurs
between 30°S and 50°S, and nearly to 60°S. Juveniles aggregate in the GAB during each summer and
autumn (Gunn and Young 1999, Young et al. 1996). Most (99.6%) of the Australian SBT catch is
taken in the eastern GAB region (Wilson et al. 2009). The estimated spawning stock biomass has
declined over the past three decades and there is no sign that the spawning stock is rebuilding, hence it
is listed as Critically Endangered in the Red List (Collette et al. 2011). No biomass data were
available, and this parameter was estimated by the model. P/B and Q/B estimates were 0.2 and 1.6
respectively (Bulman et al. 2006, Froese and Pauly 2009). Diet data were sourced from Caines (2005),
Ward et al. (2006)) and Page et al. (2011).
Yellowtail kingfish
No biomass data were available for Yellowtail Kingfish (Seriola lalandi) and it was estimated by the
model. P/B and Q/B estimates were 0.2 and 3.2 respectively (Bulman et al. 2006, Froese and Pauly
2009). Diet data were sourced from Caines (2005) and Page et al. (2011).
Snapper
Snapper (Chrysophrys auratus) is an abundant, inshore, demersal fish species that occurs throughout
temperate and sub-tropical waters of the Indo-Pacific region (Kailola et al. 1993, Paulin 1990).
Snapper is the most valuable species of fish in the Marine Scalefish Fishery in South Australia (Knight
and Tsolos 2009). This fishery is a multi-gear, multi-species fishery that operates throughout all
coastal waters of the State. Snapper are targeted with hand lines and long lines in this fishery
(McGlennon et al. 2000). South Australia now has the highest State-based commercial catch in
Australia (Fowler et al. 2010).
Key estimates of biomass, exploitation rate and recruitment are available for this species as part of
dynamic, spatial age-length structure models developed to facilitate management of this fishery
(Fowler et al. 2013). Biomass was estimated to be 0.08698 t km-2. P/B and Q/B estimates were 0.493
and 3.8, respectively (Froese and Pauly 2009, Fulton and Smith 2004). Diet data were sourced from
735 stomach samples obtained across multiple seasons within the GSV region (Lloyd 2010).

A trophic model for Gulf St Vincent: balancing exploitation of three fisheries 64
Snook
No Snook (Sphyraena novaehollandiae) were caught in the bycatch surveys undertaken in the GSV
fishery, hence the biomass estimates were based on standardised surveys undertaken in the Spencer
Gulf Prawn fishery, using the upper standard error estimate (0.00357 t km-2) (Currie et al. 2009a). P/B
and Q/B estimates were 0.411 and 3.51, respectively (Currie and Sorokin 2010, Fulton and Smith
2004). Diet data were sourced from Caines (2005) and Page et al. (2011) based on 181 stomach
samples.
Barracouta
Biomass estimates of Barracouta (Thyrsites atun) were based on standardised surveys undertaken in
the GSV Prawn fishery, using upper standard error estimate (0.00830 t.km-2) and the calculation
followed the methods of Currie et al. (2009a) and Burnell et al. (2015). P/B and Q/B estimates were
0.411 and 3.64, respectively (Currie and Sorokin 2010, Fulton and Smith 2004). Diet data were
sourced from Caines (2005) and Page et al. (2011) based on 71 stomach samples.
Skipjack Trevally
Skipjack Trevally (Pseudocaranx wrighti) was the most abundant fish caught in the bycatch surveys
for the Gulf St Vincent Prawn fishery. The biomass estimates based on these standardised surveys
using the upper SE estimate was 0.21971 t km-2, using the calculation methods of Currie et al. (2009a)
and Burnell et al. (2015). P/B and Q/B estimates were 0.480 and 4.17, respectively (Currie and
Sorokin 2010, Fulton and Smith 2004). Diet data were sourced from Currie and Sorokin (2010) based
on 42 stomach samples collected from Spencer Gulf.

A trophic model for Gulf St Vincent: balancing exploitation of three fisheries 65
Medium demersal piscivores
The medium demersal piscivore group consists of six main species that primarily consumed fish. This
piscivorous fish group included Small Tooth Flounder (Pseudorhombus jenynsii), Common Stargazer
(Kathetostoma laeve), Tiger Flathead (Platycephalus richardsoni), Red Cod (Pseudophycis bachus),
Tasselled Anglerfish (Rhycherus filamentosus) and an unknown Flathead species (Platycephalus sp.).
These species were grouped due to dietary similarities identified by Currie and Sorokin (2010).
Biomass estimates were based on standardised surveys undertaken in the Gulf St Vincent Prawn
fishery, summing the upper standard error estimate for all species (0.06785 t km-2) using the
calculation methods of Currie et al. (2009a) and Burnell et al. (2015). P/B and Q/B estimates were
0.636 and 1.58 (mean of eight species from Spencer Gulf), respectively (Currie and Sorokin 2010,
Fulton and Smith 2004). Diet data were sourced from Currie and Sorokin (2010) based on 54 stomach
samples collected from Spencer Gulf, weighted for each species in proportion to their estimated
biomass.
Large echinoderm feeding teleosts
This specialist group of fish was identified as one of the smallest fish guilds in Spencer Gulf (Currie
and Sorokin 2010), being represented by two fish species, Blue Morwong (Nemadactylus douglasii)
and Short Boarfish (Parazanclistius hutchinsi). These fish feed almost exclusively on ophiuroids and
echinoids, and were therefore recognised as a discrete guild of echinoderm specialists (Currie and
Sorokin 2010). However, these species were not sampled in the GSV Prawn Fishery surveys, but were
included as a functional group in the model as the species do occur in GSV. Biomass estimates were
therefore based on standardised surveys undertaken in the Spencer Gulf Prawn fishery, summing the
upper SE estimate for each species (0.00703 t km-2) (Currie et al. 2009b, Currie and Sorokin 2010).
P/B and Q/B estimates were 0.625 and 2.34, respectively (Currie and Sorokin 2010, Fulton and Smith
2004). Diet data were sourced from Currie and Sorokin (2010) based on only 3 stomach samples (blue
morwong =1, short boarfish = 2), weighted for each species in proportion to their estimated biomass.

A trophic model for Gulf St Vincent: balancing exploitation of three fisheries 66
Degens/Rough Leatherjackets
Degens Leatherjacket (Thamnaconus degeni) was the next most abundant species after Skipjack
Trevally collected during the trawl surveys in the GSV Prawn Fishery. The Rough Leatherjacket
(Scobinichthys granulatus) in this group was not as abundant. Both species have a wide dietary range,
feeding on crustaceans, algae, molluscs, echinoderms, bryozoans, hydroids, ascidians and annelids
(Currie and Sorokin 2010). Biomass estimates were based on standardised surveys undertaken in the
Gulf St Vincent Prawn fishery, summing the upper standard error estimate for each species (0.12785 t
km-2), calculated using the methods of Currie et al. (2009a) and Burnell et al. (2015). P/B and Q/B
estimates were 0.900 and 2.26, respectively (Currie and Sorokin 2010, Fulton and Smith 2004). Diet
data were sourced from Currie and Sorokin (2010) based on the analyses of 62 stomach samples
(Degens leatherjackets = 27, rough leatherjacket = 35), weighted for each species in proportion to their
estimated biomass.
King George Whiting
King George Whiting (Sillaginodes punctatus) are an important commercially and recreationally
caught species in South Australia. Key estimates of biomass, exploitation rate and recruitment are
available for this species as part of adynamic, spatial age-length structure model (WhiteEst), developed
to facilitate management of this fishery (Fowler et al. 2014, McGarvey and Fowler. 2002). Legal-size
population biomass was used as a starting estimate overall biomass for the GSV region as 0.04568 t
km-2. P/B and Q/B estimates were 0.548 and 2.29, respectively (Currie and Sorokin 2010, Fulton and
Smith 2004). Diet data are limited for this species, and were sourced from Currie and Sorokin (2010)
based on the analysis of 19 stomach samples from Spencer Gulf.
Southern Sea Garfish
Southern Sea Garfish (Hyporhamphus melanochir) are an important commercially and recreationally
caught species in South Australia. Key estimates of biomass, exploitation rate and recruitment are
available for this species as part of dynamic, spatial age-length structure model (GarEst), developed to
facilitate management of this species (McGarvey et al. 2007, Steer et al. 2012). The GarEst model
assesses Garfish catch and effort data broken down into the four gear types (haul-net targeting Garfish,
haul net non-targeting, dab net plus all other gears and recreations). Legal-size (fishable) population
biomass was used as a starting estimate overall biomass for the GSV region as 0.03164 t km-2. P/B and
Q/B estimates were 0.329 and 4.73, respectively (Currie and Sorokin 2010, Fulton and Smith 2004).

A trophic model for Gulf St Vincent: balancing exploitation of three fisheries 67
Diet data were based on the study by Earl et al. (2011), who examined 300 Garfish from Gulf St
Vincent.
Red Mullet
Red Mullet (Upeneichthys vlamingii) was among the more dominant fish sampled during standardised
trawl surveys in the Gulf St Vincent Prawn fishery. Biomass estimates were calculated following the
methods of Currie et al. (2009a) and Burnell et al. (2015), using the upper standard error estimate of
0.02008 t km-2. P/B and Q/B estimates were 0.790 and 4.4, respectively (Currie and Sorokin 2010,
Froese and Pauly 2009). Diet data were sourced from Currie and Sorokin (2010) based on the analysis
of 55 stomach samples collected from Spencer Gulf.
Medium crustacean teleosts
Medium crustacean teleosts are composed of a group of medium sized fishes whose diet is mostly
composed of crustaceans, and include Southern Tongue Sole (Cynoglossus broadhursti), Gurnard
Perch (Neosebastes pandus) and Blue Warehou (Seriolella brama). Biomass estimates were based on
standardised surveys undertaken in the GSV Prawn fishery, summing the upper SE estimate for each
species (0.00849 t km-2), calculated using the methods of Currie et al. (2009a) and Burnell et al.
(2015). P/B and Q/B estimates were 0.546 and 2.97, respectively (Currie and Sorokin 2010, Froese and
Pauly 2009). Diet data were sourced from Currie and Sorokin (2010) based on the analysis of 44
stomach collected from Spencer Gulf, weighted for each species in proportion to their estimated
biomass.
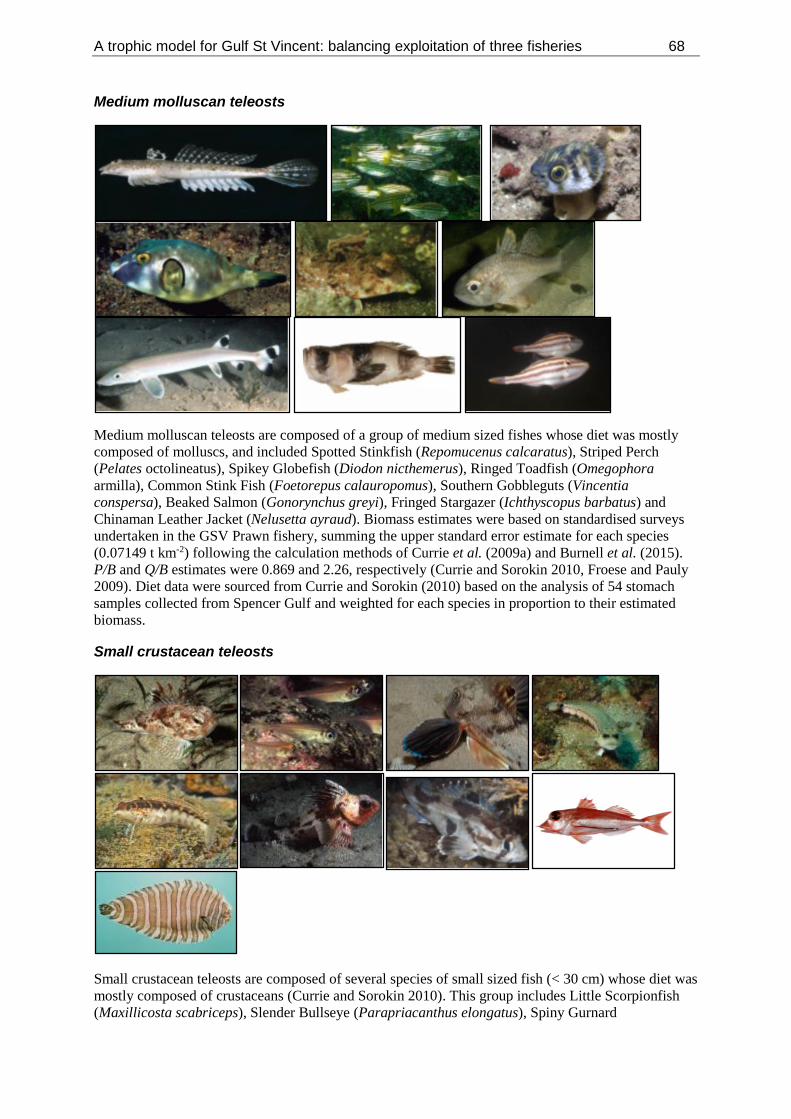
A trophic model for Gulf St Vincent: balancing exploitation of three fisheries 68
Medium molluscan teleosts
Medium molluscan teleosts are composed of a group of medium sized fishes whose diet was mostly
composed of molluscs, and included Spotted Stinkfish (Repomucenus calcaratus), Striped Perch
(Pelates octolineatus), Spikey Globefish (Diodon nicthemerus), Ringed Toadfish (Omegophora
armilla), Common Stink Fish (Foetorepus calauropomus), Southern Gobbleguts (Vincentia
conspersa), Beaked Salmon (Gonorynchus greyi), Fringed Stargazer (Ichthyscopus barbatus) and
Chinaman Leather Jacket (Nelusetta ayraud). Biomass estimates were based on standardised surveys
undertaken in the GSV Prawn fishery, summing the upper standard error estimate for each species
(0.07149 t km-2) following the calculation methods of Currie et al. (2009a) and Burnell et al. (2015).
P/B and Q/B estimates were 0.869 and 2.26, respectively (Currie and Sorokin 2010, Froese and Pauly
2009). Diet data were sourced from Currie and Sorokin (2010) based on the analysis of 54 stomach
samples collected from Spencer Gulf and weighted for each species in proportion to their estimated
biomass.
Small crustacean teleosts
Small crustacean teleosts are composed of several species of small sized fish (< 30 cm) whose diet was
mostly composed of crustaceans (Currie and Sorokin 2010). This group includes Little Scorpionfish
(Maxillicosta scabriceps), Slender Bullseye (Parapriacanthus elongatus), Spiny Gurnard
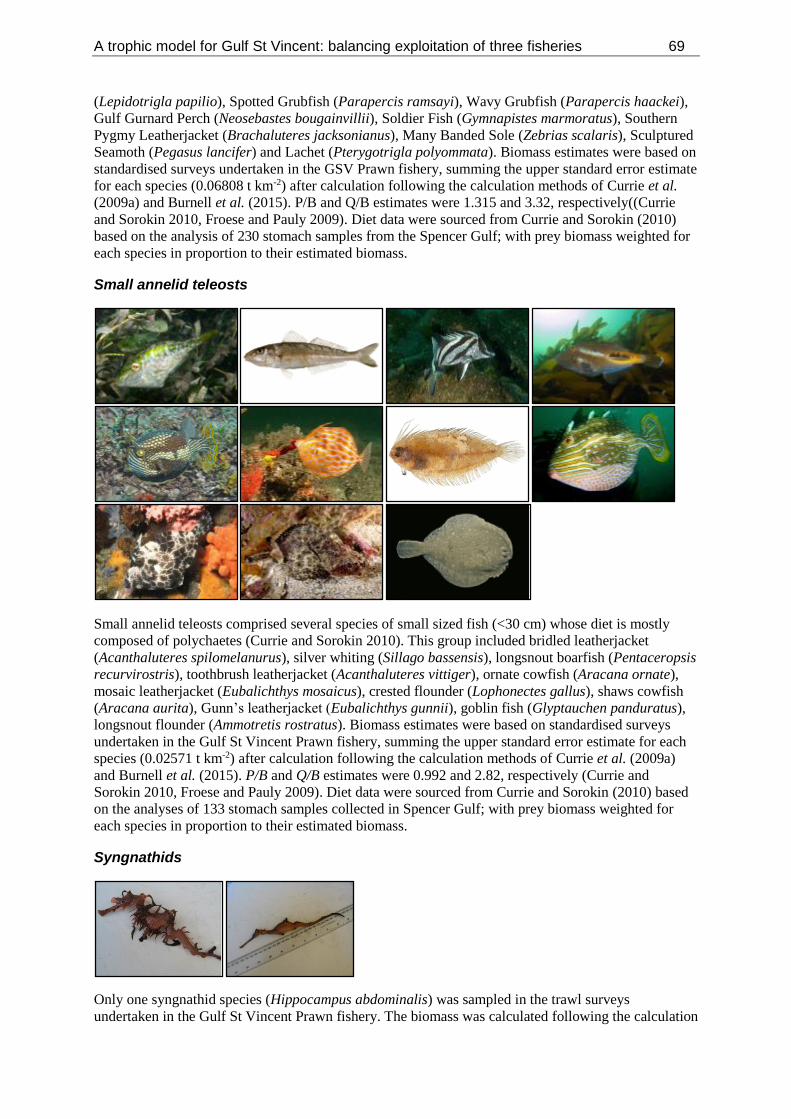
A trophic model for Gulf St Vincent: balancing exploitation of three fisheries 69
(Lepidotrigla papilio), Spotted Grubfish (Parapercis ramsayi), Wavy Grubfish (Parapercis haackei),
Gulf Gurnard Perch (Neosebastes bougainvillii), Soldier Fish (Gymnapistes marmoratus), Southern
Pygmy Leatherjacket (Brachaluteres jacksonianus), Many Banded Sole (Zebrias scalaris), Sculptured
Seamoth (Pegasus lancifer) and Lachet (Pterygotrigla polyommata). Biomass estimates were based on
standardised surveys undertaken in the GSV Prawn fishery, summing the upper standard error estimate
for each species (0.06808 t km-2) after calculation following the calculation methods of Currie et al.
(2009a) and Burnell et al. (2015). P/B and Q/B estimates were 1.315 and 3.32, respectively((Currie
and Sorokin 2010, Froese and Pauly 2009). Diet data were sourced from Currie and Sorokin (2010)
based on the analysis of 230 stomach samples from the Spencer Gulf; with prey biomass weighted for
each species in proportion to their estimated biomass.
Small annelid teleosts
Small annelid teleosts comprised several species of small sized fish (<30 cm) whose diet is mostly
composed of polychaetes (Currie and Sorokin 2010). This group included bridled leatherjacket
(Acanthaluteres spilomelanurus), silver whiting (Sillago bassensis), longsnout boarfish (Pentaceropsis
recurvirostris), toothbrush leatherjacket (Acanthaluteres vittiger), ornate cowfish (Aracana ornate),
mosaic leatherjacket (Eubalichthys mosaicus), crested flounder (Lophonectes gallus), shaws cowfish
(Aracana aurita), Gunn’s leatherjacket (Eubalichthys gunnii), goblin fish (Glyptauchen panduratus),
longsnout flounder (Ammotretis rostratus). Biomass estimates were based on standardised surveys
undertaken in the Gulf St Vincent Prawn fishery, summing the upper standard error estimate for each
species (0.02571 t km-2) after calculation following the calculation methods of Currie et al. (2009a)
and Burnell et al. (2015). P/B and Q/B estimates were 0.992 and 2.82, respectively (Currie and
Sorokin 2010, Froese and Pauly 2009). Diet data were sourced from Currie and Sorokin (2010) based
on the analyses of 133 stomach samples collected in Spencer Gulf; with prey biomass weighted for
each species in proportion to their estimated biomass.
Syngnathids
Only one syngnathid species (Hippocampus abdominalis) was sampled in the trawl surveys
undertaken in the Gulf St Vincent Prawn fishery. The biomass was calculated following the calculation
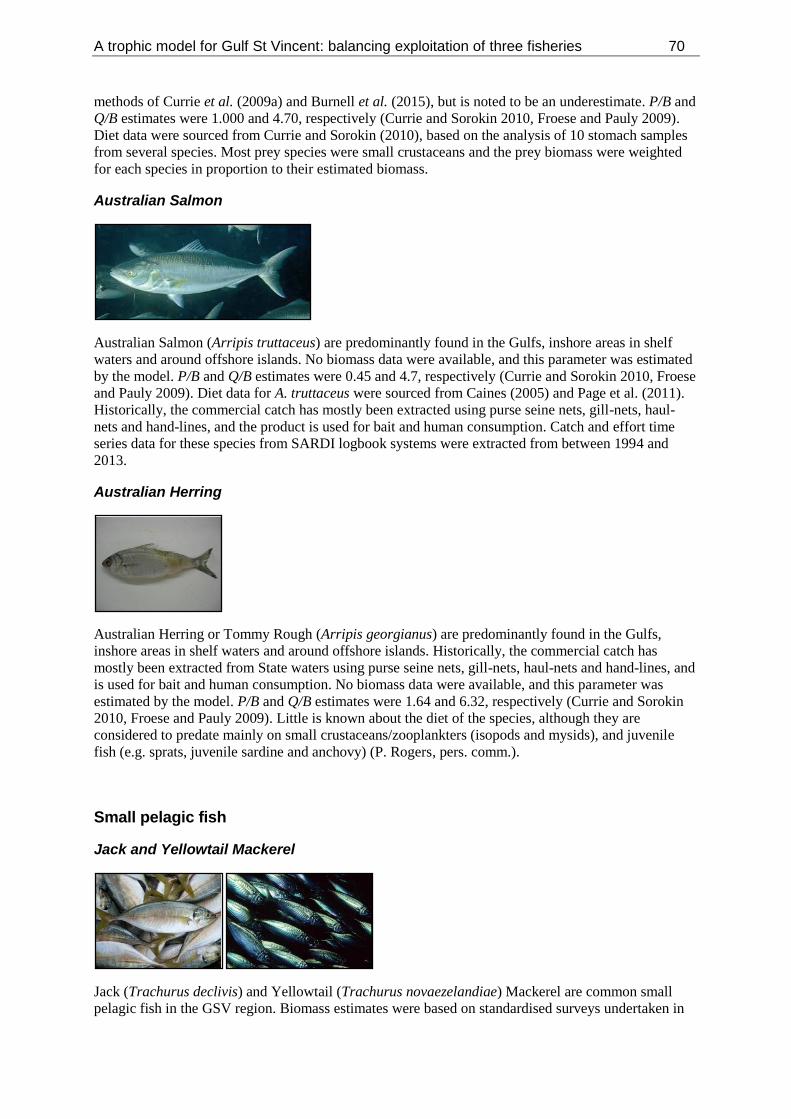
A trophic model for Gulf St Vincent: balancing exploitation of three fisheries 70
methods of Currie et al. (2009a) and Burnell et al. (2015), but is noted to be an underestimate. P/B and
Q/B estimates were 1.000 and 4.70, respectively (Currie and Sorokin 2010, Froese and Pauly 2009).
Diet data were sourced from Currie and Sorokin (2010), based on the analysis of 10 stomach samples
from several species. Most prey species were small crustaceans and the prey biomass were weighted
for each species in proportion to their estimated biomass.
Australian Salmon
Australian Salmon (Arripis truttaceus) are predominantly found in the Gulfs, inshore areas in shelf
waters and around offshore islands. No biomass data were available, and this parameter was estimated
by the model. P/B and Q/B estimates were 0.45 and 4.7, respectively (Currie and Sorokin 2010, Froese
and Pauly 2009). Diet data for A. truttaceus were sourced from Caines (2005) and Page et al. (2011).
Historically, the commercial catch has mostly been extracted using purse seine nets, gill-nets, haul-
nets and hand-lines, and the product is used for bait and human consumption. Catch and effort time
series data for these species from SARDI logbook systems were extracted from between 1994 and
2013.
Australian Herring
Australian Herring or Tommy Rough (Arripis georgianus) are predominantly found in the Gulfs,
inshore areas in shelf waters and around offshore islands. Historically, the commercial catch has
mostly been extracted from State waters using purse seine nets, gill-nets, haul-nets and hand-lines, and
is used for bait and human consumption. No biomass data were available, and this parameter was
estimated by the model. P/B and Q/B estimates were 1.64 and 6.32, respectively (Currie and Sorokin
2010, Froese and Pauly 2009). Little is known about the diet of the species, although they are
considered to predate mainly on small crustaceans/zooplankters (isopods and mysids), and juvenile
fish (e.g. sprats, juvenile sardine and anchovy) (P. Rogers, pers. comm.).
Small pelagic fish
Jack and Yellowtail Mackerel
Jack (Trachurus declivis) and Yellowtail (Trachurus novaezelandiae) Mackerel are common small
pelagic fish in the GSV region. Biomass estimates were based on standardised surveys undertaken in
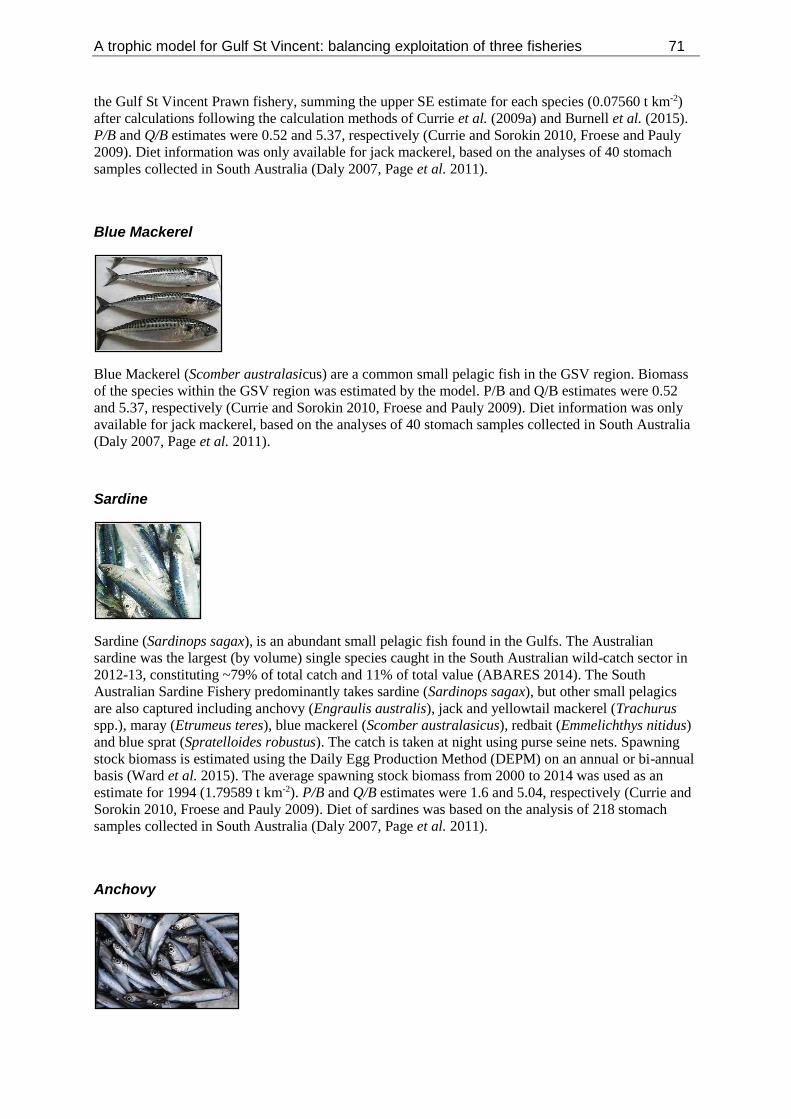
A trophic model for Gulf St Vincent: balancing exploitation of three fisheries 71
the Gulf St Vincent Prawn fishery, summing the upper SE estimate for each species (0.07560 t km-2)
after calculations following the calculation methods of Currie et al. (2009a) and Burnell et al. (2015).
P/B and Q/B estimates were 0.52 and 5.37, respectively (Currie and Sorokin 2010, Froese and Pauly
2009). Diet information was only available for jack mackerel, based on the analyses of 40 stomach
samples collected in South Australia (Daly 2007, Page et al. 2011).
Blue Mackerel
Blue Mackerel (Scomber australasicus) are a common small pelagic fish in the GSV region. Biomass
of the species within the GSV region was estimated by the model. P/B and Q/B estimates were 0.52
and 5.37, respectively (Currie and Sorokin 2010, Froese and Pauly 2009). Diet information was only
available for jack mackerel, based on the analyses of 40 stomach samples collected in South Australia
(Daly 2007, Page et al. 2011).
Sardine
Sardine (Sardinops sagax), is an abundant small pelagic fish found in the Gulfs. The Australian
sardine was the largest (by volume) single species caught in the South Australian wild-catch sector in
2012-13, constituting ~79% of total catch and 11% of total value (ABARES 2014). The South
Australian Sardine Fishery predominantly takes sardine (Sardinops sagax), but other small pelagics
are also captured including anchovy (Engraulis australis), jack and yellowtail mackerel (Trachurus
spp.), maray (Etrumeus teres), blue mackerel (Scomber australasicus), redbait (Emmelichthys nitidus)
and blue sprat (Spratelloides robustus). The catch is taken at night using purse seine nets. Spawning
stock biomass is estimated using the Daily Egg Production Method (DEPM) on an annual or bi-annual
basis (Ward et al. 2015). The average spawning stock biomass from 2000 to 2014 was used as an
estimate for 1994 (1.79589 t km-2). P/B and Q/B estimates were 1.6 and 5.04, respectively (Currie and
Sorokin 2010, Froese and Pauly 2009). Diet of sardines was based on the analysis of 218 stomach
samples collected in South Australia (Daly 2007, Page et al. 2011).
Anchovy

A trophic model for Gulf St Vincent: balancing exploitation of three fisheries 72
Anchovy (Engraulis australis), are an abundant small pelagic fish in the Gulfs. The DEPM based
estimates of anchovy spawning biomass in the SA Gulfs during the 2000 season was 25,374 t
(9561 km-2, survey area), providing a biomass estimate of 0.26535 t km-2 (upper 95% CL) (Dimmlich
et al. 2009). P/B and Q/B estimates were 0.98 and 5.76, respectively (Currie and Sorokin 2010, Froese
and Pauly 2009). Diet information was based on the analysis of 15 stomach samples collected in South
Australia (Daly 2007, Page et al. 2011).
Sprats
The sprat group includes two clupeids, the Sandy Sprat (Hyperlophus vittatus) and the Blue Sprat
(Spratelloides robustus). No biomass data were available; hence this parameter was estimated by the
model. P/B and Q/B estimates were 1.80 and 5.76, respectively (Currie and Sorokin 2010, Froese and
Pauly 2009). Diet information was based on the blue sprat, based on the analyses of 17 stomach
samples from South Australia (Daly 2007, Page et al. 2011).
Cephalopods
The cephalopod group consists of Southern Calarmari, Giant Australian Cuttlefish, ‘other squids’, and
‘octopuses’. All of these groups are commercially harvested. Calarmari (Sepioteuthis australis) and
Giant Australian Cuttlefish (Sepia apama) are targeted in the MSF fishery. P/B and Q/B estimates
typically ranged from 1.95 to 2.5 and from 3.9 to 5.85, respectively (Bulman et al. 2006, Froese and
Pauly 2009). Diet data were sourced from Braley et al. (2010), Bulman et al. (2006), Grubert et al.
(1999) and Page et al. (2011).
Southern Calarmar
Calarmari (Sepioteuthis australis) are a common and commercially harvested cephalopod in the Gulfs.
Biomass estimates were based on standardised surveys undertaken in the Gulf St Vincent Prawn
fishery using the upper SE estimate (0.03613 t.km-2). Calculations followed the methods of Currie et
al. (2009a) and Burnell et al. (2015). P/B and Q/B estimates were 1.83 and 18.25, respectively (Officer
& Parry 1996 in Fulton and Smith 2004). Diet of Calarmari was based on 85 stomachs examined by
both macro and molecular analyses (Roberts 2005, in Page et al. 2011).

A trophic model for Gulf St Vincent: balancing exploitation of three fisheries 73
Giant Australian cuttlefish
Biomass estimates for Giant Australian Cuttlefish (Sepia apama) were based on standardised surveys
undertaken in the Spencer Gulf Prawn fishery (0.02053 t km-2) (Currie et al. 2009b, Currie and
Sorokin 2010) as none were caught in the surveys carried out in GSV. P/B and Q/B estimates were
2.37 and 5.80, respectively (Loneragan et al. 2010). Little is known about the diet of giant Australian
cuttlefish. The literature consistently suggests crustaceans > fish > molluscs and we used a ratio of
7:2:1 (M. Steer, pers. comm.).
Other squids
The other squids group consists of all other remaining squid taxa found in the GSV region. These
included the Nova Cuttlefish (Sepia novaehollandiae), Southern Bottletail Squid (Sepiadarium
austrinum), Striped Pyjama Squid (Sepioloidea lineolata) and Braggi’s Cuttlefish (Sepia braggi).
Biomass estimates for these species were based on standardised surveys undertaken in the Gulf St
Vincent Prawn fishery, with biomass data for all species summed (0.01357 t km-2) following the
calculation methods of Currie et al. (2009a) and Burnell et al. (2015). P/B and Q/B estimates were
1.80 and 17.50, respectively (Loneragan et al. 2010). Diet of this group was based around a study of
Gould’s Squid which analysed the contents of 215 stomachs using both macro and molecular methods
(Braley et al. 2010, Page et al. 2011).
Octopus
The octopus group consists of several species including southern keeled octopus (Octopus berrima),
southern sand octopus (Octopus kaurna) and pale octopus (Octopus pallidus). Biomass estimates for
these species were based on standardised surveys undertaken in the Gulf St Vincent Prawn Fishery,
summing the upper SE estimate for each species (0.01615 t km-2) after calculations following the
methods of Currie et al. (2009a) and Burnell et al. (2015). P/B and Q/B estimates were 2.37 and 7.90,
respectively (Loneragan et al. 2010). Diet was based on Grubert et al. (1999), and studies therein.
Crustaceans
Rock lobster
Southern Rock Lobster (Jasus edwardsii) is a major fishery for South Australia and is fished in GSV
as part of the Northern Zone management region for the fishery. Biomass for 1994 was estimated from
the catch within the GSV (92.6 t) and assuming fishing mortality of 0.3, giving a biomass estimate of
0.05881 t km-2 with a habitat fraction of 0.5. P/B and Q/B estimates were 0.73 and 12.41, respectively
(Fulton and Smith 2004). Diet was based on the study of Hoare (2008).
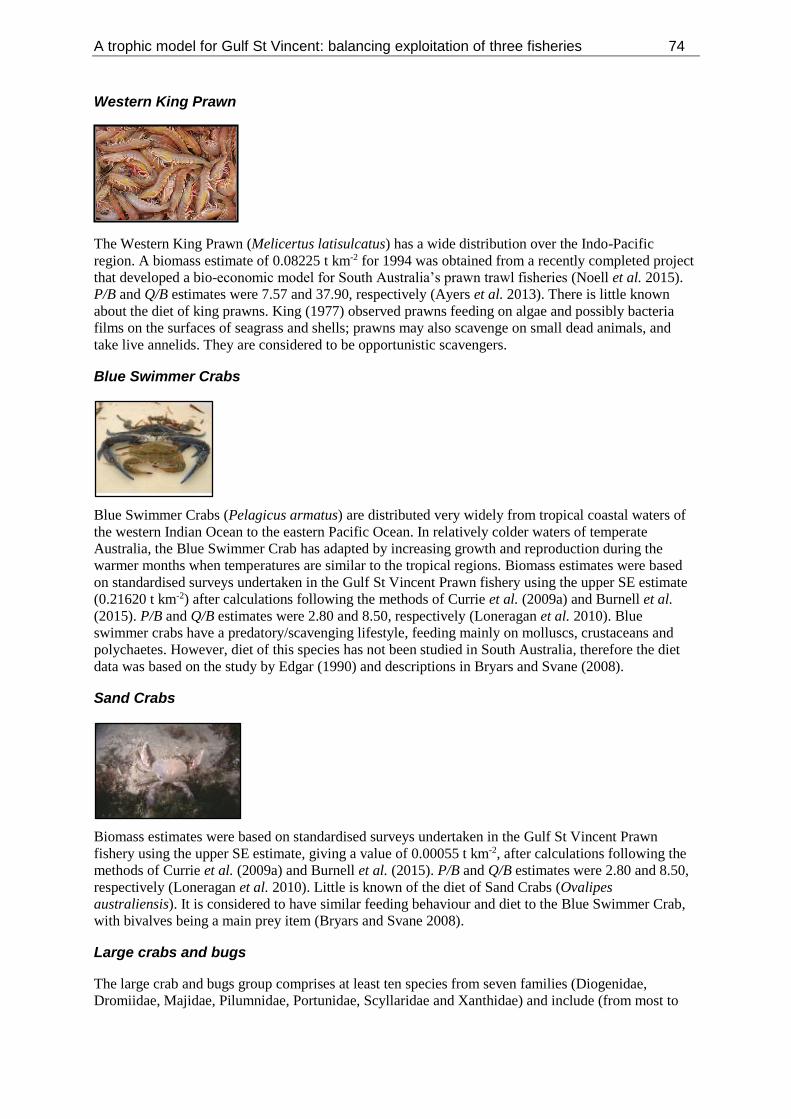
A trophic model for Gulf St Vincent: balancing exploitation of three fisheries 74
Western King Prawn
The Western King Prawn (Melicertus latisulcatus) has a wide distribution over the Indo-Pacific
region. A biomass estimate of 0.08225 t km-2 for 1994 was obtained from a recently completed project
that developed a bio-economic model for South Australia’s prawn trawl fisheries (Noell et al. 2015).
P/B and Q/B estimates were 7.57 and 37.90, respectively (Ayers et al. 2013). There is little known
about the diet of king prawns. King (1977) observed prawns feeding on algae and possibly bacteria
films on the surfaces of seagrass and shells; prawns may also scavenge on small dead animals, and
take live annelids. They are considered to be opportunistic scavengers.
Blue Swimmer Crabs
Blue Swimmer Crabs (Pelagicus armatus) are distributed very widely from tropical coastal waters of
the western Indian Ocean to the eastern Pacific Ocean. In relatively colder waters of temperate
Australia, the Blue Swimmer Crab has adapted by increasing growth and reproduction during the
warmer months when temperatures are similar to the tropical regions. Biomass estimates were based
on standardised surveys undertaken in the Gulf St Vincent Prawn fishery using the upper SE estimate
(0.21620 t km-2) after calculations following the methods of Currie et al. (2009a) and Burnell et al.
(2015). P/B and Q/B estimates were 2.80 and 8.50, respectively (Loneragan et al. 2010). Blue
swimmer crabs have a predatory/scavenging lifestyle, feeding mainly on molluscs, crustaceans and
polychaetes. However, diet of this species has not been studied in South Australia, therefore the diet
data was based on the study by Edgar (1990) and descriptions in Bryars and Svane (2008).
Sand Crabs
Biomass estimates were based on standardised surveys undertaken in the Gulf St Vincent Prawn
fishery using the upper SE estimate, giving a value of 0.00055 t km-2, after calculations following the
methods of Currie et al. (2009a) and Burnell et al. (2015). P/B and Q/B estimates were 2.80 and 8.50,
respectively (Loneragan et al. 2010). Little is known of the diet of Sand Crabs (Ovalipes
australiensis). It is considered to have similar feeding behaviour and diet to the Blue Swimmer Crab,
with bivalves being a main prey item (Bryars and Svane 2008).
Large crabs and bugs
The large crab and bugs group comprises at least ten species from seven families (Diogenidae,
Dromiidae, Majidae, Pilumnidae, Portunidae, Scyllaridae and Xanthidae) and include (from most to

A trophic model for Gulf St Vincent: balancing exploitation of three fisheries 75
least biomass contribution) the Balmain Bug (Ibacus peroneii), Giant Spider Crab (Leptomithraz
gaimardii), Common Hermit Crab (Paguristes frontalis), Bristled Sponge Crab (Austrodromidia
octodentata), Facetted Crab (Actaea calculosa), Shaggy Sponge Crab (Lamarckdromia globosa),
Hairy Shore Crab (Pilumnus sp.), Rock Crab (Nectocarcinus integrifrons) and Southern Sponge Crab
(Austrodromidia australis). Biomass estimates for these species were based on standardised surveys
undertaken in the Gulf St Vincent Prawn fishery, with the upper SE biomass data for all species
combined (0.01615 t km-2), after calculations following the methods of Currie et al. (2009a) and
Burnell et al. (2015). P/B and Q/B estimates were 2.80 and 8.5, respectively (Loneragan et al. 2010).
Diet was based on that detailed for large crabs in an Ecopath model developed for Jurien Bay, WA
(Loneragan et al. 2010).
Sand associated omnivorous crustaceans
Sand associated omnivorous (SAO) crustaceans were loosely based on the Jurien Bay Ecopath model
(Loneragan et al. 2010). This group consisted of smaller crab species, strawberry prawns (Pandalidae)
and shrimps. Biomass estimates for these crustaceans were based on standardised surveys undertaken
in the GSV Prawn fishery, with the upper SE biomass data for all species combined (0.00864 t km-2),
after calculations following the methods of Currie et al. (2009a) and Burnell et al. (2015) P/B, Q/B and
EE estimates were 0.79, 11.30 and 0.87, respectively (Loneragan et al. 2010). Diet was also based on
Loneragan et al. (2010).
Herbivorous macrobenthos
Herbivorous macrobenthos included several species of echinoderms (seastars, sea urchins and
holothurians) and molluscs (chitons, sea slugs, gastropods and nudibranchs). The biomass estimate for
this group was based on standardised surveys undertaken in the GSV Prawn fishery, by summing the
upper standard error biomass of all species (0.04353 t km-2), after calculations following the methods
of Currie et al. (2009a) and Burnell et al. (2015). P/B and Q/B estimates were 2.80 and 14.00
respectively (Loneragan et al. 2010). Diet was based on the reef associated herbivore diet detailed in
Loneragan et al. (2010), from the Jurien Bay Ecopath model.
Sand zoobenthos feeders
Sand zoobenthos feeders comprised a broad group of bivalves including cockles (Acrosterigma
cygnorum), commercial scallops (Pecten fumatus), doughboy scallop (Mimachlamys asperrima),
queen scallop (Equichlamys bifrons), grooved cardita (Cardita incrassiata), lima lima (Lima vulgaris)
razor fish (Atrina (Servatrina) tasmanica), rock shell (Cleidothaerus albidus), mud oyster (Ostrea
angasi) and southern hammer oyster (Malleus meridianus). Biomass estimate for this group was based
on standardised surveys undertaken in the Gulf St Vincent Prawn fishery, by summing the upper
standard error biomass of all species (0.01135 t km-2), after calculations following the methods of
Currie et al. (2009a) and Burnell et al. (2015) P/B and Q/B estimates were 0.65 and 7.50 respectively
(Loneragan et al. 2010). Diet was based on sand associated zoobenthos feeder diet detailed in
Loneragan et al. (2010) from the Jurien Bay Ecopath Model.
Abalone Five species of abalone occur in the GSV region, the Greenlip (Haliotis laevigata), Blacklip Abalone
(H. rubra), Roe’s Abalone (H. roei), H. scalaris and H. cyclobates. Greenlip and Blacklip abalone are
the two major commercial species taken in SA. The fishery in GSV falls into the Central Zone
management region for the fishery.
Greenlip abalone No biomass estimate was available for this group. P/B, Q/B and EE estimates were 0.73, 12.41 and
0.90, respectively (Fulton and Smith 2004). Greenlip abalone are estimated to consume 70% red algae,
11% brown algae, 15% seagrass and 4% detritus and browsed organic matter, based on diet studies at
Tipara Reef, Spencer Gulf (Shepherd 1972).

A trophic model for Gulf St Vincent: balancing exploitation of three fisheries 76
Blacklip abalone No biomass estimates were available for this group. P/B, Q/B and EE estimates were 0.73, 12.41 and
0.90, respectively (Fulton and Smith 2004). Blacklip abalone are estimated to consume 55% red algae,
7% brown algae, 34% seagrass and 5% detritus and browsed organic matter, based on diet studies at
Tipara Reef, Spencer Gulf (Shepherd 1972).
Small mobile crustaceans – deposit detritovore feeders Biomass estimates for the small mobile crustacean (deposit detritovore feeders, DDF), which included
small crustaceans such as snapping shrimps (Alpheus villosus), pistol shrimp (Alpheus lottini), mantis
shrimp (Erugosquilla graham) and long-writes shrimp (Processa gracilis), were based on standardised
surveys undertaken in the GSV Prawn fishery. The upper standard error biomass of all species were
combined (0.00235 t km-2), after calculations following the methods of Currie et al. (2009a) and
Burnell et al. (2015). P/B and Q/B estimates were 7.01 and 27.14 respectively (Loneragan et al. 2010).
Diet information was based on deposit feeding invertebrates detailed in Loneragan et al. (2010) from
the Jurien Bay Ecopath Model.
Small mobile crustacean zooplankton feeders (ZF) This group was based on combined inshore pelagic zooplankton feeders and reef associated
zooplankton feeders in Jurien Bay, detailed in Loneragan et al. (2010). It includes taxa such as krill
(Nyctiphanes australis), Gammaridea and Photidea amphipods, copepods and ostracods. No biomass
estimates were available for this group. P/B, Q/B and EE estimates were 1.12, 9.50 and 0.9,
respectively (Loneragan et al. 2010). Diet was based on combined inshore pelagic zooplankton
feeders and reef associated zooplankton feeders diet information detailed in the Jurien Bay Ecopath
model (Loneragan et al. 2010).
Polychaetes – deposit detritovore feeders This group comprise deposit detritovore feeding polychaetes which can include trumpet worms
(Pectinariidae), bobbit worms (Eunicidae), sea mice (Aphroditidae), rag worms (Nereidae), spaghetti
worms (Terebellidae), Capitellidae, Cirratulidae, peanut worms (Sipuncula), spoon worms
(Echiuroidea), Oligochaeta, horse-shoe worms (Phoronid) and acorn worms (Hemichordata). Biomass
estimate was based on standardised surveys undertaken in the GSV Prawn fishery, using the combined
upper SE biomass of all species (0.00240 t km-2), after calculations following the methods of Currie et
al. (2009a) and Burnell et al. (2015). P/B and Q/B estimates were 1.60 and 6.00 respectively (Bulman
et al. 2006). Diet was based on Mackinson and Daskalov (2008).
Sessile epifauna – zooplankton feeders This group consist of zooplankton/phytoplankton feeding sessile epifauna, including various species of
ascidians (Pyura gibbosa, Ascidia sydneiensis, Herdmania momus, Polycarpa pedunculata,
Trididemnum cerebriforme), bryozoans (Celleporaria fusca, Adeona grisea, Steginoporella chartacea,
Triphyllozoon moniliferum), Goose Barnacle (Pedunculata), hydroids, molluscs such as Hairy Mussel
(Trichomya hirsute), octocorals (Carijoa multiflora), Sea Pen (Sarcoptilus grandis) and Porifera. The
biomass estimate was based on standardised surveys undertaken in the GSV Prawn Fishery, using the
combined upper SE biomass of all species (0.95748 t km-2), after calculations following the methods
of Currie et al. (2009a) and Burnell et al. (2015). P/B and Q/B estimates were 2.80 and 11.80
respectively (Fulton and Smith 2004). Diet was based on Mackinson and Daskalov 2008).
Gelatinous zooplankton Gelatinous zooplankton consisted of all the jellies, salps and ctenophores. Very little is known about
the taxa within these groups. The biomass estimate was based on the SGE Ecopath model (Gillanders
et al. 2015) while estimates of P/B (16.50) and Q/B (80.00) were based on those used for the Jurien
Bay Ecopath model (Loneragan et al. 2010). Diet was based on Mackinson and Daskalov (2008).
Large zooplankton (carnivores) The large zooplankton group consisted of krill (Nyctiphanes), copepods and amphipods. A biomass
estimate of 0.63158 t km-2 was based on values reported for GSV in (2008, 2012). Estimates of P/B

A trophic model for Gulf St Vincent: balancing exploitation of three fisheries 77
and Q/B were 5.0 and 32.0 from Bulman et al. (2006) that were originally derived from studies in the
Northern Hemisphere (Guenette and Morato 2002). Diet was based on Mackinson & Daskalov (2008).
Small zooplankton (herbivores) Small zooplankton comprised copepods, pteropods and ostracods. Biomass was estimated based on
values reported for GSV (0.16842 t km-2) in van Ruth (2008, 2012). Estimates of P/B and Q/B were
29.5 and 55.0, and were based on those used for the Jurien Bay Ecopath model (Loneragan et al.
2010). Diet was based on Mackinson and Daskalov (2008).
Meiofauna Meiofauna include small benthic organisms that live in sediments, loosely defined as a group of
organisms by their size (larger than microfauna but smaller than macrofauna) generally able to pass
through a 1 mm mesh but retained on a 45 μm mesh (Mackinson and Daskalov 2008). They include a
variety of taxa such as nematodes, harpacticoid copepods, tubellarians, polychaetes, oligochaetes,
ostracods, tardigrades, isopods, gastrotrichs, and kinorhynchs. Estimates of P/B, Q/B and EE were
35.00, 125.00 and 0.99, respectively, from Mackinson & Daskalov (2008). Diet was also based on
Mackinson and Daskalov (2008).
Primary Producers
Phytoplankton Estimates of phytoplankton biomass and primary productivity (P/B) in GSV were based on values
reported in van Ruth (2008, 2012). Phytoplankton biomass was estimated to be 7.2 t km-2, while
primary productivity (P/B) was estimated to be 114.2.
Macroalgae and Seagrass Macroalgae biomass in GSV (1675.3 t km-2) was calculated using the dry weight estimated for the
SGE Ecopath model and converted to wet weight using macroalgae moisture content of 77% (SARDI,
unpublished data) and the habitat area estimate from Department for Environment and Heritage
(2008).
Biomass estimate for seagrass in GSV (3306.3 t km-2) was calculated using the dry weights reported in
Nayar (2012) and converted to wet weight using seagrass moisture content of 67% (Nayar et al. 2009)
and the habitat area reported in Department for Environment and Heritage (2008). P/B was then
estimated from this biomass and the production value from the SGE Ecopath model (Gillanders et al.
2015).
Microflora A large part of primary production flows through the pool of dissolved organic matter (DOM), either
after excretion by phytoplankton or through the lysis of ungrazed cells. This part of primary
production is not available to herbivorous zooplankton and is mainly used by bacteria and
auto/heterotrophic nanoflagellates that form a link between dissolved primary production and higher
trophic levels (Mackinson and Daskalov 2008). The role of bacteria and auto/heterotrophic
nanoflagellates in GSV was based on that developed for the North Sea by Mackinson & Daskalov
(2008). Essentially, organic matter produced from phytoplankton is aportioned between three-
concurrent pathways: 1) direct grazing by zooplankton; 2) incorporated into the microbial loop and 3)
sedimentation and incorporation into benthic food chains. Characterisation of these pathways and the
microbial loop in the GSV model was achieved and simplified by including heterotrophic flagellates
(which prey on bacteria) and bacteria included in the same group, and enabling the group to feed on
itself to represent flagellate-bacteria dynamics levels (Mackinson and Daskalov 2008). Importantly,
this group and the dynamic it represents captures its role in utilising the primary production of
phytoplankton from lysis and excretion that is not consumed by zooplankton (and higher trophic
levels), representing the process of remineralisation where energy is fed back into the system to
support production of higher trophic levels through the microbial loop (Mackinson and Daskalov
2008). In addition, by having two detritus groups (dissolved organic matter, DOM; and particulate
organic matter, POM) in the water column (DOM) and as sediment (POM), respectively, these two

A trophic model for Gulf St Vincent: balancing exploitation of three fisheries 78
groups enable plankton and benthic bacteria to utilise their respective sources of organic matter. In the
planktonic pathway, phytoplankton derived organic matter to be used by planktonic microflora are
then eaten by zooplankton; whereas in the benthic pathway, dead ungrazed phytoplankton are used by
benthic microflora that are then grazed by meiofauna and benthic microfauna (Mackinson and
Daskalov 2008). Details on key parameters for each group are detailed below.
Benthic microflora As there were no data for biomass of benthic microflora in GSV, the estimate was based on the value
estimated for the SGE Ecopath model, 0.5 t km-2 (Gillanders et al. 2015). Estimates of P/B and Q/B
were 29,200 and 18,940, respectively, from Mackinson & Daskalov (2008). Diet was also based on
Mackinson & Daskalov (2008).
Planktonic microflora Estimates of P/B, Q/B and EE were 571, 1142 and 0.99, respectively, from Mackinson & Daskalov
(2008), similarly for the diet data.
Detritus
Four sources of detritus were estimated in the model, that from dissolved organic matter (DOM),
particulate organic matter (POM), and fishery discard.
Detritus – DOM in water column As no data were available for the biomass of DOM in the water column for GSV, biomass was based
on the value estimated for the SGE Ecopath model, 20.4 t km-2 (Gillanders et al. 2015).
Detritus – POM in sediment The biomass of POM in the sediment was based on the calculation used for the SGE Ecopath model
(Gillanders et al. 2015). Lauer et al. (2007) showed that ~2.7% of sediment organic carbon was
microphytobenthos. Assuming the remaining fraction is benthic detritus (benthic POM), then POM
biomass is 18.5 t km-2.
Discards Discards were calculated as the total fishery discards 0.10490 t km-2.

A trophic model for Gulf St Vincent: balancing exploitation of three fisheries 79
Appendix 3. Diet matrix Gulf St Vincent Ecosystem model Group name Group 1 2 3 4 5 6 7 8 9 10 11 12 13 14 15 16
Australian Sea Lion 1 0.1267
Long-Nosed Fur Seal 2 0.1267
Bottlenose Dolphin 3 0.1569 0.0001
Common Dolphin 4 0.0169 0.0001
Petrel 5 0.0030 0.0100
Australian Gannet 6
Little Penguin 7 0.0010 0.0020 0.0064
Shags & Cormorants 8
Terns 9 0.0001
Gulls 10
White Shark 11
Whaler Shark 12 0.0735
Smooth Hammerhead 13 0.1152
Common Thresher Shark 14 0.0735
Gummy Shark 15 0.0735
School Shark 16 0.0735
Port Jackson Shark 17 0.0208
Other Demersal Shark 18 0.0025 0.0009
Ray & Skate 19 0.0042 0.0534
Southern Bluefin Tuna 20 0.0134 0.0059
Yellowtail Kingfish 21 0.0134 0.0059
Snapper 22 0.0019 0.0134 0.0710 0.0164
Snook 23 0.0134 0.0111
Barracouta 24 0.0005 0.0069 0.0059 0.3775 0.0571 0.2767
Skipjack Trevally 25 0.0087 0.0637 0.0075 0.0005
Medium piscivore fish 26 0.0427 0.0165 0.0118 0.0070 0.0200 0.1004 0.0130
Medium echinoderm fish 27
Australian Salmon 28 0.0020 0.0013 0.0170 0.0001 0.0200 0.0249 0.0134 0.0059
Australian Herring 29 0.0079 0.0086 0.0009 0.0147 0.0313 0.0719
King George Whiting 30 0.0010 0.0010 0.0065 0.0780 0.0059
Garfish 31 0.0016 0.0030 0.0001 0.1000 0.0500 0.0431 0.0489 0.0067 0.0106 0.0051
Red Mullet 32 0.0151 0.0575 0.0862 0.0007 0.0112 0.0036
Silverbelly 33 0.0161 0.0072 0.0140 0.0019 0.0011 0.0862 0.0006 0.0093
Medium crustacean fish 34 0.0962 0.0442 0.0201 0.0139 0.2755 0.0263 0.0033 0.0001 0.2000
Medium molluscan fish 35 0.0448 0.0300 0.0010 0.1561 0.0056
Small crustacean fish 36 0.0024 0.1006 0.2357 0.0209 0.1202 0.1079 0.0357 0.0060 0.0009

A trophic model for Gulf St Vincent: balancing exploitation of three fisheries 80
Group name Group 1 2 3 4 5 6 7 8 9 10 11 12 13 14 15 16
Degens/Rough Leatherjacket 37 0.0727 0.2155 0.1294 0.2956 0.0002
Small polychaete feeding fish 38 0.0684 0.0051 0.0436 0.0043 0.0862 0.0571 0.0039 0.0138 0.0165
Syngnathids 39 0.0022 0.0014 0.0020
Blue Mackerel 40 0.0004 0.0032 0.0007 0.1100 0.0043 0.0318
Jack/Yellowtail Mackerel 41 0.0080 0.1042 0.0153 0.1140 0.0134 0.0016 0.0620 0.0012 0.2000
Sardine 42 0.0223 0.0209 0.3825 0.0014 0.1600 0.0429 0.2444 0.0355 0.2353 0.1712
Anchovy 43 0.0019 0.2516 0.0177 0.0900 0.7407 0.0188 0.3072 0.0011 0.0073 0.7556 0.2000
Sprats 44 0.0063 0.0007 0.0075 0.0086 0.0755 0.0009 0.0006
Fish larvae 45
Southern Calamari 46 0.1465 0.0010 0.1337 0.0604 0.0200 0.0037 0.0009 0.0322 0.0943 0.3071 0.2000
Giant Australian Cuttlefish 47 0.1817 0.0001 0.2004 0.0249 0.0001 0.0215 0.0322 0.0767 0.1307
Other squids 48 0.0532 0.1901 0.0004 0.0124 0.0088 0.0200 0.0225 0.0022 0.0019 0.0520 0.1593
Octopus 49 0.2900 0.0115 0.2849 0.0029 0.0047 0.0322 0.0715 0.2000 0.2000
Rock lobster 50 0.0200
Western King Prawn 51 0.0036 0.0011 0.0029 0.0010 0.0179 0.2500
Blue Swimmer Crab 52 0.0039 0.2500
Sand Crab 53
Other large crabs/bugs 54 0.0039 0.0018 0.0009 0.3000
Sand associated omnivore crustacean 55 0.0136 0.0001 0.0000 0.0078 0.0001 0.0115
Herbivorous macrobenthos 56 0.0024 0.0353
Sand zoobenthos feeder 57 0.0505
Greenlip Abalone 58
Blacklip Abalone 59
Small mobile DDF crustacean 60 0.0001
Small mobile ZF crustacean 61 0.1216
Polychates DDF 62
Sessile epifauna 63 0.0039 0.0039
Gelatinous zooplankton 64
Large carnivorous zooplankton 65
Small herbivorous zooplankton 66
Meiofauna 67
Microphytobenthos 68
Planktonic microflora 69
Macroalgae 70
Seagrass 71 0.0879
Phytoplankton 72
Detritus DOM water column 73
Detritus POM sediment 74
Discards 75 0.0127
Import 0.4000 0.8160 0.2274

A trophic model for Gulf St Vincent: balancing exploitation of three fisheries 81
Group name Group 17 18 19 20 21 22 23 24 25 26 27 28 29 30 31 32 33
Australian Sea Lion 1
Long-Nosed Fur Seal 2
Bottlenose Dolphin 3
Common Dolphin 4
Petrel 5
Australian Gannet 6
Little Penguin 7
Shags & Cormorants 8
Terns 9
Gulls 10
White Shark 11
Whaler Shark 12
Smooth Hammerhead 13
Common Thresher Shark 14
Gummy Shark 15
School Shark 16
Port Jackson Shark 17
Other demersal shark 18 0.0005
Ray & skate 19
Southern Bluefin Tuna 20
Yellowtail Kingfish 21
Snapper 22 0.0000
Snook 23
Barracouta 24 0.0010
Skipjack Trevally 25 0.2050
Medium piscivore fish 26 0.0048 0.0193
Medium echinoderm fish 27
Australian Salmon 28 0.0046 0.0118
Australian Herring 29 0.0174 0.1061 0.1056
King George Whiting 30 0.0200 0.0290
Garfish 31 0.0200 0.0004 0.0010
Red Mullet 32 0.0200 0.0027
Silverbelly 33 0.0200 0.0624
Medium crustacean fish 34 0.0040 0.0200 0.0006 0.0110
Medium molluscan fish 35 0.0040 0.0500 0.0660 0.0643
Small crustacean fish 36 0.0040 0.1033 0.0469 0.5189 0.0277 0.0416 0.0147

A trophic model for Gulf St Vincent: balancing exploitation of three fisheries 82
Group name Group 17 18 19 20 21 22 23 24 25 26 27 28 29 30 31 32 33
Degens/Rough Leatherjacket 37 0.0700 0.0067
Small polychaete fish 38 0.0023 0.0400 0.0078 0.2959
Syngnathids 39 0.0200 0.0001
Blue Mackerel 40 0.0041 0.0694 0.0785 0.1040
Jack/Yellowtail Mackerel 41 0.0196 0.1640 0.0002 0.0926 0.3329 0.0832
Sardine 42 0.2292 0.0752 0.0085 0.2689 0.5505 0.1768 0.0800
Anchovy 43 0.1316 0.1387 0.0965 0.3573 0.0800
Sprats 44 0.0183 0.0002 0.0900
Fish larvae 45
Southern Calarmari 46 0.2015 0.0041 0.0210
Giant Australian Cuttlefish 47 0.0003 0.0110 0.0127
Other squids 48 0.0731 0.0916 0.4470 0.0144 0.0723 0.1820 0.0183 0.0038
Octopus 49 0.0119 0.0095
Rock Lobster 50 0.0003
Western King Prawn 51 0.1048 0.1315 0.0107 0.0868 0.0037
Blue Swimmer Crab 52 0.2345
Sand Crab 53 0.0403 0.0033
Other large crabs/bugs 54 0.1829 0.0339 0.0408 0.1031
Sand associated omnivore crustacean 55 0.2834 0.2825 0.0897 0.0237 0.3529 0.0577 0.3500 0.0111 0.5302 0.0150
Herbivorous macrobenthos 56 0.0023 0.0685 0.9977 0.0371
Sand zoobenthos feeder 57 0.0602 0.0456 0.0222 0.0106
Greenlip Abalone 58
Blacklip Abalone 59
Small mobile DDF crustacean 60 0.1209 0.0368 0.0414 0.1538 0.0036 0.4000 0.0865 0.0078
Small mobile ZF crustacean 61 0.0488 0.0013 0.1584 0.0017 0.0023 0.0012 0.2870 0.1768 0.0247
Polychaetes DDF 62 0.1474 0.0381 0.8220 0.0212 0.3349 0.0161 0.8345 0.1337 0.1752 0.8879
Sessile epifauna 63 0.0957 0.0184 0.0247
Gelatinous zooplankton 64
Large carnivorous zooplankton 65
Small herbivorous zooplankton 66
Meiofauna 67
Microphytobenthos 68
Planktonic microflora 69
Macroalgae 70 0.0002 0.0159 0.0010 0.0007
Seagrass 71 0.0886 0.0028 0.0037 0.0001 0.5699
Phytoplankton 72
Detritus DOM water column 73
Detritus POM sediment 74
Discards 75
Import 0.5000 0.0016

A trophic model for Gulf St Vincent: balancing exploitation of three fisheries 83
Group name Group 34 35 36 37 38 39 40 41 42 43 44 45 46 47 48 49
Australian Sea Lion 1
Long-Nosed Fur Seal 2
Bottlenose Dolphin 3
Common Dolphin 4
Petrel 5
Australian Gannet 6
Little Penguin 7
Shags & Cormorants 8
Terns 9
Gulls 10
White Shark 11
Whaler Shark 12
Smooth Hammerhead 13
Common Thresher Shark 14
Gummy Shark 15
School Shark 16
Port Jackson Shark 17
Other demersal shark 18
Ray & skate 19
Southern Bluefin Tuna 20
Yellowtail Kingfish 21
Snapper 22 0.0150
Snook 23 0.0025
Barracouta 24 0.0255
Skipjack Trevally 25 0.0150
Medium piscivore fish 26 0.1009 0.0033
Medium echinoderm fish 27 0.0025
Australian Salmon 28 0.1070 0.0085
Australian Herring 29 0.0200
King George Whiting 30
Garfish 31 0.0010 0.0005
Red Mullet 32 0.0124
Silverbelly 33 0.0015 0.0500
Medium crustacean fish 34
Medium molluscan fish 35
Small crustacean fish 36 0.0982 0.0510 0.1000 0.0085 0.1500

A trophic model for Gulf St Vincent: balancing exploitation of three fisheries 84
Group name Group 34 35 36 37 38 39 40 41 42 43 44 45 46 47 48 49
Degens/Rough Leatherjacket 37 0.1959
Small polychaete fish 38 0.0038 0.0143 0.1000 0.0010
Syngnathids 39 0.0051
Blue Mackerel 40 0.0600
Jack/Yellowtail Mackerel 41 0.4016 0.1002
Sardine 42 0.0510 0.0400
Anchovy 43 0.1142 0.0100
Sprats 44 0.0510
Fish Larvae 45 0.1875 0.0241 0.0161 0.0678
Southern Calarmari 46 0.0109
Giant Australian Cuttlefish 47 0.0070 0.0092 0.0500
Other squids 48 0.0008 0.0024 0.0006 0.0051 0.0050
Octopus 49 0.0494 0.0002 0.0163
Rock Lobster 50
Western King Prawn 51 0.3936 0.0354 0.1000 0.0100
Blue Swimmer Crab 52 0.1196 0.1500
Sand crab 53 0.1500 0.0100
Other large crabs/bugs 54 0.0110 0.2068 0.0113 0.1500 0.0100
Sand associated omnivore crustacean 55 0.1558 0.1403 0.4351 0.0485 0.0478 0.6127 0.1490 0.1168 0.2837 0.4719 0.8650 0.0866 0.1500 0.0844 0.6500
Herbivorous macrobenthos 56 0.0030 0.1917 0.0055 0.0635 0.0454
Sand zoobenthos feeder 57 0.4416 0.0068 0.0221 0.0140 0.0237 0.0062 0.0048 0.1000 0.0012 0.1000
Greenlip Abalone 58
Blacklip Abalone 59
Small mobile DDF crustacean 60 0.0249 0.0380 0.1488 0.1658 0.0408 0.1960
Small mobile ZF crustacean 61 0.0580 0.0339 0.0632 0.0553 0.1486 0.1652 0.6178 0.7260 0.6641 0.4604 0.2920
Polychaetes DDF 62 0.0210 0.0786 0.0567 0.1041 0.2855 0.1136 0.0000 0.0453
Sessile epifauna 63 0.0552 0.0387 0.0309 0.2460 0.1108 0.0024
Gelatinous zooplankton 64 0.0062 0.0132 0.0290
Large carnivorous zooplankton 65
Small herbivorous zooplankton 66 0.8000
Meiofauna 67
Microphytobenthos 68
Planktonic microflora 69
Macroalgae 70 0.0025 0.0193 0.0053 0.2718 0.2624 0.0237 0.1350
Seagrass 71 0.0019 0.0084 0.0011 0.0229 0.0334 0.0000 0.0158 0.0000 0.0023
Phytoplankton 72 0.2000
Detritus DOM water column 73
Detritus POM sediment 74
Discards 75
Import

A trophic model for Gulf St Vincent: balancing exploitation of three fisheries 85
Group name Group 50 51 52 53 54 55 56 57 58 59 60 61 62 63 64 65
Degens/Rough leatherjacket 37
Small polychaete fish 38
Syngnathids 39
Blue Mackerel 40
Jack/Yellowtail Mackerel 41
Sardine 42
Anchovy 43
Sprats 44
Fish larvae 45 0.2570
Southern Calarmari 46
Giant Australian Cuttlefish 47
Other squids 48
Octopus 49
Rock Lobster 50
Western King Prawn 51
Blue Swimmer Crab 52 0.0025
Sand Crab 53 0.0075
Other large crabs/bugs 54 0.1800 0.0010
Sand associated omnivore crustacean 55 0.2393 0.1000 0.1500
Herbivorous macrobenthos 56 0.3742 0.0500 0.0300 0.0010 0.1000
Sand zoobenthos feeder 57 0.1700 0.2500 0.0011 0.2000
Greenlip Abalone 58
Blacklip Abalone 59 0.0123
Small mobile DDF crustacean 60 0.1000 0.1000 0.0100
Small mobile ZF crustacean 61 0.0050 0.2280
Polychaetes DDF 62 0.1000 0.2500 0.2000 0.0500
Sessile epifauna 63
Gelatinous zooplankton 64
Large carnivorous zooplankton 65 0.6100
Small herbivorous zooplankton 66 0.1000 0.2570 0.8000
Meiofauna 67 0.1000 0.0200 0.1000 0.1000
Microphytobenthos 68 0.1000 0.0061 0.0510 0.5000 0.1500 0.5440 0.2900 0.5500 0.1500
Planktonic microflora 69 0.0500 0.6000 0.1290 0.2000
Macroalgae 70 0.3742 0.5000 0.0800 0.0600 0.1630 0.3000 0.5000 0.8100 0.6200 0.0010
Seagrass 71 0.1260 0.1500 0.3300
Phytoplankton 72 0.1000 0.1290
Detritus DOM water column 73 0.0050 0.1250
Detritus POM sediment 74 0.2000 0.2500 0.2100 0.5518 0.2490 0.0000 0.7240 0.0400 0.0500 0.3500 0.1250 0.1500
Discards 75
Import 0.1510

A trophic model for Gulf St Vincent: balancing exploitation of three fisheries 86
Group name Group 66 67 68 69
Degens/Rough Leatherjacket 37
Small polychaete fish 38
Syngnathids 39
Blue Mackerel 40
Jack/Yellowtail Mackerel 41
Sardine 42
Anchovy 43
Sprats 44
Fish larvae 45
Southern Calarmari 46
Giant Australian Cuttlefish 47
Other squids 48
Octopus 49
Rock Lobster 50
Western King Prawn 51
Blue Swimmer Crab 52
Sand Crab 53
Other large crabs/bugs 54
Sand associated omnivore crustacean 55
Herbivorous macrobenthos 56
Sand zoobenthos feeder 57
Greenlip Abalone 58
Blacklip Abalone 59
Small mobile DDF crustacean 60
Small mobile ZF crustacean 61
Polychates DDF 62
Sessile epifauna 63
Gelatinous zooplankton 64
Large carnivorous zooplankton 65
Small herbivorous zooplankton 66
Meiofauna 67 0.0500
Microphytobenthos 68 0.7500 0.1000 0.0200
Planktonic microflora 69 0.0500 0.1000 0.1000
Macroalgae 70
Seagrass 71
Phytoplankton 72 0.9000
Detritus DOM water column 73 0.0500 0.2000 0.0400 0.6000
Detritus POM sediment 74 0.7600 0.2800
Discards 75
Import

A trophic model for Gulf St Vincent: balancing exploitation of three fisheries 87
Appendix 4. Biomass estimates for bycatch species from the GSV Prawn fishery
Group name Common name Scientific name
Mean biomass (t km2)
Standard error
Port Jackson Shark Port Jackson Shark Heterodontus portusjacksoni 0.0205225 0.0047718
Other demersal shark Angel Shark Squatina australis 0.0083797 0.0219242
Other demersal shark Elephant Fish Callorhinchus milii 0.0021284 0.0037914
Other demersal shark Rusty Catshark Parascyllium ferrugineum 0.0004921
Ray & skate Coastal Stingaree Urolophus orarius 0.0001625 0.0003151
Ray & skate Sparsely-Spotted Stingaree Urolophus paucimaculatus 0.0016398 0.0011308
Ray & skate Southern Fiddler Ray Trygonorrhina fasciata 0.0150147 0.0136650
Ray & skate Melbourne Skate Dipturus whitleyi 0.0125391 0.0035931
Ray & skate Southern Shovelnose Ray Aptychotrema vincentiana 0.0005858 0.0013267
Ray & skate Smooth Stingray Dasyatis brevicaudata 0.0832937 0.0145346
Ray & skate White spotted skate 0.0000958
Ray & skate Western Shovelnose Stingaree Trygonoptera mucosa 0.0086252 0.0113413
Snapper Snapper Pagrus auratus 0.0090813 0.0096661
Barracouta Barracouta Thyrsites atun 0.0033708 0.0049318
Skipjack trevally Skipjack Trevally Pseudocaranx wrighti 0.1929389 0.0267710
Medium piscivore fish Small Tooth Flounder Pseudorhombus jenynsii 0.0127388 0.0057050
Medium piscivore fish Common Stargazer Kathetostoma laeve 0.0015927 0.0045385
Medium piscivore fish Tiger Flathead Neoplatycephalus richardsoni 0.0348707 0.0068153
Medium piscivore fish Red Cod Pseudophycis bachus 0.0000212 0.0000303
Medium piscivore fish Tasselled Anglerfish Rhycherus filamentosus 0.0000055
Medium piscivore fish Flathead no. 2 0.0010880 0.0004470
King George whiting King George Whiting Sillaginodes punctata 0.0010170 0.0010099
Garfish Southern Garfish Hyporhamphus melanochir 0.0001323 0.0005070
Red mullet Red Mullet (Bluespotted Goatfish) Upeneichthys vlamingii 0.0158407 0.0042436
Silverbelly Silverbelly Parequula melbournensis 0.0111045 0.0029806
Medium crustacean fish Southern Tongue Sole Cynoglossus broadhursti 0.0002514 0.0001855
Medium crustacean fish Gurnard Perch Neosebastes pandus 0.0027954 0.0040953
Medium crustacean fish Blue Warehou 0.0003717 0.0007858
Medium molluscan fish Spotted Stinkfish (Spotted Dragonet) Repomucenus calcaratus 0.0271482 0.0051664
Medium molluscan fish Striped Perch (Western Striped Grunter) Pelates octolineatus 0.0010009 0.0002388
Medium molluscan fish Spikey Globefish Diodon nicthemerus 0.0108863 0.0032668
Medium molluscan fish Ringed Toadfish Omegophora armilla 0.0006556 0.0014712
Medium molluscan fish Common Stink Fish Foetorepus calauropomus 0.0157991 0.0036588
Medium molluscan fish Southern Gobbleguts (Southern cardinalfish) Vincentia conspersa 0.0011009 0.0004065
Medium molluscan fish Beaked Salmon Gonorynchus greyi 0.0003901 0.0003036
Medium molluscan fish Fringed Stargazer Ichthyscopus barbatus 0.0003005
Medium molluscan fish Chinaman Leather Jacket Nelusetta ayraudi 0.0000283
Small crustacean fish Little Scorpion Fish (Little Gurnard Perch) Maxillicosta scabriceps 0.0068448 0.0015934
Small crustacean fish Slender Bullseye (Elongate Bullseye) Parapriacanthus elongatus 0.0069022 0.0077917
Small crustacean fish Spiny Gurnard Lepidotrigla papilio 0.0249933 0.0033120
Small crustacean fish Spotted Grubfish Parapercis ramsayi 0.0016453 0.0024021
Small crustacean fish Wavy Grubfish Parapercis haackei 0.0001764 0.0002450
Small crustacean fish Gulf Gurnard Perch Neosebastes bougainvillii 0.0052396 0.0034937
Small crustacean fish Soldier Fish Gymnapistes marmoratus 0.0005935 0.0003145
Small crustacean fish Sthn. Pygmy Leatherjacket Brachaluteres jacksonianus 0.0002338 0.0001529
Small crustacean fish Many Banded Sole Zebrias scalaris 0.0001912 0.0001843
Small crustacean fish Sculptured Seamoth Pegasus lancifer 0.0000357 0.0000142
Small crustacean fish Latchet Pterygotrigla polyommata 0.0007091 0.0010159

A trophic model for Gulf St Vincent: balancing exploitation of three fisheries 88
Group name Common name Scientific name
Mean biomass (t km2)
Standard error
Degens/Rough leatherjacket Rough Leatherjacket Scobinichthys granulatus 0.0143624 0.0045946
Degens/Rough leatherjacket Degens Leatherjacket (Bluefin) Thamnaconus degeni 0.0875597 0.0213356
Small polychaete fish Bridled Leatherjacket Acanthaluteres spilomelanurus 0.0052929 0.0010623
Small polychaete fish Silver Whiting (Sthn. School Whiting) Sillago bassensis 0.0059240 0.0025304
Small polychaete fish Longsnout Boarfish Pentaceropsis recurvirostris 0.0000955
Small polychaete fish Toothbrush Leatherjacket Acanthaluteres vittiger 0.0011906 0.0004862
Small polychaete fish Ornate Cowfish Aracana ornata 0.0031631 0.0012518
Small polychaete fish Mosaic Leatherjacket Eubalichthys mosaicus 0.0022220 0.0003785
Small polychaete fish Crested Flounder Lophonectes gallus 0.0004273 0.0002774
Small polychaete fish Shaws Cowfish Aracana aurita 0.0005512 0.0002754
Small polychaete fish Gunn’s Leatherjacket Eubalichthys gunnii 0.0000088
Small polychaete fish Goblin Fish Glyptauchen panduratus 0.0000712 0.0000229
Small polychaete fish Longsnout Flounder 0.0002302 0.0003547
Syngnathids Bigbelly Seahorse Hippocampus abdominalis 0.0000012
Jack/yellowtail mackerel Jack Mackerel Trachurus declivis 0.0460397 0.0295558
Anchovy Australian Anchovy Engraulis australis 0.0001960 0.0002380
Sprats Sandy Spratt Hyperlophus vittatus 0.0000021
Southern calamari Southern Calamary Sepioteuthis australis 0.0300369 0.0060971
Other squids Nova Cuttlefish Sepia novaehollandae 0.0093409 0.0039442
Other squids Southern Bottletail Squid Sepiadarium austrinum 0.0000040
Other squids Striped Pyjama Squid Sepioloidea lineolata 0.0000713
Other squids Braggi's Cuttle Sepia braggi 0.0001666 0.0001270
Octopus Southern Keeled Octopus Octopus berrima 0.0001679
Octopus Pale Octopus Octopus pallidus 0.0000449 0.0000708
Octopus Southern Sand Octopus Octopus kaurna 0.0000239
Western king prawn Western King Prawn Melicertus latisulcatus 0.3385099 0.0564801
Blue swimmer crab Blue Swimmer crab Portunus (Portunus) pelagicus 0.1593908 0.0568070
Sand crab Sand Crab Ovalipes australiensis 0.0003838 0.0001687
Other large crabs/bugs Balmain Bug (Eastern Balmain Bug) Ibacus peronii 0.0050855 0.0038968
Other large crabs/bugs Hairy Shore Crab Pilumnidae sp. 0.0001877 0.0000642
Other large crabs/bugs Bristled Sponge Crab Austrodromidia octodentata 0.0001698 0.0002955
Other large crabs/bugs Common Hermit crab Paguristes frontalis 0.0006789 0.0002192
Other large crabs/bugs Shaggy Sponge Crab Lamarckdromia globosa 0.0001457 0.0001334
Other large crabs/bugs Rock Crab (Rough Rock Crab) Nectocarcinus integrifrons 0.0000613 0.0001787
Other large crabs/bugs Great Spider Crab Leptomithrax gaimardii 0.0003235 0.0002214
Other large crabs/bugs Facetted Crab Actaea calculosa 0.0002127 0.0000851
Other large crabs/bugs Southern Sponge Crab Austrodromidia australis 0.0000658 0.0000400
Other large crabs/bugs Pilumnidae crab 0.0001810 0.0000840
Other large crabs/bugs Giant Spider Crab 0.0016981 0.0021211
SAO crustaceans Strawberry Prawn Metapenaeopsis sp. 0.0067050 0.0016544
SAO crustaceans Small hermit crab ` 0.0000171 0.0000242
SAO crustaceans Small crabs 0.0001328 0.0001074
Herbivorous macrobenthos Ophiothrix caespitosa Ophiothrix (Ophiothrix) caespitosa 0.0002178 0.0001951
Herbivorous macrobenthos Thorny Sea Urchin Goniocidaris tubaria 0.0000477 0.0000115
Herbivorous macrobenthos Schayer's brittlestar Ophionereis schayeri 0.0000107 0.0000424
Herbivorous macrobenthos Handsome Sea Cucumber Holothuria (Thymiosycia) hartmeyeri 0.0030076 0.0041986
Herbivorous macrobenthos Southern Sand Star Luidia australiae 0.0012118 0.0010923
Herbivorous macrobenthos Goniodiscaster Goniodiscaster seriatus 0.0007867 0.0006614
Herbivorous macrobenthos Eleven-armed seastar Coscinasterius muricata 0.0114474 0.0169571
Herbivorous macrobenthos Sea cucumber 0.0006303 0.0007366
Herbivorous macrobenthos Wavyvolute Amoria undulata 0.0000169 0.0000084

A trophic model for Gulf St Vincent: balancing exploitation of three fisheries 89
Group name Common name Scientific name
Mean biomass (t km2)
Standard error
Herbivorous macrobenthos Nudibranch Ceratosoma brevicaudatum 0.0004147 0.0014060
Herbivorous macrobenthos Spindle Shell Fusinus (Fusinus) australis 0.0000197
Herbivorous macrobenthos Fluted Murex Pterynotus triformis 0.0000799 0.0000287
Herbivorous macrobenthos New Holland spindle Fusinus novaehollandiae 0.0000921 0.0002276
Herbivorous macrobenthos Pear Helmet Semicassis pyrum 0.0002907
Sand zoobenthos feeders Lima Lima Lima vulgaris 0.0002034
Sand zoobenthos feeders Southern Hammer Oyster Malleus (Malleus) meridianus 0.0010881 0.0008008
Sand zoobenthos feeders Doughboy Scallop (Sponge Scallop) Mimachlamys asperrima 0.0007035 0.0005696
Sand zoobenthos feeders Cockle Acrosterigma cygnorum 0.0000284
Sand zoobenthos feeders Mud Oyster (Native Oyster) Ostrea (Eostrea) angasi 0.0000918 0.0001392
Sand zoobenthos feeders Rock Shell Cleidothaerus albidus 0.0003485 0.0005649
Sand zoobenthos feeders Commercial Scallop Pecten fumatus 0.0015081 0.0009030
Sand zoobenthos feeders Queen Scallop Equichlamys bifrons 0.0007443 0.0009217
Sand zoobenthos feeders Razor Fish sp. 2 Atrina (Servatrina) tasmanica 0.0009513 0.0020108
Sand zoobenthos feeders Grooved cardita Cardita incrassiata 0.0000325 Small mobile DDF crustaceans Snapping Prawn (Hairy Pistol Prawn) Alpheus villosus 0.0000133 0.0000138 Small mobile DDF crustaceans Pistol Shrimp (Coral Snapping Shrimp) Alpheus lottini 0.0000013 0.0000009 Small mobile DDF crustaceans Mantis Shrimp Erugosquilla grahami 0.0018812 0.0004318 Small mobile DDF crustaceans Long-Wristed Shrimp Processa gracilis 0.0000011 0.0000024
Polychaete DDF Polychaeta 0.0008972 0.0015012
Sessile epifauna Sea Tulip Pyura gibbosa 0.0000176
Sessile epifauna Blue Ascidian Ascidia sydneiensis 0.0018091 0.0022040
Sessile epifauna Spined Ascidian Herdmania momus 0.0158165 0.0118911
Sessile epifauna Polycarpa Polycarpa pedunculata 0.0002483 0.0003934
Sessile epifauna Trididemnum Trididemnum cerebriforme 0.0001388 0.0003212
Sessile epifauna Pyura sp. 2 Pyura molguloides 0.0000468
Sessile epifauna Christmas Tree Ascidian Halocynthia dumosa 0.0001899 0.0001345
Sessile epifauna Cnemidocarpa Cnemidocarpa radicosa 0.0000977 0.0003026
Sessile epifauna Cystodytes Cystodytes dellachiajei 0.0001995 0.0003611
Sessile epifauna Polysyncraton Polysyncraton aspiculatum 0.0000389
Sessile epifauna Phallusia Phallusia obesa 0.0013156 0.0010685
Sessile epifauna Cunjuvoi Pyura stolonifera 0.0068124 0.0046619
Sessile epifauna Didemnum Didemnum augusti 0.0000735 0.0000861
Sessile epifauna Holozoid Sycozoa cerebriformis 0.0000048
Sessile epifauna White compound ascidian 0.0006791 0.0002296
Sessile epifauna Speckled compound ascidian 0.0008949 0.0017106
Sessile epifauna Strawberry compound ascidian 0.0000511
Sessile epifauna Grey sandy ascidian 0.0000443
Sessile epifauna Ascidian 0.0004768
Sessile epifauna Large leathery solitary ascidian 0.0003089 0.0002049
Sessile epifauna Celleporaria Celleporaria fusca 0.0100612 0.0057777
Sessile epifauna Adeona Adeona grisea 0.0003642 0.0004282
Sessile epifauna Steginoporella Steginoporella chartacea 0.0336179 0.0740309
Sessile epifauna Lace Bryozoan Triphyllozoon moniliferum 0.0009497 0.0004086
Sessile epifauna Purple Bryozoan Iodictyum phoniceum 0.0000952 0.0001129
Sessile epifauna Black encrusting Celleporaria sp. 0.0041142 0.0100421
Sessile epifauna Black vane 0.0028348 0.0009472
Sessile epifauna Orange fine vanes 0.0000940
Sessile epifauna Orange/pink fenestrate Triphyllozoon sp. 0.0003688 0.0001554
Sessile epifauna Adenopsis 1 Adenopsis 1 0.0001158

A trophic model for Gulf St Vincent: balancing exploitation of three fisheries 90
Group name Common name Scientific name
Mean biomass (t km2)
Standard error
Sessile epifauna Canda Canda 0.0000274 0.0000298
Sessile epifauna Adenopsis 2 Adenopsis 2 0.0000313 0.0001219
Sessile epifauna Goose barnacle 0.0001487 0.0006195
Sessile epifauna Halopteris sp. 1 Halopteris campanula 0.0000009
Sessile epifauna Hydroid sp. 3 0.0000017
Sessile epifauna Hairy Mussel Trichomya hirsuta 0.0000855
Sessile epifauna Carijoa Carijoa multiflora 0.0030041 0.0031872
Sessile epifauna Sea Pen Sarcoptilus grandis 0.0001211
Sessile epifauna Clathria sp. 1 Clathria sp. 1 0.0104367 0.0050851
Sessile epifauna Cannon Ball Sponge Ecionemia sp. 1 0.0113191 0.0406232
Sessile epifauna Ircinia sp. 1 Ircinia sp. 0.0303736 0.0441204
Sessile epifauna Poecilosclerid sp. 1 Poecilosclerid sp. 1 0.0910334 0.0409196
Sessile epifauna Dictyoceratid sp. 1 Dictyoceratid sp. 1 0.0008555 0.0036731
Sessile epifauna Chondropsid sp. 1 Chondropsid sp. 1 0.0341257 0.0491163
Sessile epifauna Honey Comb Sponge Holopsamma laminaefavosa 0.0122127 0.0081319
Sessile epifauna Demosponge sp. 1 Demosponge sp. 1 0.0007676
Sessile epifauna Demosponge sp. 4 Demosponge sp. 4 0.0001766
Sessile epifauna Haplosclerid sp. 2 Haplosclerid sp. 2 0.0001877 0.0001906
Sessile epifauna Dictyoceratid sp. 2 Dictyoceratid sp. 2 0.0127890 0.0247498
Sessile epifauna Dictyoceratid sp. 3 Dictyoceratid sp. 3 0.0016704
Sessile epifauna Clathria sp. 2 Clathria sp. 2 0.0008637 0.0010361
Sessile epifauna Thorectid sp. 1 Thorectid sp. 0.0020787 0.0075007
Sessile epifauna Dictyoceratid sp. 4 Dictyoceratid sp. 4 0.0003893 0.0004932
Sessile epifauna Demosponge sp. 64 Demosponge sp. 64 0.0002501
Sessile epifauna Demosponge sp. 6 Demosponge sp. 6 0.0002795 0.0003675
Sessile epifauna Ecionemia sp. 2 Ecionemia sp. 2 0.0002547
Sessile epifauna Bath Sponge Spongiid sp. 2 0.0003108 0.0005078
Sessile epifauna Demosponge sp. 7 Demosponge sp. 7 0.0003124
Sessile epifauna Demosponge sp. 8 Demosponge sp. 8 0.0010382
Sessile epifauna Demosponge sp. 9 Demosponge sp. 9 0.0000388
Sessile epifauna Sponge sp. 27 0.0016883 0.0020694
Sessile epifauna Dictyoceratid sp. 6 Dictyoceratid sp. 6 0.0004311
Sessile epifauna Dictyoceratid sp. 7 Dictyoceratid sp. 7 0.0075781 0.0108355
Sessile epifauna Holopsamma sp. 3 Holopsamma sp. 3 0.0000830 0.0001671
Sessile epifauna Sponge sp. 33 0.0020233 0.0030933
Sessile epifauna Demosponge sp. 12 Demosponge sp. 12 0.0333159 0.0154918
Sessile epifauna Demosponge sp. 14 Demosponge sp. 14 0.0002235
Sessile epifauna Dictyoceratid sp. 8 Dictyoceratid sp. 8 0.0302949 0.0702309
Sessile epifauna Siphonochalina sp. 1 Siphonochalina sp. 0.0000705
Sessile epifauna Demosponge sp. 17 Demosponge sp. 17 0.0000094
Sessile epifauna Sponge sp. 43 0.0000316
Sessile epifauna Demosponge sp. 20 Demosponge sp. 20 0.0000863 0.0001866
Sessile epifauna Spheciospongia Shpeciospongia papillosa 0.0022248
Sessile epifauna Demosponge sp. 22 Demosponge sp. 22 0.0004476
Sessile epifauna Demosponge sp. 29 Demosponge sp. 29 0.0001222 0.0004751
Sessile epifauna Demosponge sp. 30 Demosponge sp. 30 0.0049127 0.0097258
Sessile epifauna Demosponge sp. 31 Demosponge sp. 31 0.0063318 0.0027655
Sessile epifauna Demosponge sp. 36 Demosponge sp. 36 0.0003978
Sessile epifauna Demosponge sp. 37 Demosponge sp. 37 0.0008135
Sessile epifauna Haplosclerid sp. 3 Haplosclerid sp. 3 0.0002114 0.0007645
Sessile epifauna Demosponge sp. 43 Demosponge sp. 43 0.0030417
Sessile epifauna Demosponge sp. 44 Demosponge sp. 44 0.0018143

A trophic model for Gulf St Vincent: balancing exploitation of three fisheries 91
Group name Common name Scientific name
Mean biomass (t km2)
Standard error
Sessile epifauna Chondrilla sp. 1 Chondrilla sp. 0.0002329
Sessile epifauna Demosponge sp. 47 Demosponge sp. 47 0.0001196
Sessile epifauna Dictyoceratid sp. 9 Dictyoceratid sp. 9 0.0003883 0.0008470
Sessile epifauna Sponge sp. 82 0.0009921
Sessile epifauna Verongid sp. 2 Verongid sp. 2 0.0006493 0.0027231
Sessile epifauna Demosponge sp. 50 Demosponge sp. 50 0.0002634
Sessile epifauna Demosponge sp. 51 Demosponge sp. 51 0.0009692 0.0012162
Sessile epifauna Demosponge sp. 52 Demosponge sp. 52 0.0002713 0.0003840
Sessile epifauna Sponge sp. 87 0.0066621 0.0223972
Sessile epifauna Demosponge sp. 54 Demosponge sp. 54 0.0010009 0.0015196
Sessile epifauna Demosponge sp. 55 Demosponge sp. 55 0.0001717
Sessile epifauna Demosponge sp. 56 Demosponge sp. 56 0.0001168 0.0000997
Sessile epifauna Dictyoceratid sp. 10 Dictyoceratid sp. 10 0.0002237 0.0002629
Sessile epifauna Demosponge sp. 63 Demosponge sp. 63 0.0003822
Sessile epifauna Arenochalina sp. 1 Arenochalina sp. 0.0000255
Sessile epifauna Tethya Tethya sp. 1 0.0000717
Sessile epifauna Dendrilla Dendrilla rosea 0.0004028 0.0011007
Sessile epifauna Honeycomb sponge Holopsamma sp. 0.0198089 0.0073897
Sessile epifauna Demosponge sp. 64 Demosponge sp. 64 0.0001311 0.0002218
Sessile epifauna Demosponge sp. 65 Demosponge sp. 65 0.0009086 0.0011965
Sessile epifauna Demosponge sp. 66 Demosponge sp. 66 0.0026794 0.0055606
Sessile epifauna Demosponge sp. 68 Demosponge sp. 68 0.0010598
Sessile epifauna Demosponge sp. 69 Demosponge sp. 69 0.0001133
Sessile epifauna Holopsamma sp. Holopsamma sp. 0.0000942 0.0002560
Sessile epifauna Demosponge sp. 70 Demosponge sp. 70 0.0002136 0.0003057
Sessile epifauna Thorectid. Thorectid. 0.0000505
Sessile epifauna Haplosclerid Haplosclerid 0.0010060 0.0010826
Sessile epifauna Calcarea Calcarea 0.0002025 0.0006950
Sessile epifauna Demosponge sp. 71 Demosponge sp. 71 0.0034026 0.0066776
Sessile epifauna Demosponge sp. 72 Demosponge sp. 72 0.0008221
Sessile epifauna Hadromerida Hadromerida 0.0046903 0.0198638
Sessile epifauna Caulospongia sp. Caulospongia sp. 0.0003509
Macroalgae Caulerpa Caulerpa cactoides 0.0000010
Macroalgae Zonaria sp. 1 Zonaria angustata 0.0051579 0.0221774
Macroalgae Gracilaria sp. 2 Gracilaria flageliformis 0.0071489 0.0237312
Macroalgae Popcorn Sporolithon durum 0.0000750 0.0002705
Macroalgae Spongoclonium Spongoclonium conspicuum 0.0000041
Macroalgae Zonaria sp. 2 Zonaria turneriana 0.0001126
Macroalgae Phacelocarpus Phacelocarpus peperocarpus 0.0000188
Macroalgae Dictyota Dictyota ciliolata 0.0000017
Macroalgae Botryocladia Botryocladia sonderi 0.0034679 0.0048424
Macroalgae Gelidium sp. 1 Gelidium asperum 0.0032390 0.0137105
Macroalgae Cystophora sp. 1 Cystophora sp. 1 0.0000043
Macroalgae Hormosira Hormosira banksii 0.0001334
Macroalgae Sargassum sp. 1 Sargassum sp. 1 0.0000334 0.0001196
Macroalgae Cystophora sp. 3 Cystophora sp. 3 0.0000195 0.0000103
Macroalgae Dasya Dasya extensa 0.0000015
Macroalgae Scabera Scabera agardhii 0.0000825 0.0000341
Macroalgae Sargassum sp. Sargassum sp. 0.0000361 0.0000533
Seagrass Strapweed Posidonia sp. 0.0000664 0.0000845
Seagrass Amphibolis Amphibolis antartica 0.0000344 0.0000575
Seagrass Halophila Halophila australis 0.0000025

A trophic model for Gulf St Vincent: balancing exploitation of three fisheries 92
Appendix 5. Time series
Table showing time series of taxa used for the Ecosim model. For some commercial taxa data for multiple
gear types were used. Abbreviations: EF, effort; B, biomass; CPUE, catch per unit effort; DDF, deposit
detritovore feeder; DN, dab net; F, fishing mortality; GN, gill net; HN, haul net; HL, hand line; LL, long
line; PS, purse seine; SAO, sand-associated omnivore; LNFS, long-nosed fur seal; ASL, Australian sea lion.
No. Name
1 Sardine-PS EF
2 Prawn EF
3 Australian Salmon-SA EF
4 Blue Crab-CP EF
5 Rock Lobster-LP EF
6 Blacklip Abalone EF
7 Greenlip Abalone EF
8 Blue Crab-CN EF
9 Sand Crab-CN EF
10 Australian Herring-HN EF
11 Australian Salmon-HN EF
12 Blue Crab-HN EF
13 Garfish-HN EF
14 King George Whiting-HN EF
15 Other-HN EF
16 King George Whiting-HL EF
17 Snapper-HL EF
18 Other-HL EF
19 Shark-LL EF
20 Garfish-DN EF
21 Small Mesh NET EF
22 Large Mesh Set Net EF
23 Cockle-CR EF
24 Squid Jig EF
25 Troll Line EF
26 Drop Line EF
27 Fish Trap EF
28 Other EF
29 C Whaler sharks
30 C Smooth hammerhead
31 C Common thresher shark
32 C Gummy shark
33 C School shark
34 C Port Jackson shark
35 C Other demersal sharks
36 C Rays & skates
37 C Yellowtail kingfish
38 C Snapper
39 B Snapper
40 F Snapper
41 C Snook
42 C Barracouta
43 C Skipjack trevally
44 C Medium piscivore fish
45 C Medium echinoderm fish
46 C Australian salmon
47 C Australian herring
A trophic model for Gulf St Vincent: balancing exploitation of three fisheries 93
48 C King George Whiting
49 B King George Whiting
50 C Garfish
51 B Garfish
52 C Red mullet
53 C Silverbelly
54 C Medium crustacean fish
55 C Medium molluscan fish
56 C Small crustacean fish
57 C Degens/Rough leatherjacket
58 C Small polychaete fish
59 C Blue mackerel
60 C Jack/yellowtail mackerel
61 C Sardine
62 C Anchovy
63 C Southern Calarmari
64 C Giant cuttlefish
65 C Other squids
66 C Octopus
67 C Rock lobster
68 C Western king prawn
69 B Western king prawn
70 C Blue swimmer crab
71 C Sand crab
72 C Other large crabs/bugs
73 C SAO crustaceans
74 C Hebivorous macrobenthos
75 C Sand-zoobenthos feeders
76 C Greenlip abalone
77 C Black abalone
78 C Small mobile DDF crustaceans
79 C Polychaetes DDF
80 C Sessile epifauna
81 C Macroalgae
82 Sardine-PS CPUE
83 Blue Crab-CP CPUE
84 Rock Lobster-LP CPUE
85 Blacklip Abalone CPUE
86 Greenlip Abalone CPUE
87 Sand Crab-Cn CPUE
88 Australian Herring-HN CPUE
89 Australian Salmon-HN CPUE
90 Shark-LLCPUE
91 Cockle-Cr CPUE
92 Squid Jig CPUE
93 B LNFS
94 B ASL

A trophic model for Gulf St Vincent: balancing exploitation of three fisheries 94
11 References
ABARES (2014). Australian fisheries and aquaculture statistics 2013. Australian Bureau of Agricultural and
Resource Economics and Sciences. Canberra. 115pp.
Ayers, M. J., Scharler, U. M. and Fennessy, S. T. (2013). Modelling ecosystem effects of reduced prawn
recruitment on the Thukela Bank trawling grounds, South Africa, following nursery loss. Marine Ecology
Progress Series, 479: 143-161.
Barlow, J. and Boveng, P. (1991). Modelling age-specific mortality for marine mammals populations. Marine
Mammal Science, 7: 84-119.
Barlow, J., Kahru, M. and Mitchell, B. G. (2008). Cetacean biomass, prey consumption, and primary
production requirments in te California Current ecosystem. Marine Ecology Progress Series, 371: 285-295.
Baum, J. K. and Worm, B. (2009). Cascading top‐down effects of changing oceanic predator abundances.
Journal of Animal Ecology, 78(4): 699-714.
Baylis, A. M. M., Page, B. and Goldsworthy, S. D. (2008). Colony-specific foraging areas of lactating New
Zealand fur seals. Marine Ecology Progress Series, 361: 279-290.
Baylis, A. M. M., Page, B., McKenzie, J. and Goldsworthy, S. D. (2012). Individual foraging site fidelity in
lactating New Zealand fur seals: Continental shelf vs. oceanic habitats. Marine Mammal Science, 28(2): 276-
294.
Beckmann, C. L. and Hooper, G. E. (2015). Blue Crab (Portunus armatus) Fishery 2013/14. Fishery
Assessment Report to PIRSA Fisheries and Aquaculture. South Australian Research and Development
Institute (Aquatic Sciences), Adelaide. SARDI Publication No. F2007/000729-11. SARDI Research Report
Series No. 837. 70pp.
Beckmann, C. L. and Hooper, G. E. (2016). Blue Crab (Portunus armatus) Fishery 2014/15. Fishery
Assessment Report to PIRSA Fisheries and Aquaculture. South Australian Research and Development
Institute (Aquatic Sciences), Adelaide. SARDI Publication No. F2007/000729-12. SARDI Research Report
Series No. 897. 57pp.
Beckmann, C. L., J., N. C. and Hooper, G. E. (2015). Status of the Gulf St Vincent Prawn Penaeus (Melicertus)
latisulcatus Fishery in 2014/15. Fishery Status Report to PIRSA Fisheries and Aquaculture. South Australian
Research and Development Institute (Aquatic Sciences), Adelaide. SARDI Publication No. F2007/00174-4.
SARDI Research Report Series No. 870. 25pp.
Bethge, P., Nicol, S., Culik, B. M. and Wilson, R. P. (1997). Diving behaviour and energetics in breeding little
penguins (Eudyptula minor). Journal of Zoology, London, 242: 483-502.
Bilgmann, K., Möller, L. M., Harcourt, R. G., Gibbs, S. E. and Beheregaray, L. B. (2007). Genetic
differentiation in bottlenose dolphins from South Australia: association with local oceanography and coastal
geography. Marine Ecology Progress Series, 341: 265-276.
Blaber, S. J. M. and Wassenberg, T. J. (1989). Feeding ecology of the piscivorous birds Phalacrocorax varius,
Phalacrocorax melanoleucos and Sterna bergii in Moreton Bay, Australia - diets and dependence on trawler
discards. Marine Biology, 101(1): 1-10.
Braley, M., Goldsworthy, S. D., Page, B., Steer, M. and Austin, J. J. (2010). Assessing morphological and
DNA-based diet analysis techniques in a generalist predator, the arrow squid Nototodarus gouldi. Molecular
Ecology Resources, 10: 466-474.
Bryars, S. and Svane, I. (2008). Chpter 35. Blue swimmer and sand crabs in Gulf St Vincent and Investigator
Strait. In: Shepherd, S. A., Bryars, S., Kirkegaard, I., Harbinson, P. and Jennings, J. T. (Eds). Natural History
of Gulf St Vincent. Royal Society of South Australia Inc, Adelaide, pp. 464-479.
Bulman, C., Condie, S., Furlani, D., Cahill, M., Klaer, N., Goldsworthy, S. and Knuckey, I. (2006). Trophic
dynamics of the eastern shelf and slope of the South East Fishery: impacts of and on the fishery. Final Report
to the Fisheries Research and Development Corporation (FRDC 2002/028). CSIRO Marine and Atmospheric
Research, Hobart, Tasmania. pp 197.

A trophic model for Gulf St Vincent: balancing exploitation of three fisheries 95
Bunce, A. (2001). Prey consumption of Australiasian gannets (Morus serrator) breeding in Port Phillip Bay,
southeast Australia, and potential overlap with commercial fisheries. ICES Journal of Marine Science, 58: 904-
915.
Burnell, O. W., Barrett, S. L., Hooper, G. E., Beckmann, C. L., Sorokin, S. J. and Noell, C. J. (2015). Spatial
and temporal reassessment of by-catch in the Spencer Gulf Prawn Fishery. Report to PIRSA Fisheries and
Aquaculture. South Australian Research and Development Institute (Aquatic Sciences). Adelaide. SARDI
Publication No. F2015/00414-1. SARDI Research Report Series No. 854. 128pp.
Cailliet, G. M., Natanson, L. J., Welden, B. A. and Ebert, D. A. p. (1985). Preliminary studies on the age and
growth of the white shark, Carcharodon carcharias, using vertebral bands. In: Sibley, G. (Ed.) Biology of the
White Shark, a Symposium. Memoirs of the Southern California Academy of Sciences, Volume 9. Southern
California Academy of Sciences, Los Angeles, vol. 9, pp. 49-60.
Caines, R. (2005). Trophic Guild-Structures in Pelagic Fish Communities in the Eastern Great Australian Bight
Ecosystem. Honours Thesis. University of South Australia. 110 pp.
Carey, F. G., Kanwisher, J. W., Brazier, O., Gabrielson, G., Casey, J. G. and Pratt, H. L. J. (1982). Temperature
and activities of white shark, Carcharodon carcharias. Copeia, 1982: 254-260.
Casey, J. G. and Kohler, N. E. (1992). Tagging studies on the shortfin mako (Isurus oxyrinchus) in the western
North Atlantic. Australian Journal of Marine and Freshwater Research, 43(1): 45-60.
Charlton-Robb, K., Gershwin, L.-A., Thompson, R., Austin, J. J., Owen, K. and McKechnie, S. (2011). A new
dolphin species, the Burrunan dolphin Tursiops australis sp. nov., endemic to southern Australian coastal
waters. PLoS ONE, 6(9): e24047.
Chiaradia, A., Dann, P., Jessop, R. and Collins, P. (2002). The diet of Crested Tern (Sterna bergii) chicks on
Phillip Island, Victoria, Australia. Emu, 102: 367-371.
Christensen, V. (2000). Indicators for marine ecosystems affected by fisheries. Marine and Freshwater
Research, 51: 447–450.
Christensen, V. and Pauly, D. (1992a). A guide to Ecopath II software system (version 2.1). ICLARM.
Malyasia.
Christensen, V. and Pauly, D. (1992b). A guide to Ecopath II software system (version 2.1). ICLARM,
Malaysia.
Christensen, V. and Walters, C. J. (2004). Ecopath with Ecosim: methods, capabilities and limitations.
Ecological Modelling, 172: 109-139.
Christensen, V., Walters, C. J., Pauly, D. and Forrest, R. (2008). Ecopath with Ecosim version 6 User Guide,
November 2008. Lenfest Ocean Futures Project 2008. pp.
Cliff, G. and Dudley, S. F. J. (1992). Sharks caught in the protective gillnets off Natal, South Africa. 6. The
copper shark Carcharhinus brachyurus (Gunther). South African Journal of Marine Science, 12: 663–674.
Coll, M., Santojanni, A., Palomera, I. and Arneri, E. (2009). Food-web changes in the Adriatic Sea over the
last three decades. Marine Ecology Progress Series, 318: 17-37.
Collette, B., Chang, S.-K., Di Natale, A., Fox, W., Juan Jorda, M., Miyabe, N., Nelson, R., Uozumi, Y. and
Wang, S. (2011). Thunnus maccoyii. The IUCN Red List of Threatened Species 2011: e.T21858A9328286.
http://dx.doi.org/10.2305/IUCN.UK.2011-2.RLTS.T21858A9328286.en. Available at
http://www.iucnredlist.org/ [accessed 16 November 2015].
Compagno, L. J. V. (1984). Sharks of the world. An annotated and illustrated catalogue of shark species known
to date. FAO, Rome, Italy. pp.
Copley, P. B. (1996). The status of seabirds in South Australia. The Status of Australia's Sea birds: Proceedings
of the National Seabird Workshop, Canberra 1-2 November 1993.
Cornejo-Donoso, J. and Antezana, T. (2008). Preliminary trophic model of the Antarctic Peninsula Ecosystem
(Sub-area CCAMLR 48.1). Ecological Modelling, 218: 1-17.
A trophic model for Gulf St Vincent: balancing exploitation of three fisheries 96
Costa, D. P., Dann, P. and Disher, W. (1986). Energy requirements of free ranging little penguin, Eudyptula
minor. Comparative Biochemistry and Physiology, 85A: 135-138.
Costa, D. P. and Gales, N. J. (2000). Foraging energetics and diving behaviour of lactating New Zealand sea
lions, Phocarctos hookeri. Journal of Experimental Biology, 203: 3655-3665.
Costa, D. P. and Gentry, R. L. (1986). Reproductive energetics of the northern fur seal. In: Gentry, R. L. and
Kooyman, G. L. (Eds). Fur Seals: Maternal Strategies on Land and at Sea. Princeton University Press,
Princeton, New Jersey, pp. 79-101.
Coulson, J. C., Duncan, N. and Thomas, C. (1982). Changes in the breeding biology of the herring gull (Larus
argentatus) induced by reduction in the size and density of the colony. Journal of Animal Ecology, 51(3): 739-
756.
Cowan Jr, J. H., Rice, J. C., Walters, C. J., Hilborn, R., Essington, T. E., Day Jr, J. W. and Boswell, K. M.
(2012). Challenges for implementing an ecosystem approach to fisheries management. Marine and Coastal
Fisheries, 4(1): 496-510.
Currie, D. R., Dixon, C. D., Roberts, S. D., Hooper, G. E., Sorokin, S. J. and Ward, T. M. (2009a). Fishery-
independent by-catch survey to inform risk assessment of the Spencer Gulf Prawn Trawl Fishery. Report to
PIRSA Fisheries. South Autralian Research and Development Institute (Aquatic Sciences). Adelaide.
Publication No. F2009/000369-1, Research Report Series No. 390. 121pp.
Currie, D. R., Dixson, C. D., Roberts, S. D., Hooper, G. E., Sorokin, S. J. and Ward, T. M. (2009b). Fishery-
independent by-catch survey to inform risk assessment of the Spencer Gulf Prawn Trawl Fishery. Report to
PIRSA Fisheries. South Australian Research and Development Institue (Aquatic Sciences), Adelaide. SARDI
Publication No. F2009/000369-1. SARDI Research Report Series No. 390. 121pp.
Currie, D. R., Hooper, G. E. and Ward, T. M. (2007). Blue Crab (Portunus pelagicus) Fishery 2005/06 Stock
Assessment Report to PIRSA Fisheries. South Australian Research and Development Institute (Aquatic
Sciences). Adelaide. RD -3/0274-4. 65pp.
Currie, D. R. and Sorokin, S. J. (2010). A preliminary evaluation of the distribution and trophodynamics of
demersal fish from Spencer Gulf. Report to the South Australian Department for the Environment and
Heritage. South Australian Research and Development Institue (Aquatic Sciences), Adelaide. SARDI
Publication No. F2010/000088-1. SARDI Research Report Series No. 424. 179pp.
Daly, K. (2007). The diet and guild structure of the small pelagic fish community in the eastern Great
Australian Bight, South Australia. Honours. Adelaide University. 42 pp.
Dann, P., Carron, M., Chambers, B., Chambers, L., Dornom, T., McLaughlin, A., Sharp, B., Talmage, M. E.,
Thoday, R. and Unthank, S. (2005). Longevity in Little Penguins Eudyptula minor. Marine Ornithology, 33:
71-72.
Dann, P. and Cullen, J. M. (1990). Survival, Patterns of Reproduction and Lifetime Reproductive Success in
Little Blue Penguins (Eudyptula minor ) in Victoria, Australia. In: Davis, L. A. J. D. (Ed.) Penguin Biology.
Academic Press, San Diego, pp. 63-84.
Daunt, F., Wanless, S., Greenstreet, S. P. R., Jensen, H., Hamer, K. C. and Harris, M. P. (2008). The impact
of the sandeel fishery closure on seabird food consumption, distribution, and productivity in the northwestern
North Sea. Canadian Journal of Aquatic Sciences, 65: 362-381.
Dewar, H., Domeier, M. and Nasby-Lucas, N. (2004). Insights into young of the year white shark,
Carcharodon carcharias, behavior in the Southern California Bight. Environmental Biology of Fishes, 70:
133-143.
Dimmlich, W. F., Ward, T. M. and Breed, W. G. (2009). Spawning dynamics and biomass estimates of an
anchovy Engraulis australis population in contrasting gulf and shelf environments. Journal of Fish Biology,
75(7): 1560-1576.
Dixon, C., Raptis, J., Gorman, D., Roberts, S., Hooper, G., Bicknell, N., Sorokin, S., Newman, R., Noell, C.,
Benediktsson, T., Saint, J. and Hill, W. (2013a). A collaborative approach to novel by-catch research for rapid
development, extension and adoption into a commercial trawl fishery. South Australian Research and

A trophic model for Gulf St Vincent: balancing exploitation of three fisheries 97
Development Institute (Aquatic Sciences), Adelaide. SARDI Publication No. F2012/000250-1. SARDI
Research Report Series No. 643. 47pp.
Dixon, C., Roberts, S., Hooper, G., Steer, M. A. and Ward, T. M. (2006). Gulf St Vincent Prawn (Melicertus
latisulcatus) Fishery. Fishery Assessment Report to PIRSA Fisheries. South Australian Research and
Development Institute (Aquatic Sciences), Adelaide. SARDI Publication No. RD03/0063-4. SARDI Research
Report Series No. 159. 97pp.
Dixon, C. D., Hooper, G. E. and Burch, P. (2012). Spencer Gulf Prawn Penaeus (Melicertus latisulcatus)
Fishery 2010/11. Fishery Assessment Report to PIRSA Fisheries and Aquaculture. South Australian Research
and Development Institute (Aquatic Sciences), Adelaide. SARDI Publication No. F2007/000770-5. SARDI
Research Report Series No. 603. 118pp.
Dixon, C. D., Noell, C. J., Hooper, G. E. and Ward, T. M. (2013b). Blue Crab (Portunus armatus) Fishery
2011/12. Fishery Assessment Report to PIRSA Fisheries and Aquaculture. South Australian Research and
Development Institute (Aquatic Sciences), Adelaide. SARDI Publication No. F2007/000729-9. SARDI
Research Report Series No. 689. 70pp.
Earl, J., Fowler, A. J. and Dittmann, S. (2011). Temporal variation in feeding behaviour and trophic ecology
of the temperate hemiramphid, Hyporhamphus melanochir. Environmental Biology of Fishes, 90: 71-83.
Edgar, G. J. (1990). Predator-prey interactions in seagrass beds. 2. Distriburtion and diet of blue mann crabs
Portunus pelagicus Linnaeus at Cliff Head, Western Australia. Journal of Experimental Marine Biology and
Ecology, 139(1-2): 23-32.
Einoder, L. (2010). The foraging ecology of the short-tailed shearwater Puffinus tenuirostris PhD. University
of Adelaide. pp.
Einoder, L. D. and Goldsworthy, S. D. (2005). Foraging flights of short-tailed shearwaters (Puffinus
tenuirostris) from Althorpe Island: Assessing their use of neritic waters. Transactions of the Royal Society of
South Australia, 129: 209-216.
Fowler, A. J. (2008). Chapter 28. The population biology of snapper (Pagrus auratus) in Gulf St Vincent. In:
Shepherd, S. A., Bryars, S., Kirkegaard, I., Harbinson, P. and Jennings, J. T. (Eds). Natural History of Gulf St
Vincent. Royal Society of South Australia Inc, Adelaide, pp. 385-398.
Fowler, A. J. (2016). The influence of fish movement on regional fishery production and stock structure for
South Australia's snapper (Chrysophrys auratus) fishery. Final Report to Fisheries Research and Development
Corporation (FRDC) Project No. 2012/020. South Australian Research and Development Institute (Aquatic
Sciences). Adelaide. 181pp.
Fowler, A. J. and Jones, G. K. (2008). Chpter 29. The population biology of King George whiting (Sillaginodes
punctata) in Gulf St Vincent. In: Shepherd, S. A., Bryars, S., Kirkegaard, I., Harbinson, P. and Jennings, J. T.
(Eds). Natural History of Gulf St Vincent. Royal Society of South Australia Inc, Adelaide, pp. 399-414.
Fowler, A. J., Lloyd, M. T. and Schmarr, D. (2009). A preliminary consideration of by-catch in the Marine
Scalefish fishery of South Australia. SARDI Publication Number F2009/000097-1, SARDI Research Report
Series No. 365. 79pp.
Fowler, A. J., McGarvey, R., Burch, P., Feenstra, J. E., Jackson, W. B. and Lloyd, M. T. (2013). Snapper
(Chrysophrys auratus) Fishery. Fishery Assessment. Report to PIRSA Fisheries and Aquaculture. . South
Australian Research and Development Institute (Aquatic Sciences). Adelaide. F2007/000523-3. SARDI
Research Report Series No. 713. 103pp.
Fowler, A. J., McGarvey, R., Carroll, J. and Feenstra, J. E. (2014). King George Whiting (Sillaginodes
punctatus) Fishery. Fishery Assessment Report to PIRSA Fisheries and Aquaculture. South Australian
Research and Development Institute (Aquatic Sciences). Adelaide. F2007/000843-4. SARDI Research Report
Series No. 801. 85pp.
Fowler, A. J., McGarvey, R., Steer, M. A. and Feenstra, J. E. (2010). The South Australian Marine Scalefish
Fishery – Stock Status Report. Report to PIRSA. (PDF 664.4 KB). South Australian Research and
Development Institute (Aquatic Sciences), Adelaide. SARDI Publication No. F2007/000565-5. SARDI
Research Report Series No. 507. 29pp.
A trophic model for Gulf St Vincent: balancing exploitation of three fisheries 98
Froese, R. and Pauly, D. (2009). FishBase. World Wide Web Electronic Publication, version (11/2009)
www.fishbase.org. Available at www.fishbase.org.
Fulton, E. A. and Smith, D. M. (2004). Lessons learnt from a comparison of three ecosystem models for Port
Phillip Bay, Australia. African Journal of Marine Science, 26: 219-243.
Gibbs, S. E., Harcourt, R. G. and Kemper, C. M. (2011). Niche differentiation of bottlenose dolphin species in
South Australia revealed by stable isotopes and stomach contents. Wildlife Research, 38(4): 261-270.
Gillanders, B. M., Goldsworthy, S. D., Prowse, T., Doubell, M., Middleton, J., Rogers, P., Tanner, J., Clisby,
N. A., James, C., Luick, J., Van Ruth, P., Bradshaw, C. J. A. and Ward, T. M. (2015). Spencer Gulf Research
Initiative: Development of an Ecosystem Model for Fisheries and Aquaculture. University of Adelaide and
SARDI Aquatic Sciences. Adelaide. 116pp.
Giri, K. and Hall, K. (2015). South Australian Recreational Fishing Survey. Fisheries Victoria Internal Report
Series No. 62.
Gislason, H., Sinclair, M., Sainsbury, K. and O'boyle, R. (2000). Symposium overview: incorporating
ecosystem objectives within fisheries management. ICES Journal of Marine Science: Journal du Conseil,
57(3): 468-475.
Goldsworthy, S. D., Bulman, C., He, X., Larcombe, J. and Littnan, C. (2003). Trophic interactions between
marine mammals and Australian fisheries: an ecosystem approach. In: Gales, N., Hindell, M. and Kirkwood,
R. (Eds). Marine Mammals and Humans: Fisheries, tourism and management. CSIRO Publishing, Melbourne,
pp. 69-99.
Goldsworthy, S. D., Lavers, J., Carey, M. and Lowther, A. D. (2013). Assessment of the status of the Flesh-
footed Shearwater in South Australia: population status, subspecies status and foraging ecology. South
Australian Research and Development Institute (Aquatic Sciences), Adelaide. SARDI Publication
No.F2013/000013-1. SARDI Research Report Series No. 736. 9pp.
Goldsworthy, S. D., Mackay, A. I., Shaughnessy, P. D., Bailleul, F. and Holman, D. (2015). Maintaining the
monitoring of pup production at key Australian sea lion colonies in South Australia (2014/15). Final Report to
the Australian Marine Mammal Centre. South Australian Research and Development Institute (Aquatic
Sciences). Adelaide. SARDI Publication No. F2010/000665-5. SARDI Research Report Series No. 871. .
73pp.
Goldsworthy, S. D. and Page, B. (2007). A risk-assessment approach to evaluating the significance of seal
bycatch in two Australian fisheries. Biological Conservation, 139: 269-285.
Goldsworthy, S. D., Page, B., Shaughnessy, P. D. and Linnane, A. (2010). Mitigating seal interactions in the
SRLF and the gillnet sector SESSF in South Australia. FRDC Project 2007/041 Final Report. SARDI Aquatic
Sciences Publication Number F2009/000613-1, SARDI Research Report Series Number 405. 213pp.
Gomez-Laich, A., Wilson, R. P., Shepard, E. L. C. and Quintana, F. (2013). Energy expenditure and food
consumption of foraging Imperial cormorants in Patagonia, Argentina. Marine Biology, 160(7): 1697-1707.
Griffiths, S. P., Young, J. W., Lansdell, M. J., Campbell, R. A., Hamption, J., Hoyle, S. D., Langley, A.,
Bromhead, D. and Hinton, M. G. (2010). Ecological effects of longline fishing and climate change on the
pelagic ecosystem off eastern Australia. Reviews in Fish Biology and Fisheries, 20: 239-272.
Gruber, S. H., de Marignac, J. R. C. and Hoenig, J. M. (2001). Survival of juvenile lemon sharks at Bimini,
Bahamas, estimated by mark-depletion experiments. Transactions of the American Fisheries Society, 130(3):
376-384.
Grubert, M. A., Wadley, V. A. and White, R. W. G. (1999). Diet and feeding strategy of Octopus maorum in
southeast Tasmania. Bulletin of Marine Science, 65(2): 441-451.
Guenette, S. and Morato, T. (2002). The Azores Archipelago, 1997. In: Guenette, S., Christensen, V. and
Pauly, D. (Eds). Fisheries impacts on North Atlantic Ecosystems: Modes and analysis. Fisheries Centre,
University of British Columbia, Canada, pp. 241–247.
Gunn, J. and Young, J. (1999). Environmental determinants of the movement and migration of juvenile
southern bluefin tuna. In: Gunn, J. and Block, B. (Eds). Fish Movement and Migration. Australian Society for
Fish Biology, pp. 123-128.

A trophic model for Gulf St Vincent: balancing exploitation of three fisheries 99
Harrison, S. (2009). Interactions between Silver Gulls (Larus novaehollandiae) and Southern Bluefin Tuna
(Thunnus maccoyii) aquaculture in the Port Lincoln area. PhD. Flinders University. 311 pp.
Heritage, D. f. E. a. (2008). Marine Habitats in the Adelaide and Mount Lofty Ranges NRM Region. Final
Report to the Adelaide and Mount Lofty Ranges Natural Resources Management Board for the program:
Facilitate Coast, Marine and Estuarine Planning and Management by Establishing Regional Baselines. .
Department for Environment and Heritage, Coast and Marine Conservation Branch Adelaide. 84pp.
Heupel, M. R. and Simpfendorfer, C. A. (2002). Estimation of mortality of juvenile blacktip sharks,
Carcharhinus limbatus, within a nursery area using telemetry data. Canadian Journal of Fisheries and Aquatic
Sciences, 59: 624-632.
Hoare, M. J. (2008). The effects of southern rock lobster (Jasus edwardsii) translocation on inshore rocky reef
communities in South Australia Honours. Flinders University. 92 pp.
Hooker, S. K., Whitehead, H. and Gowans, S. (2002). Ecosystem considerations in conservation planning:
energy demand for foraging bottlenose whales (Hyperoodon ampullatus) in a marine protected area. Biological
Conservation, 104: 51-58.
Humphries, P., Hyndes, G. A. and Potter, I. C. (1992). Comparisons between the diets of distant taxa (teleost
and cormorant) in an Australian estuary. Estuaries, 15(3): 327-334.
Hunter, C. M., Moller, H. and Fletcher, D. (2000). Parameter uncertainty and elasticity analyses of a population
model: setting research priorities for shearwaters. Ecological Modelling, 134(2-3): 299-323.
Hussey, N. E., McCann, H. M., Cliff, G., Dudley, S. F. J., Wintner, S. P. and Fisk, A. T. (2012). Size-based
analysis of diet and trophic position of the white shark, Carcharodon carcharias, in South African waters. In:
Domeier, M. L. (Ed.) Global perspectives on the biology and life history of the white shark.pp. 27-49.
Imber, M. J. (1981). Diets of storm petrels Pelagodrama and Garrodia and of prions Pachyptila
(Procellariiformes). Proceedings of the symposium on birds of the sea and shore.
Kailola, P. J., Williams, M. J., Stewart, P. C., Reichelt, R. E., McNee, A. and Grieve, C. (1993). Australian
Fisheries Resources. Bureau of Resource Sciences and the Fisheries Research and Development Corporation,
Canberra.
Kangas, M. and Dixon, C. (2008). Chpter 34. Prawns of Gulf St Vincent. In: Shepherd, S. A., Bryars, S.,
Kirkegaard, I., Harbinson, P. and Jennings, J. T. (Eds). Natural History of Gulf St Vincent. Royal Society of
South Australia Inc, Adelaide, pp. 456-463.
Kemper, C., Harcourt, R., Gibbs, S., Miller, C. and Wright, A. (2006). Estimating population size of ‘at risk’
bottlenose and common dolphins in Spencer Gulf and Gulf St Vincent, South Australia. Consultancy Report
to Department of the Environment and Heritage, Canberra (May 2006). 41pp.
Kemper, C. and Ling, J. (1991). Whale strandings in South Australia (1881 - 1989). Transactions of the Royal
Society of South Australia, 115: 37-52.
Kemper, C. M. (2004). Osteological variation and taxonomic affinities of bottlenose dolphins, Tursiops spp.,
from South Australia. Australian Journal of Zoology, 52(1): 29-48.
Kemper, C. M. and Gibbs, S. E. (2001). Dolphin interactions with tuna feedlots at Port Lincoln, South Australia
and recommendations for minimising entanglements. Journal of Cetacean Research and Management, 3(3):
283-292.
Kenney, R. D., Scott, G. P., Thompson, T. J. and Winn, H. E. (1997). Estimates of prey consumption and
trophic impacts of cetaceans in the USA Northwest Continental Shelf Ecosystem. Journal of the Northwest
Atlantic Fishery Science, 22: 155-171.
King, M. G. (1977). The biology of the of the western king prawn (Penaeus latisulcatus) and aspects of the
fishery in South Australia. MSc Thesis, University of Adelaide.
Kirkwood, R., Lynch, M., Gales, N., Dann, P. and Sumner, M. (2006). At-sea movements and habitats of adult
male Australian fur seals (Arctocephalus pusillus doriferus). Canadian Journal of Zoology, 84(12): 1781-1788.
Kleiber, M. (1975). The fire of life: an introduction to animal energetics. R. E. Krieger Publishing: Huntington,
NY.

A trophic model for Gulf St Vincent: balancing exploitation of three fisheries 100
Kleisner, K. and Pauly, D. (2011). The Marine Trophic Index (MTI), the Fishing in Balance (FiB) Index and
the spatial expansion of fisheries. In: . In: Christensen, V., Lai, S., Palomares, M. L. D., Zeller, D. and Pauly,
D. (Eds). The State of Biodiversity and Fisheries in Regional SeasFisheries Centre, University of British
Columbia, vol. 19(3), pp. 41-44.
Klimley, A. P., Beavers, S. C., Curtis, T. H. and Jorgensen, S. J. (2002). Movements and swimming behavior
of three species of sharks in La Jolla Canyon, California. Environmental Biology of Fishes, 63: 117-135.
Knight, M. and Tsolos, A. (2009). South Australian wild fisheries information and statistics report. (PDF 5.2
MB). SARDI Aquatic Sciences Publication No F2008/000804-1. SARDI Research Report Series No. 305.
January 2009.
Kohler, N. E., Casey, J. G. and Turner, P. A. (1996). Length-Length and Length-Weight Relationships for 13
Shark Species from the Western North Atlantic, NOAA Technical Memorandum NMFS-NE-110.
Laidre, K. L., Heide-Jørgansen, M. P., Jorgensen, O. A. and Treble, M. A. (2004). Deep-ocean predation by a
high Arctic cetacean. ICES Journal of Marine Science, 61: 430-440.
Lauer, P., Fernandez, M., Fairweather, P., Cheshire, A. C. and Tanner, J. (2007). Chapter 2: Spencer Gulf
natural sedimentary setting. In: Fernandes, M., Lauer, P., Cheshire, A., Svane, I., Putro, S., Mount, G., Angove,
M., Sedawie, T., Tanner, J., Fairweather, P., Barnett, J. and Doonan, A. (Eds). (2007). Aquafin CRC – Southern
Bluefin Tuna Aquaculture Subprogram: Tuna Environment Subproject – Evaluation of Waste Composition
and Waste Mitigation. Technical report, Aquafin CRC Project 4.3.2, FRDC Project 2001/103. (PDF 3.9 MB).
SARDI Publication No. RD03/0037-9. SARDI Research Report Series No. 207 (Ed. M. Fernandes). Aquafin
CRC, Fisheries Research & Development Corporation and South Australian Research & Development
Institute (Aquatic Sciences), Adelaide. pp. 19-46.
Lavigne, D. M. (1996). Ecological interactions between marine mammals, commercial fisheries, and their
prey: unravelling the tangled web. In: Montevecchi, W. A. (Ed.) High-lattitude seabirds 4. Trophic
relationships and energetics of endotherms in cold ocean systems. Canadian Special Publication of Fisheries
and Aquatic Sciences, vol. 9, pp. 59-71.
Leaper, R. and Lavigne, D. (2007). How much do large whales eat? Jornal of Cetacean Research and
Managment, 9: 179-188.
Lighthouses of Australia Inc (2004). The Bulletin, No 1/2004.
Lindsay, M. C. M. and Meathrel, C. E. (2008). Where, When and How? Limitations of the Techniques Used
to Examine Dietary Preference of Pacific Gulls (Larus pacificus) Using Non-consumed Parts of Prey and
Regurgitated Pellets of Prey Remains. Waterbirds, 31(4): 611-619.
Lloyd, M. (2010). Spatial variation in growth of snapper (Chrysophrys auratus) in South Australia gulf waters:
An investigation of diet as a contributing factor. Honours Thesis. The University of Adelaide. 66 pp.
Loneragan, N. R., Babcock, R. C., Lozano-Montes, H. and Dambacher, J. M. (2010). Evaluating how food
webs and the fisheries they support are affected by fishing closures in Jurien Bay, temperate Western Australia.
FRDC Report, Project No. 2006/038.
Mackinson, S. and Daskalov, G. (2008). An ecosystem model of the North Sea to support an ecosystem
approach to fisheries managment: description and parameterisation. Science Series Technical Reports. Cefas
Lowestoft, 142: 196pp.
Malcolm, H., Bruce, B. D. and Stevens, J. D. (2001). A review of the biology and status of white sharks in
Australian waters. Report to the Department of the Environment. pp 113.
Marchant, S. and Higgins, P. J. (Eds) (1990). Handbook of Australian, New Zealand and Antarctic Birds.
Oxford University Press: Melbourne. pp.
McAuley, R. and Simpfendorfer, C. (2003). Catch composition of the Western Australian temperate demersal
gillnet and demersal longline fisheries, 1994–1999; p. 78. Department of Fisheries; Perth, Western Australia.
Fisheries Research Report, 146.
McGarvey, R., Feenstra, J. E. and Ye, Q. (2007). Modeling fish numbers dynamically by age and length:
partitioning cohorts into ‘slices’. Canadian Journal of Fisheries and Aquatic Sciences, 64: 1157-1173.

A trophic model for Gulf St Vincent: balancing exploitation of three fisheries 101
McGarvey, R. and Fowler., A. J. (2002). Seasonal growth of King George whiting (Sillaginodes punctata)
from length-at-age samples truncated by legal minimum size. Fisheries Bulletin, 100: 545-558.
McGlennon, D., Jones, G. K., Baker, J., Jackson, W. B. and Kinloch, M. A. (2000). Ageing, catch-at-age and
relative year-class strength for snapper (Pagrus auratus) in northern Spencer Gulf, South Australia. Marine
and Freshwater Research, 51: 669–677.
McIntosh, R. R. (2007). The life history and population demographics of the Australian sea lion, Neophoca
cinerea. PhD Thesis. La Trobe University, Bundoora, Victoria. 367 pp.
McIntosh, R. R., Page, B. and Goldsworthy, S. D. (2006). Dietary analysis of regurgitates and stomach samples
from free-living Australian sea lions. Wildlife Research, 33: 661-669.
McKenzie, J. (2006). Population demographics of New Zealand fur seals (Arctocephalus forsteri). PhD. La
Trobe University. 166 pp.
McKenzie, J., Page, B., Goldsworthy, S. D. and Hindell, M. A. (2007a). Growth strategies of New Zealand fur
seals in southern Australia. Journal of Zoology, 272: 377-389.
McKenzie, J., Page, B., Shaughnessy, P. D. and Hindell, M. A. (2007b). Age and reproductive maturity of
New Zealand fur seals (Arctocephalus forsteri) in southern Australia. Journal of Mammalogy, 88(3): 639-648.
Mcleay, L. J. (2010). The Life History Characters, Reproductive Constraints and Foraging Strategies of a
Neritic Seabird, The Crested Tern. PhD. University of Adelaide. 182 pp.
McLeay, L. J., Page, B., Goldsworthy, S. D., Ward, T. M. and Paton, D. C. (2009). Size matters: variation in
the diet of chick and adult crested terns. Marine Biology, 156: 1765-1780.
Mecenero, S., Kirkman, S. P. and Roux, J.-P. (2006). A refined consumption model for lactating Cape fur seals
(Arctocephalus pusillus pusillus), based on scat analyses. ICES Journal of Marine Science, 63: 1551-1566.
Moller, L. M., Bilgmann, K., Charlton-Robb, K. and Beheregaray, L. (2008). Multi-gene evidence for a new
bottlenose dolphin species in southern Australia. Molecular phylogenetics and evolution, 49(2): 674-681.
Nayar, S., Collings, G., Pfening, P. and Royal, M. (2012). Managing nitrogen inputs into seagrass meadows
near a coastal city: Flow-on from research to environmental improvement plans. Marine Pollution Bulletin,
64: 932-940.
Nayar, S., Collings, G. J., Miller, D. J., Bryars, S. and Cheshire, A. C. (2009). Uptake and resource allocation
of inorganic carbon by the temperate seagrasses Posidonia and Amphibolis. Journal of Experimental Marine
Biology and Ecology, 373(2): 87-95.
Noell, C. J., O’Neill, M. F., Carroll, J. D. and Dixon, C. D. (2015). A bio‐economic model for South Australia’s
prawn trawl fisheries. Final Report. South Australian Research and Development Institute (Aquatic Sciences).
Adelaide. CRC Project No. 2011/750. 115pp.
Page, B., Goldsworthy, S. D., McLeay, L., Wiebkin, A., Peters, K., Einoder, L., Rogers, P., Braley, M., Gibbs,
S., McKenzie, J., Huveneers, C., Caines, R., Daly, K., Harrison, S., Baylis, A., Morrice, M., Gill, P., McIntosh,
R., Bool, N. and Ward, T. (2011). The diets of marine predators in southern Australia: assessing the need for
ecosystem-based management of the South Australian sardine fishery. In: Goldsworthy, S. D., Page, B.,
Rogers, P. and Ward, T. M. (Eds). Establishing ecosystem-based management for the South Australian Sardine
Fishery: developing ecological performance indicators and reference points to assess the need for ecological
allocations. Final Report to the Fisheries Research and Development Corporation, PN 2005/031.SARDI
Publication No. F2010/000863-1. SARDI Research Report Series No. 529. South Australian Research and
Development Institute, pp. 31-60.
Page, B., McKenzie, J. and Goldsworthy, S. D. (2005). Dietary resource partitioning among sympatric New
Zealand and Australian fur seals. Marine Ecology Progress Series, 293: 283-302.
Page, B., McKenzie, J., Sumner, M. D., Coyne, M. and Goldsworthy, S. D. (2006). Spatial separation of
foraging habitats among New Zealand fur seals. Marine Ecology Progress Series, 323: 263-279.
Paulin, C. D. (1990). Pagrus auratus, a new combination for the species known as “snapper” in Australasian
waters (Pisces: Sparidae). New Zealand Journal of Marine and Freshwater Research, 24: 259-265.

A trophic model for Gulf St Vincent: balancing exploitation of three fisheries 102
Pauly, D. (1980). On the interrelationship between natural mortality, growth parameters, and mean
environmental temperature in 175 fish sticks. Journal du Conseil International pour l'Exploration de la Mer,
39(2): 175-192.
Pauly, D., Christensen, V., Dalsgaard, J., Froese, R. and Torres, F. J. (1998). Fishing down marine food webs.
Science, 279: 860-863.
Pauly, D., Christensen, V. and Walters, C. (2000). Ecopath, Ecosim, and Ecospace as tools for evaluating
ecosystem impact of fisheries. ICES Journal of Marine Science, 57: 697–706.
Pauly, D. and Palomares, M. L. (2005). Fishing down marine food webs: it is far more pervasive than we
thought. Bulletin of Marine Science, 76: 197-211.
Pikitch, E., Santora, C., Babcock, E., Bakun, A., Bonfil, R., Conover, D., Dayton, P., et al., Doukakis, P.,
Fluharty, D. and Heneman, B. (2004). Ecosystem-based fishery management. Science, 305(5682): 346-347.
Piroddi, C., Bearzi, G. and Christensen, V. (2010). Effects of local fisheries and ocean productivity on the
northeastern Ionian Sea ecosystem. Ecological Modelling, 221: 1526-1544.
Poiner, I. R., Glaister, J., Pitcher, R., Burridge, C., Wassenberg, T. J., Gribble, N., Hill, B., Blaber, S., Milton,
D., Brewer, D. and Ellis, N. (1998). Final report on effects of trawling in the Far Northern Section of the Great
Barrier Reef: 1991-1996. CSIRO Division of Marine Research, Cleveland.
Polovina, J. J. (1984). Model of a coral reef ecosystem. The ECOPATH model and its application to French
Frigate Shoals. Coral Reefs, 3: 1-11.
Riordan, J. and Johnston, G. (2013). Morphological Sex Determination in Black-faced Cormorants
(Phalacrocorax fuscescens). Waterbirds, 36(1): 94-101.
Ritchie, E. G. and Johnson, C. N. (2009). Predator interactions, mesopredator release and biodiversity
conservation. Ecology letters, 12(9): 982-998.
Roberts, S. D. and Steer, M. A. (2010). By-product assessment in the Spencer Gulf Prawn Fishery with an
emphasis on developing managment option for Balmain bugs. South Australian Research and Development
Institue (Aquatic Sciences), Adelaide. SARDI Publication No. F2010/000165-1. SARDI Research Report
Series No. 439. 48pp.
Rogers, P., Huveneers, C., Page, B., Hamer, D., Goldsworthy, S. D., Mitchell, J. G. and Seuront, L. (2012). A
quantitative comparison of the diets of sympatric pelagic sharks in gulf and shelf ecosystems off southern
Australia. ICES Journal of Marine Science, 69: 1382–1393.
Sakshaug, E. (1997). Biomass and productivity distributions and their variability in the Barents Sea. ICES
Journal of Marine Science, 54: 341-350.
Shannon, L. J., Neira, S. and Taylor, M. (2008). Comparing internal and external drivers in the southern
Benguela and the southern and northern Humboldt upwelling ecosystems. African Journal of Marine Science,
30: 63-84.
Shaughnessy, P. D., Goldsworthy, S. D., Burch, P. and Dennis, T. E. (2013). Pup numbers of the Australian
sea lion (Neophoca cinerea) at The Pages Islands, South Australia, over two decades. Australian Journal of
Zoology, 61: 112-118.
Shaughnessy, P. D., Goldsworthy, S. D., Hamer, D. J., Page, B. and McIntosh, R. R. (2011). Australian sea
lions Neophoca cinerea at colonies in South Australia: distribution and abundance, 2004 to 2008. Endangered
Species Research, 13: 87-98.
Shaughnessy, P. D., Goldsworthy, S. D. and Mackay, A. I. (2015). The long-nosed fur seal in South Australia
in 2013-14; abundance, status and trends. Australian Journal of Zoology, 63: 101-110.
Shaughnessy, P. D., McIntosh, R. R., Goldsworthy, S. D., Dennis, T. E. and Berris, M. (2006). Trends in
abundance of Australian sea lions, Neophoca cinerea, at Seal Bay, Kangaroo Island, South Australia. Sea
Lions of the World, Anchorage, Alaska, USA.
Shepherd, S. A. (1972). Studies on southern Australian abalone (genus Haliotis) I. Ecology of five sympatric
species. Australian Journal of Marine and Freshwater Research, 24: 217-257.

A trophic model for Gulf St Vincent: balancing exploitation of three fisheries 103
Simpfendorfer, C. A., McAuley, R., Chidlow, J. and Unsworth, P. (2002). Validated age and growth of the
dusky shark, Carcharhinus obscurus, from Western Australian waters. Marine and Freshwater Research, 53:
567-573.
Steer, M. A., Lloyd, M. T. and Jackson, W. B. (2007). Southern Calamary (Sepioteuthis australis) Fishery.
Fishery Assessment Report to PIRSA. South Australian Research and Development Institute (Aquatic
Sciences). Adelaide. SARDI Publication No. F2007/000528-2. SARDI Research Report Series No. 229. 82pp.
Steer, M. A., McGarvey, R., Carroll, J., Jackson, W. B., Lloyd, M. T. and Feenstra, J. E. (2016). Southern
Garfish (Hyporhamphus melanochir) Fishery. Fishery Assessment Report to PIRSA Fisheries and
Aquaculture. South Australian Research and Development Institute (Aquatic Sciences). Adelaide. SARDI
Publication No. F2007/000720-4. SARDI Research Report Series No. 891. 75pp.
Steer, M. A., McGarvey, R., Fowler, A. J., Burch, P., Feenstra, J. E., Jackson, W. B. and Lloyd, M. T. (2012).
Southern Garfish (Hyporhamphus melanochir) Fishery. Report to PIRSA Fisheries and Aquaculture. South
Australian Research and Development Institute (Aquatic Sciences). Adelaide. SARDI Publication No.
F2007/000720-3. SARDI Research Report Series No. 658. 76pp.
Svane, I. (2003). Prawn fishery bycatch and sicards: fates and consequences for a marine ecosystem. Final
Report FRDC Project No. 1998/225. SARDI Aquatic Sciences, Adelaide.
Svane, I. (2005). Occurrence of dolphins and seabirds and their consumption of by-catch during prawn trawling
in Spencer Gulf, South Australia. Fisheries Research, 76(3): 317-327.
Triantafillos, L. (2008). Chpter 32. Cephalopods of Gulf St Vincent. In: Shepherd, S. A., Bryars, S.,
Kirkegaard, I., Harbinson, P. and Jennings, J. T. (Eds). Natural History of Gulf St Vincent. Royal Society of
South Australia Inc, Adelaide, pp. 437-447.
Tsikliras, A. C., Dinouli, A., Tsiros, V.-Z. and Tsalkou, E. (2015). The Mediterranean and Black Sea Fisheries
at Risk from Overexploitation. PLoS ONE, 10(3): e0121188.
van Ruth, P. (2008). Chapter 23 Plankton in Gulf St Vincent and Investigator Strait. In: Shepherd, S. A.,
Bryars, S., Kirkegaard, I., Harbison, P. and Jennings, J. T. (Eds). Natural History of Gulf St Vincent. Royal
Adelaide Society of South Australia, Adelaide, pp. 317-323.
van Ruth, P. D. (2012). Adelaide Desalination Project Plankton Characterisation Study - Phase 2. Report
prepared for Adelaide Aqua. South Australian Research and Development Institute (Aquatic Sciences).
Adelaide. SARDI Publication No. F2010/000378-2. SARDI Research Report Series No. 606. 40pp.
Walter, J. P. and Ebert, D. A. (1991). Preliminary estimates of age of the bronze whaler Carcharhinus
brachyurus (Chondrichthyes: Carcharhinidae) from southern Africa, with a review of some life history
parameters. South African Journal of Marine Science, 10: 37-44.
Walters, C., Pauly, D. and Christensen, V. (1999). Ecospace: prediction of mesoscale spatial patterns in trophic
relationships of exploited ecosystems, with emphasis on the impacts of marine protected areas. Ecosystems,
2(6): 539-554.
Walters, C. J., Christensen, V. and Pauly, D. (1997). Structuring dynamic models of exploited ecosystems
from trophic mass-balance assessments. Reviews in Fish Biology and Fisheries, 7: 139-172.
Ward, T. M., McLeay, L. J., Dimmlich, W. F., Rogers, P. J., McClatchie, S. A. M., Matthews, R., Kampf, J.
and Van Ruth, P. D. (2006). Pelagic ecology of a northern boundary current system: effects of upwelling on
the production and distribution of sardine (Sardinops sagax), anchovy (Engraulis australis) and southern
bluefin tuna (Thunnus maccoyii) in the Great Australian Bight. Fisheries Oceanography, 15(3): 191-207.
Ward, T. M., Whitten, A. R. and Ivey, A. R. (2015). South Australian Sardine (Sardinops sagax) Fishery:
Stock Assessment Report 2015. Report to PIRSA Fisheries and Aquaculture. South Australian Research and
Development Institute (Aquatic Sciences). Adelaide. SARDI Publication No. F2007/000765-5. SARDI
Research Report Series No. 877. 103pp.
Warham, J. (1996). The behaviour, population biology and physiology of the petrels. Acedemic Press: London,
UK.
Weimerskirch, H. and Cherel, Y. (1998). Feeding ecology of short-tailed shearwaters: breeding in Tasmania
and foraging in the Antarctic? Marine Ecology-Progress Series, 167: 261-274.

A trophic model for Gulf St Vincent: balancing exploitation of three fisheries 104
Weng, K. C., Castilho, P. C., Morrissette, J. M., Landeira-Fernandez, A. M., Holts, D. B., Schallert, R. J.,
Goldman, K. J. and Block, B. A. (2005). Satellite Tagging and Cardiac Physiology Reveal Nich Expansion in
Salmon Sharks. Science, 310: 104-106.
Wiebkin, A. (2011a). Conservation managment priorities for little penguin populations in Gulf St Vincent.
Report to the Adelaide and Mount Lofty Ranges Natural Resources Managment Board. South Australian
Research and Development Institute (Aquatic Sciences), Adelaide. SARDI Publication No. F2011/000188-1.
SARDI Research Report Series No. 588. 97 pp.
Wiebkin, A. (2011b). Feeding and Breeding Ecology of Little Penguins (Eudyptula minor) in the Eastern Great
Australian Bight. The University of Adelaide, South Australia. 191 pp.
Wilson, D., Curtotti, R., Begg, G. and Phillips, K. (2009). Fishery status reports 2008: status of fish stocks and
fisheries managmed by the Australian Government. Bureau of Rural Sciences and Australian Bureau of
Agriculture and Resource Economics: Canberra.
Winship, A. J., Trites, A. W. and Rosen, D. A. (2002). A bioenergetic model for estimating the food
requirements of Steller sea lions Eumatopias jubatus in Alaska, USA. Marine Ecology Progress Series, 229:
291-312.
Wintner, S. P. and Cliff, G. (1999). Age and growth determinations of the white shark Carcharodon
carcharias, from the east coast of South Africa. Fisheries Bulletin, 153: 153-169.
Wooller, R. D., Bradley, J. S., Skira, I. J. and Serventy, D. L. (1990). Reproductive success of short-tailed
shearwaters Puffinus-tenuirostris in relation to their age and breeding experience. Journal of Animal Ecology,
59(1): 161-170.
Young, J. W., Bradford, R. W., Lamb, T. D. and Lyne, V. D. (1996). Biomass of zooplankton and micronekton
in the southern bluefin tuna fishing grounds off eastern Tasmania, Australia. Marine Ecology-Progress Series,
138(1-3): 1-14.
Zhou, S., Smith, A. D., Punt, A. E., Richardson, A. J., Gibbs, M., Fulton, E. A., Pascoe, S., Bulman, C., Bayliss,
P. and Sainsbury, K. (2010). Ecosystem-based fisheries management requires a change to the selective fishing
philosophy. Proceedings of the National Academy of Sciences, 107(21): 9485-9489.