Embed Size (px)
DESCRIPTION
g3data
Citation preview

A tutorial for g3data 2011-1-21

1. It is supposed that the source files have been downloaded.
2. Unzip anyone of them
3. You can see there is a new folder:
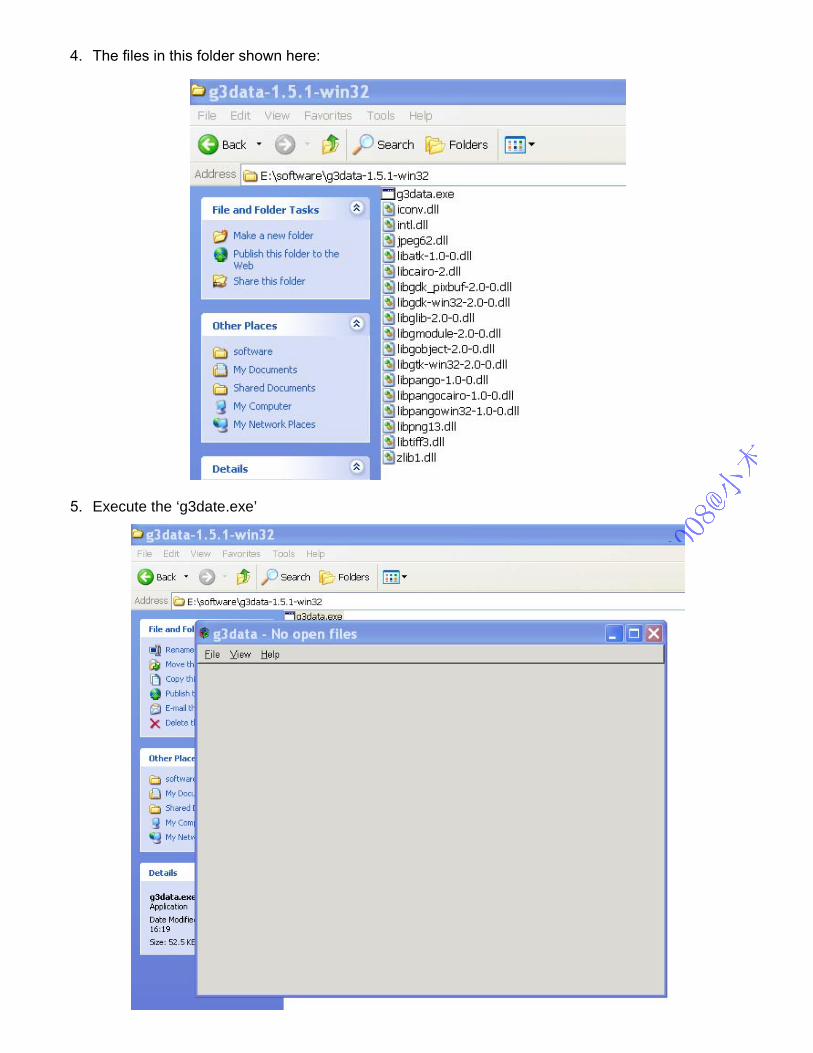
4. The files in this folder shown here:
5. Execute the ‘g3date.exe’

6. ‘File –Open’, now you will open a graph in your pc.
7. Open it.

8. The main page of this software:
9. It is necessary to choose four points to fix the coordinates of the two axes. You should click the
button ‘set point X1 on X axis (1)’ first, then you put your mouse to the point you want to set in your graph. In this tutorial, we set the 0.001 in X axis as the first point. You can see your point in the “Zoom area” left. And then input the value 0.001 behind the “X1 value”.

10. The second X axis point, point 1 is chosen here. See it in the Zoom area.
11. Here, set the first point of Y axis.

12. Set the second point in Y axis.
13. Since the X axis is logarithmic, you should mark the “X axis is logarithmic” in the left. Of course not for Y axis here.

14. Now we will “pick out” the point we want. What you need to do is just click the points you want in the graph. The Zoom area will help you to choose the right point. The first one(take the blue point as example):
15. The second one:

16. The third one:
17. After the fourth one, maybe you don’t know how to export the data you have chosen, now you should press “F5” or “View---Zoom area” to switch the “Zoom area”.

18. Now you can see the “Action” in the left. You can export you data in two ways as you like.
19. The data is exported in the file named “test.JPG.dat”.

20. Data here, it’s over. Congratulations!
Author of g3data: Jonas Frantz
Homepage: http://www.frantz.fi/index.php?page=main