Embed Size (px)
Citation preview
A Tutorial on Using RiceGeneThresher Web-based Application
Supat Thongjuea
February 9, 2007

RiceGeneThresher Tutorial for Users 1. RiceGeneThresher Concept In the pre-genomic era, targeting the genes responsible for controlling traits depended solely on the use of genetics and molecular biological approaches. Quantitative trait locus (QTL) mapping has been widely used for nearly two decades during which molecular markers have become available in conjunction with interval mapping. The QTL is determined to be located near a marker if phenotypic values for the trait are significantly different among the marker genotypes. The use of genome mapping strategy requires probability statistics to identify the gene positions followed by positional cloning to identify the underlying genes. However, genome mapping followed by positional cloning approaches make the use laborious, lose time and is costly. In the post-genomic era, after the completion of the rice genome, many publicly useful biological data were released. High-throughput technologies such as transcriptomics, proteomics, and gene-tagging approaches are greatly increasing the volume of information to assist genes function identification. Therefore, this is a great opportunity to employ the biological information obtained from the public domain to completely characterize genes of interest. Thus, RiceGeneThresher concept aims to provide a bioinformatics approach to find the most promising candidate genes in a candidate region indicated by quantitative trait loci (QTLs). As there are usually hundreds of genes in a QTL region, narrowing them down to a smaller number is one of the most important thing to do in order to proceed to further validation steps (Figure 1).
Figure 1 RiceGeneThresher Strategy

2. RiceGeneThresher Web-based Application RiceGeneThresher web-based application is the front-end of RiceGeneThresher database. Its function is to be a bioinformatics tool for determination of the number, location, regulation and the interaction of genes in the QTL interval that will enable biologists to discover new knowledge across the specific domain boundaries from sequences to expressions, structures, and pathways. RiceGeneThresher is available as an interactive web-based application at http://rice.kps.ku.ac.th. There are two ways for users to access RiceGeneThresher web-based application:
1. Access by querying DNA sequences to do similarity searching against the rice genome by using BLAT program (Feature 1 of Figure 2).
2. Access by querying the name of DNA markers (Feature 2 of Figure 2).
To give an explanation on how to use RiceGeneThresher to narrow down likely candidate genes from thousand of genes existing in chromosomal intervals, we will take the study of the salt tolerance under the trait study of K+/Na+ ratio as an example. In the background knowledge from the QTL mapping method (Ren, Gao et al. 2005), we know that the major QTL of K+/Na+ ratio trait is mapped on the chromosome 1 between DNA marker C955 and E50811. Thus, users can use the name of theses two DNA markers to search the flanking genome region by using the feature 2 or they can retrieve DNA sequences of C955 and E50811 from NCBI and then use the feature 1 to find the location of DNA markers on the rice genome physical map.
To use RiceGeneThresher, users have to fulfill the requirements of RiceGeneThresher web-based application which consist of:
1. Microsoft Internet Explorer (IE) (Version >=5.0) 2. SVG plug-in (http://www.adobe.com/svg/).
* Users can use Mozilla Firefox instead of IE, but they should be sure that the
SVG plug-in is supported by Mozilla Firefox. To install SVG adobe’s plug-in in Mozilla Firefox, users have to read the instructions available at http://www.mozilla.org/projects/svg/faq.html#iasv
Users type the address http://rice.kps.ku.ac.th in IE web browser to open RiceGeneThresher website. SVG plug-in is required to display the graphical users interface. Hence, before using RiceGeneThresher, users must check that it is installed. Users can target the genome region of interest by entering DNA markers C955 and E50811 as the input information. To mine biological information found in the flanking genome region between these two DNA markers, users can use the names of DNA marker or DNA sequences of theses DNA markers to query with the feature 1 for DNA sequences and feature 2 for the names of DNA markers in RiceGeneThresher Entering System web page (Figure 2). To use DNA sequence as the input information, related DNA sequences of markers C955 and E50811, accession numbers C98172, D15615 and AU030244 respectively, must be retrieved from NCBI and their DNA sequences must be saved under FASTA file format (Figure 3). Then, DNA sequences become the input in the submission form of feature 1 for doing similarity searching against rice genome (Figure 4A). Before users can click on the search button, they have to select the database sources from a list box. In this version of RiceGeneThresher, we prepared only data sources from RiceGeneThresher database which manage rice biological information obtained from TIGR’s

pseudomolecules released 3. The result from searching by using DNA sequence is depicted in Figure 4B.
Title of RiceGeneThresher web site
RiceGeneThresher’s logo Menu bar for linking to other information in this website Data sources of RiceGeneThresher web-based tool Feature1: Entering to the system by querying DNA sequences to search against the rice genome by using BLAT program Feature2: Entering to the system by querying the name of DNA markers
Figure 2 RiceGeneThresher Entering Web Page
1
2
3
4
5
6

Figure 3 Related DNA Sequence in FASTA format of DNA markers C955 and E50811

Figure 4 (A) RiceGeneThresher submission form of searching by entering DNA sequences of DNA markers, (B) Result from searching consists of: graphic of flanked genome region, result from the similarity searching between the query (DNA sequences of DNA markers) and the subject (rice genome) (%identity, E-values, and hit scores), and the option to manually re-define the genome region of interest. If users want to mine the genome region of interest, they can use a mouse to click on the submission button.

There is another way to use DNA marker names as the input information. Markers name C955 and E50811 are queried in the feature 2 of the submission form (Figure 5A). Before users can click on the search button, they have to select the database sources from a list box. Figure 5B describes the result of searching DNA marker names against database and consists of a graphic of the location on the chromosome of the searched DNA markers, details of each DNA marker such as accession number, name, start position on the physical map, end position on the physical map and marker types. In addition, it provides the option for users to manually re-define the genome region of interest. If users want to mine the rice biological information in this genome region, they can use a mouse to click on the QTL mining submission button.
Figure 5 (A) RiceGeneThresher submission form for searching by entering DNA marker names, (B) Result from searching consists of: graphic of flanked genome region, information of each searching DNA marker, and the option to manually re-define genome region of interest. If users want to mine the genome region of interest, they can use a mouse to click on the QTL mining submission button.
2.1 Biological Information Obtained from Mining the Interested Genome Region
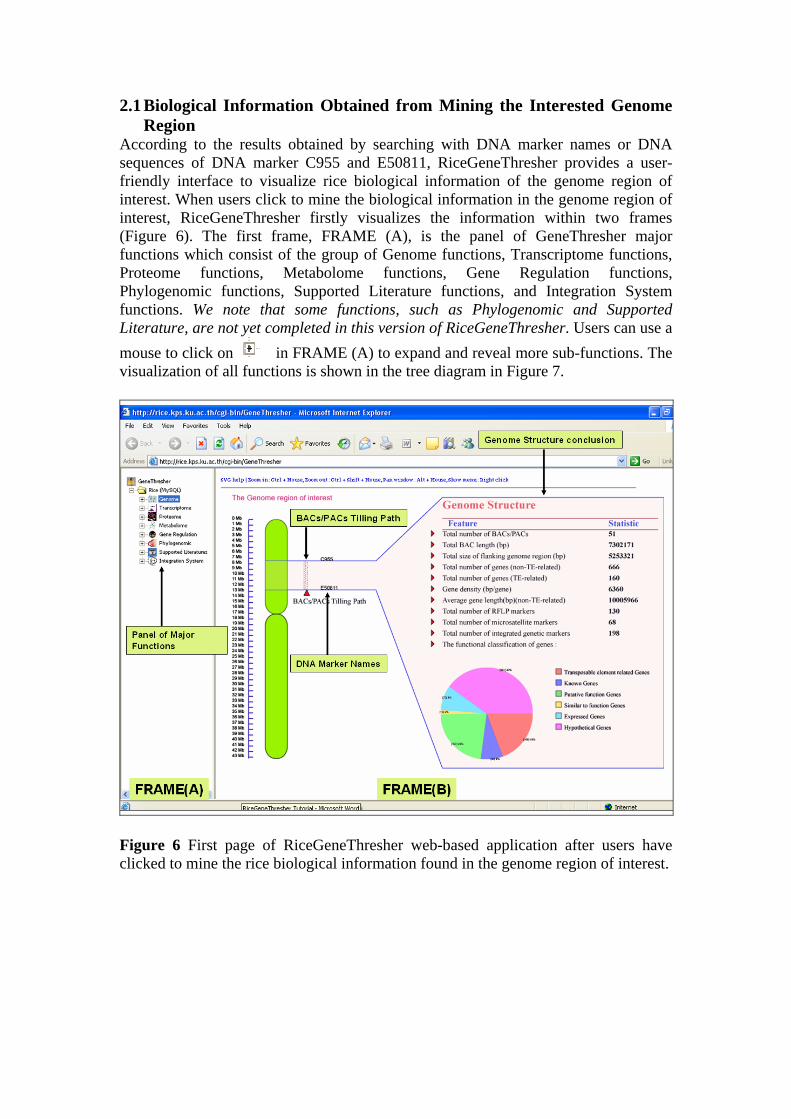
According to the results obtained by searching with DNA marker names or DNA sequences of DNA marker C955 and E50811, RiceGeneThresher provides a user-friendly interface to visualize rice biological information of the genome region of interest. When users click to mine the biological information in the genome region of interest, RiceGeneThresher firstly visualizes the information within two frames (Figure 6). The first frame, FRAME (A), is the panel of GeneThresher major functions which consist of the group of Genome functions, Transcriptome functions, Proteome functions, Metabolome functions, Gene Regulation functions, Phylogenomic functions, Supported Literature functions, and Integration System functions. We note that some functions, such as Phylogenomic and Supported Literature, are not yet completed in this version of RiceGeneThresher. Users can use a mouse to click on in FRAME (A) to expand and reveal more sub-functions. The visualization of all functions is shown in the tree diagram in Figure 7.
Figure 6 First page of RiceGeneThresher web-based application after users have clicked to mine the rice biological information found in the genome region of interest.

Figure 7 Expanded functions in FRAME (A)

The second frame, FRAME (B), is the page corresponding to the functions in FRAME (A). When users click on the submission button to mine the genome region of interest, the default page of FRAME (B) will show the corresponding page of Genome structure function. Genome structure function is the sub-function of Genome feature. 2.1.1 Genome Feature There are 12 sub-functions under Genome feature consisting of “Genome structure”, “BACs/PACs”, “Known Genes”, “Putative Protein Genes”, “Similar to Protein Genes”, “Expressed Genes”, “Hypothetical Genes”, “TE-related Genes”, “RFLP Fragments”, “Microsatellite Markers”, “Putative SSRs”, and “All Genome Information”. All of theses functions have corresponding pages shown in FRAME (B). For example, when users click on the Genome structure function in FRAME (A), the graphic of Genome structure (Figure 8) is shown in FRAME (B).
Figure 8 Genome Structure Genome Structure Function Genome Structure Function contains information on the rice genome structure in the genome region of interest. Figure 8 explains the genome structure of genome region between flanking DNA marker C955 and E50811. Genome Structure has the feature of genome information. For example, you can see the graphic of the chromosome - mostly for this genome region -, graphic of BACs/PACs tilling path and graphic of genome featuring statistics, such as the total number of BACs/PACs, total genome size, total number of genes, total number of TE-related genes, calculation of gene

density, calculation of average gene length, total number of RFLP markers, total number of microsatellite markers, total number of integrated genetic markers, and the functional classification of genes. The functional classification of genes is related to the TIGR’s rice genome annotation release 3. Genes found in this genome region are divided into group of functions depicted by the pine chart. Each detail listed on this web page (Figure 8) links to corresponding pages where additional biological information is available. To do so, users can click on the texts or on the graphics of interest. BACs/PACs Function
Figure 9 BACs/PACs Figure 9 The BACs/PACs function is used to show the details of the BACs/PACs information located in that particular genome region. The table format consists of the number of BACs/PACs, Clone name, NCBI’s accession number, position of the 5’ end on the physical map and position of 3’ end on the physical map. To get more information on the clones, users have to use a mouse to click on the NCBI’s accession number. Then, the corresponding page will link to GenBank to get more information for each BAC or PAC. Known Genes Function Figure 10 describes Known Genes Function. This function is used to show the details of rice genes located in the genome region of interest, which were annotated and categorized into a group of known genes. The function displays genes information in a tables format consisting of the gene number, gene name, functional annotation, start position on the physical map, end position on the physical map, and the gene direction. To see more information for each gene, users can use a mouse to click on the gene of interest. Then, the corresponding page of each gene will show additional information for that gene. For example, if users want to see more details of gene name “LOC_os01g22520”, they just click on the gene name and then details of gene “LOC_os01g22520” will be shown ranging from Figure 11 to Figure 18.

RiceGeneThresher provides information for genes such as graphic of gene location on the chromosome, related full-length cDNAs and related Affymetrix rice genechip positioned on that gene (Figure 11).
Figure 10 Known Genes
Figure 11 Location of the gene “LOC_os01g22520” on the physical map and positions of related full-length cDNAs and related Affymetrix rice genechip located on that gene.

Other information for each gene are shown, such as DNA sequence of a gene (Figure 12), graphic of putative transcription factor binding site located in the promoter region for that gene (Figure 13), Coding sequences and translation protein sequences (Figure 14), BlastP result (Figure 15), Interproscan result (Figure 16), GO terms (Figure 17) as well as the result of mapping the gene to the metabolic pathways (Figure 18).
Figure 12 DNA sequences of gene “LOC_os01g22520”
Figure 13 Graphic of putative transcription factor binding site located in front of 500 bp from the start codon of gene “LOC_os01g22520” scanned by Patser program.

Figure 14 Coding sequences and the translated protein sequences of gene “LOC_os01g22520”
Figure 15 Result of querying translation protein sequence of gene “LOC_os01g22520” against the BlastP web service of EBI by using the uniprot database.

Figure 16 Result of Interproscan from the queried translated protein sequences of gene “LOC_os01g22520”.
Figure 17 GO term of gene “LOC_os01g22520” analyzed by Interpro2GO.

Figure 18 Mapping translated protein of gene “LOC_os01g22520” into the KEGG metabolic pathways Putative Protein Genes Function/ Similar to Protein Genes Function/ Expressed Genes Function/ Hypothetical Genes Function/ TE-related Genes Function All theses functions show the details of rice genes located in the genome region of interest which were annotated and categorized into a group of functional annotation from TIGR’s rice genome annotation release 3. Also, the Known Gene Function displays genes information in a table format consisting of the gene number, gene name, functional annotation, start position on the physical map, end position on the physical map, and gene direction. To see more information for each gene, users can use a mouse to click on the gene of interest. Then, the corresponding page of each gene will show more information for that gene. RFLPs Fragments Function / Microsatellite Markers Function RFLPs Fragments and Microsatellite Markers functions show the details of two types of DNA markers located in the genome region of interest (Figure 19, Figure 20). All of theses DNA markers were obtained from various rice genetic maps, the most important one is the GRAMENE database (Ware, Jaiswal et al. 2002). 9,858 DNA markers were collected from 94 different genetic maps listed on GRAMENE website. Another source is the Japanese Rice Genome Program (RGP). RGP released 3,599 RGP markers for the latest high-density rice genetic map. DNA markers were positioned on the physical map by using a similarity searching method by BLAT (Kent 2002) for DNA marker sequences and by Electronic PCR (Schuler 1997) for DNA marker primers. Theses two functions display DNA markers information in a table format consisting of DNA marker number, chromosome, accession number, name, types, position of 5’ end on the physical map and position of 3’ end on the physical map. To get more information for each DNA marker, users can use a mouse to click on the marker name to obtain DNA marker details from GRAMENE database or to click on the accession number to link to GenBank.

Figure 19 RFLPs Fragments Function
Figure 20 Microsatellite Markers Function

Putative SSRs Function Putative SSRs function displays simple sequence repeats information in a table format consisting of number, chromosome, DNA motif types, Motif repeats, position of 5’ end on the physical map and position of 3’ end on the physical map (Figure 21).
Figure 21 Putative SSRs Function All Genome Information Function All genome information function integrates the results of many genome functions into one page. This function display all genome information in a table format consisting of number, chromosome, name, annotation details, strand, type of information, position of 5’ end on the physical map, position of 3’ end on the physical map (Figure 22). In addition, if users want to design primers near the genes of interest, Design Primer Function will provide an easy way to design primers. Users can select SSRs of interest located near genes and then click on the Design Primer Function links. Design Primer Function then retrieves DNA sequence in that genome region and shows them on the web page. After that, users can get the boundary DNA sequence of interest by inputing the upstream position and downstream position. Then, users have to click on the design primer button to send retrieving DNA sequences to the primer3 program (Figure 23).

Figure 22 All Genome Information Function
Figure 23 Query page for designing primer with the primer3 program

2.1.2 Transcriptome Feature The transcriptome feature has 2 sub-functions consisting of “ESTs” and “Microarray”. Presently, RiceGeneThresher provides only ESTs information. However, we are now developing the system to integrate microarray information into the RiceGeneThresher system. We will add it in the near future. Now, Rice’s ESTs from GeneBank database (around 160 ESTs experiments and more than 400,000 ESTs) are stored in our database. RiceGeneThresher groups ESTs information into 2 groups. The first group is sorted by the title of experiments. The second group depends of the ESTs tissue type. RiceGEneThresher provides a function to explore from which experiments or which tissue types are the ESTs found in the genome region of interest. Figure 24 depicts the number of ESTs in each experiment located in the genome region between DNA marker C955 and E50811. If users want to see more details about the hits between genes in the genome region and ESTs in each experiment, they can click on the number of ESTs shown in front of theirs experiments. The corresponding page is shown in Figure 25.
Figure 24 EST found in the genome region between DNA marker C955 and E50811 grouped by title of experiments.

To give an explanation on how to use RiceGeneThresher to narrow down likely candidate genes for the salt tolerance under the trait study of K+/Na+ ratio existing in chromosomal intervals by using ESTs information, users should select the ESTs experiments related to the salt experiments. For example, users should select the experiment title “A cDNA library from Oryza sativa cv. Pokkali leaves enriched for salt-responsive genes” to find genes which are hit by the ESTs in this experiment. Figure 25 is the page displayed when users click on the number of ESTs from the experiment “A cDNA library from Oryza sativa cv. Pokkali leaves enriched for salt-responsive genes”. In the web page (Figure 25), there are 10 genes which hit with the ESTs from this experiment. Users can see more details in the visualization mode about the hit information between genes and ESTs, such as the hit score, % identity, E-value, and the position of ESTs on genes.
The second group is sorted by tissue type, and has the same function and visualization style. Users can use a mouse to click on “Grouping ESTs by tissue type” panel. Then this function will allow visualization of the number of ESTs grouped by tissue types which hit the genome region of interest.

Figure 25 Hits between genes in the genome region of interest and ESTs from the experiment “A cDNA library from Oryza sativa cv. Pokkali leaves enriched for salt-responsive genes”

2.1.3 Proteome Feature Proteome feature has 2 sub-functions consisting of “Protein Domains” and “GO terms”. Protein Domains in RiceGeneThresher database were analyzed by Interproscan program. RiceGeneThresher groups genes coding proteins which have the same Interpro name into categories. RiceGeneThresher provides the Protein Domain function used to explore genes which have the same Interpro name found in the genome region of interest. Figure 26 describes the number of genes coding proteins categorized in the same Interpro name and located in the genome region between DNA marker C955 and E50811. In figure 26, there are three columns. The first column is the number of genes coding proteins. The second column is the related accession of InterPro ID. And the last column is the Interpro protein domain name. If users want to see more details on the genes that have the protein domains of interest found in this genome region, they can use a mouse to click on the number of genes coding proteins. Then the genes information is displayed with graphical interface. For each accession of InterPro, the information is linked to the EBI web site (http://www.ebi.ac.uk/interpro/). Thus, users can use that web site to extend the protein family information of interest.
Figure 26 Predicted protein domains found in the genome region located between DNA marker C955 and E50811 grouped by Interpro name.

GO terms in RiceGeneThresher database were assigned by Interpro2GO. RiceGeneThresher provides the GO terms function used to explore genes which have the related GO terms categorized into molecular function, biological process and cellular component found in the genome region of interest. Figure 27 describes the number of protein-coding genes categorized into molecular function, biological process, and cellular component located in the genome region between DNA marker C955 and E50811. In figure 26, there are three panels. Each panel is divided into the related GO terms (Molecular function, Biological Process and Cellular Component). In the Molecular Function panel, the first column is the number of proteins-coding genes. The second column is the related accession of InterPro ID. The third column is the GO term id. The fourth column is the major group of GO terms. The last column is the related GO terms for genes found in the genome region. If users want to see more details of the genes having GO terms of interest found in this genome region, they can use a mouse to click on the number of genes coding proteins. Clicking on GO term id will provide extra information related to the gene ontology from QuickGO (http://www.ebi.ac.uk/ego/).
Figure 27 GO terms assignment for genes found in the genome region located between marker C955 and E50811.

2.1.4 Metabolome Feature Metabolome feature has 2 sub-functions consisting of “RiceCyc Pathways” and “KEGG Metabolic Pathways”. In this version of RiceGeneThresher, we only provide the KEGG Metabolic Pathways information. RiceGeneThresher offers KEGG Metabolic Pathways to explore three kinds of pathway information. The first information is the number of protein-coding genes predicted as the enzyme located in the genome region of interest. The second is the number of predicted metabolic pathways found in that genome region. The final information is, in each metabolic pathway, the protein-coding genes involved in that particular metabolic pathway. To browse the three kinds of information, users have to use the “KEGG Metabolic Pathways Function” to visualize the details in the graphical web page, consisting of three columns (Figure 28). The first column is the number of protein-coding genes predicted as enzymes assigned to the metabolic pathways. The second column is the KEGG reference pathway accession. The last column is the name of the metabolic pathways from KEGG. Each number of protein-coding genes is linked to the corresponding web page. If users want to know the information of protein-coding genes predicted as enzymes, they can use a mouse to click on the number of protein-coding genes. The genes information is then displayed. Another way for users to find the information of KEGG metabolic pathways is to use a mouse to click on the name of reference metabolic pathways accession of interest. Then the graphical user interface of each selected pathway is pictured. Visualization for each metabolic pathway is generated online by using KEGG’s web service to draw the metabolic pathway (Figure 29).
Figure 28 Metabolome feature of the flanked genome region between C955 and E50811

Figure 29 Mapping of protein-coding genes found in genome region between DNA markers C955 and E50811 into Starch and Sucrose Metabolism Pathways. 2.1.5 Gene Regulation Feature RiceGeneThresher database contains the information of putative transcription factor binding sites for each rice gene. We analyzed the putative transcription factor binding sites by using the cis-elements alignment matrices from 52 plant’s TFs corresponding to 19 different TF families obtained from TRANSFAC database and literature reviews. To identify putative TF binding sites for each rice gene, the promoter regions (1500 bp upstream of the start codon) from all of rice genes were retrieved and then the pattern searching program called “Patser” was employed to identify the putative transcription factor binding sites.
There are 4 sub-functions inside the Gene Regulation Feature, consisting of “Putative Cis-elements”, “Find the target genes of TFSs”, “Co-localization Analysis”, and “Putative Transcription Factors”. Putative Cis-elements Function Putative Cis-elements Function is used to visualize the putative cis-elements located in front of each rice gene. For example, Figure 30 shows the screenshot of the upstream region of the gene named “LOC_Os01g13520” and the location of putative transcription factor binding sites of that gene. The factor name and family, species, matrix, protein sequences of that transcription factor and the related references are displayed in a pop-up window by clicking on the factor name (Figure 31).

Figure 30 Putative transcription factor binding sites of gene named “LOC_Os01g13520” (the scanned region is 1500 bp upstream of the start codon of a gene)
Figure 31 A corresponding web-page when clicking on the factor name “NtERF2”

Find the Target Genes of TFSs Function Find the Target Genes of TFSs function is used for searching the putative target genes of transcription factor found in the genome region of interest. To find putative target genes of transcription factors, users can input the factor name of interest into the system. Find the Target Genes of TFSs function prepares the web page for users to query the target genes of transcription factors. The information of querying web page consist of the factor name, family, organism, minimum and maximum score of Patser program and the cut-off criterion. If users want to find the putative target genes of transcription factor “RAV1”, they can click on the search button. Then the result from searching will be shown in Figure 33. Figure 33 shows the result of target genes of the transcription factor “RAV1” found in genome region between DNA markers C955 and E50811. The result shown in Figure 33 displays three columns. The first column is the number of putative transcription factor binding sites occurrences in front of each gene. The second column is the factor name. And the last column is the target genes id of the transcription factor “RAV1”. Users can see more details by clicking on the target gene names of interest.
Figure 32 The query web page prepares to search the target genes of transcription factors found in the genome region of interest.

Figure 33 Result of target genes of transcription factor “RAV1” found in genome region between DNA markers C955 and E50811. Co-localization Analysis Gene expression specificity is often mediated by the interaction between TFs that recognize closely spaced binding sites (Singh 1998). To find which two TFs are nearly located in front of the same genes found in the genome region of interest, Co-localization Analysis Function provides a query web page to find those target genes. Figure 34 is the web page prepared for searching the target genes of two transcription factors which are nearly located in front of the same genes. In Figure 34, users can select the two transcription factors of interest by selecting the name of transcription factor with the list box of input factor. Users can specify the input threshold Patser’s score and specify the maximum input length (bp) between two factors. For example, Figure 34 explains how to find the putative target genes of co-localization of two transcription factor “RAV1” and “NtERF2”. The default maximum length between two factors is set up at 50 bp.

Figure 34 The web page prepares for searching the target genes of co-localization of transcription factor “RAV1” and “NtERF2”. Figure 35 explains the result from searching the target gene of co-localization transcription factors “RAV1” and “NtERF2”. The result is depicted in a table format consisting of the target genes id, the name of factor1, the name of factor2, the position of factor1 on the physical map, the position of factor2 on the physical map, the Patser’s score of factor1, the Patser’s score of factor2, the strand of factor1, the strand of factor2, and the length (bp) between theses co-localization factors. User can see more details by clicking on the target genes id.

Figure 35 Putative target genes of co-localization transcription factor “RAV1” and “NtERF2” found in the genome region between DNA marker C955 and E50811. Putative Transcription Factors Function Putative Transcription Factors function is used to visualize the genes found in the genome region of interest which were annotated as putative transcription factors. RiceGeneThresher database contains the putative transcription factors from The Database of Rice Transcription Factors (DRTF)(Gao, Zhong et al. 2006). Figure 36 shows all transcription factors and their information found in the genome region between DNA markers C955 and E50811. The information of putative transcription factors found in this genome region consists of 5 columns. The first column is the number of protein-coding genes which were annotated as putative transcription factors. The second column is the related Interpro id. The third column is the related protein family (Pfam) id. The fourth column is the putative transcription factor family name. And the last column is the description for each type of transcription factor. Users can see more details by clicking on the information of interest.

Figure 36 List all of transcription factors and their information found in the genome region between DNA markers C955 and E50811.

2.2 Manually Giving Biological Evidences to Find the Most Promising Candidate Genes
2.2.1 Integration Feature Integration Feature is the major aspect to use for selecting the most promising candidate genes for the traits of interest. This feature contains “Find Candidate Genes Function”. To use the “Find Candidate Gene Function” for identification the genes that should be involved in controlling the traits of interest, users firstly have to know the biological background to study the characteristics of that trait. For example, to identify Blast resistance genes, users have to know the basic biological information of the resistance genes. Based on biological background for the protein structure of the resistance genes, disease resistance genes should consist of theses common domains: leucine zipper (LZ), coiled coil (CC), nucleotide binding site (NBS), leucine-rich repeat (LRR), protein kinase, Toll-IL-IR homology region (TIR), serine/threonine kinase, and trans-membrane (TM) (Wang, Taramino et al. 2001). Thus, users can input theses biological information to the “Find Candidate Gene Function” for screening the most promising candidate genes. In the case study of salt tolerance, the K+/Na+ ratio trait, users have to input the basic biological information of that trait into the RiceGeneThresher integration system. The related biological information of K+/Na+ ratio trait is obtained from literature reviews and other related abiotic stress experiments. In this case, users should select the related keywords of genome annotation, which have relations with the transporter proteins or cation transporter genes. Additionally, users should select the case of genes that have the transmembrane domains. Furthermore, related EST experiments under salt stress should be selected as the expression information. To provide convenient ways to input biologically supported evidences into the system, RiceGeneThresher provides the function “Find Candidate Genes” to enter the biological information into the RiceGeneThresher integration system. Figure 37 shows the corresponding web page of the “Find Candidate Gene Function”. This web page allowed users to select the biological input. It is classified into 5 types of biological data consisting of Genome Annotation, Transcriptome, Proteome, Metabolome, and Regulation. To give an example of how to find the most promising candidate genes of salt tolerance for trait K+/Na+ ratio, we selected three data types to input into the RiceGeneThresher integration system, which consist of Genome Annotation, Transcriptome, and Proteome. Figure 38 describes the result from input Genome Annotation, Transcriptome, and Proteome into the RiceGeneThresher integration system. Figure 38 shows all the related biological information with the three input data types. It consists of three panels. The first panel is the gene annotation found in the genome region between DNA marker C955 and E50811. The second panel is the list of ESTs experiments hitting the genes in this genome region. The last panel is the protein domains of genes found in this genome region. To select the most promising candidate genes for the trait of K+/Na+ ratio, we selected ESTs supported evidences by checking the check box of related ESTs experiments with the salt tolerance. Those ESTs experiments consist of theses following experiment names.

ESTs Supported Evidences
1. “cDNA library from Oryza sativa cv. Pokkali leaves enriched for salt-responsive genes”.
2. “Isolating and cloning of novel salt stress responsive mRNAs by PCR-based subtractive cloning”.
3. “Monitoring expression profiles of rice (Oryza sativa L.) genes under cold, drought and high-salinity stresses, and ABA application using both cDNA microarray and RNA gel blot analyses”.
4. “Isolation and expression analysis of salt stress-associated ESTs from contrasting rice cultivars using a PCR-based subtraction method”.
Protein Domains Supported Evidences
1. “Cation transporter” 2. “Cation transporting ATPase” 3. “transmembrane”
Figure 37 Web page of the “Find Candidate Genes” function prepared for mining the candidate genes involved in controlling the trait of interest.

Figure 38 Result from inputting the Genome Annotation, Transcriptome, and Proteome into RiceGeneThresher’ integration system Once all evidences are selected by checking the check box, we click on the submit button to find the genes which have the most supported evidences.
Figure 39 Result of finding the most promising candidate genes for the trait of K+/Na+ ratio Figure 39 shows the graph of total number of genes divided by each type of biological supported evidences input. The result show that there are 666 genes found in the

genome region between DNA markers C955 and E50811. There are 655 genes (98.35 %) with no evidences of salt tolerance support. 7 (1.05 %) genes have only ESTs related to salt tolerance support and 4 genes (0.60 %) have only protein domain related with the cation transporter and protein membrane domains. According to the result, by using RiceGeneThresher integration system, we conclude that the candidate genes for the trait study of K+/Na+ ratio are the 11 genes shown in the results below. Candidate Genes from ESTs Supported Evidences Gene No. 1 Gene ID : 11667.t01342 Supported Biological Information
- ESTs Experiment : A cDNA library from Oryza sativa cv. Pokkali leaves enriched for salt-responsive genes
Gene No. 2 Gene ID : 11667.t01428 Supported Biological Information
- ESTs Experiment : A cDNA library from Oryza sativa cv. Pokkali leaves enriched for salt-responsive genes
Gene No. 3 Gene ID : 11667.t01676 Supported Biological Information
- ESTs Experiment : A cDNA library from Oryza sativa cv. Pokkali leaves enriched for salt-responsive genes
Gene No. 4 Gene ID : 11667.t01793 Supported Biological Information
- ESTs Experiment : A cDNA library from Oryza sativa cv. Pokkali leaves enriched for salt-responsive genes
Gene No. 5 Gene ID : 11667.t02006 Supported Biological Information
- ESTs Experiment : A cDNA library from Oryza sativa cv. Pokkali leaves enriched for salt-responsive genes - ESTs Experiment : A cDNA library from Oryza sativa cv. Pokkali leaves enriched for salt-responsive genes
Gene No. 6 Gene ID : 11667.t02044 Supported Biological Information
- ESTs Experiment : A cDNA library from Oryza sativa cv. Pokkali leaves enriched for salt-responsive genes - ESTs Experiment : A cDNA library from Oryza sativa cv. Pokkali leaves enriched for salt-responsive genes

Gene No. 7 Gene ID : 11667.t02054 Supported Biological Information
-ESTs Experiment : A cDNA library from Oryza sativa cv. Pokkali leaves enriched for salt-responsive genes
Candidate Genes from Protein Domain Supported Evidences Gene No. 1 Gene ID : 11667.t01602 Supported Biological Information
- Protein Domain (Interpro ID) : IPR006069 Cation transporting ATPase
Gene No. 2 Gene ID : 11667.t01719 Supported Biological Information
- Protein Domain (Interpro ID) : IPR001140 ABC transporter, transmembrane region
Gene No. 3 Gene ID : 11667.t01838 Supported Biological Information
- Protein Domain (Interpro ID) : IPR004842 Na-K-Cl cotransporter superfamily
Gene No. 4 Gene ID : 11667.t01869 Supported Biological Information
- Protein Domain (Interpro ID) : IPR003445 Cation transporter

REFERENCES Gao, G., Y. Zhong, et al., 2006,"DRTF: a database of rice transcription factors",
Bioinformatics, Vol.22, No.10, pp.1286-1287. Kent, W. J., 2002,"BLAT--the BLAST-like alignment tool", Genome Res, Vol.12,
No.4, pp.656-64. Ren, Z. H., J. P. Gao, et al., 2005,"A rice quantitative trait locus for salt tolerance
encodes a sodium transporter", Nat Genet, Vol.37, No.10, pp.1141-6. Schuler, G. D., 1997,"Sequence mapping by electronic PCR", Genome Res, Vol.7,
No.5, pp.541-50. Singh, K. B., 1998,"Transcriptional Regulation in Plants: The Importance of
Combinatorial Control", Plant Physiol., Vol.118, No.4, pp.1111-1120. Wang, Z., G. Taramino, et al., 2001,"Rice ESTs with disease-resistance gene- or
defense-response gene-like sequences mapped to regions containing major resistance genes or QTLs", Mol Genet Genomics, Vol.265, No.2, pp.302-10.
Ware, D. H., P. Jaiswal, et al., 2002,"Gramene, a tool for grass genomics", Plant
Physiol, Vol.130, No.4, pp.1606-13.