Embed Size (px)
Citation preview
A TWO-DIMENSIONAL MICROFLUIDIC SEPARATION PLATFORM FOR
HIGH-THROUGHPUT GENETIC MUTATIONAL ANALYSIS
By
Jesse Stephen Buch
Thesis submitted to the Faculty of the Graduate School of the University of Maryland, College Park in partial fulfillment
of the requirements for the degree of Doctor of Philosophy
2003
Advisory Committee:
Professor Cheng S. Lee, Chair Professor Dorothy Beckett Professor Douglas English Professor Catherine Fenselau Professor Stephen Mount

© Copyright by
Jesse Stephen Buch
2003
PREFACE
Chapters two and three in this dissertation were co-authored and previously
submitted for publication. Copyright permissions for the reproduced manuscripts
were obtained from the publishers and are indicated on the first page of both
chapters. Furthermore, the inclusion of reproduced manuscripts in this dissertation
is permitted by the Department of Chemistry and Biochemistry and the Graduate
School at the University of Maryland, College Park.
In the cases for both manuscripts, I was the primary author. In addition to
my own written work, contributions from the coauthors named to the manuscripts
constituting chapters two and three of this thesis consisted solely of critiques and
suggested revisions received from my dissertation advisor, Dr. Cheng S. Lee. All
other persons named as coauthors were recognized exclusively for contributions
made to the work that is reported in the manuscripts.
ii

DEDICATION
To Mom, Dad, Ethan, and Aron,
You have always been there to support me in every endeavor I have undertaken. I
can never thank you enough.
To Nancy,
You have stuck by my side in thick and thin throughout this entire process. I could
not have finished without you.
iii
ACKNOWLEDGEMENTS
I would like to thank Dr. Pen-Chang Wang for his help with the work
presented in Chapter 2. Fred Rosenberger and Yan Li provided an immense amount
of fabrication support in fabricating a substantial portion of the silicon templates and
microfluidic devices that were used in the studies presented in Chapter 3 and
Chapter 4. For their help, I am extremely grateful. Christopher Kimball is
gratefully acknowledged for his work with integrated microheaters and sensors that
enabled the development and demonstration of the integrated spatial TGGE device
presented in Chapter 3. I would like to thank Edd Cole for providing invaluable
instruction and assistance with the manufacturing and machining of the custom
hardware required for the work outlined in this dissertation. Dr. Ed Highsmith and
Dr. Caren Chang are also gratefully acknowledged for their assistance in generating
the DNA samples required for the studies presented in Chapter 3 and Chapter 4.
Finally, I would like to acknowledge my advisor, Dr. Cheng S. Lee, for his tutelage
during the course of my studies for the doctor of philosophy degree.
The financial support for this work by the National Cancer Institute (through
Grants R21CA83871 and CA092819) and the Analytical Chemistry Division of the
National Institute of Standards and Technology are gratefully acknowledged.
iv
TABLE OF CONTENTS
List of Tables …………………………………………………………………..… viii.
List of Figures …………………………………………………………………….. ix .
Chapter 1: Background and Significance ……………………………………… 1.
Introduction ………………………………………………………………... 1.
Traditional Methods of Genetic Mutation Detection ……………………… 3.
Two-Dimensional Gene Scanning …………………………………………. 7.
Microfluidics ………………………………………………………………. 9.
2D Microfluidic Separations For Mutation Analysis …………………….. 11.
Project Description ……………………………………………………….. 11.
Chapter 2: Field-Effect Flow Control in a Polydimethylsiloxane-BasedMicrofluidic System ……………………………………………… 16.
Introduction ………………………………………………………………. 16.
Experimental Section ……………………………………………………... 18.
Materials and Reagents …………………………………………… 18.
Fabrication of Silicon Template ………………………………….. 19.
Fabrication of PDMS Microchannel and Assembly of HybridMicrofluidic Device ………………………………………………. 20.
Current-Monitoring of Electroosmotic Flow ……………………... 20.
Partial Modification of Channel Surface with CTAB ……………. 23.
Results and Discussion .…………………………………………………... 23.
Field-Effect Flow Control at Low pHs …………………………… 24.
Field-Effect Flow Control at Higher pHs Assisted by CTABSurface Modification ……………………………………………... 24.
Surface Coverage of Microchannel Under Field-Effect ………….. 25.
v
Microfluidic Devices Versus Capillary Systems in Field- Effect Flow Control ………………………………………………. 27.
Conclusion ………………………………………………………………... 30.
Chapter 3: DNA Mutation Detection In A Polymer MicrofluidicNetwork Using Temperature Gradient Gel Electrophoresis ……... 32
.
Introduction ………………………………………………………………. 32.
Experimental Section ……………………………………………………... 35.
Materials and Reagents …………………………………………… 35.
Device Fabrication ………………………………………………... 35.
Temperature Control Schemes …………………………………… 36.
DNA Samples and PCR Reactions ……………………………….. 39.
TGGE Analysis …………………………………………………... 43.
Results and Discussion ……………...……………………………………. 43.
Externally Generated Temporal Temperature Gradient ………….. 45.
Externally Generated Spatial Temperature Gradient …………….. 49.
Spatial Temperature Gradient Using Integrated Microheater ……. 53.
Conclusion ………………………………………………………………... 55.
Chapter 4: Two-Dimensional Genomic Separations in a PolymerMicrofluidic Network …………………………………………….. 57.
Introduction ………………………………………………………………. 57.
Experimental Section ……………………………………………………... 61.
Materials and Reagents …………………………………………… 61.
DNA Samples and PCR Reactions ……………………………….. 62.
Device Fabrication ………………………………………………... 63.
Temporal Temperature Control …………………………………... 64.
Finite Element Modeling …………………………………………. 64.
2D Microfluidic Mutation Analysis ……………………………… 65.
pH-Mediated Sample Stacking Following Transfer toSecond Dimension ………………………………………………... 65.
vi

Results and Discussion …………………………………………………… 66.
Parallel 2D Microfluidic Network Design ……………………….. 68.
Finite Element Modeling of Network Geometry …………………. 70.
Comprehensive Parallel 2D Microfluidic Analysis ………………. 76.
Second Dimension pH-Mediated Base Stacking Approach ……… 80.
Conclusion ………………………………………………………………... 83.
Chapter 5: Summary and Conclusions ……………………………………….. 87.
References: ……………………………………………………………………….. 92.
vii
LIST OF TABLES
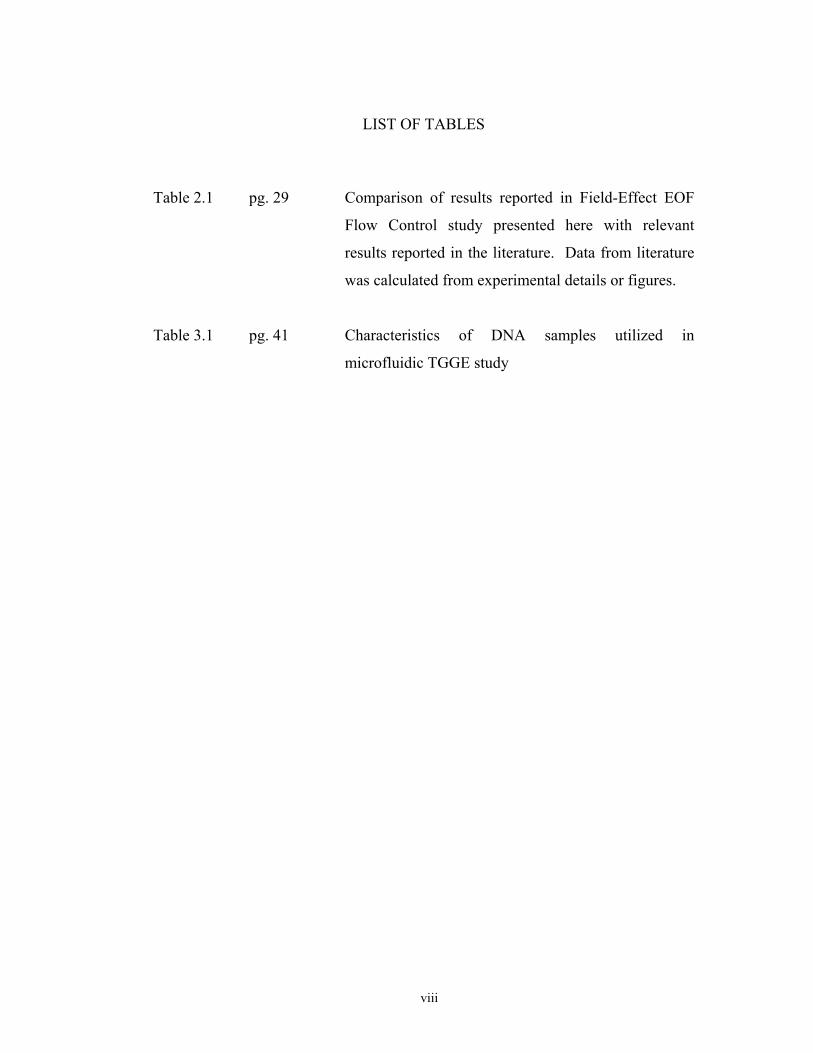
Table 2.1 pg. 29 Comparison of results reported in Field-Effect EOF ……
Flow Control study presented here with relevant ……….…..
results reported in the literature. Data from literature ….
was calculated from experimental details or figures.
Table 3.1 pg. 41 Characteristics of DNA samples utilized in ……………….……...
microfluidic TGGE study
viii
LIST OF FIGURES
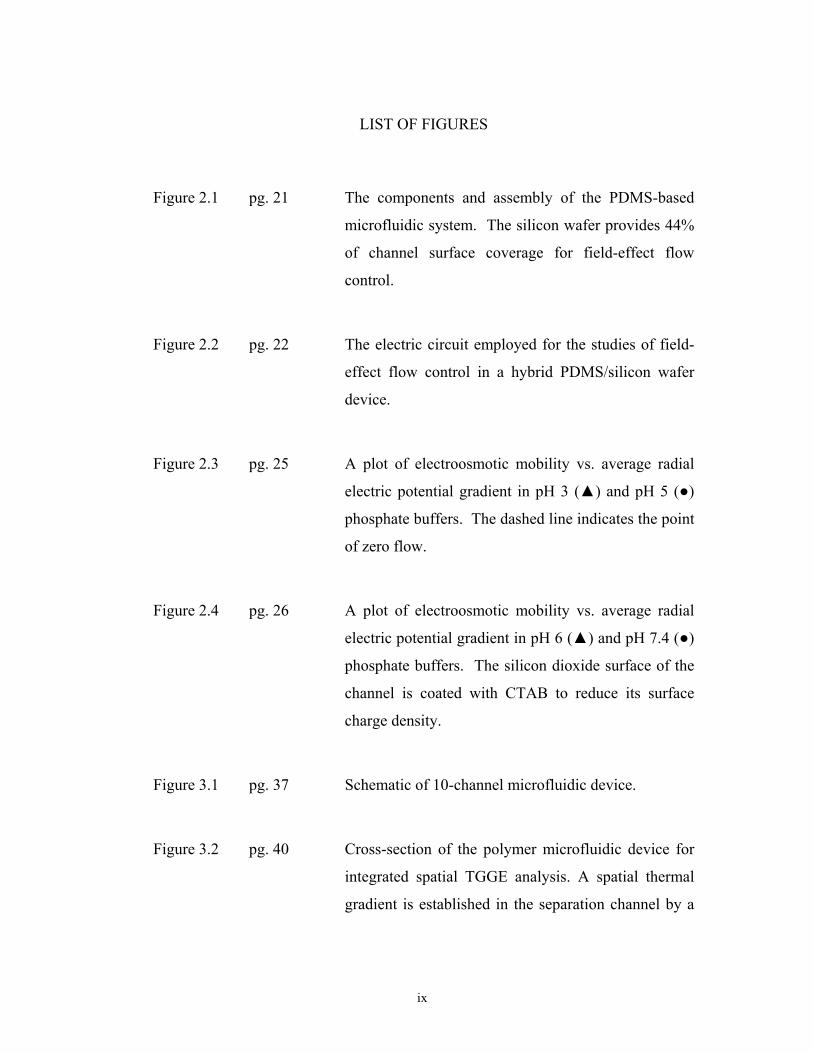
Figure 2.1 pg. 21 The components and assembly of the PDMS-based …………...
microfluidic system. The silicon wafer provides 44%
of channel surface coverage for field-effect flow
control.
Figure 2.2 pg. 22 The electric circuit employed for the studies of field- ………………………………
effect flow control in a hybrid PDMS/silicon wafer
device.
Figure 2.3 pg. 25 A plot of electroosmotic mobility vs. average radial ………………………………….
electric potential gradient in pH 3 ( ) and pH 5 ( )
phosphate buffers. The dashed line indicates the point
of zero flow.
Figure 2.4 pg. 26 A plot of electroosmotic mobility vs. average radial ………………………..
electric potential gradient in pH 6 ( ) and pH 7.4 ( )
phosphate buffers. The silicon dioxide surface of the
channel is coated with CTAB to reduce its surface
charge density.
Figure 3.1 pg. 37 Schematic of 10-channel microfluidic device.
Figure 3.2 pg. 40 Cross-section of the polymer microfluidic device for ……………….
integrated spatial TGGE analysis. A spatial thermal
gradient is established in the separation channel by a
ix
tapered microheater and thermal sensor array that are
patterned on the bottom polycarbonate substrate of the
device.
Figure 3.3 pg. 42 Melt maps for the five samples calculated by Poland …………………..
Analysis software [75]. Traces for each sample
representing the wild-type homoduplex (black line)
and the mismatched mutant heteroduplex (red line)
are superimposed for comparison.
Figure 3.4 pg. 47 Three temporal TGGE electropherograms of Mut100………………………………….
sample illustrating the reproducibility of the analysis.
Analyses are performed sequentially using 4.5% PVP
in 1X TBE under an applied electric field of 150
V/cm. The PVP gel matrix is replaced in the channel
prior to each analysis.
Figure 3.5 pg. 48 Multichannel electropherograms for 10-channel………………………………………
temporal TGGE analysis performed in parallel.
Conditions are identical to those described for Figure
3.4.
Figure 3.6 pg. 52 Spatial TGGE electropherograms for: (a) Mut100; (b) …………………………………
Mut200; (c) Mut300; (d) Mut400; and (e) Mut500 along
with their corresponding reference wild type samples.
Separations were performed under a spatial thermal
gradient of 70-75 oC at electric field strength of 200
V/cm.
x
Figure 3.7 pg. 54 Electropherogram for Mut100 and its corresponding …………………………………….
reference wild type sample in a microfluidic device
containing an integrated heater and thermal sensor
array. The spatial thermal gradient of 70-75 oC was
distributed over a 4-cm long effective separation
length at electric field strength of 150 V/cm.
Figure 4.1 pg. 69 Design of two-dimensional microfluidic network. The ………………………………………..
individual and pooled reservoirs are labeled as
follows: 1 – sample reservoir; 2 – waste reservoir; 3 –
1D inlet reservoir; 4 – 1D outlet reservoir; 5 – 2D
inlet reservoirs; 6 – 2D outlet reservoirs.
Figure 4.2 pg. 71 a) Cartoon of electric field profile in separation ……………………………..
channel at T-junction with a floating, orthogonal
channel. b) Image of 10mM fluorescein band
illustrates how leakage of the electric field lines into
the side channel at a t-junction results in a differential
pathlength for the analyte molecules through the
junction leading to broadening of the sample band.
Figure 4.3 pg. 73 Plot of the depth an electric field leaks into the side ……………………………………..
channel of a t-junction for a given ratio of side
channel width to main (separation) channel width.
The field leakage depth was determined by measuring
the distance into the side channel at which the
magnitude of the electric field in the side channel
xi
equaled 1% of the electric field in the uniform part of
the separation channel.
Figure 4.4 pg. 74 Contour plots of the electric field profiles for t-………………………………………..
junctions of width ratios: a) 0.1; b) 0.5; c) 1.0; d) 1.5.
Figure 4.5 pg. 75 Plots of the simulated and empirical sample band ……………………………….
dispersion caused by the presence of a t-junction in
the separation channel as a function of the ratio of side
channel width to separation channel width. Empirical
data was only obtained for width ratios of 0.2, 0.5, and
1.0.
Figure 4.6 pg. 77 2D separation electrical control configuration. ………………………………..
Number indicates which 5V power supply controls the
high voltage relays. In general, relays for reservoirs
involved in the first dimension are closed at the
beginning of the 2D separation process and open
during the second dimension TGGE separation.
Figure 4.7 pg. 79 Electropherograms for comprehensive 2D DNA ………………………………………………..
separations of a) homoduplex control and b)
heteroduplex samples consisting of a mixture of
Mut100, Mut200, and Mut400 fragments. The time
domain along the x-axis of the electropherogram
represents the retention time for the second dimension
separation only. Data recording was initiated once
transfer of bands from first dimension to second
xii
dimension commenced. First dimension separation
was performed for 90 seconds.
Figure 4.8 pg. 81 Illustration of the steps involved in 2D separation …………………………………….
protocol involving the pH-mediated on column
sample stacking process: a) 1D gel electrophoresis
separation; b) Transfer to 2nd dimension; c) Post-
transfer on-column base stacking of sample band; d)
2D TGGE separation.
Figure 4.9 pg. 82 Design of modified 2D microfluidic network that ………………………………………
allows for the employment of pH-mediated sample
stacking technique following electrokinetic transfer of
sample bands from first dimension to second
dimension.
Figure 4.10 pg. 84 Electropherograms for comprehensive 2D DNA ……………………………………………..
separation of heteroduplex samples consisting of a
mixture of Mut100, Mut200, and Mut400 fragments.
Separation efficiency and resolution are enhanced
through incorporation of a sample band stacking
process following the transfer of the bands into the
second dimension and prior to commencement of the
second dimension TGGE separation.
xiii

CHAPTER ONE
INTRODUCTION
The fundamental and complex biochemical processes that sustain life in the
human body are ultimately governed by the elemental genetic information that
defines the physical nature of all human beings. This genetic information is
encoded in the form of deoxyribonucleic acid (DNA) molecules situated in the
nuclei of constituent cells of the body and is collectively denoted as the human
genome.
As the human genome provides the elementary blueprint for all innate
processes that sustain life in the human body, increasing our understanding of the
structure and function of the human genome has remained of utmost importance.
Consequently, scientists worldwide have worked toward mapping and sequencing
the entire human genome over the past two decades. This massive collective effort
has been dubbed The Human Genome Project (HGP).
It has long been understood that various diseases and disorders can be linked
to defects or mutations within well-defined loci of the human genome known as
genes. As a result, the nature and location of these mutations and their relationship
to associated genes and gene function has been the subject of lengthy and in-depth
1
study. For example, sickle cell anemia has been linked to a single base mutation
(adenine to thymine substitution at the second position of the sixth codon) in the -
globin gene [1]. In addition, assorted mutations occurring in the p53 tumor
suppressor gene (~90% of which occur in exons 5-8) have been associated with
numerous cancers. The presence of germline, or inherited mutations in the p53 gene
causes Li-Faumani syndrome, which is characterized by greatly increased risks of a
variety of cancers and the occurrence of multiple cancers in a single individual [2].
The Human Genome Project has provided scientists with an unprecedented
wealth of information as new genes are being discovered at an accelerated rate
along with the determination of the function of these genes (functional genomics).
With the first draft of the genome completed, a reference is now available against
which all sequencing data can be compared. As a result, the increased ability to
correlate specific genes, or mutations within these genes, with particular disease
states has produced an assortment of new genetic markers for use in diagnosing and
predicting genetic-based diseases. Employment of this newly acquired cache of
genomic data has been primarily directed toward improving disease prevention and
disease management, with cancer and genetic disorders serving as the principal
targets [3].
Major emphasis has been placed upon the enhancement of medical
technology, which is expected to ultimately result in superior and more personalized
health care for all. Advances in analytical technology and genetic understanding
have resulted in improved medical diagnostics, for earlier disease detection and
2
more accurate disease prognosis. Likewise, recent innovations are also paving the
way for new therapies that possess potential for providing more effective treatment
of genetic-based disease. The importance placed on such endeavors is no better
illustrated than by the immense public attention currently paid to the field of gene
therapy even as it remains in its infancy. Ultimately, significant improvement in our
abilities to diagnose, prognosticate, and treat disease is critical to enhancing the
quality and longevity of human life worldwide.
TRADITIONAL METHODS OF GENETIC MUTATION DETECTION
A primary challenge to augmenting genetic-based disease prevention and
management is the establishment of new analytical strategies for detecting genetic
mutations that surpass the performance and capabilities of traditional gel-based
approaches. The need to screen individuals for the presence of sequence
heterogeneity across a large number of genes requires the development of
technology that can more rapidly, more accurately, and more cost-effectively
identify DNA sequence heterogeneity.
Currently, nucleotide sequencing remains the “gold standard” for mutational
analyses as it provides the most reliable method for accurately detecting and fully
characterizing mutations [4-6]. However, the high cost and expenditure of time
associated with contemporary sequencing technology, as well as the difficulties that
hinder sequencing in detecting heterozygous mutations, make alternative
approaches more attractive in many cases. Furthermore, mutations occur in the
genome at a rather low frequency. A recent estimate asserts the presence of 2.1
million single nucleotide polymorphisms (SNPs) in the human genome occurring at
3
a density of approximately 1 per 1,250 bases of sequence [7]. This estimate further
maintains the position of nucleotide sequencing as a comparatively inefficient
approach to the large-scale investigation of genomic sequence heterogeneity,
especially in large population-based screening. As a result, various approaches have
been developed to provide more cost-effective pre-screening of mutations in
relatively large pieces of DNA. Alternative prescreening techniques include single-
strand conformation polymorphism (SSCP) analyses [8,9], hybridization analyses
[10-12], and heteroduplex-based analyses such as denaturing gradient gel
electrophoresis (DGGE) [13-15].
Mutational analysis by single-strand conformation polymorphism (SSCP) is one
of the most popular methods employed in the field. In SSCP, double-stranded DNA
fragments are first denatured. The resulting single-stranded fragments take on
tertiary structures similar to RNA with their electrophoretic mobilities dependent on
the resulting conformations. Because mutant strands will have a different
conformation than that of the wild-type strands, they are detected when more than
one band appears on the gel for a given sized fragment. While simple and
inexpensive to perform, SSCP suffers from poor sensitivity and the failure to
accurately analyze single-stranded sequences greater than 200 base pairs [3,16].
Hybridization analysis is a method that has become increasingly popular due to
its implementation in microfluidic devices, referred to as “DNA microarray chips”,
which have recently become commercially available. In hybridization analyses
performed on a DNA chip [9,10], 20-25-mer oligonucleotide probes matching all of
4
the possible single-nucleotide substitutions for a gene are synthesized and
immobilized on the microchip substrate to form an oligonucleotide array. A
solution of PCR-amplified and fluorescently labeled DNA containing the gene or
gene segment of interest is transported into the hybridization chamber and allowed
to incubate over a lengthy time interval. The DNA solution is then removed,
unbound probes are washed away, and the immobilized probes are illuminated by an
excitation light source. When illuminated, spots on the chip where hybridization
has occurred emit fluorescence indicating the presence of a mutation.
Although this developing technology is quite promising, it is presently hindered
by high costs. Moreover, these chips can only be used to screen a very limited
range of genes, as the sequence of the gene of interest must be extensively verified
to provide the required hybridization probes. DNA microarray chips also suffer
from lengthy analysis times due to their reliance upon diffusion kinetics during the
hybridization step. Admittedly, the number of spots that can be packed into a small
region on the chip is enormous. However, one must routinely employ numerous
spots to span a mismatch and utilize multiple chips for large and composite gene
testing [17].
Additional screening techniques employ the formation of heteroduplexes to
reveal differentiation between two sequences. Since most mutations occur in
heterozygous form (i.e. in one allele), heteroduplexes can be formed from
polymerase chain-reaction (PCR) products by denaturing them before allowing
them to slowly re-anneal. In the case of homozygous mutations, the addition of
5
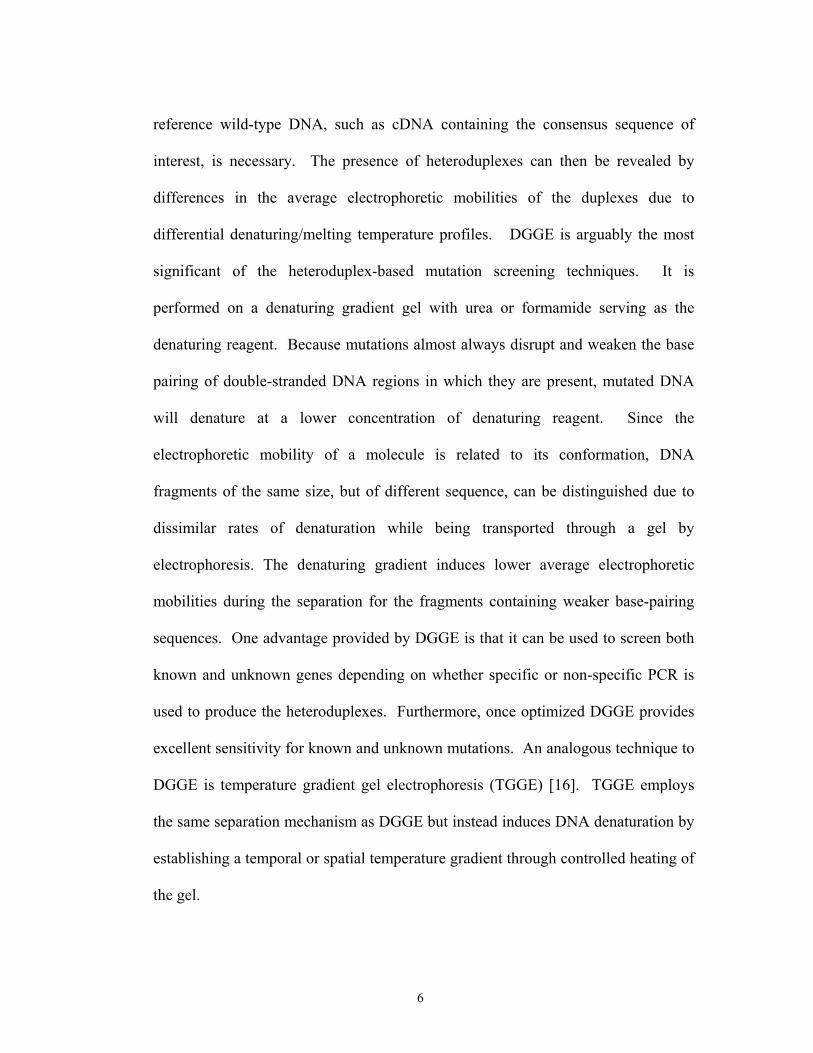
reference wild-type DNA, such as cDNA containing the consensus sequence of
interest, is necessary. The presence of heteroduplexes can then be revealed by
differences in the average electrophoretic mobilities of the duplexes due to
differential denaturing/melting temperature profiles. DGGE is arguably the most
significant of the heteroduplex-based mutation screening techniques. It is
performed on a denaturing gradient gel with urea or formamide serving as the
denaturing reagent. Because mutations almost always disrupt and weaken the base
pairing of double-stranded DNA regions in which they are present, mutated DNA
will denature at a lower concentration of denaturing reagent. Since the
electrophoretic mobility of a molecule is related to its conformation, DNA
fragments of the same size, but of different sequence, can be distinguished due to
dissimilar rates of denaturation while being transported through a gel by
electrophoresis. The denaturing gradient induces lower average electrophoretic
mobilities during the separation for the fragments containing weaker base-pairing
sequences. One advantage provided by DGGE is that it can be used to screen both
known and unknown genes depending on whether specific or non-specific PCR is
used to produce the heteroduplexes. Furthermore, once optimized DGGE provides
excellent sensitivity for known and unknown mutations. An analogous technique to
DGGE is temperature gradient gel electrophoresis (TGGE) [16]. TGGE employs
the same separation mechanism as DGGE but instead induces DNA denaturation by
establishing a temporal or spatial temperature gradient through controlled heating of
the gel.
6
TWO-DIMENSIONAL GENE SCANNING
A strategy for increasing the resolving power and throughput of genetic
mutational analyses is to employ multidimensional separations in series. Fischer
and Lerman [19] first introduced two-dimensional (2-D) DGGE as an example of
such a strategy. In demonstrating the immense resolving power of such an
approach, Fischer and Lerman succeeded in utilizing 2-D DGGE to resolve the
entire E. coli genome in two dimensions and detect sequence heterogeneities [19].
Aside from nucleotide sequencing, 2-D DGGE is the only method which provides
nearly 100% sensitivity for mutation detection. Assuming the sequence of the
fragment of interest is known, DGGE can be simulated on the basis of melting point
theory using a computer-run algorithm. Furthermore, a GC-rich fragment (GC
clamp) can be attached to one of the PCR primers. Because poly-GC regions
exhibit the strongest base pairing, this enables a target fragment to be designed so
that it will always be the lowest melting domain, providing the utmost sensitivity for
all types of mutations.
The capability to perform multidimensional separations such as 2-D DGGE
provides analytical support for utilizing more complex sample preparation strategies
such as PCR multiplexing. Under optimized conditions, as many as 10 or more
PCR reactions can be carried out in a multiplex fashion within the same reaction
volume [20]. Due to the parallel sample processing involved, multiplex PCR
essentially normalizes much of the variability involved in preparing individual PCR
reactions such as pipetting accuracy and individual PCR reaction variability.
7
Additional advantages to performing multiplex PCR include reduced sample
preparation time and thus an increase in information obtained per unit time. Also,
the ability to perform several reactions in the same volume significantly reduces the
amount of reagents required, especially with regards to the amount of template
required.
Through the incorporation of extensive PCR multiplexing with 2-D DGGE,
Vijg et al. [21,22] have succeeded in greatly improving upon the capacity and
resolving power of 2-D DGGE. Dubbed two-dimensional gene scanning (TDGS) by
its founders, this scheme provides a platform for performing parallel analyses of
mutational variants in multiple genes. The exceptional resolving capability of
TDGS in the slab gel format has been demonstrated for several large human disease
genes, including BRCA1 (breast and ovarian cancer susceptibility gene 1) [22],
CFTR (cystic fibrosis transmembrane regulator gene) [23], RB1 (retinoblastoma
tumor suppressor gene)[24], MLH1 (MutL protein homolog 1) [25,26], and TP53
(p53 tumor suppressor gene) [27]. TDGS has also been utilized in analyzing a
portion of the mitochondrial genome [28].
In order for a gene-scanning method to be amenable to large-scale analysis
of a broad range of human genes in large population-based studies, it must provide
accurate detection in combination with a facility for operating at a high throughput
and cost-effective manner. In its current state, TDGS succeeds in being relatively
cost-effective when weighed against other mutation detection techniques [22].
However, TDGS has yet to be implemented in a high-throughput platform for
8

comprehensive DNA analysis. Despite the selectivity and sensitivity provided by
traditional TDGS, this technique as carried out today is a compilation of manually
demanding and time-consuming tasks, susceptible to irreproducibility and inferior
quantitative accuracy.
MICROFLUIDICS
The search for increasingly higher throughput analysis platforms has been a
primary focus of Analytical chemists beyond the past decade. One upshot of this
focus has been the rapidly emerging field of microfluidics technology [29-34].
Microfluidics improves upon existing analytical diagnostic platforms due to the
amenability of the technology towards miniaturization, automation, analysis speed,
and fabrication, all of which are critical aspects associated with the development of
high throughput platforms. Microfluidics also provides the advantages of durability
and minimal sample consumption. With the benefits provided by microfluidics, a
substantial movement exists toward implementing contemporary genetic mutational
analysis technologies in microfluidic platforms. Currently, the majority of
microfluidic devices developed for genomic analysis consist of simple platforms,
which merely embody existing techniques, such as sequencing [35,36], conventional
heteroduplex analysis [37], and SSCP [38], in a miniaturized format. However, the
true power of microfluidic technology lies in its unparalleled ability to perform
high-throughput and multi-dimensional analyses without sacrificing efficiency and
resolution. Thus, the need exists for the development of more complex devices that
will be able to harness and exploit this inherent capability.
9

Over the past decade, the search for materials that are compatible with
microfluidic technology has produced a dichotomy in the field. At one end of the
spectrum lie devices fabricated from glass or silicon [29-38]. These materials are
attractive in that they tend to have uniform and well-characterized surface
properties, which are important in electroosmosis-driven microfluidic operations.
Furthermore, techniques and methodologies including various surface coatings and
treatments previously developed for capillaries are readily transferable to these
platforms. In the case of glass, the optical properties are suitable for sensitive
optical detection as well. The processes involved in fabricating microchips from
glass and silicon, however, are not amenable to mass-production. As a result, glass
and silicon microchips can be relatively expensive. This has led to the search for
viable plastic materials that can be used as substrates for fabricating functional
microfluidic platforms.
To date, plastics have proven disadvantageous to glass when
considering the autofluorescence and lack of surface property understanding
associated with them. However, they are highly attractive due to their amenability
toward fabrication methods that can mass-produce these devices. The impetus
behind the push to produce viable plastic microfluidic devices is the ultimate goal of
developing inexpensive, disposable devices that can eliminate cross-contamination
between separate analyses [37]. Of the plastics that have been investigated for this
purpose, three have emerged at the forefront. Polydimethylsiloxane (PDMS)
[38,39], polymethlymethacrylate (PMMA) [40,41], and polycarbonate (PC) [42]
10
have all been utilized to fabricate functional microfluidic devices that have been
employed in numerous analytical and bioanalytical applications.
2D MICROFLUIDIC SEPARATIONS FOR MUTATION ANALYSIS
When considering the advantages afforded by microfluidics, the obvious
strategy for increasing the throughput and cost-effectiveness of TDGS is to
implement the technology in a microfluidic platform. Thus, the design,
development, and characterization of a novel polymer 2-D microfluidic separation
platform have been investigated. Briefly, the entire microfluidic channel network is
filled with an electrophoretic size-sieving matrix. Using the gated valve injection
technique, a mixture of PCR amplicons are injected into a single, first-dimension
separation channel and separated by size via gel electrophoresis. The size-resolved
amplicons are then electrokinetically and quantitatively transferred into a second
separation dimension, which consists of an array of orthogonal channels all of
which intersect with the first dimension channel at evenly distributed intervals.
Following the electrokinetic transfer of the analyte bands, each amplicon is
examined for sequence heterogeneity via separation by TGGE. Fluorescence in
each channel of the second dimension array is simultaneously detected with a CCD
camera by laser-induced fluorescence detection.
PROJECT DESCRIPTION
The development of fabrication methods for polymeric microfluidic separation
platforms and the application of these first generation devices to performing direct
11

manipulation of electroosmotic flow is outlined in Chapter two. In this work, the
amenability of a simple polydimthylsiloxane-based polymeric microfluidic system
toward field-effect electroosmotic flow control was investigated.
The microfluidic system consisted of a 2.0 cm open microchannel fabricated
on a PDMS slab, which can reversibly adhere to a silicon wafer to form a hybrid
microfluidic device. Aside from mechanically serving as a robust bottom substrate
to seal the channel and support the microfluidic system, the silicon wafer was
exploited to achieve field-effect flow control by grounding the semi-conductive
silicon medium. When an electric field was applied through the channel, a radial
electric potential gradient was generated across the silicon dioxide layer to allow for
direct control of the zeta ( ) potential and the resulting electroosmotic flow (EOF).
By configuring this microfluidic system with two power supplies at both ends of the
microchannel, the applied electric potentials could be varied for manipulation of the
polarity and magnitude of the radial electric potential gradient across the silicon
dioxide layer. At the same time, the longitudinal potential gradient through the
microchannel, used to induce EOF, was held constant.
The results of EOF control in this hybrid microfluidic system are presented for
phosphate buffer at pH 3 and pH 5. EOF control achieved at higher solution pHs of
6 and 7.4 by modifying the microchannel surface with cetyltrimethylammonium
bromide (CTAB) is also presented. Results of EOF control from this study are
compared with those reported in the literature involving the use of fused-silica
capillary systems and microfluidic devices under comparable conditions.
12
Chapter three illustrates the technical basis and demonstration of a
miniaturized system for DNA mutation analysis, utilizing temperature gradient gel
electrophoresis (TGGE) in a polycarbonate (PC) microfluidic device. Bulk heater
assemblies were designed and employed to externally generate temperature
gradients in spatial and temporal formats along the separation channels. TGGE
analyses of model mutant DNA fragments, each containing a single base
substitution, successfully revealed the presence of sequence heterogeneity in each
model heteroduplex sample. Results were achieved using both single and 10-
channel parallel measurements in a microfluidic platform.
Additionally, a comprehensive polymer microfluidic device containing an
integrated microheater and sensor array was developed and demonstrated for
performing spatial TGGE for DNA mutation analysis. The device consisted of two
PC modular substrates mechanically bonded together. One substrate was embossed
with microchannels while the other contained a tapered microheater,
lithographically patterned along with an array of temperature sensors. Compared
with the external heating approaches, the integrated platform provided significant
reduction in power requirement and thermal response time while establishing more
accurate and highly effective control of the temperature gradient for achieving
improved separation resolution.
The conception and realization of a parallel two-dimensional microfluidic
platform for genetic mutation screening is described in Chapter four. A
microfluidic system was designed and fabricated to include an imprinted two-
13
dimensional network of microchannels in a PC substrate. The first separation
dimension on the platform consisted of a single channel for performing size-based
gel electrophoresis on a mixture of PCR products. Due to the discontinuous
sidewalls of the first dimension separation channel, extensive finite element
modeling (FEM) was performed to optimize controllable geometric factors at the
interface between the first dimension and second dimension channels. This was
done to minimize analyte band dispersion caused by the side channel junctions
along the first dimension channel as well as the electrokinetic transfer process from
the first separation dimension to the second. The second separation on the platform
involved an array of ten microchannels in which each PCR product resolved by size
in the first dimension was interrogated for the presence of sequence heterogeneity
individually with parallel microfluidic TGGE. The comprehensive two-dimensional
mutation analysis performed using this microfluidic system demonstrated the
capability to detect mutations in DNA fragments at speeds approximately one to two
orders of magnitude higher than is possible with conventional gel-based TDGS.
Ultimately, the novel aspects of this work include the development of a
multidimensional microfluidic separation system that is capable of performing high
throughput analyses in parallel. For the first time, TGGE was successfully
demonstrated in a microfluidic format in both single and parallel modes. The ability
to resolve sequence variants using both temporal and spatial thermal gradients was
also verified. Implementing the TDGS process in a miniaturized platform enables
14

mutation analyses to be performed at speeds unparalleled by competitive
approaches.
15

CHAPTER TWO
Field-Effect Flow Control in a Polydimethylsiloxane-Based
Microfluidic System
Reproduced with permission from Buch, J. S.; Wang, P. C.; DeVoe, D. L.; Lee, C.
S. Electrophoresis 2001, 22, 3902-3907. Copyright 2001 Wiley-VCH.
INTRODUCTION
The microfluidic device is rapidly supplanting capillaries as the platform of
choice for performing electrokinetic separations and biochemical analyses. The
advantages of such analytical microsystems include automation, efficiency,
integration, minimal sample consumption, and speed [39-41]. The majority of
microfluidics work has involved the fabrication of glass and silicon-based chips [42-
44]. However, the widespread interest in microfluidic devices for bioanalytical
applications has resulted in efforts to facilitate the use, and to reduce the cost, of
such devices. As a result, polymeric materials such as PDMS and polymethyl
methacrylate have been explored as more versatile alternatives for the fabrication of
microfluidic devices [45-50].
16
As the pumping mechanism of choice in microfluidic network [51,52],
electroosmosis provides several advantages over micro-machined pressure driven
pumps, including ease of fabrication and the absence of moving parts. Moreover,
sample plugs suffer little from dispersion in electroosmotic pumping due to the
nearly uniform fluid velocity profile across the channel diameter. EOF is generally
controlled by manipulating the chemical composition of the buffer solution (i.e.
buffer additives, ionic strength, organic content, and solution pH), or by coating of
the inner wall of the fluid channel. However, these chemical methods do not allow
for the dynamic regulation of EOF.
A physical means for effective control of EOF, involving the application of an
external radial electric field, has been demonstrated in fused-silica capillaries [53-
56] and, more recently, in microfluidic devices [57,58]. The ability to physically
manipulate EOF is advantageous as it allows for dynamic flow control at any point
during either the mobilization or separation of analytes in an electrophoresis
experiment. Such capability also provides spatial control of EOF at points of
interest within the microfluidic network.
In this work, a hybrid microfluidic device is constructed for low-voltage
studies of field-effect flow control at various solution conditions. The device
consists of a 2-cm long microchannel fabricated on a PDMS substrate. The channel
is reversibly sealed using a silicon wafer coated with a 2.0 m thick silicon dioxide
layer. The field-effect for direct control of electroosmosis is obtained by grounding
17
the backside of silicon wafer for the creation of a radial electric potential gradient
across the silicon dioxide layer.
EOF control results are compared with those reported using fused-silica
capillary systems [53,59,60] and microfluidic device [57,58]. Due to the application
of thin insulating layers for comprising fluid channel walls, the absolute magnitude
of radial electric voltages required for achieving EOF control is about two (across 2
m silicon dioxide in this study) to three [57] (across 0.4 m silicon nitride) orders
of magnitude lower than those applied across 50-150 m-thick fused-silica
[53,59,60]. Thus, the range of applied radial electric potential gradients (radial
electric potential/thickness of channel wall) for achieving field-effect flow control
measured in this study is in agreement with those reported using fused-silica
capillaries [53,59,60] and a silicon nitride microfluidic network [57]. However,
Polson and Hayes have reported enhanced EOF control while applying radial
electric potentials in the low-voltage range across 50- m thick glass walls. The
source and mechanism responsible for the enhanced EOF control in the studies of
Polson and Hayes [58] are unclear.
EXPERIMENTAL SECTION
Materials and Reagents. 4” <100> oriented p-type silicon wafers containing
2.4 m silicon dioxide coating were obtained from WaferNet, Inc. (San Jose, CA)
and were used for the template fabrication. 4” <100> oriented p-type silicon wafers
coated with a 2.0 m thick silicon dioxide layer were acquired from Nova
18

Electronics Materials (Richardson, TX) and were employed for the construction of
hybrid microfluidic devices. CTAB and sodium mono- and diphosphate were
purchased from Sigma (St. Louis, MO). The Sylgard® 184 PDMS kit was obtained
from Dow Corning (Midland, MI). All solutions were prepared using water purified
by a SYBRON/Barnstead Nanopure II system (Boston, MA) and further filtered
with a 0.22 m membrane (Costar, Cambridge, MA)
Fabrication of Silicon Template. The fabrication of a silicon template was
performed by following standard procedures involving photolithography and
chemical etching. First, the 2.4 m-thick silicon dioxide surface of the <100>
oriented p-type silicon wafer was covered by a layer of photoresist. Then, a
patterned photomask, which consisted of the channel design printed with high
resolution onto a transparency, was placed on top of the photoresist layer.
Following the exposure of the wafer to ultra-violet light, the photoresist was
developed to form the desired patterns and features on the wafer surface. The wafer
was then etched with buffered hydrofluoric acid solution to remove the silicon
dioxide except for that under the protection of the developed photoresist. The
remaining silicon dioxide pattern acted as a protection mask so that the silicon could
be etched anisotropically in 30% (w/v) potassium hydroxide solution to form a
positive relief mold containing the desired three-dimensional structures for the
fabrication of PDMS microchannels.
19
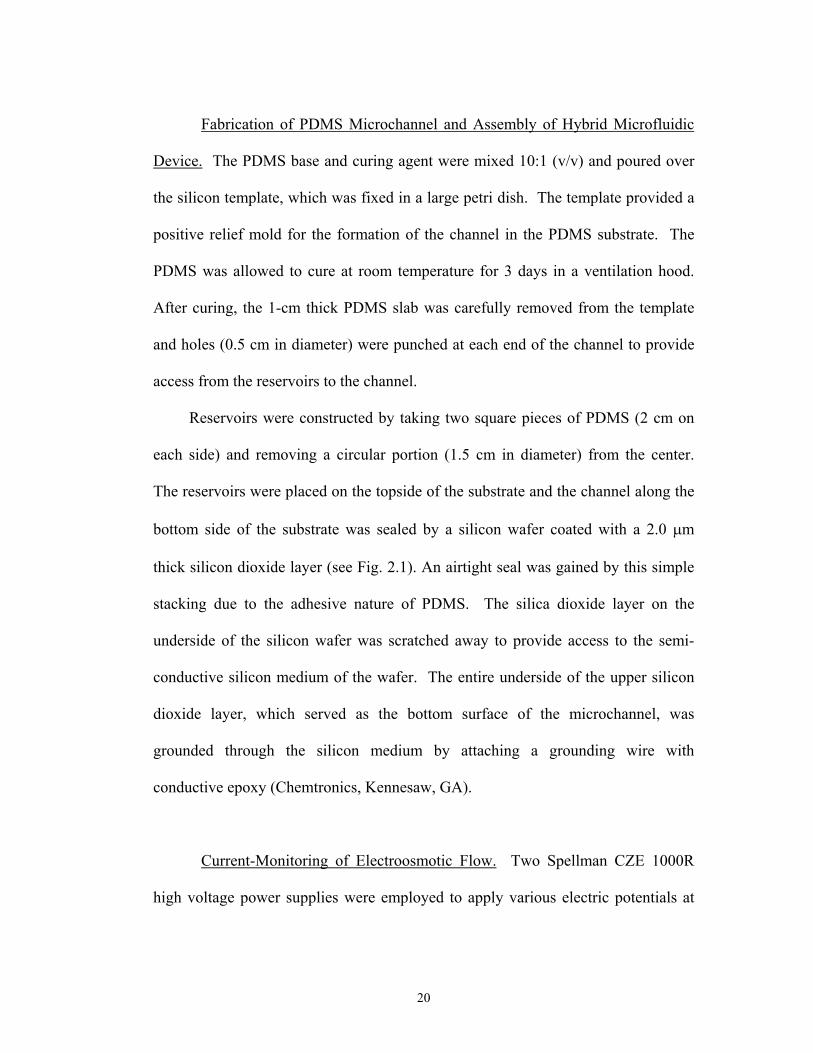
Fabrication of PDMS Microchannel and Assembly of Hybrid Microfluidic
Device. The PDMS base and curing agent were mixed 10:1 (v/v) and poured over
the silicon template, which was fixed in a large petri dish. The template provided a
positive relief mold for the formation of the channel in the PDMS substrate. The
PDMS was allowed to cure at room temperature for 3 days in a ventilation hood.
After curing, the 1-cm thick PDMS slab was carefully removed from the template
and holes (0.5 cm in diameter) were punched at each end of the channel to provide
access from the reservoirs to the channel.
Reservoirs were constructed by taking two square pieces of PDMS (2 cm on
each side) and removing a circular portion (1.5 cm in diameter) from the center.
The reservoirs were placed on the topside of the substrate and the channel along the
bottom side of the substrate was sealed by a silicon wafer coated with a 2.0 m
thick silicon dioxide layer (see Fig. 2.1). An airtight seal was gained by this simple
stacking due to the adhesive nature of PDMS. The silica dioxide layer on the
underside of the silicon wafer was scratched away to provide access to the semi-
conductive silicon medium of the wafer. The entire underside of the upper silicon
dioxide layer, which served as the bottom surface of the microchannel, was
grounded through the silicon medium by attaching a grounding wire with
conductive epoxy (Chemtronics, Kennesaw, GA).
Current-Monitoring of Electroosmotic Flow. Two Spellman CZE 1000R
high voltage power supplies were employed to apply various electric potentials at
20
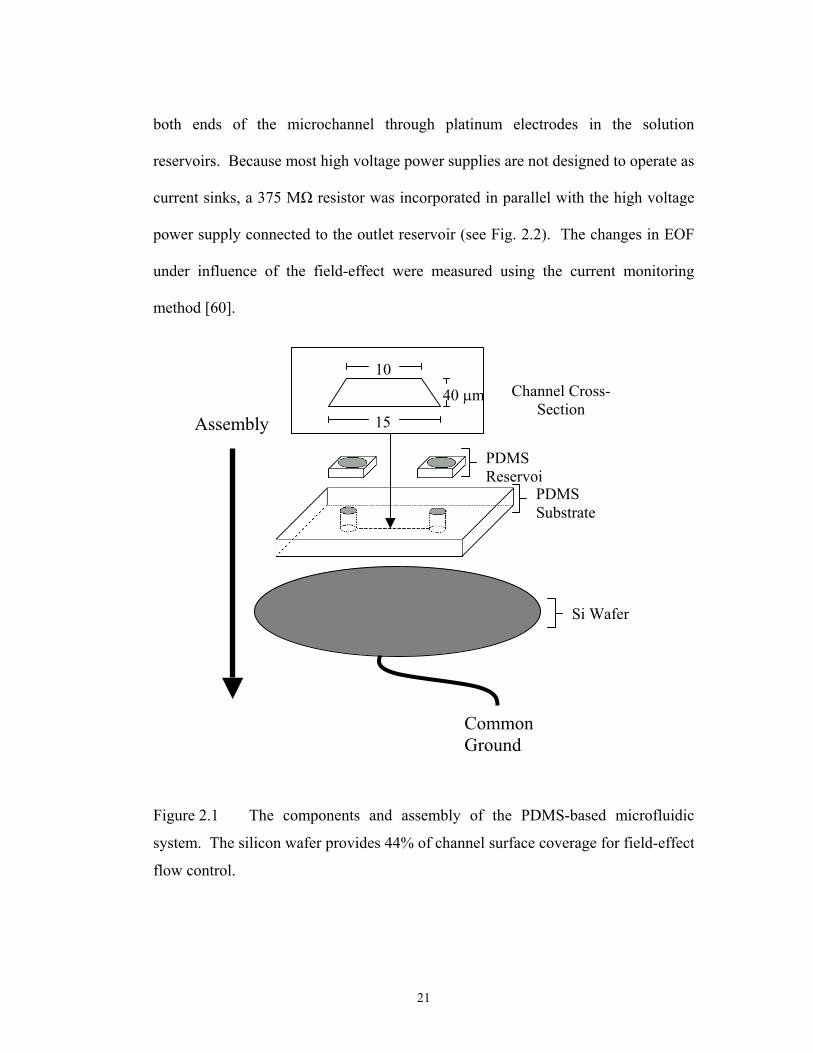
both ends of the microchannel through platinum electrodes in the solution
reservoirs. Because most high voltage power supplies are not designed to operate as
current sinks, a 375 M resistor was incorporated in parallel with the high voltage
power supply connected to the outlet reservoir (see Fig. 2.2). The changes in EOF
under influence of the field-effect were measured using the current monitoring
method [60].
PDMSSubstrate
PDMSReservoi
Channel Cross-Section
40 m
15
10
Assembly
CommonGround
Si Wafer
Figure 2.1 The components and assembly of the PDMS-based microfluidic
system. The silicon wafer provides 44% of channel surface coverage for field-effect
flow control.
21
10 k resistorfor current monitoring
PDMS/SiliconWafer Device
375 MCurrent Sink
Resistor
HVPS #2HVPS #1
Figure 2.2 The electric circuit employed for the studies of field-effect flow
control in a hybrid PDMS/silicon wafer device.
The current in the microchannel was measured by monitoring the voltage drop
across a 10-k resistor connected to the electrode in the outlet reservoir (see Fig.
2.2). In all runs, the channel was pre-filled with 1 mM phosphate buffer by vacuum.
Both reservoirs were filled with 400 L of 1 mM phosphate buffer and the current
was monitored for one minute to verify stability. The 1 mM buffer in the reservoir
at the high voltage end was then replaced with 3 mM buffer. As soon as the electric
potentials were applied, the higher concentration phosphate buffer migrated into the
22
channel by electroosmotic pumping and increased the current in the circuit.
Complete filling of the channel with the 3 mM phosphate buffer was indicated by a
plateau in the current. The channel length divided by the time required to complete
the filling process gave the rate of EOF.
Partial Modification of Channel Surface with CTAB. The silicon dioxide
surface of the channel was modified with CTAB by incubating the silicon wafer
substrate, prior to system assembly, with phosphate buffer containing 0.01 mg/ml
CTAB for one hour. The wafer was then rinsed with deionized water, to remove
any excess, unbound CTAB from the surface, prior to the assembly of the
PDMS/silicon wafer hybrid device.
RESULTS AND DISCUSSION
Two separate electric voltages were applied at the inlet and the outlet
reservoirs for inducing the EOF in the microchannel and creating various radial
electric potential gradients across a 2.0 m thick silicon dioxide layer in an effort to
directly control the EOF. For example, an electric field strength of 150 V/cm in a 2-
cm long microchannel was established by applying two individual voltages of 450 V
and 150 V at the inlet and the outlet reservoirs, respectively. The voltages inside the
channel, relative to a common ground on the back side of the silicon wafer,
established the radial electric potential gradients which ranged from –2.25 MV/cm
(0 – 450 V/2.0 m) at the inlet end of the channel to -0.75 MV/cm at the channel
23

outlet. Thus, an average radial electric potential gradient of –1.50 MV/cm was
simultaneously imposed for studying field-effect flow control.
Field-Effect Flow Control at Low pHs. By adjusting the applied electric
potentials in the inlet and outlet reservoirs, we were able to maintain a constant
electric field strength of 150 V/cm in the microchannel, while varying the polarity
and the magnitude of average radial electric potential gradients across the insulating
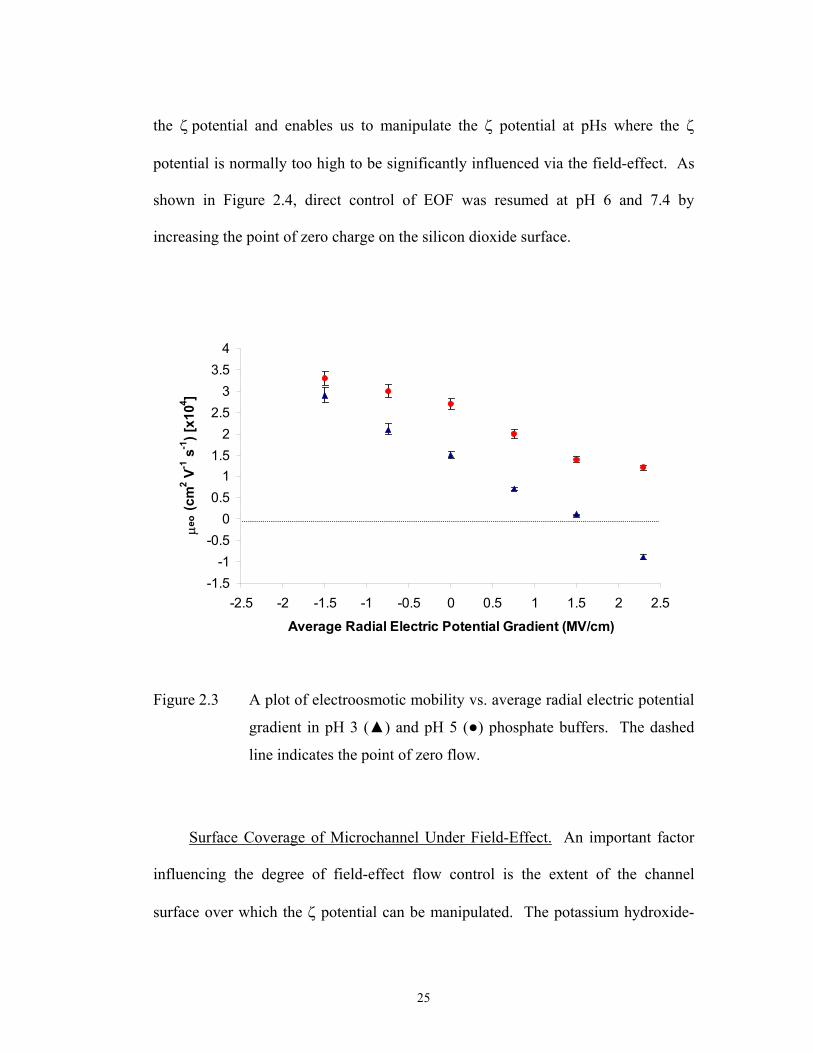
silicon dioxide layer for direct control of EOF. As shown in Fig. 2.3, application of
negative radial electric potential gradients increased the electroosmotic mobility at
pH 3 from 1.5 x 10⁻⁴ cm2/V-s at 0 MV/cm to 2.9 x 10⁻⁴ cm2/V-s at -1.5 MV/cm. By
applying opposite polarity in radial electric potential gradients, the electroosmotic
mobility was decreased to zero and eventually reversed at 2.3 MV/cm. The extent
of EOF control decreased with increasing solution pH from 3 to 5. Such pH
dependence of field-effect flow control was in good agreement with those reported
in fused-silica capillary systems [53,59,60] and microfluidic devices [57].
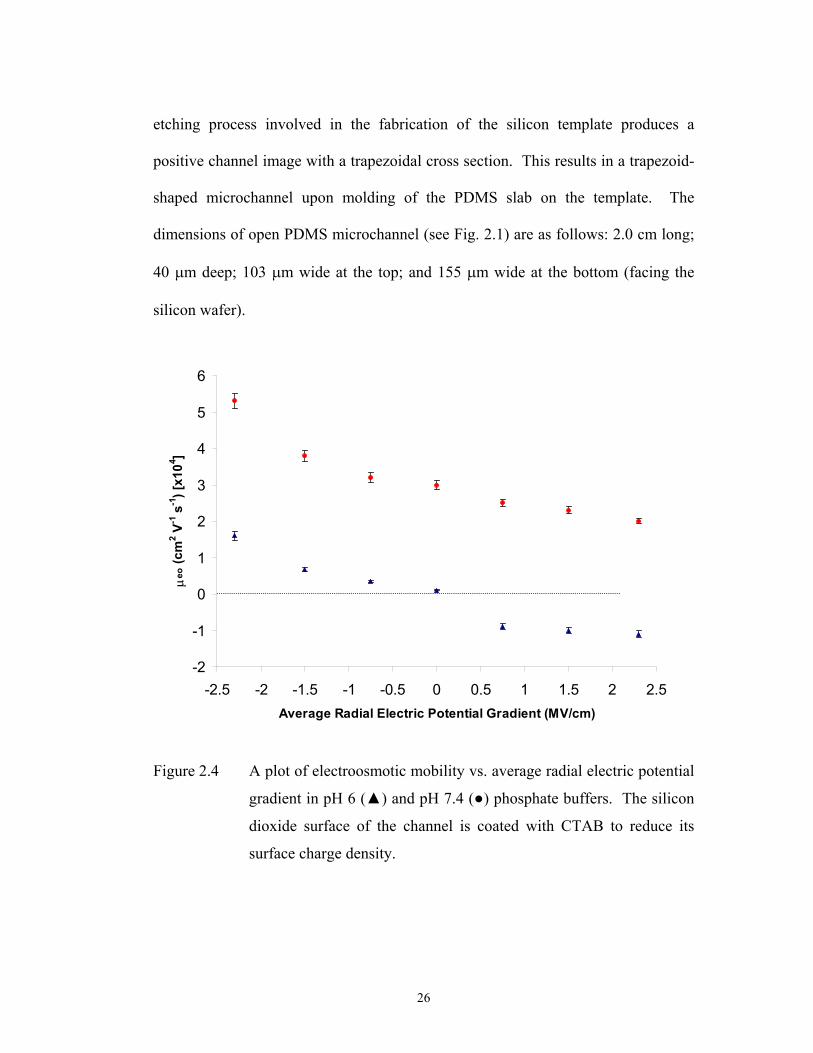
Field-Effect Flow Control at Higher pHs Assisted by CTAB Surface
Modification. The effectiveness of EOF control decreases at higher solution pHs
because of the larger intrinsic surface charge and the higher capacitance of the
electrostatic diffuse layer at the wall/solution interface. To demonstrate the ability
to perform field-effect flow control at higher solution pHs, the silicon dioxide
surface of the channel was coated with the EOF modifier CTAB. CTAB reduces
24
the potential and enables us to manipulate the potential at pHs where the
potential is normally too high to be significantly influenced via the field-effect. As
shown in Figure 2.4, direct control of EOF was resumed at pH 6 and 7.4 by
increasing the point of zero charge on the silicon dioxide surface.
-1.5-1
-0.50
0.51
1.52
2.53
3.54
-2.5 -2 -1.5 -1 -0.5 0 0.5 1 1.5 2 2.5
Average Radial Electric Potential Gradient (MV/cm)
eo (c
m2 V
-1 s
-1) [
x104 ]
Figure 2.3 A plot of electroosmotic mobility vs. average radial electric potential
gradient in pH 3 ( ) and pH 5 ( ) phosphate buffers. The dashed
line indicates the point of zero flow.
Surface Coverage of Microchannel Under Field-Effect. An important factor
influencing the degree of field-effect flow control is the extent of the channel
surface over which the potential can be manipulated. The potassium hydroxide-
25
etching process involved in the fabrication of the silicon template produces a
positive channel image with a trapezoidal cross section. This results in a trapezoid-
shaped microchannel upon molding of the PDMS slab on the template. The
dimensions of open PDMS microchannel (see Fig. 2.1) are as follows: 2.0 cm long;
40 m deep; 103 m wide at the top; and 155 m wide at the bottom (facing the
silicon wafer).
-2
-1
0
1
2
3
4
5
6
-2.5 -2 -1.5 -1 -0.5 0 0.5 1 1.5 2 2.5Average Radial Electric Potential Gradient (MV/cm)
eo (c
m2 V
-1 s
-1) [
x104 ]
Figure 2.4 A plot of electroosmotic mobility vs. average radial electric potential
gradient in pH 6 ( ) and pH 7.4 ( ) phosphate buffers. The silicon
dioxide surface of the channel is coated with CTAB to reduce its
surface charge density.
26

Because the field-effect is only applied across the silicon dioxide surface of the
channel, the trapezoidal shape provides us with 44% of channel surface under direct
control of the potential.
The electroosmotic mobility in molded PDMS microchannels [49] ranged
from 0.15 x 10⁻⁴ cm2/V-s at pH 3 to 4.0 x 10⁻⁴ cm2/V-s at pH 7. Thus, the EOF
originating from the silicon dioxide surface under the influence of applied radial
electric potential gradients was mostly in the same direction as that contributed by
the PDMS walls. However, bi-directional flow could occur in this hybrid
microfluidic device when the EOF, originating from the silicon dioxide surface, was
reversed using the large and positive radial electric potential gradients (see Figs. 2.3
and 2.4). Such bi-directional flow, flow in opposite directions in the same channel,
has been demonstrated by Barker and co-workers [62]. A positively derivatized
plastic substrate with a negatively charged lid was used to achieve top-bottom
opposite flows. Derivatization of the two sides of a plastic microchannel with
oppositely charged polyelectrolytes was employed to establish side-by-side opposite
flows.
Microfluidic Devices Versus Capillary Systems in Field-Effect Flow Control.
EOF control results obtained from this study were compared with those reported in
the literature using fused-silica capillary systems [53,59,60] and microfluidic
devices [57,58] (see Table 2.1). The cylindrical capacitor factor [57,60], 1/(ri ln
(ro/ri)), was included for the calculation of the range of applied radial electric
27
potential gradient in fused-silica capillaries, where ri and ro are the inner and the
outer radii of the capillaries, respectively. The percentage of total channel surface
under the influence of the field-effect was also estimated from experimental details
or figures in each study. For example, in the work of Polson and Hayes [58], two
6.0 mm-long external voltage electrodes were located parallel to and on either side
of a 5-cm main channel separated by 50 m of glass substrate. The percentage of
field-effect coverage was therefore estimated to be around 12% in this particular
system configuration.
The control factor summarized in Table 2.1 is simply calculated by
determining the range of electroosmotic mobility under field-effect flow control and
dividing it by the range of the applied radial electric potential gradient. Of the
studies summarized in Table 2.1, the last three works involved the use of the field-
effect for flow control in microfluidic systems. By taking into account both the
control factor and the percentage of field-effect coverage, our studies and the work
reported by Schasfoort et al. [57] displayed flow control on the same order of
magnitude as those performed in capillary systems [53,59,60]. However,
comparable flow control in both studies, involving the use of microfluidic devices,
was achieved using radial electric potentials one to two orders of magnitude smaller
than those applied in capillary systems.
The ability to effectively control the EOF in microfluidic devices is the result
of using an extremely thin insulating layer (2.0 m silicon dioxide in our study and
0.4 m silicon nitride in the work of Schasfoort et al. [57]) as part of the channel
28

wall. Thus, comparable radial electric potential gradients can be attained for direct
control of EOF by applying much lower radial electric potentials across extremely
thin insulating layers. In contrast, it is not clear as to what the origin and the
mechanism are that are responsible for the enhanced EOF control observed by
……
Table 2.1 Comparison of the Results Reported in This Study with Those Reported in the Literaturea
pHBufferIonic
Strength(mM)
Thickness of capillary orchannel wall
( m)
Vrad(V)b
Erad(V/cm)c
eo(cm2/V-s)d
ControlFactor
( eo/Erad)
PercentCoverage
Lee, McManigill, Wu, and Patel [53]
5 1,2 75/375 11,000 1.8 x 10⁶ 3.0 x 10⁻⁴ 1.6 x 10⁻¹⁰ 85 % Hayes, Kheterpal, and Ewing [59]
3 1 10/144 20,000 1.5 x 10⁷ 6.4 x 10⁻⁴ 4.3 x 10⁻¹¹ 80%3 1 25/250 20,000 6.9 x 10⁶ 6.4 x 10⁻⁴ 9.2 x 10⁻¹¹ 80%5 1 25/250 20,000 6.9 x 10⁶ 3.1 x 10⁻⁴ 4.5 x 10⁻¹¹ 80%
Huang, Tsai, Wu, and Lee [60]3 10 50/150 20,000 7.3 x 10⁶ 4.1 x 10⁻⁴ 5.6 x 10⁻¹¹ 85 %
Schasfoort, Schlautmann, Hendrikse, and Van den Berg [57]
3.6 2 0.4 52.5 1.6 x 10⁶ 3.4 x 10⁻⁴ 2.1 x 10⁻¹⁰ 45%4.5 2 0.4 100 2.6 x 10⁶ 1.6 x 10⁻⁴ 6.2 x 10⁻¹¹ 45%
Polson and Hayes [58]
3 20 50 120 2.4 x 10⁴ 7.9 x 10⁻⁵ 3.3 x 10⁻⁹ 12% Buch, Wang, and Lee
3 1,3 2 750 3.8 x 10⁶ 3.8 x 10⁻⁴ 1.0 x 10⁻¹⁰ 44%5 1,3 2 750 3.8 x 10⁶ 2.1 x 10⁻⁴ 5.5 x 10⁻¹¹ 44%
a) Data from literature was calculated from experimental details or figuresb) Range of applied radial electric voltage c) Range of applied radial electric potential gradient d) Range of electroosmotic mobility achieved with field-effect flow control
29
Polson and Hayes [58]. In their studies, the control factor obtained from a surface
coverage of only 12% was at least one order of magnitude greater than the rest of
work summarized in Table 2.1. Furthermore, the range of their radial electric
potential gradient, which was achieved by applying 120 V across 50 m thick glass
layer, was about two orders of magnitude lower than those reported in the literature
[53,57,59,60] using capillary systems and microfluidic devices.
CONCLUSION
The realization of true lab-on-a-chip technology, in which the functionality of
desktop biochemical analytical tools is replicated in a credit card sized package, will
require flow control in complex microfluidic networks of interconnected channels
between mixers, reactors, reservoirs, sensing elements, and related components. A
hybrid microfluidic device is employed in this study for the demonstration of EOF
control by directly manipulating the potential at the interface through the use of
the field-effect. The impact of the use of ultrathin insulating walls for the channels
in microfluidic devices is that significantly smaller radial electric voltages are used
to create the extraordinary fields required to have effective field-effect flow control.
In the work reported by Schasfoort et al. [57], silicon nitride is employed as
the dielectric wall material, with a relative permittivity of approximately r = 6 and a
thickness of 0.4 m. While silicon dioxide has a relative dielectric constant similar
to that of nitride ( r = 4), it offers several important advantages compared to silicon
nitride such as controllable thicknesses as small as 50 nm or lower, high dielectric
30

breakdown strength (20 MV/cm for thermal oxide), low film defect density, true
conformal coverage for all channel surfaces, and simple deposition for cost-
effective manufacturing. Future studies will involve the fabrication of ultrathin
silicon dioxide layers in field-effect fluid manifolds and the exploration for the use
of a hybrid plastic/silicon platform for integrating fluidic networks with functional
silicon elements while providing compatibility for mass production at a reduced
cost.
31
CHAPTER THREE
DNA Mutation Detection In A Polymer Microfluidic Network Using
Temperature Gradient Gel Electrophoresis
Submitted for publication and reproduced with permission from Analytical
Chemistry. Unpublished work copyright 2003 American Chemical Society.
Authors: Jesse S. Buch; Christopher Kimball; Frederick Rosenberger; W. Edward
Highsmith, Jr.; Don L. DeVoe; Cheng S. Lee.
INTRODUCTION
The nearly completed human genome sequence produced by the Human
Genome Project makes available a reference against which all other sequencing data
can be compared [7]. As a result, the search for the role performed by specific genes
and gene variants in disease has been greatly accelerated, with cancer and genetic
disorders serving as the primary targets [3]. At the forefront of this endeavor is the
identification of specific nucleotide variations known as single-nucleotide
polymorphisms (SNPs). SNPs have attracted the bulk of the attention because they
are the most widely distributed form of genetic variation in the human genome and
therefore offer the highest resolution markers for tracking disease genes and
32
population history. These types of single base substitutions, insertions, and deletions
in the genome occur at a frequency of greater than 1% in the human population.
According to a recent estimate, there are 2.1 million SNPs in the human genome
occurring at a density of approximately 1 per 1.25kb of sequence [7].
Continuing progress toward the identification of new genes, the detection of
sequence variations in these genes, and the relationship between disease states and
these gene variants has garnered high priority. As a result, increasing demand has
arisen for the development of technologies that offer greater accuracy, superior cost-
effectiveness, and higher throughput than what is currently available. Although,
nucleotide sequencing remains the preferred method for detecting and identifying
specific nucleotide variations, the rather low frequency of mutations present in the
genome renders sequencing a fairly inefficient approach to the large-scale
investigation of genomic sequence heterogeneity. Furthermore, the high cost of
screening samples for mutations by nucleotide sequencing and the difficulty in
detecting heterozygous mutants remain issues.
The most prevalent of the slab gel-based traditional SNP detection techniques
include heteroduplex analysis (HA) [63,64], single-strand conformation
polymorphism (SSCP) [8,64], and denaturing gradient gel electrophoresis (DGGE)
[13]. HA and SSCP have both been successfully implemented in capillary [65,66]
and microchip formats [38,39] resulting in increased automaton, efficiency, and
speed. Of the three traditional methods however, DGGE has shown the most
promise as it can handle longer DNA fragments, is less time consuming, and its
33
mutation detection sensitivity can theoretically reach 100%. Implementation of
DGGE in the capillary format was initially reported by Gelfi and coworkers [67]. A
secondary polymer concentration gradient, in addition to the usual denaturant
gradient, was employed for refocusing sample bands. Still, the irreproducibility
inherent in attaining in situ preparation of competent chemical denaturant gradient
gel matrices along with the additional secondary polymer concentration gradient
required for adequate sensitivity renders implementation difficult.
Temperature gradient gel electrophoresis (TGGE) is analogous to DGGE
and has been successfully demonstrated in slab gel [68] and capillary [69-73]
formats. Gelfi et al. pioneered generated a temporal thermal gradient in the capillary
via joule heating [69]. The joule heating and subsequent temperature in the capillary
were manipulated by ramping the separation voltage with time. The inability to
control the separation voltage and temperature independently has led to the pursuit
of alternative temperature control strategies for TGGE in capillary. Schell and
coworkers [70] modified the cooling jacket of a commercial capillary
electrophoresis system to allow for the generation of a controlled temperature ramp
over time. Gao and Yeung [71] successfully extended this use of an externally
generated temporal thermal gradient to a high throughput TGGE system consisting
of an array of 96 capillaries. Zhu et al. [73] later demonstrated TGCGE with a
spatially generated thermal gradient as well.
In this work, plastic microfluidic systems employing TGGE are developed to
perform rapid and cost-effective screening for DNA sequence variation. Bulk heater
34
assemblies are utilized to externally induce both spatial and temporal thermal
gradients in the microchannels, thus enabling single and parallel TGGE separations.
Reduced size and power requirements in microfluidics not only lead to improved
portability and the effective simplification of equipment requirements, but also
establish the foundation for on-chip heater/sensor integration. A comprehensive
polycarbonate (PC)-based microfluidic device, containing an integrated microheater
and sensor array for generating an internal spatial temperature gradient along the
length of the microchannel, illustrates the potential of achieving high throughput
and sensitive DNA mutation detection in miniaturized systems.
EXPERIMENTAL SECTION
Materials and Reagents. Boric acid, KlenTaq® DV Ready Mix, and
poly(vinylpyrrolidone) (PVP, MW 360,000) were obtained from Sigma (St. Louis,
MO). Ethylene(diaminetetraacetic acid) (EDTA) and
Tris(hydroxymethyl)aminomethane (Tris) were acquired from Bio-Rad (Hercules,
CA). YOYO®-1 fluorescent intercalating dye (excitation: 491 nm; emission: 509
nm) and PCR primers were purchased from Molecular Probes (Eugene, OR) and
Integrated DNA Technologies (Coralville, IA), respectively. All aqueous solutions
were prepared using water purified by a Nanopure II system (Dubuque, IA) and
further filtered with a 0.22 m membrane (Costar, Cambridge, MA).
Device Fabrication. A standard lithographically patterned silicon master
template containing a positive representation of the desired channel network was
35
used to fabricate the plastic microfluidic devices from blank PC substrates via
thermal embossing. Briefly, each blank PC disk, 9.0 cm in diameter and cut from
1.5 mm thick PC sheet (Sheffield Plastic, Sheffield, MA) was aligned over the
silicon template and the subsequent assembly was sandwiched between two glass
plates. A hydraulic press with heated platens was then used to emboss the PC
substrate with an applied force of 300 psi at 160 °C for 5 min. A separate PC
substrate, complete with machined channel access holes, was aligned with the
embossed substrate to serve as a cover piece. The assembly was sandwiched
between two glass plates and the previously embossed open channels are sealed by
thermally annealing the substrates under 900 psi at 140 °C for 10 min. Finally, fluid
reservoirs machined from 1.3 cm-thick PC sheet were fixed to the annealed
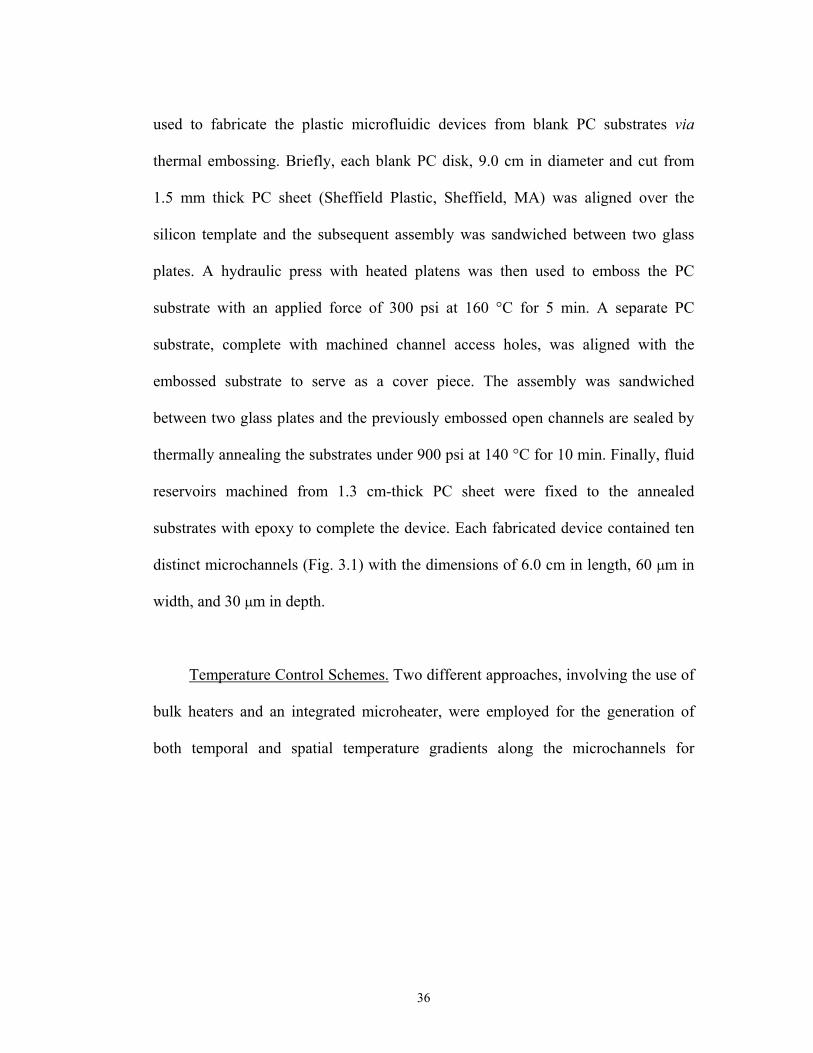
substrates with epoxy to complete the device. Each fabricated device contained ten
distinct microchannels (Fig. 3.1) with the dimensions of 6.0 cm in length, 60 m in
width, and 30 m in depth.
Temperature Control Schemes. Two different approaches, involving the use of
bulk heaters and an integrated microheater, were employed for the generation of
both temporal and spatial temperature gradients along the microchannels for
……….
36
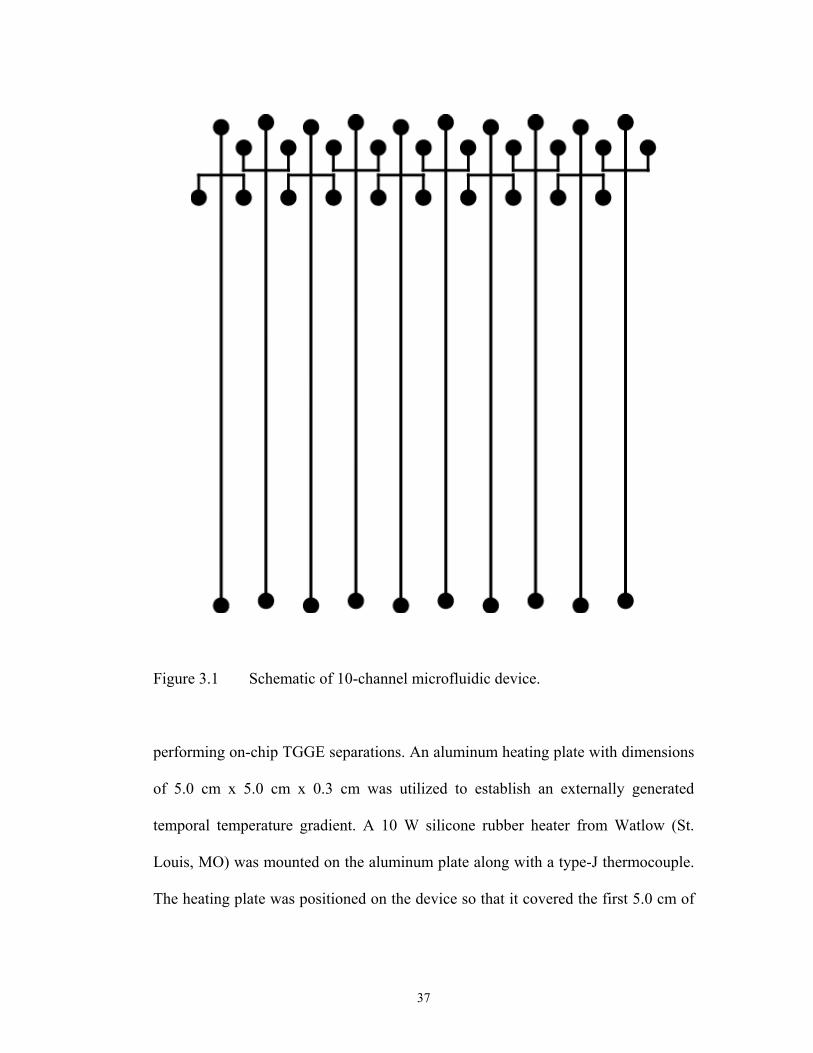
Figure 3.1 Schematic of 10-channel microfluidic device.
performing on-chip TGGE separations. An aluminum heating plate with dimensions
of 5.0 cm x 5.0 cm x 0.3 cm was utilized to establish an externally generated
temporal temperature gradient. A 10 W silicone rubber heater from Watlow (St.
Louis, MO) was mounted on the aluminum plate along with a type-J thermocouple.
The heating plate was positioned on the device so that it covered the first 5.0 cm of
37

the separation channel. Even contact between the top surface of the microfluidic
device and heater was achieved by mechanically fixing the heater assembly to the
microfluidic device. A Watlow Series 96 single-loop auto-tuning controller was
used to ramp the temperature at the desired range and rate during the separations.
A bulk heater platform, similar to the one reported by Mao and coworkers
[74], was employed for the separations involving an externally generated spatial
temperature gradient. Briefly, a custom aluminum heating plate with dimensions of
12.7 cm x 7.6 cm x 1.3 cm was constructed. The high-temperature end of heating
plate was controlled by a 300 W cartridge heater from Omega Engineering
(Stanford, CT). The cartridge heater was inserted into one hole at the high-
temperature end and was monitored by a Watlow Series 96 single-loop auto-tuning
controller with a type-J thermocouple mounted onto the heating plate directly above
the cartridge heater. The low-temperature end of the heating plate was manipulated
by circulating water through copper tubing that was inserted into the second hole.
The water flow rate and temperature were regulated by a water circulator with
heating and cooling capabilities from Fisher Scientific (Pittsburgh, PA). The bottom
and sides of the heating plate were insulated by a custom plastic housing
constructed from black copolyester. Transfer of the induced linear spatial
temperature gradient from the surface of the heating plate into the microfluidic
separation channels was facilitated by clamping the microfluidic device to the
exposed surface of the heating plate with the channel oriented in parallel to the
applied thermal gradient.
38
A comprehensive microfluidic device, containing an integrated microheater
and temperature sensor array (Fig. 3.2), was fabricated for the internal generation of
a spatial temperature gradient for performing microchip TGGE. Briefly, a thin layer
of titanium with a thickness of 20-100 nm was evaporated onto a blank PC
substrate. A microfabricated heater and sensor array were then lithographically
patterned in the thin titanium layer. A 0.5 m thick gold layer was similarly
evaporated onto the titanium and patterned to form low resistance leads and bond
pads. A parylene layer with a thickness of 5-10 m was then deposited atop the
integrated elements. Finally, a second PC substrate, containing embossed
microchannels, was sealed by a piece of 25 m thick LDPE/Nylon lamination film
prior to being mechanically fixed to the heater substrate to form the integrated
device.
DNA Samples and PCR Reactions. Model ds-DNA fragments ranging in size
from 136bp to 530bp and containing SNPs were prepared by amplifying DNA
Toolbox plasmid templates [65] via PCR. Briefly, 4 plasmid constructs (40-A, 40-C,
40-G, and 40-T) containing 40%-GC content and differing in sequence at one site to
account for all possible SNPs were amplified with the required primers to achieve
…
39
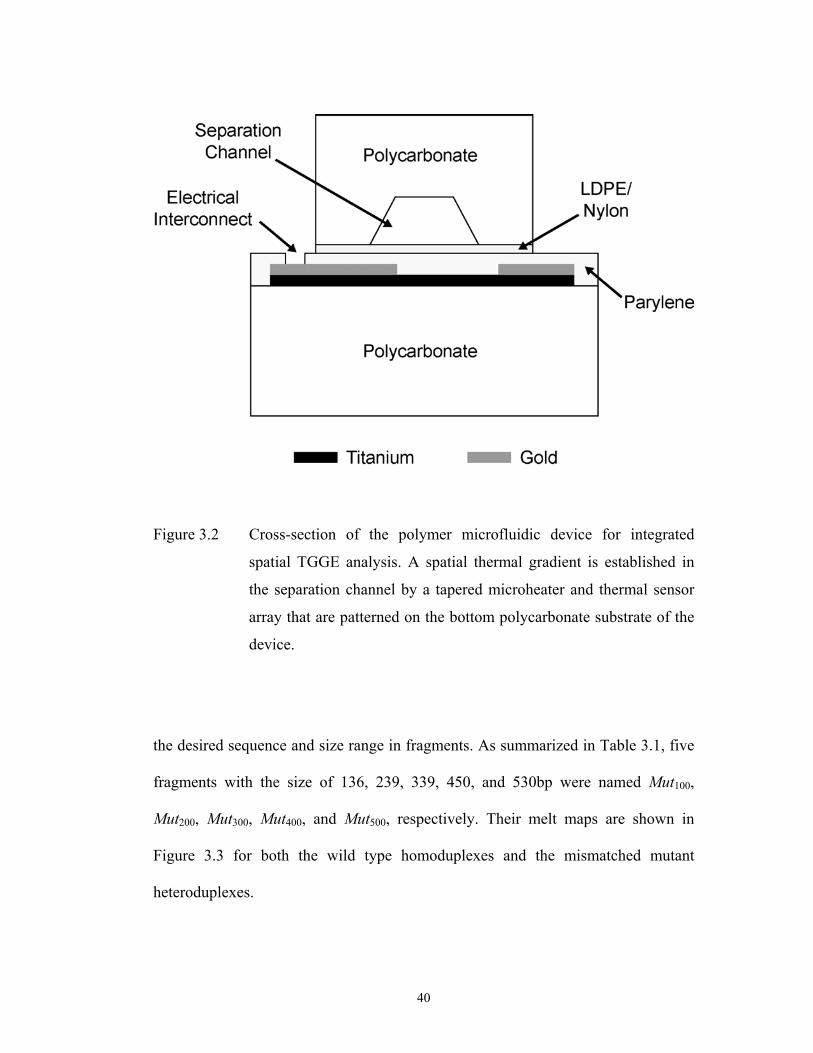
Figure 3.2 Cross-section of the polymer microfluidic device for integrated
spatial TGGE analysis. A spatial thermal gradient is established in
the separation channel by a tapered microheater and thermal sensor
array that are patterned on the bottom polycarbonate substrate of the
device.
the desired sequence and size range in fragments. As summarized in Table 3.1, five
fragments with the size of 136, 239, 339, 450, and 530bp were named Mut100,
Mut200, Mut300, Mut400, and Mut500, respectively. Their melt maps are shown in
Figure 3.3 for both the wild type homoduplexes and the mismatched mutant
heteroduplexes.
40
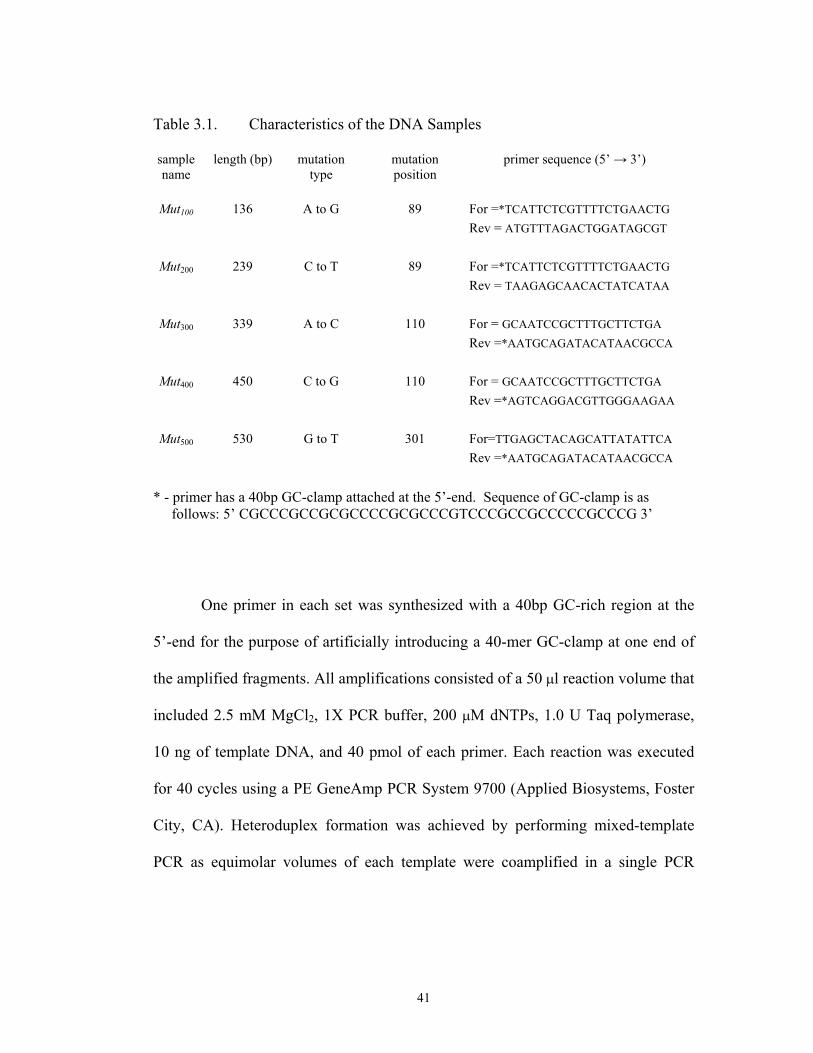
Table 3.1. Characteristics of the DNA Samples
samplename
length (bp) mutationtype
mutationposition
primer sequence (5’ 3’)
Mut100 136 A to G 89 For =*TCATTCTCGTTTTCTGAACTGRev = ATGTTTAGACTGGATAGCGT
Mut200 239 C to T 89 For =*TCATTCTCGTTTTCTGAACTGRev = TAAGAGCAACACTATCATAA
Mut300 339 A to C 110 For = GCAATCCGCTTTGCTTCTGARev =*AATGCAGATACATAACGCCA
Mut400 450 C to G 110 For = GCAATCCGCTTTGCTTCTGARev =*AGTCAGGACGTTGGGAAGAA
Mut500 530 G to T 301 For=TTGAGCTACAGCATTATATTCARev =*AATGCAGATACATAACGCCA
* - primer has a 40bp GC-clamp attached at the 5’-end. Sequence of GC-clamp is as follows: 5’ CGCCCGCCGCGCCCCGCGCCCGTCCCGCCGCCCCCGCCCG 3’
One primer in each set was synthesized with a 40bp GC-rich region at the
5’-end for the purpose of artificially introducing a 40-mer GC-clamp at one end of
the amplified fragments. All amplifications consisted of a 50 l reaction volume that
included 2.5 mM MgCl2, 1X PCR buffer, 200 M dNTPs, 1.0 U Taq polymerase,
10 ng of template DNA, and 40 pmol of each primer. Each reaction was executed
for 40 cycles using a PE GeneAmp PCR System 9700 (Applied Biosystems, Foster
City, CA). Heteroduplex formation was achieved by performing mixed-template
PCR as equimolar volumes of each template were coamplified in a single PCR
focusing
41

Figure 3.3 Melt maps for the five samples calculated by Poland Analysis software
[75]. Traces for each sample representing the wild-type homoduplex
(black line) and the mismatched mutant heteroduplex (red line) are
superimposed for comparison.
42
reaction to generate mismatches. The concluding elongation step in the PCR was
followed by a final denaturation at 94 °C for 5 min before incubating at 68 °C for 30
min. The amplified DNA was then allowed to cool to room temperature over 1 hr.
TGGE Analysis. The DNA was labeled with YOYO®-1 fluorescent
intercalating dye prior to analysis. The microchannels were filled with 4.5% PVP in
1X TBE buffer (89 mM Tris, 89 mM boric acid, 2 mM EDTA) as the polymer
matrix. Effective separation lengths were 5.5 and 4.0 cm for the devices using the
external heater assemblies and an integrated heater, respectively. Laser-induced
fluorescence detection was utilized to monitor the separations with the 488 nm-line
of an argon-ion laser. Briefly, a laser-line generator lens (Edmund Industrial Optics,
Barrington, NJ) was used to expand the incident laser beam horizontally prior to
focusing the beam vertically with a 15-cm focal length cylindrical lens. The
orientation of the optically generated laser line was redirected vertically toward the
detection window on the PC device where it spanned the 10-channel array on the
substrate. The fluorescence was monitored individually in each channel by a 16-bit
cooled CCD camera (Andor Technology, South Windsor, CT) employing a 50-mm
macro Nikon camera lens to focus the light onto the CCD sensor. A holographic
notch filter was located in front of the CCD chip to filter out laser scattering.
RESULTS AND DISCUSSION
TGGE is able to reveal the presence of sequence heterogeneity in a given
heteroduplex sample by inducing a thermal denaturing gradient that results in
43
differences between the average electrophoretic mobilities of DNA molecules that
are identical in size, but different in sequence. Given that the melting profile of a
DNA molecule is dependent on its sequence, DNA fragments of like size but
different sequence denature at different temperatures. When performing
electrophoresis under partial melting conditions, individual species display different
states of equilibrium between the unmelted DNA fragment and the partially melted
form. Because the fraction of time spent by the DNA molecules in the slower,
partially melted form varies among specific sequences, less stable fragments exhibit
a lower average electrophoretic mobility during the separation than more stable
fragments. In this way, the mobility difference induced by the thermal gradient
allows TGGE to resolve DNA sequence variants, thus revealing the presence of
mutations in a given sample.
The sensitivity of TGGE (and DGGE) has been shown to increase
significantly by adding artificial segments known as GC-clamps, 30-50bp stretches
of GC-rich fragments, to one or both ends of the DNA fragment targeted for
analysis. The GC-clamp can be easily introduced when amplifying the target
sequence via the PCR reaction by including it at the 5’-end of one of the PCR
primers [14]. In the absence of the GC-clamp, a DNA fragment consisting of a
single melting domain denatures completely under the applied temperature gradient,
making it impossible to determine any presence or absence of sequence
heterogeneity. Additionally, when the DNA fragment of interest consists of
multiple melting domains, only mutations in the lowest melting domain are readily
44
detected. By including a GC-clamp, a single high melting domain is artificially
created at one end of the target fragment. When properly positioned, the addition of
a GC-clamp can convert the target sequence of a fragment to a single low melting
domain ensuring that any mutation present in the target fragment is detectable by
TGGE.
To successfully resolve sequence variants in a TGGE analysis, the
separation medium must sustain a thermal gradient at a resolution that is finer than
the difference in partial melting temperatures among the variants, while performing
at a high enough efficiency to maintain the achieved separation through the
detection region. Thus, the primary experimental constraint for a proven
microfluidic-based TGGE platform is the resolution of the thermal gradient that is
applied during the separation. In this study, two separate approaches, involving the
use of bulk heaters and an integrated microheater, were pursued toward generating
an adequate temporal or spatial thermal gradient for performing TGGE separations
in a polymer microfluidic device fabricated from PC.
Externally Generated Temporal Temperature Gradient. To establish a temporal
temperature gradient for performing TGGE separations, the channel temperature
was regulated by applying heat to the top face of the microfluidic device using a
small aluminum heating plate. The accuracy and reproducibility of the temperature
control system was confirmed by first calibrating the system. This was
accomplished by embedding and monitoring type-J thermocouples in both outer
45
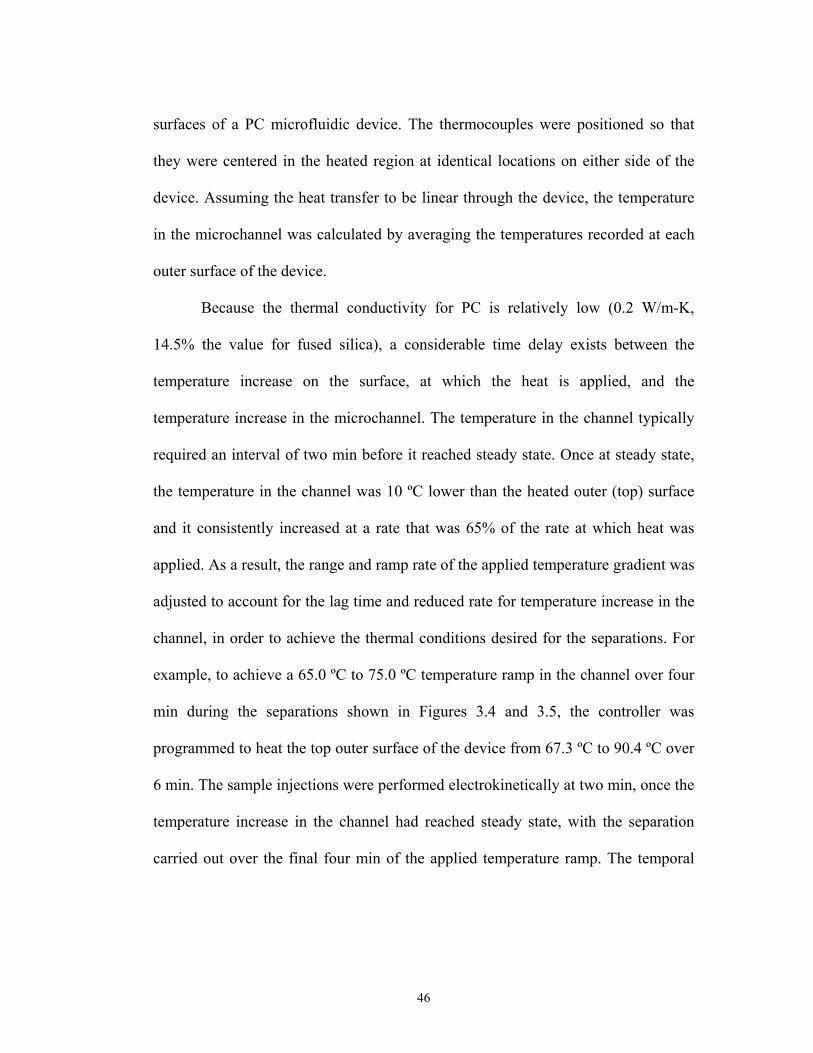
surfaces of a PC microfluidic device. The thermocouples were positioned so that
they were centered in the heated region at identical locations on either side of the
device. Assuming the heat transfer to be linear through the device, the temperature
in the microchannel was calculated by averaging the temperatures recorded at each
outer surface of the device.
Because the thermal conductivity for PC is relatively low (0.2 W/m-K,
14.5% the value for fused silica), a considerable time delay exists between the
temperature increase on the surface, at which the heat is applied, and the
temperature increase in the microchannel. The temperature in the channel typically
required an interval of two min before it reached steady state. Once at steady state,
the temperature in the channel was 10 ºC lower than the heated outer (top) surface
and it consistently increased at a rate that was 65% of the rate at which heat was
applied. As a result, the range and ramp rate of the applied temperature gradient was
adjusted to account for the lag time and reduced rate for temperature increase in the
channel, in order to achieve the thermal conditions desired for the separations. For
example, to achieve a 65.0 ºC to 75.0 ºC temperature ramp in the channel over four
min during the separations shown in Figures 3.4 and 3.5, the controller was
programmed to heat the top outer surface of the device from 67.3 ºC to 90.4 ºC over
6 min. The sample injections were performed electrokinetically at two min, once the
temperature increase in the channel had reached steady state, with the separation
carried out over the final four min of the applied temperature ramp. The temporal
46

temperature gradient was applied over the first 5 of the 5.5-cm long effective
separation length.
TGGE Separations were performed in both individual and parallel formats.
Figure 3.4 illustrates the reproducibility that was attained for separations of the
Mut100 sample in the single mode. The reproducibility shown is representative for
the entire sample set when analyzed by temporal TGGE in the single mode. Due to
the shorter analysis times associated with microchip electrophoresis, the temporal
.....
Figure 3.4 Three temporal TGGE electropherograms of Mut100 sample illustrating
the reproducibility of the analysis. Analyses are performed sequentially
using 4.5% PVP in 1X TBE under an applied electric field of 150 V/cm.
The PVP gel matrix is replaced in the channel prior to each analysis.
47
Figure 3.5 Multichannel electropherograms for 10-channel temporal TGGE
analysis performed in parallel. Conditions are identical to those
described for Figure 3.4.
48
resolution for the applied temperature ramps is not as high as that for capillary-
based temporal TGGE systems [68-71]. However, the much smaller injection plugs
associated with microchip electrophoresis require a temporal TGGE system to
generate a difference in partial melting between two sequence variants for only a
few seconds for those variants to be resolved from one another. This enabled the
microfluidics-based temporal TGGE system to attain resolution and separation
efficiency that are comparable to capillary TGGE systems, but at a much shorter
analysis time.
To demonstrate the applicability of the temporal TGGE platform for
performing high throughput mutation detection, all five model mutant samples
along with their corresponding reference wild types were analyzed in parallel under
one temporal temperature gradient. Although lacking optimal resolution under one
temperature gradient, a 10-channel parallel separation positively detected SNPs in
all five model mutant samples in less than 4 min. Further enhancement in
throughput can be achieved by simply fabricating devices containing a high density
of microchannels in the parallel array.
Externally Generated Spatial Temperature Gradient. As discussed earlier, the
low thermal conductivity of PC provides a significant impediment when using an
external heat source to generate a temporal thermal gradient inside the separation
channel. Consequently, the viability of performing TGGE in a PC microfluidic
device using an externally generated spatial temperature gradient was explored. The
49
use of a broad spatial temperature gradient has the potential for reducing the
significance of the low thermal conductivity to analysis time by requiring the
channel temperature to reach steady state only once prior to the initial run when
performing a sequence of separations. This method also ensures that every fragment
theoretically experiences the same temperature gradient during a given TGGE
analysis regardless of their differences in electrophoretic mobility within the gel
matrix. Removing this time dependence further allows for performing separations at
higher electric field-strengths and speeds without sacrificing the resolution of the
applied temperature gradient.
For this scheme, the microfluidic device is fixed to an aluminum-heating
platform containing a thermal gradient along its length. This bulk spatial thermal
gradient platform was constructed with a surface that was significantly larger than
the PC microfluidic device for the purpose of reducing edge effects. The resulting
platform design provided excellent flexibility and linearity for the range and
magnitude of the spatial temperature gradients applied. The various gradients
employed were calibrated with a specially modified calibration microfluidic device.
Briefly, a device was fabricated using the embossing process described previously.
However, prior to thermal binding of the embossed PC substrate to the cover piece,
small grooves were milled along the center channel and four miniature
thermocouples were fixed equidistantly along the length of the channel. The
thermocouples embedded in the bonded calibration device were used to acquire a
50
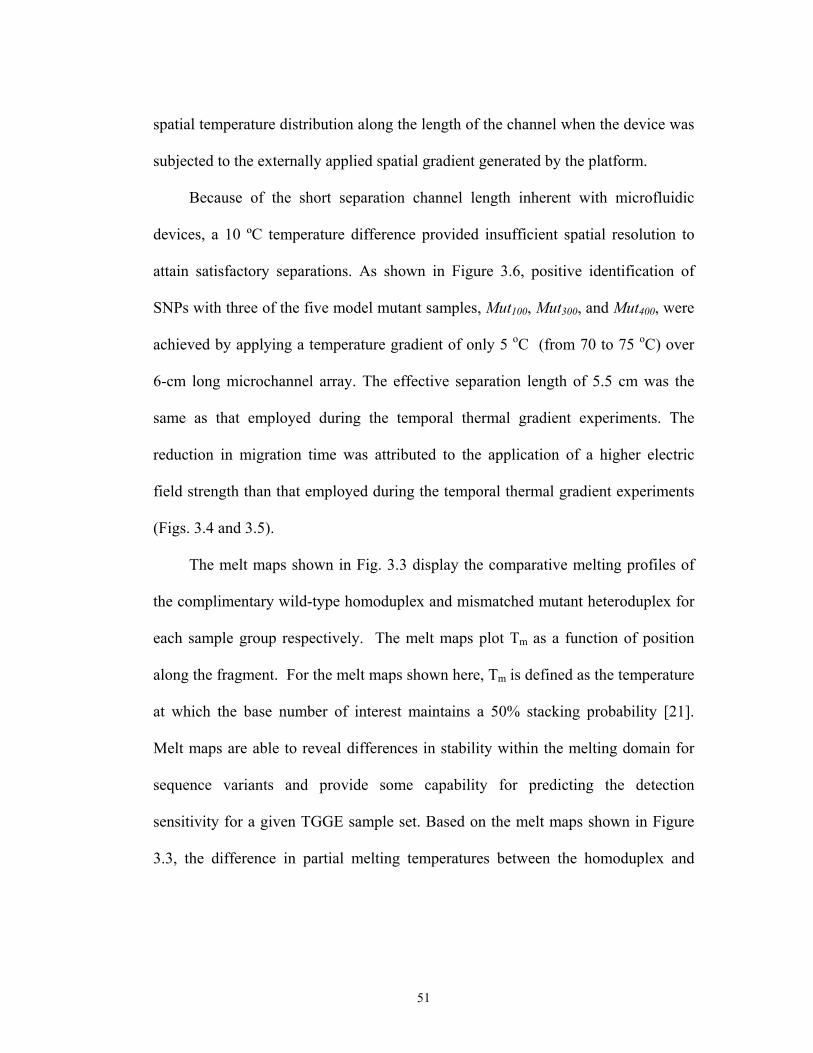
spatial temperature distribution along the length of the channel when the device was
subjected to the externally applied spatial gradient generated by the platform.
Because of the short separation channel length inherent with microfluidic
devices, a 10 ºC temperature difference provided insufficient spatial resolution to
attain satisfactory separations. As shown in Figure 3.6, positive identification of
SNPs with three of the five model mutant samples, Mut100, Mut300, and Mut400, were
achieved by applying a temperature gradient of only 5 oC (from 70 to 75 oC) over
6-cm long microchannel array. The effective separation length of 5.5 cm was the
same as that employed during the temporal thermal gradient experiments. The
reduction in migration time was attributed to the application of a higher electric
field strength than that employed during the temporal thermal gradient experiments
(Figs. 3.4 and 3.5).
The melt maps shown in Fig. 3.3 display the comparative melting profiles of
the complimentary wild-type homoduplex and mismatched mutant heteroduplex for
each sample group respectively. The melt maps plot Tm as a function of position
along the fragment. For the melt maps shown here, Tm is defined as the temperature
at which the base number of interest maintains a 50% stacking probability [21].
Melt maps are able to reveal differences in stability within the melting domain for
sequence variants and provide some capability for predicting the detection
sensitivity for a given TGGE sample set. Based on the melt maps shown in Figure
3.3, the difference in partial melting temperatures between the homoduplex and
51
heteroduplex species for each of the Mut200 and Mut500 samples was not wide
enough to achieve separation at the same spatial temperature gradient resolution.
Figure 3.6 Spatial TGGE electropherograms for: (a) Mut100; (b) Mut200; (c) Mut300;
(d) Mut400; and (e) Mut500 along with their corresponding reference wild
type samples. Separations were performed under a spatial thermal
gradient of 70-75 oC at electric field strength of 200 V/cm.
52
Spatial Temperature Gradient Using Integrated Microheater. One disadvantage
to employing off-chip external bulk heater platforms for generation of the thermal
gradient is the stipulation that such TGGE systems require off-line calibration and
monitoring of the temperature profile imposed in the microchannel. In order to
calibrate the thermal gradient applied by an external heating platform, the
temperature in the separation channel can be monitored by either introducing a
temperature sensitive fluorescent dye [76], or by invasively interrogating the
channel environment with a thermocouple probe. Regardless of the approach, it is
difficult to replicate the exact experimental conditions of the analysis during
calibration. One solution to this problem is to integrate the heaters and sensors
directly into to the microfluidic device. By decreasing the proximity of the heaters
to the separation channel, the integration of microheaters and sensors on the
substrate significantly reduces the power requirement and thermal response times
involved in generating an adequate thermal gradient for TGGE separations.
Fabrication of a comprehensive polymer microfluidic TGGE device equipped
with an integrated microheater and thermal sensor array was therefore pursued in
this study. The spatial temperature gradient was achieved with a tapered heater, and
was monitored by an array of 25 resistive temperature detectors (RTD) located next
to the heater along the length of the microchannel. The heater was designed such
that the power dissipation varied linearly along the length of the heater, establishing
a linear spatial thermal gradient in the adjacent separation channel. Each sensor in
53

the RTD array covered an area of 100 x 300 m, providing a fine spatial resolution
for monitoring the temperature in the channel.
In a preliminary test, the integrated device equipped with a spatial temperature
gradient from 70 to 75 oC over a 4-cm separation length successfully resolved all
sequence variants in the Mut100 heteroduplex sample (Fig. 3.7). It should be noted
that effective separation lengths were 5.5 and 4.0 cm for the devices using the
external heater assemblies and an integrated heater, respectively. Compared with the
demonstrated external platforms, the increase in the number of sensors from 4 in the
.that
Figure 3.7 Electropherogram for Mut100 and its corresponding reference wild type
sample in a microfluidic device containing an integrated heater and
thermal sensor array. The spatial thermal gradient of 70-75 oC was
distributed over a 4-cm long effective separation length at electric field
strength of 150 V/cm.
54
external calibration device to 25 in the integrated approach combined with the
reductions in power requirement (50 to 600 times) and thermal response time (50
times) provided more accurate and highly effective control of the temperature
gradient, resulting in improved separation efficiency and resolution in a TGGE
analysis of the Mut100 sample.
CONCLUSION
The demonstrated ability to perform on-chip TGGE analysis of model
mutant DNA fragments, each containing a single base substitution at one site,
significantly shortens analysis time while achieving resolution comparable to
capillary-based systems previously reported in the literature. Two different
platforms, involving the use of external heater assemblies and an integrated
microheater, are explored for generating temporal and spatial thermal gradients
required for performing TGGE separations. The externally generated temporal
thermal gradient positively detects sequence variations within all the model
heteroduplex samples. Additionally, the temporal TGGE platform is successfully
employed in achieving parallel analysis of all mutant DNA fragments, thus further
reducing the required analysis time by an order of magnitude in this high throughput
format. In contrast, the limited resolution of the externally applied spatial thermal
gradient over the short separation length in microfluidic device only allows for the
identification of sequence variations in the Mut100, Mut300, and Mut400 heteroduplex
samples.
55
The external heater assemblies struggle at quickly generating a thermal
gradient due to the low thermal conductivity of polymer substrate and the relatively
thick substrate through which the heat is applied to the microchannel. As a result,
fabrication of a comprehensive polymer microfluidic TGGE device complete with
an integrated microheater and thermal sensor array is pursued. In a preliminary test,
the integrated TGGE device rapidly achieves the detection of DNA mutants at better
separation resolution and greater energy efficiency than those attained using the
external heaters. This comprehensive TGGE microfluidic platform further allows
for on-chip control/monitoring of the spatial thermal gradient in the channel during
analysis while offering increased potential for portability. Ultimately, the potential
of microfluidic technology to transform the conventional and highly sensitive
mutation screening method of TGGE into an automated, portable, and high
throughput genomic technology is demonstrated.
56
CHAPTER FOUR
Two-Dimensional Genomic Separations in a Polymer Microfluidic Network
INTRODUCTION
As the scientific community moves forward in the post-genomic era, a
primary initiative has been focused on functional genomic studies. At the forefront
is the increase in analysis of genetic variation in human populations. This work
strives to expand the information and tools at the disposal of healthcare providers
with the overall aim of improving disease diagnosis, prognosis, and management.
To facilitate the achievement of this goal, the development of enhanced analytical
tools for rapid, inexpensive, and accurate detection of DNA sequence heterogeneity
had been identified as holding much importance. In addition to the need for more
superior analytical technologies, there is also a demand for front-end nucleic acid
preparation practices that can be carried out at much higher throughput to minimize
any limitations sample preparation steps impose on the overall analysis.
Front-end DNA sample preparation received a tremendous boost from the
introduction of the polymerase chain reaction (PCR) in the mid-1980s by Mullis and
co-workers [77]. This development revolutionized the field of molecular biology
and diagnostics as it provided a means for nucleic acid amplification that is much
57

more rapid than cloning-based methods. However, when performed in a discrete
format (one reaction per reaction volume), PCR can still emerge by far as the rate-
determining step in the overall analysis due to the laborious preparation involved.
To reduce this, researchers have pursued the implementation of PCR in a more
parallel, multiplexed format [20-27]. Under optimized conditions, as many as 10 or
more PCR reactions can be carried out in a multiplex fashion within the same
reaction volume [20]. Due to the parallel sample processing involved, PCR
multiplexing significantly reduces sample preparation time. Furthermore, it
provides a procedural means for eliminating much of the variability inherent in the
preparation of discreet PCR reactions such as pipetting accuracy and disparity
among individual PCR reactions. The ability to perform several reactions in the
same volume also provides a significant reduction in reagent consumption,
especially with regards to the template DNA.
As a consequence of the establishment of higher throughput biological
sample preparation strategies, an even stronger need has arisen for improved
analytical technologies capable of resolving highly complex sample mixtures. A
popular approach to analyzing complex biological samples such as multiplex PCR
products has been to employ two-dimensional gel electrophoresis strategies. A
powerful two-dimensional gel electrophoresis methodology was pioneered by
Fischer and Lerman [19] and was utilized to fully resolve and detect sequence
variations in the entire E. coli genome. In this conventional slab-gel approach,
DNA fragments can be resolved in two dimensions based on their differences in size
58

and sequence. DNA fragments in complex mixtures are segregated by size with a
standard gel electrophoresis separation in the first separation dimension. Size
resolved fragments are then interrogated for sequence variation by a sequence-
dependent separation in the second dimension using denaturing gradient gel
electrophoresis (DGGE). Apart from nucleotide sequencing, denaturing gradient
gel electrophoresis is the only method which provides virtually 100% theoretical
sensitivity for mutation detection. In this approach, the application of 2-D DNA gel
electrophoresis significantly increases the number of target fragments that can be
analyzed simultaneously on the basis of two independent criteria, size and melting
temperature (determined by sequence).
By combining extensive PCR multiplexing with 2-D DGGE, Vijg and
coworkers have largely enhanced the throughput of 2-D DGGE through the
incorporation of a highly parallel sample preparation approach [21,22]. Named two-
dimensional gene scanning (TDGS) by its originators, this scheme has been directed
toward performing parallel analyses of mutational variants in multiple genes.
Accordingly, the exceptional resolving capability of TDGS in the slab gel format
has been demonstrated for several large, intensely studied human disease genes,
including BRCA1 [22], CFTR [23], RB1 [24], MLH1 [25,26], and TP53 [27].
Although front-end overtures have been made for improving overall
throughput of the analysis through the incorporation of multiplex PCR, the
fundamental limitations imposed by traditional slab-gel platforms on TDGS prevent
the technology from achieving desirable throughput in the analysis step. Despite the
59
selectivity and sensitivity provided by traditional TDGS, this technique as carried
out today consists of a series of manually intensive, time-consuming tasks, which
are susceptible to irreproducibility and inferior quantitative accuracy. As a result,
higher throughput platforms amenable to multidimensional separation processes
have become extremely desirable.
One promising alternative lies in the growing field of microfluidics.
Microfluidic analysis platforms are not subject to the fundamental limitations of
slab-gel platforms due to their potential for increased miniaturization, automation,
resolving power, and speed of analysis. Likewise, the capability of integrating
intricate separation networks within a miniaturized platform allows microfluidic
technology to readily support the analysis of complex biological samples in a
multidimensional, high throughput format.
In the work reported here, a complex single-layer microfluidic network is
fabricated in a rigid polycarbonate (PC) substrate for the purpose of performing
parallel two-dimensional genetic mutation analyses. In the analysis, standard gel
electrophoresis is utilized in the single first dimension channel to provide a size-
based separation for model multiplex PCR products of variable size. Following the
electrokinetic transfer of the size-resolved PCR products from the first dimension
channel into discreet second dimension channels, temperature gradient gel
electrophoresis (TGGE) is employed for performing parallel mutational analyses in
the second dimension channels. TGGE, analogous to denaturing gradient gel
electrophoresis, is performed while externally generating a temporal temperature
60
gradient through the microfluidic network to provide its sequence-based separation.
The thermal gradient provides for the resolution of DNA fragments of similar size,
but of different sequence, thus revealing the presence of mutations in a given
sample.
To optimize the parallel 2D separation process, extensive finite element
modeling (FEM) was performed. The FEM software was utilized to determine the
optimal geometries of the microfluidic network for the purpose of minimizing non-
uniformities in the electric field and analyte band dispersion caused by the presence
of interconnected channels in the microfluidic network. Furthermore, an alternative
sample stacking strategy was investigated for increasing the efficiency and resolving
power of the overall system for performing genetic mutation analyses.
EXPERIMENTAL SECTION
Materials and Reagents. Boric acid, KlenTaq® DV Ready Mix,
Tris(hydroxymethyl)aminomethane hydrochloride (Tris-HCl), fluorescein sodium
salt (excitation: 490 nm; emission: 514 nm), and poly(vinylpyrrolidone) (PVP, MW
360,000) were obtained from Sigma (St. Louis, MO). Ethylene(diaminetetraacetic
acid) (EDTA) and Tris were acquired from Bio-Rad (Hercules, CA). YOYO®-1
fluorescent intercalating dye (excitation: 491 nm; emission: 509 nm) and PCR
primers were purchased from Molecular Probes (Eugene, OR) and Integrated DNA
Technologies (Coralville, IA), respectively. All aqueous solutions were prepared
using water purified by a Nanopure II system (Dubuque, IA) and further filtered
with a 0.22 m membrane (Costar, Cambridge, MA).
61

DNA Samples and PCR Reactions. Three model ds-DNA fragments of
varying size (136bp, 239bp, and 450bp) and containing SNPs were prepared by
amplifying DNA Toolbox plasmid templates [65] via PCR. Briefly, 4 plasmids
containing 40%-GC content and differing in sequence at one site were amplified
with the required primers to achieve the desired sequence and size range in
fragments. As summarized in Table 1 of chapter 3, the three fragments, 136, 239,
and 450bp in size, are referred to as Mut100, Mut200, and Mut400 respectively. Their
melt maps are also shown in Fig. 3 of chapter 3 for both the wild type
homoduplexes and the mismatched mutant heteroduplexes.
One primer in each set was synthesized with a 40bp GC-rich region at the 5’-
end for the purpose of artificially introducing a 40-mer GC-clamp at one end of the
amplified fragments. All amplifications consisted of a 50 l reaction volume that
included 2.5 mM MgCl2, 1X PCR buffer, 200 M dNTPs, 1.0 U Taq polymerase,
40 ng of template DNA, and 40 pmol of each primer. Each reaction was executed
individually for 40 cycles using a PE GeneAmp PCR System 9700 (Applied
Biosystems, Foster City, CA). Heteroduplex formation was achieved by performing
mixed-template PCR as equimolar volumes of each template were coamplified in a
single PCR reaction to generate mismatches. The concluding elongation step in the
PCR was followed by a final denaturation at 94 °C for 5 min before incubating at 68
°C for 30 min. The amplified DNA was then allowed to slowly cool to room
temperature over 1 hr. Following amplification and heteroduplex formation, the
62

PCR products from each reaction were desalted using centrifugal membrane
filtration to decrease the conductivity of the sample matrix. Finally, the individual
PCR products were pooled to simulate an aliquot from a multiplex PCR reaction.
Device Fabrication. A standard lithographically patterned silicon master
template containing a positive representation of the desired channel network was
used to fabricate the plastic microfluidic devices from blank PC substrates via
thermal embossing. Briefly, each blank PC disk, 9.0 cm in diameter and cut from
1.5 mm thick PC sheet (Sheffield Plastic, Sheffield, MA) was aligned over the
silicon template and the subsequent assembly was sandwiched between two glass
plates. A hydraulic press with heated platens was then used to emboss the PC
substrate with an applied force of 300 psi at 160 °C for 5 min. A separate PC
substrate, complete with machined channel access holes, was aligned with the
embossed substrate to serve as a cover piece. The assembly was sandwiched
between two glass plates and the previously embossed open channels are sealed by
thermally annealing the substrates under 900 psi at 140 °C for 10 min. Finally, fluid
reservoirs machined from 1.3 cm-thick PC sheet were fixed to the annealed
substrates with epoxy to complete the device.
Temporal Temperature Control. As described in chapter 3, an aluminum
heating plate with dimensions of 5.0 cm x 5.0 cm x 0.3 cm was utilized to establish
an externally generated temporal temperature gradient. A 10 W silicone rubber
63

heater from Watlow (St. Louis, MO) was mounted on the aluminum plate along
with a type-J thermocouple. The heating plate was positioned on the device so that it
covered from 1.0 cm to 6.0 cm along the length of the second dimension channels
moving away from the first dimension channel. Even contact between the top
surface of the microfluidic device and heater was achieved by mechanically fixing
the heater assembly to the microfluidic device. A Watlow Series 96 single-loop
auto-tuning controller was used to ramp the temperature at the desired range and
rate during the separations.
Finite Element Modeling. The software used to model the electric field
profile at the interface between the channels of the first and second separation
dimensions was ANSYS 6.1. The software employed to model the dispersion of
analyte bands during the first dimension separation and transfer steps was FemLab
2.3. All constants used to define the boundary conditions for the simulations such
as conductivity of the electrophoresis medium and electrophoretic mobility of the
analytes were determined empirically. The constant used for the coefficient of
diffusion was taken from the literature [81].
2D Microfluidic Mutation Analysis. The DNA was labeled with YOYO®-1
fluorescent intercalating dye prior to analysis. The microchannels were filled with
4.5% PVP in 1X TBE buffer (89 mM Tris, 89 mM boric acid, 2 mM EDTA) as the
polymer matrix. Effective separation lengths were 6.5 cm for the first dimension
64
separation and 6.5 cm for the parallel second dimension separations. Briefly, a
sample plug was injected into the first dimension separation channel using the
pinched-valve injection method [82]. Upon resolution of the sample components by
size, the voltage sources controlling the first dimension electrophoretic separation
were shut off, halting the electrokinetic migration of the analyte bands.
Immediately, the voltage sources controlling the second dimension separation were
initiated, and the bands were transferred into discreet second dimension channels
where parallel TGGE analyses were performed on each resolved analyte species as
the temperature in the channels was ramped over the desired range. A custom-
designed laser-induced fluorescence detection system, as described in chapter 3, was
utilized to monitor the parallel separations simultaneously. The effective length of
the parallel separations was 6.5 cm. Data was recorded at a frequency of 10 Hz.
pH-Mediated Sample Stacking Following Transfer to Second Dimension.
Size-resolved analyte PCR bands were stacked following transfer to the second
dimension by utilizing the base stacking on-column sample concentration approach
introduced by Swerdlow and coworkers [83]. For this process, the sieving matrix
for the two-dimensional separation was 4.5% PVP dissolved in 50 mM Tris-HCl
buffer. Following the first dimension separation, the transfer process is performed
for 10 seconds before being halted. The grounding voltages helping to drive
electrophoresis in the second dimension are removed from the buffer reservoirs and
applied to reservoirs containing 0.1 N NaOH. NaOH is then injected into each
65
channel of the second dimension array for a total of 10 seconds before the electric
field is turned off and the voltages are reapplied to the buffer reservoirs. The
parallel TGGE analyses are then carried out in the same manner as described above.
RESULTS AND DISCUSSION
The promise shown by microfluidic platforms for realizing
multidimensional separations in a single integrated system has prompted several
research groups to explore such strategies. Recently, researchers have confirmed
this potential through preliminary demonstrations of multidimensional protein and
peptide separations. These attainments further uphold the potential of microfluidic
platforms in providing several unique advantages over traditional bench-top
instrumentation and methodologies, including rapid and high throughput
separations, ultrahigh separation efficiency and resolution, improved
reproducibility, ultralow sample consumption, high sensitivity, and fully automated
and integrated operation.
For example, Ramsey and co-workers [78] have demonstrated two-
dimensional separations of peptide mixtures in a glass microfluidic device using
micellar electrokinetic chromatography and zone electrophoresis as the first and
second dimensions, respectively. They have also fabricated a spiral shaped channel
coated with a C-18 stationary phase for performing reversed-phase chromatographic
separations of tryptic digest peptides. By utilizing a cross interface, the eluted
peptides from micellar electrokinetic chromatography or reversed-phase
chromatography channel are sampled by a rapid zone electrophoresis separation.
66
Additionally, Kenny and co-workers have recently coupled isoelectric focusing with
zone electrophoresis for 2-D separations of model proteins using plastic
microfluidics [79]. In both cases, the multidimensional separations were performed
in a serial format. The serial coupling of two dynamic separation methods, as in the
work by Ramsey et al., suffers from the fundamental limitation that the second
dimension separation must be orders of magnitude faster than the first dimension
separation in order to sample the entire volume of the first dimension contents at a
high enough density. Furthermore serial two-dimensional microfluidic separation
strategies lack the ability to simultaneously sample all analyte bands resolved in the
first dimension for parallel analysis in the second dimension, thus falling short of
providing maximum throughput.
As an early step toward realizing parallel two-dimensional microfluidic
separations, Whitesides and co-workers [80] have developed a 2-D capillary
electrophoresis system based on a 6-layer PDMS microfluidic system. The system
consisted of a single first dimension channel for performing isoelectric focusing.
The single first dimension channel is intersected by an array of parallel channels for
achieving SDS gel electrophoresis. This 6-layer PDMS microfluidic system,
however, requires the alignment, bonding, removal, re-alignment, and re-bonding of
various combinations of the six layers to perform a full 2-D protein separation. In
addition to being cumbersome and fairly complex to implement, the system may
suffer from band broadening due to diffusion during the post-separation assembly
process and cross-contamination during these manual procedures.
67

For the throughput potential of multidimensional microfluidic separations to
be realized, the development of more comprehensive, autonomous, and automation-
amenable parallel 2D microfluidic systems is essential. To this end, parallel two-
dimensional genetic mutation analysis in a complex, single-layer microfluidic
network fabricated in a rigid PC substrate is demonstrated in this study.
Parallel 2D Microfluidic Network Design. The channel network design
utilized in the microfluidic system reported here is illustrated in Figure 4.1. Briefly,
a single first dimension separation channel (connecting reservoirs 3 and 4), 6.5 cm
in length, 100 m wide, and 30 m in height is intersected 0.5 cm from the inlet end
by a cross injection channel (connecting reservoirs 1 and 2), 1.0 cm in length, 40
m wide, and 30 m in height. The cross injection channel provides the structural
means for performing the pinched-valve injection required to introduce a sample
plug into the first dimension for subsequent separation. The top side of the first
dimension separation channel is intersected toward the outlet end by an array of
eleven orthogonal 2D fluid access channels that connect the 1D separation channel
to the 2D inlet reservoirs (reservoirs 5). These channels are 0.5 cm in length, 40 m
wide, and 30 m in height. The bottom side of the first dimension separation
68
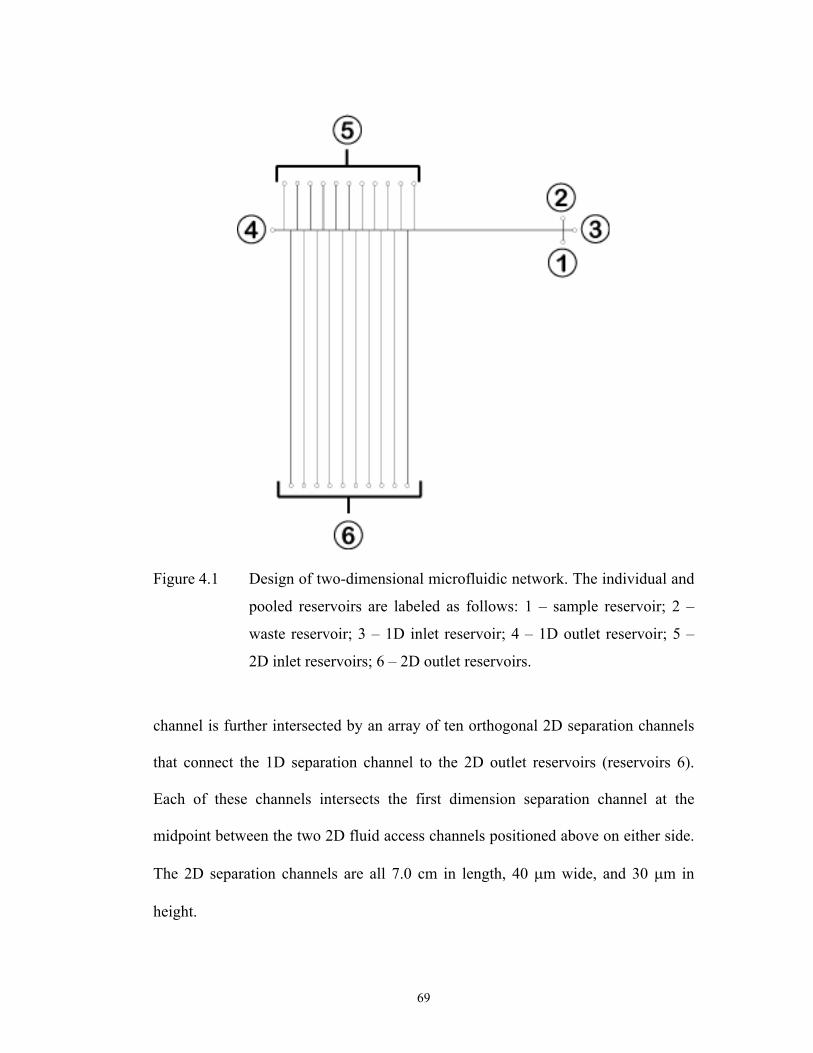
Figure 4.1 Design of two-dimensional microfluidic network. The individual and
pooled reservoirs are labeled as follows: 1 – sample reservoir; 2 –
waste reservoir; 3 – 1D inlet reservoir; 4 – 1D outlet reservoir; 5 –
2D inlet reservoirs; 6 – 2D outlet reservoirs.
channel is further intersected by an array of ten orthogonal 2D separation channels
that connect the 1D separation channel to the 2D outlet reservoirs (reservoirs 6).
Each of these channels intersects the first dimension separation channel at the
midpoint between the two 2D fluid access channels positioned above on either side.
The 2D separation channels are all 7.0 cm in length, 40 m wide, and 30 m in
height.
69
The placement of the 2D fluid access channels and the 2D separation channels
are staggered with respect to each other to simplify the transfer process.
Furthermore, this configuration allows for the entire contents of the first dimension
separation channel between the two outermost 2D fluid access channels of the upper
array to be transferred into the second dimension in a single process where it can be
simultaneously interrogated among ten discreet microchannels by parallel TGGE.
Finite Element Modeling of Network Geometry. To perform a parallel,
multidimensional analysis in a microfluidic device, a first dimension separation
must be conducted through a channel that is intersected by numerous second
dimension channels. The presence of numerous t-junctions within the first
dimension separation channel results in discontinuous sidewalls along the length of
the first dimension channel. Consequently, the effect these channel junctions have
on the separation efficiency of an analyte band as it migrates through them was
investigated.
The presence of discontinuous sidewalls in the first dimension separation
channel due to the intersecting 2D channels results in a non-uniform electric field
distribution along the length of the channel. Similar to a “leaky” electric field, this
electric field non-uniformity results when the electric field lines encounter regions
of reduced confinement created at the t-junctions along the 1D separation channel
by the intersecting 2D channels. At each junction, the uniform density of the
70
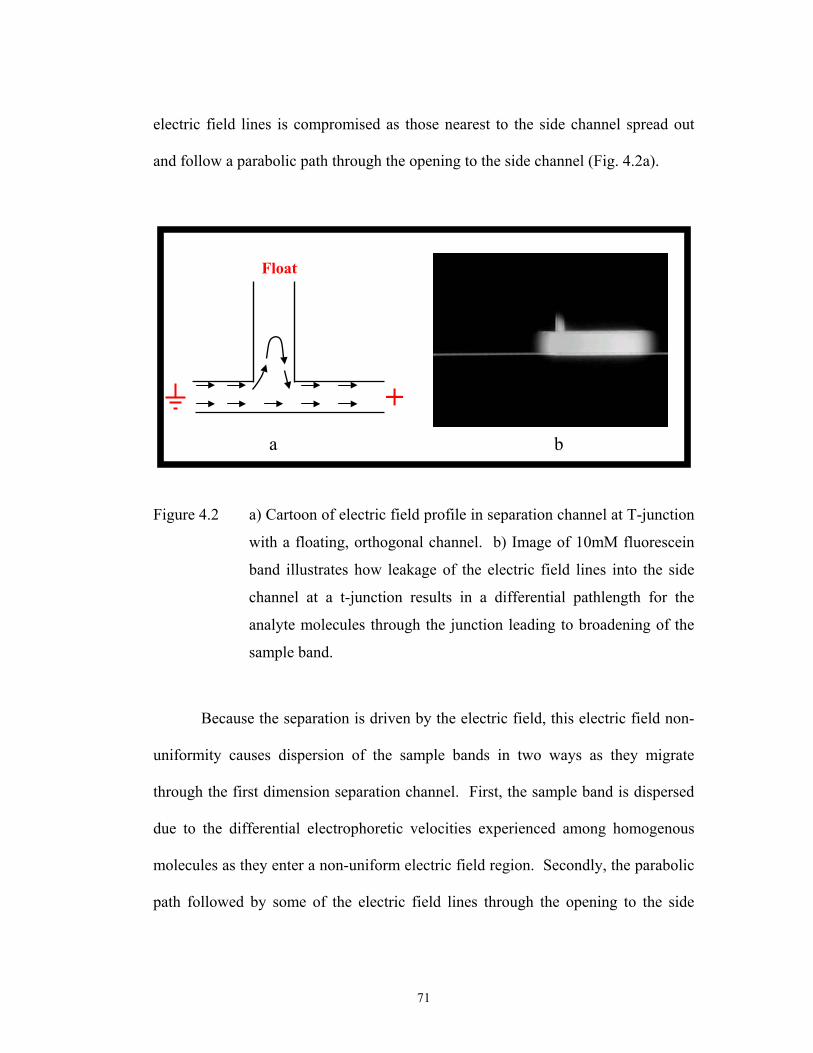
electric field lines is compromised as those nearest to the side channel spread out
and follow a parabolic path through the opening to the side channel (Fig. 4.2a).
ba
+
Float
Figure 4.2 a) Cartoon of electric field profile in separation channel at T-junction
with a floating, orthogonal channel. b) Image of 10mM fluorescein
band illustrates how leakage of the electric field lines into the side
channel at a t-junction results in a differential pathlength for the
analyte molecules through the junction leading to broadening of the
sample band.
Because the separation is driven by the electric field, this electric field non-
uniformity causes dispersion of the sample bands in two ways as they migrate
through the first dimension separation channel. First, the sample band is dispersed
due to the differential electrophoretic velocities experienced among homogenous
molecules as they enter a non-uniform electric field region. Secondly, the parabolic
path followed by some of the electric field lines through the opening to the side
71
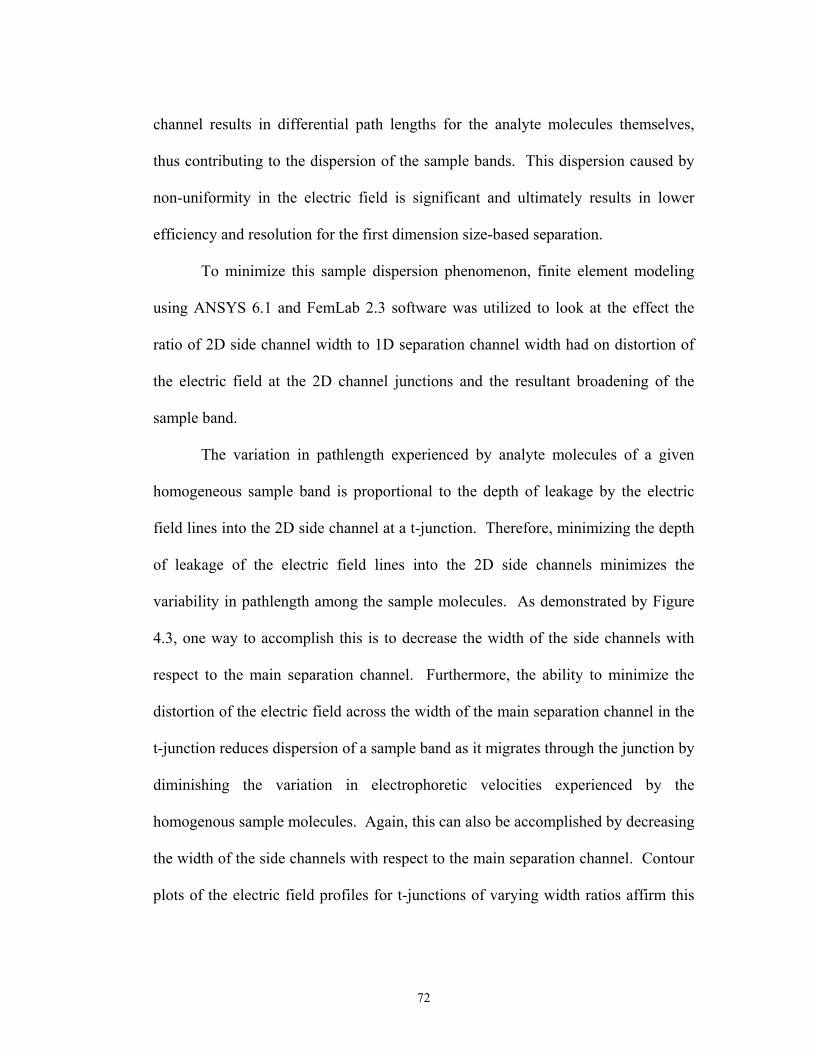
channel results in differential path lengths for the analyte molecules themselves,
thus contributing to the dispersion of the sample bands. This dispersion caused by
non-uniformity in the electric field is significant and ultimately results in lower
efficiency and resolution for the first dimension size-based separation.
To minimize this sample dispersion phenomenon, finite element modeling
using ANSYS 6.1 and FemLab 2.3 software was utilized to look at the effect the
ratio of 2D side channel width to 1D separation channel width had on distortion of
the electric field at the 2D channel junctions and the resultant broadening of the
sample band.
The variation in pathlength experienced by analyte molecules of a given
homogeneous sample band is proportional to the depth of leakage by the electric
field lines into the 2D side channel at a t-junction. Therefore, minimizing the depth
of leakage of the electric field lines into the 2D side channels minimizes the
variability in pathlength among the sample molecules. As demonstrated by Figure
4.3, one way to accomplish this is to decrease the width of the side channels with
respect to the main separation channel. Furthermore, the ability to minimize the
distortion of the electric field across the width of the main separation channel in the
t-junction reduces dispersion of a sample band as it migrates through the junction by
diminishing the variation in electrophoretic velocities experienced by the
homogenous sample molecules. Again, this can also be accomplished by decreasing
the width of the side channels with respect to the main separation channel. Contour
plots of the electric field profiles for t-junctions of varying width ratios affirm this
72
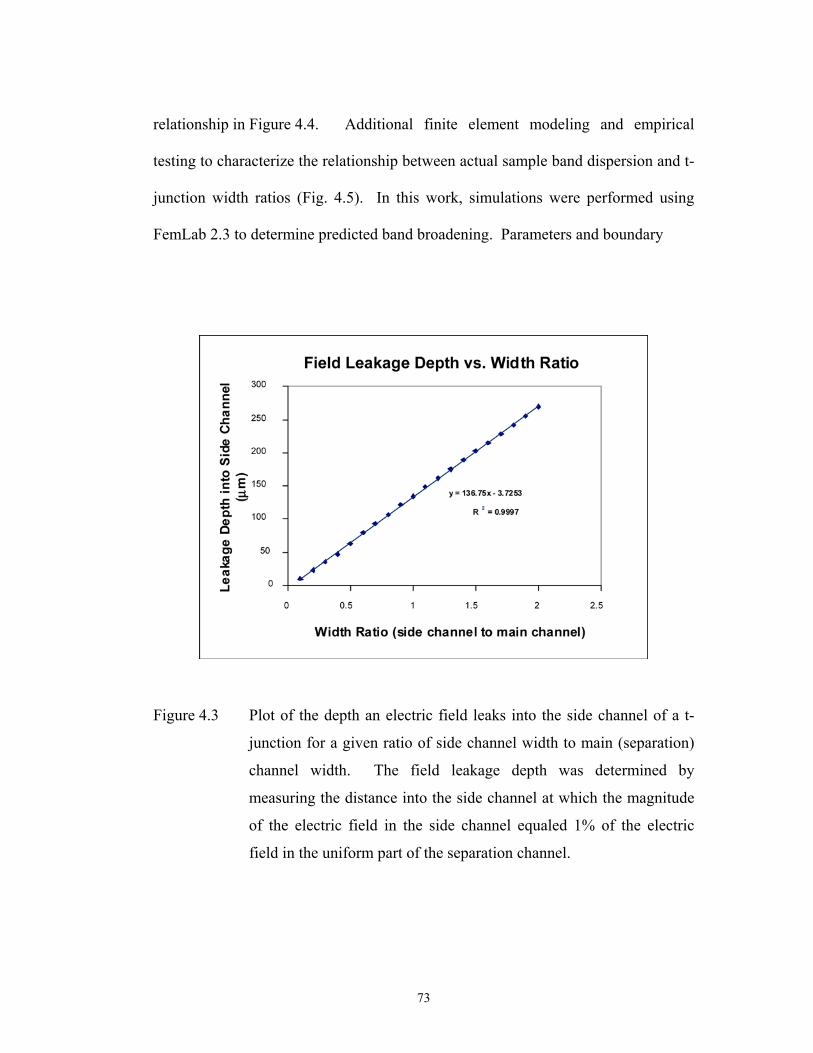
relationship in Figure 4.4. Additional finite element modeling and empirical
testing to characterize the relationship between actual sample band dispersion and t-
junction width ratios (Fig. 4.5). In this work, simulations were performed using
FemLab 2.3 to determine predicted band broadening. Parameters and boundary
Figure 4.3 Plot of the depth an electric field leaks into the side channel of a t-
junction for a given ratio of side channel width to main (separation)
channel width. The field leakage depth was determined by
measuring the distance into the side channel at which the magnitude
of the electric field in the side channel equaled 1% of the electric
field in the uniform part of the separation channel.
73
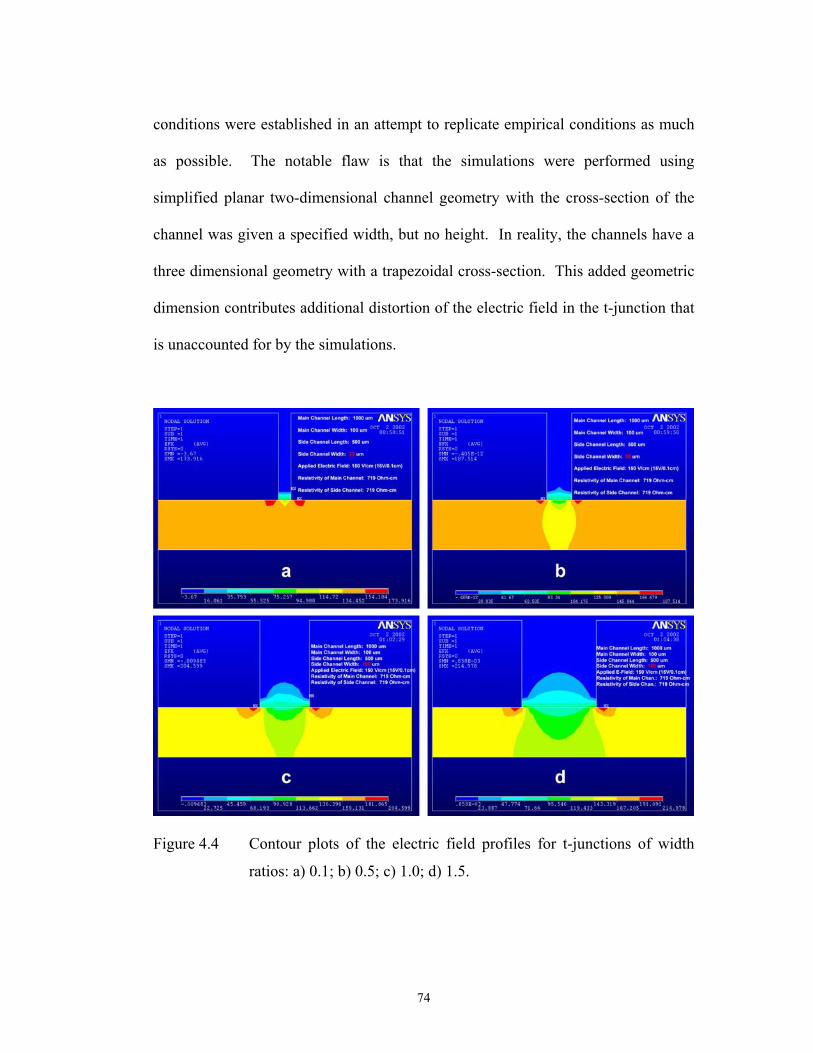
conditions were established in an attempt to replicate empirical conditions as much
as possible. The notable flaw is that the simulations were performed using
simplified planar two-dimensional channel geometry with the cross-section of the
channel was given a specified width, but no height. In reality, the channels have a
three dimensional geometry with a trapezoidal cross-section. This added geometric
dimension contributes additional distortion of the electric field in the t-junction that
is unaccounted for by the simulations.
Figure 4.4 Contour plots of the electric field profiles for t-junctions of width
ratios: a) 0.1; b) 0.5; c) 1.0; d) 1.5.
74

The band broadening simulations reconfirmed the relationship that was
deduced from the electric field modeling. As is the case for electric field leakage
depth and electric field distortion, Figure 4.5 demonstrates that the relative
broadening of a sample band as it passes through a t-junction is directly proportional
to the ratio of side channel width to separation channel width. Empirical
measurement
Figure 4.5 Plots of the simulated and empirical sample band dispersion caused
by the presence of a t-junction in the separation channel as a function
of the ratio of side channel width to separation channel width.
Empirical data was only obtained for width ratios of 0.2, 0.5, and 1.0.
measurements, however, exceeded the predicted values considerably. This most
likely resulted from the failure of the simulation to account for the three-
75
dimensional geometry of the channel structure used in the empirical testing.
Specifically, for the width ratio used in the 2D microfluidic network demonstrated
for genetic mutation analysis in this study (0.4 width ratio), the empirically derived
relationship predicts a relative sample band dispersion of 13.63% for each t-junction
encountered by the band. Conversely, simulation results predict a sample band
dispersion of 7.02% for each t-junction encountered by the band.
Comprehensive Parallel 2D Microfluidic Analysis. A model system
consisting of three, sequence variable PCR products 136, 239, and 450bp in size
was employed to validate the capability of the demonstrated microfluidic system to
perform a parallel 2D genetic mutational analysis. In order to perform a parallel 2D
separation in the microfluidic network designed here, the reservoirs used to control
the separations must be electrically decoupled from one another. The simplest way
to achieve this is to have the terminal ends of every channel in the network
disconnected (i.e. no common reservoirs). This allows electrical biases to be
selectively applied to, or removed from, reservoirs as needed depending upon the
intended operation. The application and removal of voltage sources at selected
reservoirs can be accomplished manually by simply placing or removing electrodes
by hand. However, this approach is highly undesirable and becomes impractical
when the density of channels in the microfluidic network increases. An alternative
approach that is highly amenable to automation involves the use of high voltage
relays [83]. Relays are inserted in series between the voltage source and the
76
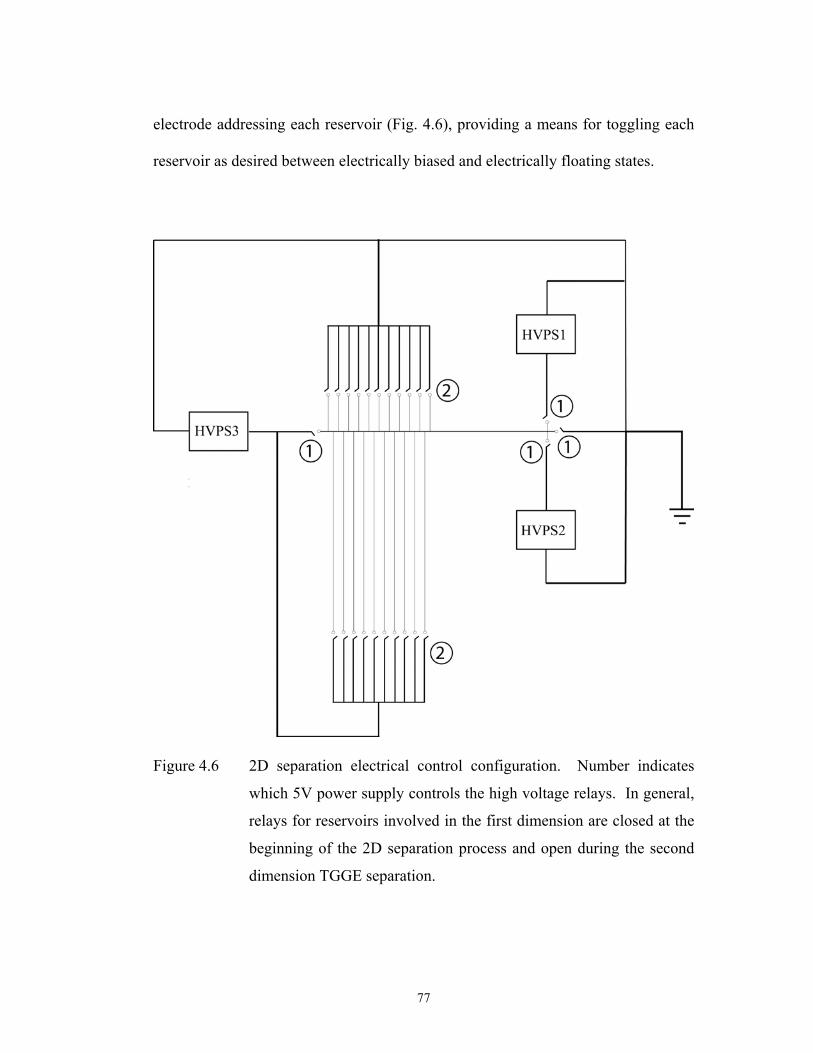
electrode addressing each reservoir (Fig. 4.6), providing a means for toggling each
reservoir as desired between electrically biased and electrically floating states.
Figure 4.6 2D separation electrical control configuration. Number indicates
which 5V power supply controls the high voltage relays. In general,
relays for reservoirs involved in the first dimension are closed at the
beginning of the 2D separation process and open during the second
dimension TGGE separation.
77
In employing this system to perform a parallel 2D microfluidic genetic
mutation analysis, a sample band (~50 m in width) containing a mixture of three
variable-sized PCR products was injected into the first dimension separation
channel using a pinched-valve injection technique. The size-based first dimension
gel electrophoresis separation was run for 90 seconds allowing for sufficient enough
resolution of the PCR products to transfer them into discreet second dimension
channels. After 90 seconds, the separation was halted. The reservoirs involved in
the first dimension separation (1 through 4 in Fig. 4.1) were then switched so that
they were electrically floating with respect to the circuit in the microfluidic network.
Next, the reservoirs involved in the second dimension separation (5 and 6 in Fig.
4.1) were then switched so that they could apply an electric potential across the 2D
separation channels. In this mode, the transfer and subsequent parallel mutation
analysis of all bands is performed simultaneously. Figures 4.7a (homoduplex
control) and 4.7b (heteroduplexes) show the results of comprehensive 2D
separations for mixtures containing Mut100, Mut200, and Mut400. The mixtures were
separated in the first dimension by size for 90 seconds at an electric field strength of
150V/cm. Upon halting the first dimension separation, the size-resolved bands were
transferred simultaneously into the second dimension and subsequently separated by
sequence using parallel TGGE at 125 V/cm. TGGE was performed with an
externally generated temporal thermal gradient by ramping the temperature from
72 C to 75 C over three minutes. An average separation efficiency of ~18,000
theoretical plates was demonstrated for the 2D analysis of the heteroduplex. In the
78

heteroduplex analysis, the 2D separation successfully revealed all three
heteroduplex samples. Each size variant was interrogated for sequence
heterogeneity in its own second dimension channel. Total analysis time was under
five minutes.
Figure 4.7 Electropherograms for comprehensive 2D DNA separations of a)
homoduplex control and b) heteroduplex samples consisting of a
mixture of Mut100, Mut200, and Mut400 fragments. The time domain
along the x-axis of the electropherogram represents the retention time
for the second dimension separation only. Data recording was
initiated once transfer of bands from first dimension to second
dimension commenced. First dimension separation was performed
for 90 seconds.
79
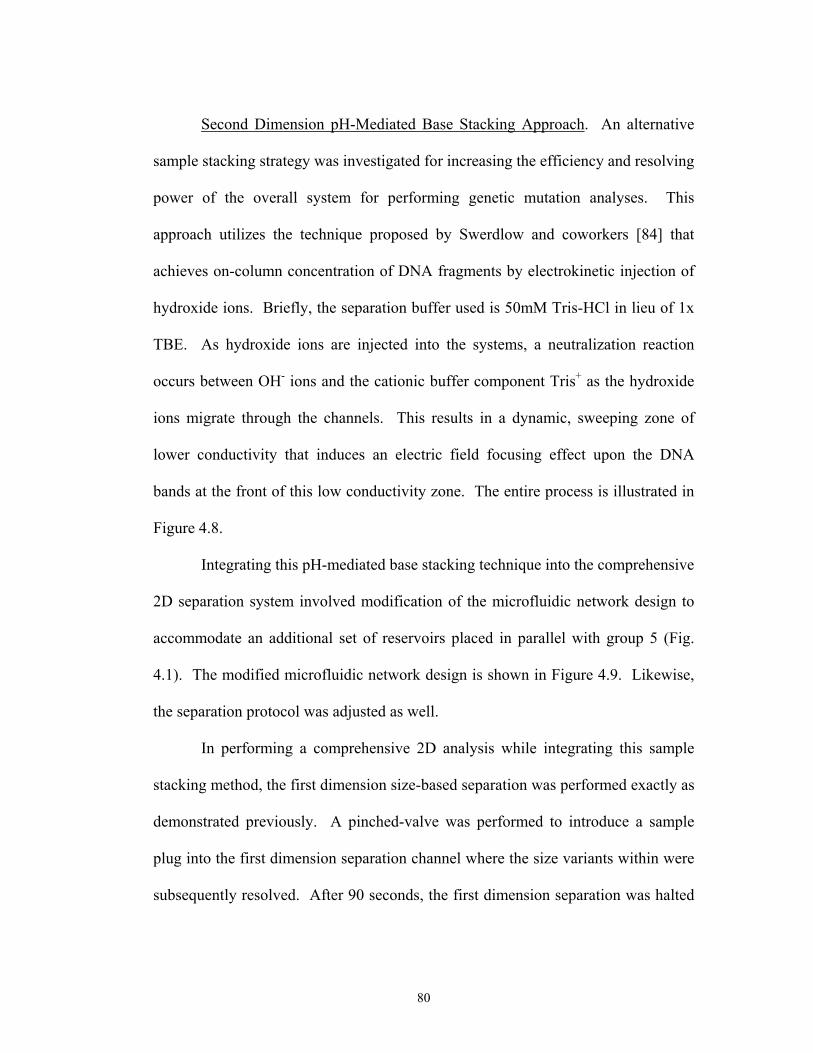
Second Dimension pH-Mediated Base Stacking Approach. An alternative
sample stacking strategy was investigated for increasing the efficiency and resolving
power of the overall system for performing genetic mutation analyses. This
approach utilizes the technique proposed by Swerdlow and coworkers [84] that
achieves on-column concentration of DNA fragments by electrokinetic injection of
hydroxide ions. Briefly, the separation buffer used is 50mM Tris-HCl in lieu of 1x
TBE. As hydroxide ions are injected into the systems, a neutralization reaction
occurs between OH- ions and the cationic buffer component Tris+ as the hydroxide
ions migrate through the channels. This results in a dynamic, sweeping zone of
lower conductivity that induces an electric field focusing effect upon the DNA
bands at the front of this low conductivity zone. The entire process is illustrated in
Figure 4.8.
Integrating this pH-mediated base stacking technique into the comprehensive
2D separation system involved modification of the microfluidic network design to
accommodate an additional set of reservoirs placed in parallel with group 5 (Fig.
4.1). The modified microfluidic network design is shown in Figure 4.9. Likewise,
the separation protocol was adjusted as well.
In performing a comprehensive 2D analysis while integrating this sample
stacking method, the first dimension size-based separation was performed exactly as
demonstrated previously. A pinched-valve was performed to introduce a sample
plug into the first dimension separation channel where the size variants within were
subsequently resolved. After 90 seconds, the first dimension separation was halted
80

and the bands were electrokinetically transferred into second dimension channels for
10 s before the field was turned off. As illustrated in Figure 4.8, the electric
potential was removed from the buffer reservoirs and placed in the NaOH reservoirs
upon which NaOH was injected into the second dimension separation channels for
10
Figure 4.8 Illustration of the steps involved in 2D separation protocol involving
the pH-mediated on column sample stacking process: a) 1D gel
electrophoresis separation; b) Transfer to 2nd dimension; c) Post-
transfer on-column base stacking of sample band; d) 2D TGGE
separation.
81
Figure 4.9 Design of modified 2D microfluidic network that allows for the
employment of pH-mediated sample stacking technique following
electrokinetic transfer of sample bands from first dimension to
second dimension.
82

10 seconds, effectively stacking the transferred sample bands by the mechanism
described above. The electric potential was returned to the buffer reservoirs and the
parallel TGGE separation was commenced. Results from a 2D analysis of a
heteroduplex mixture containing Mut100, Mut200, and Mut400 fragments are shown in
Figure 4.10. Parallel TGGE was performed in the second dimension channels
immediately following the base stacking process by externally generating a
temporal thermal gradient by ramping the temperature from 69 C to 72 C over three
minutes. The lower temperature range was required due to the use of lower ionic
strength buffer in this case. From the results obtained, it is obvious that the
separation efficiency and resolution of the heteroduplex samples are enhanced
through incorporation on the sample band stacking process into the 2D separation
protocol. An average ~1.8-fold increase in separation efficiency for the
heteroduplex sample bands along with increased peak heights indicate effective
sample stacking and concentration occurred following transfer of the bands into the
second dimension channels.
CONCLUSION
The design of a parallel 2D microfluidic network with the potential for dramatically
increasing the throughput of genetic mutation screening is proposed. The capability
of the microfluidic system for performing comprehensive parallel 2D DNA
separation is demonstrated through the analysis of simulated multiplex PCR
products containing variation in both size and sequence. In the first separation
83

dimension, size variants within the injected sample band are segregated using
standard gel electrophoresis. Following the first dimension separation, the size-
resolved
Figure 4.10 Electropherograms for comprehensive 2D DNA separation of
heteroduplex samples consisting of a mixture of Mut100, Mut200, and
Mut400 fragments. Separation efficiency and resolution are enhanced
through incorporation of a sample band stacking process following
the transfer of the bands into the second dimension and prior to
commencement of the second dimension TGGE separation.
84
resolved DNA fragments are subsequently transferred to discrete second dimension
channels where parallel, sequence-based TGGE separations are performed to
interrogate each size variant for sequence heterogeneity using a temporal
temperature gradient. Total analysis time is under 5 minutes.
Extensive finite element modeling determined that the 2D microfluidic
network design could be further optimized by minimizing the widths of the
interconnecting second dimension channels with respect to the width of the main
first dimension separation channel. Optimization of the geometry factors involved
in the network design are crucial in counteracting the sample band dispersion that is
inherent in separation channels, such as the first dimension separation channel
described here, which have discontinuous side walls. At present, the ratio of side
channel width to main separation channel width used in the 2D channel network
design is 0.4 with 40 m-wide second dimension channels representing the lower
limit of our current microfluidic fabrication capabilities. Alternative fabrication
methods must be explored to further improve the geometric optimization of the 2D
microfluidic network design.
In addition to geometric optimizations, a chemical optimization of the system
was demonstrated by the incorporation of a post-transfer sample band stacking
method prior to the second dimension. Effectively performing this process is not
trivial however, as the window in which it can be done is quite small. This is
because it must be executed following the complete transfer of all bands into the
second dimension to prevent re-broadening of the bands after stacking has already
85

been performed. Furthermore, the stacking must be carried out prior to the sample
bands reaching the heated region of the second dimension channels. This is because
stacking the band after commencing the TGGE separation will decrease the
resolving power of the separation. Ultimately, however, the potential of parallel 2D
microfluidic technology to rival and even supercede conventional mutation
screening methods with a more automated, portable, and high throughput genomic
technology is validated.
86

CHAPTER FIVE
SUMMARY AND CONCLUSION
The overall research objective of this project is to provide a higher
throughput approach toward the screening of genomic DNA for sequence
heterogeneity. This was to be achieved through the union of parallel
multidimensional separation strategies with a microfluidic separation platform, in
which the benefits of both can combine to achieve unparalleled throughput and
analysis speed.
With the completion of the preliminary component of the Human Genome
Project, the search for the role performed by specific genes and gene variants in
disease has been greatly accelerated, especially for genes associated with cancer and
genetic disorders. As the field of functional genomics advances, the identification
of specific nucleotide variations, especially SNPs has become increasingly
important in the attempt to increase present capabilities for detecting, monitoring
and treating disease. Although nucleotide sequencing remains the prime means for
identifying and characterizing sequence heterogeneity, the high costs and lengthy
time expenditure associated with current sequencing technology makes alternative
approaches more attractive in many cases. Furthermore, due to the low frequency
87

of mutations present in the genome (as noted previously), nucleotide sequencing by
itself is an entirely inefficient approach to interrogating the entire genome. Thus,
various methodologies have been developed to provide more cost-effective pre-
screening of mutations in relatively large pieces of DNA. These methods primarily
aim to screen through large amounts of DNA identify fragments of interest for
further characterization by nucleotide sequencing or a specific assay. The work
demonstrated here was aimed at developing a new, higher throughput mutation
screening method by exploiting the advantages of microfluidic technology.
Initial work provided a foundation for micro-fabrication methods to be used
later on. Specifically, a photolithographically-based methodology for fabricating
microchannel structures on a silicon template master was developed and used to
produce asters to be used in molding, imprinting, and embossing for the fabrication
of microfluidic networks. The work described in Chapter 2 outlines a unique
application to which these methods were directed.
The application of the field-effect for direct control of electroosmosis in a
polydimethylsiloxane (PDMS)-based microfluidic system, constructed on a silicon
wafer with a 2.0 m electrically insulating layer of silicon dioxide, was
demonstrated. This microfluidic system consists of a 2.0 cm open microchannel
fabricated on a PDMS slab, which can reversibly adhere to the silicon wafer to form
a hybrid microfluidic device. Aside from mechanically serving as a robust bottom
substrate to seal the channel and support the microfluidic system, the silicon wafer
is exploited to achieve field-effect flow control by grounding the semi-conductive
88
silicon medium. When an electric field is applied through the channel, a radial
electric potential gradient is created across the silicon dioxide layer that allows for
direct control of the zeta ( ) potential and the resulting electroosmotic flow (EOF).
By configuring this microfluidic system with two power supplies at
both ends of the microchannel, the applied electric potentials could be varied to
allow for manipulation of the polarity and magnitude of the radial electric potential
gradient across the silicon dioxide layer. At the same time, the longitudinal
potential gradient through the microchannel, which is used to induce EOF, was held
constant. The results of EOF control in this hybrid microfluidic system were
presented for phosphate buffer at pH 3 and pH 5. EOF control was achieved at
higher solution pHs of 6 and 7.4 by modifying the microchannel surface with
cetyltrimethylammonium bromide (CTAB) was also presented. Finally, results of
EOF control from this study were compared with those reported in the literature
involving the use of fused-silica capillary systems and microfluidic devices under
comparable conditions.
Chapter 3 outlines the efforts made to integrate a traditional mutation
screening method, TGGE, onto a microfluidic platform. In this work, a
miniaturized system for DNA mutation analysis, utilizing temperature gradient gel
electrophoresis (TGGE) in a polycarbonate (PC) microfluidic device, was reported.
By introducing a thermal denaturing gradient that results in differences of melting
states for DNA samples of homogeneous size but heterogeneous sequence, the
subsequent difference in average electrophoretic mobility allows TGGE to reveal
89
the presence of sequence heterogeneity in a given heteroduplex sample. Bulk heater
assemblies were designed and employed to externally generate temperature
gradients in spatial and temporal formats along the separation channels. TGGE
analyses of model mutant DNA fragments, each containing a single base
substitution, were achieved using both single and 10-channel parallel measurements
in a microfluidic platform.
Additionally, a comprehensive polymer microfluidic device containing an
integrated microheater and sensor array was developed and demonstrated for
performing spatial TGGE for DNA mutation analysis. The device consisted of two
PC modular substrates mechanically bonded together. One substrate was embossed
with microchannels while the other contained a tapered microheater,
lithographically patterned along with an array of temperature sensors. Compared
with the external heating approaches, the integrated platform provided significant
reduction in power requirement and thermal response time while establishing more
accurate and highly effective control of the temperature gradient for achieving
improved separation resolution.
Finally, Chapter 4 illustrates the realization of accomplishing a parallel two-
dimensional separation in a microfluidic network to perform high throughput
genetic mutation analysis of simulated multiplex PCR products. Geometric
optimization of the microfluidic network design was investigated and implemented.
Furthermore the separation process was enhanced through integration of a pH-
mediated sample stacking technique following transfer of the sample bands from the
90
first dimension channel to the second dimension channels. These optimizations
improved the overall efficiency and resolving power of the total system.
The comprehensive 2D mutation analysis performed with this platform
demonstrated the ability to resolve a complex mixture and reveal sequence
heterogeneity among target DNA fragments in approximately five minutes while
maintaining adequate separation efficiencies. This reveals the potential of the
system to provide tremendous improvement in analysis throughput over
conventional technologies that require several hours to even days. Further
enhancements of the facilities provided by this novel method will require alternative
fabrication methods to silicon template embossing for fabrication of the microfluidic
network that can allow for more advanced geometric optimization of the network
design. Specifically, further reduction in the electric field non-uniformity along the
length of the first dimension separation channel as well as an increase in the density
of the second dimension microchannel array need to be addressed. Finally, the
overall system needs to be fully automated into a self sufficient, autonomous
platform to realize the reproducibility and sensitivity promised by this technology.
This work will be essential for this method to approach the dependability and
detection limits that are achieved by competitive mutation screening methods.
91
REFERENCES
1. Pauling, L; Itano, H. A.; Singer, S. J.; Wells, I. C. Science 1949, 110, 543-548.
2. Srivastava, S.; Zou, Z. Q.; Pirollo, K.; Blattner, W.; Chang, E. H. Nature1990, 348, 747-749.
3. Eng, C., Vijg, J. Nature Biotechnol. 1997, 15, 422-426.
4. Cohen, A. S., Najarian, D. R.; Paulus, A.; Guttman, A.; Smith, J. A.; Karger, B. L. Proc. Natl. Acad. Sci. U.S.A. 1987, 85, 9660-9663.
5. Smith, L. M. Nature 1991, 349, 812-813.
6. Fung, E. N.; Yeung, E. S. Anal. Chem. 1995, 67, 1913-1919.
7. Venter, J. C. et al. Science 2001, 291, 1304-1351.
8. Orita, M., Iwahana, H., Kanazawa, H., Hayashi, K., Sekiya, T., Proc. Natl. Acad. Sci. USA 1989, 86, 2766-2770.
9. Liu, Q., Sommer, S. S. BioTechniques 1995, 18, 470-477.
10. Southern, E. M. Electrophoresis 1995, 16, 1539-1542.
11. Chee, M. et al. Science 1996, 274, 610-614.
12. Winzeler, E. A. et al. Science 1998, 281, 1194-1197.
13. Fischer, S. G., Lerman, L. S. Proc. Natl. Acad. Sci. USA 1983 , 80, 1579.
14. Sheffield, V. C., Cox, D. R., Lerman, L. S., Myers, R. M. Proc. Natl. Acad. Sci. USA 1989, 86, 232-236.
15. Abrams, E. S., Murdaugh, S. E., Lerman, L. S. Genomics 1990, 7, 463-475.
16. Gromp, M. Nat. Genet. 1993, 5, 111-117.
92

17. Fodor, S. P. A.; Read, J. L.; Pirrung, M. C.; Stryer, L.; Lu, A. T.; Solas, D. Science 1991, 251, 767-773.
18. Oefner, P. J.; Underhill, P. A. Am. J. Hum. Genet. 1995, 57, A266.
19. Fischer, S. G., Lerman, L. S. Cell 1979, 16, 191-200.
20. Barker, D. F. Human Mut. 2000, 16, 334-344.
21. J. Vijg Biotechnology 1995, 13, 137-139.
22. Vijg, J., van Orsouw, N. J. Electrophoresis 1999, 20, 1239-1249.
23. Wu, Y. et al. Human Mut. 1996, 8, 160-167.
24. van Orsouw, N.J. et al. Hum. Mol. Genet. 1996, 5, 755-761.
25. Nystrom-Lahti, M. et al. Hum. Mol. Genet. 1996, 5, 763-769.
26. Smith, W.M. et al. Genet. Testing 1998, 2, 43-53.
27. Rines, R.D. et al. Carcinogenesis 1998, 19, 979-984.
28. van Orsouw, N.J., Zhang, X., Wei, J.Y., Johns, D.R., Vijg, J., Genomics1998, 52, 27-36.
29. Harrison, D. J., Manz, A., Fan, Z., Ludi, H., Widmer, H. M. Anal. Chem.1992, 64, 1926-1932.
30. Harrison, D. J., Fluri, K., Seiler, K., Fan, Z., Effenhauser, C. S., Manz, A. Science 1993, 261, 895-897.
31. Chiem, N., Harrison, D. J. Anal. Chem. 1997, 69, 373-378.
32. Effenhauser, S. F., Manz, A., Widmer, H. M. Anal. Chem. 1993, 65, 2637-2642.
33. Effenhauser, C. S., Manz, A., Widmer, H. M. Anal. Chem. 1995, 67, 2284-2287.
34. Jacobson, S. C., Hergenroder, R., Koutny, L. B., Warmakc, R. J., Ramsey,J. M. Anal. Chem. 1994, 66, 1107-1113.
35. Woolley, A. T.; Mathies, R. A. Anal. Chem. 1995, 67, 3676-3680.
93
36. Schmalzing, D. et al. Anal. Chem. 1998, 70, 2303-2310.
37. Tian, H., Brody, L. C., Landers, J. P. Genome Res. 2000, 10, 1403-1413.
38. Tian, H., Jaquins-Gerstl A., Munro, N., Trucco, M., Brody, L. C., Landers, J. P. Genomics 2000, 63, 25-34.
39. Kopp, M. U.; de Mello, A. J.; Manz, A. Science 1998, 280, 1046-1048.
40. Waters, L. C.; Jacobsen, S. C.; Krotchinina, N.; Khandurina, J.; Foote, R. S.; Ramsey, J. M. Anal. Chem. 1998, 70, 158-162.
41. Weigl, B. H.; Yager, P. Science 1999, 283, 346-347.
42. Colyer, C. L.; Tang, T.; Chiem, N.; Harrison, D. J. Electrophoresis 1997,18, 1733-1741.
43. Effenhauser, C. S.; Paulus, A.; Manz, A.; Widmer, H. M. Anal. Chem.1994, 66, 2949-2953.
44. Woolley, A. T.; Lao, K.; Glazer, A. N.; Mathies, R. A. Anal. Chem. 1998,70, 684-688.
45. Effenhauser, C. S.; Bruin, G. J. M.; Paulus, A. Anal. Chem. 1997, 69, 3451-3457.
46. Duffy, D. C.; McDonald, J. C.; Schueller, O. J. A.; Whitesides, G. M. Anal.Chem. 1998, 70, 4974-4984.
47. Martynova, L.; Locascio, L. E.; Gaitan, M.; Kramer, G. W.; Christensen, R. G.; MacCrehan, W. A. Anal. Chem. 1997, 69, 4783-4789.
48. Locascio, L. E.; Perso, C. E.; Lee, C. S. J. Chromatogr. A 1999, 857, 275-284.
49. Ocvirk, G.; Munroe, M.; Tang, T.; Oleschuk, R.; Westra, K.; Harrison, D. J. Electrophoresis 2000, 21, 107-115.
50. Soper, S. A.; Ford, S. M.; Qi, S.; McCarley, R. L.; Kelly, K.; Murphy, M. C. Anal. Chem. 2000, 72, 642A-651A.
51. Seiler, K.; Fan, Z. H.; Flurl, K.; Harrison, D. J. Anal. Chem. 1994, 66, 3485-3491.
94
52. Kovacs, G. T. A.; Petersen, K.; Albin, M. Anal. Chem. 1996, 68, 407A-416A.
53. Lee, C. S.; McManigill, D.; Wu, C. T.; Patel, B. Anal. Chem. 1991, 63,1519-1523.
54. Ghowsi, K.; Gale, R. J. Chromatogr. 1991, 559, 95-101.
55. Hayes, M. A.; Ewing, A. G. Anal. Chem. 1992, 64, 512-516.
56. Poppe, H.; Cifuentes, A.; Kok, W. T. Anal. Chem. 1996, 68, 888-893.
57. Schasfoort, R. B. M.; Schlautmann, S.; Hendrikse, J.; van den Berg, A. Science 1999, 286, 942-945.
58. Polson, N. A.; Hayes, M. A. Anal. Chem. 2000, 72, 1088-1092.
59. Hayes, M. A.; Kheterpal, I.; Ewing, A. G. Anal. Chem. 1993, 65, 27-31.
60. Huang, T. L.; Tsai, P.; Wu, C. T.; Lee, C. S. Anal. Chem. 1993, 65, 2887- 2893.
61. Huang, X.; Gordon, M. J.; Zare, R. N. Anal. Chem. 1988, 60, 1837-1838.
62. Barker, S. L.; Ross, D.; Tarlov, M. J.; Gaitan, M.; Locascio, L. E. Anal.Chem. 2000, 72, 5925-5929.
63. Highsmith, W. E., Jr.; Jin, Q.; Nataraj, A. J.; O’Connor, J. M.; Burland, V. D.; Baubonis, W. R.; Curtis, F. P.; Kusukawa, N.; Garner, M. M. Electrophoresis 1999, 20, 1186-1194.
64. Nataraj, A. J.; Olivos-Glander, I.; Kusukawa, N.; Highsmith, W. E., Jr.Electrophoresis 1999, 20, 1177-1185.
65. Henbenbrock, K.; Williams, P. M.; Karger, B. L. Electrophoresis 1995, 16,1429-1436.
66. Thomas, G. A.; Williams, D. L.; Soper, S. A. Clin. Chem. 2001, 47, 1195-203.
67. Gelfi, C.; Righetti, S. C.; Zunino, F.; Della Torre, G.; Pierotti, M. A.; Righetti, P. G. Electrophoresis 1997, 18, 2921-2927.
95
68. Riesner, D.; Steger, G.; Zimmat, R.; Owens, R. A.; Wagonhofer, M.; Hillen, W.; Vollbach, S.; Henco, K. Electrophoresis 1989, 10, 377-389.
69. Gelfi, C.; Righetti, P. G.; Cremonesi, L.; Ferrari, M. Electrophoresis 1994,15, 1506-1511.
70. Schell, J.; Wulfert, M.; Riesner, D. Electrophoresis 1999, 20, 2864-2869.
71. Gao, Q.; Yeung, E. S. Anal. Chem. 2000, 72, 2499-2506.
72. Kristensen, A. T.; Bjorheim, J.; Minarik, M.; Giercksky, K. E.; Ekstrom, P. O. BioTechniques 2002, 33, 650-653.
73. Zhu, L.; Lee, H. K.; Lin, B.; Yeung, E. S. Electrophoresis 2001, 22, 3683-3687.
74. Mao, H.; Holden, M. A.; You, M.; Cremer, P. S. Anal. Chem. 2002, 74,5071-5075.
75. Steger, G. Nucleic Acids Res. 1994, 22, 2760-2768.
76. Ross, D.; Gaitan, M.; Locascio, L. E. Anal. Chem. 2001, 73, 4717-4123.
77. Mullis, K.; Faloona, F.; Scharf, S.; Saiki, R.; Horn, G.; Erlich, H. ColdSpring Harbor Symp. Quant. Biol. 1986, 51, 263-73. Rocklin, R. D.; Ramsey, R. S.; Ramsey, J. M. Anal. Chem. 2000, 72, 5244-5249.
79. Herr, A. E.; Molho, J. I.; Drouvalakis, K. A.; Mikkelsen, J. C.; Utz, P. J.; Santiago, J. G.; Kenny, T. W. Anal. Chem. 2003, 75, 1180-1187.
80. Chen, X.; Wu, H.; Mao, C.; Whitesides, G. M. Anal. Chem. 2002, 74, 1772-1778.
81. Nkodo, A.E.; Tinland, B. Electrophoresis. 2002, 23, 2755-65.
82. Ermakov, S. V.; Jacobson, S. C.; Ramsey, J. M. Anal. Chem 2000, 72,3512-3517.
83. Jacobson, S. C.; Ermakov, S. V.; Ramsey, J. M. Anal. Chem. 1999, 71,3273-3276.
84. Xiong, Y.; Park, S. R.; Swerdlow, H. Anal. Chem 1998, 70, 3605-3611.
96