Embed Size (px)
Citation preview
International Journal of Management and Marketing Research Vol. 13, No. 1, 2020, pp. 23-34 ISSN: 1931-0269 (print) ISSN: 2157-0698 (online)
www.theIBFR.com
23
A TWO-LEVEL EVALUATION OF MOBILE TRAVEL WEBSITES USING THE VISITOR EXPERIENCE AND
THE BRAND PRESENTATION Mary Beth McCabe, National University
Richard Weaver, National University
ABSTRACT With global mobile phone usage at an all-time high, people are traveling and making travel plans on their wireless devices while on the go. This research looks at how travel websites present their offerings on smartphones. It considers the promotion and, more specifically, the branding of the travel industry leaders from a consumer’s mobile phone. The authors explored how the travel websites present and promote on mobile devices and the difference between these travel offerings when viewed on mobile websites. This study considered that shopping for airfare and hotel rooms was within a few clicks on anyone’s mobile phone today. The researchers considered the best practices and recommendations for mobile users and the top ten companies providing this experience. The researchers reviewed Expedia Group and Booking Holdings (formerly Priceline) families of travel brands, as well as other top brands’ mobile websites. The websites were evaluated using criteria from a recent rubric of digital marketing in a service industry. The presentation of the brands on these mobile websites was then evaluated using a custom set of criteria to rate their achievement in this area. In both areas of the criteria, the Expedia family of brands was rated the highest. JEL: M31 KEYWORDS: Branding, Websites, Mobile, Marketing, Travel Marketing INTRODUCTION
ears ago, the neighborhood travel agent was the service provider who knew his/her customer and could find airline flights and book travel for a percentage of the fee. That model has mostly gone away because of global business trends, such as disintermediation (i.e., removing the middleman)
and the adoption of the Internet and mobile phones (Werthner & Ricci, 2004; Webb, 2016; Wang & Cheung, 2004). Closing neighborhood travel agencies has been a constant trend for decades. The airlines cut out the percentage of revenue incentive and then revised again to a flat fee for booking a customer’s travel and, finally, paid nothing. So, agents stopped booking. There are still a few personal service travel agencies that have fees for their services, but they are uncommon. For example, Thomas Cook Travel, founded in the UK in 1841, closed abruptly in 2019, leaving 150,000 people on vacation stranded. The 2020 coronavirus scare has raised serious questions about how trustworthy travel agencies are when travelers experience fear of illness. This exploratory research considers how travel agencies present their brands via mobile devices. Changes in how travel is booked, as well as the marketing of these services, have become important for business leaders in tourism. Managing the dollars or revenue management has evolved into a transformed environment in forecasting, pricing, and online travel agency inventory allocations because purchasing behavior has become much more of a last-minute choice of travelers instead of planning ahead (Webb,
Y
M. B. McCabe & R. Weaver | IJMMR ♦ Vol. 13 ♦ No. 1 ♦ 2020
24
2016). The research questions addressed are: 1) How do the travel websites present on mobile devices? and 2) What is different about these businesses viewed on mobile websites? LITERATURE REVIEW Travel Agencies Migrate to Mobile Delivery of Services The top two travel companies globally are Expedia Group and Booking Holdings, each with about $88 B in revenues in an industry that does $368 B annually in sales. The business trends for travel agencies is a more scalable self-service model, just as service firms, like banking and insurance industries are doing. The factors that influence this move include external competitive pressure, a culture of innovation, and available resources. CEO risk-taking and the size of the firm also have had an impact on making the transition to e-business activity (Wang & Cheung, 2004) One of the trends found was the focus on sales over the longer-term marketing activities. A study in Turkey looked at independent travel agencies, rather than the larger brands of Expedia and Booking Holdings, which were focused on using mobile phones to reach customers directly and to increase sales, rather than on improving their brand. They did not report that the agencies were seeking to enhance their delivery of services to customers, merely increase revenue. They were thinking shorter-term paybacks instead of loyalty and repeat business (Selvi, 2014). Another trend involves downloading and using apps on the phone. A study looked at the receptivity of customers who used mobile apps to make hospitality purchases. This two-step study was completed with a university student population that had demonstrated a propensity to use mobile devices to make purchases. They found that there was a range of willingness to download apps, and for those who did download the travel application, there was also a range of willingness to use them. There was a correlation among customers who enjoy using smartphones and are confident in themselves. They were found to be more likely to download the travel apps and then use them. Those who were confident in themselves and trusting in the technology to deliver results were most inclined to use mobile devices successfully (Kwon, Bae & Blum, 2013). Cutting Edge Tourism Experiences on Mobile Devices On the horizon for travel agencies are the new mobile-delivered augmented reality tools, which are like virtual travel guides with highly engaged interactivity. Some of these virtual offerings include three dimensional experiences, a higher level of personalized services, and even the anticipation of what the needs may be in the future. For example, agencies can take their future airline passengers on virtual airline flights. This capacity is already available. Samsung phones can click into a virtual reality travel experience, for example, a visit to the San Diego Zoo to see the animals. Most customers are using mobile devices for the basics, like ordering food and seeking accommodations and transportation, but there is a segment of the travel audience who wants more, including context-aware services that may include trip planning (Goh, Ang, Lee, & Lee, 2010). There is much published research on mobile tourism apps and tourists’ needs and behaviors. There are comparatively fewer studies on types of services they desire. Tourists favored basic services that provide information about transportation, housing, and eating. Some, but not many, more experienced tourists, were looking more often at context-aware services and trip planning. These were found to be less needed compared to the basics for most travelers (Goh, Ang, Lee & Lee, 2010). Transforming Shopping Behavior for Services Consumer behavior and, specifically, shopping behavior on the Internet, has been of interest to academics and industry from the start. Shopping for travel or shopping for educational services are alike in that both are service industries and intangible. Similar research studies considered branding for internet experiences in the k-12 education field through marketing on mobile websites. The websites that were most effective were those with elements of good user experience, navigation, and clear purpose (McCabe & Weaver, 2018a). Both when and how people book their travel has changed (Webb, 2016). The Internet has made
INTERNATIONAL JOURNAL OF MANAGEMENT AND MARKETING RESEARCH ♦VOLUME 13 ♦NUMBER 1♦2020
25
everyone a travel agent who can make their own reservations online. Yang & Forney (2013) considered how technology anxiety affects mobile shopping behavior. The mobile shopping assistant has emerged from the phone, enabling anyone to purchase products and services at their fingertips. Because of the personal nature of the phone, there is a legal requirement for security and privacy. More personal and interactive communications are now available, compared to the traditional channels of TV, radio, and print, which have led to some consumer anxiety. Social influences, such as technology anxiety, reveal why some customers use mobile shopping and others choose not to. Yang (2010) considered what determines the adoption of mobile e-commerce services, such as travel, and how to design these for the best user experience. The study revealed that certain factors of social influence, such as entertainment choices drove behavior change. Travel for pleasure is not the same as travel for work. The business traveler has a task to complete, not just a visit as a tourist. Some travel planning adjustments are needed for booking this type of travel, and it begins with the mobile experience. The success of the mobile travel booking depends on task-technology fit, practicality, and financial criteria (Liang & Wei, 2004). Werther and Ricci (2004) considered the travel industry to be a service provider, with a new usage for travel, more than just booking a trip, in which people are creating their individual experiences. Businesses are seeing mass customization and flexible configurations, down to the individual level. One cruise company allows people to create their own custom cruises (Werthner & Ricci, 2004). Clearly, consumers are driving the travel industry toward a simple model where they are making more independent decisions instead of relying on the tour operators. Mobile Devices for Booking Travel The Internet, via Online Travel Agencies (OTA), has dominated travel and tourism planning on mobile devices. This is across all customer segments and especially found among frequent users of social media. There are two segments or different groups for marketers to consider as best customers. The first group uses traditional online tools, such as websites to book travel online on the desktop computer. A second group adopts new channels of information and purchases their travel through more advanced and emerging tools, such as the mobile phone (Xiang, Magnini & Fesenmaier, 2015). When looking at customer loyalty and booking utilizing mobile hotel booking technology, the research found that personalization, privacy, trust, and risk perceptions were most important. Trust was relative to risk and associated with loyalty. Booking a room on a mobile device was important to online travel agencies, hotel operators and technology vendors alike (Ozturk, Nusair, Okumus & Singh, 2017). Fun and games can guide a user to book a trip. This can lead users to book their next travel with the brand bringing the fun in the form of a game or guide (Aluri, 2017). Distinguishing a Brand on a Mobile Website Brands allow companies to be different. Differentiated brands may use unique messaging, distinguishing graphics, different optimization, and display on mobile screens. Brand identity includes font, color, image, symbols, shape, and the unique product benefits (Zaichkowsky, 2010). For the mobile user, optimizing what the computer displays is important. Not all brands are using mobile experiences for all the brands’ capability. A customer now follows the brand through the purchase journey, including on social media (Edelman, 2010). Social media is most likely accessed via a mobile device. Mobile marketing is the use of communications using a mobile phone, communicating the brand value (Leppäniemi, Sinisalo, & Karjaluoto, 2006). Millennials, born between 1981 and 1996, are different from Baby Boomers (1946-1960) or Gen Xers (1961-1980), with expectations of faster responses to queries and they are more comfortable using digital technology (Eastman, Iyer, Liao-Troth et al, 2014). Because of the differences, marketers are being careful about their brand distinction. Those in marketing study today’s users’ expectations, since they drive future revenues. Marketers need to know how people behave using mobile phones. Mobile websites must display information in a way that is fast, interesting, and affordable for the consumer. Businesses are differentiating their brands to target travel markets. Usually, business travelers go with what the company recommends for the hotel choice, but some use search engines or online travel
M. B. McCabe & R. Weaver | IJMMR ♦ Vol. 13 ♦ No. 1 ♦ 2020
26
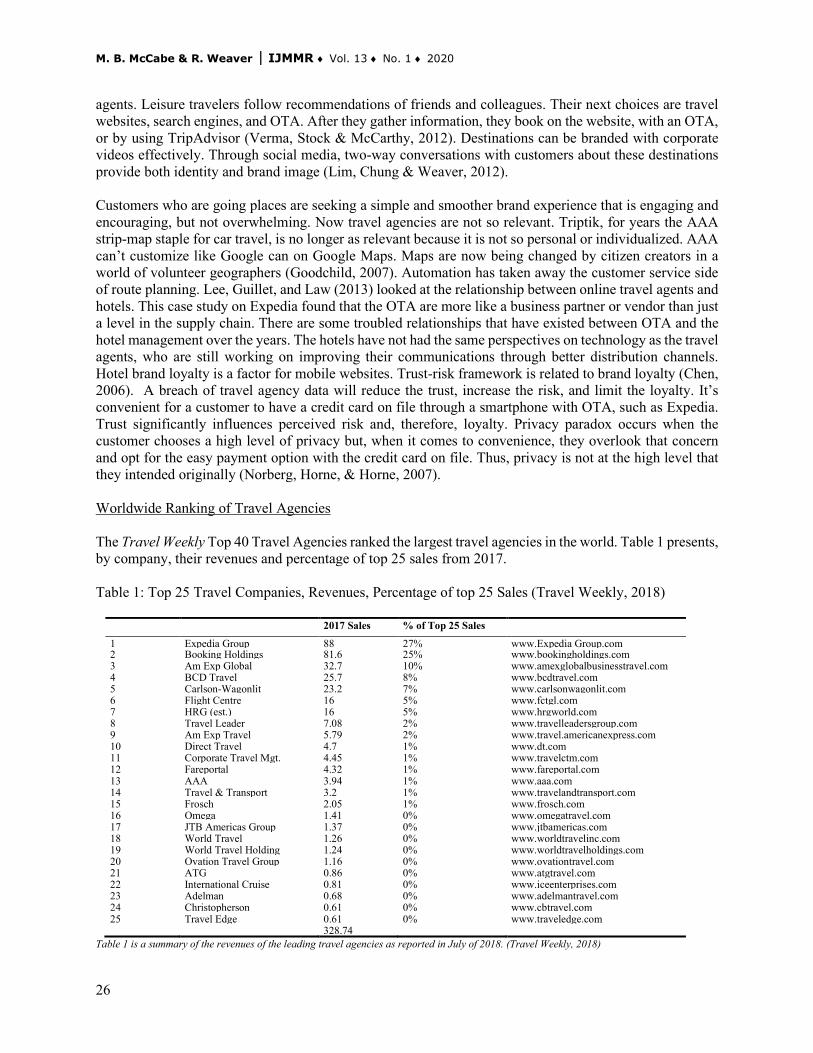
agents. Leisure travelers follow recommendations of friends and colleagues. Their next choices are travel websites, search engines, and OTA. After they gather information, they book on the website, with an OTA, or by using TripAdvisor (Verma, Stock & McCarthy, 2012). Destinations can be branded with corporate videos effectively. Through social media, two-way conversations with customers about these destinations provide both identity and brand image (Lim, Chung & Weaver, 2012). Customers who are going places are seeking a simple and smoother brand experience that is engaging and encouraging, but not overwhelming. Now travel agencies are not so relevant. Triptik, for years the AAA strip-map staple for car travel, is no longer as relevant because it is not so personal or individualized. AAA can’t customize like Google can on Google Maps. Maps are now being changed by citizen creators in a world of volunteer geographers (Goodchild, 2007). Automation has taken away the customer service side of route planning. Lee, Guillet, and Law (2013) looked at the relationship between online travel agents and hotels. This case study on Expedia found that the OTA are more like a business partner or vendor than just a level in the supply chain. There are some troubled relationships that have existed between OTA and the hotel management over the years. The hotels have not had the same perspectives on technology as the travel agents, who are still working on improving their communications through better distribution channels. Hotel brand loyalty is a factor for mobile websites. Trust-risk framework is related to brand loyalty (Chen, 2006). A breach of travel agency data will reduce the trust, increase the risk, and limit the loyalty. It’s convenient for a customer to have a credit card on file through a smartphone with OTA, such as Expedia. Trust significantly influences perceived risk and, therefore, loyalty. Privacy paradox occurs when the customer chooses a high level of privacy but, when it comes to convenience, they overlook that concern and opt for the easy payment option with the credit card on file. Thus, privacy is not at the high level that they intended originally (Norberg, Horne, & Horne, 2007). Worldwide Ranking of Travel Agencies The Travel Weekly Top 40 Travel Agencies ranked the largest travel agencies in the world. Table 1 presents, by company, their revenues and percentage of top 25 sales from 2017. Table 1: Top 25 Travel Companies, Revenues, Percentage of top 25 Sales (Travel Weekly, 2018)
2017 Sales % of Top 25 Sales
1 Expedia Group 88 27% www.Expedia Group.com 2 Booking Holdings 81.6 25% www.bookingholdings.com 3 Am Exp Global 32.7 10% www.amexglobalbusinesstravel.com 4 BCD Travel 25.7 8% www.bcdtravel.com 5 Carlson-Wagonlit 23.2 7% www.carlsonwagonlit.com 6 Flight Centre 16 5% www.fctgl.com 7 HRG (est.) 16 5% www.hrgworld.com 8 Travel Leader 7.08 2% www.travelleadersgroup.com 9 Am Exp Travel 5.79 2% www.travel.americanexpress.com 10 Direct Travel 4.7 1% www.dt.com 11 Corporate Travel Mgt. 4.45 1% www.travelctm.com 12 Fareportal 4.32 1% www.fareportal.com 13 AAA 3.94 1% www.aaa.com 14 Travel & Transport 3.2 1% www.travelandtransport.com 15 Frosch 2.05 1% www.frosch.com 16 Omega 1.41 0% www.omegatravel.com 17 JTB Americas Group 1.37 0% www.jtbamericas.com 18 World Travel 1.26 0% www.worldtravelinc.com 19 World Travel Holding 1.24 0% www.worldtravelholdings.com 20 Ovation Travel Group 1.16 0% www.ovationtravel.com 21 ATG 0.86 0% www.atgtravel.com 22 International Cruise 0.81 0% www.iceenterprises.com 23 Adelman 0.68 0% www.adelmantravel.com 24 Christopherson 0.61 0% www.cbtravel.com 25 Travel Edge 0.61 0% www.traveledge.com 328.74
Table 1 is a summary of the revenues of the leading travel agencies as reported in July of 2018. (Travel Weekly, 2018)
INTERNATIONAL JOURNAL OF MANAGEMENT AND MARKETING RESEARCH ♦VOLUME 13 ♦NUMBER 1♦2020
27
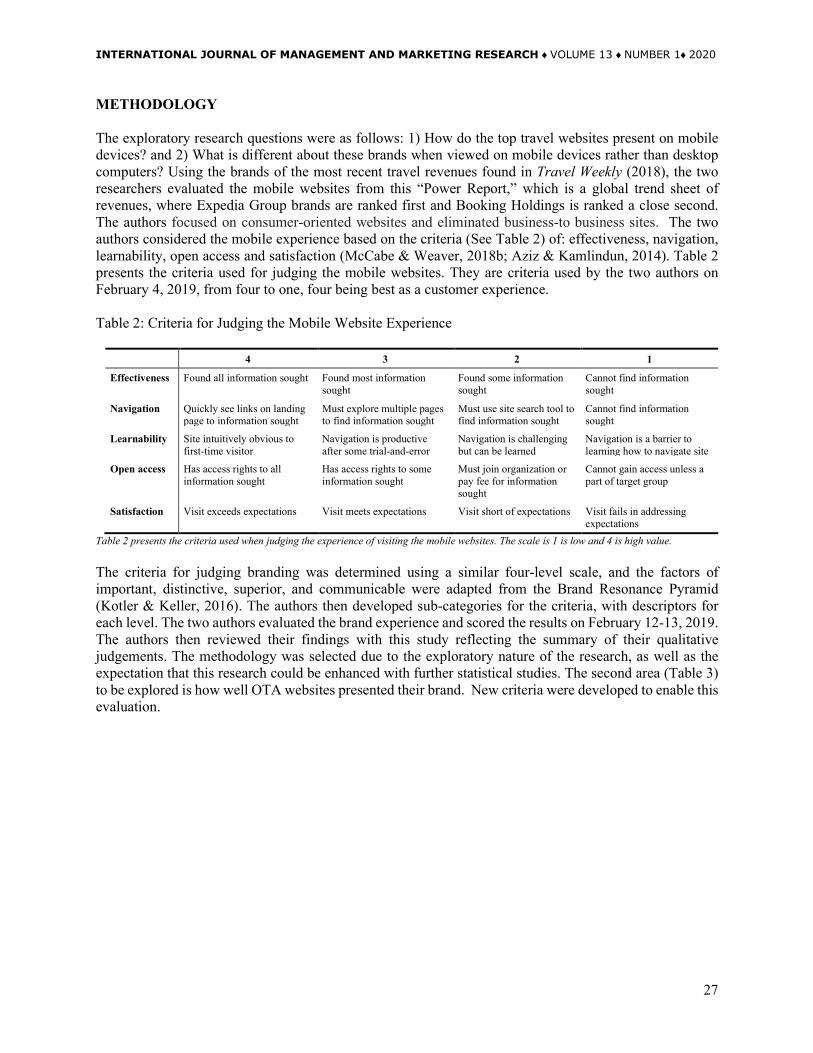
METHODOLOGY The exploratory research questions were as follows: 1) How do the top travel websites present on mobile devices? and 2) What is different about these brands when viewed on mobile devices rather than desktop computers? Using the brands of the most recent travel revenues found in Travel Weekly (2018), the two researchers evaluated the mobile websites from this “Power Report,” which is a global trend sheet of revenues, where Expedia Group brands are ranked first and Booking Holdings is ranked a close second. The authors focused on consumer-oriented websites and eliminated business-to business sites. The two authors considered the mobile experience based on the criteria (See Table 2) of: effectiveness, navigation, learnability, open access and satisfaction (McCabe & Weaver, 2018b; Aziz & Kamlindun, 2014). Table 2 presents the criteria used for judging the mobile websites. They are criteria used by the two authors on February 4, 2019, from four to one, four being best as a customer experience. Table 2: Criteria for Judging the Mobile Website Experience
4 3 2 1
Effectiveness Found all information sought Found most information sought
Found some information sought
Cannot find information sought
Navigation Quickly see links on landing page to information sought
Must explore multiple pages to find information sought
Must use site search tool to find information sought
Cannot find information sought
Learnability Site intuitively obvious to first-time visitor
Navigation is productive after some trial-and-error
Navigation is challenging but can be learned
Navigation is a barrier to learning how to navigate site
Open access Has access rights to all information sought
Has access rights to some information sought
Must join organization or pay fee for information sought
Cannot gain access unless a part of target group
Satisfaction Visit exceeds expectations Visit meets expectations Visit short of expectations Visit fails in addressing expectations
Table 2 presents the criteria used when judging the experience of visiting the mobile websites. The scale is 1 is low and 4 is high value. The criteria for judging branding was determined using a similar four-level scale, and the factors of important, distinctive, superior, and communicable were adapted from the Brand Resonance Pyramid (Kotler & Keller, 2016). The authors then developed sub-categories for the criteria, with descriptors for each level. The two authors evaluated the brand experience and scored the results on February 12-13, 2019. The authors then reviewed their findings with this study reflecting the summary of their qualitative judgements. The methodology was selected due to the exploratory nature of the research, as well as the expectation that this research could be enhanced with further statistical studies. The second area (Table 3) to be explored is how well OTA websites presented their brand. New criteria were developed to enable this evaluation.
M. B. McCabe & R. Weaver | IJMMR ♦ Vol. 13 ♦ No. 1 ♦ 2020
28
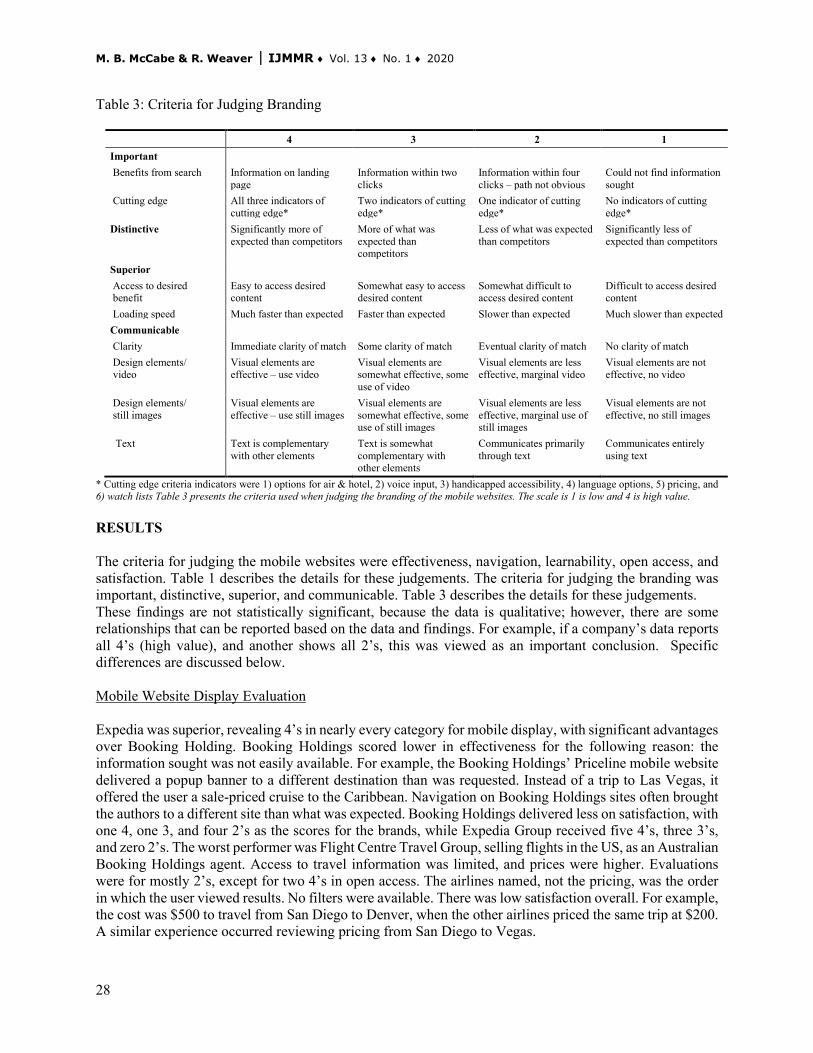
Table 3: Criteria for Judging Branding
4 3 2 1 Important Benefits from search Information on landing
page Information within two clicks
Information within four clicks – path not obvious
Could not find information sought
Cutting edge All three indicators of cutting edge*
Two indicators of cutting edge*
One indicator of cutting edge*
No indicators of cutting edge*
Distinctive Significantly more of expected than competitors
More of what was expected than competitors
Less of what was expected than competitors
Significantly less of expected than competitors
Superior Access to desired benefit
Easy to access desired content
Somewhat easy to access desired content
Somewhat difficult to access desired content
Difficult to access desired content
Loading speed Much faster than expected Faster than expected Slower than expected Much slower than expected Communicable Clarity Immediate clarity of match Some clarity of match Eventual clarity of match No clarity of match Design elements/ video
Visual elements are effective – use video
Visual elements are somewhat effective, some use of video
Visual elements are less effective, marginal video
Visual elements are not effective, no video
Design elements/ still images
Visual elements are effective – use still images
Visual elements are somewhat effective, some use of still images
Visual elements are less effective, marginal use of still images
Visual elements are not effective, no still images
Text Text is complementary with other elements
Text is somewhat complementary with other elements
Communicates primarily through text
Communicates entirely using text
* Cutting edge criteria indicators were 1) options for air & hotel, 2) voice input, 3) handicapped accessibility, 4) language options, 5) pricing, and 6) watch lists Table 3 presents the criteria used when judging the branding of the mobile websites. The scale is 1 is low and 4 is high value. RESULTS The criteria for judging the mobile websites were effectiveness, navigation, learnability, open access, and satisfaction. Table 1 describes the details for these judgements. The criteria for judging the branding was important, distinctive, superior, and communicable. Table 3 describes the details for these judgements. These findings are not statistically significant, because the data is qualitative; however, there are some relationships that can be reported based on the data and findings. For example, if a company’s data reports all 4’s (high value), and another shows all 2’s, this was viewed as an important conclusion. Specific differences are discussed below. Mobile Website Display Evaluation Expedia was superior, revealing 4’s in nearly every category for mobile display, with significant advantages over Booking Holding. Booking Holdings scored lower in effectiveness for the following reason: the information sought was not easily available. For example, the Booking Holdings’ Priceline mobile website delivered a popup banner to a different destination than was requested. Instead of a trip to Las Vegas, it offered the user a sale-priced cruise to the Caribbean. Navigation on Booking Holdings sites often brought the authors to a different site than what was expected. Booking Holdings delivered less on satisfaction, with one 4, one 3, and four 2’s as the scores for the brands, while Expedia Group received five 4’s, three 3’s, and zero 2’s. The worst performer was Flight Centre Travel Group, selling flights in the US, as an Australian Booking Holdings agent. Access to travel information was limited, and prices were higher. Evaluations were for mostly 2’s, except for two 4’s in open access. The airlines named, not the pricing, was the order in which the user viewed results. No filters were available. There was low satisfaction overall. For example, the cost was $500 to travel from San Diego to Denver, when the other airlines priced the same trip at $200. A similar experience occurred reviewing pricing from San Diego to Vegas.
INTERNATIONAL JOURNAL OF MANAGEMENT AND MARKETING RESEARCH ♦VOLUME 13 ♦NUMBER 1♦2020
29
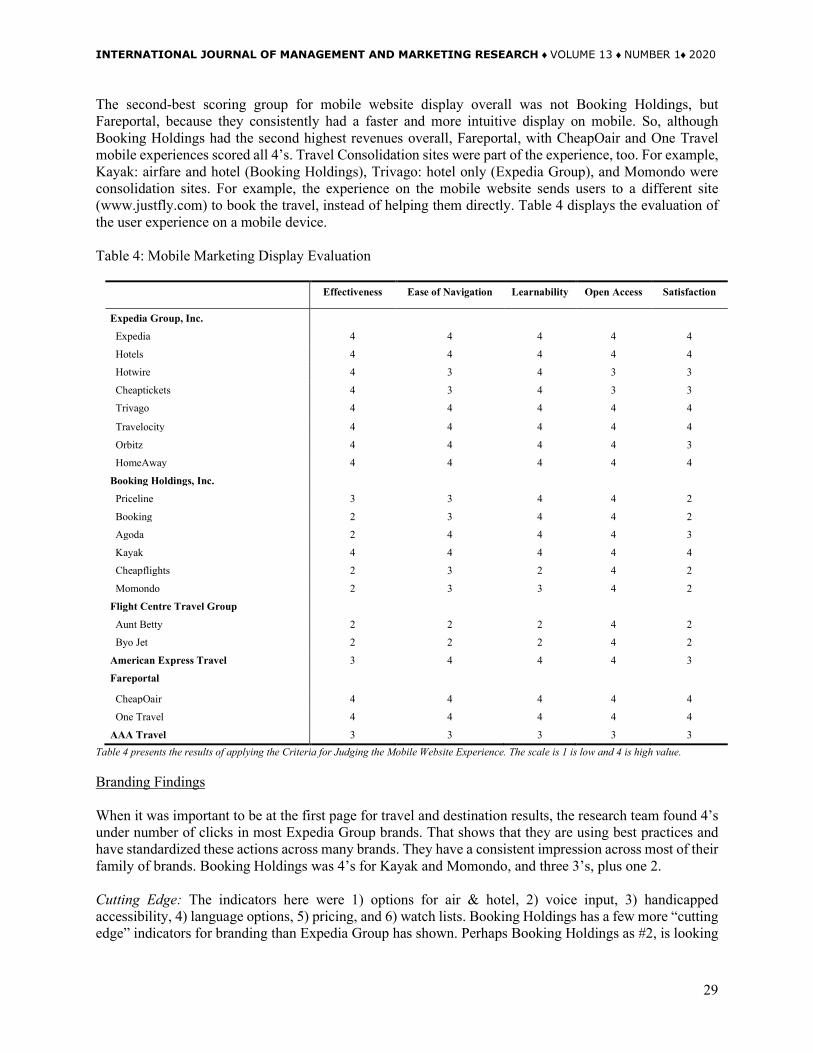
The second-best scoring group for mobile website display overall was not Booking Holdings, but Fareportal, because they consistently had a faster and more intuitive display on mobile. So, although Booking Holdings had the second highest revenues overall, Fareportal, with CheapOair and One Travel mobile experiences scored all 4’s. Travel Consolidation sites were part of the experience, too. For example, Kayak: airfare and hotel (Booking Holdings), Trivago: hotel only (Expedia Group), and Momondo were consolidation sites. For example, the experience on the mobile website sends users to a different site (www.justfly.com) to book the travel, instead of helping them directly. Table 4 displays the evaluation of the user experience on a mobile device. Table 4: Mobile Marketing Display Evaluation
Effectiveness Ease of Navigation Learnability Open Access Satisfaction
Expedia Group, Inc.
Expedia 4 4 4 4 4
Hotels 4 4 4 4 4
Hotwire 4 3 4 3 3
Cheaptickets 4 3 4 3 3
Trivago 4 4 4 4 4
Travelocity 4 4 4 4 4
Orbitz 4 4 4 4 3
HomeAway 4 4 4 4 4
Booking Holdings, Inc.
Priceline 3 3 4 4 2
Booking 2 3 4 4 2
Agoda 2 4 4 4 3
Kayak 4 4 4 4 4
Cheapflights 2 3 2 4 2
Momondo 2 3 3 4 2
Flight Centre Travel Group
Aunt Betty 2 2 2 4 2
Byo Jet 2 2 2 4 2
American Express Travel 3 4 4 4 3
Fareportal
CheapOair 4 4 4 4 4
One Travel 4 4 4 4 4
AAA Travel 3 3 3 3 3 Table 4 presents the results of applying the Criteria for Judging the Mobile Website Experience. The scale is 1 is low and 4 is high value. Branding Findings When it was important to be at the first page for travel and destination results, the research team found 4’s under number of clicks in most Expedia Group brands. That shows that they are using best practices and have standardized these actions across many brands. They have a consistent impression across most of their family of brands. Booking Holdings was 4’s for Kayak and Momondo, and three 3’s, plus one 2. Cutting Edge: The indicators here were 1) options for air & hotel, 2) voice input, 3) handicapped accessibility, 4) language options, 5) pricing, and 6) watch lists. Booking Holdings has a few more “cutting edge” indicators for branding than Expedia Group has shown. Perhaps Booking Holdings as #2, is looking
M. B. McCabe & R. Weaver | IJMMR ♦ Vol. 13 ♦ No. 1 ♦ 2020
30
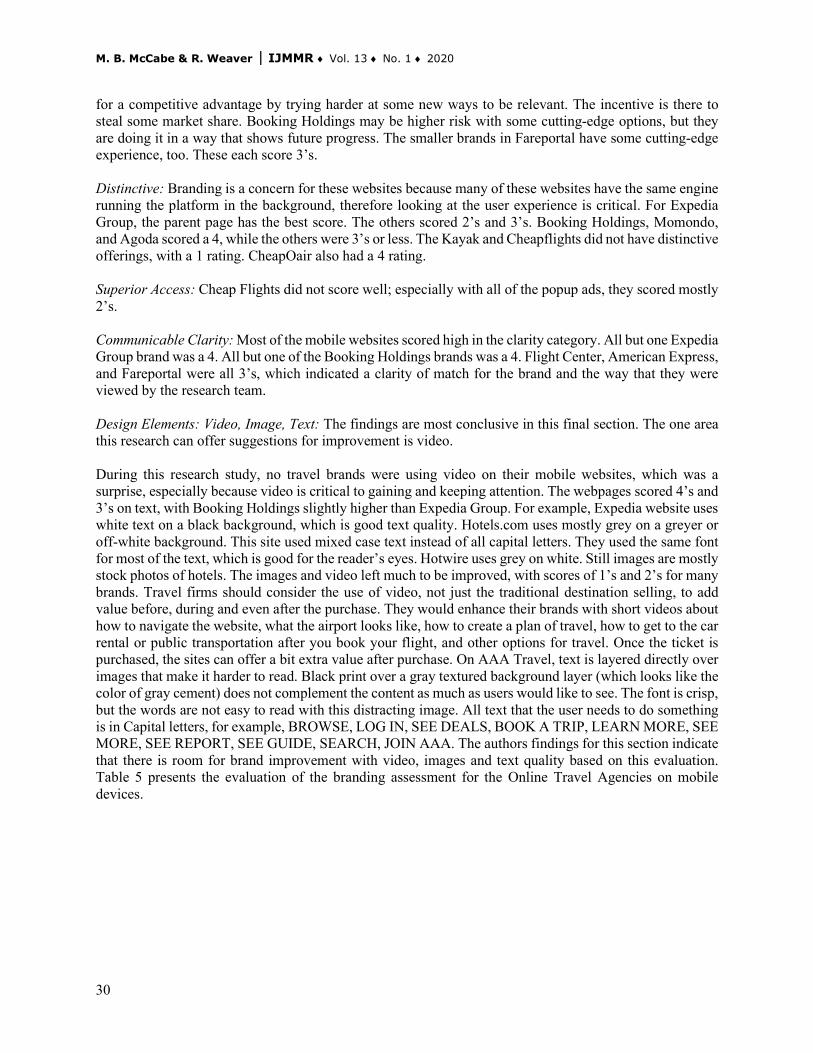
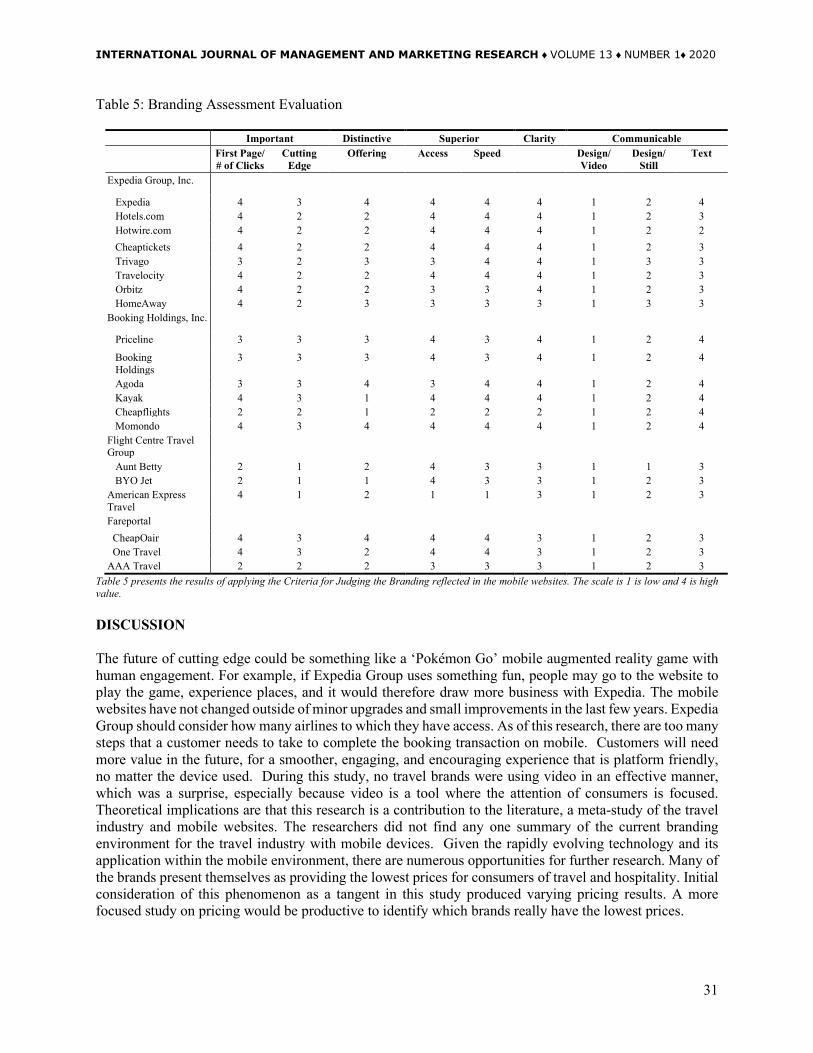
for a competitive advantage by trying harder at some new ways to be relevant. The incentive is there to steal some market share. Booking Holdings may be higher risk with some cutting-edge options, but they are doing it in a way that shows future progress. The smaller brands in Fareportal have some cutting-edge experience, too. These each score 3’s. Distinctive: Branding is a concern for these websites because many of these websites have the same engine running the platform in the background, therefore looking at the user experience is critical. For Expedia Group, the parent page has the best score. The others scored 2’s and 3’s. Booking Holdings, Momondo, and Agoda scored a 4, while the others were 3’s or less. The Kayak and Cheapflights did not have distinctive offerings, with a 1 rating. CheapOair also had a 4 rating. Superior Access: Cheap Flights did not score well; especially with all of the popup ads, they scored mostly 2’s. Communicable Clarity: Most of the mobile websites scored high in the clarity category. All but one Expedia Group brand was a 4. All but one of the Booking Holdings brands was a 4. Flight Center, American Express, and Fareportal were all 3’s, which indicated a clarity of match for the brand and the way that they were viewed by the research team. Design Elements: Video, Image, Text: The findings are most conclusive in this final section. The one area this research can offer suggestions for improvement is video. During this research study, no travel brands were using video on their mobile websites, which was a surprise, especially because video is critical to gaining and keeping attention. The webpages scored 4’s and 3’s on text, with Booking Holdings slightly higher than Expedia Group. For example, Expedia website uses white text on a black background, which is good text quality. Hotels.com uses mostly grey on a greyer or off-white background. This site used mixed case text instead of all capital letters. They used the same font for most of the text, which is good for the reader’s eyes. Hotwire uses grey on white. Still images are mostly stock photos of hotels. The images and video left much to be improved, with scores of 1’s and 2’s for many brands. Travel firms should consider the use of video, not just the traditional destination selling, to add value before, during and even after the purchase. They would enhance their brands with short videos about how to navigate the website, what the airport looks like, how to create a plan of travel, how to get to the car rental or public transportation after you book your flight, and other options for travel. Once the ticket is purchased, the sites can offer a bit extra value after purchase. On AAA Travel, text is layered directly over images that make it harder to read. Black print over a gray textured background layer (which looks like the color of gray cement) does not complement the content as much as users would like to see. The font is crisp, but the words are not easy to read with this distracting image. All text that the user needs to do something is in Capital letters, for example, BROWSE, LOG IN, SEE DEALS, BOOK A TRIP, LEARN MORE, SEE MORE, SEE REPORT, SEE GUIDE, SEARCH, JOIN AAA. The authors findings for this section indicate that there is room for brand improvement with video, images and text quality based on this evaluation. Table 5 presents the evaluation of the branding assessment for the Online Travel Agencies on mobile devices.
INTERNATIONAL JOURNAL OF MANAGEMENT AND MARKETING RESEARCH ♦VOLUME 13 ♦NUMBER 1♦2020
31
Table 5: Branding Assessment Evaluation
Important Distinctive Superior Clarity Communicable First Page/ # of Clicks
Cutting Edge
Offering Access Speed
Design/ Video
Design/ Still
Text
Expedia Group, Inc.
Expedia 4 3 4 4 4 4 1 2 4 Hotels.com 4 2 2 4 4 4 1 2 3 Hotwire.com 4 2 2 4 4 4 1 2 2 Cheaptickets 4 2 2 4 4 4 1 2 3 Trivago 3 2 3 3 4 4 1 3 3 Travelocity 4 2 2 4 4 4 1 2 3 Orbitz 4 2 2 3 3 4 1 2 3 HomeAway 4 2 3 3 3 3 1 3 3 Booking Holdings, Inc.
Priceline 3 3 3 4 3 4 1 2 4
Booking Holdings
3 3 3 4 3 4 1 2 4
Agoda 3 3 4 3 4 4 1 2 4 Kayak 4 3 1 4 4 4 1 2 4 Cheapflights 2 2 1 2 2 2 1 2 4 Momondo 4 3 4 4 4 4 1 2 4 Flight Centre Travel Group
Aunt Betty 2 1 2 4 3 3 1 1 3 BYO Jet 2 1 1 4 3 3 1 2 3 American Express Travel
4 1 2 1 1 3 1 2 3
Fareportal CheapOair 4 3 4 4 4 3 1 2 3 One Travel 4 3 2 4 4 3 1 2 3 AAA Travel 2 2 2 3 3 3 1 2 3
Table 5 presents the results of applying the Criteria for Judging the Branding reflected in the mobile websites. The scale is 1 is low and 4 is high value. DISCUSSION The future of cutting edge could be something like a ‘Pokémon Go’ mobile augmented reality game with human engagement. For example, if Expedia Group uses something fun, people may go to the website to play the game, experience places, and it would therefore draw more business with Expedia. The mobile websites have not changed outside of minor upgrades and small improvements in the last few years. Expedia Group should consider how many airlines to which they have access. As of this research, there are too many steps that a customer needs to take to complete the booking transaction on mobile. Customers will need more value in the future, for a smoother, engaging, and encouraging experience that is platform friendly, no matter the device used. During this study, no travel brands were using video in an effective manner, which was a surprise, especially because video is a tool where the attention of consumers is focused. Theoretical implications are that this research is a contribution to the literature, a meta-study of the travel industry and mobile websites. The researchers did not find any one summary of the current branding environment for the travel industry with mobile devices. Given the rapidly evolving technology and its application within the mobile environment, there are numerous opportunities for further research. Many of the brands present themselves as providing the lowest prices for consumers of travel and hospitality. Initial consideration of this phenomenon as a tangent in this study produced varying pricing results. A more focused study on pricing would be productive to identify which brands really have the lowest prices.
M. B. McCabe & R. Weaver | IJMMR ♦ Vol. 13 ♦ No. 1 ♦ 2020
32
Managers in the travel industry need to consider further research on which behaviors lead to improved metrics and revenue lift. The algorithms that deliver brand value need to be at the forefront of the website engineering mindset. The landscape is changing, and the websites must adapt and change to full self-service. Stale brands are not effective for delivering value. Travel agencies need to use video to add value before, during and even after the travel purchase. The authors suggest that video could be about how to navigate in a city, what the airport looks like, how to draw out your plan of travel, and how to get to the car rental or public transportation after the flight is booked. Many of the websites prominently provided links to their apps which are downloaded to an individual’s mobile device. These apps were presented as making it even easier for an individual to make travel and hospitality reservations. An exploratory and comparative study of these mobile apps would also produce useful information for marketers who know that younger users are more likely to use them. One of the technologies that is becoming more prominent in a variety of industries is Artificial Intelligence (AI). AI has transformed the ways people access information from such technology as smart speakers, allowing for voice activated search and purchase. It has the potential to have significant impact on the ways people access and plan travel and hospitality using their mobile devices. Exploring both the uses of AI and the opportunities of apps for travel agencies would also be productive for the OAT industry to thrive. CONCLUDING COMMENTS The goal of this paper was to evaluate how the top travel websites appear on mobile devices and to evaluate how these websites presented the companies’ brands in that environment. The researchers adapted models to provide criteria to complete evaluations in these specific situations. Visitors to these websites were expected to have two primary needs: information about their travel alternatives and ease in making travel purchases. Websites in Expedia Group consistently provided the more productive experience for visitors. They received top ratings for both the information area and satisfaction from completing purchases. Finding the most important information sought by visitors as well as completing purchases were functions found to be more challenging. Effectively presenting a consistent branding message was challenging for all the websites. All websites appeared to be seeking to present a brand image of the “best” way to meet the needs for air, hotel, and car rental purchases. They were able to provide these services with adequate speed and access. None were able to provide enough examples of being on the “cutting edge.” They were limited in using stock still photography and generic text. There were extensive opportunities for these websites to enhance the presentation of their brands. Managers of travel websites will discover in these results opportunities to more closely examine their own websites and identify ways to improve both the users’ experiences and to better differentiate their offering from those of their competitors. The adapted models used in this research provide specific guidance to these managers. This research provides an initial examination of the websites providing travel services to the public. The primary contribution of the research is to create these evaluative perspectives and demonstrate how they can be used. The major limitation of this study is that it is qualitative research in which the source of the data was the two researchers’ experiences. In this way, the results are informative but not generalizable. Additional research can be completed drawing on a sample of the users of these websites. Such quantifiable research will address the limitation of this study. REFERENCES Aluri, A. (2017). Mobile augmented reality (MAR) game as a travel guide: Insights from Pokémon GO. Journal of Hospitality and Tourism Technology, 8(1), 55-72. Doi: http://dx.doi.org/10.1108/JHTT-12-2016-0087. Aziz, N.S., Kamlindun, A., (2014). Assessing website usability attributes using partial least squares. International Journal of Information and Electronics Engineering, Vol. 4, No. 2, March 2014.
INTERNATIONAL JOURNAL OF MANAGEMENT AND MARKETING RESEARCH ♦VOLUME 13 ♦NUMBER 1♦2020
33
Chen, C. (2006). Identifying significant factors influencing consumer trust in an online travel site. Information Technology & Tourism, 8(3-4), 197-214. Eastman, J. K., Iyer, R., Liao-Troth, S., Williams, D. F., & Griffin, M. (2014). The role of involvement on millennials' mobile technology behaviors: The moderating impact of status consumption, innovation, and opinion leadership. Journal of Marketing Theory and Practice, 22(4), 455-470. Edelman, D. C. (2010). Branding in the digital age. Harvard Business Review, 88(12), 62-69. Goh, D. H., Ang, R. P., Lee, C. S., & Lee, C. K. (2010). Determining services for the mobile tourist. The Journal of Computer Information Systems, 51(1), 31-40. Retrieved from https://nuls.idm.oclc.org/login?Url=https://search.proquest.com/docview/808409733?Accountid=25320. Goodchild, M. F. (2007). Citizens as sensors: The world of volunteered geography. Geojournal, 69(4), 211-221. Keen, P., & Williams, R. (2013). Value architectures for digital business: Beyond the business model. MIS Quarterly, 37(2), 643-647. Retrieved from http://www.jstor.org/stable/43825929. Kotler, P. & Keller, K. (2016). Marketing Management. 15th Edition. Pearson, Boston, MA. Kwon, J. M., Jung-in (Stephanie) Bae, & Blum, S. C. (2013). Mobile apps in the hospitality industry. Journal of Hospitality and Tourism Technology, 4(1), 81-92. Doi:http://dx.doi.org/10.1108/17579881311302365. Lee, H., Guillet, B., & Law, R. (2013). An examination of the relationship between online travel agents and hotels: A case study of Choice Hotels International and Expedia Group.com. Cornell Hospitality Quarterly, 54(1), 95–107. Https://doi.org/10.1177/1938965512454218. Leppäniemi, M., Sinisalo, J., & Karjaluoto, H. (2006). A review of mobile marketing research. International Journal of Mobile Marketing, 1(1), 30-40. Liang, T. & Wei, C. (2004). Introduction to the special issue: Mobile commerce apps. International Journal of Electronic Commerce, 8:3, 7-17, DOI: 10.1080/10864415.2004.11044303. Lim, Y., Chung, Y., & Weaver, P. A. (2012). The impact of social media on destination branding: Consumer-generated videos versus destination marketer-generated videos. Journal of Vacation Marketing, 18(3), 197–206. Https://doi.org/10.1177/1356766712449366. McCabe, M., & Weaver, R. (2018a). Marketing effectiveness of educational services on websites. Business Education & Accreditation, 10(1), 49-58. McCabe, M., & Weaver, R. (2018b). Social media marketing strategies for educational programs. Global Journal of Business Research, 12(2), 53-62. Norberg, P. A., Horne, D. R., & Horne, D. A. (2007). The privacy paradox: Personal information disclosure intentions versus behaviors. Journal of Consumer Affairs, 41(1), 100-126. Ozturk, A. B., Nusair, K., Okumus, F., & Singh, D. (2017). Understanding mobile hotel Booking Holdings loyalty: An integration of privacy calculus theory and trust-risk framework. Information Systems Frontiers, 19(4), 753-767. Doi:http://dx.doi.org/10.1007/s10796-017-9736-4.
M. B. McCabe & R. Weaver | IJMMR ♦ Vol. 13 ♦ No. 1 ♦ 2020
34
Ryans, A., More, R. & Hulland, J. J. (1995). Profitable Multibranding. The Journal of Brand Management (1995) 3: 183. Https://doi.org/10.1057/bm.1995.45 Selvi, M. S. (2014). Mobile marketing apps of travel agencies. International Journal of Research in Business and Social Science, 3(4), 68-84. Travel Weekly (2018). http://www.inboundreport.com/2018/07/24/the-top-20-companies-that-dominate-the-world-of-travel-agencies/. Verma, R., Stock, D., & McCarthy, L. (2012). Customer preferences for online, social media, and mobile innovations in the hospitality industry. Cornell Hospitality Quarterly, 53(3), 183-186. https://doi.org/10.1177/1938965512445161. Wang, S. & Cheung, W. (2004). E-business adoption by travel agencies: Prime candidates for mobile e-business, International Journal of Electronic Commerce, 8:3, 43-63, DOI: 10.1080/10864415.2004.11044298. Webb, T. (2016) From travel agents to OTA’s: How the evolution of consumer booking behavior has affected revenue management, Journal of Revenue and Pricing Management (2016) 15, 276-282 doi:10.1057/rpm.2016.16: published online 4 March 2016. Werthner, H. & Ricci, F. (2004). E-Commerce and Tourism Communications of the ACM December 2004/Vol. 47, No. 12 p. 101 http://www.inf.unibz.it/~ricci/papers/werthnercacmvers2.pdf. Yang, K. (2010). Determinants of US consumer mobile shopping services adoption: Implications for designing mobile shopping services, Journal of Consumer Marketing, Vol. 27 Issue: 3, pp.262-270, https://doi.org/10.1108/07363761011038338. Yang, K. & Forney, J. (2013). The moderating role of consumer technology anxiety in mobile shopping. Journal of Electronic Commerce Research, VOL 14, NO 4 Page 334 http://ojs.jecr.org/jecr/sites/default/files/14_4_p04.pdf. Xiang, Z. & Fesenbaier, D. (2015). Information technology and consumer behavior in travel and tourism: Insights from travel planning using the internet. Journal of Retailing and Consumer Services.Volume 22, January 2015, Pages 244-249 https://doi.org/10.1016/j.jretconser.2014.08.005. Zaichkowsky, J. J (2010). Strategies for distinctive brands. Brand Management. 17: 548. https://doi.org/10.1057/bm.2010.12. BIOGRAPHY Dr. Mary Beth McCabe is a full-time Associate Professor in the College of Professional Studies at National University, where she is Academic Program Director for Marketing. She has a Doctorate in Marketing from Alliant International University (San Diego, CA) and an MBA in Marketing from DePaul University (Chicago, IL). Dr. Richard Weaver is Professor Emeritus in the College of Professional Studies at National University, and has a doctoral degree in Human and Organizational Systems from Fielding Graduate University (Santa Barbara, CA), MBA in Marketing from Wright State University (Dayton, OH).and a M.Ed. from the University of Dayton (Dayton, OH). At National University, he was Academic Program Director for undergraduate and graduate management programs.